Article

Forest Tales? Unravelling Divergent Land Use and Land Cover Change (LULCC) Maps and State Narratives in Vietnam’s Northern Uplands

1
Faculty of Development Economics, VNU University of Economics and Business (UEB), Hanoi 100000, Vietnam
2
Water Resource Management, Hanoi University for Natural Resources and Environment (HUNRE), Hanoi 100000, Vietnam
3
Department of Geography, McGill University, Montreal, QC H3A 0B9, Canada
4
Applied Remote Sensing Lab, Department of Geography, McGill University, Montreal, QC H3A 0B9, Canada
*
Author to whom correspondence should be addressed.
Land 2024, 13(1), 71; https://doi.org/10.3390/land13010071
Submission received: 11 December 2023 / Revised: 26 December 2023 / Accepted: 5 January 2024 / Published: 7 January 2024
(This article belongs to the Special Issue The Role Played by Agriculture in Inland Areas)

Abstract

:
The Vietnamese state has advocated for the sedentarization and market integration of upland northern farmers over the past thirty years, leading to both agrarian and forest transitions. This article presents a comprehensive land use and land cover change (LULCC) analysis of two adjacent upland borderland districts, Phong Thổ and Bát Xát, in northern Vietnam, spanning two neighboring inland provinces, Lai Châu and Lào Cai. These districts are primarily home to ethnic minority farmers who are encouraged by Vietnamese state officials to not only protect forests but to also transition toward cash crop cultivation from less intensive semi-subsistence agriculture. Our LULCC maps, covering the period from 1990 to 2020, revealed a reduction in the speed by which closed-canopy forests were disappearing. During interviews, state officials were confident that this was due to a range of state policies and state-sponsored initiatives, including the promotion of tree crops and payments for forest environmental services. Our own fieldwork in the region suggests other factors are also supporting this decline in deforestation rates, rooted in ethnic minority farmer livelihood decision making. Some state officials were also able to point to factors hindering a more positive result regarding forest cover, including population pressure and new infrastructure. Interestingly, despite our positive findings on Land use and land cover change (LULCC) related to forest cover, one-third of state officials, upon reviewing our LULCC maps, firmly maintained that errors had occurred. Some even proposed that there was an actual rise in forest cover. Our study shows that these discrepancies raise compelling questions about officials’ political motivations and ongoing pressures to uphold the central state’s reforestation and agrarian transition discourses.

1. Introduction

For over forty years, the Vietnamese state has been strongly advocating for the sedentarization and greater market integration of upland farmers, particularly ethnic minority households residing at higher altitudes who historically tended to practice composite agriculture. Such a composite approach enabled farmers to maintain a mix of terraced rice paddy fields (or maize depending on localized rainfall and soil conditions); rotating swidden plots (now officially banned); and small gardens, livestock, and forest product collection for subsistence or small-scale trade purposes [1,2,3,4]. In recent decades, however, an agrarian transition has been underway, with ethnic minority farmers strongly encouraged by the state to move toward hybrid rice and maize seeds, requiring more industrial inputs, as well as a range of cash crops [5,6]. A forest transition has also been occurring in these uplands since the early 1990s because of prohibitions on opium and logging since 1992/93, along with state reforestation initiatives such as the “Greening the Barren Hills Program” from 1992 and the “Five Million Hectare Reforestation Program” introduced in 1998. However, the outcomes of these reforestation programs have been mixed, with case studies elsewhere indicating a decline in forest density and quality [7,8,9,10].
In the past two decades, even more policies have been introduced by the Vietnamese state to stimulate rural development in these inland, northern uplands, with a distinct emphasis placed on encouraging a modernist development approach. In 2010, the ambitious New Rural Development Program (Nông Thôn Mới), also known as the ”New Rural Countryside” was launched [11]. The objective was to further “modernize” agriculture and enhance rural market integration. This initiative has included district and provincial officials undertaking measures to develop or upgrade socio-economic infrastructure; promote agricultural commoditization, including arboriculture; and enhance rural trade [12,13]. While such policies aim to improve the livelihoods of over eleven million ethnic minority inhabitants in the region, their impacts have been mixed [5,14]. They have also led to land and resource enclosures, legitimized capitalist expansion, and accelerated the cultural integration of ethnic minority communities into national ideals of modernization and development [15]. Not surprisingly, notable land use and land cover change (LULCC) has also taken place.
Several important studies have concentrated on LULCC and the forest transition in Vietnam, with a particular emphasis on upland regions. As an illustration, Clement et al. [7] pinpointed a range of drivers of afforestation during the period from 1993 to 2000 in the northern province of Hòa Bình, Vietnam. They found that key factors influencing afforestation included the presence or proximity of a wood-processing industry, distance to highways, and land allocation to households. While the wood-processing industry and highway proximity were generally positively correlated with afforestation, a surprising negative correlation was observed for land allocation to households. The study concluded that state organizations on protected land primarily drove afforestation during this period [7]. Yen et al. [16] contributed insights into the more northern uplands, emphasizing how a combination of complex biophysical conditions and ethnic minority communities influence agricultural land use. By analyzing the impacts of Đổi Mới (economic renovation from the mid-1980s) and its impacts on agriculture production and economic trends, they underscored persistent challenges such as poverty, low productivity, and land degradation. The authors advocated for participatory and bottom-up approaches to address mismatches between government policies and actual land use changes, emphasizing the need for nuanced solutions to improve household agricultural production [16]. Meanwhile, Sikor and Baggio [17] delved into the rapid global expansion of tree plantations, focusing on smallholders in rural Vietnam (including a case study site in the northern midlands) as a potential avenue for poverty alleviation. Their study revealed that better-off households were more likely to engage in tree plantations, possess forestland, and make larger investments, a finding that we found resonated with our own case studies further inland. Sikor and Baggio’s study underscores the role of institutional mechanisms in differentiating household access to land and finance, influencing the capacity of households to participate in tree plantations [17]. See also [18,19] for a broader analysis across Vietnam.
More recently, Khuc et al. [20] provided a comprehensive exploration of plantation forests in Vietnam’s uplands, assessing economic roles, trade-offs, and constraints on expansion in Nghệ An Province. Their results show substantial forest expansion between 1990 and 2016, with plantation forests contributing significantly to household income. This study emphasizes the need for external cooperation, education, market stability, and agroforestry extension services to overcome constraints on further plantation forest expansion [20]. Similarly, Trædal et al. [21] shared a comparative analysis of forest cover change in two provinces, Bắc Kạn and Lâm Đồng. They found that Bắc Kạn, despite being one of Vietnam’s poorest provinces, expanded its forest cover, while Lâm Đồng, with a higher GDP and higher population density, experienced deforestation linked to the expansion of perennial crops. This deviation from standard forest transition patterns was attributed to historical heritage, state control, and recent policy shifts in Vietnam [21], creating an interesting comparison with our own LULCC findings. Finally, in our brief review here, Khuc et al. [22] delved into factors driving forest transition at local scales in Điện Biên Province, the neighboring province to the west of our own case study sites. They found that approximately 118,000 hectares of forest were rehabilitated between 1990 and 2010, with the presence of rehabilitated forests associated with biophysical and accessibility factors [22]. These studies and others clearly underscore the complexities of forest transitions within upland Vietnam, influenced by diverse and oft-rapidly changing socio-economic, political, and environmental factors.
Despite such studies, however, other than [23,24,25], scant information is available on LULCC in the mountainous inland provinces of the northern Vietnam borderlands. Hence, there exists an imperative to broaden the extant scholarly literature, with the goal of enhancing our comprehension of the intricate interplay between the persistent pressures compelling upland farmers—strongly encouraged by local state officials—to follow state-driven development initiatives (including agrarian transition and reforestation schemes) and the resultant LULC change.
To gain greater insights into the possible causes of this LULCC, we sought to meet with state officials working in the region at the sub-district, district. and provincial levels—the very individuals charged with implementing state policies “on the ground”. We were curious to gain their insights and opinions regarding the series of LULCC maps that we had produced, covering the decades 1990–2000, 2000–2010, and 2010–2020, for two inland, neighboring rural districts. While we have been working with farmers in the region since 1999 and have published our findings regarding their livelihoods and the impacts of state policies elsewhere (e.g., [5]), there is limited scholarly literature regarding Vietnamese state officials’ perspectives on and the narratives of LULCC. To address these knowledge gaps, we have two objectives. Objective 1: To analyze and document the main land use and land cover change (LULCC) that has occurred in the mountainous upland districts of Phong Thổ and Bát Xát in northern Vietnam since 1990. Objective 2: To gather and assess the perspectives of local state officials working in these districts regarding our LULCC findings and their interpretations of our LULCC findings.

2. Materials and Methods

Next, we introduce our study site and detail the mixed methods approach we employed, including the creation of LULCC maps for the inland upland borderland districts of Phong Thổ and Bát Xát and in-depth, semi-structured interviews with local state officials. We then outline our LULCC analysis, which indicated a reduction in deforestation rates in both districts. This is followed by insights from interviews conducted with provincial, district, and sub-district officials, during which, we presented our LULCC maps and sought their feedback on the observable changes. Notably, when presented with our maps, officials in the two provinces steadfastly asserted an unequivocal increase in forest cover. We conclude by discussing the consequences of this disjunction.

2.1. Study Area

This case study is situated in the provinces of Lai Châu and Lào Cai, which neighbor each other in upland northern Vietnam, and both are located directly on the Sino-Vietnamese border (Figure 1). Vietnam’s northern mountainous region has a tropical monsoon climate (rainy, dry, and cold seasons), with an average annual rainfall of 1800 mm and an average temperature of 18–25 °C, varying by elevation [26]. Lai Châu and Lào Cai Provinces have population totals of 460,196 and 730,420 inhabitants, respectively, both with predominantly ethnic minority populations. We focus on one district within each province, Phong Thổ District in Lai Châu Province and Bát Xát District in Lào Cai Province. Both districts abut the Hoàng Liên Sơn mountain range and are predominantly inhabited by Mien (Yao/Dao), Hmong, and Hani ethnic communities (in this descending order of population for both provinces) [27]. The elevation range for Bát Xát is approximately 88–2945 m [28] and 245–3012 m for Phong Thổ. We intentionally chose these two neighboring provinces and districts to facilitate a systematic exploration of discernible policy impacts and influences across similar ecologies and demographics and neighboring geographical areas.
Phong Thổ District had a population of 79,645 at the time of the 2019 census, with 93 percent of inhabitants classified as rural. The highest proportions of ethnic minorities in the district are Mien (37 percent) and Hmong (27 percent). The district covers an area of 1034.60 km² and is divided into 17 communes, including the district capital town of Phong Thổ, and 16 rural communes. The population density is 77/km2 [27]. Phong Thổ District is bordered to the east by the Hoàng Liên Sơn mountain range. In areas with more pronounced inclines, a mix of closed- and open-canopy forests is commonly observed, along with dry rice and maize cultivated on hillsides. Hillsides are also often planted with cassava, hemp, and other seasonal crops. In the lower-lying valley region to the west of the district, the cultivation primarily involves wet rice farming, usually yielding one harvest annually (Figure 2).
Bát Xát District had a population of 82,733 in 2019 and also had 93 percent of its inhabitants classified as rural. The highest proportions of ethnic minorities in the district are 31 percent Hmong and 25 percent Mien. The district covers an area of 1050 km2, hence very similar in size to Phong Thổ District. The district is divided into 21 communes, including the district capital town of Bát Xát and 20 rural communes. The population density is 106 people/km2 [27]. Incorporating a segment of the Hoàng Liên Sơn mountain range as the district’s western margin, Bát Xát District experiences elevated humidity levels because of the range having a barrier effect on atmospheric circulation. The district is characterized by steep slopes to the west and east, with a valley running northwest to southeast through the central region. It is bordered to the east by the Red River and its valley. As for Phong Thổ District, in Bát Xát District on the steeper slopes, one tends to find closed- and open-canopy forests interspersed with dry rice and maize cultivation. In the valleys, wet rice cultivation predominates, with farmers typically harvesting one wet rice crop per year, although, in some lower-lying areas with favorable agroecological conditions, it is possible for farmers to harvest two crops annually.
In both districts, farmers living close to old-growth forests also frequently cultivate black cardamom (Lanxangia tsaoko, formerly known as Amomum tsaoko), taking advantage of the forest canopy’s shade (Figure 2B). Also, in both districts, but more so in Bát Xát, forest plantations are being established on a relatively small, yet growing scale. These include state-supported species, including alder (Alnus nepalensis), eucalyptus (Eucalyptus urophylla), cinnamon (Cinnamomum cassia), Magnolia conifera, and acacia (Acacia auriculiformis) [29,30]. Additionally, ethnic minority farmers have traditionally grown Cunninghamia lanceolata (a species of tree in the cypress family), which has only received state endorsement in the last eight years [5,31].

2.2. Overview of Data and Analysis

We present an overview of the steps taken to gain and analyze both the remotely sensed data (Section 2.3 and Section 2.4) and the state official interviews (Section 2.5) in Figure 3. The main outcome of the remote sensing analyses, namely, the LULCC maps, were shown to officials during interviews. The results from these two data sources are presented in Section 3, with similarities and differences discussed in Section 4.

2.3. Satellite Image Classification

We selected satellite imagery from Landsat 5 TM, Landsat 7 ETM+, and Landsat 8 OLI (30 m pixel size) for neighboring Phong Thổ and Bát Xát Districts (Figure 1, Table A1). All the images were from October, when agricultural crops such as paddy wet rice, maize, corn, and cassava are not present, allowing for the identification of subsistence crops as ”bare soil”, minimizing confusion with the shrub class. While we acknowledge that this may lead to an overestimation of ”bare soil” due to not differentiating areas of exposed soils and areas used for agriculture, in these districts, plots of unused bare soil are generally not present. Cleared land is almost always used for agricultural purposes. We determined five land cover classes: closed-canopy forest, open-canopy forest, shrubs, water, and bare soil (which is almost entirely agricultural). We also chose one land use class (built-up) following previous work by [23,24,25]. We considered closed-canopy forests to be areas with >60% tree cover and open-canopy forests to be areas with tree cover between 10% and 60%.
We downloaded the atmospherically corrected Landsat imagery (Collection 2, Level 2) from USGS EarthExplorer. We then carried out a geographic object-oriented classification [32] with eCognition Developer v.8.7, consisting of multi-resolution segmentation (scale: 30, shape: 0.6, and compactness: 0.8) followed by a nearest neighbor classification based on the object level mean and standard deviation values of brightness (i.e., average of the means of the six bands: blue to shortwave infrared) and reflectance from all six bands (Table A1).
In addition, RGB cloud-free composite basemap tiles from the Planet Dove constellation for the second (April–June) and fourth (October–December) quarters of 2020 were used to aid in augmenting the number of field validation points to assess the classification accuracy for 2020. The classifications were validated with 34 field reference points collected in February 2022 and 316 points extracted through the interpretation of the Planet basemaps. In total, fifty points were used for each of the six classes, except bare soil, for which 100 points were used. At each field reference point, the GPS location was recorded (5 m precision), land cover/use was described, and photos were taken in the four cardinal directions.

2.4. LULC Change Estimation

LULC change was estimated from the object-based image classifications. The absolute values of changes for each class were estimated as follows: area in hectares was computed at specific times (1990, 2000, 2010, 2020); area change in hectares was computed during specific periods (1990–2000, 2000–2010, and 2010–2020). The annual rate of change in hectares by year during these periods for each class was computed to measure LULC change following [33] (Equation (1)):
R a t e = ln A 2 A 1 t 1 t 2
where A1 = area at an initial time (t1); A = area of land cover class at time 2 (t2).

2.5. State Official Interviews

We completed interviews with twelve state officials in Lai Châu and Lào Cai Provinces using a semi-structured interview guide. All officials were working within the Department of Forestry at the provincial, district, or sub-district levels (there are nine sub-district offices—five in Phong Thổ District and four in Bát Xát—that each have one to seven communes under their jurisdiction). We interviewed one provincial-level official and one district-level official for each study site (four total). We then interviewed one official from eight of the nine sub-district forestry offices in the two districts (one was unavailable because of a family emergency). The interviews, lasting one to two hours, included questions regarding the officials’ professional development and training, time in their current positions, their regular responsibilities, their observations of LULCC in the region (for the duration of their current tenures in the uplands), and their impressions of the causes of LULCC. They were then presented with our LULCC maps (see Section 3) and a concise description of what they showed. An open-ended question was posed to solicit their insights and feedback regarding the depicted changes. The qualitative data were coded using thematic and constant comparative coding.
It should be noted that gaining access to and interviewing state officials in Vietnam is notoriously difficult [34,35,36]. These interviews were facilitated by the social capital the first author had in the region, stemming from a former student now employed in a provincial office, while the third author had cultivated strong connections with different officials during nine months of fieldwork in the districts for his MA and Ph.D. between 2018 and 2023. These findings are complemented by observations made during ethnographic fieldwork with ethnic minority farmers in the two districts by the third author and fieldwork with ethnic minority farmers in the two provinces since 1999 by the fourth author. However, we focus on state officials’ interpretations and narratives in this paper, with farmer observations and discussions being the focus of [31].

3. Results

3.1. Classification Accuracy

Table 1 shows a confusion matrix for the 2020 classification. The overall accuracy is 82.57% (kappa = 0.79). The producer’s accuracy ranges from 74.40% (bare soil) to 95.45% (water). The user’s accuracy ranges from 74.00% (built-up) to 93% (bare soil). The overall classification accuracy of the classification is 82.57%. Since neither field reference points nor high-resolution satellite imagery were available for the earlier time periods, but because the classification methodology was the same for all years and performed with local expert knowledge, a similar accuracy is expected for the classifications from 1990, 2000, and 2010.

3.2. Land Use and Land Cover Change (LULCC)

3.2.1. Land Use and Land Cover Summary

Figure 4 shows the percentage of area cover of each land cover class for 1990–2020. Figure 4 and Table A2 show that, at the start of our study period in 1990, closed-canopy forests covered the largest area (103,173 ha), with bare soil (agricultural lands) next (63,763 ha), then open-canopy forests (20,357 ha), and then shrubs (14,165 ha) and water (6268 ha). Built-up (1334 ha) covered the smallest surface area. In the most recent classification, 2020, the difference between closed-canopy forest and bare soil decreased considerably to 2856 ha (from 39,410 ha in 1990), resulting in near equal proportions of closed-canopy forest and bare soil in the landscape. The water class consisting of large rivers remained consistent over time (~6268 ha) and, as such, is omitted from the class-wise land cover change analysis (see Section 3.2.2).

3.2.2. LULCC over the Entire Time Period (1990–2020)

The main increase in a specific land cover or land use for both districts combined was for bare soil (17,421.2 ha during 1990–2020), noting that this could relate to the cultivation of dry rice, corn, cassava, hemp, or other seasonal crops (Figure 4 and Figure 5; Table A2). The main decrease was in closed-canopy forests (19,132.8 ha during 1990–2020). For 30 years, bare soils have had the biggest increase in area (17,421.2 ha), with an annual rate of change of 2.12 percent, whereas closed canopy has had the biggest decrease in area (19,132.8 ha), with an annual rate of change of 2.28 percent (Table A2).
More specifically, these results show that, while the total closed-cover forest has declined over the three time periods (1990–2000, 2000–2020, and 2010–2020), the amount being lost is slowing down each decade. We can thus observe that far less closed-canopy forest was lost during 2010–2020 than was lost from 2000 to 2010, and less again than in 1990–2000. With a total of 202,793 hectares, a loss of only 1642 hectares over the past decade (2010–2020) is considered very low (Figure 5, Table A2).
Figure 5, Table A3 (for Phong Thổ District), and Table A4 (for Bát Xát District) show differences in land cover change between the districts. For Phong Thổ, between 1990 and 2000, the bare soil class overtakes closed-canopy forest and remains the largest area class during the other time periods. In contrast, in Bát Xát, the class proportions remain consistent over time. With the two districts combined (Figure 5; Table A2), between 2000 and 2010, shrubs overtook open-canopy forests in terms of area because of an increase in shrub area in Phong Thổ in that same period. From 2000 to 2010 in Phong Thổ, the deforestation of closed-canopy forests nearly halted after 2000, with the area lost decreasing from 9560.7 ha (1990–2000) to 344.5 ha (2000–2010) and 122.2 ha in 2010–2020 (Table A2, Figure 5). An overall decline in the loss of closed-canopy forests is also seen for Bát Xát across the entire time period between 1990 and 2020, but when comparing the individual decades, there was a slight increase in area lost between 1990 and 2000 (3066.8 ha) and between 2000 and 2010 (4517.7) (Table A4). The greatest increase in built-up areas was seen for the first decade (1990–2000) for both districts, while the class with the greatest increase in area over time was bare soil.

3.2.3. LULC Change over Individual Decades: 1990–2000, 2000–2010, and 2010–2020

LULC change matrices (Table 2, Table 3 and Table 4) indicate the observable transitions for land cover and land use during the period from 1990 to 2000. Table 2 shows that, across the two districts, the transitions to bare soil occurred most often when closed canopy and shrubs converted to bare soil (11,764.94 ha and 7473.45 ha, respectively). Shrubs were converted primarily from closed canopy and bare soil (7564.26 ha and 5964 ha, respectively).
While Table 3 for Phong Thổ District and Table 4 for Bát Xát District show similarities in land cover transitions, one notable difference is the increased conversion of the open-canopy class to bare soil in Bát Xát (4288.8 ha) in comparison with Phong Thổ (2178.4 ha). In both districts, very little (<300 ha) built-up area was abandoned with conversion into a vegetated class.
LULC change during 2000–2010 shows a different trend (Table 5, Table 6 and Table 7). In Table 5, for both districts, bare soil was predominantly converted to shrubs (9335.27 ha), while built-up areas were mainly converted from bare soil (1237.27 ha). The expansion of closed-canopy forests occurred most often because of conversion from bare soil (4290.37 ha), shrubs (3299.95 ha), and open canopy (1103.50 ha).
Table 6 and Table 7 for Phong Thổ and Bát Xát Districts show opposing patterns of vegetation loss and gain. In Phong Thổ (Table 6), the largest conversion is bare soil to shrubs (6765.4 ha), following the overall pattern from Table 4. However, in Bát Xát, the largest conversion is from closed-canopy forest to bare soil (4972.8 ha) and open-canopy forest to bare soil (4262.8 ha). Bare soil to shrubs is lower in comparison (2569.8 ha).
During 2010–2020 (Table 8), across the two districts, transitions to bare soil occurred most often when shrubs converted to bare soil (10,389.54 ha), while closed canopy converted mainly to bare soil (4357.94 ha). Built-up areas were converted primarily from bare soil (935.85 ha). In Table 9 and Table 10, for the districts of Phong Thổ and Bát Xát individually, there is agreement between the greatest area of conversion from shrubs to bare soil (6863.0 ha, Phong Thổ; 3526.5 ha, Bát Xát). The main difference between the two areas is the relatively large conversion of closed- and open-canopy forest to bare soil in Bát Xát (2406.7 ha and 3300.6 ha), which is nearly equal to the loss of the shrub class to bare soil. In Phong Thổ, the loss of closed- and open-canopy forests converted to shrubs (1951.2 ha and 1332.3 ha) is closer to only one-third of the loss of the shrub class converted to bare soil.
Figure 6, Figure 7 and Figure 8 illustrate the LULCC maps shown to state official interviewees. Overall, attrition in the small patches of closed-canopy forest can be seen through the three decades, while the largest connected patch of forest in the north remains more intact. The large conversion of closed-canopy forests in the 2000–2010 decade (Table 6 and Table 7) can be seen in Figure 7, with the areas cleared predominantly found on the edges of intact forests, especially in Bát Xát. The decrease in the loss of closed-canopy forests from 2010 to 2020 (Table 9 and Table 10) is also evident in Figure 8, with mainly patches of open-canopy forest being converted to the bare soil class. Consistently over these three decades, the region with the largest patches of regeneration (bare soil to closed-canopy forest) can be found in Bát Xát on the NW border with China (Figure 6, Figure 7 and Figure 8).

3.3. State Officials’ Interpretations of the LULCC Maps

3.3.1. Positive Causes of a Decline in Deforestation Rates

Of all the changes that the LULCC maps showed, it was changes in forest cover that the officials were quick to focus on and choose to discuss further. Since the 2010s, provincial governments have been allocating forestry payments to districts, which then allocate these payments to communes. Communes then give payments to village households (interviews, 2023). Payment amounts are determined by the area, the quality of the forest, and the number of households in a village. In turn, villagers are tasked with protecting the forest by creating schedules for forest patrols and organizing penalties for violators (e.g., someone felling timber without permission). Payments range between about VND 4–12 million (~USD 165–495) per household, per year. While forestry officials viewed such payments for forest environmental services (PFESs) as the one forest policy that had the greatest direct impact on local villagers/farmers, some officials acknowledged the limitations of these PFES schemes. One sub-district-level official in Phong Thổ stated that the compensation provided in the communes they were in charge of—VND 5–6 million (~USD 206–248) per household annually—was probably insufficient to change behaviors regarding forest use (interview, 2023). Nevertheless, an official working in a sub-district office in Bát Xát declared that the implementation of PFESs had significantly enhanced local awareness, reducing forest encroachment and exploitation (interview, 2023).
In addition to monetary compensation, the officials also identified the allocation of land use rights as a policy measure that was key to reductions in deforestation rates, especially due to an increase in sedentarization and an associated decline in shifting cultivation. Once policies enabled the allocation of land use rights to individuals in 1993, deforestation allegedly lessened [37]. As one sub-district-level official in Phong Thổ District explained, “The changes in land use were mainly due to people’s shifting cultivation and deforestation in the past. However, since the 1990s, people have received allocated land for agricultural purposes, and their shifting cultivation practices have decreased” (interview, 2023).
Two specific policies, one from 2012 and the other from 2017, were also seen as key to the declining deforestation rates. Officials from both districts explained that, in 2012, Decision 7/2012/qd-Ttg allowed households to be granted certain forest use rights and a forest land use certificate in return for protecting a forest area. This allowed them to become the “owners” of the land, and households started to protect “their forests” (all land in Vietnam is officially owned by the state, so these are long-term use rights; interviews, 2023 [38]). After receiving a certificate, individuals who violated forest protection regulations faced stiff penalties. The officials argued that, historically, when forests were collectively owned, they were left unprotected and subject to widespread exploitation. However, with the allocation of individual household ”ownership”, the practice of “destroying forests” had declined (interviews, 2023).
Similarly, nearly every official we spoke with, across both districts, also attributed a decline in deforestation rates to the enforcement of Directive No. 13-CT/TW in 2017. This directive mandates that the conversion of “natural forests” requires approval from either the National Congress or the Prime Minister, imposing substantial constraints on any actor—be it a state entity, corporation, or individual—seeking to repurpose existing natural forests for alternative uses. In the event of approval, those accountable for such conversions must undertake afforestation efforts or remit funds to the government for afforestation projects. Notably, the officials indicated that a considerable number of corporations (e.g., mining, hydroelectric dams, and large cold-water fisheries) opt for the latter option (interviews, 2023).
Specific areas of the maps where conversions to open- or closed-canopy forest cover were apparent were often pointed to by officials and attributed to Program 327, “Regreening the Barren Hills Program”, implemented in 1993. As the name suggests, state efforts to afforest areas ensued. Program 327 defined three different forest classifications, which were to be managed by forest management boards, who then contracted individuals to afforest plots and protect existing forests (interviews, 2023 [39,40]). Further empowering individual land users, Program 327 aimed to give authority to local organizations to allocate responsibilities to individuals to plant, protect, and regenerate forests. In 1997, Program 661 (“The Five Million Hectare Reforestation Program”) began encouraging farmers to plant trees not only on “barren hills”, but also on other “inefficient” parcels of land, predominantly lower-elevation fields that rotated corn, cassava, and banana trees. Farmers were encouraged to plant mỡ (Magnolia conifera), keo (acacia), and quế (Chinese cassia, or “bastard cinnamon’; see [41] for a disambiguation of “Vietnamese cinnamon”), among other trees. One sub-district official noted that “Cinnamon is the most valuable timber tree in this area. People have gradually changed bare soil and unused land to cinnamon because of government programs” (interview, 2023).
While cinnamon was touted as a very lucrative crop, a few officials also recognized the difficulties local farmers faced in investing in such plantations. As one district official explained:
Previously, the low price of timber discouraged people from investing in tree cultivation. In upland districts, agriculture and forest products are crucial for the local communities’ livelihoods. Establishing cultivated forests in these areas requires an investment of approximately VND 8–10 million [~USD 330–410] per hectare, with income only realized after a 10-year period (interview, 2023).
Interviews with these officials (and those previously undertaken with farmers [31]) revealed that farmers who had the financial means to invest in forestry, either privately or with government assistance, were often households that were already more wealthy, with larger land parcels (beyond what was needed for subsistence cultivation), land use rights, and surplus labor for weeding tree plantations, a point we return to in our discussion.
Each of the positive factors contributing to a decline in deforestation rates, as mentioned above, did not yield important distinctions in the responses from officials based on the district and, hence, province in which they were employed. The only distinct cause, observed in Bát Xát District, for a reduction in deforestation rates was attributed to the establishment of the Bát Xát Nature Reserve. This was inaugurated in 2017 and financially supported by KfW, a German development bank (interviews, 2023, [42,43]). Spanning five communes, the nature reserve covers 18,637 hectares, constituting nearly a fifth of Bát Xát District. Within the core area of the reserve, stringent regulations prohibit the collection of timber or non-timber forest products, with the exception of black cardamom. Yet, following the Reserve’s establishment, concerns arose among ethnic minority farmers regarding the potential prohibition of black cardamom cultivation in the future. Indeed, in discussions with officials in Lào Cai Province, it was disclosed that there are plans to phase out black cardamom as a viable livelihood strategy in the Reserve by the year 2030.
What we noted, which local officials consistently omitted from their discussions regarding forest conservation, were the independent measures that ethnic minority farmers have taken to conserve forests. The officials never mentioned the traditional environmental protection practices of ethnic minorities in the two districts, such as ethnic minority farmers’ widespread understanding and acknowledgment of the need to protect watershed areas, wildlife, non-timber forest products, and timber stocks [39,44]. Despite disrupting decades—even generations—of forest conservation by local communities in some communes, most officials argued that monetary compensation for forest protection, through payments for forest environmental services (PFESs), was appropriate. Yet, Mien, Hmong, and Hani farmers in these districts have voiced their frustrations to us regarding forest restriction laws, including those pertaining to the Bát Xát Nature Reserve [31].

3.3.2. Negative Reasons Deforestation Continues

Forestry officials at all jurisdictional levels in both provinces identified agricultural expansion—specifically for cereal crops (rice and maize, as well as limited buckwheat and wheat in Bát Xát), medicinal plants, and grazing land (mostly for water buffalo, cows, or horses)—as primary drivers of deforestation, along with timber and firewood collection. This expansion was partly attributed to population growth. For example, Phong Thổ District had a population of 66,372 at the time of the 2009 census and 79,645 at the time of the 2019 census, a rate of increase of approximately 18.15%. Meanwhile, Bát Xát District had a population of 70,015 at the time of the 2009 census and 82,733 at the time of the 2019 census, a rate of increase of approximately 18.16%, remarkably similar to Phong Thổ District [27,45].
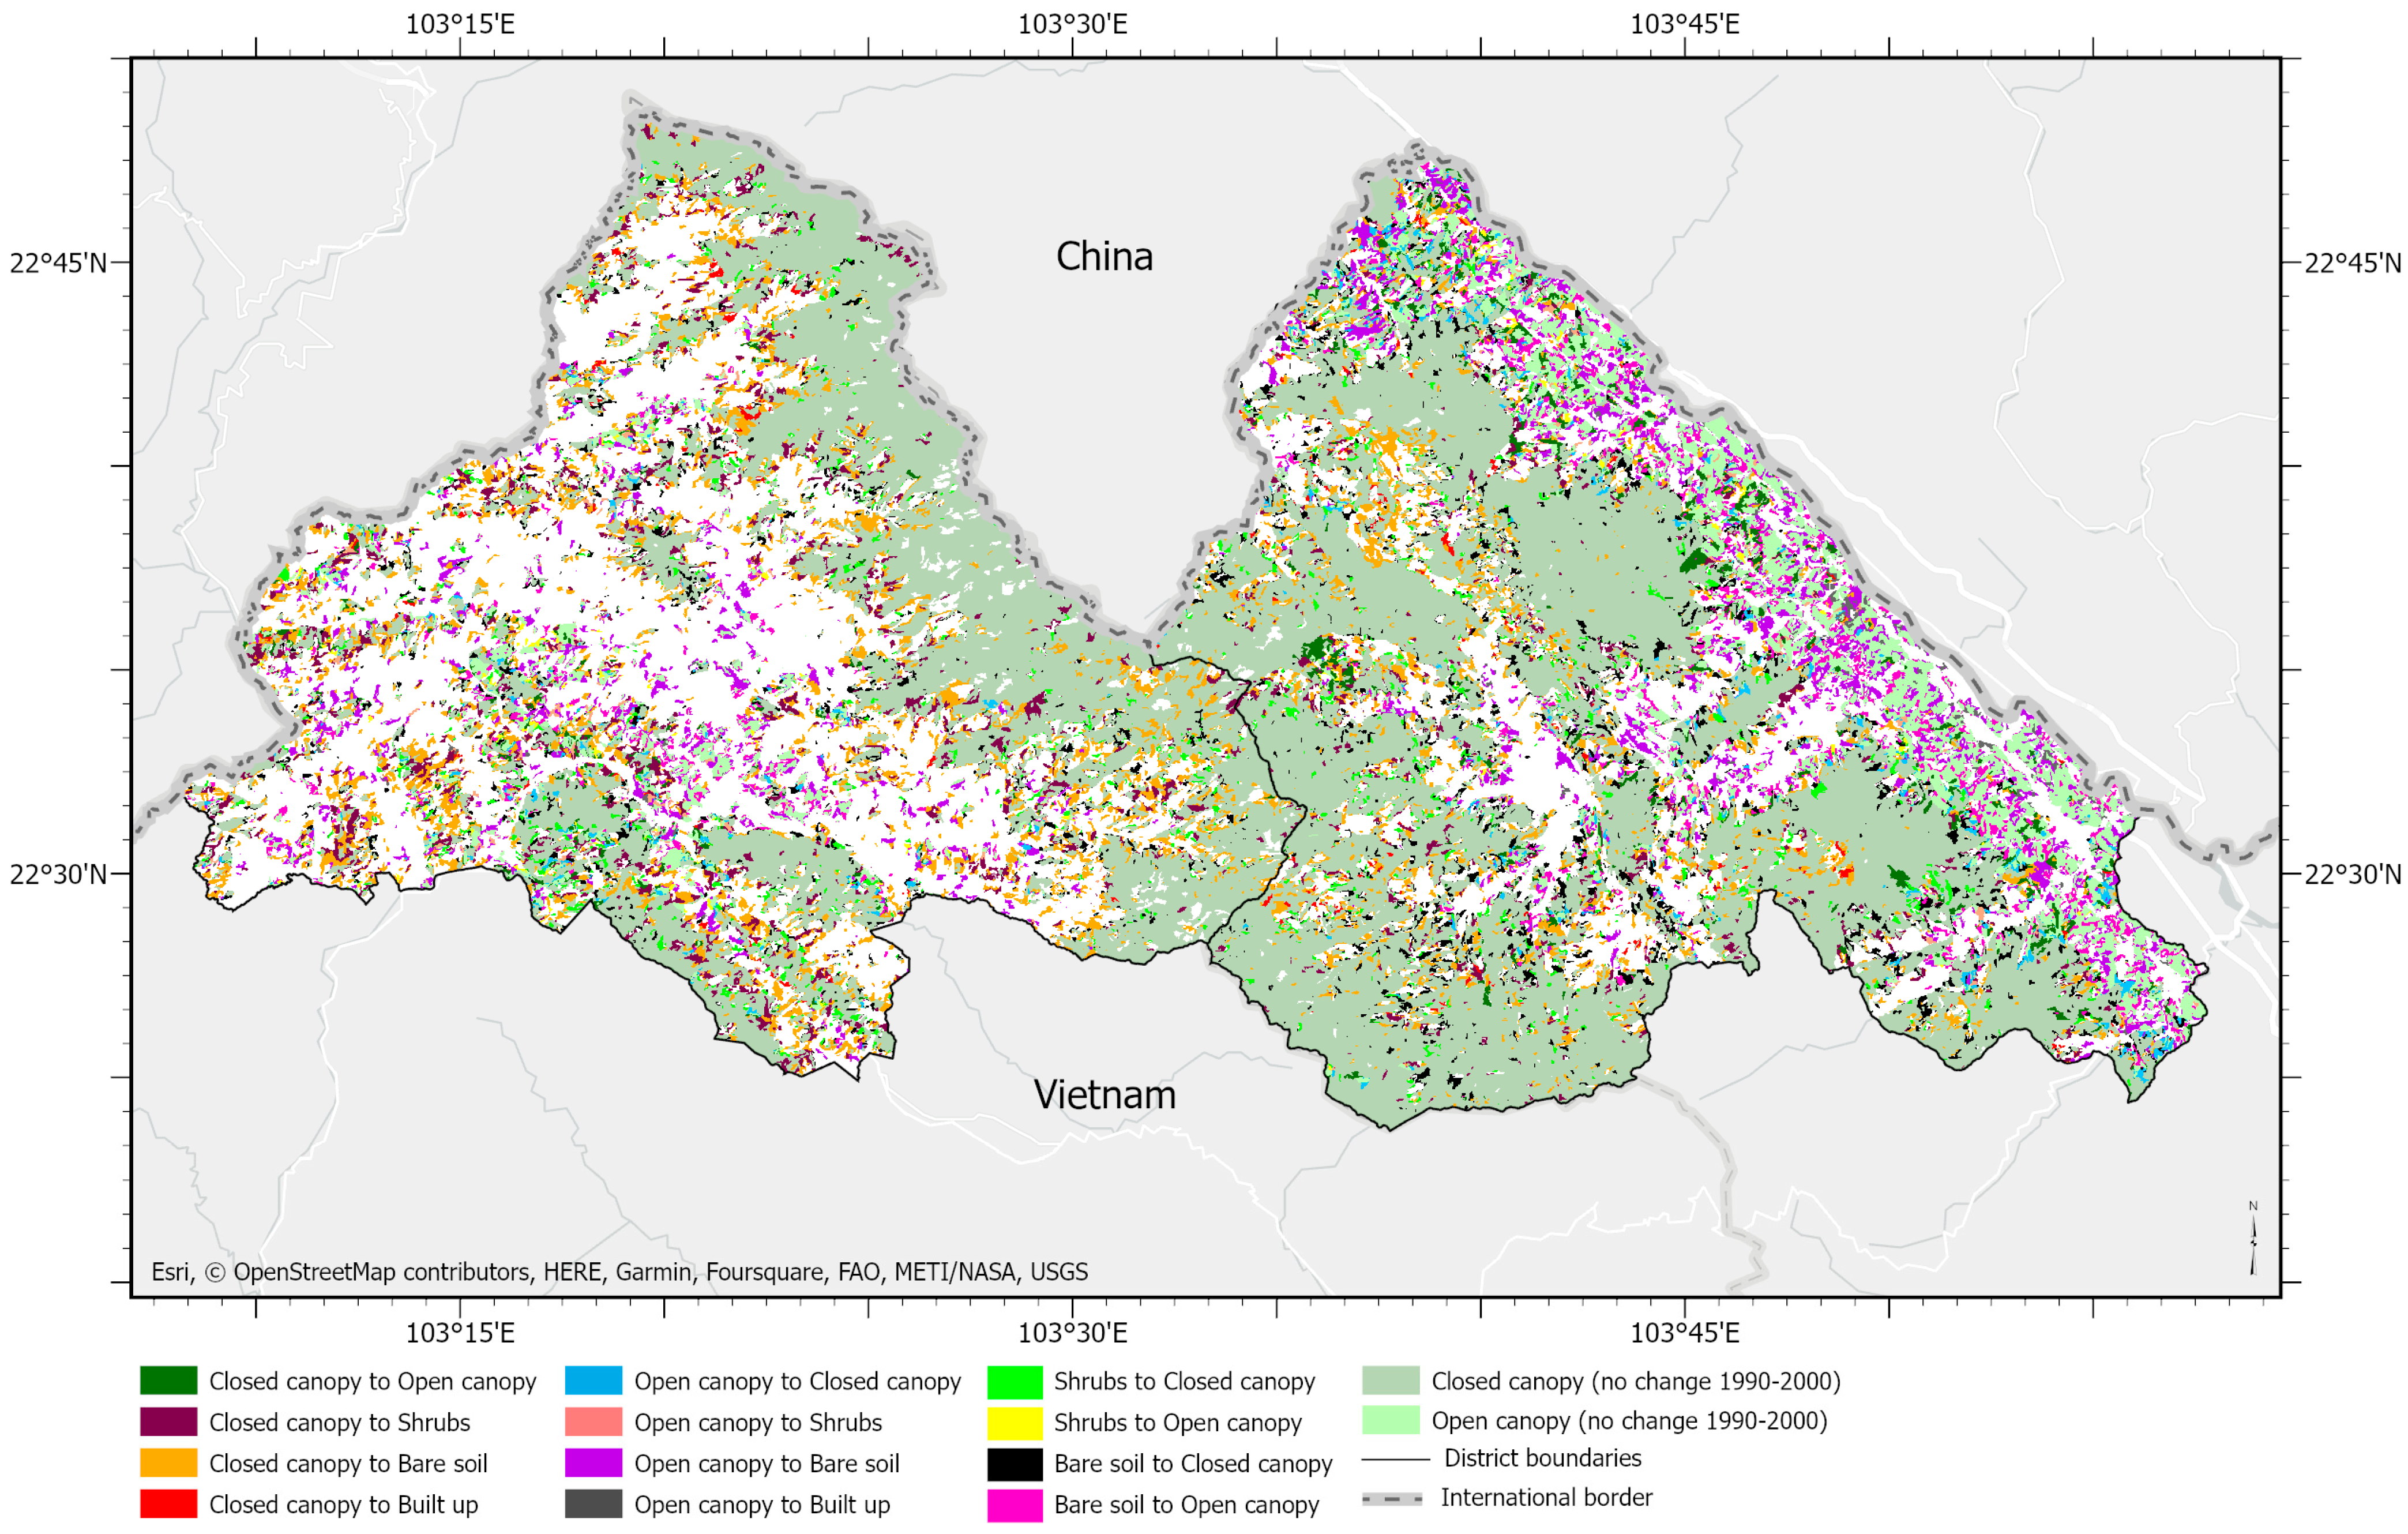
The officials predominantly attributed the conversion of closed- or open-canopy forests to bare soil, especially during the period from 1990 to 2010, to expanding swidden cultivation. A sub-district forestry official in Phong Thổ District noted that “People moved to live in other places too often, and farmers didn’t focus on just one field. Secondly, there were no fire restrictions. People just burnt areas to clear new fields and took fresh grass for animals, which caused a lot of deforestation” (interview, 2023). Nonetheless, a sub-district official from Bát Xát District offered a more sympathetic view on why local farmers had cleared forests in the past:
From 1990–2010, the economy wasn’t open, there were no border gates [at which to cross to China], and people couldn’t find work as laborers. So, farmers went to the forest to cultivate and produce crops like cassava, sweet potato, and rice. To grow rice, they needed to clear the forest and burn it. Later, when there were more opportunities for cultivating wet rice, people gradually stopped cultivating hill rice (interview, 2023).
Beyond staple crops, another sub-district official in Bát Xát District argued that deforestation was due to ethnic minority farmers cultivating medicinal crops for cash income: “From 2000 to 2010, people still violated the rules, cutting down the forest to plant black cardamom, đương quy [Angelica sinensis], and xuyên khung [Ligusticum striatum]. It related to economic pressure; they couldn’t find wage work and were forced to go to the forest” (interview, 2023).
The officials also recognized infrastructure as a cause of land use change. A sub-district official in Phong Thổ District specified: “Because of the New Countryside Program [Nông Thôn Mới], now everyone has concrete roads that lead to their commune. Some villages have small concrete paths for motorbikes” (interview, 2023). The officials added that the New Countryside Program supported the construction of new government buildings, schools, and commune community centers and provided limited construction materials or cash for “modernizing” roofs, kitchens, and toilets (official interviews, 2023 [46,47]). Dependent upon road infrastructure for maintenance and construction, hydroelectric dams were also seen as an important infrastructural change in these two districts. One Bát Xát District-level official recounted that “The presence of several hydroelectric dams has already impacted forested regions. The people living in highland communes rely on natural forest products for their livelihoods. Therefore, any reduction in natural forest areas could have a significant impact on their ability to sustain themselves” (interview, 2023).

4. Discussion

Our comprehensive analysis of LULCC maps, spanning 1990 to 2020, conclusively demonstrates that, when comparing the two districts, Phong Thổ stands out as the more dynamic in terms of LULCC during this period. This observation was evident in the maps and during our own on-site observations of both districts. We attribute this difference to Phong Thổ District still being in the initial stages of agrarian and forest transitions, characterized by a shift from semi-subsistence cultivation to cash crops and plantations. In contrast, farmers in Bát Xát District began this agrarian transition earlier, and rates of large-scale land cover change have slowed. This difference in the initiation and speed of agrarian changes likely stems from the easier accessibility of Bát Xát District. The district’s eastern border is the Red River Valley, which is a major transportation corridor from the Vietnam lowlands to Lào Cai City on the Chinese border and across into China.
Contrary to findings in European contexts, where military training areas significantly impact LULC [48,49], our fieldwork since 1999 indicates no such effect in these Vietnamese districts. This area was not directly involved in the Vietnam War, and the Sino-Vietnamese War of early 1979 was too brief for the creation of any sizable military areas. The border only had concrete markers and the occasional military post until China built a metal fence in 2021 (after our mapping period). However, there has been a rise in the construction of road infrastructure in border areas for economic development (perhaps with a secondary benefit of military readiness) [12].
In our interviews with state forestry officials, their focus was predominantly on the slowdown in the rate at which closed-canopy forests are diminishing. State officials argued that this was due to a range of effective state policies, which they expressed considerable pride in contributing to. Such measures slowing deforestation included the promotion of tree crops through different decrees, the implementation of payments for forest environmental services, and land use rights being provided to households for forest plots. To give these officials credit, their involvement in the implementation of these policies did contribute to the deceleration of forest removal.
What was less frequently acknowledged by these officials, but was evident from our own observations and earlier farmer interviews, was that it was a subset of more financially and resource-rich farmer households that were benefiting from government programs promoting forestry as a poverty alleviation strategy (see also [17,50]). Furthermore, the officials rarely acknowledged that the preservation of forest cover was also due to the traditional ecological knowledge, forest protection traditions, and specific livelihood strategies of ethnic minority farmers. These livelihood strategies included the cultivation of black cardamom under closed-canopy cover, which has played a central role in this preservation effort (see also [24,31]).
Despite our LULCC findings suggesting a relatively positive overall trend, that is, a decrease in deforestation rates over this 20-year period, a number of state officials in the two provinces, occupying a range of positions, tended to be upset at our findings and remained resolute in claiming a definitive increase in forest cover. Criticisms of our LULCC maps included “not creating the maps correctly”. The officials appeared to misunderstand that the maps solely focused on changes and were not the land use and land cover for a specific year. This occurred despite us pointing out these changes after they had initially reviewed the maps. In any case, the maps elicited some heated responses, especially from the four “more senior” interviewees at the provincial and district levels. We were told that our maps were “incorrect” or “not the most accurate” and that we “needed to reassess and analyze the satellite images” (interviews, 2023). Most criticisms were directed at the fact that the satellite images used were from October to December when there were no leaves on a number of plants. A district-level official confidently spoke from his experience: “I worked on maps in the past. When we went to the real location of what was supposed to be forest, it was just corn and bananas. The image quality must be checked for accuracy. These maps are not accurate to what is at these places today” (interview, 2023). It should be remembered that all images were purposively acquired in the winter when paddy rice, corn, and cassava were absent. This deliberate choice enabled the identification of annual agricultural crops as “bare soil”, thereby minimizing potential inaccuracies related to small shrubs. Moreover, we completed ground truthing across the two districts, and Table 1 shows that our accuracy levels were robust.
These responses from some of the officials were thought-provoking. Such individuals are charged with turning the state’s policies into reality, and those working in upland remote areas are provided with additional monetary incentives for their “hardship posts”. Officials are rewarded for positive policy outcomes and can see benefits, perks, or promotions stalled or revoked otherwise. Criticizing our maps, presented by an academic from Hanoi and an overseas Ph.D. student, was perhaps easier than a soul-searching inquiry into why deforestation was still occurring to a greater degree than it should theoretically be if all state policies were strictly adhered to (see also [12,51]).
We are not necessarily questioning the state officials’ own actions here, but we do question the degree to which officials stationed in these uplands are fully aware of the complex upland livelihood dynamics of ethnic minority residents, including the positive outcomes that local livelihood decisions can have for forest cover [52]. This includes possible benefits if ethnic minority households are allowed to pursue time-honored livelihoods such as the collection of non-timber forest products and if respect is paid to traditional environmental protection norms. Moreover, while some officials were able to acknowledge the negative implications of some of the policies being implemented in these uplands, others were far less critically reflexive. This latter group remained steadfast in their opinion that the policies were in everyone’s best interests, highlighting the considerable influence of the socialist state’s development discourse on its employees [51,53].

5. Conclusions

So, where could things go from here? This study calls for a deeper understanding and respect for traditional environmental protection norms and ethnic minority livelihoods, which could potentially offer significant benefits for forest conservation. If state officials were able to overcome their initial reservations or potential misunderstandings of such LULCC maps and data, we believe that enhanced insights into LULCC, livelihood patterns, and agricultural and forest transitions in this region could create valuable opportunities. While state policies have had positive impacts in slowing deforestation rates, officials adamantly repeated state narratives concerning both forest deforestation and reforestation causes, allowing little room for other and. perhaps, more citizen-led drivers [54]. If officials were more open to considering a range of non-policy drivers of such LULC changes, farmers and officials might be able to engage in more constructive dialogs, which, in turn, could possibly lead to mutually beneficial policy outcomes. For instance, in locations where officials observe an expansion of closed-canopy forests on a LULCC map, instead of working toward a ban on black cardamom cultivation, they could contemplate regulating cardamom cultivation instead. This might include implementing stringent firewood collection protocols (for drying the cardamom pods), encouraging balanced forest conservation with cardamom cultivation, and establishing harvest dates to safeguard forests, mirroring successful policies enacted just across the border in Yunnan [25]. Similarly, registering a lack of change in specific areas in the LULCC tables and maps could lead to a heightened awareness of agroecological constraints and a subsequent reevaluation of potentially unsustainable agricultural policy options. Acknowledging Vietnam’s highly hierarchical state structure, the integration of such findings into decision-making processes for these upland, inland areas obviously poses a challenging endeavor. However, through continued research endeavors like the present study, a heightened understanding among Vietnamese academics and policymakers of LULCC complexity in Vietnam’s northern uplands could foster increased dialog and gradually influence decision-making processes among stakeholders and at geographical scales, from the national to the local level.

Author Contributions

Conceptualization, S.T.; methodology, T.A.N., H.L. and M.K. (LULCC methods); S.T. and P.S. (qualitative methods); validation, T.A.N., H.L. and M.K. (LULCC validation), S.T. and P.S. (qualitative data validation); formal analysis, M.K., T.A.N. and H.L. (LULCC), S.T. and P.S. (qualitative analysis); writing—original draft preparation, S.T., M.K., P.S. and T.A.N.; writing—review and editing, S.T., M.K. and P.S.; funding acquisition, S.T. and P.S. All authors have read and agreed to the published version of the manuscript.

Funding

Funding was provided by the Social Science and Humanities Research Council, Canada, and the Wenner-Gren Dissertation Fieldwork Award.

Data Availability Statement

Data are unavailable because of institutional, privacy, or ethical restrictions.

Acknowledgments

We sincerely thank the state officials and local farmers with whom we talked for their time and enthusiasm in responding to our questions. We thank Duc Anh and Ngo Thuy Hanh for their translation and research assistance. Access to Planet Labs basemaps was provided by the Geographic Information Center, Department of Geography, McGill University.

Conflicts of Interest

The authors declare no conflict of interest. The funders had no role in the design of the study; in the collection, analyses, or interpretation of the data; in the writing of the manuscript; or in the decision to publish the results.

Appendix A

Table A1. Specifications of Landsat imagery bands used in this study. Near-IR = near-infrared; SWIR = shortwave infrared.
YearSatellitePath-RowImage Bands Used in the Analysis
1990Landsat 5 TM128-44Blue (450–520 nm), Green (520–600 nm), Red (630–690 nm), Near-IR (760–900 nm), SWIR1 (1550–1750 nm), SWIR2 (2080–2350 nm)
2000Landsat 7 EMT+128-44Blue (450–520 nm), Green (520–600 nm), Red (630–690 nm), Near-IR (760–900 nm), SWIR1 (1550–1750 nm), SWIR2 (2080–2350 nm)
2010Landsat 7 ETM+128-44Blue (450–520 nm), Green (520–600 nm), Red (630–690 nm), Near-IR (760–900 nm), SWIR1 (1550–1750 nm), SWIR2 (2080–2350 nm)
2020Landsat 8 OLI128-44Blue (450–515 nm), Green (525–600 nm), Red (630–680 nm), Near-IR (845–885 nm), SWIR1 (1560–1660 nm), SWIR2 (2100–2300 nm)
Table A2. LULCC change in Phong Thổ and Bát Xát Districts (combined) from 1990 to 2020 (hectares).
LULCArea in 1990 (ha)Area in 2000 (ha)Area in 2010 (ha)Area in 2020 (ha)1990–2000 Area Change (ha)2000–2010 Area Change (ha)2010–2020 Area Change (ha)1990–2020 Area Change (ha)1990–2000 Annual Rate of Change (%y−1)2000–2010 Annual Rate of Change (% y−1)2010–2020 Annual Rate of Change (% y−1)1990–2020 Annual Rate of Change (%y−1)
Closed canopy103,173.490,545.885,683.684,040.6−12,627.6−4862.2−1643.0−19,132.8−1.22−0.54−0.19−2.28
Open canopy20,357.418,785.316,934.714,663.2−1572.1−1850.6−2271.4−5694.1−0.77−0.99−1.34−3.88
Shrubs14,165.217,649.221,399.418,432.33484.03750.2−2967.14267.12.462.12−1.392.31
Bare soil63,763.372,832.474,795.781,184.59069.21963.36388.817,421.21.420.270.852.15
Built-up1333.92980.53979.84472.61646.5999.4492.83138.712.343.351.247.02
Total202,793.1202,793.1202,793.1202,793.10.00.00.00.0
Table A3. LULCC change in Phong Thổ District from 1990 to 2020 (hectares).
LULCArea in 1990 (ha)Area in 2000 (ha)Area in 2010 (ha)Area in 2020 (ha)1990–2000 Area Change (ha)2000–2010 Area Change (ha)2010–2020 Area Change (ha)1990–2020 Area Change (ha)1990–2000 Annual Rate of Change (%y−1)2000–2010 Annual Rate of Change (% y−1)2010–2020 Annual Rate of Change (% y−1)1990–2020 Annual Rate of Change (%y−1)
Closed canopy46,195.136,634.336,289.836,167.6−9560.7−344.5−122.2−10,027.5−2.07−0.09−0.03−2.77
Open canopy5170.74250.44705.24710.6−920.4454.85.4−460.1−1.781.070.01−0.98
Shrubs9964.111,881.614,365.911,189.31917.52484.3−3176.61225.21.922.09−2.211.09
Bare soil37,800.645,506.642,808.546,009.87706.0−2698.13201.38209.22.04−0.590.751.78
Built-up751.31608.81712.41804.5857.5103.592.11053.211.410.640.545.84
Total99,881.899,881.899,881.899,881.80.00.00.00.0
Table A4. LULCC change in Bát Xát District from 1990 to 2020 (hectares).
LULCArea in 1990 (ha)Area in 2000 (ha)Area in 2010 (ha)Area in 2020 (ha)1990–2000 Area Change (ha)2000–2010 Area Change (ha)2010–2020 Area Change (ha)1990–2020 Area Change (ha)1990–2000 Annual Rate of Change (%y−1)2000–2010 Annual Rate of Change (% y−1)2010–2020 Annual Rate of Change (% y−1)1990–2020 Annual Rate of Change (%y−1)
Closed canopy56,978.353,911.549,393.847,873.0−3066.8−4517.7−1520.8−9105.4−0.54−0.84−0.31−1.90
Open canopy15,186.614,534.912,229.49952.6−651.8−2305.4−2276.9−5234.0−0.43−1.59−1.86−5.26
Shrubs4201.15767.67033.57243.01566.51265.9209.53041.83.732.190.304.20
Bare soil25,962.727,325.831,987.235,174.71363.14661.43187.59212.00.531.711.002.62
Built-up582.61371.62267.42668.2789.0895.8400.72085.513.546.531.777.82
Total102,911.4102,911.4102,911.4102,911.40.00.00.00.0

References

  1. Kunstadter, P.; Kunstadter, S.L. Hmong (Meo) Highlander Merchants in Lowland Thai Markets Spontaneous Development of Highland-Lowland Interactions. Mt. Res. Dev. 1983, 3, 363–371. [Google Scholar] [CrossRef]
  2. Leisz, S.J.; Thu Ha, N.t.; Bich Yen, N.t.; Lam, N.T.; Vien, T.D. Developing a methodology for identifying, mapping and potentially monitoring the distribution of general farming system types in Vietnam’s northern mountain region. Agric. Syst. 2005, 85, 340–363. [Google Scholar] [CrossRef]
  3. Sowerwine, J. The Political Ecology of Dao (Yao) Landscape Transformations: Territory, Gender, and Livelihood Politics in Upland Vietnam; University of California: Los Angeles, CA, USA, 2004. [Google Scholar]
  4. Vuong, D.Q. The Hmong and forest management in northern Vietnam’s mountainous areas. In Hmong-Miao in Asia; Tapp, N., Michaud, J., Culas, C., Lee, G.Y., Eds.; Silkworm Books: Chiang Mai, Thailand, 2004; pp. 321–331. [Google Scholar]
  5. Turner, S.; Bonnin, C.; Michaud, J. Frontier Livelihoods: Hmong in the Sino-Vietnamese Borderlands; University of Washington Press: Seattle, WA, USA, 2015. [Google Scholar]
  6. McElwee, P. Becoming Socialist or Becoming Kinh? In Civilizing the Margins: Southeast Asian Government Policies for the Development of Minorities; Duncan, C.R., Ed.; Cornell University Press: Ithaca, NY, USA, 2004; pp. 182–213. [Google Scholar]
  7. Clement, F.; Orange, D.; Williams, M.; Mulley, C.; Epprecht, M. Drivers of afforestation in Northern Vietnam: Assessing local variations using geographically weighted regression. Appl. Geogr. 2009, 29, 561–576. [Google Scholar] [CrossRef]
  8. McElwee, P. Reforesting “Bare Hills” in Vietnam: Social and Environmental Consequences of the 5 Million Hectare Reforestation Program. Ambio 2009, 38, 325–333. [Google Scholar] [CrossRef] [PubMed]
  9. Meyfroidt, P.; Lambin, E.F. The causes of the reforestation in Vietnam. Land Use Policy 2008, 25, 182–197. [Google Scholar] [CrossRef]
  10. Sikor, T.; Tuyen, N.P.; Sowerwine, J.; Romm, J. Upland Transformations in Vietnam; National University of Singapore Press: Singapore, 2011. [Google Scholar]
  11. Socialist Republic of Vietnam. Decision No. 800/QD-TTG Quyết Định Phê duyệt Chương trình mục tiêu Quốc gia về xây dựng nông thôn mới giai đoạn 2010–2020. [Approval of the National Target Program Building a New Countryside in the 2010–2020 Period]. Available online: http://vanban.chinhphu.vn/portal/page/portal/chinhphu/hethongvanban?class_id=1&mode=detail&document_id=95073 (accessed on 30 November 2023).
  12. Turner, S. Slow forms of infrastructural violence: The case of Vietnam’s mountainous northern borderlands. Geoforum 2022, 133, 185–197. [Google Scholar] [CrossRef]
  13. World Bank. International Development Association Program Appraisal Document on a Proposed IDA Credit in the Amount of SDR 111.5 Million (US$153 Million Equivalent). National Target Programs for New Rural Development and Sustainable Poverty Reduction Support Program (NTPSP) Program-For-Results. Available online: https://documents1.worldbank.org/curated/en/975721498874530249/pdf/Vietnam-NTPSP-PAD-114017-VN-REVISEDV2-06092017.pdf (accessed on 19 December 2023).
  14. Michaud, J.; Swain, M.B.; Barkataki-Ruscheweyh, M. Historical Dictionary of the Peoples of the Southeast Asian Massif, 2nd ed.; Rowman and Littlefield: Lanham, MD, USA, 2016. [Google Scholar]
  15. Forsyth, T.; Michaud, J. Rethinking the Relationships between Livelihoods and Ethnicity in Highland China, Vietnam, and Laos. In Moving Mountains: Ethnicity and Livelihoods in Highland China, Vietnam, and Laos; Michaud, J., Forsyth, T., Eds.; University of British Columbia Press: Vancouver, BC, Canada, 2011; pp. 1–27. [Google Scholar]
  16. Yen, B.T.; Visser, S.M.; Hoanh, C.T.; Stroosnijder, l. Constraints on Agricultural Production in the Northern Uplands of Vietnam. Mt. Res. Dev. 2013, 33, 404–415. [Google Scholar] [CrossRef]
  17. Sikor, T.; Baggio, J.A. Can Smallholders Engage in Tree Plantations? An Entitlements Analysis from Vietnam. World Dev. 2014, 64, S101–S112. [Google Scholar] [CrossRef]
  18. Cochard, R.; Ngo, D.T.; Waeber, P.O.; Kull, C.A. Extent and causes of forest cover changes in Vietnam’s provinces 1993–2013: A review and analysis of official data. Environ. Rev. 2017, 25, 199–217. [Google Scholar] [CrossRef]
  19. Sandewall, M.; Ohlsoon, B.; Sandewall, R.K.; Le, S.V. The expansion of farm-based plantation forestry in Vietnam. Ambio 2010, 39, 567–579. [Google Scholar] [CrossRef]
  20. Khuc, Q.V.; Le, T.-A.T.; Nguyen, T.H.; Nong, D.; Tran, B.Q.; Meyfroidt, P.; Tran, T.; Duong, P.B.; Nguyen, T.T.; Tran, T.; et al. Forest Cover Change, Households’ Livelihoods, Trade-Offs, and Constraints Associated with Plantation Forests in Poor Upland-Rural Landscapes: Evidence from North Central Vietnam. Forests 2020, 11, 548. [Google Scholar] [CrossRef]
  21. Trædal, L.T.; Angelsen, A. Policies Drive Sub-National Forest Transitions in Vietnam. Forests 2020, 11, 1038. [Google Scholar] [CrossRef]
  22. Khuc, V.Q.; Tran, B.Q.; Nong, D.; Nguyen, T.H.; Nguyen, M.-H.; Le, T.-T.; Lich, H.K.; Meyfroidt, P.; Van Pham, D.; Leisz, S.J.; et al. Driving forces of forest cover rehabilitation and implications for forest transition, environmental management and upland sustainable development in Vietnam. Environ. Dev. Sustain. 2023. [Google Scholar] [CrossRef]
  23. Nguyen, A.T.; Turner, S.; Kalacska, M. Challenging slopes: Ethnic minority livelihoods, state visions, and land-use land cover change in Vietnam’s northern mountainous borderlands. Environ. Dev. Sustain. 2022, 24, 2412–2431. [Google Scholar] [CrossRef]
  24. Trincsi, K.; Pham, T.-T.-H.; Turner, S. Mapping mountain diversity: Ethnic minorities and land use land cover change in Vietnam’s borderlands. Land Use Policy 2014, 41, 484–497. [Google Scholar] [CrossRef]
  25. Turner, S.; Pham, T.-T.-H. “Nothing Is Like It Was Before”: The Dynamics between Land-Use and Land-Cover, and Livelihood Strategies in the Northern Vietnam Borderlands. Land 2015, 4, 1030–1059. [Google Scholar] [CrossRef]
  26. Nguyen, D.T.; Kieu, Q.L. Application of 3s technology in disaster risk research in the northern mountainous region of Vietnam. Geogr. Tech. 2022, 17, 116–128. [Google Scholar] [CrossRef]
  27. Socialist Republic of Vietnam. The 2019 Vietnam Population and Housing Census: Completed Results; Central Population and Housing Census Steering Committee: Hanoi, Vietnam, 2020. [Google Scholar]
  28. Giới Thiệu Bát Xát (Bát Xát Introduction). Available online: https://batxat.laocai.gov.vn/gioi-thieu-bat-xat/dieu-kien-tu-nhien-824142 (accessed on 27 September 2023).
  29. Lào Cai People’s Committee (LCPC). Developing Market Linkages for the Production and Consumption of Key Products of Lào Cai Province, 2021–2025 [Phát Triển Chuỗi Liên Kết Sản Xuất Và Tiêu Thụ Sản Phẩm Chủ Lực Tỉnh Lào Cai, Giai Đoạn 2021–2025]; LCPC: Lào Cai, Vietnam, 2021. [Google Scholar]
  30. Lào Cai People’s Committee (LCPC). The Implementation of the Project for the Development of Agriculture, Forestry, Population, New Rural Construction, Lao Cai Province in 2022 [Thực Hiện Đề Án Phát Triển Nông, Lâm Nghiệp, Sắp Xếp Dân Cư, Xây Dựng Nông Thôn Mới Tỉnh Lào Cai, Năm 2022]; LCPC: Lào Cai, Vietnam, 2022. [Google Scholar]
  31. Slack, P.; Turner, S. Ethnic minority livelihoods contesting state visions of ‘ideal farmers’ in Vietnam’s northern borderlands. J. Political Ecol. 2023, 30, 448–470. [Google Scholar] [CrossRef]
  32. Johansen, K.; Sohlbach, M.; Sullivan, B.; Stringer, S.; Peasley, D.; Phinn, S. Mapping Banana Plants from High Spatial Resolution Orthophotos to Facilitate Plant Health Assessment. Remote Sens. 2014, 6, 8261–8286. [Google Scholar] [CrossRef]
  33. Puyravaud, J.-P. Standardizing the calculation of the annual rate of deforestation. For. Ecol. Manag. 2003, 177, 593–596. [Google Scholar] [CrossRef]
  34. Bonnin, C. Navigating fieldwork politics, practicalities and ethics in the upland borderlands of northern Vietnam. Asia Pac. Viewp. 2010, 51, 179–192. [Google Scholar] [CrossRef] [PubMed]
  35. Kerkvliet, B. Speaking Out in Vietnam: Public Political Criticism in a Communist Party-Ruled Nation; Cornell University Press: Ithaca, NY, USA, 2019. [Google Scholar]
  36. Michaud, J. Comrades of Minority Policy in China, Vietnam, and Laos. In Red Stamps and Gold Stars: Fieldwork Dilemmas in Upland Socialist Asia; Turner, S., Ed.; University of British Columbia Press: Vancouver, BC, Canada, 2013; pp. 22–39. [Google Scholar]
  37. Castella, J.C.; Boisseau, S.; Thanh, N.H.; Novosad, P. Impact of forestland allocation on land use in a mountainous province of Vietnam. Land Use Policy 2006, 23, 147–160. [Google Scholar] [CrossRef]
  38. Hirsch, P.; Scurrah, N. The Political Economy of Land Governance in the Mekong Region; Mekong Region Land Governance: Vientiane, Laos, 2015. [Google Scholar]
  39. McElwee, P. Forests Are Gold: Trees, People and Environmental Rule in Vietnam; University of Washington Press: Seattle, WA, USA, 2016. [Google Scholar]
  40. Huong, T.T.T.; Zeller, M.; Hoanh, C.T. The ‘Five Million Hectare Reforestation Program’ in Vietnam: An Analysis of its Implementation and Transaction Costs a Case Study in Hoa Binh Province. Q. J. Int. Agric. 2014, 53, 341–375. [Google Scholar]
  41. Derks, A.; Turner, S.; Ngo, T.H. Bastard Spice or Champagne of Cinnamon? Conflicting Value Creations along Cinnamon Commodity Chains in Northern Vietnam. Dev. Chang. 2020, 51, 895–920. [Google Scholar] [CrossRef]
  42. Management Board for Forestry Projects. Launching Project on “Sustainable Forest Management and Biodiversity as a Measure to Decrease CO2 Emissions (KfW8) Project in Northwest Vietnam. Available online: https://m.daln.gov.vn/en/ac129a763/launching-project-on-quot-sustainable-forest-management-and-biodiversity-as-a-measure-to-decrease-co2-emissions-quot-kfw8-project-in-northwest-vietnam.html (accessed on 25 March 2019).
  43. Management Board for Forestry Projects. Project of Sustainable Forest Management and Biodiversity to Reduce CO2 Emissions—KfW8. Available online: https://daln.gov.vn/vi/ac191a804/du-an-quan-ly-rung-ben-vung-va-da-dang-sinh-hoc-nham-giam-phat-thai-co2-kfw8.html (accessed on 25 November 2023).
  44. Corlin, C. Hmong and the land question in Vietnam: National policy and local concepts of the environment. In Hmong/Miao in Asia; Tapp, N., Michaud, J., Culas, C., Lee, G.Y., Eds.; Silkworm Books: Chiang Mai, Thailand, 2004; pp. 295–320. [Google Scholar]
  45. Socialist Republic of Vietnam. The 2009 Vietnam Population and Housing Census: Completed Results; Central Population and Housing Census Steering Committee: Hanoi, Vietnam, 2010. [Google Scholar]
  46. Nguyen, M.T.N. The New Countryside and the Pocket of the People: Narratives of Entrepreneurship, Local Development and Social Aspirations in Vietnam; Working Paper 181; Max Planck Institute for Social Anthropology: Halle, Germany, 2017. [Google Scholar]
  47. Nguyen, T.A.; Gillen, J.; Rigg, J. Retaining the Old Countryside, Embracing the New Countryside: Vietnam’s New Rural Development Program. J. Vietnam. Stud. 2021, 16, 77–110. [Google Scholar] [CrossRef]
  48. Havlíček, M.; Skokanová, H.; Dostál, I.; Vymazalová, M.; Pavelková, R.; Petrovič, F. The consequences of establishing military training areas for land use development—A case study of Libavá, Czech Republic. Land Use Policy 2018, 73, 84–94. [Google Scholar] [CrossRef]
  49. Gu, X.S.; Womack, B. Border cooperation between China and Vietnam in the 1990s. Asian Surv. 2000, 40, 1042–1058. [Google Scholar]
  50. Sikor, T.; Pham, T.T.V. The dynamics of commoditization in a Vietnamese uplands village, 1980–2000. J. Agrar. Chang. 2005, 5, 405–428. [Google Scholar] [CrossRef]
  51. Turner, S.; Kettig, T.; Đinh, D.T.; Cự, P.V. State Livelihood Planning and Legibility in Vietnam’s Northern Borderlands: The “Rightful Criticisms” of Local Officials. J. Contemp. Asia 2016, 46, 42–70. [Google Scholar] [CrossRef]
  52. Jadin, I.; Vanacker, V.; Hoang, H.T.T. Drivers of forest cover dynamics I smallholder farming systems: The case of Northwestern Vietnam. Ambio 2013, 42, 344–356. [Google Scholar] [CrossRef]
  53. Kerkvliet, B. An Approach for Analysing State-Society Relations in Vietnam. Sojourn J. Soc. Issues Southeast Asia 2001, 2, 238–278. [Google Scholar] [CrossRef]
  54. Clement, F.; Amezaga, J.M. Linking reforestation policies with land use change in northern Vietnam: Why local factors matter. Geoforum 2008, 39, 265–277. [Google Scholar] [CrossRef]
Figure 1. Map showing the location of the two districts, Phong Thổ and Bát Xát in Lai Châu and Lào Cai Provinces in Northern Vietnam, directly on the Sino-Vietnamese border. Background imagery is from the Planet Labs global cloud-free basemap for the 4th quarter of 2020 (October–December). Inset shows the location of the main map (red box) in Vietnam (beige).
Land 13 00071 g001
Figure 2. (A) Mosaic of wet rice terraces, dry rice and/or maize fields (classified as bare soil), and shrubs in Bát Xát; (B) open-canopy forest (undergrowth is black cardamom) in Bát Xát; (C) small built-up area in Bát Xát (ethnic minority Hani houses); (D) mosaic of dry rice or maize fields (classified as bare soil), built up, and shrub classes in Bát Xát; (E) closed-canopy forest patches surrounded by shrubs in Phong Thổ; (F) mosaic of closed-canopy forest, shrubs, and maize fields or dry rice (classed as bare soil) in Phong Thổ; (G) maize fields (classified as bare soil) and shrubs in Phong Thổ; (H) wet rice terraces in Phong Thổ (classified as bare soil). Photographs by S. Turner.
Land 13 00071 g002
Figure 3. Flowchart illustrating the generation of the LULCC maps and the integration of these maps with data from state official interviews. The main analytical steps of the thematic coding for the interviews are also shown. The final outcomes of the remote sensing analyses are shown in red, and the final outcomes of the analysis of the interviews are shown in blue.
Land 13 00071 g003
Figure 4. Percentage of area covered by each land cover class for the districts of Phong Thổ and Bát Xát at each of the four time periods.
Land 13 00071 g004
Figure 5. Ribbon plots of land cover change over the 1990–2020 period for each of the districts separately and combined. The thickness of the colored lines indicates the proportion of the total area of that class.
Land 13 00071 g005
Figure 6. LULCC for closed- and open-canopy forests from 1990 to 2000 in Phong Thổ and Bát Xát Districts.
Land 13 00071 g006
Figure 7. LULCC for closed- and open-canopy forests from 2000 to 2010 in Phong Thổ and Bát Xát Districts.
Land 13 00071 g007
Figure 8. LULCC for closed- and open-canopy forests from 2010 to 2020 in Phong Thổ and Bát Xát Districts.
Land 13 00071 g008
Table 1. Confusion matrix from the accuracy assessment of the 2020 classification.
Ground Reference Total
Closed CanopyOpen CanopyShrubsBare SoilBuilt-UpWater
ClassificationClosed canopy3922 3 46
Open canopy138222 45
Shrubs114013 46
Bare soil9869354125
Built-up 1 2 37444
Water 2 4244
Total5050501005050
User’s Accuracy (%)78.0076.0080.0093.0074.0084.00
Producer’s Accuracy (%)84.7884.4486.9674.4084.0995.45
Table 2. LULCC in the districts of Phong Thổ and Bát Xát (combined) from 1990 to 2000 (hectares).
YearIn 2000
In 1990LULCClosed CanopyOpen CanopyShrubsBare SoilBuilt-UpTotal
Closed canopy80,630.562836.607564.2611,764.94377.02103,173.38
Open canopy1325.5011,377.94814.766467.18372.0020,357.37
Shrubs2775.21517.643248.617473.45150.2814,165.20
Bare soil5729.063810.865964.9346,778.881479.5463,763.26
Built-up85.50242.2156.64347.97601.611333.93
Total90,545.8318,785.2517,649.1972,832.422980.45202,793.15
Table 3. LULCC in the district of Phong Thổ from 1990 to 2000 (hectares).
YearIn 2000
In 1990LULCClosed CanopyOpen CanopyShrubsBare SoilBuilt-UpTotal
Closed canopy32,856.9637.65120.07308.6272.046,195.1
Open canopy323.82193.3422.92178.452.45170.7
Shrubs1410.6296.32429.65700.2127.49964.1
Bare soil1992.2976.23856.030,174.4801.937,800.6
Built-up50.9147.153.1145.0355.2751.3
Total36,634.34250.411,881.645,506.61608.899,881.8
Table 4. LULCC in Bát Xát District from 1990 to 2000 (hectares).
YearIn 2000
In 1990LULCClosed CanopyOpen CanopyShrubsBare SoilBuilt-UpTotal
Closed canopy47,773.62199.02444.24456.4105.056,978.3
Open canopy1001.79184.7391.84288.8319.615,186.6
Shrubs1364.7221.4819.01773.222.94201.1
Bare soil3736.92834.72109.016,604.5677.625,962.7
Built-up34.695.13.6203.0246.4582.6
Total53,911.514,534.95767.627,325.81371.6102,911.4
Table 5. LULCC in Phong Thổ and Bát Xát Districts (combined) from 2000 to 2010 (hectares).
YearIn 2010
In 2000LULCClosed CanopyOpen CanopyShrubsBare SoilBuilt-UpTotal
Closed canopy76,777.821572.344477.267519.41199.0190,545.83
Open canopy1103.5011,231.45913.565147.31389.4418,785.25
Shrubs3299.95613.366556.257004.60175.0317,649.19
Bare soil4390.373350.099335.2754,519.421237.2772,832.42
Built-up111.96167.42117.07604.951979.072980.45
Total85,683.5916,934.6521,399.4174,795.683979.82202,793.15
Table 6. LULCC in Phong Thổ District from 2000 to 2010 (hectares).
YearIn 2010
In 2000LULCClosed CanopyOpen CanopyShrubsBare SoilBuilt-UpTotal
Closed canopy31,608.5454.01908.62546.6116.536,634.3
Open canopy300.82663.3366.8884.535.04250.4
Shrubs1902.8296.15224.54327.8130.411,881.6
Bare soil2386.71263.06765.434,745.2346.345,506.6
Built-up91.028.8100.6304.31084.11608.8
Total36,289.84705.214,365.942,808.51712.499,881.8
Table 7. LULCC in Bát Xát District from 2000 to 2010 (hectares).
YearIn 2010
In 2000LULCClosed CanopyOpen CanopyShrubsBare SoilBuilt-UpTotal
Closed canopy45,169.31118.32568.64972.882.553,911.5
Open canopy802.78568.1546.84262.8354.414,534.9
Shrubs1397.2317.31331.82676.844.65767.6
Bare soil2003.72087.12569.819,774.2891.027,325.8
Built-up21.0138.616.5300.6894.91371.6
Total49,393.812,229.47033.531,987.22267.4102,911.4
Table 8. LULCC in the districts of Phong Thổ and Bát Xát (combined) from 2010 to 2020 (hectares).
YearIn 2020
In 2010LULCClosed CanopyOpen CanopyShrubsBare SoilBuilt-UpTotal
Closed canopy77,664.38814.912711.354357.94135.0185,683.59
Open canopy790.959788.411488.194632.91234.1816,934.65
Shrubs2345.82641.627885.1010,389.54137.3321,399.41
Bare soil3162.663261.986302.1461,133.05935.8574,795.68
Built-up76.74156.3145.49671.023030.253979.82
Total84,040.5614,663.2218,432.2781,184.464472.64202,793.15
Table 9. LULCC in Phong Thổ District from 2010 to 2020 (hectares).
YearIn 2020
In 2010LULCClosed CanopyOpen CanopyShrubsBare SoilBuilt-UpTotal
Closed canopy32,660.3361.11224.91951.292.236,289.8
Open canopy315.12380.8648.01332.329.04705.2
Shrubs1491.4440.65461.76863.0109.114,365.9
Bare soil1646.71498.63821.335,515.2326.842,808.5
Built-up54.029.533.4348.11247.41712.4
Total36,167.64710.611,189.346,009.81804.599,881.8
Table 10. LULCC in Bát Xát District from 2010 to 2020 (hectares).
YearIn 2020
In 2010LULCClosed CanopyOpen CanopyShrubsBare SoilBuilt-UpTotal
Closed canopy45,004.1453.81486.42406.742.849,393.8
Open canopy475.87407.6840.23300.6205.212,229.4
Shrubs854.4201.02423.43526.528.27033.5
Bare soil1516.01763.42480.925,617.8609.131,987.2
Built-up22.7126.812.1323.01782.92267.4
Total47,873.09952.67243.035,174.72668.2102,911.4
Disclaimer/Publisher’s Note: The statements, opinions and data contained in all publications are solely those of the individual author(s) and contributor(s) and not of MDPI and/or the editor(s). MDPI and/or the editor(s) disclaim responsibility for any injury to people or property resulting from any ideas, methods, instructions or products referred to in the content.

