


Research on the Spatial Disparities and Convergence of Guangdong’s Urban Economy Based on Industrial Agglomeration and Industrial Proximity

Abstract
:1. Introduction
2. Theoretical Mechanism and Research Hypothesis
2.1. Industrial Agglomeration and Regional Economic Convergence
2.2. The Convergence of Industrial Structure and Regional Economic Convergence
3. Overview of the Study Area and Materials
4. Methods
4.1. Regional Difference Analysis
4.2. Industry Analysis
4.2.1. Industry Agglomeration
4.2.2. Industrial Proximity
4.3. Spatial Autocorrelation
4.4. Economic Convergence Model
4.4.1. σ-Convergence
4.4.2. β-Convergence
- β-convergence and conditional β-convergence
- 2.
- Conditional space β-convergence
- 3.
- Spatial weight matrix
- 4.
- Convergence rate and half-life year
5. Results
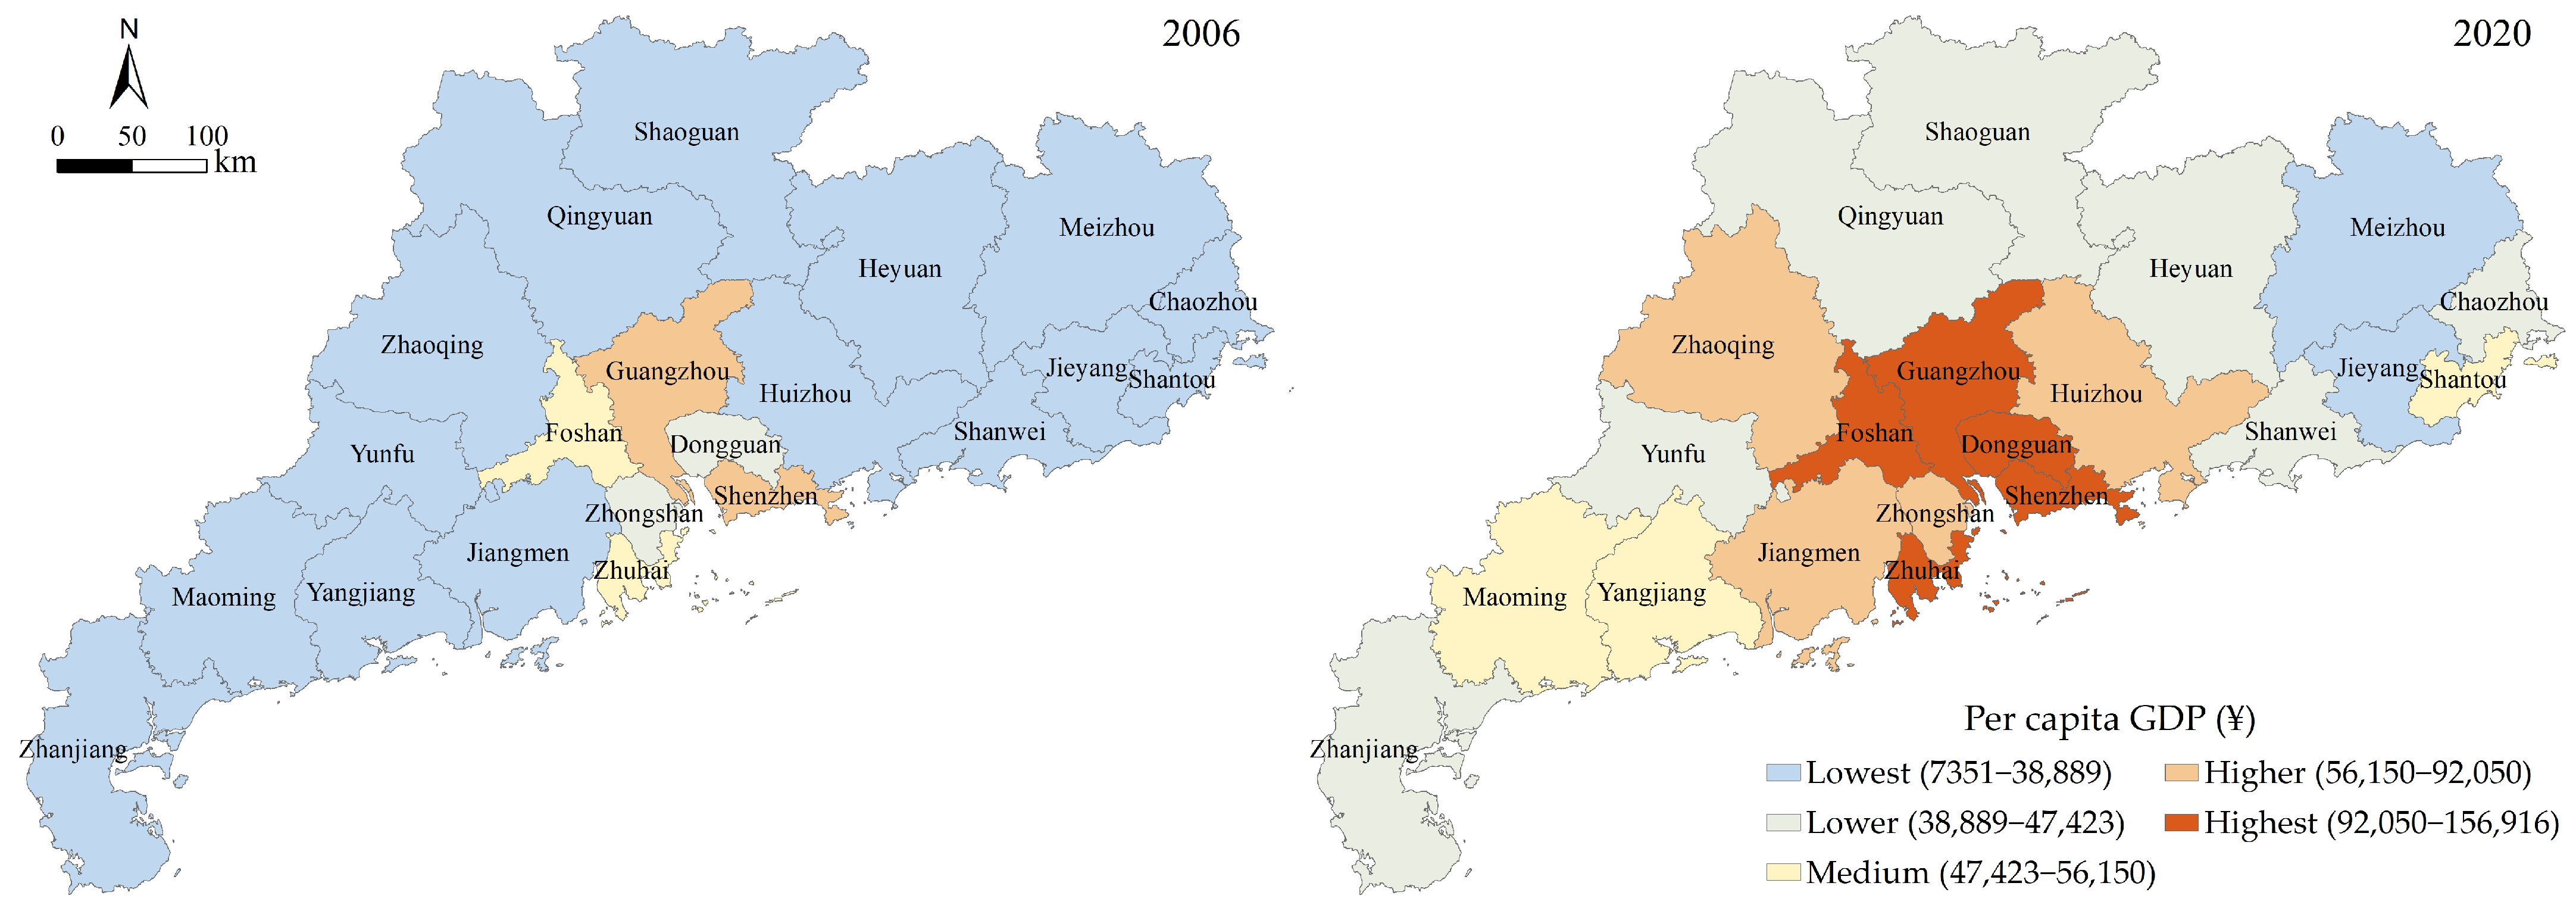
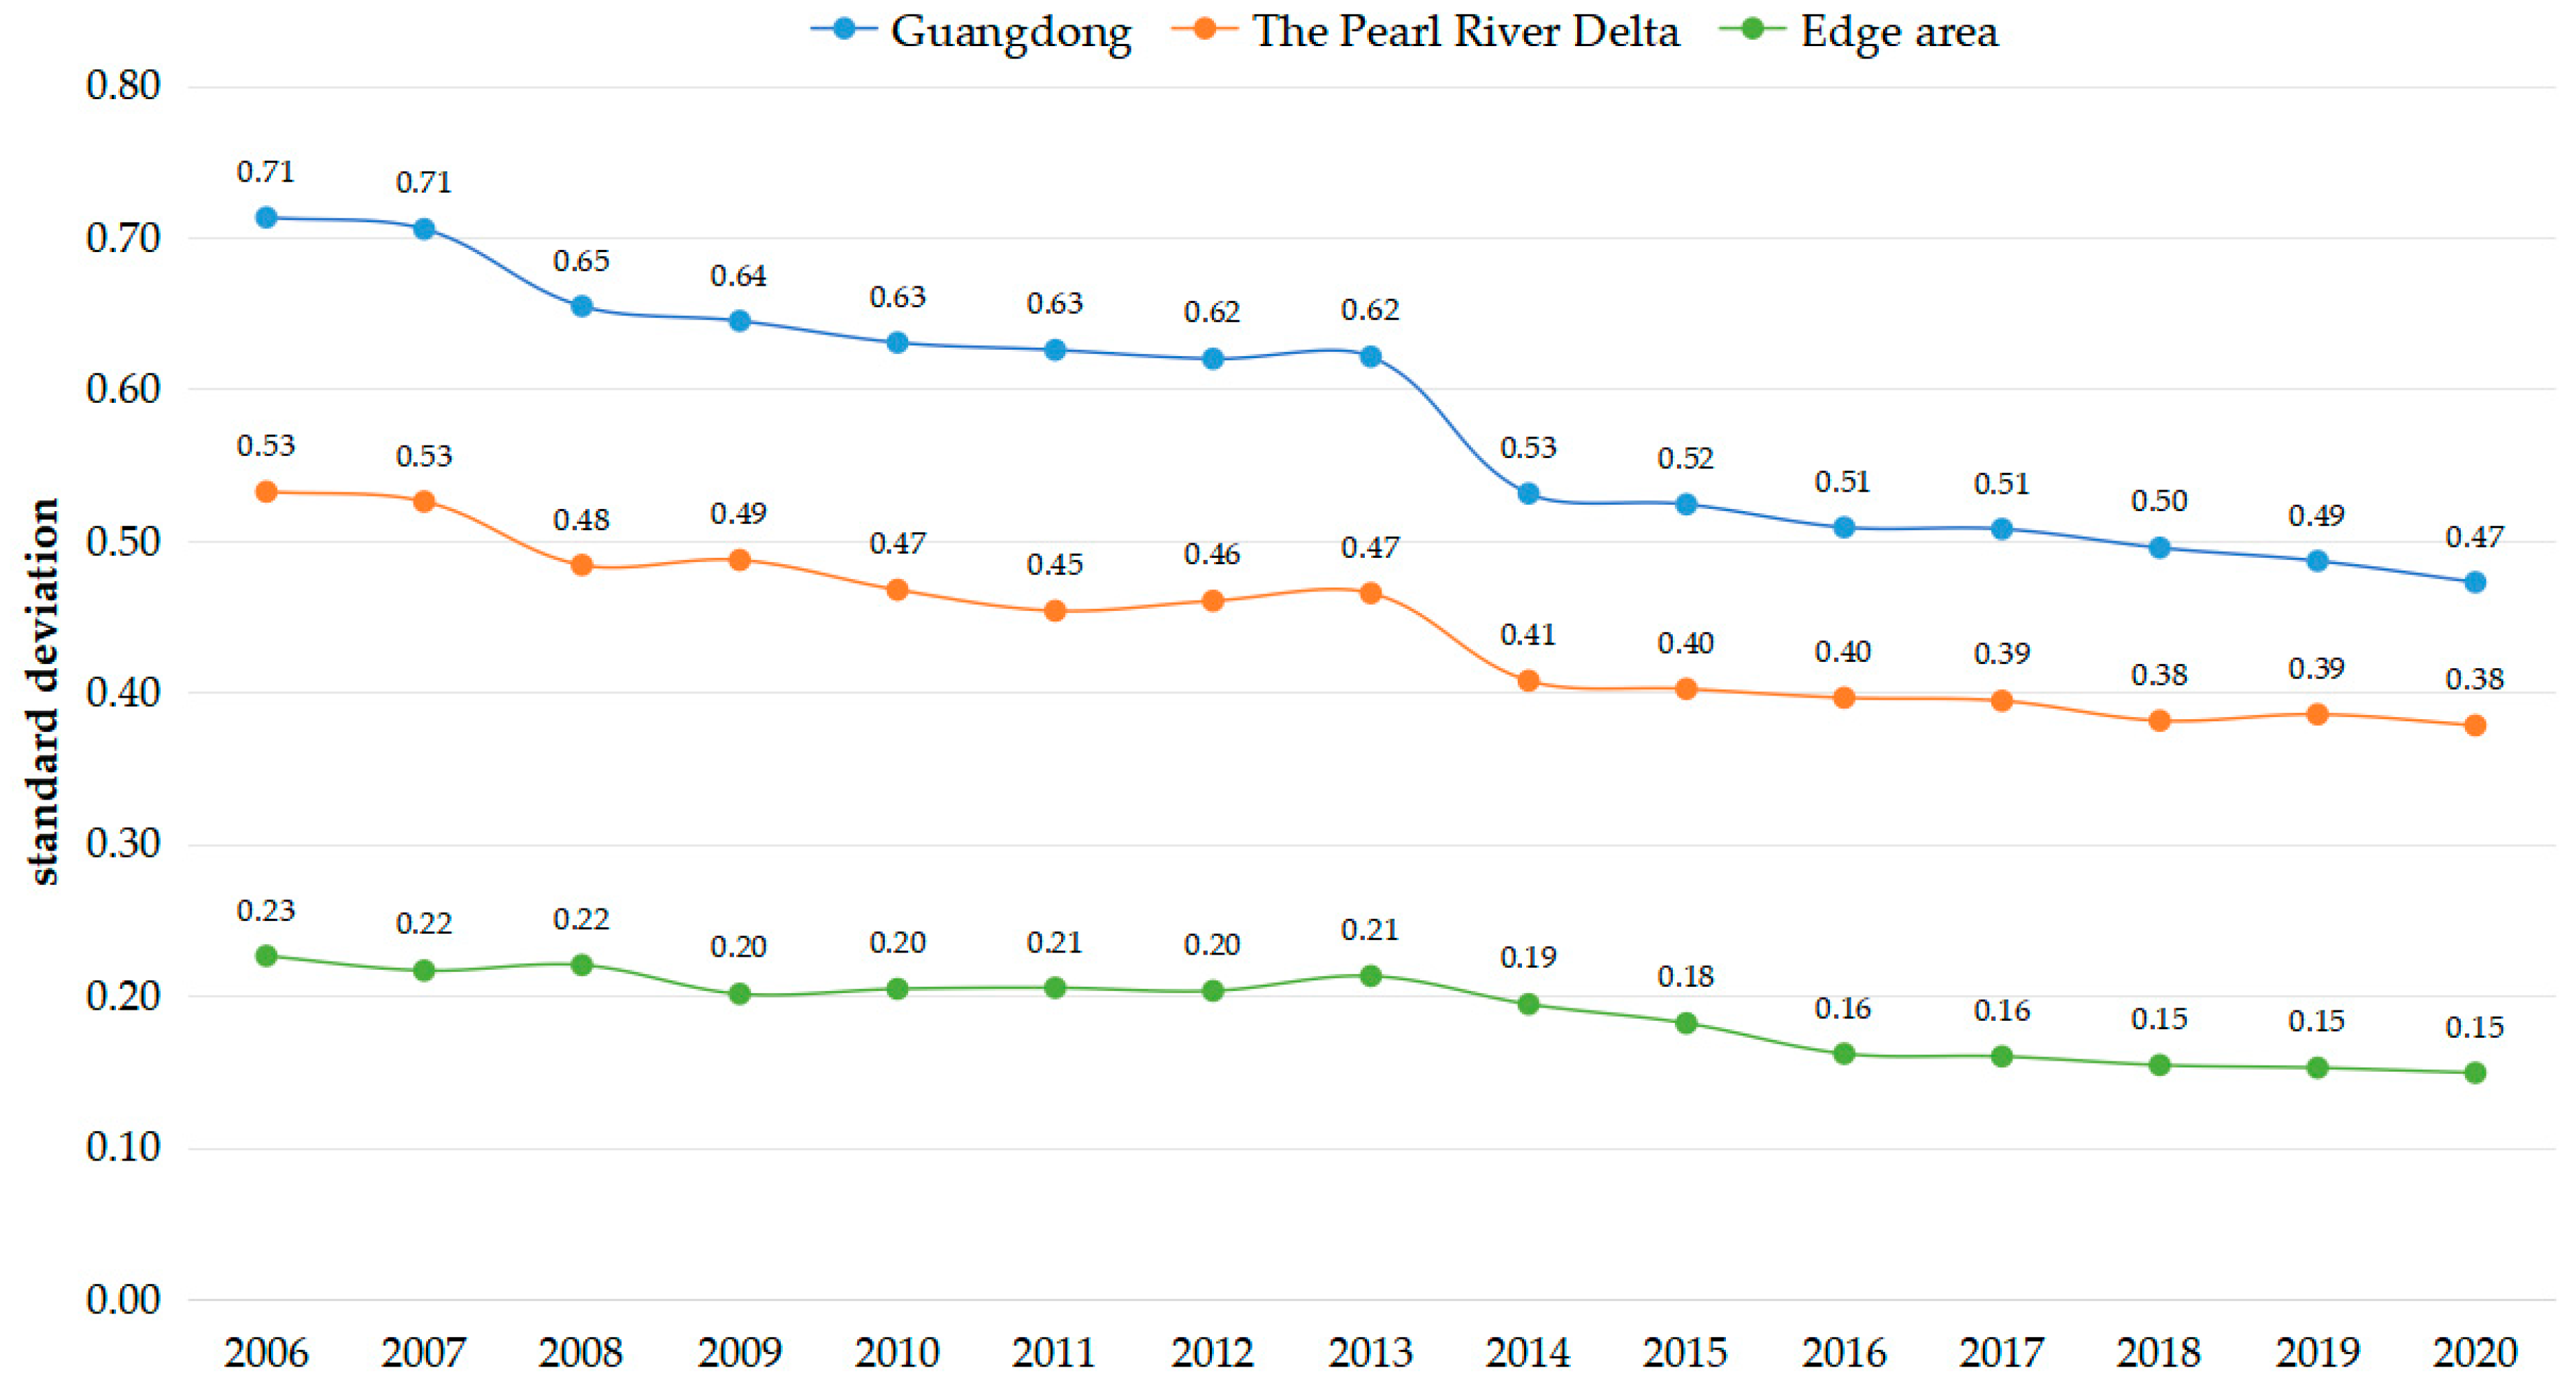
5.1. Analysis of the Spatial Distribution Characteristics and Regional Disparities of Urban Economy
5.2. Analysis of Urban Economic Spatial Convergence in Guangdong
Preliminary Study on Economic Convergence
- The selection of a spatial econometric model
- 2.
- Robustness testing
- 3.
- Space β-Convergence analysis
6. Discussion
6.1. Understanding Regional Economic Disparities and Convergence
6.2. The Spatial Spillover Effect and Economic Convergence
6.3. The Impact of Industry on Economic Convergence
7. Conclusions
Author Contributions
Funding
Data Availability Statement
Conflicts of Interest
References
- Lee, B.S.; Peng, J.; Li, G.; He, J. Regional Economic Disparity, Financial Disparity, and National Economic Growth: Evidence from China. Rev. Dev. Econ. 2012, 16, 342–358. [Google Scholar] [CrossRef]
- Wang, S.J.; Wang, Y.; Zhao, Y.B. Spatial spillover effects and multi-mechanism for regional development in Guangdong province since 1990s. Acta Geogr. Sin. 2015, 70, 965–979. [Google Scholar]
- Fu, Q.; Li, S.W. Review of Research on Economic Convergence Theory Based on Economic Growth Theory. Inq. Into Econ. Issues 2016, 11, 161–172. [Google Scholar]
- Xuebing, D.; Ruonan, C. Characteristics of the Temporal and Spatial Pattern of the Economic Disparity and Convergence Between Different Regions in China. Econ. Geogr. 2020, 40, 11–21. [Google Scholar]
- Zeng, P.; Pang, Y. Regional Differences and Convergence Analysis of Economic Development in Chinese Urban Agglomerations. Stat. Decis. 2023, 39, 132–136. [Google Scholar]
- Lu, M.; Li, P. Coordinated development between urban and rural areas and regions. Econ. Res. J. 2022, 57, 16–25. [Google Scholar]
- Pengfei, L.; Ming, L. Urban Systems: Understanding and Predicting the Spatial Distribution of China’s Population. China World Econ. 2021, 29, 35–62. [Google Scholar]
- Gege, C.; Teng, L.; Weiqi, L. Producer Services Agglomeration, Spatial Spillover and Urbanization: From the Perspective of New Economic Geography. Front. Sci. Technol. Eng. Manag. 2022, 41, 76–82. [Google Scholar]
- Bindong, S. Highlighting the Scientific Concept in the Future Spatial Planning. Frontiers 2020, 4, 81–88. [Google Scholar]
- Helsley, R.W.; Strange, W.C. Coagglomeration, clusters, and the scale and composition of cities. J. Political Econ. 2014, 122, 1064–1093. [Google Scholar] [CrossRef]
- Feng, Q.; Guoping, Z.; Heng, Z. Research on Problem of Industrial Structure in the Yantse River Delta. China Ind. Econ. 2005, 4, 77–85. [Google Scholar]
- Hong, D. Spatial Spillover Effects of Industrial Isomorphism on Regional Economic Growth—Taking the Beijing-Tianjin-Hebei Region as Example. J. Cap. Univ. Econ. Bus. 2021, 23, 44–54. [Google Scholar]
- Liu, X.; Wang, N.; Ji, X. Siphon Effect of Central Cities and Coordinated Development of Regions. China Soft Sci. 2022, 4, 76–86. [Google Scholar]
- Dachun, F.; Mengdi, P. Research on the Characteristics of Network Structure of Isomorphism in China’s High-tech Industry. Contemp. Econ. Manag. 2020, 42, 59–65. [Google Scholar]
- Fuzhuo, F. An Improved Method of Measuring Industrial Structure Similarity Degree between Areas. J. Quant. Technol. Econ. 2013, 7, 98–115. [Google Scholar]
- Chen, L.; Liu, X. A Study on the Converging Evolution of Industrial Structure among Cities in the Yangtze River Delta Region and Its Influencing Factors. J. Soochow Univ. (Philos. Soc. Sci. Ed.) 2023, 44, 55–66. [Google Scholar]
- Krugman, P. The role of geography in development. Int. Reg. Sci. Rev. 1999, 22, 142–161. [Google Scholar] [CrossRef]
- Sergio, J.R.; Montouri, B.D. US Regional Income Convergence: A Spatial Econometric Perspective. Reg. Stud. 1999, 33, 143–156. [Google Scholar]
- Abreu, M.; de Groot, H.L.F.; Florax, R.J.G.M. Space and Growth: A Survey of Empirical Evidence and Methods. SSRN Electron. J. 2004, 21, 13–44. [Google Scholar] [CrossRef]
- Pfaffermayr, M. Conditional β- and σ-convergence in space: A maximum likelihood approach. Reg. Sci. Urban Econ. 2009, 39, 63–78. [Google Scholar] [CrossRef]
- Yin, Y.; Yaoqi, T. From Industrial Convergence to Industrial Clusters: A New Structural Economics Analysis of the Manufacturing Industry in the Yangtze River Delta. J. Hohai Univ. (Philos. Soc. Sci.) 2022, 2, 45–52. [Google Scholar]
- Wu, Y.; Zhu, X. Industrial policy and economic geography: Evidence from China. J. Asia Pac. Econ. 2016, 22, 173–190. [Google Scholar] [CrossRef]
- Zhang, H.; Sun, T. Network Externalities of Urban Economic Growth in Chinese Urban Agglomerations and the Mechanism. Res. Econ. Manag. 2022, 43, 48–64. [Google Scholar]
- Yu, D.; Zhang, K. Factor Market Segmentation, Convergence of Industrial Structure and Advanced Development of Manufacturing Industry. Res. Econ. Manag. 2020, 41, 36–47. [Google Scholar]
- Peilin, D.; Bingxin, Z. The Convergence Evolution and Spatial Pattern of Regional Industrial Structure from the Perspective of K-cores. Inq. Into Econ. Issues 2014, 11, 87–93. [Google Scholar]
- Wenjie, Z.; Bao, S. Created unequal: China’s regional pay inequality and its relationship with mega-trend urbanization. Appl. Geogr. 2015, 61, 81–93. [Google Scholar]
- Theil, H.; Scholes, M. Forecast evaluation based on a multiplicative decomposition of mean square errors. Econom. Soc. 1967, 35, 70–88. [Google Scholar] [CrossRef]
- Hengmei, G.; Xiaodong, M. Evolution of Economic Spatial Pattern and Centrality Measure of Huaihai Economic Zone Based on Night-Time Light Data. Geogr. Geo-Inf. Sci. 2020, 36, 34–40. [Google Scholar]
- UNIDO. World Industry Since 1960: Progress and Prospects; United Nations: New York, NY, USA, 1979. [Google Scholar]
- Friedman, M. Do Old Fallacies Ever Die? J. Econ. Lit. 1992, 4, 229–2132. [Google Scholar]
- Xie, H.; Wang, W. Spatiotemporal differences and convergence of urban industrial land use efficiency for China’s major economic zones. J. Geogr. Sci. 2015, 25, 1183–1198. [Google Scholar] [CrossRef]
- Ramsey, F.P. A Mathematical theory of Saving. Econ. J. 1928, 38, 543–559. [Google Scholar] [CrossRef]
- William, J.B. Productivity Growth, Convergence, and Welfare What the Long-Run Data Show. Am. Econ. Rev. 1986, 5, 1072–1085. [Google Scholar]
- Melvyn, W.; Yao, J.Y. Provincial Conditional Income Convergence in China, 1953–1997: A Panel Data Approach. Econom. Rev. 2007, 22, 59–77. [Google Scholar]
- Houkai, W. Effects of Foreign Direct Investment on Regional Economic Growth in China. Econ. Res. J. 2002, 4, 19–26. [Google Scholar]
- Katircioglu, S.; Fethi, S.; Caner, H. Testing the Higher Educationled Growth Hypothesis in a Small Island: An Empirical Investigation from a New Version of the Solow Growth Model. Qual. Quant. 2014, 2, 729–744. [Google Scholar] [CrossRef]
- Yang, W.; Fidrmuc, J.; Ghosh, S. Macroeconomic effects of fiscal adjustment: A tale of two approaches. Int. Money Financ. 2015, 57, 31–60. [Google Scholar] [CrossRef]
- Bai, J.; Wang, Y.; Jiang, F.; Li, J. R&D Element Flow, Spatial Knowledge Spillovers and Economic Growth. Econ. Res. J. 2017, 52, 109–123. [Google Scholar]
- López-Bazo, E.; Vayá, E.; Mora, A.J.; Suriñach, J. Regional economic dynamics and convergence in the European Union. Ann. Reg. Sci. 1999, 33, 343–370. [Google Scholar] [CrossRef]
- Andrés, R.P.; Fratesi, U. Between development and social policies: The impact of European structural funds in objective regions. Reg. Stud. 2004, 38, 97–113. [Google Scholar]
- Dawson, J.W.; Strazicich, M.C. Time-series tests of income convergence with two structural breaks: Evidence from 29 countries. Appl. Econ. Lett. 2010, 17, 909–912. [Google Scholar] [CrossRef]
- Barro, R.J.; Sala-i-Martin, X.; Blanchard, O.J.; Hall, R.E. Convergence across States and Regions. In Brookings Papers on Economic Activity; Brookings Institution: Washington, DC, USA, 1991; pp. 107–182. [Google Scholar]
- Wenqing, P. Regional Economic Differences and Convergence in China. Soc. Sci. China 2010, 1, 72–84+222–223. [Google Scholar]
- Hangjun, H.; Jingxiang, Z. Innovation-Driven Reverse Enclaves: The Cross-Gradient Innovation Development. Plan. Stud. 2022, 46, 30–39. [Google Scholar]
- Xuan, W.; Kuai, Y. The Governance Logic of Enclave Economy in Terms of the Spatial Production: A Case Study of Shenzhen-Shanwei Special Cooperation Zone. Chin. Public Adm. 2021, 2, 76–83. [Google Scholar]
- Li, M.; Huang, Z. “Enclave Economy” for Promoting Regional Coordinated Development: Development Mode and Future Trend. Tianjin Soc. Sci. 2020, 4, 97–102. [Google Scholar]
- Benjamin, D.; Brandt, L.; Giles, J. Did Higher Inequality Impede Growth in Rural China? Econ. J. 2011, 121, 1281–1309. [Google Scholar] [CrossRef]
- Guoxin, L.; Junkuang, W.; Yao, C. Innovation incentives and R&D spillover. Chin. J. Manag. Sci. 1999, 7, 68–75. [Google Scholar]


| Type | Name | Unit | Description |
|---|---|---|---|
| Dependent variable () | Per-capital GDP | CNY | GDP/year-end permanent population |
| Core variables () | Industry agglomeration (R) | -- | Calculated according to Formula (3) |
| Industrial proximity (IP) | -- | Calculated according to Formula (4) | |
| Control variables () | Investment (Inves) | CNY/person | Fixed asset investment/year-end permanent population |
| Foreign direct investment (FDI) | % | Actual use of foreign direct investment/GDP | |
| Research and development (R&D) | CNY/person | R&D spending/year-end permanent population | |
| Government fiscal expenditure (fiscal) | CNY/person | Local general public budget expenditure/year-end permanent population |
| Year | Theil | Interval Difference (Tb) | Intra-Regional Difference (Tw) |
|---|---|---|---|
| 2006 | 0.262 | 0.186 | 0.075 |
| 2007 | 0.257 | 0.184 | 0.073 |
| 2008 | 0.222 | 0.158 | 0.064 |
| 2009 | 0.220 | 0.155 | 0.065 |
| 2010 | 0.210 | 0.148 | 0.062 |
| 2011 | 0.207 | 0.147 | 0.060 |
| 2012 | 0.205 | 0.143 | 0.062 |
| 2013 | 0.207 | 0.143 | 0.065 |
| 2014 | 0.155 | 0.103 | 0.052 |
| 2015 | 0.151 | 0.102 | 0.050 |
| 2016 | 0.145 | 0.097 | 0.047 |
| 2017 | 0.145 | 0.097 | 0.048 |
| 2018 | 0.138 | 0.093 | 0.045 |
| 2019 | 0.133 | 0.089 | 0.045 |
| 2020 | 0.126 | 0.083 | 0.042 |
| Year | W1 | W2 | Year | W1 | W2 |
|---|---|---|---|---|---|
| 2006 | 0.573 *** | 0.619 *** | 2014 | 0.499 *** | 0.554 *** |
| (4.6173) | (4.0579) | (4.0773) | (3.7112) | ||
| 2007 | 0.583 *** | 0.630 *** | 2015 | 0.497 *** | 0.557 *** |
| (4.6808) | (4.1120) | (4.0594) | (3.7239) | ||
| 2008 | 0.586 *** | 0.631 *** | 2016 | 0.487 *** | 0.549 *** |
| (4.6966) | (4.1173) | (4.0109) | (3.6924) | ||
| 2009 | 0.558 *** | 0.607 *** | 2017 | 0.478 *** | 0.540 *** |
| (4.4956) | (3.9913) | (3.9405) | (3.6400) | ||
| 2010 | 0.554 *** | 0.603 *** | 2018 | 0.484 *** | 0.545 *** |
| (4.4655) | (3.9841) | (3.9810) | (3.6684) | ||
| 2011 | 0.556 *** | 0.606 *** | 2019 | 0.473 *** | 0.539 *** |
| (4.4924) | (4.0138) | (3.9076) | (3.6224) | ||
| 2012 | 0.543 *** | 0.591 *** | 2020 | 0.476 *** | 0.542 *** |
| (4.3829) | (3.9216) | (3.9354) | (3.6397) | ||
| 2013 | 0.532 *** | 0.583 *** | |||
| (4.3028) | (3.8647) |
| Parameter | W1 | W2 | |
|---|---|---|---|
| LM test | Moran’s I | 3.258 *** | 1.617 * |
| LM-error | 264.549 *** | 354.191 *** | |
| Robust LM | 63.724 *** | 58.646 *** | |
| LM-lag | 212.054 *** | 334.217 *** | |
| Rubust LM | 11.230 *** | 38.672 *** | |
| Hausman test | Hausman test | 17.19 *** | 8.54 *** |
| Wald test | Wald spatial lag | 11.25 * | 30.87 *** |
| Wald spatial error | 16.70 *** | 16.96 *** |
| W1 | W2 | PRD a | Edge Area a | |
|---|---|---|---|---|
| −0.1334 *** | −0.0955 *** | −0.0918 *** | −0.1890 *** | |
| (−4.81) | (−4.49) | (−2.98) | (−4.27) | |
| 0.1062 *** | 0.0620 *** | 0.0586 ** | 0.1582 *** | |
| (3.59) | (2.78) | (1.87) | (3.50) | |
| 0.6766 *** | 0.6688 *** | 0.7369 *** | 0.6437 *** | |
| (17.33) | (11.13) | (14.40) | (9.70) | |
| Log-likelihood | 572.3487 | 529.1923 | 240.0055 | 331.1577 |
| Convergence speed () | 0.41% | 0.29% | 0.22% | 0.73% |
| Half-life () | 167.21 | 238.51 | 314.49 | 95.57 |
| 0.2582 | 0.3033 | 0.2450 | 0.3017 | |
| 294 | 294 | 123 | 168 |
| W1 | W2 | PRD a | Edge Area a | |
|---|---|---|---|---|
| −0.2817 *** | −0.4098 *** | −0.3412 *** | −0.4177 *** | |
| (−12.33) | (−12.29) | (−6.48) | (−8.23) | |
| 0.0157 | 0.0230 ** | 0.0366 | 0.0121 | |
| (1.27) | (2.03) | (0.95) | (0.90) | |
| −0.0235 | −0.0386 * | −0.2125 *** | −0.0178 | |
| (−1.13) | (−1.85) | (−3.54) | (−0.89) | |
| 0.0535 *** | 0.0231 *** | 0.0935 ** | 0.0562 *** | |
| (5.66) | (5.96) | (3.50) | (5.95) | |
| 0.0064 ** | 0.0129 *** | 0.0060 | 0.0093 ** | |
| (3.50) | (3.92) | (1.41) | (2.15) | |
| −0.0057 | −0.0090 ** | −0.0080 | −0.0097 ** | |
| (−1.52) | (−2.14) | (−1.08) | (−2.33) | |
| 0.087 *** | 0.1630 *** | 0.1016 *** | 0.0996 *** | |
| (4.08) | (7.55) | (3.53) | (3.12) | |
| 0.0741 | 0.0110 | 0.0016 | 0.1240 | |
| (1.54) | (−0.11) | (0.02) | (1.24) | |
| −0.0016 | −0.0213 | −0.1649 | −0.0052 | |
| (−0.09) | (−0.56) | (−1.03) | (−0.21) | |
| −0.0354 *** | −0.2124 *** | 0.0306 | −0.1514 ** | |
| (−0.83) | (−2.85) | (0.31) | (−2.30) | |
| −0.0376 ** | 0.0266 | 0.0577 | 0.0289 | |
| (−2.24) | (0.48) | (0.72) | (0.75) | |
| 0.0105 ** | 0.0487 *** | −0.0054 | 0.0260 *** | |
| (2.11) | (3.07) | (−0.39) | (2.60) | |
| 0.0006 | 0.0175 | 0.0242 | 0.0210 | |
| (0.09) | (1.16) | (1.55) | (1.62) | |
| −0.0129 | −0.0307 | −0.0091 | −0.0100 | |
| (−0.42) | (−0.50) | (−0.16) | (−0.14) | |
| 0.5946 *** | 0.3658 *** | 0.5891 *** | 0.4381 *** | |
| (12.44) | (3.18) | (7.34) | (4.32) | |
| 610.2081 | 593.1951 | 268.9268 | 362.7365 | |
| 0.96% | 1.53% | 1.21% | 1.57% | |
| 72.36 | 45.40 | 57.37 | 44.27 | |
| 0.2464 | 0.3036 | 0.6406 | 0.2872 | |
| 294 | 294 | 126 | 168 |
Disclaimer/Publisher’s Note: The statements, opinions and data contained in all publications are solely those of the individual author(s) and contributor(s) and not of MDPI and/or the editor(s). MDPI and/or the editor(s) disclaim responsibility for any injury to people or property resulting from any ideas, methods, instructions or products referred to in the content. |
© 2024 by the authors. Licensee MDPI, Basel, Switzerland. This article is an open access article distributed under the terms and conditions of the Creative Commons Attribution (CC BY) license (https://creativecommons.org/licenses/by/4.0/).
Share and Cite
Huang, X.; Guo, R.; Wang, W.; Li, X.; Fan, Y. Research on the Spatial Disparities and Convergence of Guangdong’s Urban Economy Based on Industrial Agglomeration and Industrial Proximity. Land 2024, 13, 73. https://doi.org/10.3390/land13010073
Huang X, Guo R, Wang W, Li X, Fan Y. Research on the Spatial Disparities and Convergence of Guangdong’s Urban Economy Based on Industrial Agglomeration and Industrial Proximity. Land. 2024; 13(1):73. https://doi.org/10.3390/land13010073
Chicago/Turabian StyleHuang, Xiaojin, Renzhong Guo, Weixi Wang, Xiaoming Li, and Yong Fan. 2024. "Research on the Spatial Disparities and Convergence of Guangdong’s Urban Economy Based on Industrial Agglomeration and Industrial Proximity" Land 13, no. 1: 73. https://doi.org/10.3390/land13010073
APA StyleHuang, X., Guo, R., Wang, W., Li, X., & Fan, Y. (2024). Research on the Spatial Disparities and Convergence of Guangdong’s Urban Economy Based on Industrial Agglomeration and Industrial Proximity. Land, 13(1), 73. https://doi.org/10.3390/land13010073