

Research on the Correlation between the Dynamic Distribution Patterns of Urban Population Density and Land Use Morphology Based on Human–Land Big Data: A Case Study of the Shanghai Central Urban Area


Abstract
1. Introduction
2. Data and Methodology
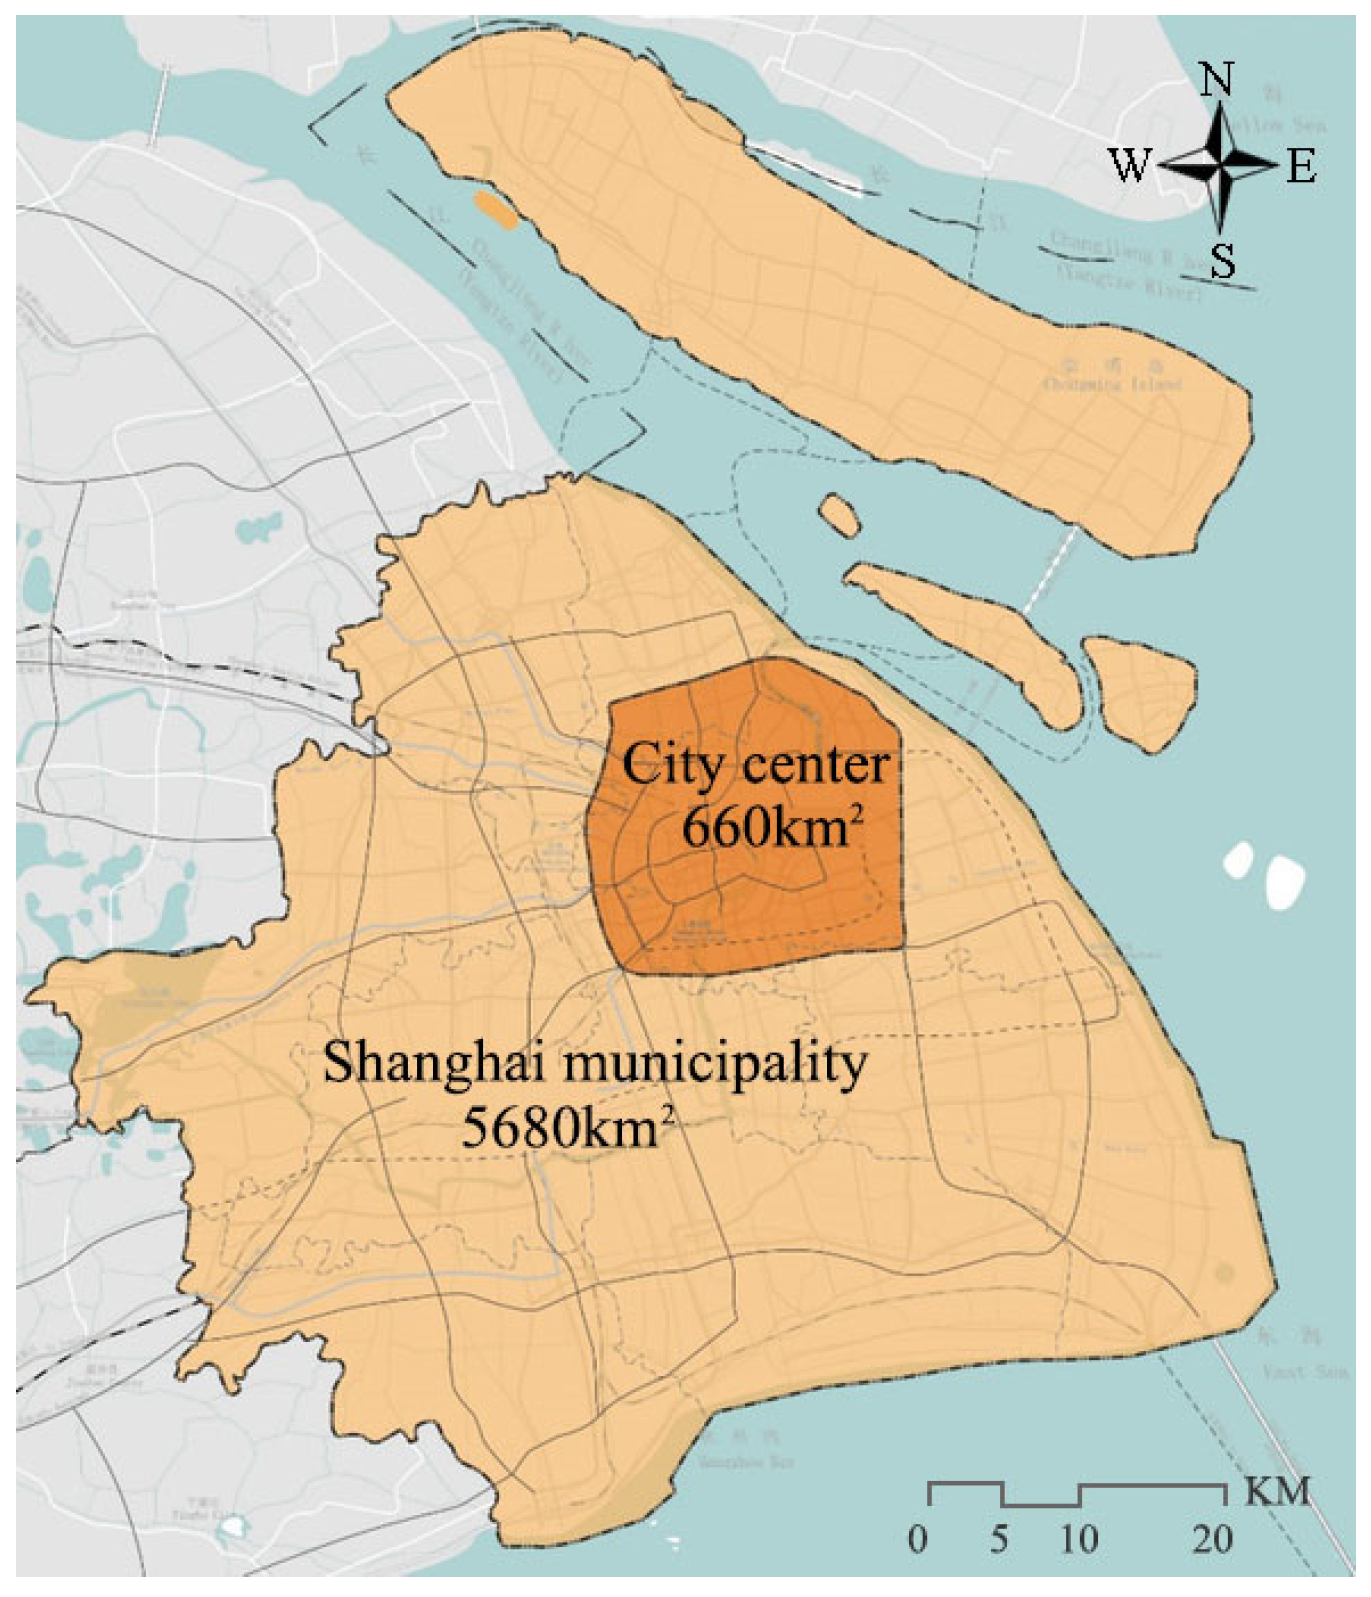
2.1. Study Site
2.2. Data
- Mobile signaling data
- 2.
- Land use data
2.3. Methodology
2.3.1. Measurement of the Dynamic Distribution of Population Density
2.3.2. Clustering of Dynamic Population Density Distribution Patterns
2.3.3. Measurement Methods for Land Use Factors
2.3.4. Methodology for the Correlation between Dynamic Distribution of Population Density and Land Use Factors
3. Results
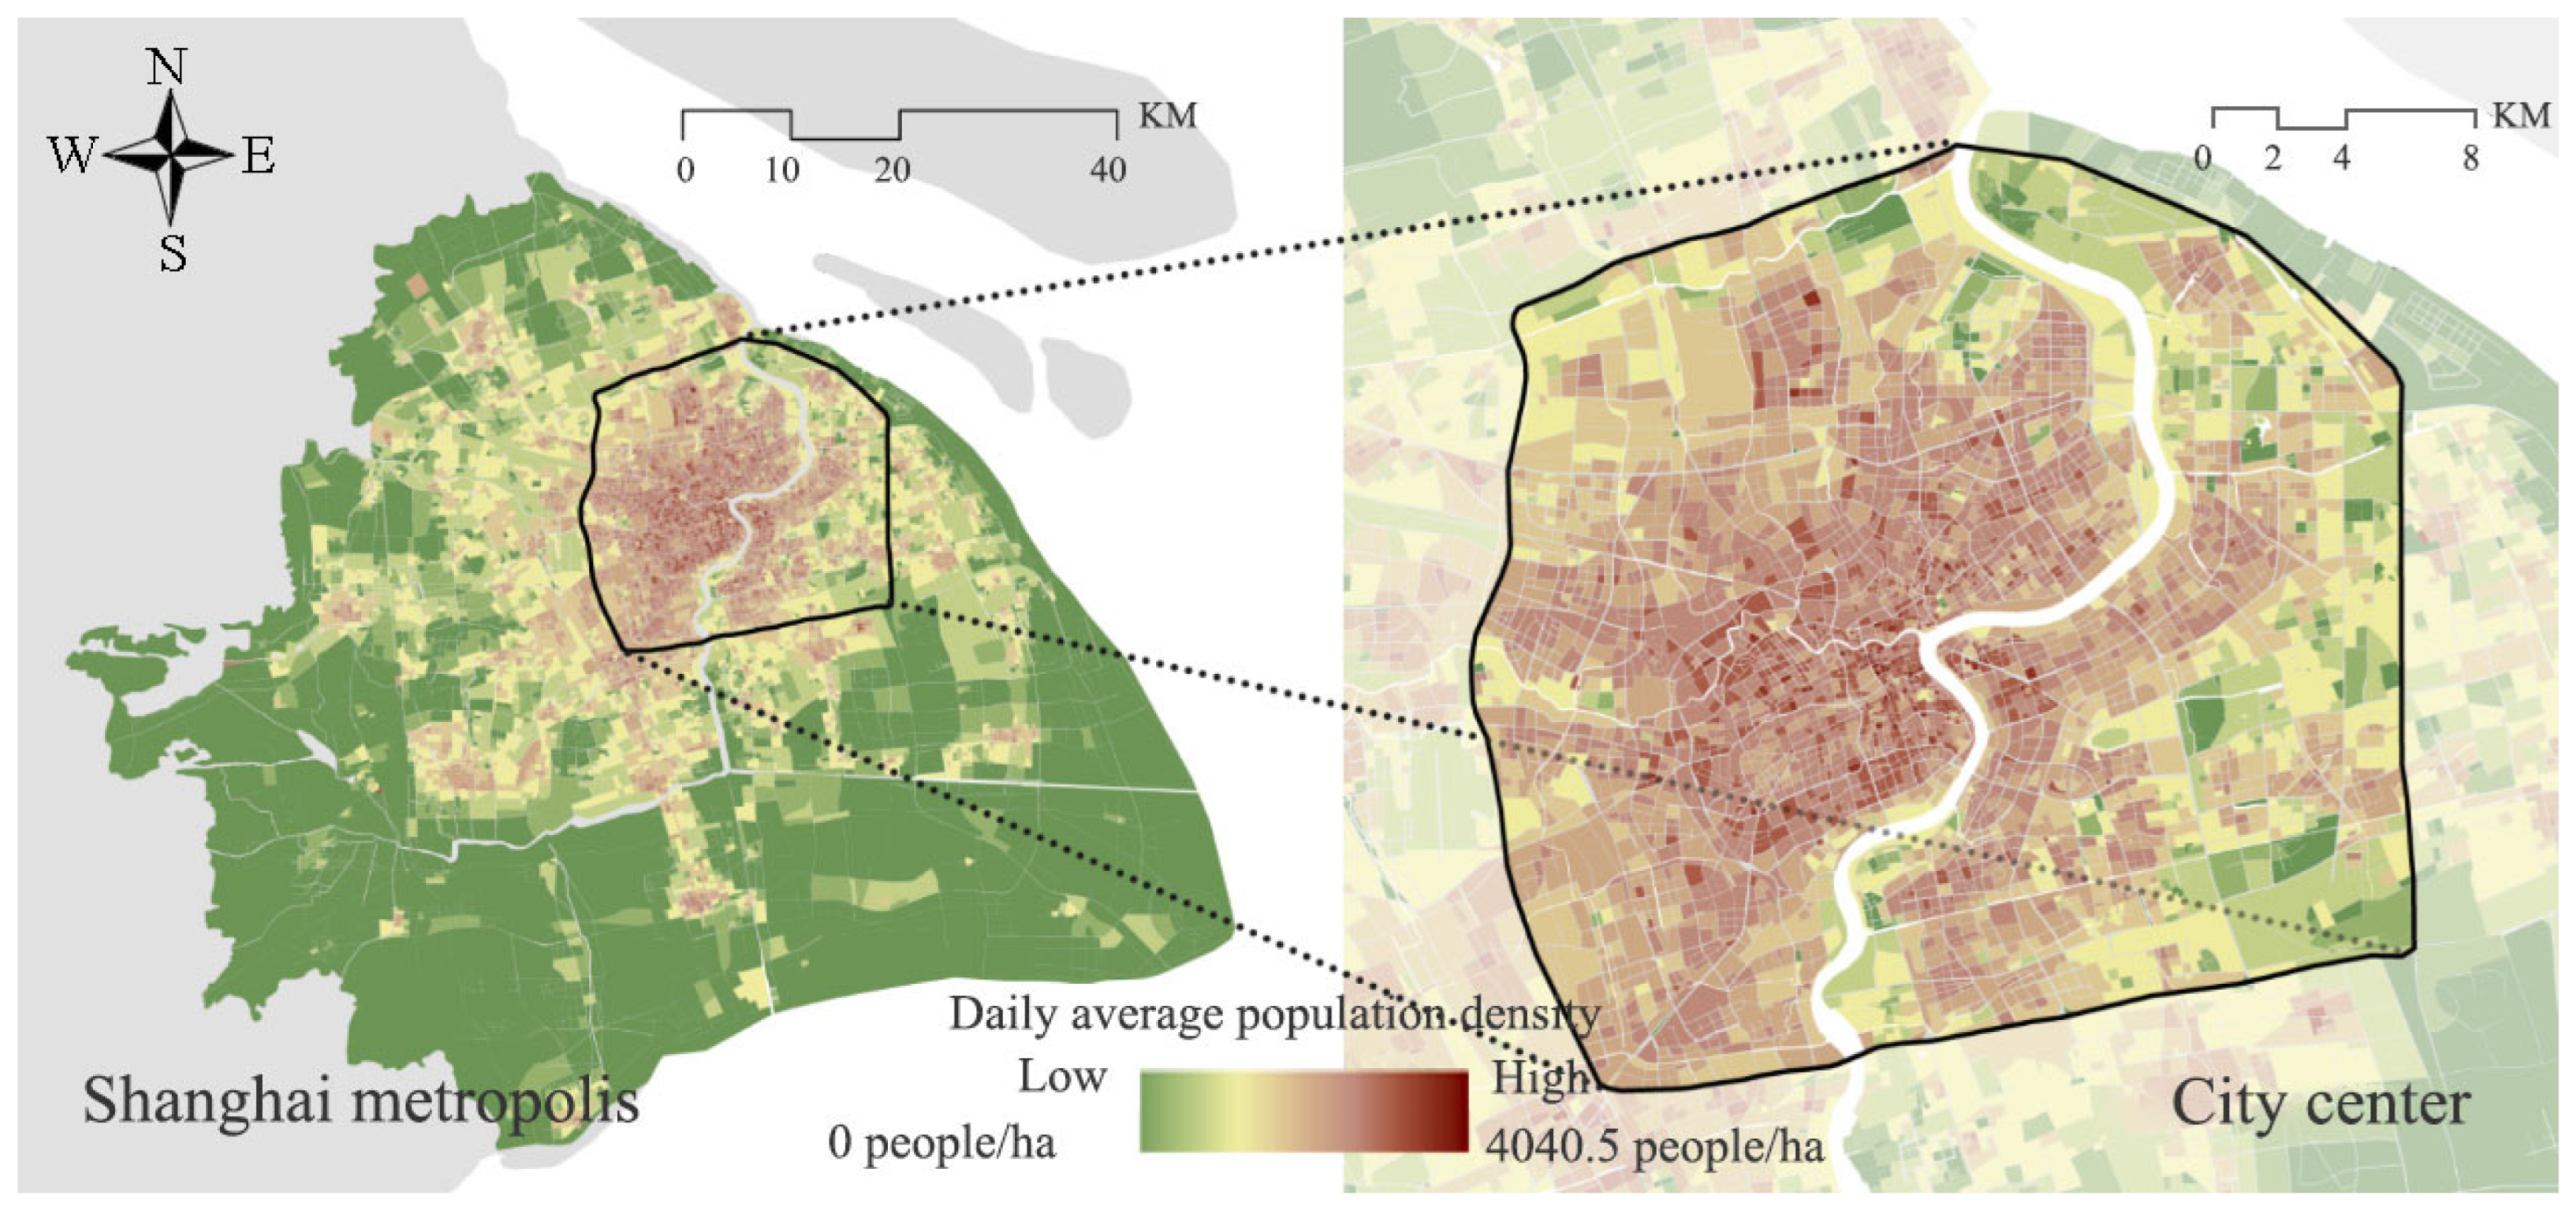
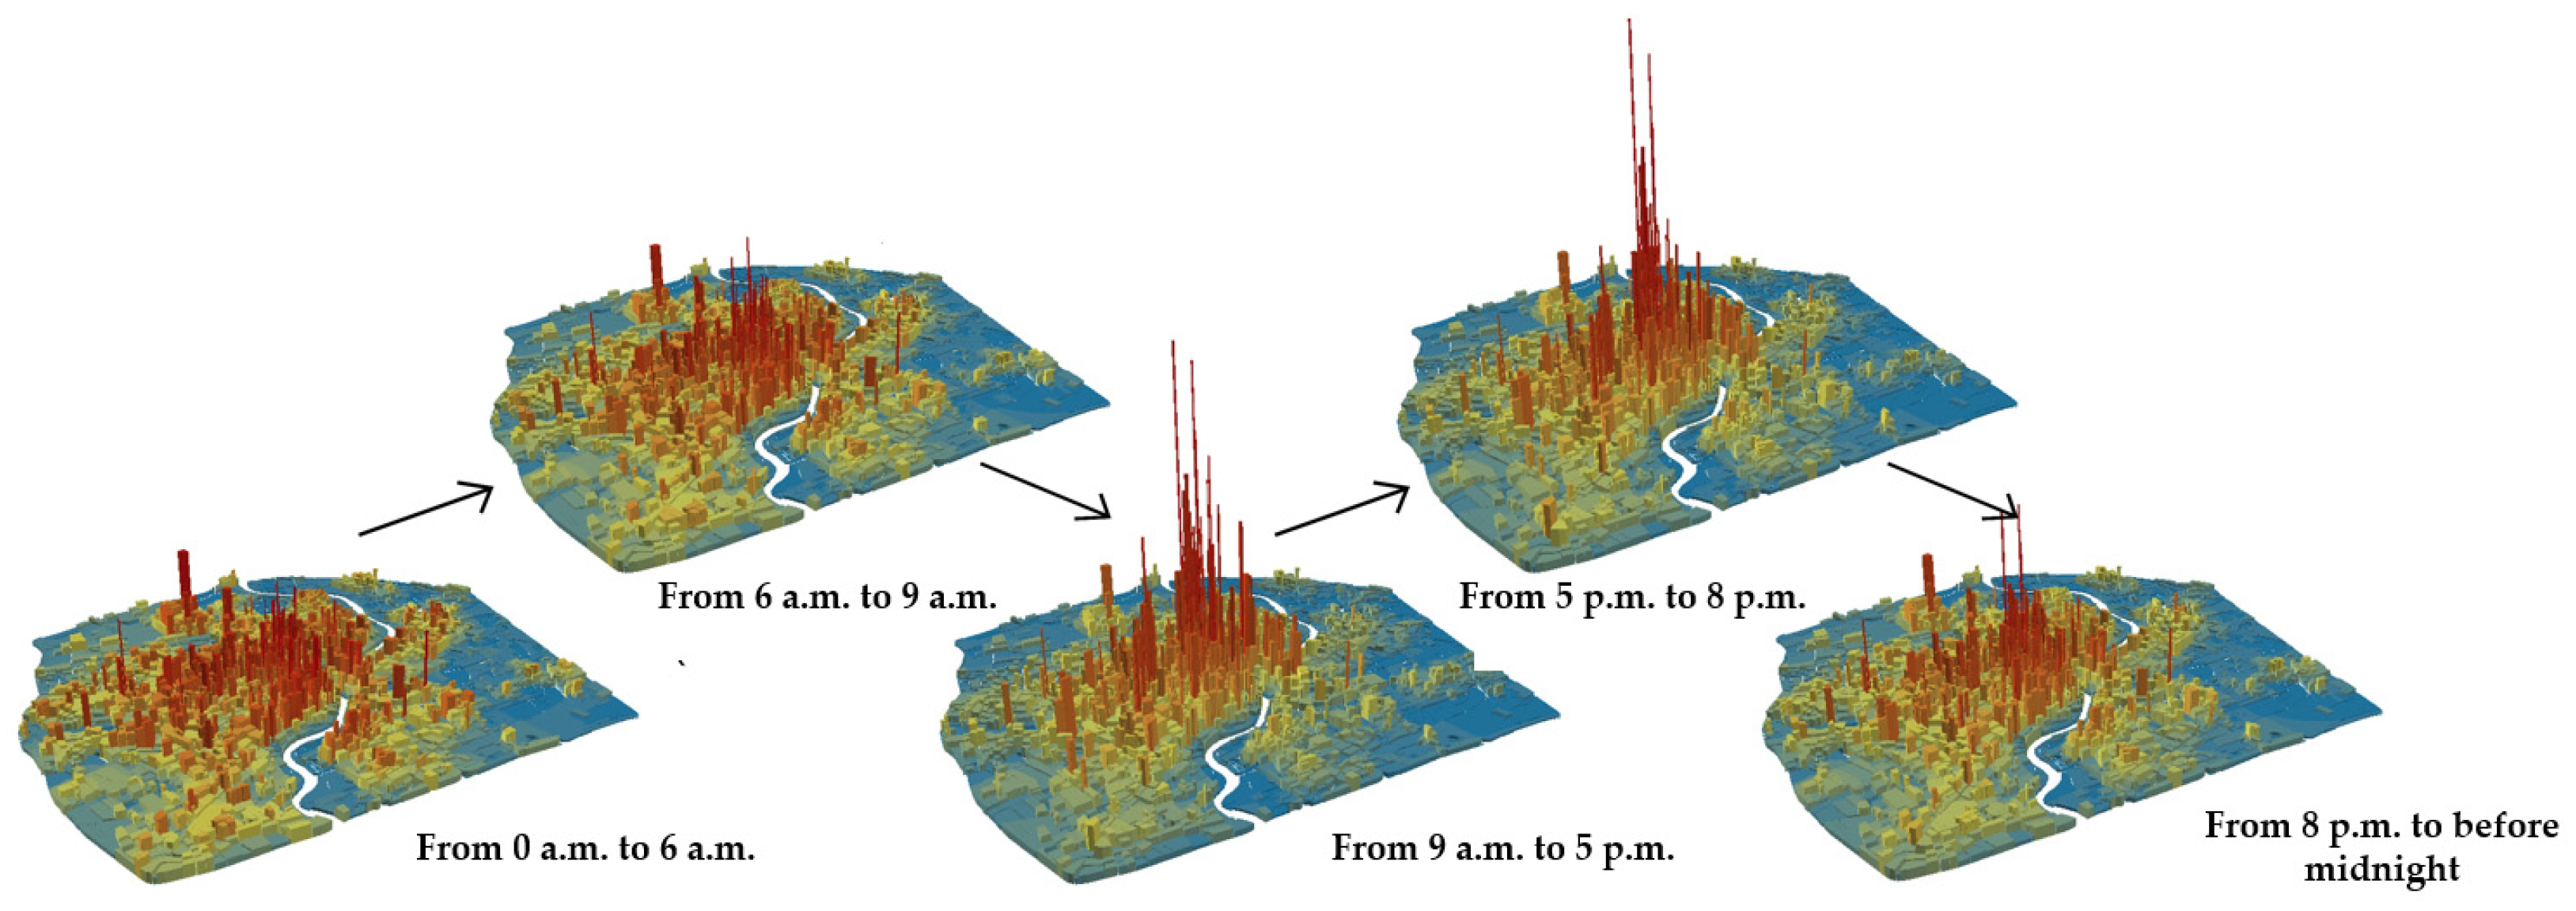
3.1. Characteristics and Patterns of the Dynamic Distribution of Population Density
3.2. Measurement Results of Land Use Characteristics
3.3. Contrast of Differences in the Correlation between Population Density Dynamic Distribution Patterns and Land Use Factors
4. Discussion
5. Conclusions
Author Contributions
Funding
Data Availability Statement
Conflicts of Interest
References
- Michael, B. The New Science of Cities; The MIT Press: Cambridge, MA, USA, 2018. [Google Scholar]
- Li, J.; Li, J.; Yuan, Y.; Li, G. Spatiotemporal Distribution Characteristics and Mechanism Analysis of Urban Population Density: A Case of Xi’an, Shaanxi, China. Cities 2019, 86, 62–70. [Google Scholar] [CrossRef]
- Li, Q.; Cui, C.; Liu, F.; Wu, Q.; Run, Y.; Han, Z. Multidimensional Urban Vitality on Streets: Spatial Patterns and Influence Factor Identification Using Multisource Urban Data. ISPRS Int. J. Geo-Inf. 2022, 11, 2. [Google Scholar] [CrossRef]
- Ha, K.-M. Reviewing Stakeholders during the Itaewon Halloween Crowd Crush, Korea 2022: Qualitative Content Analysis. F1000Research 2023, 12, 829. [Google Scholar] [CrossRef] [PubMed]
- Zhou, H.; Gao, H. The Impact of Urban Morphology on Urban Transportation Mode: A Case Study of Tokyo. Case Stud. Transp. Policy 2020, 8, 197–205. [Google Scholar] [CrossRef]
- Ye, Y.; Qiu, H. Using Urban Landscape Pattern to Understand and Evaluate Infectious Disease Risk. Urban For. Urban Green. 2021, 62, 127126. [Google Scholar] [CrossRef]
- Khan, S.U.; Cui, Y. Identifying the Impact Factors of Sustainable Development Efficiency: Integrating Environmental Degradation, Population Density, Industrial Structure, GDP per Capita, Urbanization, and Technology. Environ. Sci. Pollut. Res. 2022, 29, 56098–56113. [Google Scholar] [CrossRef]
- Song, X.; Feng, Q.; Xia, F.; Li, X.; Scheffran, J. Impacts of Changing Urban Land-Use Structure on Sustainable City Growth in China: A Population-Density Dynamics Perspective. Habitat Int. 2021, 107, 102296. [Google Scholar] [CrossRef]
- Ghosh, P.A.; Ghosh, P.A.; Raval, P.M. Reasoning the Social Benefits of Mixed Land-Use and Population Density in an Indian City. J. Eng. Res. 2022, 10, 17. [Google Scholar] [CrossRef]
- Wu, C.; Ye, X.; Ren, F.; Du, Q. Check-in Behaviour and Spatio-Temporal Vibrancy: An Exploratory Analysis in Shenzhen, China. Cities 2018, 77, 104–116. [Google Scholar] [CrossRef]
- Shi, Z.; Zhou, S.; Chen, Y. Jobs-Housing Relationship in Different Industries and its Impact on Traffic Demand on Road Networks: A Case Study in Guangzhou. City Plan. Rev. 2020, 44, 87–94. [Google Scholar]
- Sun, B.; Ermagun, A.; Dan, B. Built Environmental Impacts on Commuting Mode Choice and Distance: Evidence from Shanghai. Transp. Res. Part D Transp. Environ. 2017, 52, 441–453. [Google Scholar] [CrossRef]
- Gu, Q.; Zhang, H.; Huang, S.; Zheng, F.; Chen, C. Tourists’ Spatiotemporal Behaviors in an Emerging Wine Region: A Time-Geography Perspective. J. Destin. Mark. Manag. 2021, 19, 100513. [Google Scholar] [CrossRef]
- Zhang, Y.; Zhong, W.; Wang, D.; Lin, F.-T. Understanding the Spatiotemporal Patterns of Nighttime Urban Vibrancy in Central Shanghai Inferred from Mobile Phone Data. Reg. Sustain. 2021, 2, 297–307. [Google Scholar] [CrossRef]
- Deros, S.N.M.; Din, N.M.; Norzeli, S.; Sukri, A.M.; Bin Baharuddin, M. Modelling of Population Density in Urban Cities Using VIIRS Night Time Light Data. Int. J. Adv. Sci. Technol. 2019, 28, 150–157. [Google Scholar]
- García-Palomares, J.C.; Salas-Olmedo, M.H.; Moya-Gómez, B.; Condeço-Melhorado, A.; Gutiérrez, J. City Dynamics through Twitter: Relationships between Land Use and Spatiotemporal Demographics. Cities 2018, 72, 310–319. [Google Scholar] [CrossRef]
- Shi, Y.; Yang, J.; Shen, P. Revealing the Correlation between Population Density and the Spatial Distribution of Urban Public Service Facilities with Mobile Phone Data. ISPRS Int. J. Geo-Inf. 2020, 9, 38. [Google Scholar] [CrossRef]
- Liu, X.; Huang, B.; Li, R.; Wang, J. Characterizing the Complex Influence of the Urban Built Environment on the Dynamic Population Distribution of Shenzhen, China, Using Geographically and Temporally Weighted Regression. Environ. Plan. B Urban Anal. City Sci. 2021, 48, 1445–1462. [Google Scholar] [CrossRef]
- Meng, Y.; Xing, H. Exploring the Relationship between Landscape Characteristics and Urban Vibrancy: A Case Study Using Morphology and Review Data. Cities 2019, 95, 102389. [Google Scholar] [CrossRef]
- Ye, Y.; Li, D.; Liu, X. How Block Density and Typology Affect Urban Vitality: An Exploratory Analysis in Shenzhen, China. Urban Geogr. 2018, 39, 631–652. [Google Scholar] [CrossRef]
- Arribas-Bel, D.; Fleischmann, M. Spatial Signatures—Understanding (Urban) Spaces through Form and Function. Habitat Int. 2022, 128, 102641. [Google Scholar] [CrossRef]
- Berghauser Pont, M.; Stavroulaki, G.; Bobkova, E.; Gil, J.; Marcus, L.; Olsson, J.; Sun, K.; Serra, M.; Hausleitner, B.; Dhanani, A.; et al. The Spatial Distribution and Frequency of Street, Plot and Building Types across Five European Cities. Environ. Plan. B Urban Anal. City Sci. 2019, 46, 1226–1242. [Google Scholar] [CrossRef]
- Paraskevopoulos, Y.; Bakogiannis, E. Exploring the urban types of built density, network centrality, and functional mixture in the city of Athens. An open data approach. In Proceedings of the 13th Space Syntax Symposium, Bergen, Norway, 1 August 2022; pp. 468.1–468.25. [Google Scholar]
- Zhang, Z.; Xiao, Y.; Luo, X.; Zhou, M. Urban Human Activity Density Spatiotemporal Variations and the Relationship with Geographical Factors: An Exploratory Baidu Heatmaps-based Analysis of Wuhan, China. Growth Chang. 2020, 51, 505–529. [Google Scholar] [CrossRef]
- Louail, T.; Lenormand, M.; Cantu Ros, O.G.; Picornell, M.; Herranz, R.; Frias-Martinez, E.; Ramasco, J.J.; Barthelemy, M. From Mobile Phone Data to the Spatial Structure of Cities. Sci. Rep. 2014, 4, 5276. [Google Scholar] [CrossRef] [PubMed]
- Montero, P.; Vilar, J.A. TSclust: An R Package for Time Series Clustering. J. Stat. Soft. 2014, 62, 1–43. [Google Scholar] [CrossRef]
- Kenari, A.R.; Maarof, M.A.B.; Sap, M.N.B.M.; Shamsi, M. An Intelligent Weighted Kernel K-Means Algorithm for High Dimension Data. In Proceedings of the 2009 Second International Conference on the Applications of Digital Information and Web Technologies, London, UK, 4–6 August 2009; pp. 829–831. [Google Scholar]
- Rousseeuw, P.J. Silhouettes: A Graphical Aid to the Interpretation and Validation of Cluster Analysis. J. Comput. Appl. Math. 1987, 20, 53–65. [Google Scholar] [CrossRef]
- Dunn, J.C. Well-Separated Clusters and Optimal Fuzzy Partitions. J. Cybern. 1974, 4, 95–104. [Google Scholar] [CrossRef]
- Gehl, J.; Gemzoe, L. New City Spaces; Danish Architectural Press: Copenhagen, Denmark, 2000. [Google Scholar]
- Ahas, R.; Aasa, A.; Yuan, Y.; Raubal, M.; Smoreda, Z.; Liu, Y.; Ziemlicki, C.; Tiru, M.; Zook, M. Everyday Space–Time Geographies: Using Mobile Phone-Based Sensor Data to Monitor Urban Activity in Harbin, Paris, and Tallinn. Int. J. Geogr. Inf. Sci. 2015, 29, 2017–2039. [Google Scholar] [CrossRef]
- Jiang, Y.; Han, Y.; Liu, M.; Ye, Y. Street Vitality and Built Environment Features: A Data-Informed Approach from Fourteen Chinese Cities. Sustain. Cities Soc. 2022, 79, 103724. [Google Scholar] [CrossRef]
- Braun, L.M.; Malizia, E. Downtown Vibrancy Influences Public Health and Safety Outcomes in Urban Counties. J. Transp. Health 2015, 2, 540–548. [Google Scholar] [CrossRef]
- Liu, S.; Zhang, L.; Long, Y. Urban Vitality Area Identification and Pattern Analysis from the Perspective of Time and Space Fusion. Sustainability 2019, 11, 4032. [Google Scholar] [CrossRef]
- Ratti, C.; Frenchman, D.; Pulselli, R.M.; Williams, S. Mobile Landscapes: Using Location Data from Cell Phones for Urban Analysis. Environ. Plann. B Plann. Des. 2006, 33, 727–748. [Google Scholar] [CrossRef]
- Bibri, S.E.; Krogstie, J.; Kärrholm, M. Compact City Planning and Development: Emerging Practices and Strategies for Achieving the Goals of Sustainability. Dev. Built Environ. 2020, 4, 100021. [Google Scholar] [CrossRef]
- Li, J.; Huang, Z.; Zhu, Z.; Ding, G. Coexistence Perspectives: Exploring the Impact of Landscape Features on Aesthetic and Recreational Values in Urban Parks. Ecol. Indic. 2024, 162, 112043. [Google Scholar] [CrossRef]
- Hu, X.; Zhu, W.; Shen, X.; Bai, R.; Shi, Y.; Li, C.; Zhao, L. Exploring the Predictive Ability of the CA–Markov Model for Urban Functional Area in Nanjing Old City. Sci. Rep. 2024, 14, 18453. [Google Scholar] [CrossRef] [PubMed]
- Paköz, M.Z.; Işık, M. Rethinking Urban Density, Vitality and Healthy Environment in the Post-Pandemic City: The Case of Istanbul. Cities 2022, 124, 103598. [Google Scholar] [CrossRef] [PubMed]
- Zhong, C.; Schlapfer, M.; Arisona, S.M.; Batty, M.; Ratti, C.; Schmitt, G. Revealing Centrality in the Spatial Structure of Cities from Human Activity Patterns. Urban Stud. 2017, 54, 437–455. [Google Scholar] [CrossRef]
- Whyte, H.W. City: Rediscovering the Center; Anchor Books: New York, NY, USA, 1998. [Google Scholar]
- Gehl, J. Life between Buildings; Arkitektens Forlag: Copenhagen, Denmark, 1971. [Google Scholar]
- Shen, Y.; Karimi, K. Urban Evolution as a Spatio-Functional Interaction Process: The Case of Central Shanghai. J. Urban Des. 2018, 23, 42–70. [Google Scholar] [CrossRef]
- Xu, Z.; Shang, Z.; Zhong, Y.; Han, L.; Li, M.; Yang, Y. Evaluating 15-Minute Walkable Life Circles for the Senior: A Case Study of Jiande, China. J. Asian Archit. Build. Eng. 2024, 1–17. [Google Scholar] [CrossRef]


| Dataset | Data Layer | Contents of Subdataset |
|---|---|---|
| Individual signaling data | ID | Anonymous encrypted mobile terminal ID |
| Station | Base station code to which a mobile phone was connected during signaling events | |
| TIME | Signaling occurrence time, reflecting the temporal information of population spatial dynamics | |
| Longitude | Latitude and longitude coordinates of a mobile base station, reflecting the spatial information of population spatial dynamics | |
| Latitude |
| Dataset | Data Layer | Contents of Subdataset |
|---|---|---|
| Land use data | Land parcel level | Function (land use type), boundary, and area of developed land parcels |
| Street block level | Boundary and area of street blocks | |
| Building level | Planar profile of buildings, number of stories, land area of buildings, function of buildings | |
| Road transport level | Central line and boundary line of roads, rail transport stations, public transport stops | |
| Natural environment level | Rivers, water systems, and mountains |
| Dimension | Measure | Computational Formula | Remarks | |
|---|---|---|---|---|
| A | Location centrality | City center location index (A1) | In the formula, K is the number of city centers; Gk is the total building area of public service facilities in the k city center; Sk is the total area of developed land in the k city center; and Dnk is the straight-line distance from the n spatial unit to the k city center. | |
| District center location index (A2) | In the formula, c is the district center to which the straight-line distance from the n spatial unit is the smallest; Gc is the total building area of public service facilities in district center c; Sc is the total area of developed lands in the district center c; and Min(Dnc) is the straight-line distance from the n spatial unit to district center c. | |||
| B | Functional diversity | Land use diversity (B1) | In the formula, pu is the total area of the u type of developed land in the n spatial unit and U is the total number of land development types in the spatial unit. | |
| Building functional diversity (B2) | In the formula, qu is the total building area of the u type of developed land in the n spatial unit and U is the total number of land development types in the spatial unit. | |||
| C | Transportation accessibility | Road network accessibility (C1) | In the formula, L is the total central line length of roads in the spatial unit and S is the total area of developed land in the spatial unit. | |
| Rail-transit convenience (C2) | In the formula, Dnr is the straight-line distance from the n spatial unit to the rail transport station; Min(Dnr) is the minimum of the Dnr measurements; and D0 is a constant, indicating the minimum distance. | |||
| D | Scale intensification | Plot ratio index (D1) | In the formula, Q is the total building area in the n spatial unit; S is the total area of developed land in the n spatial unit; and U is the total number of land development types. | |
| Building density (D2) | In the formula, M is the total land area of buildings in the spatial unit and S is the area of the spatial unit. | |||
| E | Form compactness | Space fragment index (E1) | In the formula, F is the total number of plots in the nth spatial unit; Min(pu) is the area of the smallest plot in the spatial unit; and S is the total area of the n spatial unit. | |
| Plane shape index (E2) | In the formula, S is the total area of developed lands in the spatial unit and V is the length of the planar boundary of the spatial unit. | |||
| F | Landscape quality | Green coverage index (F1) | In the formula, E is the area of green space in a 500 m buffer zone and S is the area of the 500 m buffer zone in the n spatial unit. | |
| Space hydrophilic index (F2) | In the formula, Dnw is the straight-line distance from the n spatial unit to the w water system in the vicinity; Min(Dnw) is the minimum of the Dnw measurements; and D0 is a constant, indicating the minimum distance. | |||
| Types of Daily Fluctuation Curve of Crowd Activities | Features | Distribution | Land Use Patterns |
|---|---|---|---|
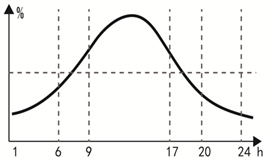 Type-1 | It describes a situation where there is a short-term, extremely high peak value during a day, leading to strong fluctuations with high and low oscillations. |  | Large commercial facility land, public facility land, business office land, and residential land adjacent to them. |
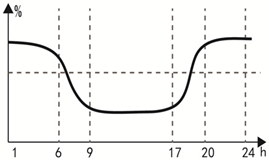
 Type-2 | It maintains a relatively stable high-intensity state during the day, with only transient increases and decreases in population density occurring during the morning and evening commuting periods, respectively. |  | Mainly composed of large industrial land and commercial consulting land, with a small amount of residential land and commercial land. |
 Type-3 | It maintains a relatively stable low-intensity state during the day, with only transient decreases and increases in population density occurring during the morning and evening commuting periods, respectively. | 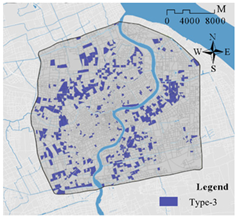 | The central urban area is mainly composed of small residential communities and under-construction sites; the peripheral areas are primarily focused on large residential land functions. |
 Type-4 | The population density remains relatively low and stable throughout the day in each time period. |  | Mainly composed of agricultural and forestry land, suburban green space, and non-construction land; partially consists of industrial land and logistics warehousing land. |
 Type-5 | There is a peak inflection point in population density during the morning and evening commuting periods. | 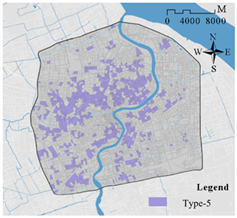 | Primarily consists of large-scale residential land and educational and research land. |
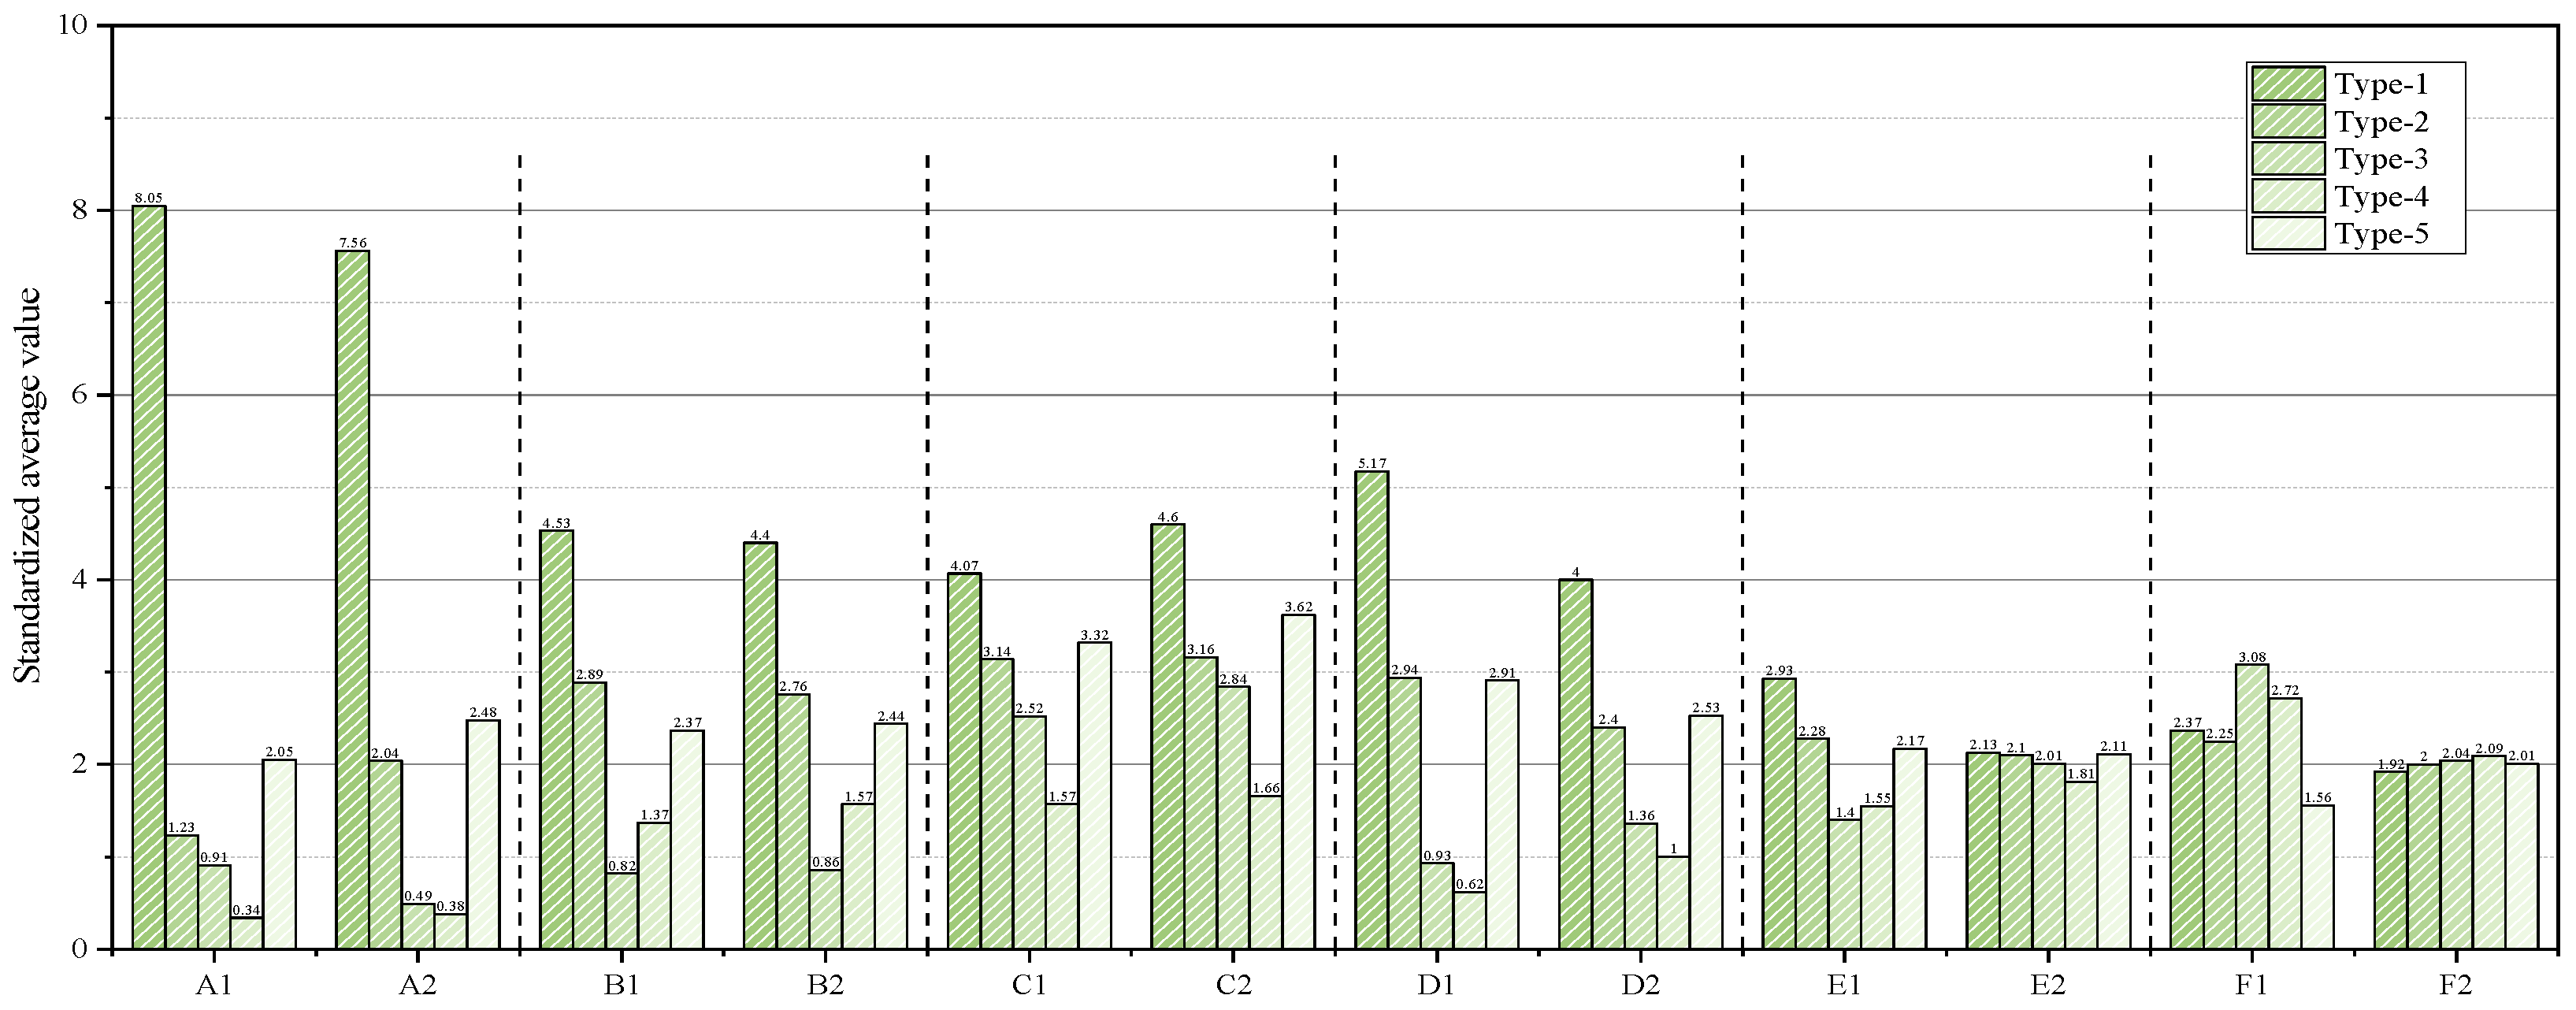
| Factors of Urban Form | Type-1 | Type-2 | Type-3 | Type-4 | Type-5 | |
|---|---|---|---|---|---|---|
| Radar chart of land use influencing factors | 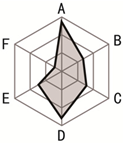 | 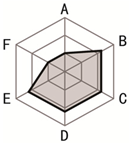 |  | 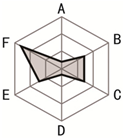 |  | |
| Location centrality (A) | City center location index (A1) | 8.05 | 1.23 | 0.91 | 0.34 | 2.05 |
| District center location index (A2) | 7.56 | 2.04 | 0.49 | 0.38 | 2.48 | |
| Functional diversity (B) | Land use diversity (B1) | 4.53 | 2.89 | 0.82 | 1.37 | 2.37 |
| Building functional diversity (B2) | 4.40 | 2.76 | 0.86 | 1.57 | 2.44 | |
| Transportation accessibility (C) | Road network accessibility (C1) | 4.07 | 3.14 | 2.52 | 1.57 | 3.32 |
| Rail transit convenience (C2) | 4.60 | 3.16 | 2.84 | 1.66 | 3.62 | |
| Scale intensification (D) | Plot ratio index (D1) | 5.17 | 2.94 | 0.93 | 0.62 | 2.91 |
| Building density (D2) | 4.00 | 2.40 | 1.36 | 1.00 | 2.53 | |
| Form compactness (E) | Space fragment index (E1) | 2.93 | 2.28 | 1.40 | 1.55 | 2.17 |
| Plane shape index (E2) | 2.13 | 2.10 | 2.01 | 1.81 | 2.11 | |
| Landscape quality (F) | Green coverage index (F1) | 2.37 | 2.25 | 3.08 | 2.72 | 1.56 |
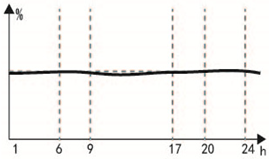
| Space hydrophilic index (F2) | 1.92 | 2.00 | 2.04 | 2.09 | 2.01 | |
Disclaimer/Publisher’s Note: The statements, opinions and data contained in all publications are solely those of the individual author(s) and contributor(s) and not of MDPI and/or the editor(s). MDPI and/or the editor(s) disclaim responsibility for any injury to people or property resulting from any ideas, methods, instructions or products referred to in the content. |
© 2024 by the authors. Licensee MDPI, Basel, Switzerland. This article is an open access article distributed under the terms and conditions of the Creative Commons Attribution (CC BY) license (https://creativecommons.org/licenses/by/4.0/).
Share and Cite
Shi, Y.; Zheng, Y.; Chen, D.; Yang, J.; Cao, Y.; Cui, A. Research on the Correlation between the Dynamic Distribution Patterns of Urban Population Density and Land Use Morphology Based on Human–Land Big Data: A Case Study of the Shanghai Central Urban Area. Land 2024, 13, 1547. https://doi.org/10.3390/land13101547
Shi Y, Zheng Y, Chen D, Yang J, Cao Y, Cui A. Research on the Correlation between the Dynamic Distribution Patterns of Urban Population Density and Land Use Morphology Based on Human–Land Big Data: A Case Study of the Shanghai Central Urban Area. Land. 2024; 13(10):1547. https://doi.org/10.3390/land13101547
Chicago/Turabian StyleShi, Yi, Yi Zheng, Daijun Chen, Junyan Yang, Yue Cao, and Ao Cui. 2024. "Research on the Correlation between the Dynamic Distribution Patterns of Urban Population Density and Land Use Morphology Based on Human–Land Big Data: A Case Study of the Shanghai Central Urban Area" Land 13, no. 10: 1547. https://doi.org/10.3390/land13101547
APA StyleShi, Y., Zheng, Y., Chen, D., Yang, J., Cao, Y., & Cui, A. (2024). Research on the Correlation between the Dynamic Distribution Patterns of Urban Population Density and Land Use Morphology Based on Human–Land Big Data: A Case Study of the Shanghai Central Urban Area. Land, 13(10), 1547. https://doi.org/10.3390/land13101547