Article

Comparative Study of Cognitive Differences in Rural Landscapes Based on Eye Movement Experiments

Department of Landscape Architecture and Art, Northwest A&F University, Xianyang 712100, China
*
Author to whom correspondence should be addressed.
Land 2024, 13(10), 1592; https://doi.org/10.3390/land13101592
Submission received: 9 August 2024 / Revised: 23 September 2024 / Accepted: 27 September 2024 / Published: 30 September 2024

Abstract

:
With the booming development of rural tourism, the users of rural environments are gradually becoming more diverse. Both tourists and villagers are the main appreciators of rural landscapes, but the cognitive similarities and differences in rural landscape between the two have not yet been explored. Therefore, taking Wangshang Village, located in Shaanxi Province, China as a case study, this research used a combination of quantitative analysis (eye-tracking technology) and qualitative analysis (semi-structured interviews) to compare and analyze the cognitive similarities and differences of rural landscapes between tourists and villagers. The experimental results showed that the cognitive similarities and differences in rural landscapes between tourists and villagers are mainly reflected in their level of cognition, observation methods, and key elements of focus. The reasons for cognitive differences are due to the different living backgrounds of the two groups of subjects, as well as their varying levels of familiarity, novelty, and personal needs towards rural landscapes. In conclusion, studying the cognitive differences between the two groups of participants, tourists and villagers, can help address the homogenization problem faced by rural landscapes. Meanwhile, the results of this study also provide theoretical guidance and methodological support for rural landscape design.

1. Introduction

The countryside records the origin and evolution of human civilization, as well as being a simple cultural landscape. The well-preserved natural landscapes in rural environments are also a significant foundation for protecting biodiversity [1]. Nowadays, rural landscapes are playing an increasingly considerable role in tourism [2], ecology [3], cultural heritage [4], and other fields. There is an increasing demand for leisure tourism, which pursues a harmonious coexistence between humans and nature, something which is also increasingly sought after by people [5]. In recent years, rural tourism has emerged as a novel model and pivotal avenue for driving economic development in China’s rural areas, garnering significant attention and active support from the national and local government. The construction of rural landscapes not only facilitates the optimization and upgrading of rural industrial structures but also imparts fresh vitality into the diversification and sustainable development of rural economies [6]. Concurrently, rural landscape research has also received increasing attention from researchers due to its diversity and complexity [7]. How to tap into the development genes of local characteristics in countryside to activate endogenous driving forces and promote high-quality development in rural areas has become an unavoidable problem in current theoretical research and practical exploration [8]. To better address the homogenization problem faced by rural landscapes, this research takes the perspectives of tourists and villagers as entry points to explore the impact of these groups’ cognitive differences on rural landscape design.

1.1. Research on Rural Landscapes from Different Perspectives

Rural landscapes are one of the significant carrying units of rural ecological environment and culture [9]. The rapid development of rural landscape construction has promoted the diversification of research perspectives on rural landscapes. Scholars mostly conduct research from the perspectives of regional culture [10], ecology [11], carbon neutrality [12], and rural revitalization [13]. However, these research findings mostly revolve around the perspectives of culture, ecology, art, and policy, with only a few scholars conducting research from the perspectives of tourists, villagers, and other subjects. For instance, Cong et al., from the perspective of tourists, used a mixed model to examine the willingness to pay (WTP) and preference heterogeneity of tourists towards rural landscape improvement and evaluated the entertainment value of rural landscapes using compensatory surplus calculation methods. Finally, they concluded that the growth of rural tourism depends on the improvement of landscape elements [14]. On the contrary, Li et al. used the perspective of villagers as a starting point to analyze the perception and driving factors behind the changes in landscape values among villagers in the context of drastic changes in traditional Chinese village landscapes. Finally, the role of village value judgment in guiding the scientific formulation of policies for the protection and development of traditional villages and promoting sustainable development planning for traditional village society was emphasized [15].
However, the above studies mostly focus on a single group, such as local villagers or foreign tourists, as the cognitive subject, and rarely involve comparisons of cognitive differences between different groups. This not only easily leads to the consequences of researchers falling into a single-perspective misconception, but also has a certain adverse impact on the integrity of rural landscape cognitive research system construction.

1.2. Research on Rural Landscape Cognition

How to recognize rural landscape spaces and how to reveal and express the local characteristics of rural landscapes have always been the basic propositions for conducting rural space research and planning and design practice [16]. In the early stages of cognitive research on rural landscapes, scholars mainly conducted research on the concept of rural landscapes [17]. For example, John defines the concept of a rural landscape as a geographical unit of interdependent human, social, and economic phenomena within a rural area [18]. Further, Dong deems that a rural landscape refers to the most basic unit that constitutes a rural regional complex with a consistent natural geographical foundation in rural areas [19]. Agnoletti believes that rural landscapes are a cultural construct [20].
In the research process of rural landscape cognition, several scholars have introduced quantitative analysis methods and research tools based on qualitative analysis to improve the research system of rural landscape cognition through objective data analysis. Among numerous quantitative research methods, visual analysis is the most common. For instance, Torreggiani et al. quantitatively analyzed the changes in traditional rural landscape markers at the farm scale, ultimately proving that rural landscape research can help support and improve the description, planning, and meta design of rural settlements [21]. Dupont et al. used an eye tracking device to study the eye movement data of 42 observers when freely viewing landscape photos from rural to urban environments. They analyzed the saliency maps and eye tracking focus maps, and ultimately found that the saliency maps can serve as a reliable prediction for human observation patterns [22]. Su et al. took the “user oriented” landscape preference as a starting point to analyze the characteristics of users’ preference for rural public space landscapes with eye tracking technology. The research has found that participants have the most difficulty in understanding the spatial landscape of streets and alleys; tourists and residents are more interested in public green spaces, indicating that the landscape characteristics of public green spaces are more obvious. Compared to tourists, residents search for more information in public green spaces and waterfront landscapes, and the frequency of search is also higher [23]. Semi-structured interviews, a common qualitative analysis method, are widely used research tools in social sciences, often used for information gathering, and are a more natural and spontaneous way of interaction [24]. Due to the concentration of content in semi-structured interviews, the benefits of using semi-structured interviews to collect data and make decisions have long been widely known in many industries [25]. For example, Ma et al. used a research method that combines eye tracking technology with semi-structured interviews to compare and analyze the cognitive differences between tourists and villagers towards the traditional village style, providing theoretical and methodological support for the protection of traditional village styles and the revitalization of rural culture [26]. Thus, eye-tracking technology, as a quantitative analysis method, significantly excels in providing precise and objective data. These quantitative data facilitate the revelation of tourists’ preferences and cognitive patterns towards various landscape elements, thereby rendering the research outcomes highly reliable and reproducible. On the other hand, semi-structured interviews integrate the standardization of structured interviews with the flexibility of unstructured interviews, enabling researchers to dynamically adjust questions based on the interview progress and delve deeply into the cognitive differences between tourists and villagers towards rural landscapes. Through open-ended questions and probing inquiries, researchers can capture respondents’ subjective experiences, emotional attitudes, and profound insights, leading to a more comprehensive understanding of their cognitive processes. The precision and objectivity of quantitative analysis complement the depth and flexibility of qualitative analysis, enabling both research methods to leverage their respective strengths in the study of cognitive differences towards rural landscapes. This mutual validation and interpretation ensures the rigor of research findings.

1.3. Classification Methods for Rural Landscape Image Elements

Duan and Han divided rural landscapes into rural pastoral landscapes, rural settlement landscapes, rural architectural landscapes, rural agricultural cultural landscapes, and rural folk cultural landscapes [27]. Unlike the views of these researchers, Wang and Liu believe that a rural landscape is a comprehensive landscape environment composed of rural settlement landscapes, economic landscapes, cultural landscapes, and natural environment landscapes [28]. However, when influenced and constrained by the surrounding environment, people will develop direct or indirect experiential knowledge and form subjective environmental cognition [29]. Therefore, our research mainly refers to Kevin Lynch’s The Image of The City [30] and derived rural images based on urban images.
Urban image is constructed by Kevin Lynch using psychological and behavioral research methods, such as interviews, descriptions, and drawing cognitive maps. This method of classification is now internationally recognized as a highly effective and widely used approach for gathering social data pertinent to urban design and planning [29]. Thus, compared with traditional classification methods, this method of dividing rural landscapes into five specific cognitive elements, “landmarks”, “edges”, “districts”, “nodes”, and “paths”, focuses on people’s perception and cognition of rural landscapes, emphasizes the research purpose of “people-oriented”, truly meets the principle of “public participation” in rural landscape design, and strengthens the reliability and validity of our research.

2. Materials and Methods

2.1. Sample Site Selection

Shaanxi Province, renowned for its pivotal role in the origin of the Chinese nation and culture, is located in the inland hinterland of China, between longitude 105°29′–111°15′ E and latitude 31°42′–39°35′ N.
This research selected Wangshang Village in the southwest of Xianyang City, Shaanxi Province, China as the research site (Figure 1 for details). It is in Wu Quan Town, Yangling Demonstration Zone, covering an area of approximately 854,000 square meters with a total population of 1113 people. In 2020, Wangshang Village was declared a beautiful leisure village in China by the Office of the Ministry of Agriculture and Rural Affairs of the People’s Republic of China [31]. As the second batch of national rural governance demonstration villages in China, Wangshang Village has beautiful scenery, abundant tourism resources, and complete rural landscape cognitive elements, meeting the screening criteria for rural landscape research.

2.2. Eye Movement Experiment

2.2.1. Selection of Experimental Photos

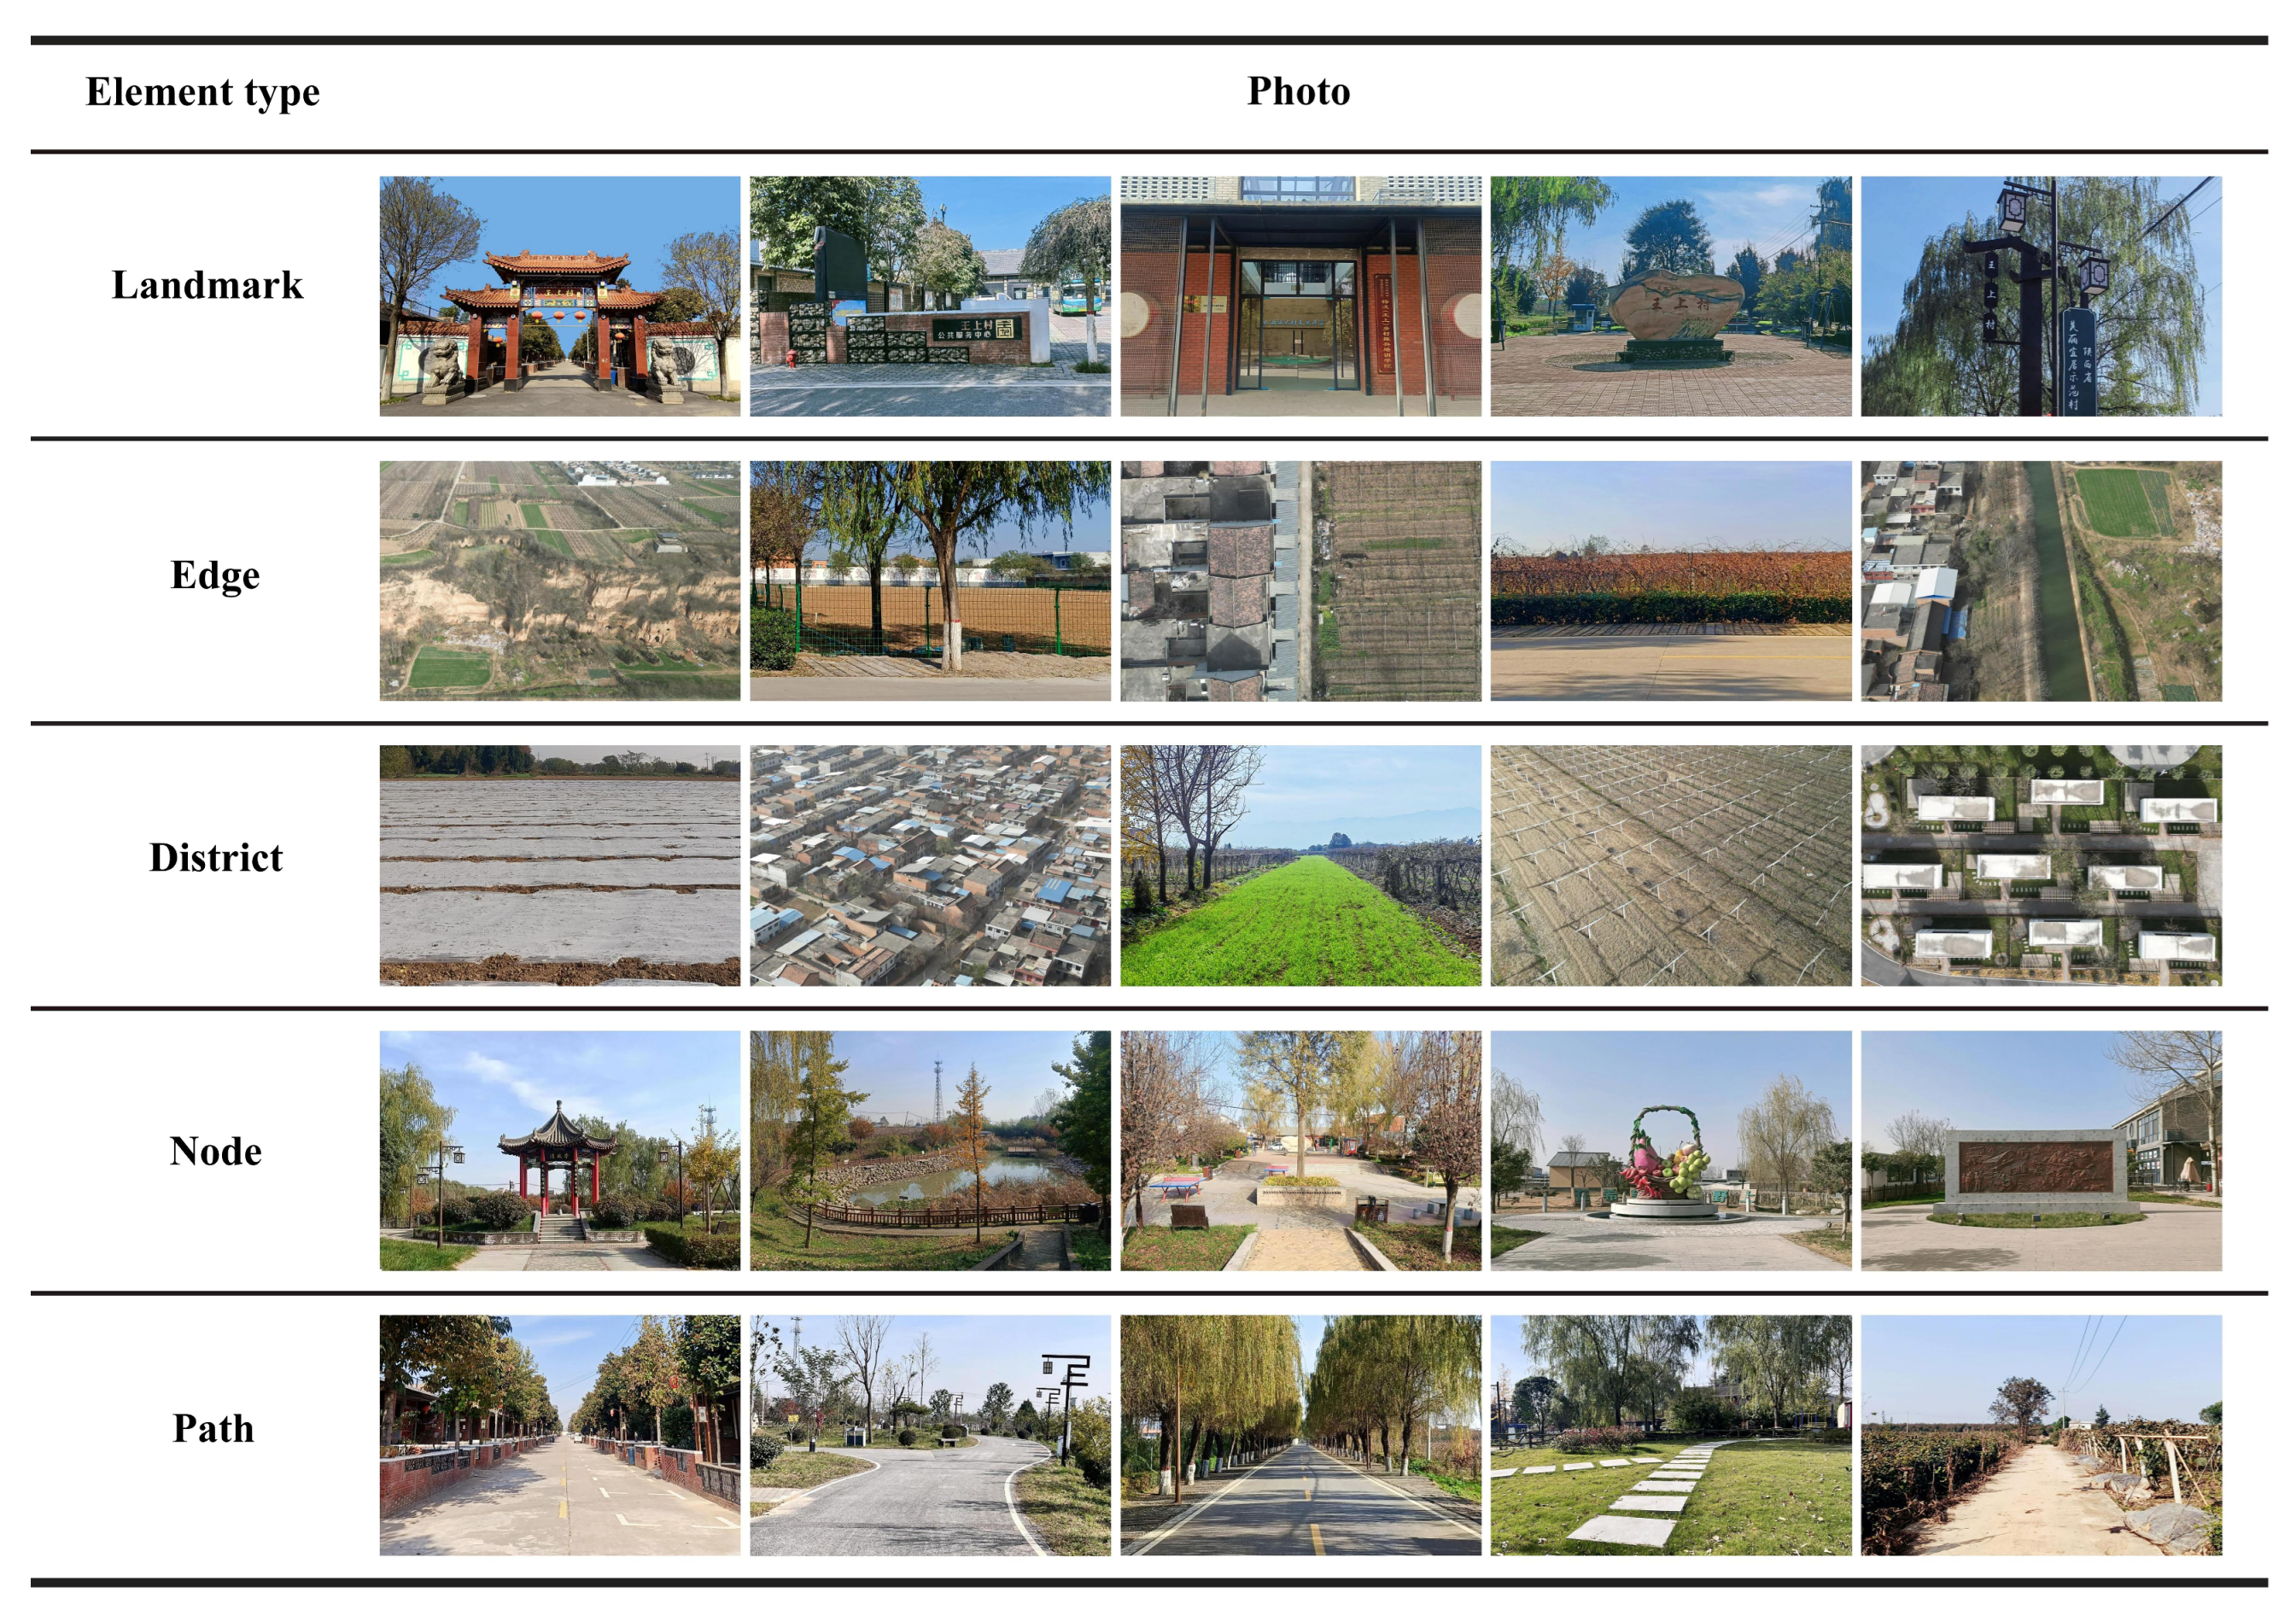
Referring to Kevin Lynch’s theory of urban image [30], rural image was introduced, and the rural landscape image of Wangshang Village was divided into 5 categories: “landmarks”, “boundaries”, “regions”, “nodes”, and “roads”. Among them, the landmarks of Wangshang Village mainly include road signs, memorial archways, temples and landmark buildings; The edges mainly include roads, water bodies, fences, and boundary markers that isolate farmland, orchards, and residential areas. The districts mainly include residential areas for villagers, tourist homestays, kiwifruit plantations, and crop planting areas; nodes mainly include intersections or convergence points of roads, rest stations in transportation routes, public service centers, recreational facilities, and leisure and entertainment squares. Paths mainly include village roads, rural roads, field paths, forest paths, etc.
Due to the adverse impact of external and technological factors on eye movement experiments, a controlled experiment was adopted which involved taking photos of rural landscapes as static stimuli in the field, organizing participants to observe the photos in a blank laboratory, and obtaining measurement data. The principle of selecting experimental photos was to include as many cognitive elements of the corresponding category as possible so that each element was presented indiscriminately and interference from irrelevant factors was avoided.
In the preparation stage before formal experiment, our team embarked on rigorous preparatory work to ensure the effectiveness and reliability of the experiment. This included conducting three small-scale preliminary experiments successively one month prior to the formal experiment. During these processes, we invited several participants, including local villagers and administrative leaders from Wangshang Village, to engage in testing. According to the feedback from the participants on the experimental process, photographs taken from a human perspective have significant limitations in showcasing the edges and districts characteristics of Wangshang Village and fail to fully reflect the unique geological features and regional culture of the village. Considering this feedbacks, we sought opinions from five renowned professors in the field of landscape architecture design. These experts pointed out that for rural areas such as Wangshang Village which have relatively flat terrain and are mainly farmland, a single human perspective cannot fully display the complete appearance of their boundaries and regions. Based on this professional advice, we decided to incorporate aerial views into the formal experiment as a supplement, providing more comprehensive and objective visual information to ensure that the experimental materials truthfully reflect the characteristics of the rural landscape in Wangshang Village.
At the first, our team divided the collected 165 photos into five types of rural landscape elements. Next, secondary screening according to the classification criteria of rural landscape cognitive elements was conducted by 10 graduate students majoring in landscape architecture. Moreover, to ensure objectivity and rigor, the 5 administrative leaders of Wangshang Village conducted three rounds of screening of the photos based on the unique rural landscape characteristics of Wangshang Village, and five professors in the field of landscape design were invited to conduct a final review of the experimental photos. Eventually, 25 photos were selected and uniformly scaled as static stimulus materials for eye movement experiments (Figure 2 for details).

2.2.2. Selection of Subjects

To mitigate biases stemming from participant subjectivity, we conducted stringent screening during participant selection, striving to ensure representativeness across age, gender, cultural background, and other relevant dimensions. The experiment selected two different cognitive groups as participants, with a total of 77 people; namely, 40 villagers (23 males and 17 females, Mean Age = 57.325, Standard Deviation = 11.840) who had lived in Wangshang Village for a long time and 37 tourists (20 males and 17 females, Mean Age = 32.892, Standard Deviation = 10.107) who had no long-term living experience in Wangshang Village. All participants had normal vision, and among them, the participants in the local population group were mostly farmers, students, chefs, and township managers. The non-local participants were mostly students, teachers, tour guides, maintenance workers, photographers, retired workers, and so on. Selecting cognitive groups with different identities was mainly done to ensure the diversity of the subjects in terms of profession, aesthetics, taste, cognition, choice, and judgment.

2.2.3. Experimental Equipment and Environment

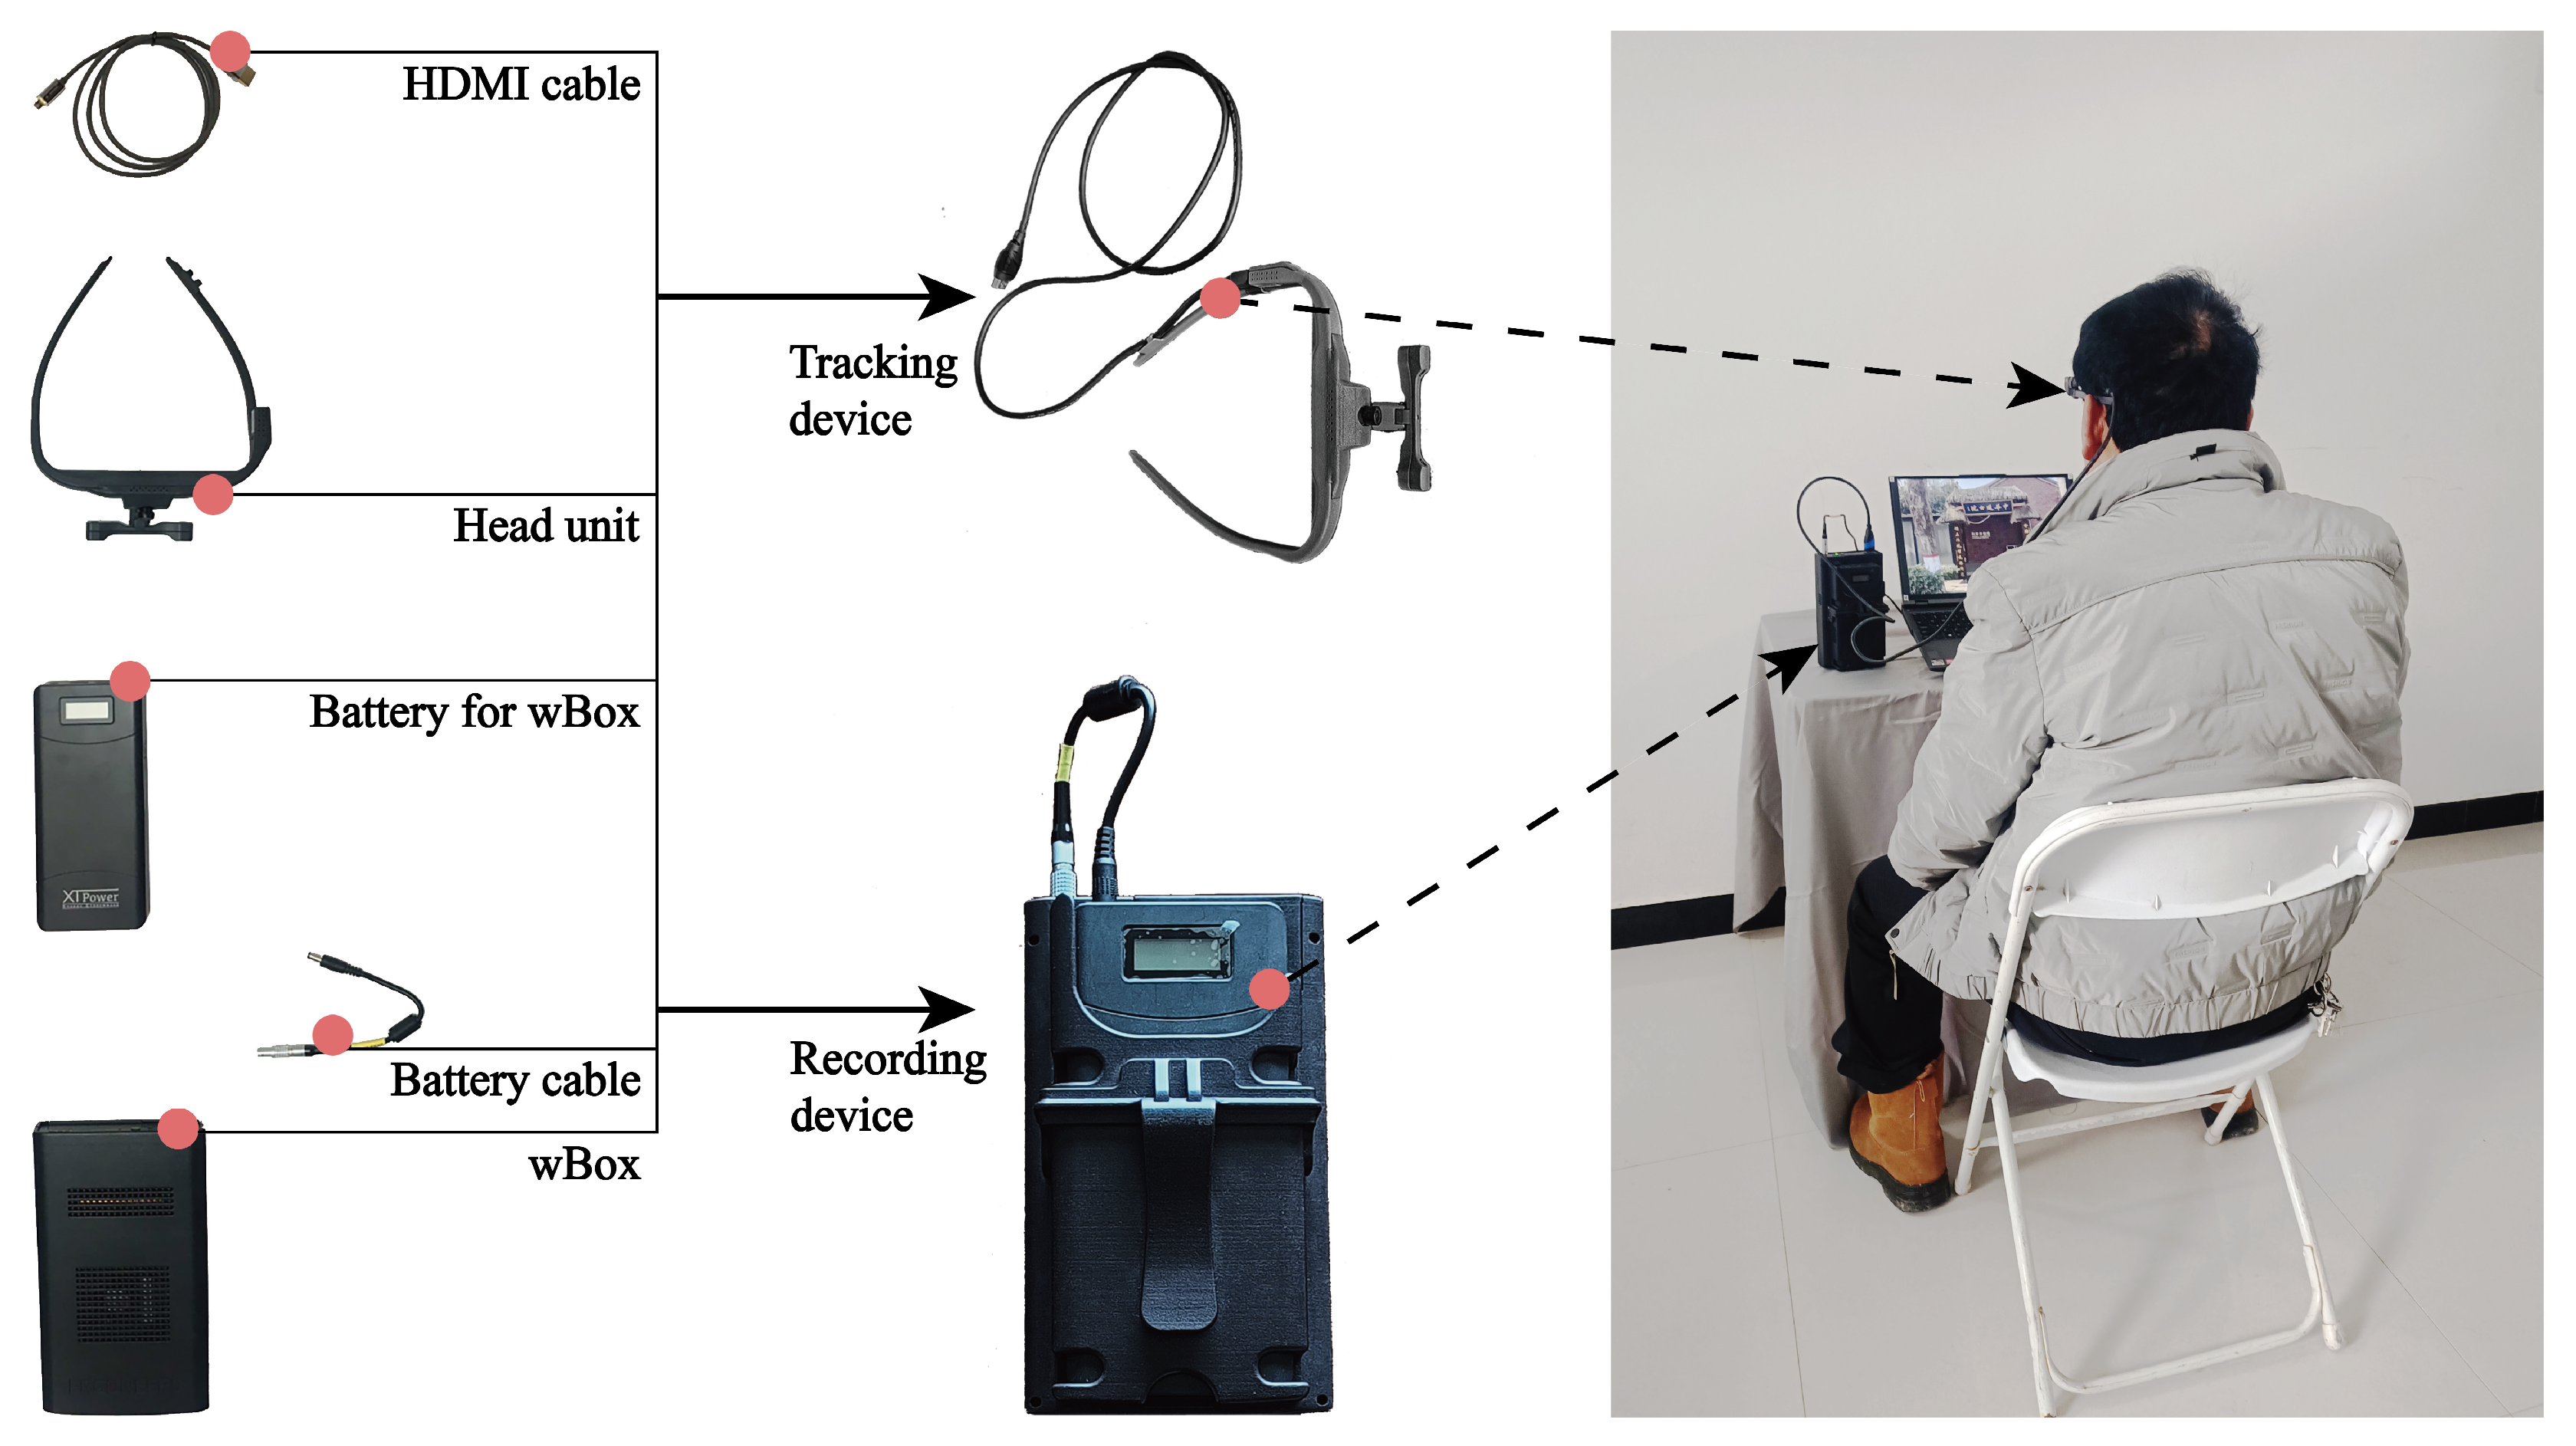
A Dikablis Glasses 3.0 eye tracking device was used as an eye tracking recognition instrument in the experiment, and a Lenovo Savior R9000P Laptop with a 16-inch screen was used as the experimental photo playback device. The experiment was conducted in a quiet and soft indoor environment, with an indoor temperature of about 23 degrees Celsius and an air humidity between 50–60%. Meanwhile, the background of the entire laboratory was white, and a light gray lining was laid on the desktop where the instruments were placed to control variables and reduce the impact of irrelevant factors on the experiment. Additionally, to avoid the influence of the first cause effect on the experimental results, participants were not allowed to preview the experimental photos in advance before the experiment. Further, due to the height, weight, and facial bone size variance in each subject, the height of the seat, the size of the nose pad, and the lens of the eye tracker needed to be adjusted to find the best position for each subject before the experiment began (Figure 3 for details).

2.2.4. Process of Eye Movement Experiment

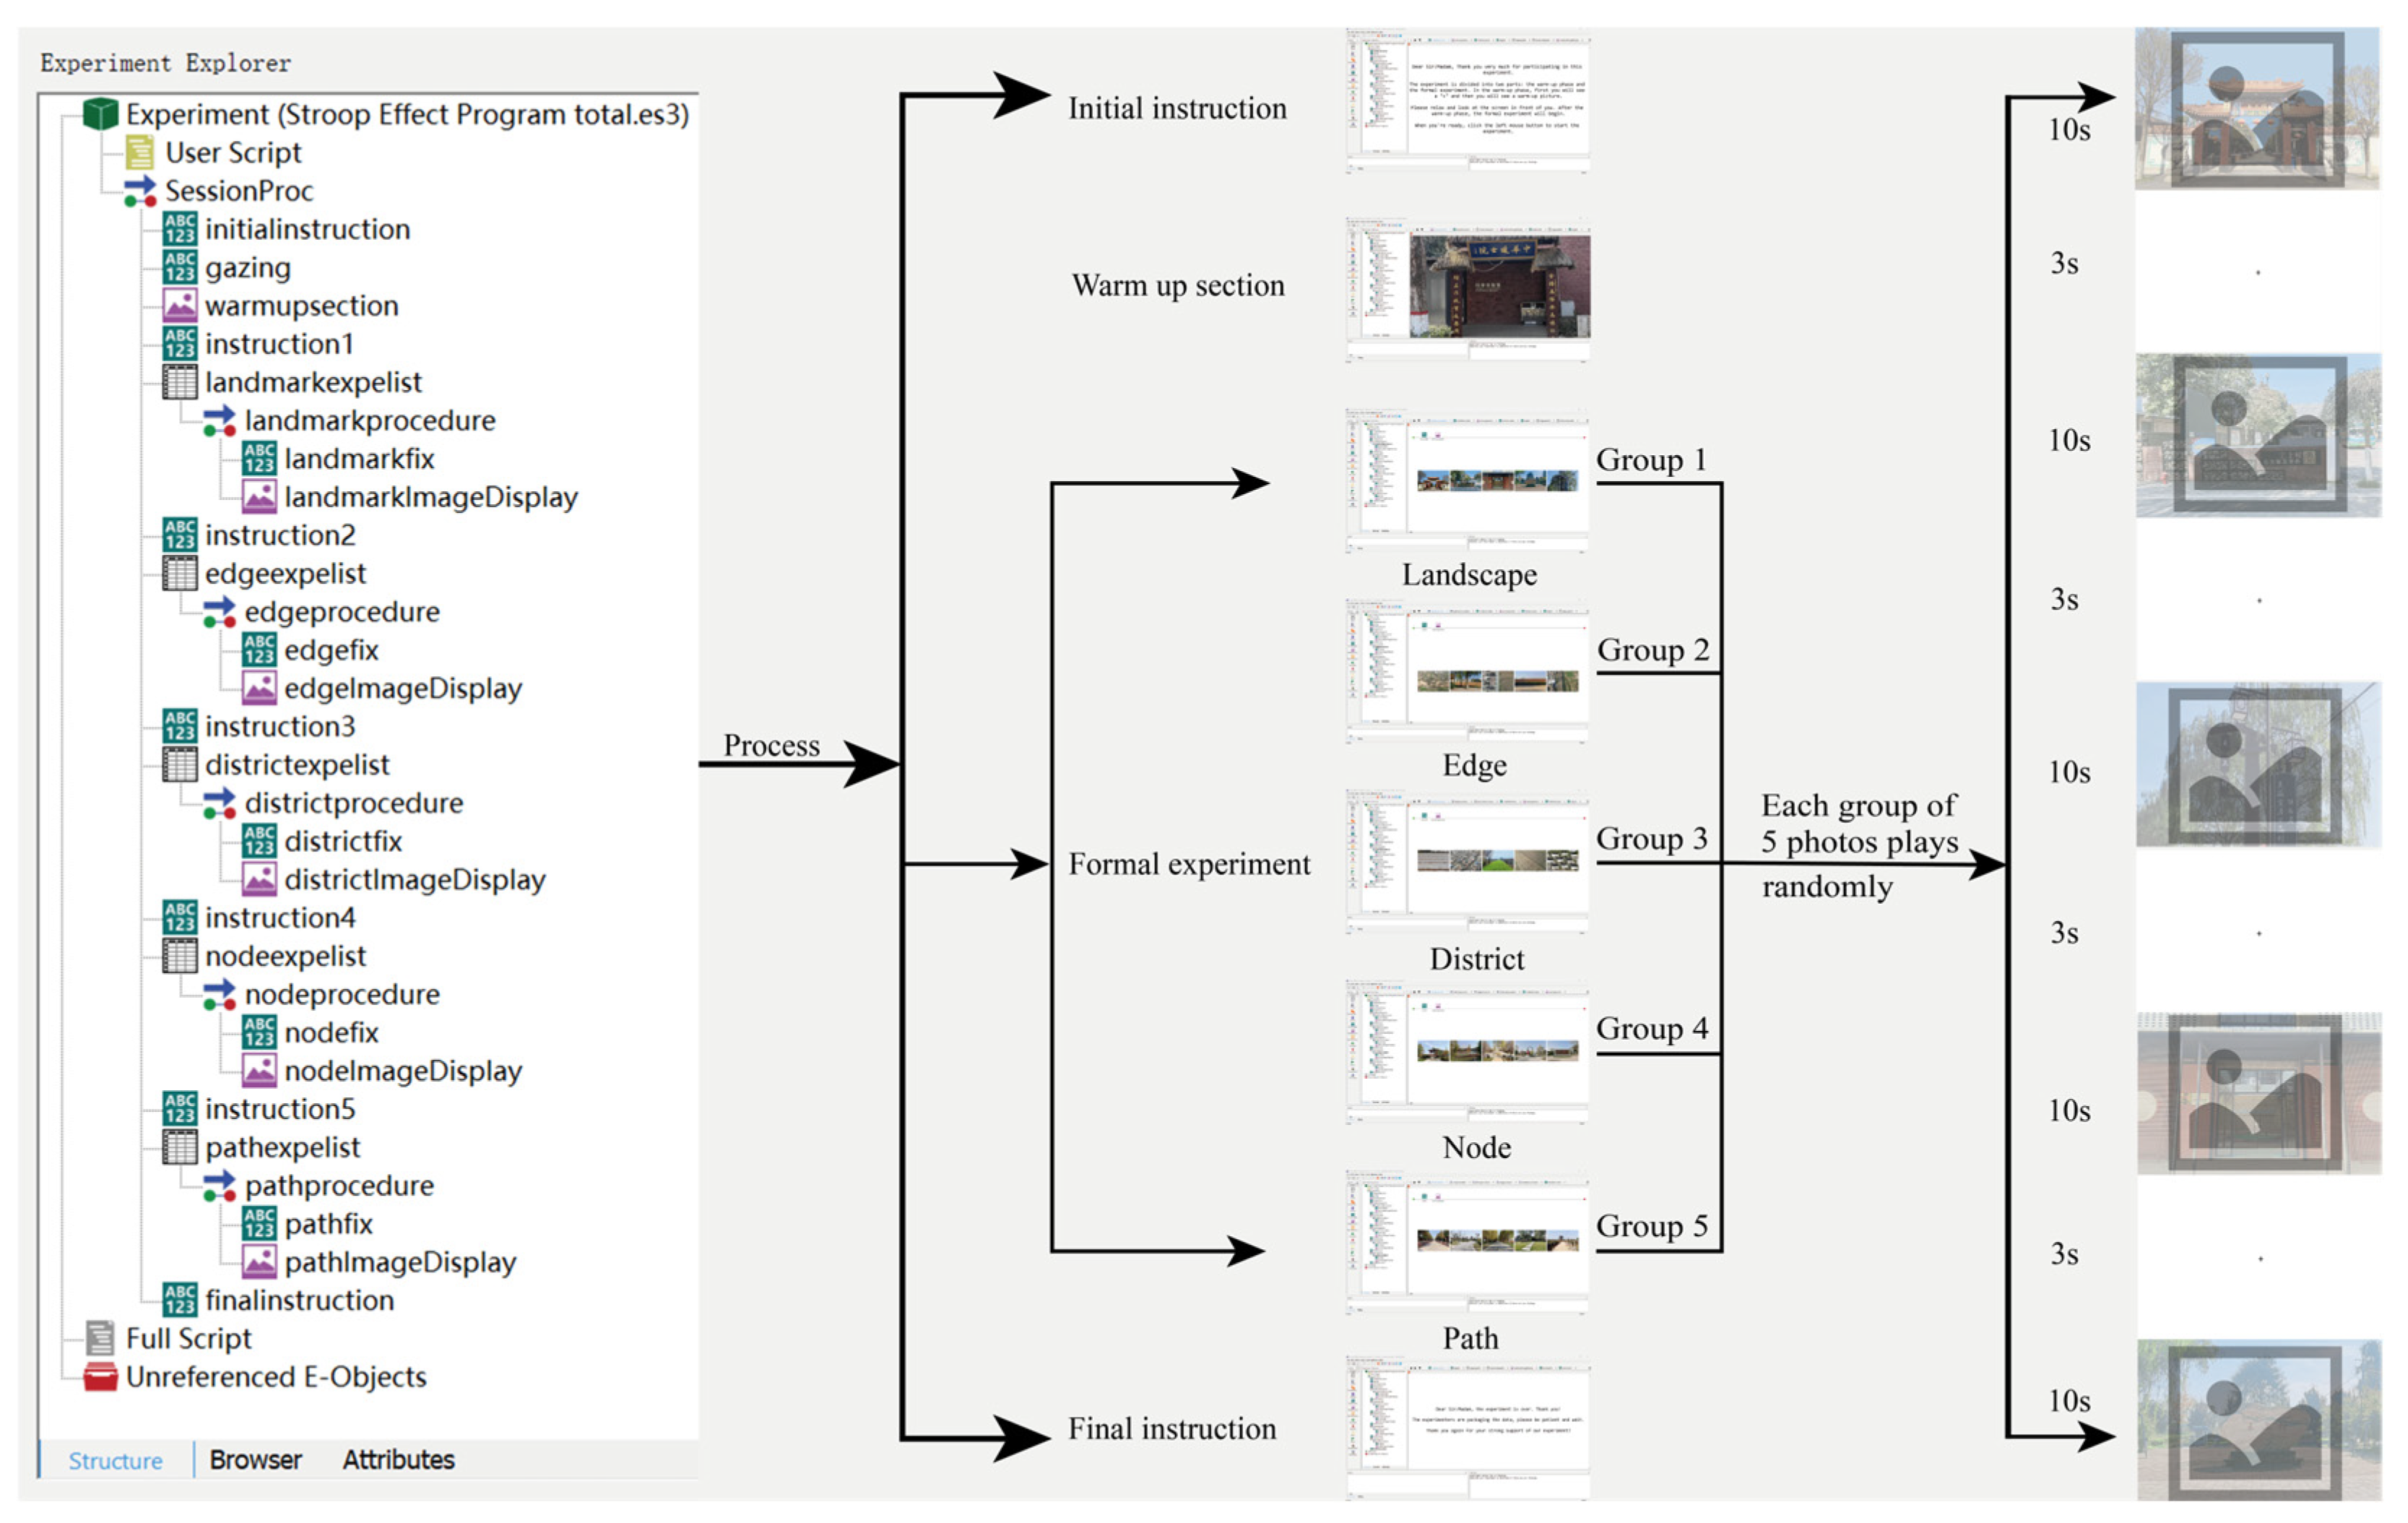
The entire eye movement experiment process was divided into two parts: the warm-up stage and the formal experiment, which took a total of 10 min. To begin with, subjects were led to sit about 50 cm in front of the computer screen [26]. Next, the experimenters assisted the subjects in putting on the eye tracking device and calibrating various parameters, and then guided the subjects to play the warm-up pictures on their own based on their preparation. Last, after successful completion of the warm-up phase, the subjects were guided to complete formal experiment independently.
Our study used E-Prime 3.0.3.9 software to set up the eye movement experiment process. Firstly, the starting instructions for the experiment were set up to ensure that the subjects completed the eye movement experiment correctly according to the process. Secondly, a warm-up section was prepared to help subjects quickly enter the experimental state and master specific experimental operations. Thirdly, 25 formal experimental photos were grouped and encoded, based on 5 types of rural landscape cognitive elements, and the photo screening order was set to random playback to avoid subjective interference. Each photo was played for 10 s with a 3 s gray screen interval [32], with a total playback time of about 6 min. Finally, the termination instructions for the experiment were set up (see Figure 4 for details).

2.2.5. Data Handling of Eye Movement Experiment

The minimum fixation time threshold was set to 300 ms in D-LAB 3.71 software, and the experimental data were processed to obtain indicators, such as the number of fixation points and fixation time, for each subject when viewing each photo. By using the gaze mapping function of the software, the eye movement heatmaps generated by each subject while viewing the experimental photos could be obtained [32]. This research first used Microsoft Excel 2021 for statistical processing of the obtained data, and then used Spss27.0 software for statistical analysis of the obtained data. The data analysis was mainly divided into the following four parts:
First, the Mann–Whitney U test in SPSS was applied to conduct inter-group difference analysis on the eye movement data of all participants. Based on the p-value analysis, significant differences were observed between the two groups in the average number of fixation points and average fixation time of the overall rural landscape cognitive element photos.
Second, using the Mann–Whitney U test in SPSS again, the significant differences between the two groups of subjects in the five types of rural landscape cognitive element photos were analyzed. The p-values and z-values between each group were compared to analyze whether there was a significant difference in the average number of fixation points and average fixation time between the two groups of subjects.
Third, for the five landscape cognitive elements divided in the experiment, the Kruskal–Wallis H-test was applied to analyze the intra-group differences between the two groups of subjects. It was analyzed whether there was a significant difference in the average number of fixation points and average fixation time of the five elements of rural landscape cognition photos between the two groups of subjects according to the M value, SD value, and p-value.
Last, the five types of landscape cognitive elements were paired and the Mann–Whitney U test in SPSS was used to analyze the intra-group differences between the two groups of subjects. Based on the p-value analysis, significant differences were identified between which types of landscape cognitive elements existed and whether the two groups of subjects had the ability to distinguish different types of rural landscapes in their viewing behavior.

2.3. Semi-Structured Interviews

2.3.1. Process of Semi-Structured Interviews

Semi-structured interviews were promptly initiated with the participants after the successful completion of the eye-tracking experiments. In this phase, the experimenter first presented five sets of experimental images, including landmarks, edges, districts, nodes, and paths, as visual prompts in front of the subjects. Then, based on the interview outline (Appendix A for details) for rural landscape cognition, the experimenter engaged in a dialogue with the subjects to guide them to clearly articulate their true feelings about these 25 photos. During the interview, participants were asked to describe their viewing sequence of the rural landscapes depicted in each photo while viewing the photos and to highlight the key elements of interest in each photo. The entire interview process was recorded using the Saramonia 1.1.0 recording software.
The aim of semi-structured interviews is to further elucidate the subjective experiences and viewpoints of the subjects, thereby providing a more comprehensive explanation and supplementation to the experimental outcomes. The primary objective of conducting semi-structured interviews after eye-tracking experiments is to gain an in-depth understanding of the subjective experiences of participants during the experimental process, reveal the preferences and cognitive patterns of subjects towards different landscape imagery elements, and make the research results highly reliable. This mode of communication not only facilitates the free flow of information but also ensures that the interview content closely aligns with the subjects’ authentic experiences and understandings.

2.3.2. Data Handling of Semi-Structured Interview

Interview record data were imported into the ROST-CM6 6.0 software for word segmentation, and the word frequency of each keyword was classified and counted. After manual verification, synonyms were grouped, such as “convenient and convenience”, “clean, neat, and tidy”, “location, site, and position”, etc. Next, the top 50% of the most frequent words in each category were used to construct a high-frequency word co-occurrence matrix. Finally, the high-frequency word co-occurrence matrix was imported into the Gephi 0.9.2 software to generate a high-frequency word co-occurrence network diagram.

3. Results

3.1. Analysis of Eye Movement Indicators

3.1.1. Analysis of Inter-Group Differences

An inter-group difference analysis was conducted on the 77 eye movement index data samples obtained from the experiment between the two subjects, firstly. After discarding two samples with invalid data and three samples with insufficient eye tracking data capture, seventy-two valid samples were obtained, with thirty-six for the tourist group and thirty-six for the resident group. The average number of fixation points refers to the average of the fixation points each subject placed on each photo, which can intuitively reflect whether the subject’s gaze was locked onto a specific object [33]. The average fixation time refers to the average length of time the subject stayed at each fixation point. The longer the average fixation time, the more difficult or attractive the information in the image was to interpret, accompanied by emotional arousal related to physical practice [34].
This research then applied the Mann–Whitney U test in SPSS to conduct a significant difference analysis between two groups of participants on the average number of fixation points and average fixation time of the overall rural landscape cognitive element photos. The test results are shown in Table 1. Meanwhile, to ascertain which among the five rural landscape cognitive elements—”landmarks”, “boundaries”, “districts”, “nodes”, and “paths”—elicited the most significant differences in perception between tourists and residents, the present study conducted a comparative analysis of the average fixation count and average fixation duration for each element separately across the two groups of participants. The test results are shown in Table 2.
According to the analysis of eye movement data in Table 1, there is no significant difference in the average number of fixation points (visual interest points) between the two groups of subjects regarding the overall rural landscape cognitive elements, but there is a significant difference (p < 0.01) in the average fixation time (visual processing time).
In the light of the analysis of eye movement data in Table 2, there is a significant difference (p < 0.01) in the average fixation time between the two groups of subjects for the 5 types of rural landscape cognitive element photos, while there is no significant difference in the average fixation point. In addition, it is worth noting that the two groups of subjects spent the highest average fixation time on landmarks and the lowest average fixation time on edges. This demonstrates that compared to the other four cognitive elements of rural landscapes, landmarks have more distinct visual features and are more likely to be a visual focus in rural landscapes.

3.1.2. Analysis of Intra-Group Differences

Intra-group difference analysis was performed on the two groups of subjects based on the five landscape cognitive elements divided. The Kruskal–Wallis H-test was applied to investigate the visual behavioral characteristics of subjects in the same group towards photos of different types of rural landscape elements. The average number of fixation points and average fixation time of the two groups of subjects were analyzed for significant differences within the group.
According to the analysis results of the eye movement data in Table 3, participants in the tourist group showed no significant difference in the average number of fixation points and average fixation time when observing the cognitive elements of 5 types of rural landscapes separately. This indicates that the participants in the tourist group had relatively consistent visual behaviors in terms of cognitive level and attention allocation towards different types of rural landscape elements. However, participants in the villager group showed significant differences in average fixation time (p < 0.05), except for the lack of significant differences in their average fixation points. This indicates that the participants in the village group had inconsistent visual behaviors in terms of cognitive level and attention allocation towards different types of rural landscape elements, thus investing more attention and time in viewing these landscape elements.
To explore which types of rural landscape cognitive elements this significant difference exists in, this study once again applied the Kruskal–Wallis H test in SPSS to further analyze the pairwise comparison results of five rural landscape cognitive elements within the two groups of subjects. In the light of the analysis of the eye movement data in Table 4, the participants in the tourist group only showed significant differences in the average number of fixation points on landmarks and edges. However, the participants in the villager group showed significant differences (p < 0.05) in average fixation time between landmarks and edges, landmarks and nodes, and districts and nodes. This result, showing significant differences in mean fixation times for different types of landscape elements or regions in eye movement experiments, revealed a selective attention mechanism during visual cognition. If tourists and villagers fixate on a certain type of landscape elements or areas significantly longer than others, they have higher cognitive interest and discriminatory ability for such elements or areas. Therefore, this demonstrates that, compared to the tourist group participants, the villager group participants are more able to distinguish different types of rural landscapes in terms of viewing behavior.

3.2. Analysis of Eye Movement Heat Maps

Eye-tracking data refers to the ocular movement information directly recorded by eye-tracking devices which possesses a high accuracy and objectivity, enabling an exact reflection of the subjects’ eye movements during the observation of stimulus materials. However, eye-tracking heatmaps are visual images derived from complex eye-tracking data through color coding by eye-tracking devices. These heatmaps enable researchers to directly observe the visual interest points of subjects and the distribution situation of attention on stimulus materials [35]. Therefore, to further explore the specific landscape cognitive elements that the two groups of participants are interested in, this study applies eye tracking heat maps for a more intuitive analysis.
The intensity of colors in the eye-tracking heatmap not only maps the intensity level of the subjects’ gaze during the observation of specific images or stimulus materials, but also profoundly reflects the length of their average fixation time and the degree of interest they have towards these areas [34]. In the research on eye-tracking heatmaps, the red region is used to represent the key focus areas of the subjects, which are the parts that have attracted the attention of subjects for a long time and have a high level of interest. Conversely, the yellow region represents moderate attention, while the green region signifies lesser attention [36].
By analyzing the eye movement heat maps of the two groups of participants on images of the five types of rural landscapes (Figure 5 for details), the specific cognitive differences between tourists and residents are obtained as follows:
The participants in the villager group, when looking at landmarks, had a more dispersed view, and their observation method was mostly scanning. The villagers mainly focused their attention on objects in the surrounding environment where various landmarks were located, such as stone lions, street lamps, platform foundations, war drums, signs, and roadside trees. Compared with the participants in the villager group, the participants in the tourist group had a more focused gaze when viewing landmarks, and their observation method was mainly gazing. A great many tourists focused on a special part of the landmark itself, such as the roof of the memorial archway, the plaque of the service center, or the words of the landmark landscape stone.
When viewing edges, the observation manner of the villager group of participants was mostly scanning, and their visual range was relatively wide. The villagers did not pay high attention to the edges, and their focus was mostly scattered on the geographical location, surrounding environment, and hardware facilities where the boundaries were located. Compared to the participants in the villager group, the observation method of the participants in the tourist group was mainly gazing, and the visual range was relatively small. Most tourists concentrated their attention on the surface of various edges, such as fences, rivers, roads, hedges, or the cross-section of a cliff wall.
The participants in the village group had a more scattered view when looking at districts, and the observation means was mostly scanning. Most of the villagers’ attention points were dispersed in various places in the photos, such as the surrounding environment of farmland, the rough appearance of residential areas, the overall layout of homestays, etc. Unlike the participants in the villager group, the participants in the tourist group had a more focused gaze when viewing districts, and their observation method was mainly gazing. Many tourists concentrated their attention on a specific part of the districts, such as a unique building in a residential area, the color of plants planted in crop growing areas, materials used in economic crop growing areas, climbing frames in kiwifruit growing areas, or the shape of individual buildings in homestays.
When observing nodes, the observation method of the participants in the villager group was mainly scanning, and their vision was relatively scattered. The villagers’ attention points were mostly scattered on the plaques of pavilions, the shapes of sculptures, the materials of buildings, the carving content of scenic walls, various entertainment facilities, the size of the water body area, and the wooden boardwalks around the water body. Differently from the participants in the villager group, the observation method of the participants in the tourist group was mainly gazing, and their gaze was more concentrated. Numerous tourists focused their attention on the unique individual components inside each node square, such as pavilions, sculptures, tree pools, table tennis tables, water bodies, vegetation, venue paving, etc.
The observation manner of the participants in the villager group was mainly scanning, supplemented by staring, and their vision was relatively scattered, when viewing paths. Most of the villagers’ attention points were decentralized around the surrounding environment on both sides of the road, such as flower beds, street lamps, roadside trees, plant shapes, residential buildings, and other facilities. Compared with the participants in the village group, the participants in the tourist group observed the path mainly through gaze, supplemented by scanning, and had a more focused gaze. A lot of tourists focused their attention on the surface of each road or various landscape elements at the end of the path.

3.3. Analysis of Semi-Structured Interviews

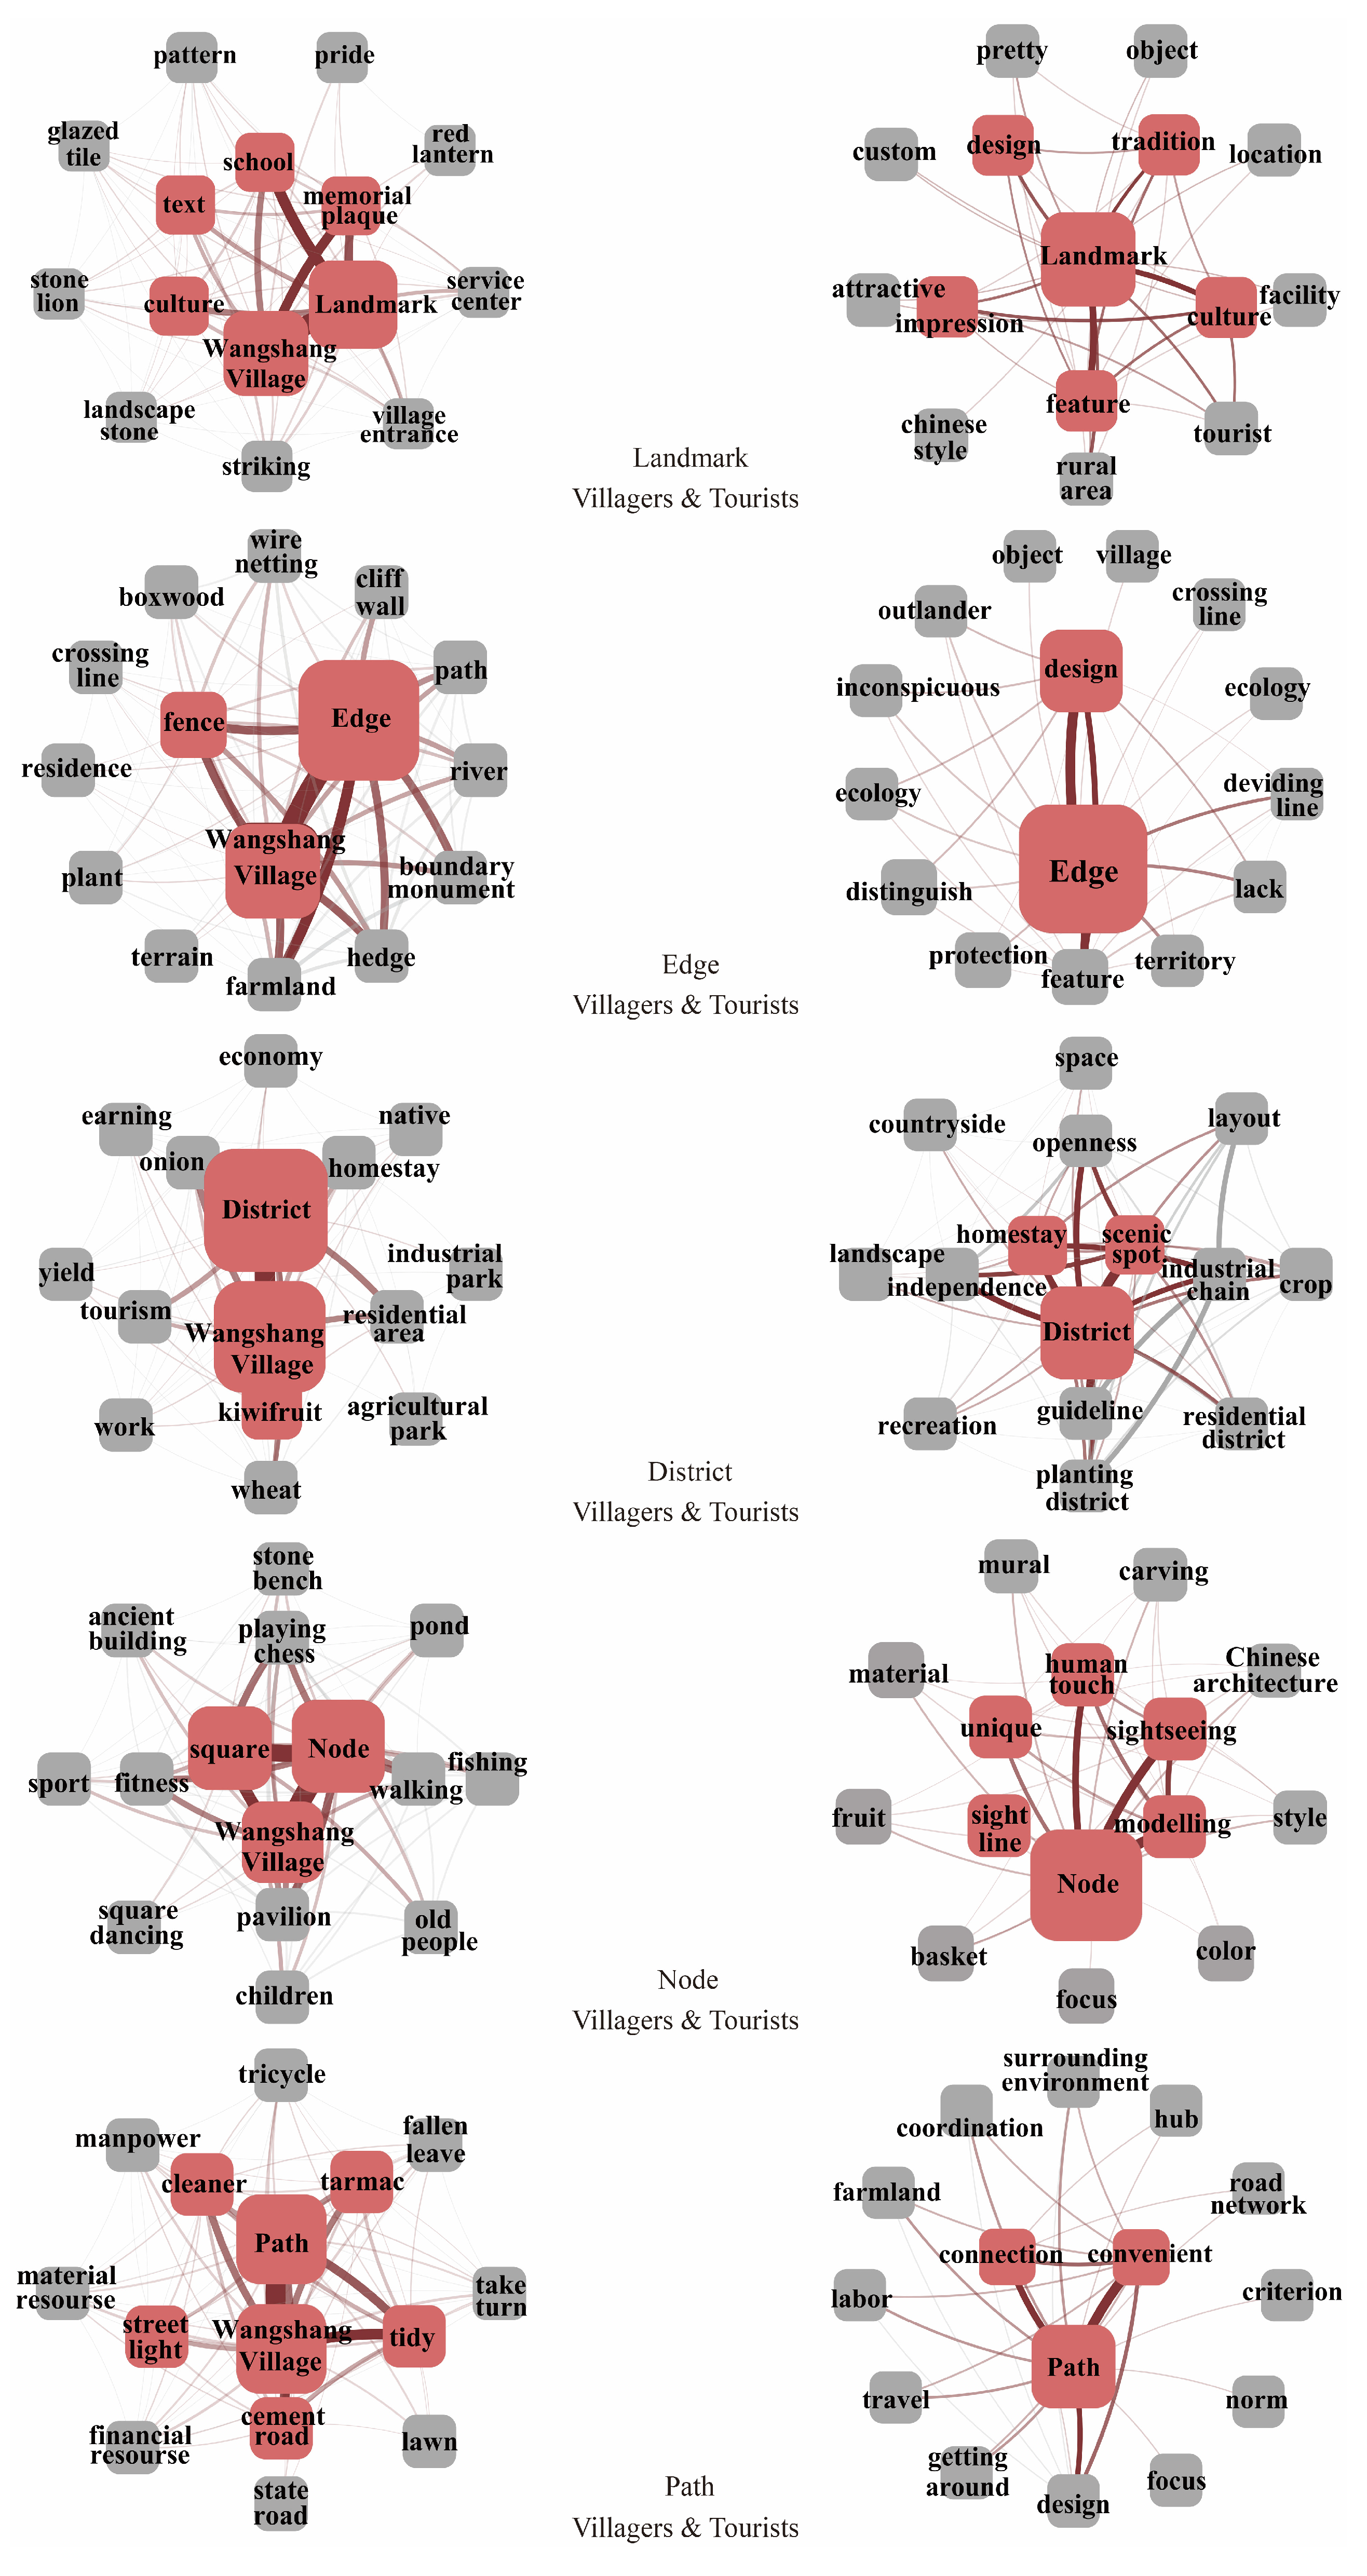
To ensure the reliability and authenticity of the eye movement experiment results, and to provide more detailed supplementary explanations for the experimental results, this study, based on quantitative eye movement experiment analysis, also used qualitative semi-structured interviews to analyze the subjective evaluations of the two groups of participants on the five types of rural landscape image elements: landmarks, edges, districts, nodes, and paths. A total of 72 valid interview record texts were obtained, with 36 for the tourist group and 36 for the resident group. The interview record data were imported into the ROST-CM6 software for word segmentation processing, and word frequency was classified and counted. Finally, 10 high-frequency word co-occurrence network diagrams were generated by importing the data into the Gephi 0.9.2 software (Figure 6 for details).
(1)
Landmarks. The evaluation of the participants in the village group primarily revolved around Wangshang Village and the landmarks in the village, with a closely connected network of high-frequency words. Their key elements of focus were centered on objects within the immediate surroundings of each landmark, such as stone lions, streetlights, pedestals, war drums, signboards, and roadside trees. Approximately 80% of the participants shared numerous anecdotes during interviews that were related to their living memories. However, the evaluations of the participants in the tourist group revolved around the advantages and disadvantages of each landmark design, and the network formed between high-frequency words is relatively scattered. Their key elements of focus were mainly concentrated on a particular special component of each landmark, such as the roof of an archway, the plaque of the service center, or the inscriptions on landmark landscaping stones. Most tourists made evaluations based on local characteristics, personal experiences, cultural aesthetics, and other factors, and their comments were primarily related to local folklore, culture, traditions, as well as their initial impressions of Wangshang Village.
(2)
Edges. The evaluation of edges by the participants in the village group mainly revolved around their understanding and perception of the edges, with a relatively close network of high-frequency words. Their key elements of focus were scattered across the geographical locations, surrounding environments, and hardware facilities of the boundaries, and the evaluation dimensions were often related to the materials, locations, and shape characteristics of each edge. The evaluation of the participants in the tourist group centered on the recognizability of the edges, with a similarly close network of high-frequency words. Their key elements of focus were mostly on the appearance of each edge, such as fences, rivers, roads, hedges, or cliff faces. Most tourists evaluate the design of the edges from a critical perspective, with evaluation dimensions primarily encompassing the clarity, physical function, and potential design improvements for these edges.
(3)
Districts. The evaluation of the districts by the participants in the village group mainly revolved around the crops and several economic crop planting areas around the living area, with a relatively dispersed network of high-frequency words. Their key elements of focus were scattered across various locations within the kiwifruit-, onion-, and wheat-planting areas, and the evaluation dimensions were often linked to economic benefits. However, the evaluation of the districts by the tourist group participants mainly revolved around the characteristics and functions of the district, and the high-frequency word network is relatively scattered. Their primary focus tended to concentrate on specific aspects within the regions, such as a unique building within the residential area, the color of plants grown in the agricultural planting area, the materials used in the economic crop planting area, the trellises in the kiwifruit-planting area, or the shape of individual buildings in the homestay area. In addition, most tourists pointed out the dilemma of Wangshang Village lacking an industrial chain, and the evaluation dimensions were related to their suggestions for future design improvements.
(4)
Nodes. The evaluation of nodes by the participants in the village group mainly revolved around the node square within Wangshang Village, with a closely connected network of high-frequency words. Their key elements of focus were widely distributed across the plaque inscriptions on pavilions, the engravings on scenic walls, the size of water bodies, and the wooden walkways surrounding them. The evaluation dimensions were mostly related to the daily activities and habits of the local people. In addition, most middle-aged and elderly villagers raised demands for the maintenance and updating of related activity facilities. Compared with the participants in the village group, the evaluation of the tourist group participants mainly revolved around the styling characteristics of each node, and the high-frequency words also form a close network. Their attention was primarily concentrated on the distinctive individual components within each node plaza, such as pavilions, sculptures, tree pools, table tennis tables, water bodies, vegetation, or paving materials. The evaluation dimensions were mostly related to the advantages and disadvantages of node design, as well as subsequent design improvement suggestions.
(5)
Paths. The evaluation of paths by participants in the village group mainly revolved around the type, cleanliness, and daily habits of the paths, with a particularly tight network of high-frequency words. Their key elements of focus were widely dispersed across the surrounding environments on both sides of the roads, such as flower beds, streetlights, roadside trees, plant designs, residential buildings, and other facilities. Approximately 90% of villagers believed that compared to previous roads, the practicality and functionality of the various roads in the village had significantly improved. In contrast, the evaluation of the paths by the tourist group participants mainly revolved around the design, improvement, and enhancement measures of the paths themselves. Their main attention was often centered on the surface of each road or the various landscape elements at the end of the road, and the network formed between high-frequency words is relatively scattered.

4. Discussion

A landscape is a product of the interaction between humans and the natural environment [37]. Previous studies have shown that people exhibit different visual behaviors when observing different types of landscape spaces [38]. Our research once again confirms this conclusion. In recent years, although various public participation methods have been widely used in the research process of rural landscapes, the cognitive results of human beings towards rural landscapes still cannot be accurately quantitatively analyzed, and an updated and more comprehensive research method is still needed [39]. Vision is one of the most effective and primary ways for people to obtain information [40]. In the cognitive process, eye tracking technology is a useful tool for analyzing people’s observations of landscapes which can help designers study the types of landscape elements that can most attract the attention of participants, and thus help designers better design landscape spaces [41]. This study used eye tracking technology to compare the cognitive differences between tourist and resident groups. The experimental results showed that there was no significant difference between the two groups in the average number of fixation points for the overall rural landscape cognitive elements, but there was a significant difference in the average fixation time [32]. Our research findings are similar to those of Malan’s study. However, the difference between the results of our research and those of Ma et al. lies in the fact that after using the Kruskal–Wallis H test to analyze the intra-group significant differences between the two groups of subjects, we found that there was no significant difference in the average number of fixation points and average fixation time for the five rural landscape cognitive elements among the tourist group of subjects. In contrast, there was a significant difference in average fixation time among the participants in the village group, but no significant difference in the average fixation points. This result may be due to the living background of the subjects, since a lot of studies have shown significant cognitive differences among different groups of subjects regarding the existence of rural landscapes. For example, some researchers have found that cognitive differences can have different outcomes with age [42]. Other studies have also shown that there are significant cognitive differences among subjects from different social classes, professions, and cultural backgrounds [43].
In this study, the quantitative eye-tracking experimental data reveal that the cognitive differences between the tourist and villager participants primarily manifested in the average fixation duration, with tourists exhibiting the longest average fixation time, indicating a stronger interest and exploration desire towards the depicted rural landscape image elements. Furthermore, integrating the results of semi-structured interviews, we observe that villagers predominantly employed scanning patterns when viewing the five types of rural landscape image elements, displaying a more dispersed gaze and focusing their fixations primarily on the surrounding environments of these elements. Conversely, tourists adopted a gazing strategy, directing their more concentrated attention towards the specific components of each image element. The most noteworthy element is that we found that the key focus elements of the subjects recorded in the eye movement heat maps were strongly consistent with the key focus elements recorded in the high-frequency word co-occurrence network diagrams, which can be seen after carefully observing Figure 5 and Figure 6 and comprehensively analyzing the key focal elements of each photo captured in the eye movement experiment with those recorded in the semi-structured interview. From this, although quantitative analysis (eye tracking technology) and qualitative analysis (semi-structured interviews) are two different types of research method, the results of these two studies have a high degree of overlap.
By combining the results of eye tracking experiments with semi-structured interviews for comprehensive analysis, we found that the main reasons for these cognitive differences were due to the different living backgrounds of the subjects, as well as their familiarity, novelty, and personal needs towards rural landscapes. Specifically, villagers, being long-term residents of rural environments, possess a high degree of familiarity with the landscapes, thereby easily diverting their attention across a broader range of environmental elements. They prioritize the convenience and practicality of landscape facilities, linking their concerns closely to their daily lives, such as the functionality of amenities, crop cultivation, and road cleanliness. These elements not only reflect rural economic benefits and living standards but also embody the collective memories and cultural identities of villagers. In contrast, tourists, as outsiders, harbor a heightened sense of novelty and curiosity towards local rural landscapes, tending to focus on their uniqueness and design details. Unfamiliar with the local environment, tourists require more cognitive effort and time to comprehend and process the information, as evidenced by their longer average fixation durations, which reflect their efforts to assimilate and integrate new information. By gazing intently at specific components, tourists delve deeper into the cultural connotations and design philosophies of local landscapes, evaluating their merits, flaws, and design features based on personal experiences and aesthetic preferences, which are primarily driven by these preferences.
Moreover, the needs of tourists mainly focus on tourism experiences and cultural exploration, prompting them to deepen their understanding and appreciation of rural cultures through focused gazes on specific components. Therefore, tourists are more sensitive to landscape recognizability, design sensibility, and cultural implications. In contrast, the needs of villagers are more intertwined with daily life and economic development, emphasizing landscape practicality and functionality, like road capacity and crop yields. These differing needs and cognitive motivations underlie the cognitive disparities observed between the two participant groups in their perception of rural landscapes. These findings have filled the previously unexplored research gap that has not yet been explored regarding the similarities and differences in rural landscape cognition between tourists and villagers. Our research provides theoretical guidance for rural tourism construction; that is, when designing tourism products and planning rural landscapes, the different needs and preferences of tourists and residents should be fully considered to achieve more accurate and effective market positioning and resource allocation. At the same time, our study also provides specific methodological support for rural tourism construction, and this innovative approach provides new perspectives and tools for rural tourism research.
Compared with structured interviews that are often used to verify people’s behavior, views, beliefs, values, etc., at any specific moment, the purpose of semi-structured interviews is to gain a deeper understanding of how people give meaning to their own world in social interactions [24]. For example, Muro et al. identified social, natural, and perceptual elements through semi-structured interviews which have been shown to play a relevant role in the happiness of local people [44]. For another example, Johnson et al. conducted a study on the green space benefits of Prospect Park in Brooklyn, New York City. They evaluated and measured the cultural ecosystem services of the park through semi-structured interviews, ultimately proving that text-based social media content can be used to stimulate the existence and richness of cultural ecosystem services in urban parks [45]. Thus, our research provides a more detailed supplementary explanation of the experimental results using qualitative semi-structural interviews based on the eye tracking experiments. Furthermore, during the experiment, we have also found that using semi-structured interviews to collect subjective evaluations of the five types of rural landscape cognitive elements from participants not only closely related to the theme, but was also able to uncover deeper levels of information. Therefore, we once again confirm the significant advantages of semi-structured interviews in data collection. Further, we are also cognizant of the potential added value of combining structured and semi-structured questionnaires. In future research, we will consider adopting this approach to further optimize our data collection and analysis processes. For instance, we could initially use structured questionnaires to guide subjects towards clear categorization, ensuring more consistent data, and subsequently employ semi-structured questionnaires for deeper exploration, yielding more detailed and specific information.
Additionally, incorporating aerial photographs into our experimental design was deliberate, given the limitations of the human perspective in fully capturing Wangshang Village’s boundaries and regional integrity. More importantly, our research aims to explore cognitive differences among different groups towards landscape types. The crux of our experiment lies in comparing and analyzing the cognitive differences generated by the same experimental photographs among distinct subject populations. Our team took the feedback from participants, particularly local villagers, seriously during the preliminary experiment period and integrated expert opinions from the relevant field to make scientifically reasonable adjustments to the experimental materials. These adjustments aimed to ensure the objectivity and representativeness of the experimental data while respecting and embodying the cultural characteristics and regional identities of the study subject. In the future, we will delve deeper into the impact of different photographic perspectives on the cognitive differences among various subject groups. We believe that through these efforts, we can more effectively assess subjects’ cognitive differences under different perspectives, providing solid data support for subsequent academic research and practical applications.

5. Conclusions

Cognitive differences are not only a reflection of the unique fascination of rural landscapes, but also a key factor in promoting sustainable development in rural areas. This research takes two types of subjects, villagers and tourists, as an entry point. Wangshang Village, located in Yangling District, Xianyang City, Shaanxi Province, China, is selected as the experimental site. Using quantitative eye tracking technology and qualitative semi-structured interviews, the cognitive differences of 40 villagers and 37 tourists when viewing 5 types of rural landscape elements were comparatively analyzed. Research findings indicate that the cognitive similarities and differences in rural landscape viewing between tourists and villagers are mainly reflected in their level of cognition, observation methods, and key elements of focus. The reasons for these cognitive differences are due to the different living backgrounds of the two groups of subjects, as well as their varying levels of familiarity, novelty, and personal needs towards rural landscapes.
The resulting findings not only provide theoretical and methodological support for rural landscape design, but also provide new perspectives and insights to address the issue of homogenization in rural landscapes. However, our research also has limitations that need to be addressed in the future. Although eye tracking experiments provide a scientific and objective quantitative way to study the cognitive differences among different participants in rural landscape cognition, eye tracking technology fail to directly explain the physiological mechanisms of information processing currently. Physiological sensor technology can provide feedback and record physiological data of subjects, such as skin conductance response, heart rate variability, EEG indicators, etc. Therefore, in the future, we will attempt a research method that combines eye tracking technology with physiological sensor technology and select multiple plots containing different rural landscape characteristics for comparative testing to improve the credibility of the research, thereby further improving the research system of rural landscape cognition.

Author Contributions

Conceptualization, Y.W. and K.L.; methodology, K.L.; software, T.H.; validation, Y.W., K.L. and J.L.; formal analysis, Y.W.; investigation, Y.W.; resources, K.L.; data curation, J.L.; writing—original draft preparation, Y.W.; writing—review and editing, Y.W.; visualization, Z.Z.; supervision, K.L.; project administration, Y.W.; funding acquisition, K.L. All authors have read and agreed to the published version of the manuscript.

Funding

This research was funded by the Northwest A&F University College Student Innovation and Entrepreneurship Project (202402460A4), the Northwest A&F University Doctoral Research Start-up Funding Project (2452024010), and the Construction and Revitalization of Qinling Ancient Road Cultural Heritage Corridor Project (24YJC760061).

Data Availability Statement

The data that support the findings of this study are available from the corresponding authors upon reasonable request.

Acknowledgments

The author would like to thank Gou Ge for his strong support and generous help. At the same time, I am highly grateful to the reviewers for their constructive feedback and valuable comments.

Conflicts of Interest

The author declares that the research was conducted in the absence of any commercial or financial relationships that could be construed as a potential conflict of interest.

Appendix A

Core questions discussed during semi-structured interviews with participants:
(1)
Dear Sir/Madam, thank you very much for participating in this experiment. During the experiment just now, which part did you pay the most attention to when observing each of the 5 landmarks photos? What aspects are most attractive to you? What elements require more time for you to observe? What is the viewing order of landscape elements in each photo? Please describe in detail. What is your opinion on the landmark design of Wangshang Village? Do you have any improvement suggestions?
(2)
During the experiment just now, which part did you pay the most attention to when observing each of the 5 edges photos? What aspects are most attractive to you? What elements require more time for you to observe? What is the viewing order of elements in each photo? Please describe in detail. What is your opinion on the edge design of Wangshang Village? Do you have any improvement suggestions?
(3)
During the experiment just now, which part did you pay the most attention to when observing each of the 5 districts photos? What aspects are most attractive to you? What elements require more time for you to observe? What is the viewing order of elements in each photo? Please describe in detail. What is your opinion on the district design of Wangshang Village? Do you have any improvement suggestions?
(4)
During the experiment just now, which part did you pay the most attention to when observing each of the 5 nodes photos? What aspects are most attractive to you? What elements require more time for you to observe? What is the viewing order of elements in each photo? Please describe in detail. What is your opinion on the node design of Wangshang Village? Do you have any improvement suggestions?
(5)
During the experiment just now, which part did you pay the most attention to when observing each of the 5 paths photos? What aspects are most attractive to you? What elements require more time for you to observe? What is the viewing order of elements in each photo? Please describe in detail. What is your opinion on the path design of Wangshang Village? Do you have any improvement suggestions?

References

  1. Kilos, T.; Primdahl, J.; Kristensen, L.S.; Busck, A.G. Introduction: Landscape change and rural development. Landsc. Res. 2010, 35, 571–576. [Google Scholar] [CrossRef]
  2. Liu, L.L.; Wu, R.N.; Lou, Y.R.; Luo, P.P.; Sun, Y.; He, B.; Hu, M.C.; Herath, S. Exploring the comprehensive evaluation of sustainable development in rural tourism: A perspective and method based on the AVC theory. Land 2023, 12, 1473. [Google Scholar] [CrossRef]
  3. Bartolini, F.; Vergamini, D. Introduction: Trade-offs and synergies between ecosystem services provided by different rural landscape. Agronomy 2023, 13, 997. [Google Scholar] [CrossRef]
  4. Yang, Q. Introduction: Research on the changes in cultural landscape of tourist-type traditional Chinese villages from the perspective of cultural memory: Taking Anshan Village in Chongqing as an example. Land 2023, 12, 816. [Google Scholar] [CrossRef]
  5. Xu, Z.Y. Research on the Planning and Design of Tourism Rural Landscape Trails. Master’ Thesis, Shandong Jianzhu University, Jinan, China, 2024. [Google Scholar]
  6. Zhao, Z.D. Research on Rural Tourism Landscape Planning and Design Based on Cultural Experience. Master’ Thesis, Henan Agricultural University, Zhengzhou, China, 2023. [Google Scholar] [CrossRef]
  7. Xie, H.L.; Zhu, Z.H.; He, Y.F.; Zeng, X.J.; Wen, Y.Y. Integrated framework of rural landscape research: Based on the global perspective. Landsc. Ecol. 2022, 37, 1161–1184. [Google Scholar] [CrossRef]
  8. Luo, W.B.; Lei, J.Q.; Shen, S.N.; Xu, F.X. Research on the influence mechanism of urban residents’ rural landscape cognition on tourism behavior intention. J. Hunan Fina. Econ. Univ. 2020, 36, 51–60. [Google Scholar] [CrossRef]
  9. Wang, X.C.; Luo, C.X.; Cai, W.T. Progress of Chinese Rural Landscape Characteristic System Research in Recent 20 Years. CHN Landsc. Arch. 2022, 38, 44–49. [Google Scholar] [CrossRef]
  10. Kim, E.-J.; Lim, C.; Choi, J. A Study on Planning Trails of Natural and Historic-Cultural Landscapes in Rural Villages. J. Kr. Soc. Rural Plan. 2014, 20, 159–171. [Google Scholar] [CrossRef]
  11. Zeng, X.G.; Zhao, Y.N. The Characteristics of Rural Settlement Landscape in Hilly Area from the Perspective of Ecological Environment. J. Coast. Res. 2020, 103, 506–510. [Google Scholar] [CrossRef]
  12. Li, W.W.; Zhou, Y.J.; Dai, X.G.; Hu, F. Evaluation of rural tourism landscape resources in terms of carbon neutrality and rural revitalization. Sustainability 2022, 14, 2863. [Google Scholar] [CrossRef]
  13. Yang, H.Y.; Wu, R.Z.; Qiu, B.; Zhang, Z.H.; Hu, T.Z.; Zou, J.H.; Wang, H. The next step in suburban rural revitalization: Integrated whole-process landscape management linking ecosystem services and landscape characteristics. Ecol. Indic. 2024, 126, 111999. [Google Scholar] [CrossRef]
  14. Cong, L.; Zhang, Y.J.; Su, C.H.; Chen, M.H.; Wang, J.N. Understanding tourists’ willingness-to-pay for rural landscape improvement and preference heterogeneity. Sustainability 2019, 11, 7001. [Google Scholar] [CrossRef]
  15. Li, M.X.; Yan, Y.; Ying, Z.Y.; Zhou, L. Measuring villagers’ perceptions of changes in the landscape values of traditional villages. ISPRS Int. J. Geo-Inf. 2024, 13, 60. [Google Scholar] [CrossRef]
  16. Chen, Z.F.; Wang, C.Y. The spatial ecological wisdom of rural landscape unit identification and cognition: A case study of Pai fang Community in Nanjing City. Landscape Arch. 2022, 29, 30–36. [Google Scholar] [CrossRef]
  17. Chen, H.; Guan, J.M.; Yang, H.T.; He, Y.X.; Zhu, B.; Chen, J. A review of domestic research on rural human settlement environment planning-Bibliometric and visual analysis based on CNKI academic journals. J. Manyang Tchr. Coll. 2022, 41, 117–123. [Google Scholar] [CrossRef]
  18. John, L. Land and Life: A Selection from the Writing of Carl Sauer, 1st ed.; University of California Press: Berkeley, CA, USA, 1963; pp. 12–15. [Google Scholar] [CrossRef]
  19. Dong, X. The significance, principles and index system of rural landscape classification. HM. Geo. 1990, 1990, 49–52+78. (In Chinese) [Google Scholar]
  20. Agnolotti, M. Rural landscape, nature conservation and culture: Some notes on research trends and management approaches from a (southern) European perspective. Landscape Urban Plan. 2014, 126, 66–73. [Google Scholar] [CrossRef]
  21. Torregiani, D.; Ludwiczak, Z.; Dall, A.E.; Benni, S.; Maino, E.; Tassinari, P. Trula: A high-resolution method for multi-time analysis of traditional rural landscapes and its application in Emilia-Romagna, Italy. Landsc. Urban Plan. 2014, 124, 93–103. [Google Scholar] [CrossRef]
  22. Dupont, L.; Ooms, K.; Antro, M.; Reveled, V.V. Comparing saliency maps and eye-tracking focus maps: The potential use in visual impact assessment based on landscape photographs. Landsc. Urban Plan. 2016, 148, 17–26. [Google Scholar] [CrossRef]
  23. Su, T.T.; Wang, K.P.; Li, S.S.; Wang, X.Y.; Li, H.; Ding, H.R.; Chen, Y.F.; Liu, C.H.; Liu, M.; Zhang, Y.L. Analysis and Optimization of Landscape Preference Characteristics of Rural Public Space Based on Eye-Tracking Technology: The Case of Huangshan Dian Village, China. Sustainability 2023, 15, 212. [Google Scholar] [CrossRef]
  24. Grindsted, A. Interactive resources used in semi-structured research interviewing. J. Pragma. 2005, 37, 1015–1035. [Google Scholar] [CrossRef]
  25. Gugu, P.C.; Rodríguez-Campos, L. Semi-structured interview protocol for constructing logic models. Eval. Program Plan. 2007, 30, 339–350. [Google Scholar] [CrossRef] [PubMed]
  26. Guo, S.L.; Zhao, N.X.; Zhang, J.X.; Xue, T.; Liu, P.X.; Xu, S.; Xu, D.D. Research Landscape visual quality assessment based on eye movement: College student eye-tracking experiments on Hongcun tourism landscape pictures. Res. Sci. 2017, 39, 1137–1147. (In Chinese) [Google Scholar]
  27. Duan, H.L.; Han, L. Research on the development of rural tourism. Res. Dev. Mkt. 2000, 5, 314–315. (In Chinese) [Google Scholar]
  28. Wang, Y.C.; Liu, B.Y. On Chinese rural landscape and rural landscape planning. CHN. Landscape Arch. 2003, 1, 56–59. (In Chinese) [Google Scholar]
  29. Liu, Y.F. A Study on the Imagery of Urban Historical Landscape in the Old City of Beijing, 1st ed.; Science Press: Beijing, China, 2019; pp. 23–25. [Google Scholar]
  30. Lynch, K. The Image of the City, 1st ed.; Fang, Y.; He, X., Translators; Huaxia Publishing House: Beijing, China, 2001; pp. 37–66. [Google Scholar]
  31. Liu, J.Y.; Li, L.M. Notice of the general office of the ministry of agriculture and rural affairs on the announcement of beautiful leisure villages in China in 2020. China Agric. Yearb. 2020, 2020, 521–524. [Google Scholar]
  32. Ma, L.; Xu, Y.Z.; He, S.Y.; Tang, Z.; Li, T.Z. Exploring cognition differences in the traditional village landscape based on eye-tracking experiment. Urban Dev. Stud. 2023, 30, 86–94. (In Chinese) [Google Scholar]
  33. Yang, M.M. Eye-Tracking and Chinese Reading, 1st ed.; Social Science Literature Publishing House: Beijing, China, 2018; pp. 36–56. [Google Scholar]
  34. Zhao, Y.; Lin, J.H.; Liu, Y. Research on visual evaluation of tourism scenery based on eye movement experiment: A case of Tangjia Ancient Town in Zhuhai. Human Geography. 2020, 35, 130–140. [Google Scholar] [CrossRef]
  35. Wu, C.J.; Min, Y.C.; Fei, B.H.; Song, S.S. A study on the aesthetic preference of bamboo weaving patterns based on eye movement experiments. Buildings 2023, 13, 1558. [Google Scholar] [CrossRef]
  36. Zhang, T.; Liu, D.D.; Zhang, H.W.; Huang, L.F. Landscape Aesthetic Experience of Longi Rice Terraces based on the Eye-Tracking Experiment. South Arch. 2023, 2023, 52–61. (In Chinese) [Google Scholar]
  37. Mead, W.R. The Iconography of Landscape: Essays on the Symbolic Representation, Design and Use of Past Environments; Cambridge University Press: Cambridge, UK; Cosgrove, D., Daniels, S., Eds.; 1989; Volume 155, p. 129. [Google Scholar] [CrossRef]
  38. Wang, M. Eye Movement Analysis for Landscape Visual Quality Evaluation—A Case Study of Danxia Landform in Sunan, Gansu Province. Ph.D. Thesis, Nanjing University, Nanjing, China, 2011. [Google Scholar]
  39. Zhao, J.Z.; Yan, Y.; Deng, H.B.; Liu, G.H.; Dai, L.M.; Tang, L.N.; Shi, L.Y.; Shao, G.F. Remarks about land senses ecology and ecosystem services. Int. J. Sust. Dev. World 2020, 27, 196–201. [Google Scholar] [CrossRef]
  40. Treichler, D.G. Are you missing the boat in training aid? Film AV Comm. 1967, 1, 14–16. [Google Scholar]
  41. Amati, M.; Parmer, E.G.; McCarthy, C.; Sita, J. How eye-catching are natural features when walking through a park? Eye-tracking responses to videos of walks. Urban For. Urban Green. 2018, 31, 67–78. [Google Scholar] [CrossRef]
  42. Meidenbauer, L.K.; Stenfors, U.C.; Young, J.; Layden, E.A.; Schertz, K.E.; Kardan, O.; Decay, J.; Berman, M.G. The gradual development of the preference for natural environments. J. Environ. Psychol. 2019, 65, 101328. [Google Scholar] [CrossRef]
  43. Van Den Berg, A.E.; Vlei, C.A.J.; Couturier, J.F. Group differences in the aesthetic evaluation of nature development plans: A multilevel approach. J. Environ. Psychol. 1998, 18, 141–157. [Google Scholar] [CrossRef]
  44. Muro, R.S.T.; Granados, C.S.D.; Romero, E.J.R. Green infrastructures in the peri-urban landscape: Exploring local perception of well-being through ‘Go-Along’ and ‘Semi-Structured Interviews’. Sustainability 2020, 12, 6836. [Google Scholar] [CrossRef]
  45. Johnson, M.L.; Campbell, L.K.; Svendsen, E.S.; McMillen, H.L. Mapping urban park cultural ecosystem services: A comparison of twitter and semi-structured interview methods. Sustainability 2019, 11, 6137. [Google Scholar] [CrossRef]
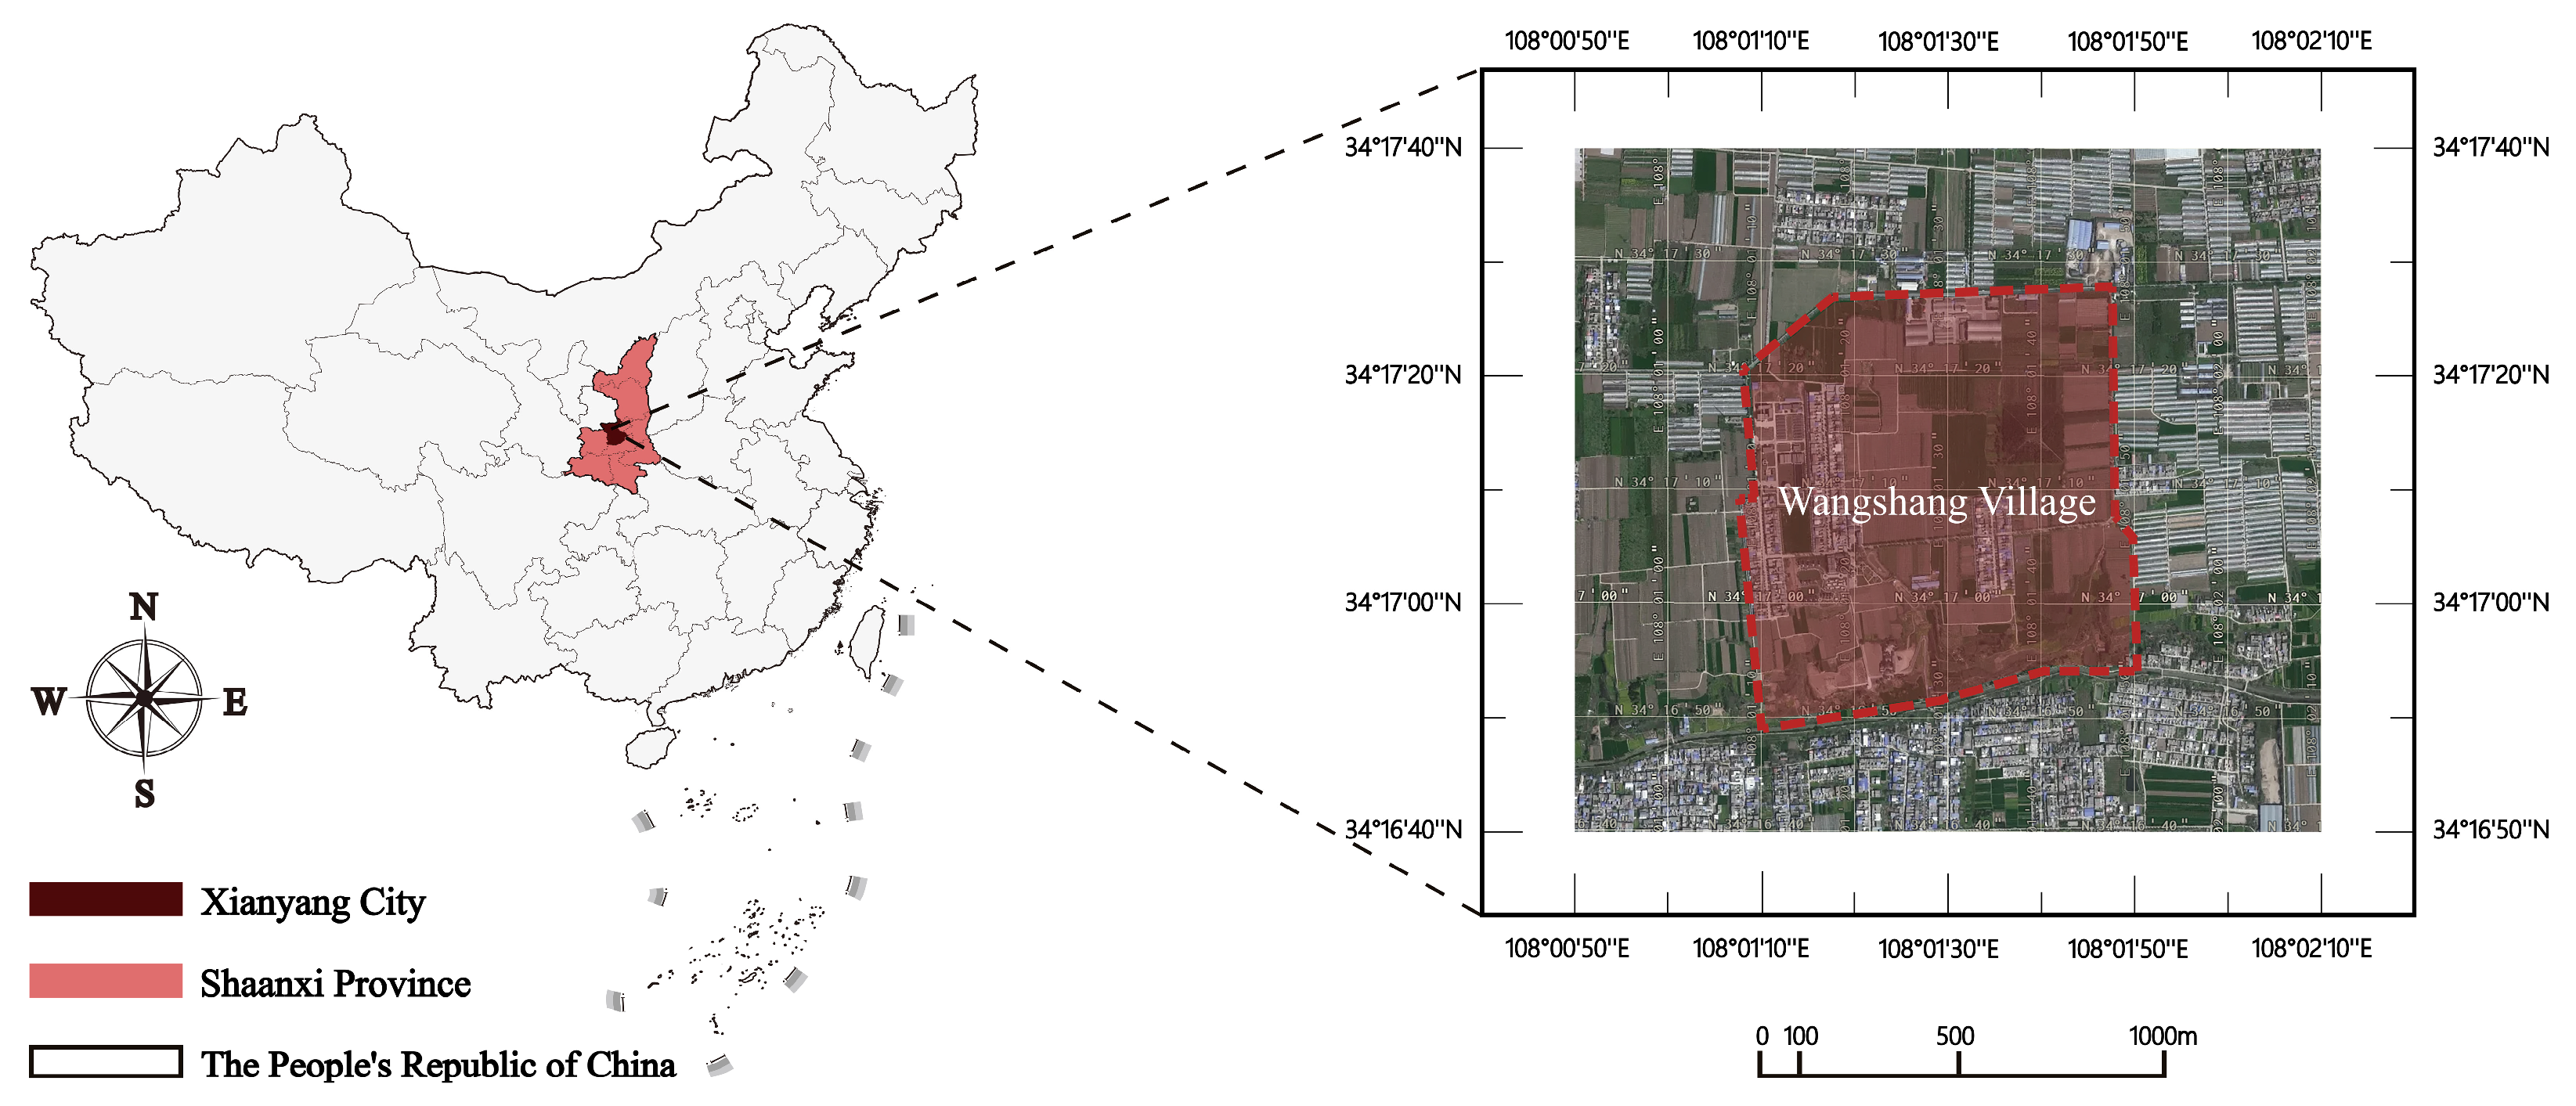
Figure 1. Schematic diagram of Wangshang Village’s location.
Land 13 01592 g001
Figure 2. Eye movement experiment photos.
Land 13 01592 g002
Figure 3. Experimental equipment and environment.
Land 13 01592 g003
Figure 4. Experimental process.
Land 13 01592 g004
Figure 5. Eye movement heat maps of two groups of subjects.
Land 13 01592 g005
Figure 6. High-frequency word co-occurrence network diagrams of the two groups of participants about the five types of rural landscapes.
Land 13 01592 g006
Table 1. Analysis of overall significant differences in average fixation time between the two groups of subjects for 5 types of rural landscapes.
GroupMann–Whitney U Test Results
Average Fixation Points/No./PersonZpAverage Fixation Time/s/PersonZp
Villagers11.418−1.1830.2370.588−5.5300.001 ***
(8.800, 14.220)(0.475, 0.898)
Tourists11.8200.771
(9.400, 13.680)(0.568, 1.105)
Note: *** indicates p < 0.01. Since the data comprise two independent samples from non-normal distributions, the Mann–Whitney U test is applied to assess their differences. The measurement data are expressed as the median and interquartile range.
Table 2. Analysis of significant differences in the average number of fixation points and average fixation time between the two groups of subjects for 5 types of rural landscapes.
Element TypeGroupMann–Whitney U Test Results
Average Fixation Points/No./PersonZpAverage Fixation Time/s/PersonZp
LandmarkVillagers11.628
(8.700, 14.300)
−0.4620.6440.621
(0.466, 1.045)
−4.8200.001 ***
Tourists11.464
(8.300, 13.800)
0.803
(0.536, 1.147)
EdgeVillagers11.381
(8.200, 14.800)
−2.2030.028 **0.555
(0.428, 0.898)
−5.6200.001 ***
Tourists12.214
(9.900, 15.500)
0.749
(0.505, 0.961)
DistrictVillagers11.583
(7.800, 15.300)
−0.8730.3830.604
(0.479, 0.923)
−4.1560.001 ***
Tourists11.894
(8.100, 14.200)
0.778
(0.515, 1.431)
NodeVillagers11.211
(8.600, 14.900)
−1.9330.0530.556
(0.416, 0.878)
−5.4510.001 ***
Tourists11.933
(7.700, 14.500)
0.762
(0.504, 1.164)
PathVillagers11.289
(8.300, 13.900)
−0.9750.7700.603
(0.462, 0.973)
−3.3670.001 ***
Tourists11.594
(7.300, 15.000)
0.764
(0.490, 1.652)
Note: ** and *** respectively indicate p < 0.05 and p < 0.01, respectively.
Table 3. Analysis of overall significant differences in the average number of fixation points and average fixation time for 5 rural landscapes within two groups of subjects.
GroupKruskal–Wallis H Test Results
Average Fixation Points/Number/PersonAverage Fixation Time/Second/Person
MSDpMSDp
Villagers11.4181.6420.7420.5880.1290.019 **
Tourists11.8201.5720.3470.7110.1910.365
Note: ** indicates p < 0.05. Given that the data comprise multiple independent samples from non-normal distributions, the Kruskal–Wallis H test is applied to assess their differences.
Table 4. Analysis of significant differences in the average number of fixation points and average fixation time for pairwise matching of 5 types of rural landscapes within the same experimental group.
GroupElement Type Sample PairingAverage Fixation Points
(Significance/p)
Average Fixation Time
(Significance/p)
VillagersLandmark-Edge0.4710.009 **
Landmark-District0.9730.224
Landmark-Node0.2480.003 **
Landmark-Path0.3730.392
Edge-District0.5540.156
Edge-Node0.6810.411
Edge-Path0.9330.220
District-Node0.3380.039 **
District-Path0.3890.884
Node-Path0.7910.080
TouristsLandmark-Edge0.039 **0.215
Landmark-District0.1640.173
Landmark-Node0.1620.260
Landmark-Path0.4080.057
Edge-District0.8000.937
Edge-Node0.6120.796
Edge-Path0.2820.417
District-Node0.9510.884
District-Path0.4140.417
Node-Path0.6810.305
Note: ** indicates p < 0.05. The significance results were corrected by Bonferroni test.
Disclaimer/Publisher’s Note: The statements, opinions and data contained in all publications are solely those of the individual author(s) and contributor(s) and not of MDPI and/or the editor(s). MDPI and/or the editor(s) disclaim responsibility for any injury to people or property resulting from any ideas, methods, instructions or products referred to in the content.