

Differences in Urban Vibrancy Enhancement among Different Mixed Land Use Types: Evidence from Shenzhen, China


Abstract
:1. Introduction
2. Theoretical Framework
3. Materials and Methods
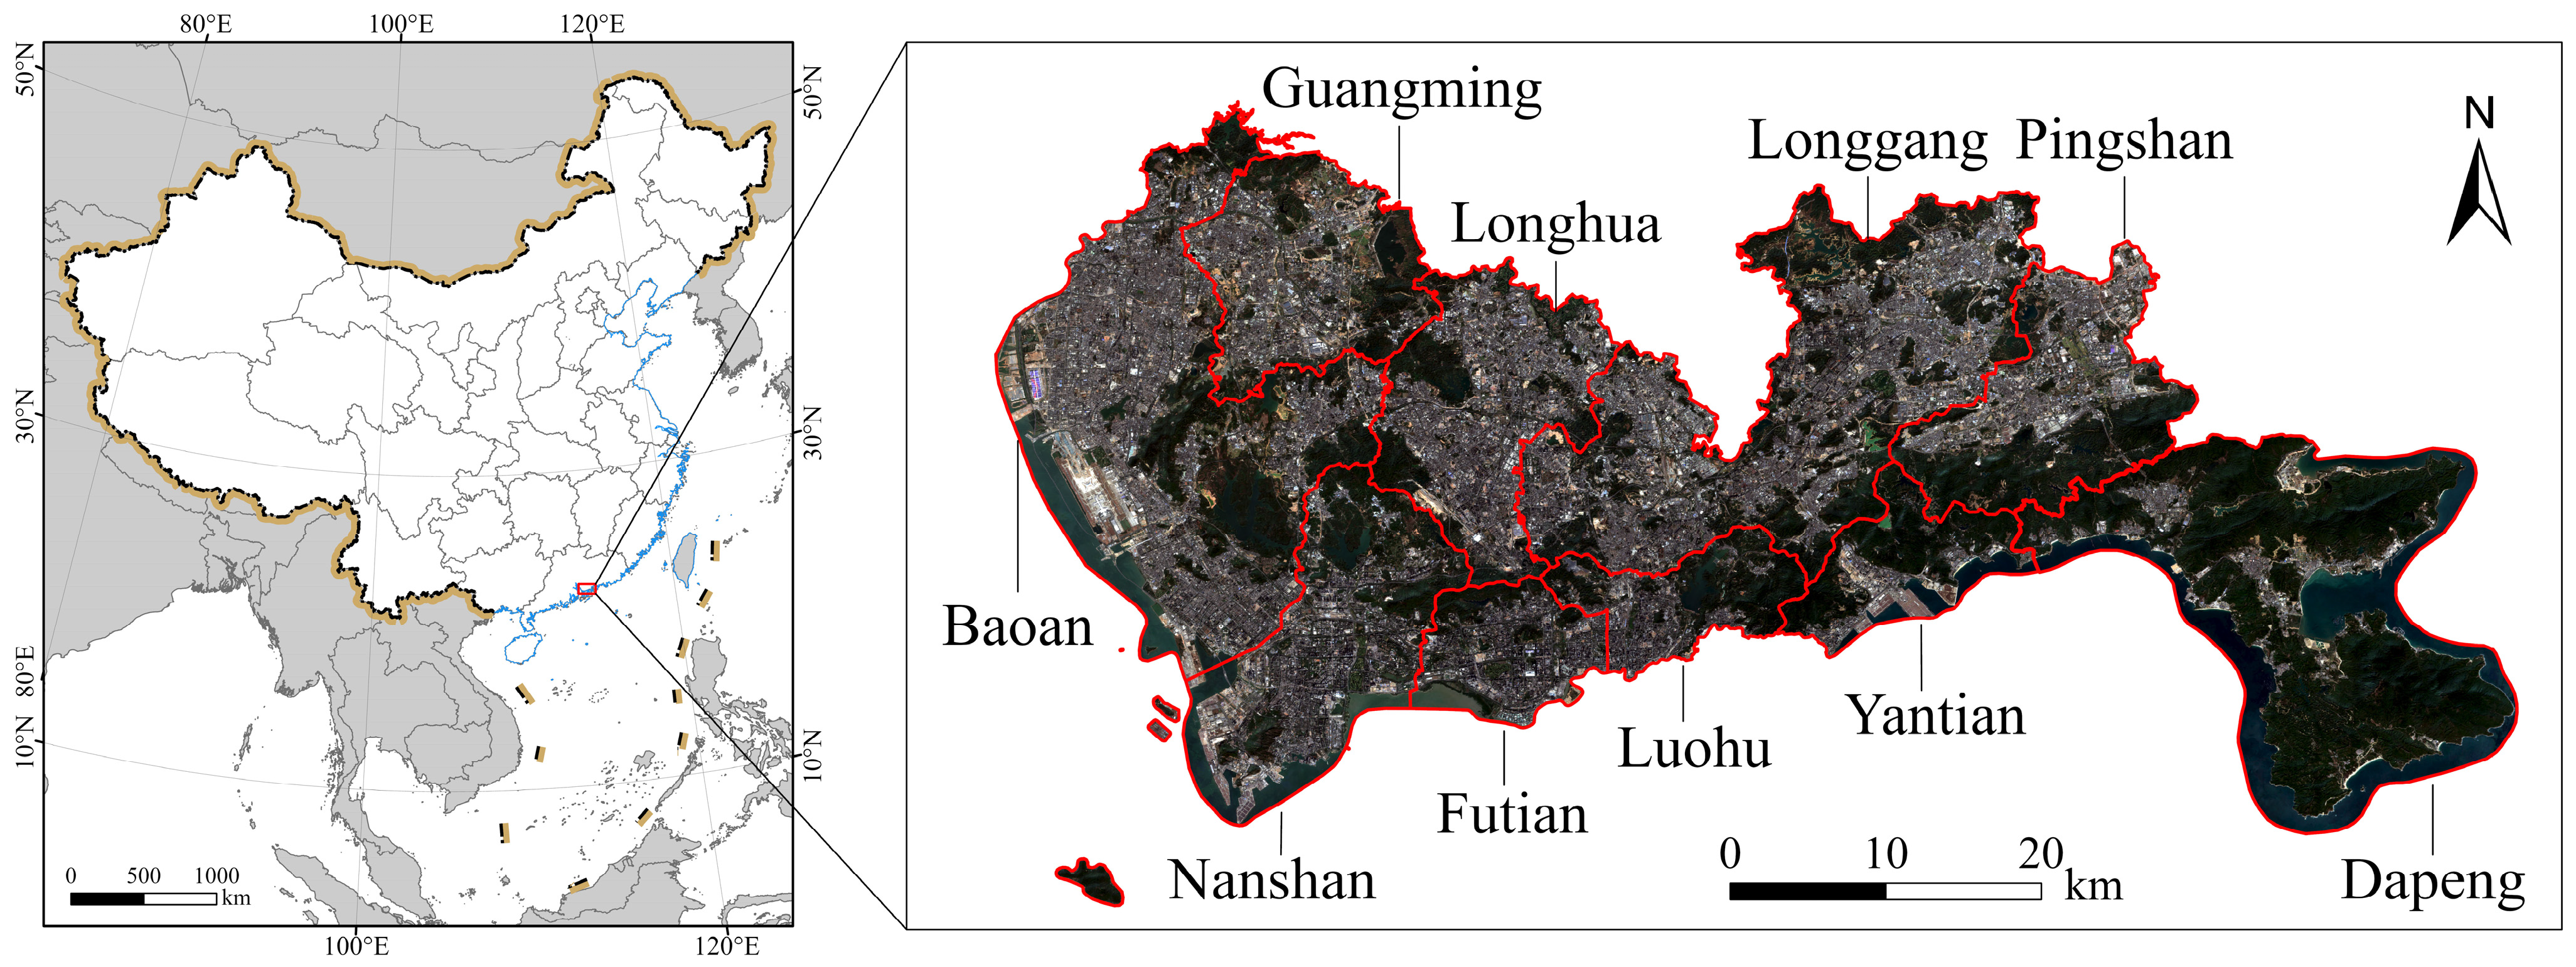
3.1. Study Area
3.2. Data Sources and Processing
3.2.1. Data Sources
3.2.2. Construction of Land Use Data
- (1)
- Definition and proportion standard of mixed land use
- (2)
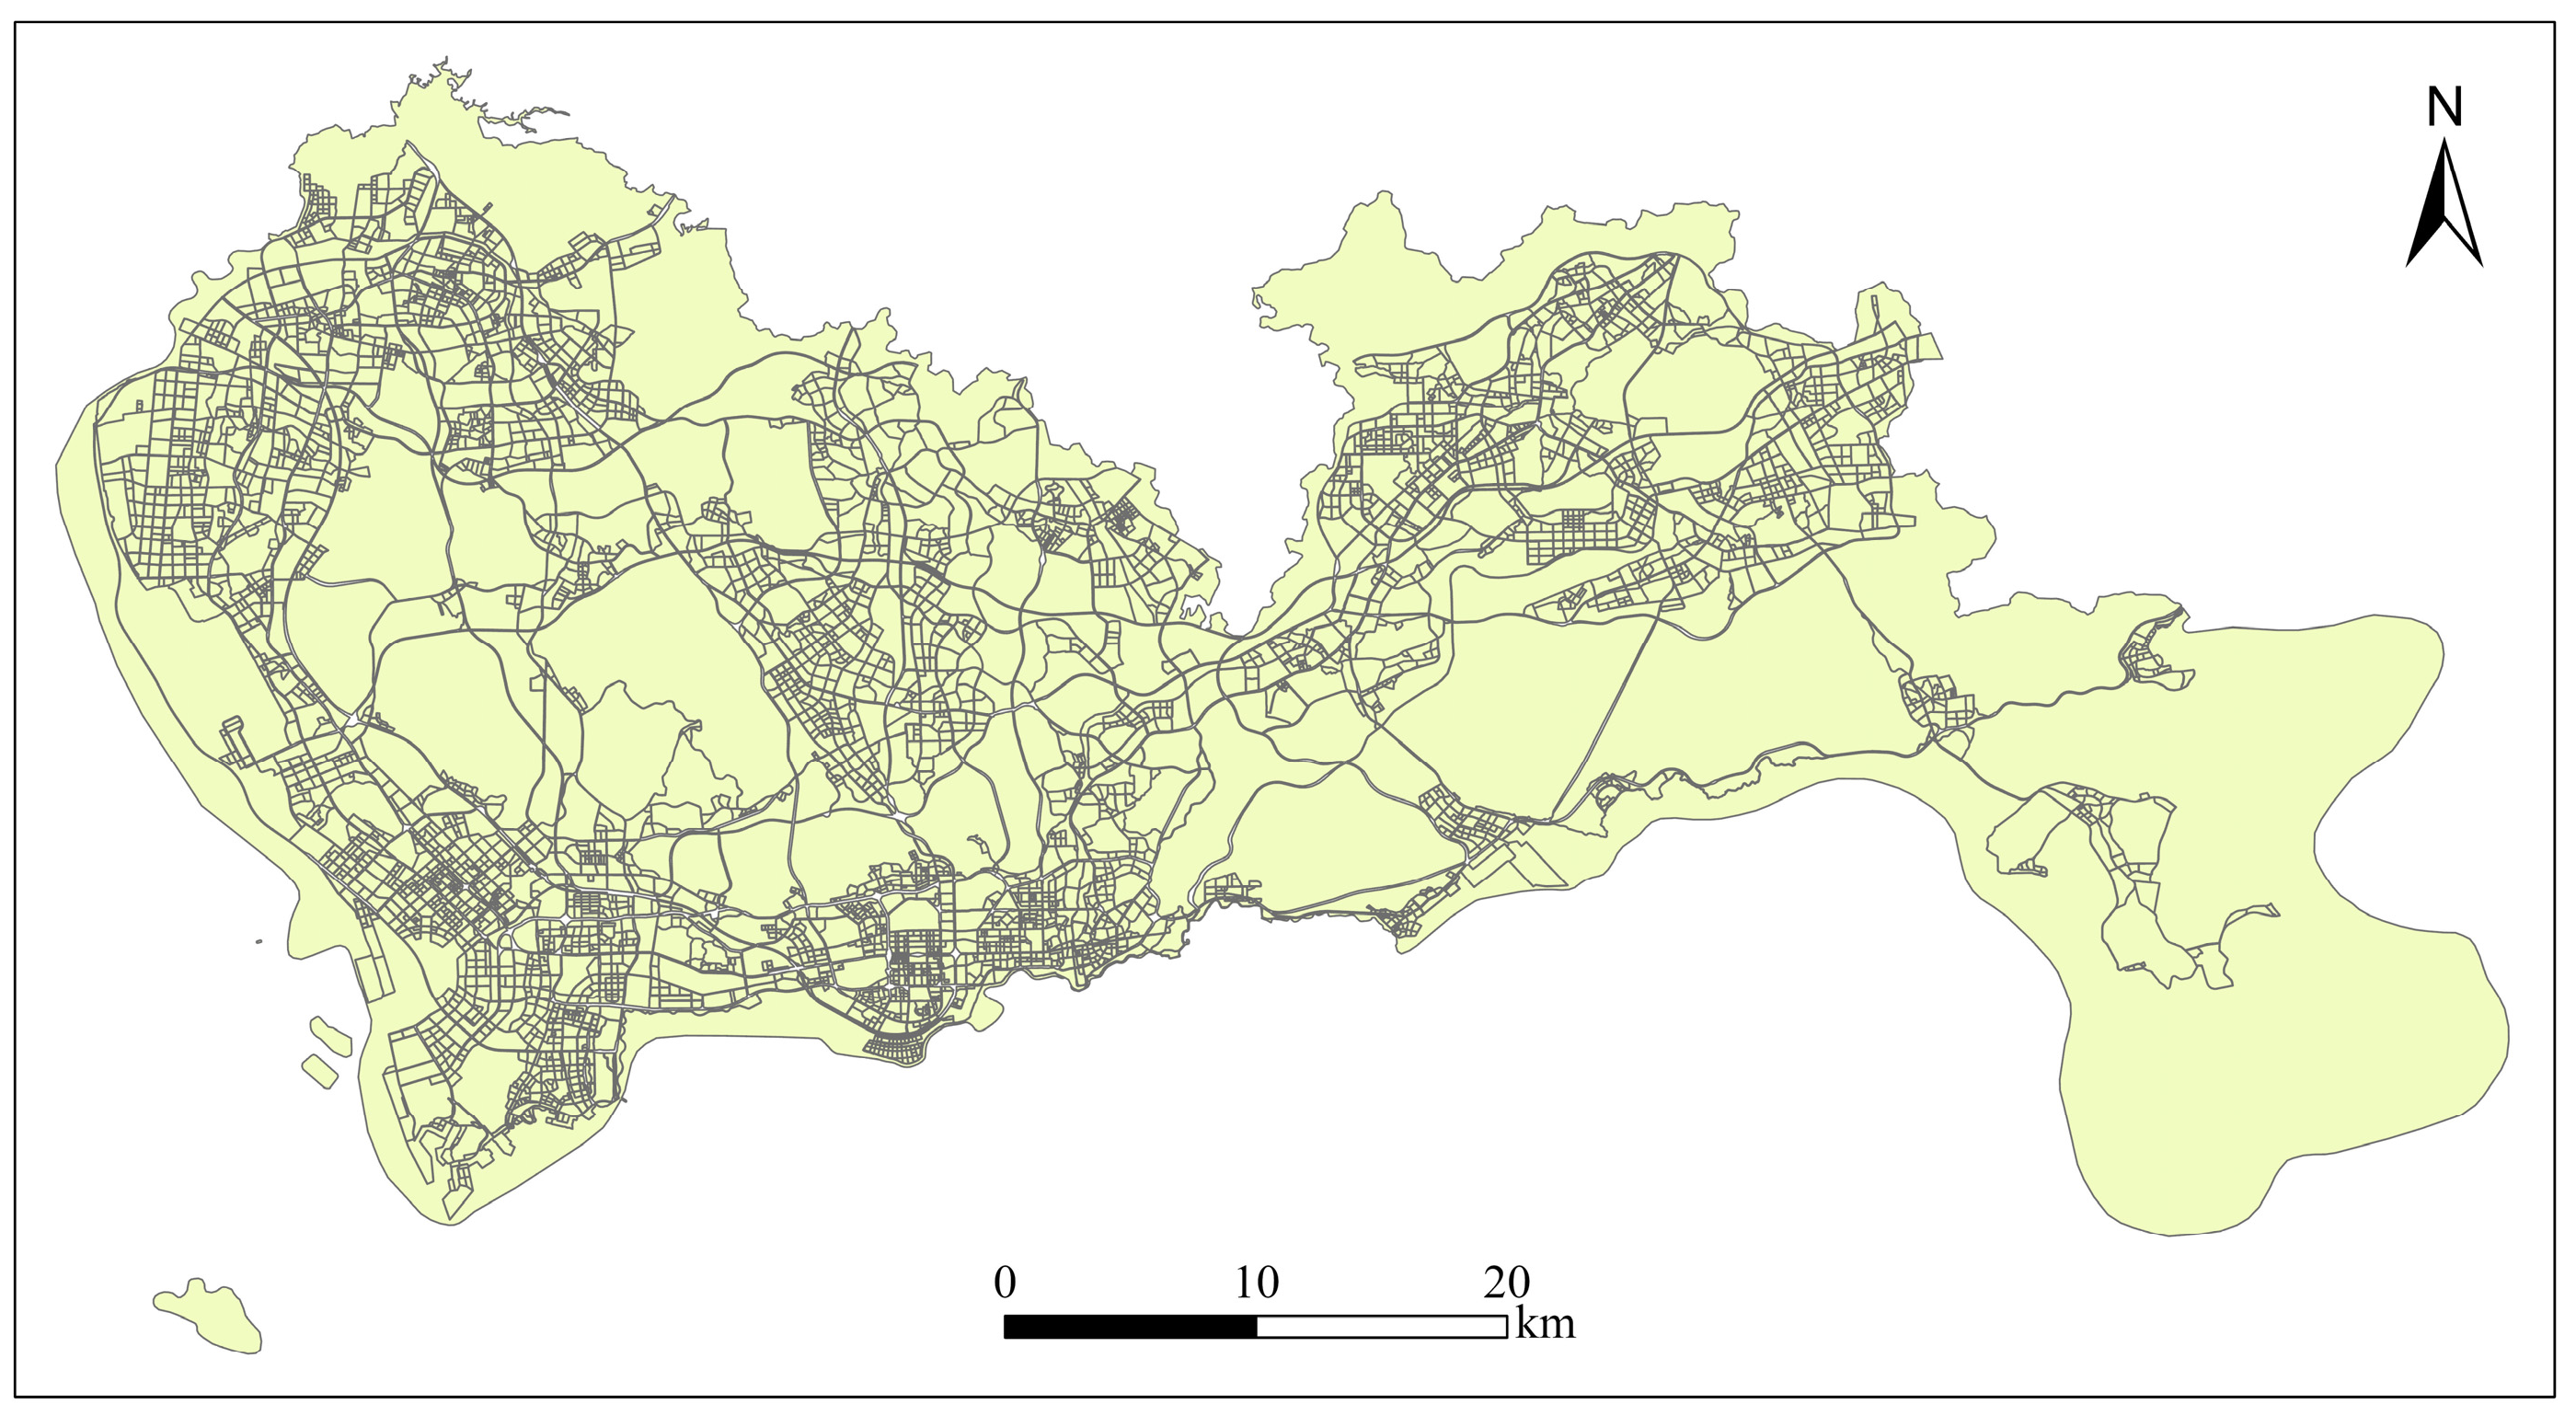
- Urban block extraction
- (3)
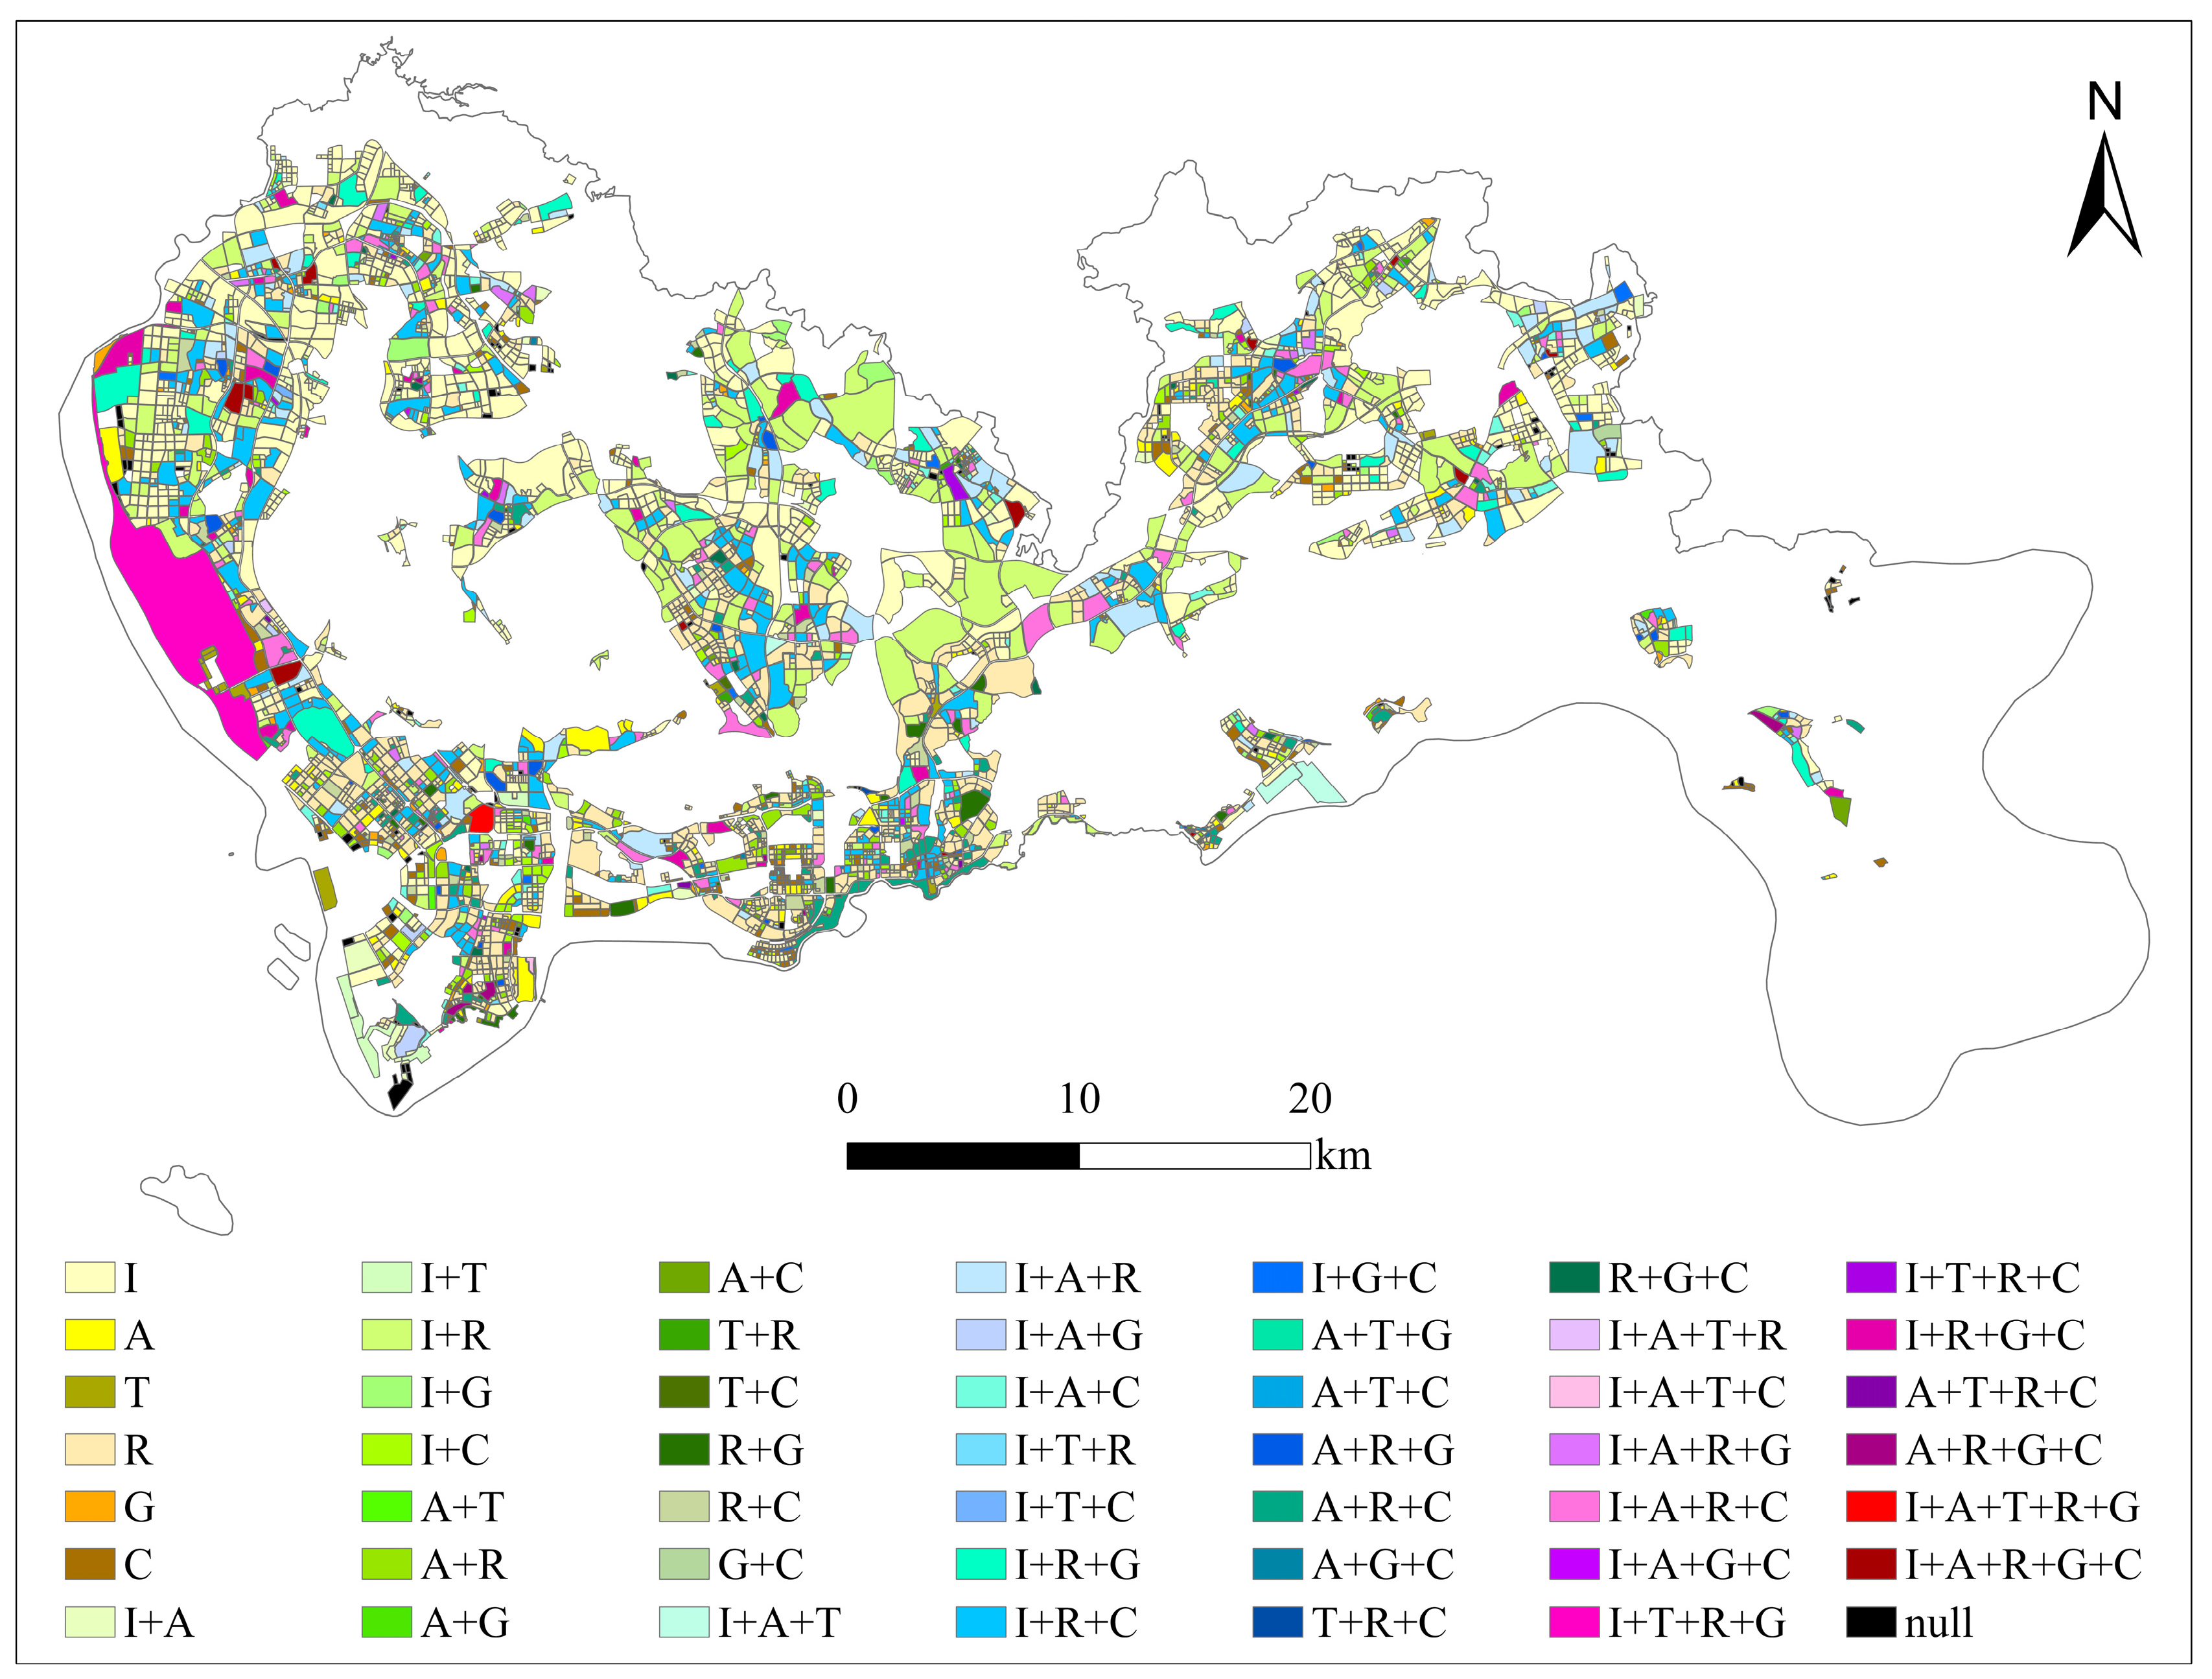
- Block land use type identification
- (4)
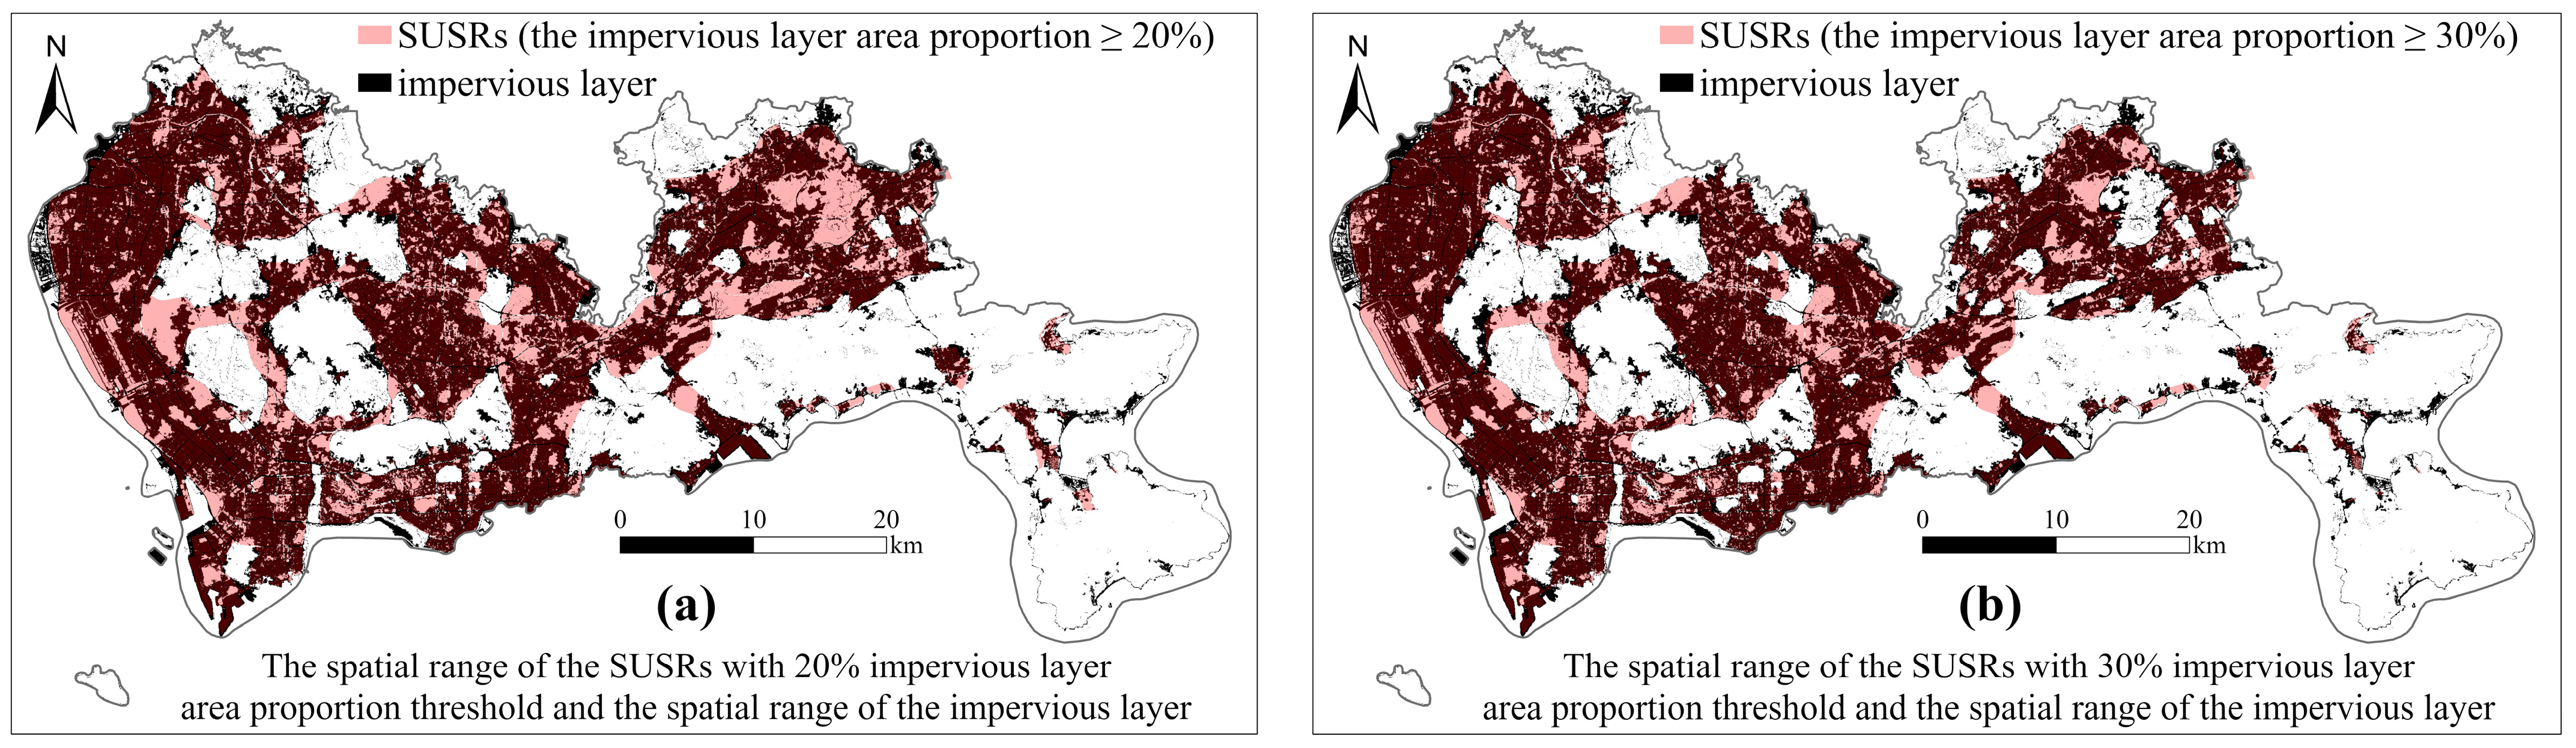
- Accuracy verification
3.2.3. Land Use Type Selection
3.3. Methods
3.3.1. Quantitative Measurement of Urban Vibrancy
- (1)
- Urban vibrancy intensity
- (2)
- Urban vibrancy stability
3.3.2. Kernel Density Analysis
3.3.3. Regression Analysis
- (1)
- Selection and quantification of variables
- (2)
- Multiple linear regression model
4. Results
4.1. Spatial Distribution Characteristics of Mixed Land Use and Urban Vibrancy
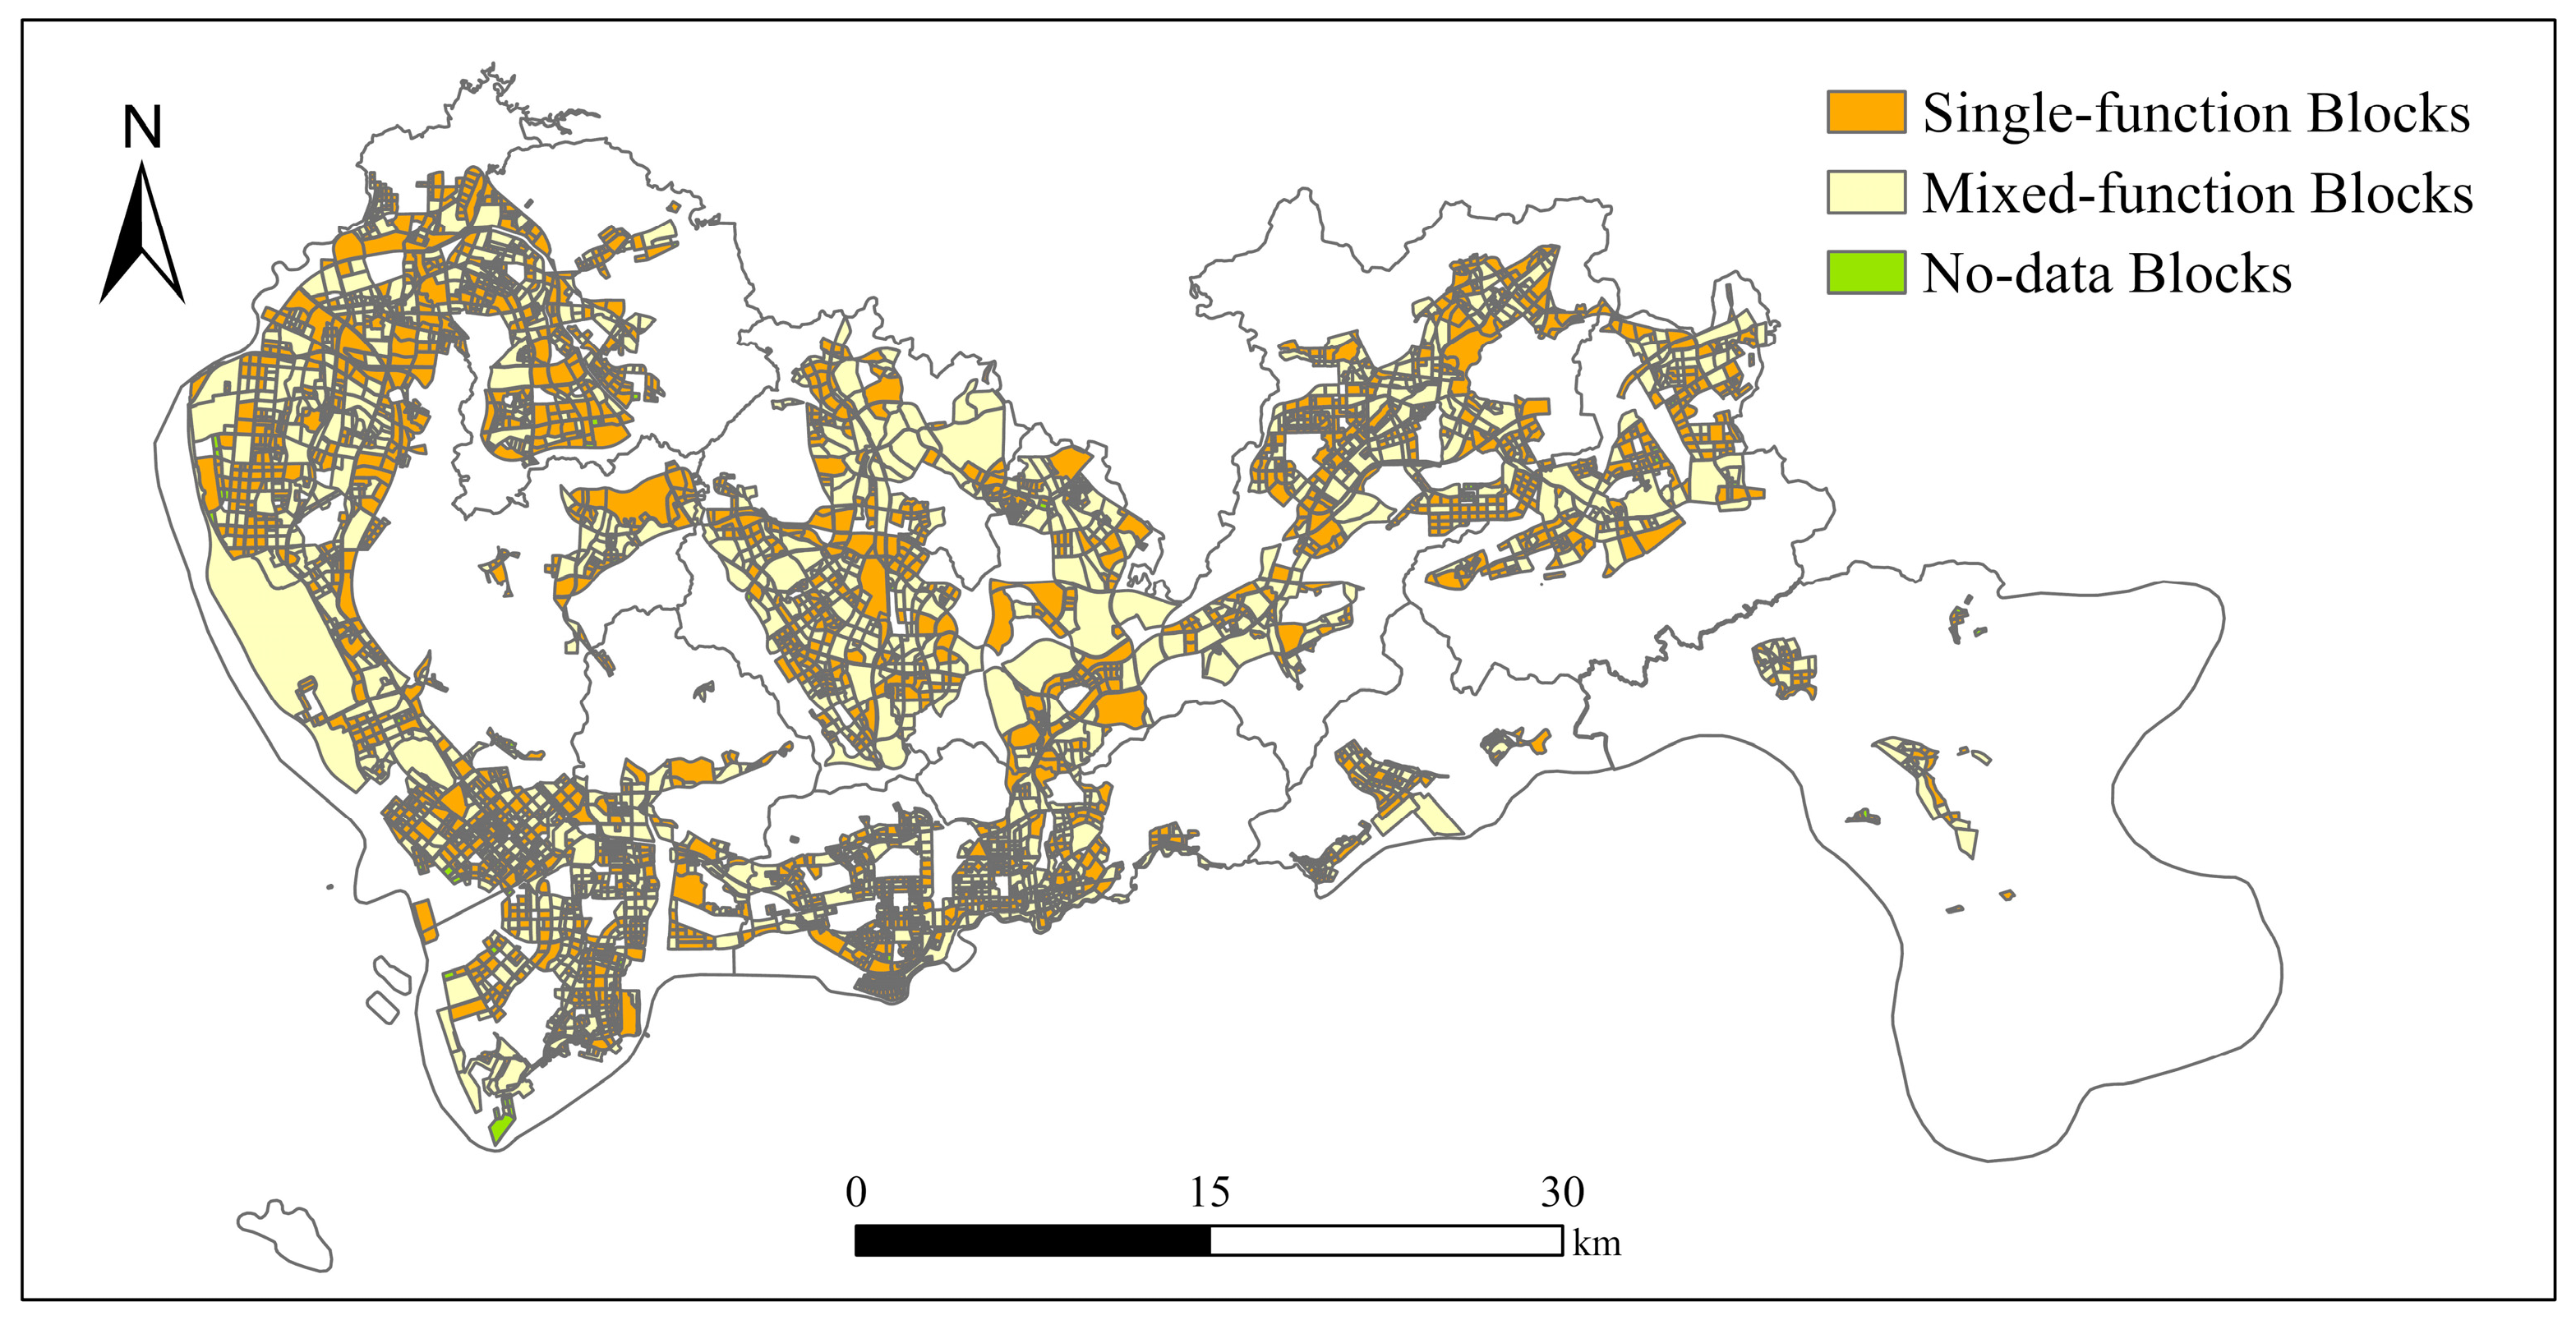
4.1.1. Overall Characteristics of Mixed Land Use
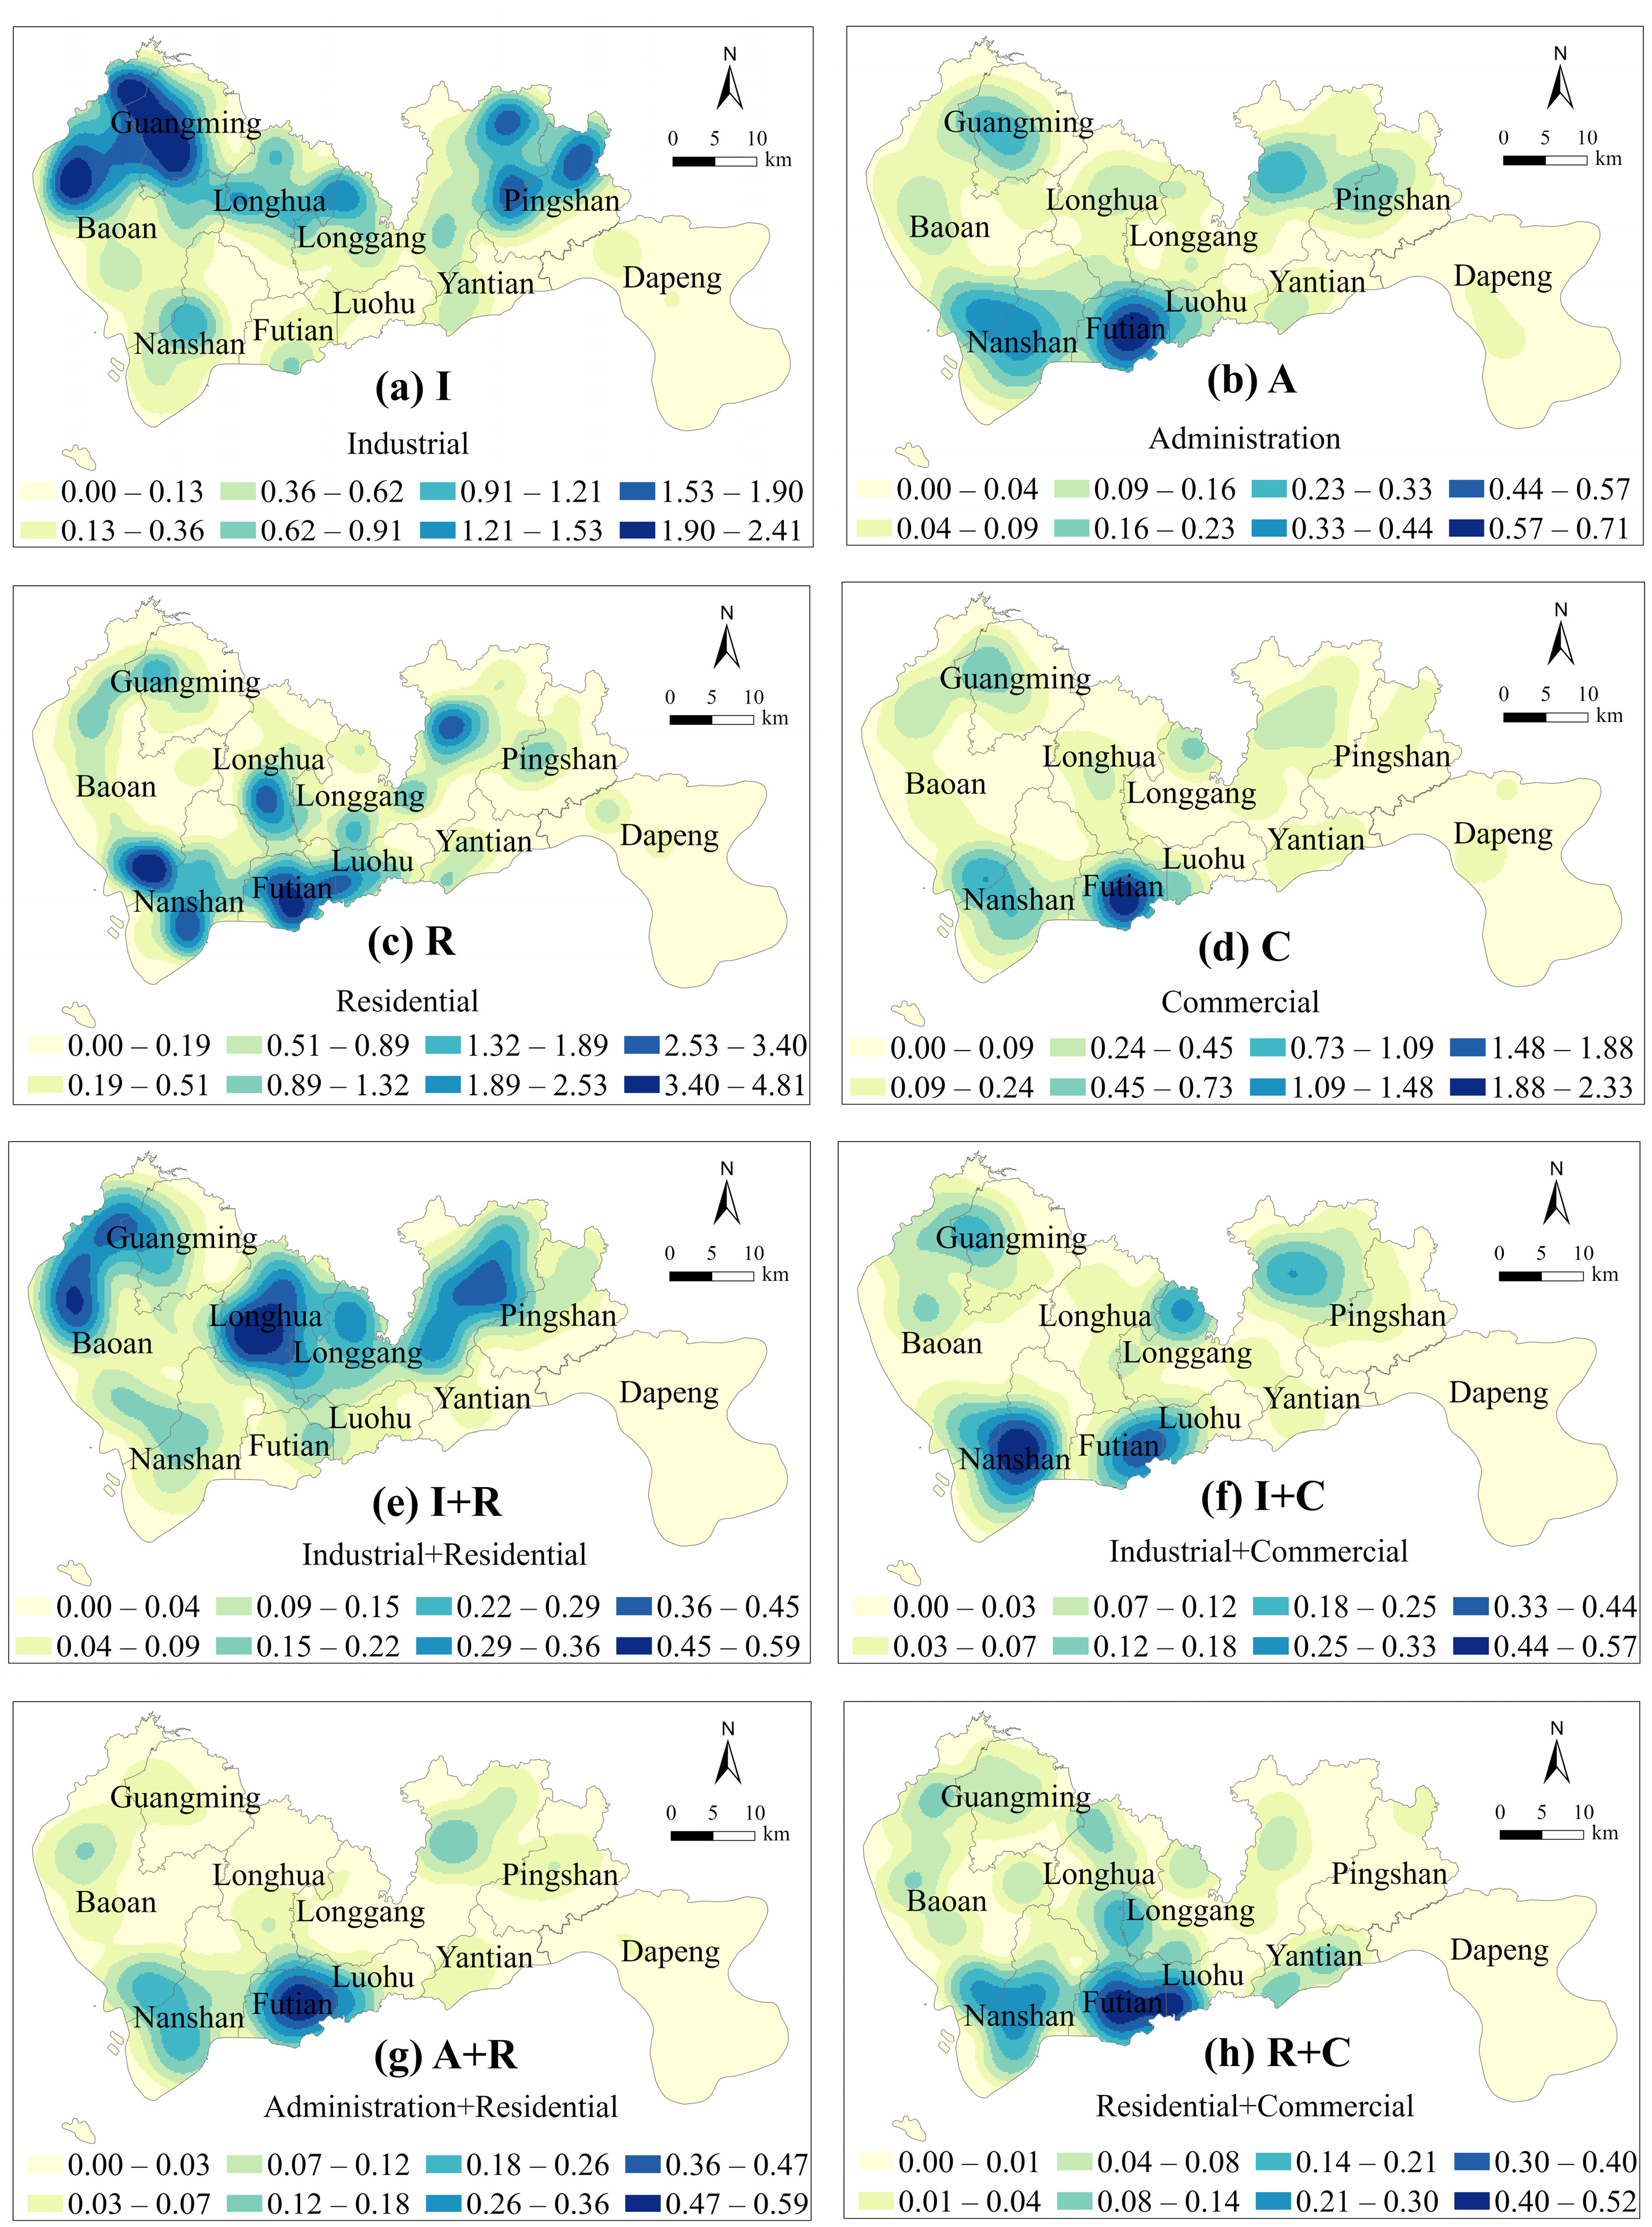
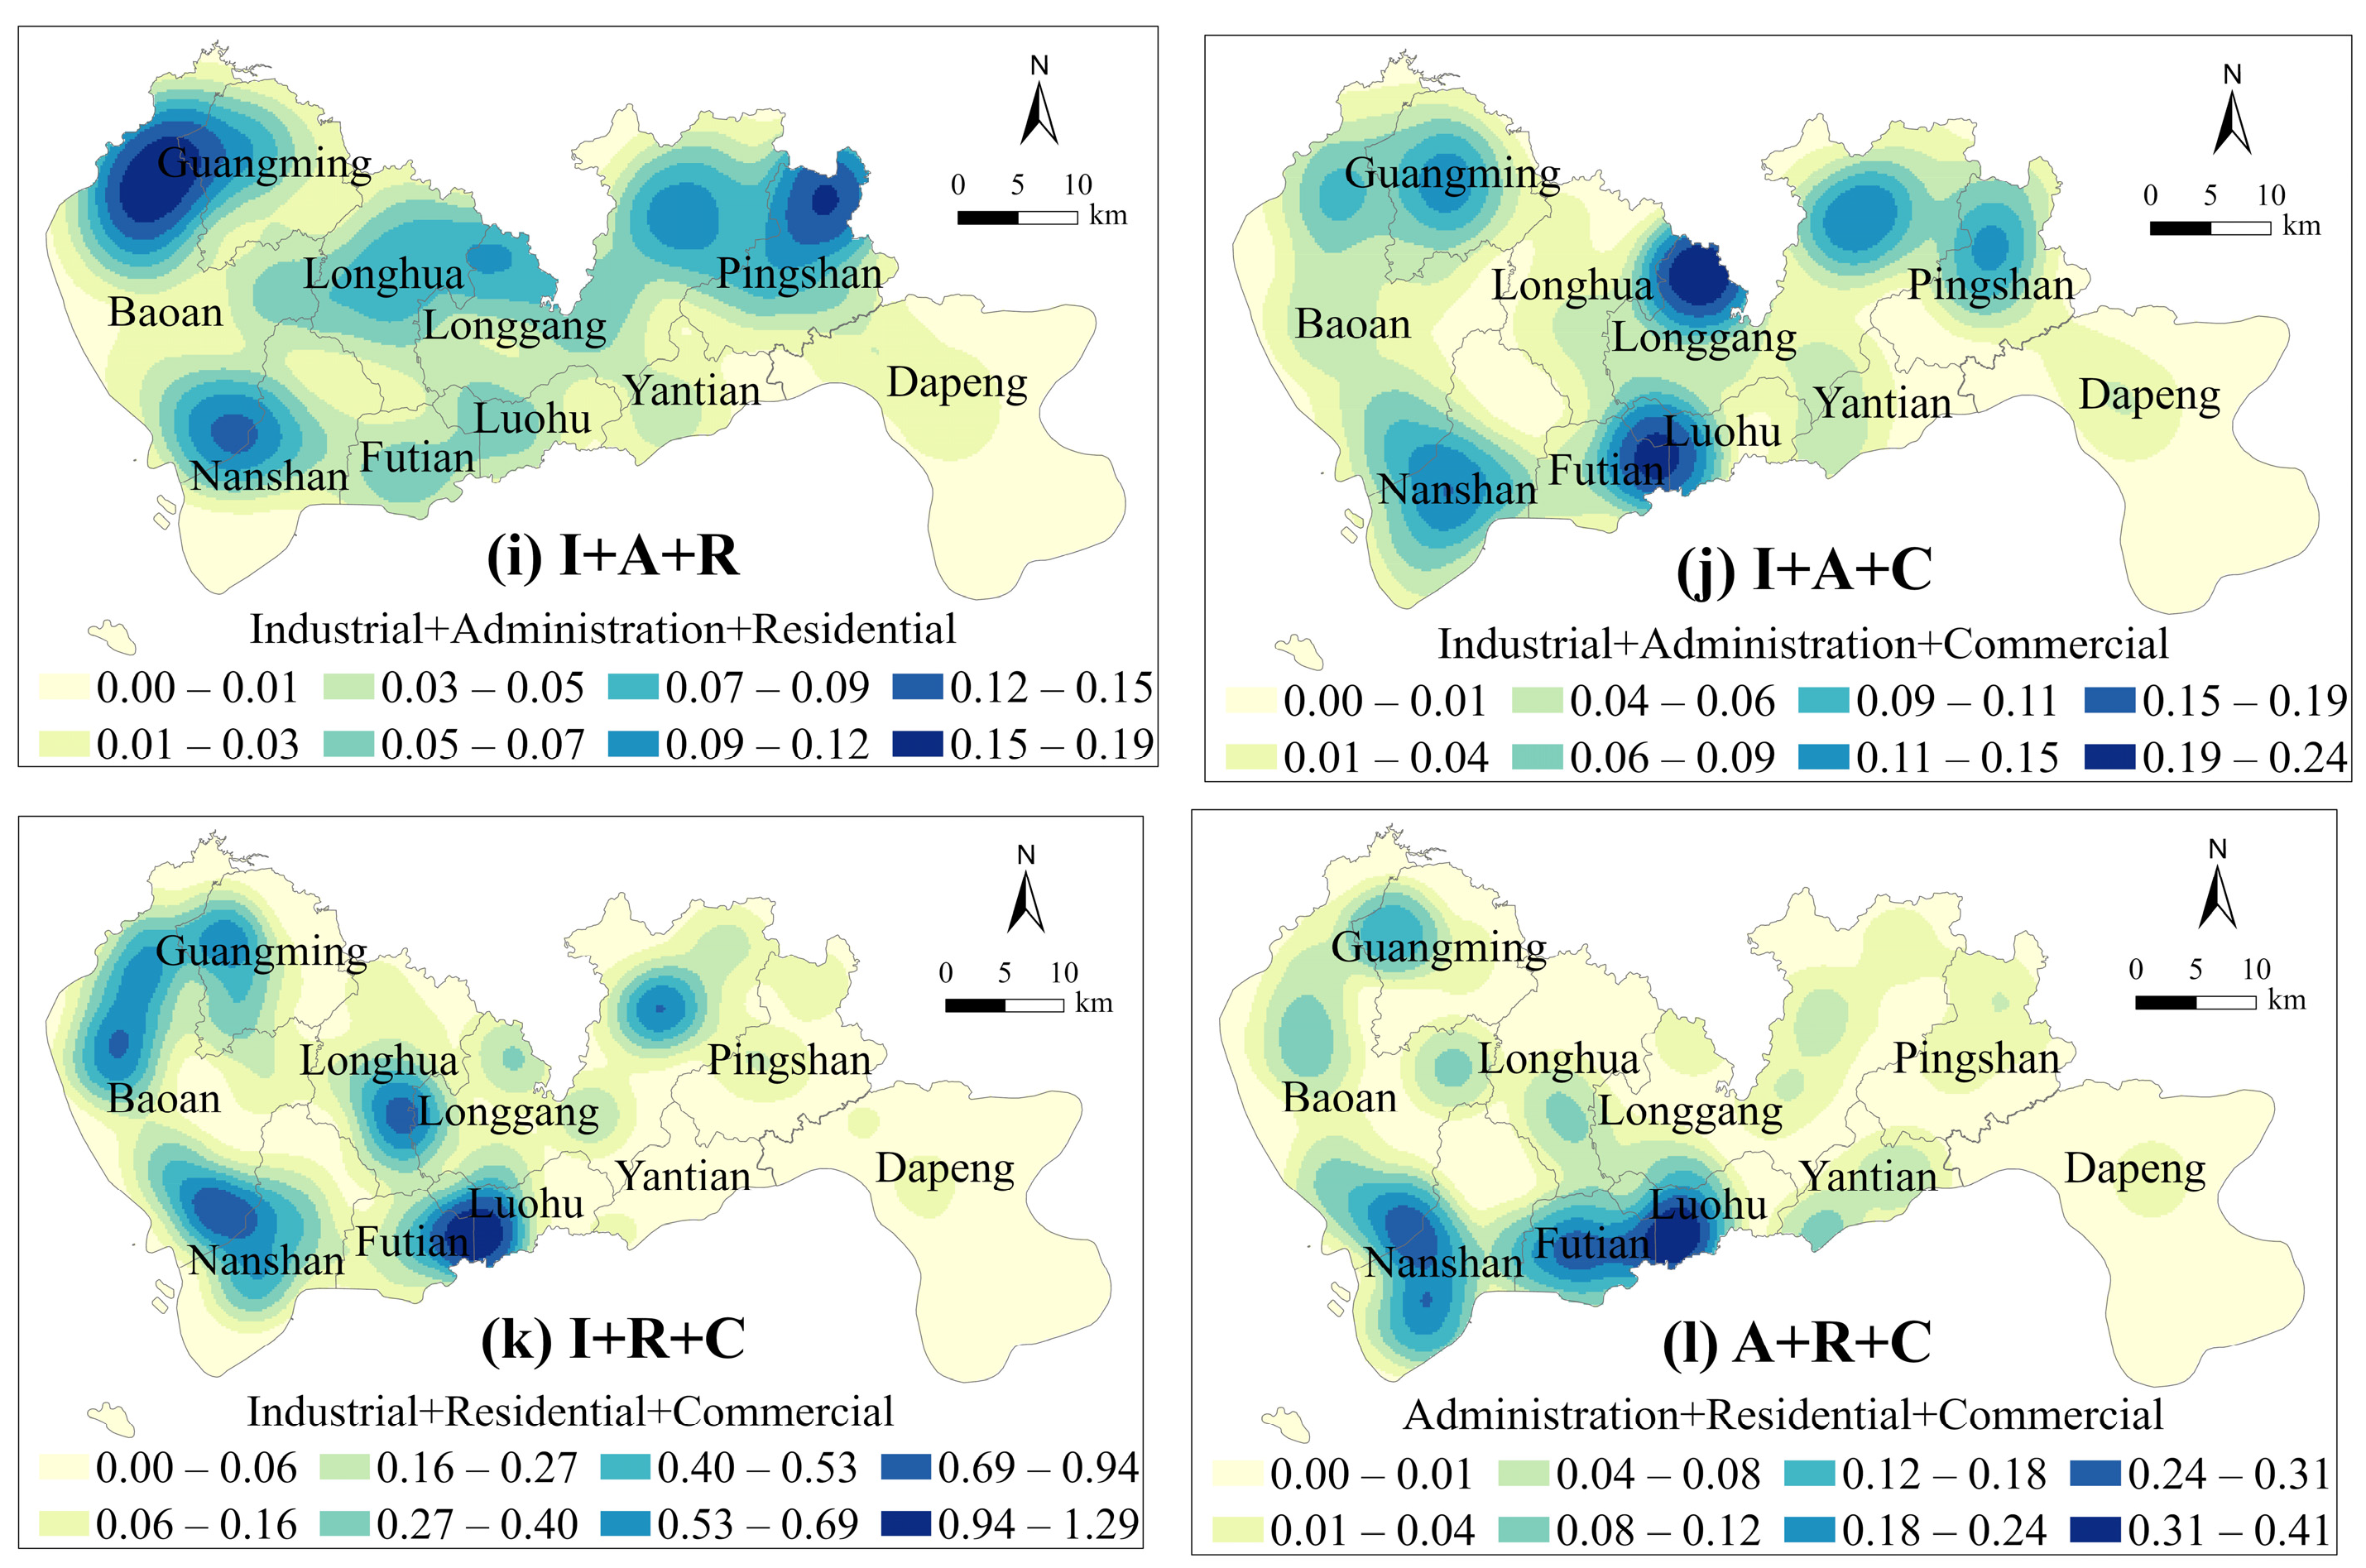
4.1.2. Spatial Distribution Characteristics of Main Mixed Land Use Types
4.1.3. Spatial Distribution Characteristics of Urban Vibrancy
4.2. Impact of Mixed Land Use Types on Urban Vibrancy
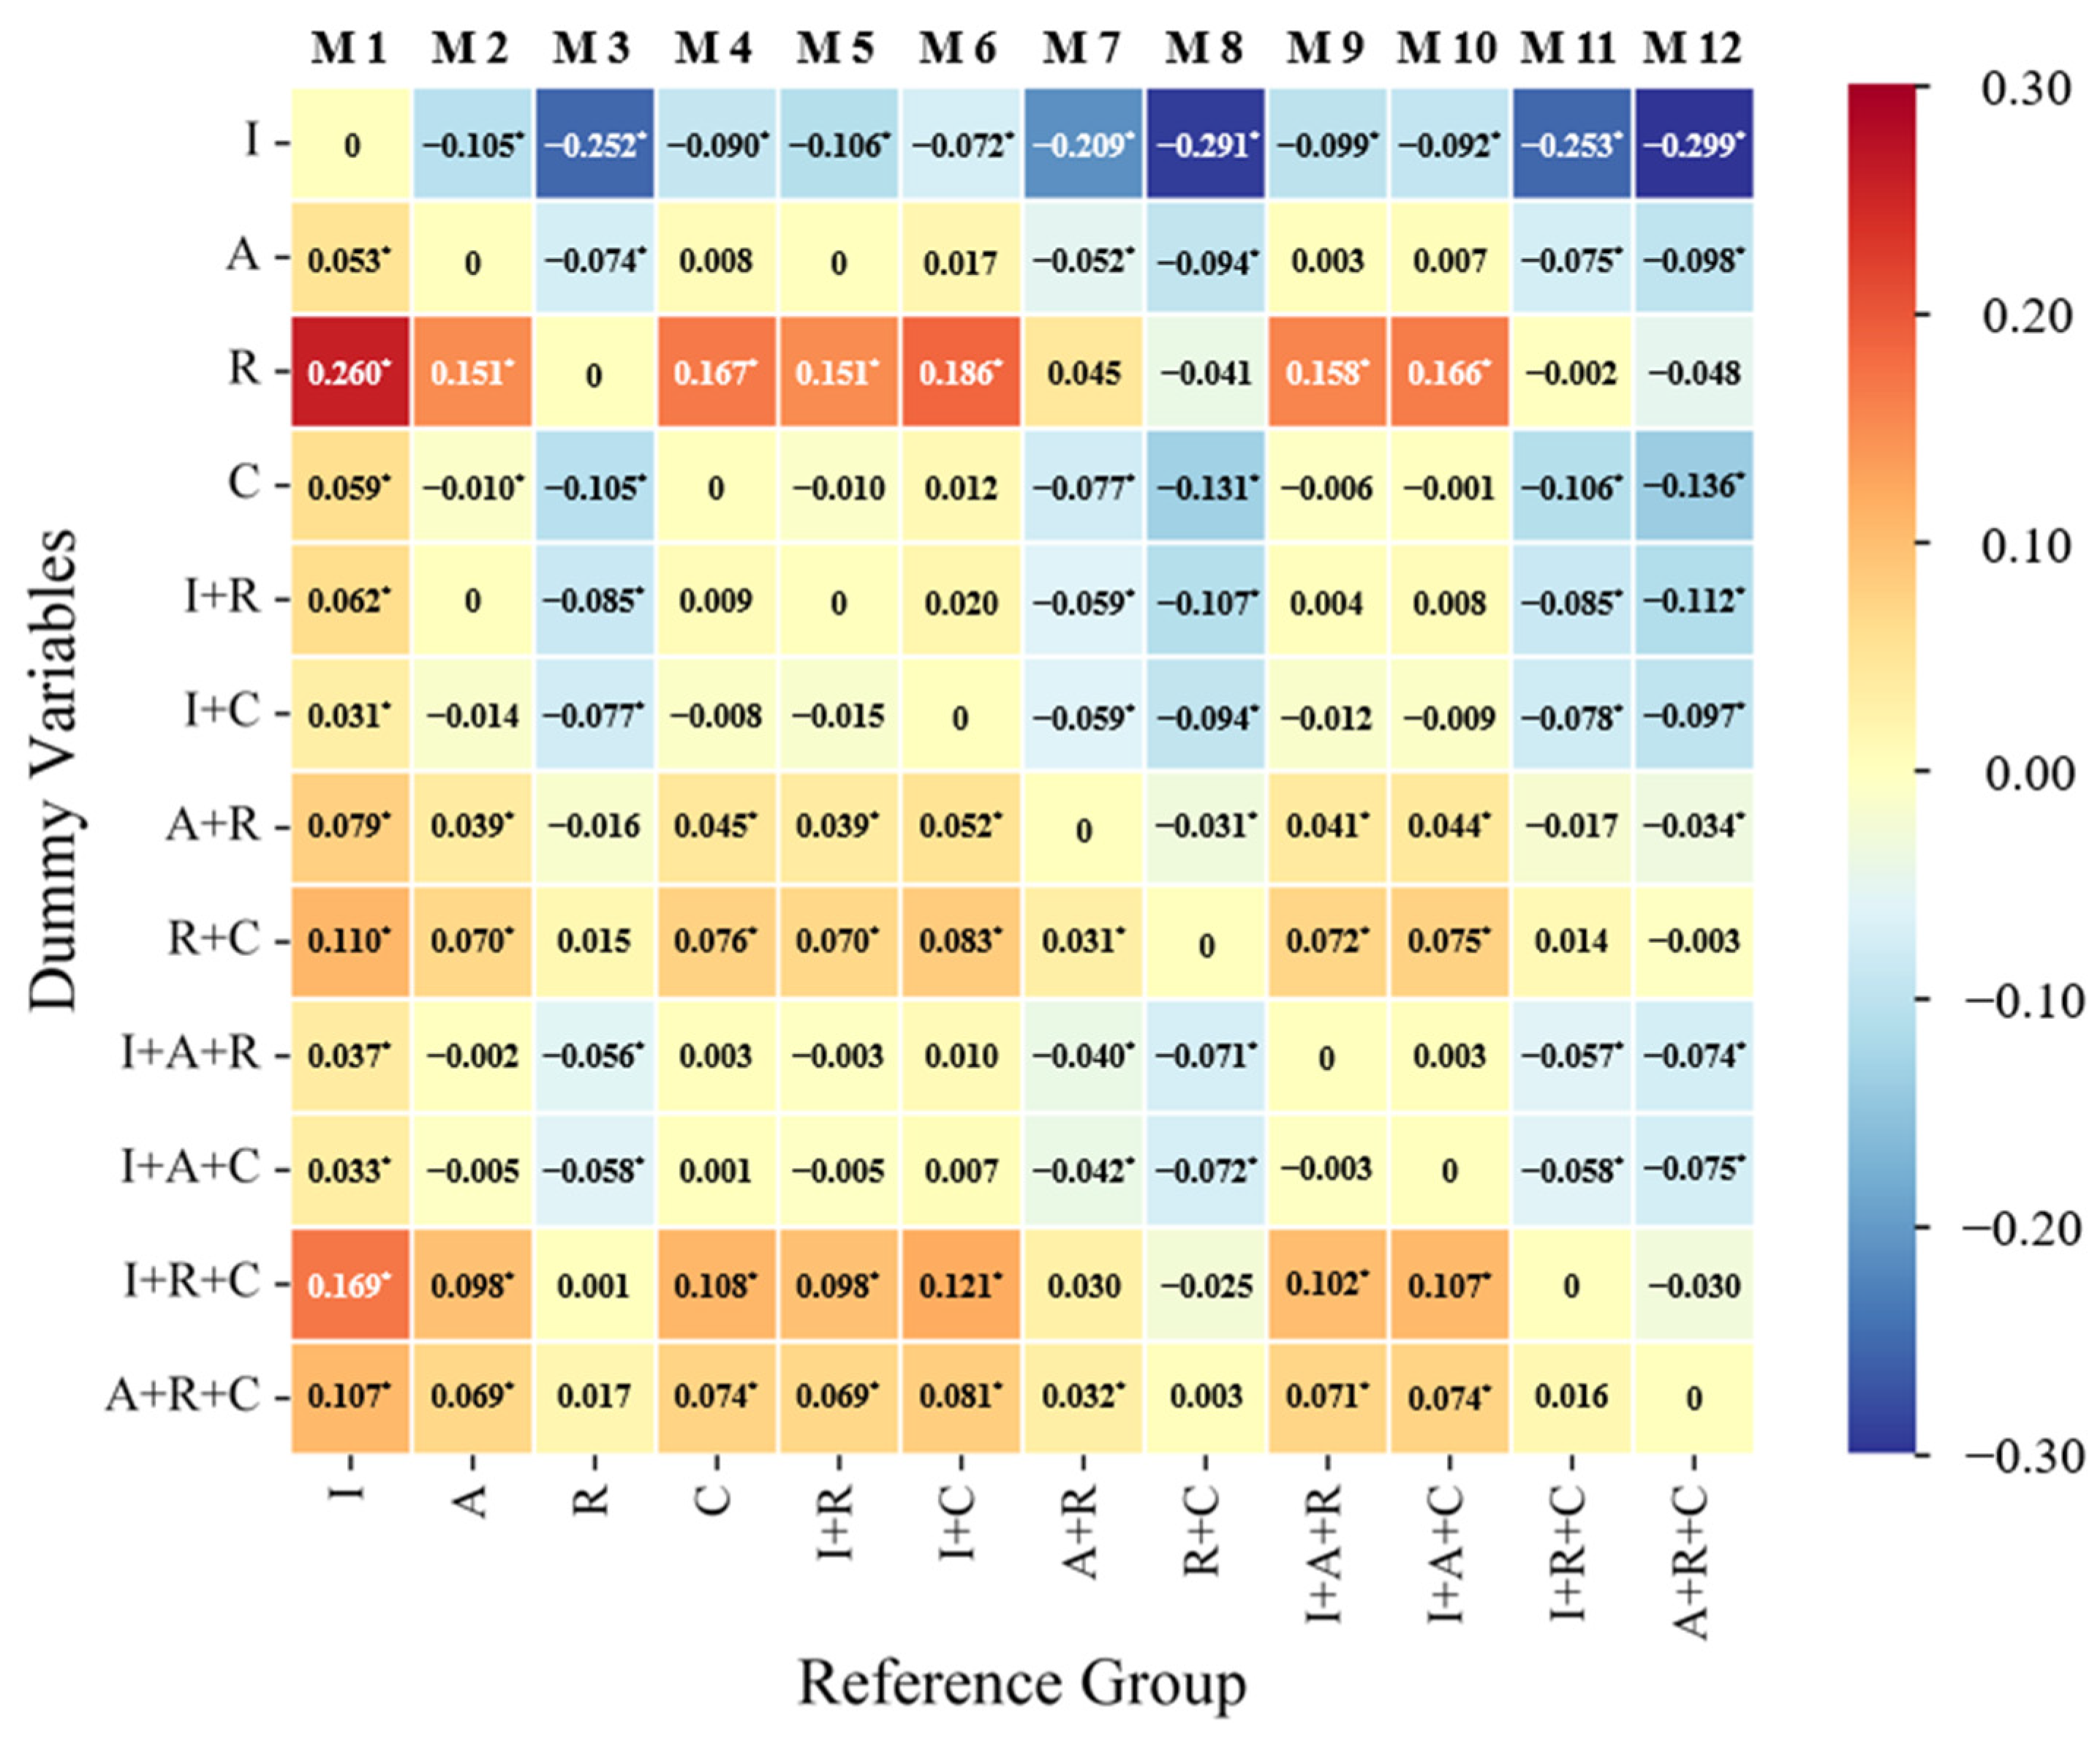
4.2.1. Impact of Mixed Land Use Types on Urban Vibrancy Intensity
4.2.2. Impact of Mixed Land Use Types on Urban Vibrancy Stability
5. Discussion
5.1. Validation of Results
5.2. Policy Implications
5.3. Contributions and Deficiencies
6. Conclusions
- (1)
- The consistency between the land use status data of Shenzhen constructed using the method proposed in this study and the real land use situation was as high as 86.67%, so could be used for further analysis.
- (2)
- The mixed land use types containing industrial land were mainly concentrated in the northern industrial area of Shenzhen, while the mixed land use types containing residential, commercial and services, or administrative and public services land were mainly concentrated in the city center. The spatial distribution trends in urban vibrancy intensity and stability were inconsistent in most areas of Shenzhen, indicating the problem of “jobs–housing mismatch” and low urban vibrancy in the peripheral areas of the city.
- (3)
- There were differences in the urban vibrancy enhancement among the different mixed land use types. The urban vibrancy intensity of the mixed land use types that included residential or commercial land related to residents’ daily living conditions or consumption was stronger. The urban vibrancy stability of the mixed land use types containing industrial land related to residents’ daily work was stronger. For the urban center area, the urban vibrancy stability can be improved by reasonably improving housing supply to encourage residents to live nearby, appropriately increasing the layout of pollution-free industries, or evacuating some workplaces outside the urban central area. For the peripheral area of the city, providing residents with more living and consumption space can promote the enhancement in urban vibrancy intensity.
Author Contributions
Funding
Data Availability Statement
Conflicts of Interest
Appendix A
Appendix A.1. Detailed Information on the Results of Models 1–12

| β1–β8 | M1–M12 |
|---|---|
| Building density | −0.018 |
| Plot ratio | 0.016 |
| Facility density | 0.291 *** |
| Road density | 0.187 *** |
| Vegetation coverage | −0.150 *** |
| City center | −0.204 *** |
| Subway station | −0.154 *** |
| Bus station | −0.111 *** |
| Adjusted R2 | 0.551 |
| δ1–δ12 | M1 | M2 | M3 | M4 | M5 | M6 | M7 | M8 | M9 | M10 | M11 | M12 |
|---|---|---|---|---|---|---|---|---|---|---|---|---|
| I | — | −0.105 *** | −0.252 *** | −0.090 *** | −0.106 *** | −0.072 ** | −0.209 *** | −0.291 *** | −0.099 ** | −0.092 ** | −0.253 *** | −0.299 *** |
| A | 0.053 *** | — | −0.074 *** | 0.008 | 0.000 | 0.017 | −0.052 ** | −0.094 *** | 0.003 | 0.007 | −0.075 *** | −0.098 *** |
| R | 0.260 *** | 0.151 *** | — | 0.167 *** | 0.151 *** | 0.186 *** | 0.045 | −0.041 | 0.158 *** | 0.166 *** | −0.002 | −0.048 |
| C | 0.059 *** | −0.010 | −0.105 *** | — | −0.010 | 0.012 | −0.077 *** | −0.131 *** | −0.006 | −0.001 | −0.106 *** | −0.136 *** |
| I+R | 0.062 *** | 0.000 | −0.085 *** | 0.009 | — | 0.020 | −0.059 ** | −0.107 *** | 0.004 | 0.008 | −0.085 *** | −0.112 *** |
| I+C | 0.031 ** | −0.014 | −0.077 *** | −0.008 | −0.015 | — | −0.059 *** | −0.094 *** | −0.012 | −0.009 | −0.078 *** | −0.097 *** |
| A+R | 0.079 *** | 0.039 ** | −0.016 | 0.045 *** | 0.039 ** | 0.052 *** | — | −0.031 * | 0.041 ** | 0.044 ** | −0.017 | −0.034 * |
| R+C | 0.110 *** | 0.070 *** | 0.015 | 0.076 *** | 0.070 *** | 0.083 *** | 0.031 * | — | 0.072 *** | 0.075 *** | 0.014 | −0.003 |
| I+A+R | 0.037 ** | −0.002 | −0.056 *** | 0.003 | −0.003 | 0.010 | −0.040 ** | −0.071 *** | — | 0.003 | −0.057 *** | −0.074 *** |
| I+A+C | 0.033 ** | −0.005 | −0.058 *** | 0.001 | −0.005 | 0.007 | −0.042 ** | −0.072 *** | −0.003 | — | −0.058 *** | −0.075 *** |
| I+R+C | 0.169 *** | 0.098 *** | 0.001 | 0.108 *** | 0.098 *** | 0.121 *** | 0.030 | −0.025 | 0.102 *** | 0.107 *** | — | −0.030 |
| A+R+C | 0.107 *** | 0.069 *** | 0.017 | 0.074 *** | 0.069 *** | 0.081 *** | 0.032 * | 0.003 | 0.071 *** | 0.074 *** | 0.016 | — |
Appendix A.2. Detailed Information on the Results of Models 13–24
| β1–β8 | M13–M24 |
|---|---|
| Building density | −0.062 *** |
| Plot ratio | 0.093 *** |
| Facility density | 0.112 *** |
| Road density | 0.151 *** |
| Vegetation coverage | −0.049 *** |
| City center | −0.197 *** |
| Subway station | −0.222 *** |
| Bus station | −0.201 *** |
| Adjusted R2 | 0.410 |
| δ1–δ12 | M13 | M14 | M15 | M16 | M17 | M18 | M19 | M20 | M21 | M22 | M23 | M24 |
|---|---|---|---|---|---|---|---|---|---|---|---|---|
| I | — | −0.105 *** | −0.097 *** | −0.165 *** | −0.041 | −0.197 *** | −0.124 *** | −0.120 ** | −0.028 | −0.154 *** | −0.160 *** | −0.192 *** |
| A | 0.053 *** | — | 0.004 | −0.030 * | 0.032 * | −0.047 * | −0.010 | −0.008 | 0.039 | −0.025 | −0.028 | −0.044 * |
| R | 0.101 *** | −0.008 | — | −0.070 ** | 0.059 * | −0.103 ** | −0.027 | −0.024 | 0.071 * | −0.059 | −0.064 ** | −0.098 ** |
| C | 0.107 *** | 0.039 * | 0.044 *** | — | 0.081 *** | −0.021 | 0.027 | 0.029 | 0.089 *** | 0.007 | 0.003 | −0.018 |
| I+R | 0.024 | −0.037 * | −0.033 * | −0.072 *** | — | −0.091 | −0.048 * | −0.046 * | 0.007 | −0.066 ** | −0.069 *** | −0.088 *** |
| I+C | 0.085 *** | 0.040 * | 0.043 ** | 0.014 | 0.067 *** | — | 0.031 | 0.033 | 0.072 *** | 0.018 | 0.016 | 0.002 |
| A+R | 0.047 *** | 0.007 | 0.010 | −0.016 | 0.031 * | −0.028 | — | 0.001 | 0.036 * | −0.012 | −0.014 | −0.026 |
| R+C | 0.045 ** | 0.006 | 0.009 | −0.017 | 0.030 * | −0.029 | −0.001 | — | 0.035 * | −0.013 | −0.015 | −0.027 |
| I+A+R | 0.010 | −0.028 | −0.025 * | −0.050 *** | −0.005 | −0.062 *** | −0.035 * | −0.034 * | — | −0.046 ** | −0.048 *** | −0.060 ** |
| I+A+C | 0.056 *** | 0.018 | 0.020 | −0.004 | 0.041 ** | −0.015 | 0.011 | 0.012 | 0.045 ** | — | −0.002 | −0.014 |
| I+R+C | 0.106 *** | 0.036 | 0.041 ** | −0.003 | 0.079 *** | −0.025 | 0.024 | 0.026 | 0.087 *** | 0.004 | — | −0.022 |
| A+R+C | 0.069 *** | 0.031 * | 0.034 ** | 0.010 | 0.054 *** | −0.002 | 0.024 | 0.026 | 0.058 ** | 0.013 | 0.012 | — |
References
- Pan, H.; Yang, C.; Quan, L.; Liao, L. A New Insight into Understanding Urban Vitality: A Case Study in the Chengdu-Chongqing Area Twin-City Economic Circle, China. Sustainability 2021, 13, 10068. [Google Scholar] [CrossRef]
- Shi, J.-G.; Miao, W.; Si, H. Visualization and Analysis of Mapping Knowledge Domain of Urban Vitality Research. Sustainability 2019, 11, 988. [Google Scholar] [CrossRef]
- Lan, F.; Gong, X.; Da, H.; Wen, H. How do population inflow and social infrastructure affect urban vitality? Evidence from 35 large- and medium-sized cities in China. Cities 2020, 100, 102454. [Google Scholar] [CrossRef]
- Woodworth, M.D.; Wallace, J.L. ‘Seeing ghosts: Parsing China’s “ghost city” controversy’. Urban Geogr. 2017, 38, 1270–1281. [Google Scholar] [CrossRef]
- Jin, X.; Long, Y.; Sun, W.; Lu, Y.; Yang, X.; Tang, J. Evaluating cities’ vitality and identifying ghost cities in China with emerging geographical data. Cities 2017, 63, 98–109. [Google Scholar] [CrossRef]
- Fang, C.; He, S.; Wang, L. Spatial Characterization of Urban Vitality and the Association with Various Street Network Metrics from the Multi-Scalar Perspective. Front. Public Health 2021, 9, 677910. [Google Scholar] [CrossRef]
- Jacobs, J. The Death and Life of Great American Cities; Vintage Books: Vancouver, WA, USA, 2012. [Google Scholar]
- Farjam, R.; Hossieni Motlaq, S.M. Does urban mixed use development approach explain spatial analysis of inner city decay? J. Urban Manag. 2019, 8, 245–260. [Google Scholar] [CrossRef]
- Zhang, M.; Zhao, P. The impact of land-use mix on residents’ travel energy consumption: New evidence from Beijing. Transp. Res. Part D Transp. Environ. 2017, 57, 224–236. [Google Scholar] [CrossRef]
- Gan, Z.; Feng, T.; Wu, Y.; Yang, M.; Timmermans, H. Station-based average travel distance and its relationship with urban form and land use: An analysis of smart card data in Nanjing City, China. Transp. Policy 2019, 79, 137–154. [Google Scholar] [CrossRef]
- Cervero, R.; Kockelman, K. Travel demand and the 3Ds: Density, diversity, and design. Transp. Res. Part D Transp. Environ. 1997, 2, 199–219. [Google Scholar] [CrossRef]
- Duncan, M.J.; Winkler, E.; Sugiyama, T.; Cerin, E.; duToit, L.; Leslie, E.; Owen, N. Relationships of Land Use Mix with Walking for Transport: Do Land Uses and Geographical Scale Matter? J. Urban Health 2010, 87, 782–795. [Google Scholar] [CrossRef] [PubMed]
- Ewing, R.; Cervero, R. Travel and the Built Environment. J. Am. Plan. Assoc. 2010, 76, 265–294. [Google Scholar] [CrossRef]
- Rowley, A. Mixed-use Development: Ambiguous concept, simplistic analysis and wishful thinking? Plan. Pract. Res. 1996, 11, 85–98. [Google Scholar] [CrossRef]
- Aurand, A. Density, Housing Types and Mixed Land Use: Smart Tools for Affordable Housing? Urban Stud. 2010, 47, 1015–1036. [Google Scholar] [CrossRef]
- Gu, D.; Newman, G.; Kim, J.-H.; Park, Y.; Lee, J. Neighborhood decline and mixed land uses: Mitigating housing abandonment in shrinking cities. Land Use Policy 2019, 83, 505–511. [Google Scholar] [CrossRef]
- Frank, L.D.; Schmid, T.L.; Sallis, J.F.; Chapman, J.; Saelens, B.E. Linking objectively measured physical activity with objectively measured urban form: Findings from SMARTRAQ. Am. J. Prev. Med. 2005, 28, 117–125. [Google Scholar] [CrossRef]
- Wu, Y.-T.; Prina, A.M.; Jones, A.; Barnes, L.E.; Matthews, F.E.; Brayne, C.; Mrc, C. Land use mix and five-year mortality in later life: Results from the Cognitive Function and Ageing Study. Health Place 2016, 38, 54–60. [Google Scholar] [CrossRef]
- Sohn, D.-W.; Yoon, D.K.; Lee, J. The impact of neighborhood permeability on residential burglary risk: A case study in Seattle, USA. Cities 2018, 82, 27–34. [Google Scholar] [CrossRef]
- Geyer, H.; Quin, L. Social diversity and modal choice strategies in mixed land-use development in South Africa. S. Afr. Geogr. J. 2019, 101, 1–21. [Google Scholar] [CrossRef]
- Koster, H.R.A.; Rouwendal, J. The impact of mixed land use on residential property values. J. Reg. Sci. 2012, 52, 733–761. [Google Scholar] [CrossRef]
- Liu, D.; Shi, Y. The Influence Mechanism of Urban Spatial Structure on Urban Vitality Based on Geographic Big Data: A Case Study in Downtown Shanghai. Buildings 2022, 12, 569. [Google Scholar] [CrossRef]
- Shi, H.; Zhao, M.; Simth, D.A.; Chi, B. Behind the Land Use Mix: Measuring the Functional Compatibility in Urban and Sub-Urban Areas of China. Land 2022, 11, 2. [Google Scholar] [CrossRef]
- Hu, Q.; Shen, W.; Yan, J.; Kong, W.; Li, W.; Zhang, Z. Does existing mixed land development promote the urban spatial composite function? Evidence from Beijing, China. Land Use Policy 2024, 143, 107212. [Google Scholar] [CrossRef]
- Shi, B.; Yang, J. Scale, distribution, and pattern of mixed land use in central districts: A case study of Nanjing, China. Habitat. Int. 2015, 46, 166–177. [Google Scholar] [CrossRef]
- Liu, S.; Zhang, L.; Long, Y. Urban Vitality Area Identification and Pattern Analysis from the Perspective of Time and Space Fusion. Sustainability 2019, 11, 4032. [Google Scholar] [CrossRef]
- Yue, W.; Chen, Y.; Zhang, Q.; Liu, Y. Spatial Explicit Assessment of Urban Vitality Using Multi-Source Data: A Case of Shanghai, China. Sustainability 2019, 11, 638. [Google Scholar] [CrossRef]
- Lu, S.; Huang, Y.; Shi, C.; Yang, X. Exploring the Associations Between Urban Form and Neighborhood Vibrancy: A Case Study of Chengdu, China. ISPRS Int. J. Geo-Inf. 2019, 8, 165. [Google Scholar] [CrossRef]
- Xu, Y.; Chen, X. Quantitative analysis of spatial vitality and spatial characteristics of urban underground space (UUS) in metro area. Tunn. Undergr. Space Technol. 2021, 111, 103875. [Google Scholar] [CrossRef]
- Fan, Z.; Duan, J.; Luo, M.; Zhan, H.; Liu, M.; Peng, W. How Did Built Environment Affect Urban Vitality in Urban Waterfronts? A Case Study in Nanjing Reach of Yangtze River. ISPRS Int. J. Geo-Inf. 2021, 10, 611. [Google Scholar] [CrossRef]
- Chen, W.; Wu, A.N.; Biljecki, F. Classification of urban morphology with deep learning: Application on urban vitality. Comput. Environ. Urban 2021, 90, 101706. [Google Scholar] [CrossRef]
- Liu, S.; Zhang, L.; Long, Y.; Long, Y.; Xu, M. A New Urban Vitality Analysis and Evaluation Framework Based on Human Activity Modeling Using Multi-Source Big Data. ISPRS Int. J. Geo-Inf. 2020, 9, 617. [Google Scholar] [CrossRef]
- Wu, W.; Niu, X. Influence of Built Environment on Urban Vitality: Case Study of Shanghai Using Mobile Phone Location Data. J. Urban Plan. Dev. 2019, 145, 04019007. [Google Scholar] [CrossRef]
- Kim, S. Urban Vitality, Urban Form, and Land Use: Their Relations within a Geographical Boundary for Walkers. Sustainability 2020, 12, 10633. [Google Scholar] [CrossRef]
- Yin, J.; Dong, J.; Hamm, N.A.S.; Li, Z.; Wang, J.; Xing, H.; Fu, P. Integrating remote sensing and geospatial big data for urban land use mapping: A review. Int. J. Appl. Earth Obs. 2021, 103, 102514. [Google Scholar] [CrossRef]
- Tu, Y.; Chen, B.; Zhang, T.; Xu, B. Regional Mapping of Essential Urban Land Use Categories in China: A Segmentation-Based Approach. Remote Sens. 2020, 12, 1058. [Google Scholar] [CrossRef]
- Chen, B.; Xu, B.; Gong, P. Mapping essential urban land use categories (EULUC) using geospatial big data: Progress, challenges, and opportunities. Big Earth Data 2021, 5, 410–441. [Google Scholar] [CrossRef]
- Kang, Y.; Wang, Y.; Xia, Z.; Chi, J.; Jiao, L.; Wei, Z. Identification and Classification of Wuhan Urban Districts Based on POI. J. Geomat. 2018, 43, 81–85. (In Chinese) [Google Scholar] [CrossRef]
- Sun, J.; Wang, H.; Song, Z.; Lu, J.; Meng, P.; Qin, S. Mapping Essential Urban Land Use Categories in Nanjing by Integrating Multi-Source Big Data. Remote Sens. 2020, 12, 2386. [Google Scholar] [CrossRef]
- Chen, S.; Tao, H.; Li, X.; Zhuo, L. Discovering urban functional regions using latent semantic information: Spatiotemporal data mining of floating cars GPS data of Guangzhou. Acta Geogr. Sin. 2016, 71, 471–483. (In Chinese) [Google Scholar] [CrossRef]
- Gu, Y.; Jiao, L.; Dong, T.; Wang, Y.; Xu, G. Spatial Distribution and Interaction Analysis of Urban Functional Areas Based on Multi-source Data. Geomat. Inf. Sci. Wuhan Univ. 2018, 43, 1113–1121. (In Chinese) [Google Scholar] [CrossRef]
- Chi, J.; Jiao, L.; Dong, T.; Gu, Y.; Ma, Y. Quantitative identification and visualization of urban functional area based on POI data. J. Geomat. 2016, 41, 68–73. (In Chinese) [Google Scholar] [CrossRef]
- Lynch, K. Good City Form; MIT Press: Cambridge, MA, USA, 1984. [Google Scholar]
- Maas, P.R. Towards a Theory of Urban Vitality; University of British Colombia: Vancouver, BC, Canada, 1984. [Google Scholar]
- Montgomery, J. Making a city: Urbanity, vitality and urban design. J. Urban Des. 1998, 3, 93–116. [Google Scholar] [CrossRef]
- Balsas, C.J.L. Exciting walk-only precincts in Asia, Europe and North-America. Cities 2021, 112, 103129. [Google Scholar] [CrossRef]
- Xiao, L.; Liu, J. Exploring non-linear built environment effects on urban vibrancy under COVID-19: The case of Hong Kong. Appl. Geogr. 2023, 155, 102960. [Google Scholar] [CrossRef]
- Chen, Z.; Huang, B. Achieving urban vibrancy through effective city planning: A spatial and temporal perspective. Cities 2024, 152, 105230. [Google Scholar] [CrossRef]
- Zhang, Z.; Zhao, L.; Zhang, M. Exploring non-linear urban vibrancy dynamics in emerging new towns: A case study of the Wuhan metropolitan area. Sustain. Cities Soc. 2024, 112, 105580. [Google Scholar] [CrossRef]
- Chen, L.; Zhao, L.; Xiao, Y.; Lu, Y. Investigating the spatiotemporal pattern between the built environment and urban vibrancy using big data in Shenzhen, China. Comput. Environ. Urban Syst. 2022, 95, 101827. [Google Scholar] [CrossRef]
- Chen, T.; Hui, E.C.M.; Wu, J.; Lang, W.; Li, X. Identifying urban spatial structure and urban vibrancy in highly dense cities using georeferenced social media data. Habitat Int. 2019, 89, 102005. [Google Scholar] [CrossRef]
- Lang, W.; Lang, H.; Hui, E.C.M.; Chen, T.; Wu, J.; Jahre, M. Measuring urban vibrancy of neighborhood performance using social media data in Oslo, Norway. Cities 2022, 131, 103908. [Google Scholar] [CrossRef]
- Ouyang, J.; Fan, H.; Wang, L.; Zhu, D.; Yang, M. Revealing urban vibrancy stability based on human activity time-series. Sustain. Cities Soc. 2022, 85, 104053. [Google Scholar] [CrossRef]
- Xia, F.; Lu, P. Can mixed land use promote social integration? Multiple mediator analysis based on spatiotemporal big data in Beijing. Land Use Policy 2023, 132, 106800. [Google Scholar] [CrossRef]
- Jacobs-Crisioni, C.; Rietveld, P.; Koomen, E.; Tranos, E. Evaluating the Impact of Land-Use Density and Mix on Spatiotemporal Urban Activity Patterns: An Exploratory Study Using Mobile Phone Data. Environ. Plan. A 2014, 46, 2769–2785. [Google Scholar] [CrossRef]
- Shenzhen Municipality Bureau of Statistics. 2022 Shenzhen Statistical Yearbook; China Statistics Press: Beijing, China, 2022. (In Chinese)
- Shenzhen Municipal People’s Government. Shenzhen Urban Planning Standards and Guidelines, 2019. Available online: https://www.sz.gov.cn/attachment/1/1133/1133901/10013132.pdf (accessed on 29 August 2024). (In Chinese)
- Shanghai Municipal Bureau of Planning and Land Resources Management. Technical Guidelines for Regulatory Detailed Planning of Shanghai, 2016. Available online: https://hd.ghzyj.sh.gov.cn/zcfg/ghbz/201701/P020170111543883631659.pdf (accessed on 29 August 2024). (In Chinese)
- Silverman, B.W. Density Estimation for Statistics and Data Analysis; Routledge: New York, NY, USA, 1998. [Google Scholar] [CrossRef]
- Pan, C.; Zhou, J.; Huang, X. Impact of Check-In Data on Urban Vitality in the Macao Peninsula. Sci. Program. 2021, 2021, 7179965. [Google Scholar] [CrossRef]
- Sung, H.; Lee, S. Residential built environment and walking activity: Empirical evidence of Jane Jacobs’ urban vitality. Transp. Res. Part D Transp. Environ. 2015, 41, 318–329. [Google Scholar] [CrossRef]
- Xia, C.; Yeh, A.G.-O.; Zhang, A. Analyzing spatial relationships between urban land use intensity and urban vitality at street block level: A case study of five Chinese megacities. Landsc. Urban Plan. 2020, 193, 103669. [Google Scholar] [CrossRef]
- Mouratidis, K.; Poortinga, W. Built environment, urban vitality and social cohesion: Do vibrant neighborhoods foster strong communities? Landsc. Urban Plan. 2020, 204, 103951. [Google Scholar] [CrossRef]
- Katz, P. The New Urbanism: Toward an Architecture of Community; McGraw-Hill: New York, NY, USA, 1994. [Google Scholar]
- Yue, H.; Zhu, X. Exploring the Relationship between Urban Vitality and Street Centrality Based on Social Network Review Data in Wuhan, China. Sustainability 2019, 11, 4356. [Google Scholar] [CrossRef]
- Liu, Y.; Zhao, P.; Liang, J. Study on Urban Vitality Based on LBS Data: A Case of Beijing within 6th Ring Road. Areal Res. Dev. 2018, 37, 64–69+87. (In Chinese) [Google Scholar]
- Lu, S.; Shi, C.; Yang, X. Impacts of Built Environment on Urban Vitality: Regression Analyses of Beijing and Chengdu, China. Int. J. Environ. Res. Public Health 2019, 16, 4592. [Google Scholar] [CrossRef]
- Pan, W.; Du, J. Towards sustainable urban transition: A critical review of strategies and policies of urban village renewal in Shenzhen, China. Land Use Policy 2021, 111, 105744. [Google Scholar] [CrossRef]
- Hu, R. The planned and unplanned. In The Shenzhen Phenomenon: From Fishing Village to Global Knowledge City; Routledge: London, UK, 2020; Volume 3, pp. 41–78. [Google Scholar] [CrossRef]
- Zhao, X.; Xia, N.; Li, M. 3-D multi-aspect mix degree index: A method for measuring land use mix at street block level. Comput. Environ. Urban Syst. 2023, 104, 102005. [Google Scholar] [CrossRef]
- Li, S.; Chen, P.; Hui, F.; Gong, M. Evaluating urban vitality and resilience under the influence of the COVID-19 pandemic from a mobility perspective: A case study in Shenzhen, China. J. Transp. Geogr. 2024, 117, 103886. [Google Scholar] [CrossRef]
- Li, Z.; Zhao, G. Revealing the Spatio-Temporal Heterogeneity of the Association between the Built Environment and Urban Vitality in Shenzhen. ISPRS Int. J. Geo-Inf. 2023, 12, 433. [Google Scholar] [CrossRef]
- Chen, Y.; Yu, B.; Shu, B.; Yang, L.; Wang, R. Exploring the spatiotemporal patterns and correlates of urban vitality: Temporal and spatial heterogeneity. Sustain. Cities Soc. 2023, 91, 104440. [Google Scholar] [CrossRef]
- Yang, H.; Fu, M.; Wang, L.; Tang, F. Mixed Land Use Evaluation and Its Impact on Housing Prices in Beijing Based on Multi-Source Big Data. Land 2021, 10, 1103. [Google Scholar] [CrossRef]
- Doan, Q.C.; Ma, J.; Chen, S.; Zhang, X. Nonlinear and threshold effects of the built environment, road vehicles and air pollution on urban vitality. Landsc. Urban Plan. 2025, 253, 105204. [Google Scholar] [CrossRef]
- Rehman, A.; Asghar, Z. Mixed Use of Land in Big cities of Pakistan and its Impact on Reduction in commuting and Congestion Cost. J. Archit. Plan. 2016, 21, 17–28. [Google Scholar]
- Kong, H.; Sui, D.Z.; Tong, X.; Wang, X. Paths to mixed-use development: A case study of Southern Changping in Beijing, China. Cities 2015, 44, 94–103. [Google Scholar] [CrossRef]
- Bontje, M. Shenzhen: Satellite city or city of satellites? Int. Plan. Stud. 2019, 24, 255–271. [Google Scholar] [CrossRef]


| Data Type | Source | Accessed Date | Received Date | Purpose |
|---|---|---|---|---|
| Road data | Amap (https://lbs.amap.com) | 13 May 2021 | 13 May 2021 | To obtain the boundaries of blocks |
| POI data | Amap (https://lbs.amap.com) | 19 March 2021 | 25 March 2021 | To determine the land use types of blocks |
| Baidu heatmap | Baidu Maps (https://lbsyun.baidu.com/) | 19 May 2021 | 19 May 2021 | To measure the urban vibrancy of blocks |
| AOI data | Baidu Maps (https://lbsyun.baidu.com/) | 14 September 2021 | 17 September 2021 | To determine the land use types of blocks |
| Sentinel-2 remote sensing data | GEE platform (https://developers.google.cn/earth-engine) | 5 September 2021 | 5 September 2021 | To extract impervious layers in the study area |
| Building footprint data | Tianditu (https://www.tianditu.gov.cn) | 14 November 2021 | 23 November 2021 | To determine the building density and plot ratio of blocks |
| Land Use Type | Abbreviation and Code | Scope of Land Use Type |
|---|---|---|
| Industrial land | Industrial (I) | Land that is dominated by activities such as production, manufacturing, and finishing of products, and is supported by activities such as research and development, design, testing, and management. |
| Administration and public services land | Administration (A) | Land for administration, culture, education, scientific research, sports, medical and healthcare, social welfare, public security, religion, and land of a special nature. |
| Transportation land | Transportation (T) | Land for regional transportation, urban roads, rail transit, transportation facilities, etc. |
| Residential land | Residential (R) | Land for residential buildings and corresponding supporting service facilities. |
| Green space and public square land | Green (G) | Land for public open spaces, such as parks, green spaces, and squares. |
| Commercial and service land | Commercial (C) | Land used for various commercial sales, service activities, and accommodating various activities, such as offices, hotels, and amusement activities. |
| Area Proportion | Functional Importance |
|---|---|
| ≥70% | dominant function |
| 10~70% | main function |
| <10% | auxiliary function |
| Area Proportion | Functional Type | Land Use Type |
|---|---|---|
| one of Px ≥ 70% | Single function | X (Px ≥ 70%) |
| Px are all < 70% | Mixed functions | X1 + X2 +… < 70%, …) |
| Variable Name | Description of Variable (Units) | Min. | Mean | Max. |
|---|---|---|---|---|
| Urban vibrancy intensity | Average of heat value within the block (–) | 0.00 | 2.82 | 6.05 |
| Urban vibrancy stability | Standard deviation of heat value within the block (–) | 0.00 | 1.49 | 2.83 |
| Building density | Ratio of building footprint within a block to the area of the block (%) | 0.00 | 0.63 | 10.21 |
| Plot ratio | Ratio of gross floor area within a block to the area of the block (–) | 0.00 | 13.56 | 331.57 |
| Facility density | Number of POI points per unit area within a block (pcs/m2) | 0.00 | 0.00 | 0.04 |
| Road density | Length of roads per unit area within a block (m/m2) | 0.00 | 0.03 | 0.14 |
| Vegetation coverage | Vegetation coverage calculated by using the dimidiate pixel model (%) | 0.00 | 0.32 | 0.84 |
| City center | Shortest straight-line distance between the centroid of the block and the city center (m) | 174.03 | 19,569.50 | 44,864.79 |
| Subway station | Straight-line distance between the centroid of the block and the nearest subway station (m) | 31.37 | 1848.85 | 25,204.02 |
| Bus station | Straight-line distance between the centroid of the block and the nearest bus stop (m) | 7.10 | 194.27 | 863.90 |
| Mixed land use type | Quantify by setting dummy variables with values of 0 or 1 | 0.00 | — | 1.00 |
Disclaimer/Publisher’s Note: The statements, opinions and data contained in all publications are solely those of the individual author(s) and contributor(s) and not of MDPI and/or the editor(s). MDPI and/or the editor(s) disclaim responsibility for any injury to people or property resulting from any ideas, methods, instructions or products referred to in the content. |
© 2024 by the authors. Licensee MDPI, Basel, Switzerland. This article is an open access article distributed under the terms and conditions of the Creative Commons Attribution (CC BY) license (https://creativecommons.org/licenses/by/4.0/).
Share and Cite
Yang, H.; Wang, L.; Tang, F.; Fu, M.; Xiong, Y. Differences in Urban Vibrancy Enhancement among Different Mixed Land Use Types: Evidence from Shenzhen, China. Land 2024, 13, 1661. https://doi.org/10.3390/land13101661
Yang H, Wang L, Tang F, Fu M, Xiong Y. Differences in Urban Vibrancy Enhancement among Different Mixed Land Use Types: Evidence from Shenzhen, China. Land. 2024; 13(10):1661. https://doi.org/10.3390/land13101661
Chicago/Turabian StyleYang, Hanbing, Li Wang, Feng Tang, Meichen Fu, and Yuqing Xiong. 2024. "Differences in Urban Vibrancy Enhancement among Different Mixed Land Use Types: Evidence from Shenzhen, China" Land 13, no. 10: 1661. https://doi.org/10.3390/land13101661
APA StyleYang, H., Wang, L., Tang, F., Fu, M., & Xiong, Y. (2024). Differences in Urban Vibrancy Enhancement among Different Mixed Land Use Types: Evidence from Shenzhen, China. Land, 13(10), 1661. https://doi.org/10.3390/land13101661