Article

Towards Sustainable Rural Development: Assessment Spatio-Temporal Evolution of Rural Ecosystem Health through Integrating Ecosystem Integrity and SDGs

1
School of Architecture, Tsinghua University, Beijing 100084, China
2
Faculty of Architecture and Urban Planning, Chongqing University, Chongqing 400044, China
3
Key Laboratory of New Technology for Construction of Cities in Mountain Area, Chongqing 400030, China
4
China Railway Eryuan Engineering Group Co., Ltd., Chengdu 610031, China
*
Author to whom correspondence should be addressed.
Land 2024, 13(10), 1672; https://doi.org/10.3390/land13101672
Submission received: 8 September 2024 / Revised: 4 October 2024 / Accepted: 10 October 2024 / Published: 14 October 2024
(This article belongs to the Section Land Environmental and Policy Impact Assessment)

Abstract

:
Rural ecosystem health (REH) serves as an effective metric for assessing the damage degree and stability state within rural systems and their components. It reflects the interaction and the balance among rural subsystems, emphasizing the harmonious development of resources, agriculture, environment, economy, and society that are fundamental to sustainable rural development. Most regional-scale ecosystem health assessments primarily focus on either the natural state of the ecosystem or external disturbances affecting it, often neglecting human ecological systems characterized by economic and social dimensions. Taking Chongqing as an example, we established an improved REH assessment framework by integrating ecological integrity from the perspective of a social-economy-natural compound ecosystem. Furthermore, we innovatively incorporated the Sustainable Development Goals (SDGs) into the formulation of the REH indicator system to quantitatively elucidate the spatiotemporal characteristics. The results indicated that: (1) The REH in Chongqing exhibited an evolutionary pattern characterized by a subsequent rise, maintaining values between 0.363–0.872 from 2000 to 2018. This trend reflected a distinct two-stage development characteristic, with the rural socio-economic subsystem contributing the most at 33.36%, followed closely by the rural environmental subsystem at 27.84%; (2) In 2018, the REH across the 36 districts and counties in Chongqing displayed spatial differentiation patterns described as “collapse in the west, high levels in the northeast, and localized surges”. The areas ranked from smallest to largest REH were metropolitan, western, southeastern, and northeastern areas; (3) Four levels (e.g., disease, single health, compound health, and comprehensive health) and twelve sub-levels of REH were defined using a dominant factors method. Finally, we analyzed the driving factors from four aspects of urbanization development: policy regulation, urban-rural factors flow, and regional differences. We also proposed differentiated planning and policies for sustainable rural development in Chongqing.

1. Introduction

Rural areas differ from urban environments and refer to the spaces where laborers primarily engage in agricultural production. They are a compound ecosystem characterized by the mutual interactions among the natural environment, agriculture, economy, society, and human activities. Rural ecosystem health (REH), as an indicator of a stable state embodied by rural resources, environment, agriculture, society, and economy, can be understood as the aggregate of interactions between various subsystems and individuals within a specific temporal and spatial context. It not only possesses the capacity for material and energy supply to meet reasonable human needs but also exhibits stability, self-regulation, and resilience against stress-induced damage [1,2]. Since the advent of global urbanization strategy and Sustainable Development Goals (SDGs), there has been rapid integration between urban and rural areas; urbanization has significantly contributed to improvements in rural social and economic conditions; advancements in agricultural technology; revitalization of rural industries; and enhancement of settlement environments. However, it has also generated negative impacts on the REH, such as continuous deterioration of rural natural resources, agricultural chemical pollution, and landscape encroachment. Consequently, many developing countries and less developed nations such as China, Southeast Asia, and African countries are experiencing substantial ecological load pressures on their REH [3,4,5,6]. Therefore, focusing on the REH will facilitate appropriate guidance for rural resource utilization, ecological environment protection, and restoration and promote rural agriculture and socio-economic sustainable development [2].
In China, rural areas are extensive, with the rural population constituting approximately 41.48% of the total population; the REH directly influences the prospects for sustainable development in a context characterized by a large population, limited natural resources, and fragile ecosystems [7]. Currently, China is undergoing a crucial transition in rural development; there are excessive human intervention phenomena such as population non-agricultural, land non-grain, land abandoned, and non-ecological artificial environments in rural areas. The rural areas exhibit an unnatural compression of production space. Consequently, the ecological environment faces damage and degradation within its internal structure and functions; this instability often manifests as an unhealthy state influenced by urban land expansion, pollution emissions, environmental load stressors, and artificial production interventions [8,9,10]. However, issues related to REH have not received adequate attention compared to urban ecosystems. It is well-known that the urban ecosystem and rural ecosystem are integral and inseparable, and long-term neglect of rural ecosystem input will hinder effective governance concerning ecological environmental protection.
As a newly proposed concept, ecosystem health research has garnered wide discussion in recent decades, and it was regarded as the ultimate goal of environmental management, ecological restoration, and spatial planning policy [11,12]. Grounded in land ecology, studies on ecosystem health have extensively drawn upon the notion of land health that emerged in the late 20th century [7,13], emphasizing the resilience and stability of ecosystems to external disturbances [4,14,15,16] while also highlighting the service and support functions that ecosystems provide for human beings. It posited that ecosystems function akin to organisms with an inherent capacity for resistance to interference and possess the ability to meet legitimate social needs while maintaining the fundamental capacity for self-sustenance and renewal, such as the ability to provide food, drinking water, clean air, and recycle waste [16,17,18]. Currently, there is increasing focus on ecosystem health assessment, primarily involving applications within specific ecological domains and enhancements of assessment methodologies across various contexts, including regional forests, rivers, agriculture, mining, wetland, and urban areas [12,14,15,18,19,20,21,22,23,24,25]. Numerous innovative evaluation methods have been introduced to further broaden the field of ecosystem health evaluation, such as the VOR (Vigour-organization-Resilience) model, VORES (Vigour-organization-Resilience-Ecosystem service), VORES (Vigour-organization-Resilience-Ecosystem service), VORSDR (Vigour-organization-Resilience-Ecosystem services-Supply-Demand Ratio), multi-level grey correlation analysis model, REHI index (Rural ecosystem health index), PSR (pressure-state-response), DSR (driving force—state-response model) and DPSIR (driving force—pressure-state-influence—response model), etc. [2,26,27,28,29,30,31,32,33,34,35]. For example, in prior studies, Rapport et al. proposed ecosystem maladjustment symptoms as an indicator of an unhealthy state of the ecosystem, including the decline of the nutrient pool, primary productivity, body size distribution, and species diversity [2]. Costanza et al. used vigor, organization, and resilience metrics to evaluate ecosystem health [36]. In China, scholars have primarily discussed the connotation, spatial-temporal characteristics, and functional assessment of ecosystem health. Notably, there has been growing emphasis on the analysis and evaluation of empirical research conducted in typical areas with unique geographical conditions, covering urban forests, wetland nature reserves, natural rivers, mining areas of mineral resources, etc. [10,12,21,22,23].
Further review of the literature showed that ecosystem health evaluations have primarily concentrated on indicator systems, evaluation methods, and the application of different geographical ecosystem fields. This focus has evolved from a singular evaluation of temporal evolution patterns to an exploration of spatiotemporal dynamics, transitioning towards the assessment of agro-environment-socio-economic complex systems rather than relying solely on traditional environmental assessments. The evaluation methods could be summarized into three categories: Firstly, functional indicators were used to diagnose the disaster symptoms and health status of natural ecosystems based on the VOR assessment framework; this approach predominantly emphasized single-dimensional assessments while neglecting the integrative aspects of social and economic systems [33,37,38]. Secondly, methodologies including PSR, DSR, and DPSIR [2,11,12,28] methods, which focused on the single-dimensional natural ecosystems assessment to reveal the internal evolution mechanism around the interaction between ecosystems and human activities, these approaches often overlook effective measures for maintaining ecosystem integrity; Thirdly, there was a shift towards understanding ecosystem integrity through the lens of socio-economic-natural complex systems and moving away from single-dimensional assessments toward more comprehensive evaluations that considered socio-economic factors alongside ecological ones [2,33,34,35]. Currently prevalent evaluation methods for ecosystem health tend to emphasize either a singular state or self-organizing dynamic processes within natural ecosystems and frequently disregard the integral condition of complex ecosystem measurements when viewed from a composite perspective encompassing both societal and economic dimensions.
Rural ecosystems encompass the intricate characteristics of a typical natural ecosystem alongside a highly artificial socioeconomic system. It represents a comprehensive expression formed by the interactions of energy, population, and capital flows among humans, resources, agriculture, environment, society, and economy. In this context, resources and environment subsystems directly influence natural capital input, while socio-economic subsystems serve as external driving factors that affect rural production relations and material wealth accumulation (Figure 1). In other words, a rural ecosystem, also known as a social-economic-natural complex ecosystem, is composed of societal, economic, and natural conditions, emphasizing the integral connection between the human system and the ecosystem [34,35]. An innovative research direction may be the measurement of the REH in terms of the natural-socio-economic subsystems, which emphasizes ecosystem integrity and Sustainable Development Goals. However, the existing Sustainable Development Goals (SDGSs) related to REH assessment are insufficiently addressed and deviate from SDGSs objectives. Most previous index systems have primarily relied on single-dimensional assessments of natural ecosystem states that do not align with international reference standards. To address these shortcomings, an improved REH evaluation framework was proposed for mountainous areas. It mainly focused on the integrity connotation of the ecosystem and incorporated the SDGSs into the indicator selection of REH.
An enhanced framework for assessing REH in mountainous regions is proposed, focusing on two key aspects: (1) Emphasizing the stable state of the constituent subsystems from the perspective of ecosystem integrity within rural complex ecosystems. This approach not only prioritizes the health of rural resources, environment, and agriculture ecosystem but also emphasizes the health of rural socio-economic subsystems; (2) Currently, there remains a significant gap in relevant and universal applicable reference indicators for REH assessment, especially in mountainous and rural areas characterized by unique geographical ecological environment and conflict arising from human-land interactions. Furthermore, existing assessments often inadequately consider economic and social Sustainable Development Goals related to REH evaluation, and many outcomes derived from previous regional natural ecosystem health assessments do not align with international reference indicators pertinent to these Sustainable Development Goals (SDGs). Our study establishes an improved REH evaluation method from the perspective of ecosystem integrity and innovatively integrates the Sustainable Development Goal (SDGSs17) into the mountainous REH indicator system. The temporal evolution and spatial differentiation characteristics of REH from 2000 to 2018 in Chongqing are discussed and propose differentiated planning regulation suggestions according to the evaluation results.

2. Methods and Data Source

2.1. Integrating SDGs into Rural Ecosystem Health Assessments

The ultimate objectives of rural sustainable development involve effectively managing the balanced relationship between humans and rural ecosystems; in other words, the artificial capital increase of human activity construction relying on rural endowment does not damage and reduce the resilience of rural ecosystems capital [5,39]. Based on the above, we propose that the REH is reflected by the stable state of each subsystem and interprets as four subsystem health (Figure 1): rural resources subsystem (RRS), agriculture subsystem (RAS), environment subsystem (REnvS) and socio-economic subsystem (RSecS). Among them, RRS and RAS are natural capital that belongs to the intrinsic underlying condition affecting the state of the REH; the artificial external socio-economic subsystem (RSecS) is the accumulation of artificial capitalists and indirectly affects the REH, which adversely changes the rural internal characteristics. The ultimate goal of integrating Sustainable Development Goals into the REH assessment is to achieve healthy and sustainable development between coupled human systems and rural ecosystems.
The improved REH assessment framework for mountain areas in Chongqing is proposed through integrating rural ecosystem integrity and Sustainable Development Goals (Figure 2).

2.2. Study Area

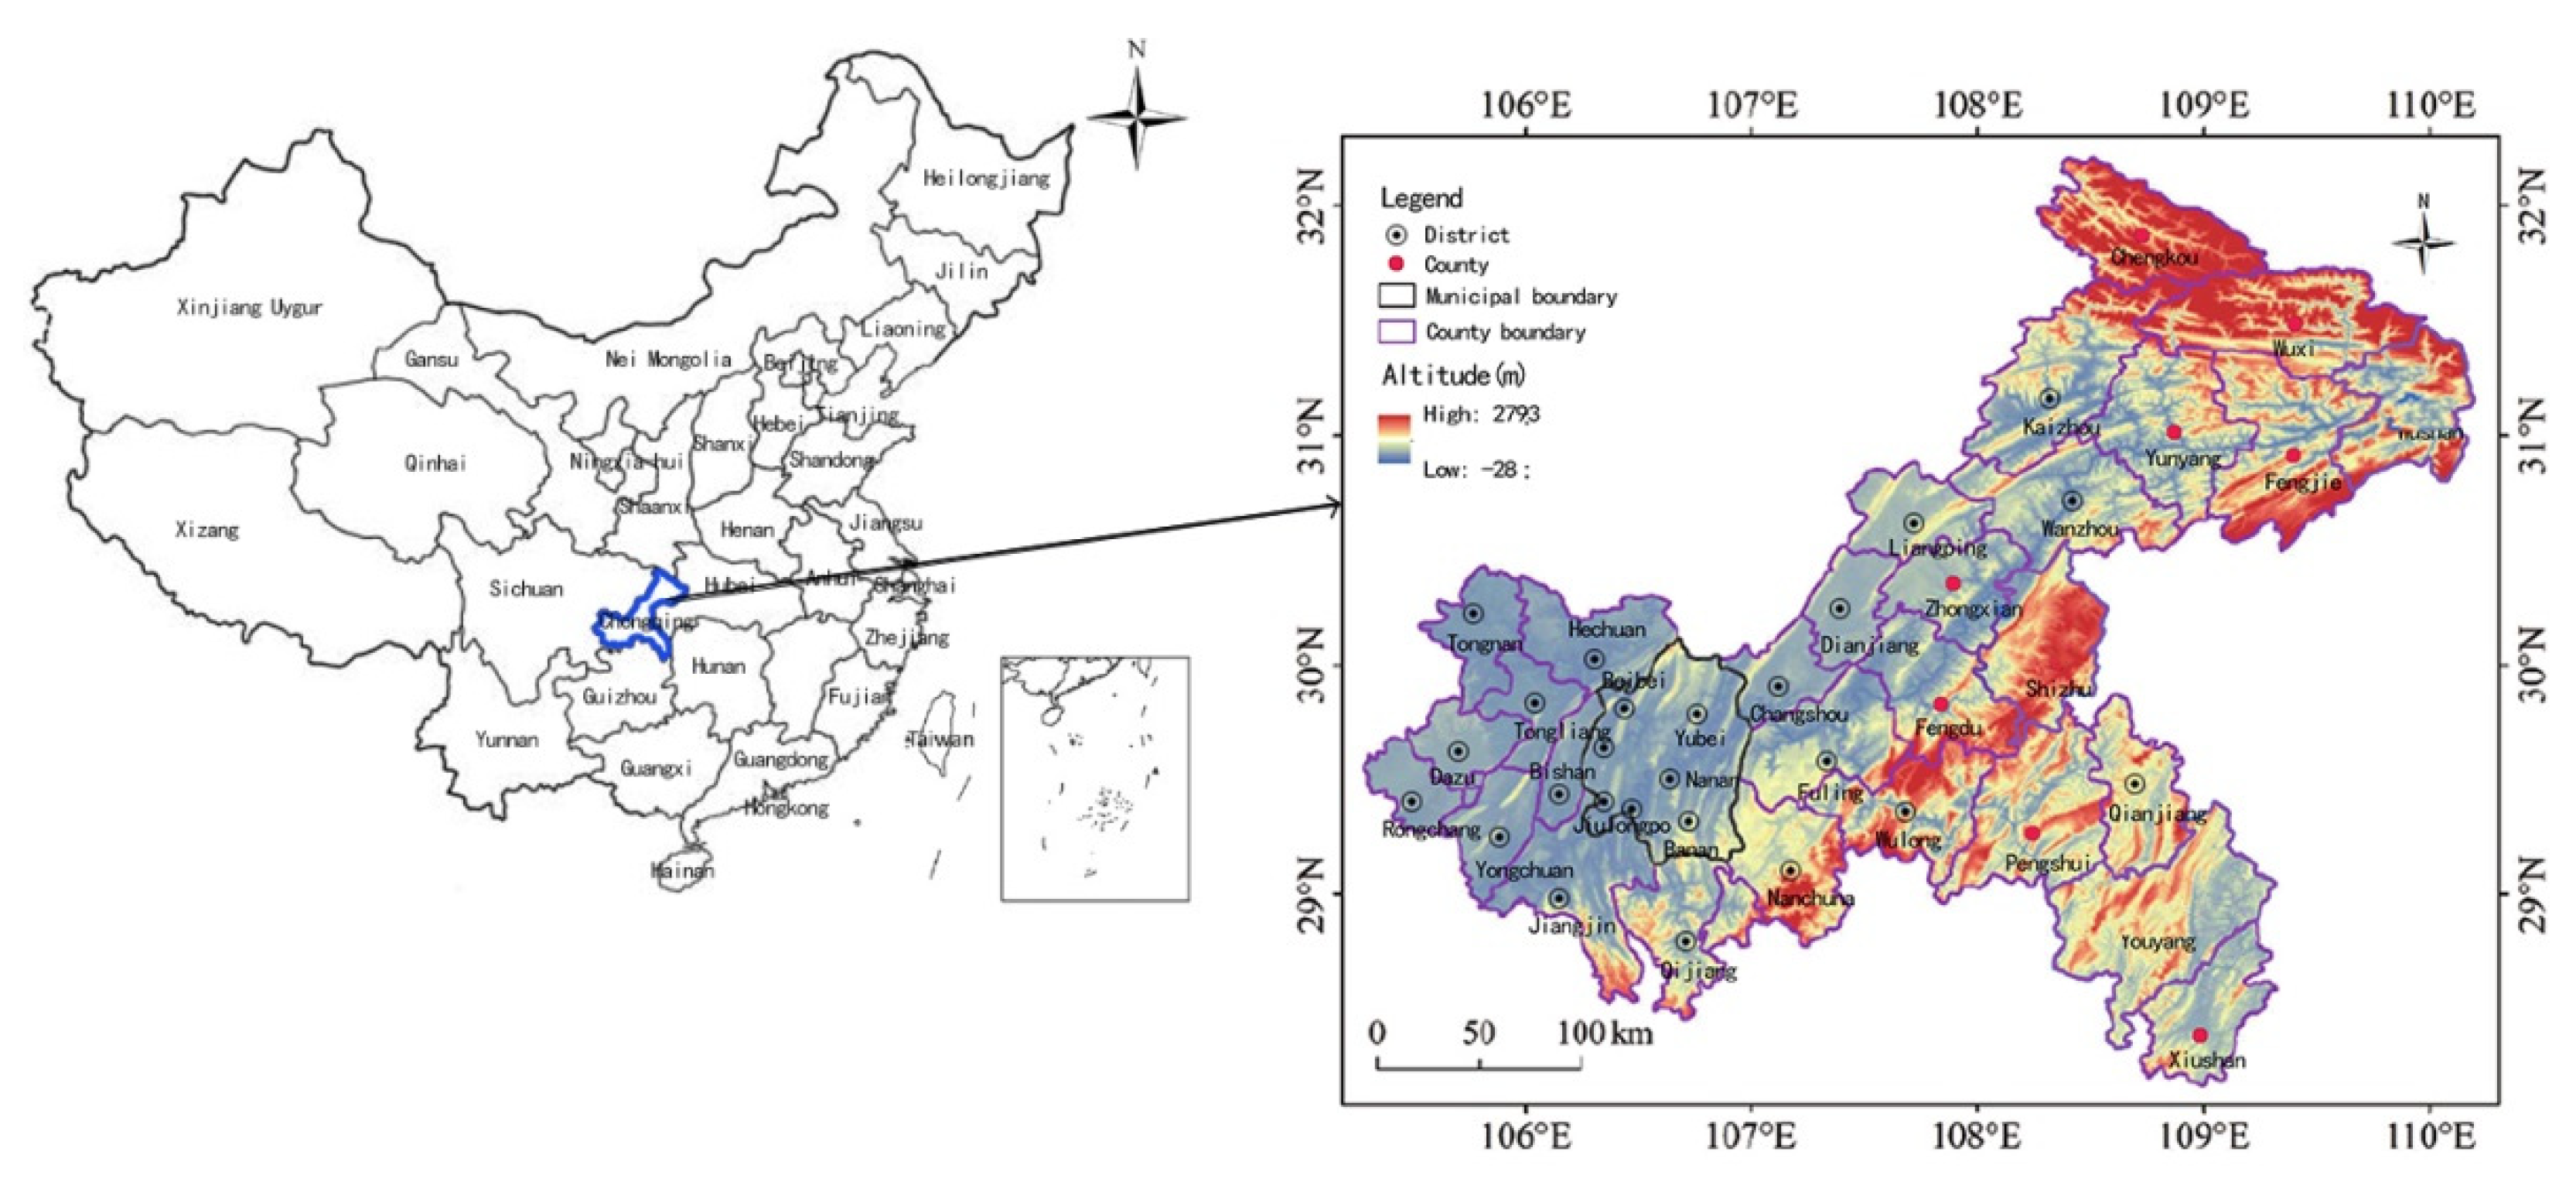
Chongqing (28°10′ N~32°13′ N, 105°11′ E~110°11′ E) is located in the parallel mountains and valleys of eastern Sichuan, characterized by an elevation difference of up to 2700 m. The region is predominantly hilly and mountainous, encompassing a total area of 82,400 km2 and governing 38 districts and counties. As a mountainous municipality with a significant ecological environment and topographic features in the west of China (Figure 2), Chongqing serves as an empirical case for this study based on several reasons: (1) Since the implementation of “Experimental Zone for Urban-Rural Integration Development” strategies, there have been notable improvements in rural socio-economic condition, agricultural production technology, rural tourism industry, and habitation environment. The mode of rural development and construction experiences exhibit distinct regional characteristics typical of the southwestern mountainous region; (2) In recent years, with the execution of policies aimed at “supporting agriculture and benefiting farmers”, Chongqing has witnessed rapid advancements in its rural society and economy. Concurrently, both the status and pattern of rural ecosystems have also undergone significant transformations; some rural areas are now facing ecosystem-related challenges. Therefore, this study takes 36 districts and counties in Chongqing from 2000 to 2018 as the case study (Figure 3).

2.3. Data Sources

Taking the county-level administrative scale as the research spatial unit facilitates the collection of detailed data [2,5,23,32]. This includes 36 districts and counties that serve as administrative management and data statistics units (Chongqing comprises a total of 38 districts and counties; for this evaluation, Yuzhong District and Jiangbei District are excluded due to their achievement of 100% urbanization). Considering the availability and accuracy of data samples, the time series analysis data were conducted using data from 2000 to 2018 in both spatial and temporal dimensions, and the spatial data of 36 districts and counties were based on information from the year 2018.
  • Spatio-temporal data mainly consist of vector spatial data, land use data, and natural, social and economic statistics. Among them, the administrative division boundaries (1:50,000) and Chongqing Topographic map (1:500,000) mainly rely on the “Chongqing 1:50,000 Topographic Map (2018)” exported by the Geographic Information Center.
  • Land use change (LUCC) data were derived from Landsat TM/ETM/OLI remote sensing images. According to the existing land use/land cover classification system, land use types were divided into six primary and 25 secondary categories.
  • The socio-economic and environmental data mainly come from the Chongqing Statistical Yearbook (2000–2018), the Chongqing Annual Report of Environmental Statistics (2000–2018), the Third National Agricultural Census in 2016 (Chongqing), the Three-Five-Year Plan, Chongqing Municipal People’s Government website, Chongqing Agricultural Commission website, etc. SPSS21 and ArcGIS 10.2 were used for data preprocessing, analysis, and visual presentation.

2.4. Rural Ecosystem Health Evaluation Indicator System

Our study proposes an evaluation framework and evaluation indicators from the perspective of the integrity of rural socio-economic-natural ecosystems. Specifically, the REH hinges on the stability of the rural society, economy, nature, agriculture, and environment. Among them, the rural ecosystem encompasses five components: rural resources subsystem (RRS), agriculture subsystem (RAS), environment subsystem (REnvS), and socio-economic subsystem (RSecS). Rural natural capital is transformed into socio-economic wealth accumulation through the process of information, energy, and material flow and then invested in the development of social subsystems [2,40]. Hence, this paper selects the evaluation index dimension of the REH from the four aspects of rural resources, agriculture, environment, economy, and society, further integrating the Sustainable Development Goal (SDGs17) into the index system, including cultivated land area per capita, sown area of farm corps, proportion of high-quality days, energy consumption, density of rural population indicators, Engel coefficient of rural residents, etc. (Table 1).

2.4.1. Rural Resources Subsystem Health (RRS)

The RRS aligns with the Sustainable Development Goals’ objective of “zero hunger, life below water, and life on land”, emphasizing the stable capacity of rural ecosystems to meet human activities’ reasonable needs and self-maintenance and renewal. The subsystem is dependent on natural resources, cultivated land capacity, water resources, and forest endowment potential. This study selected four indicators to characterize the health status of the rural resource subsystem, including cultivated land area per capita, water resources per capita, irrigation area per capita, and forest coverage rate. Cultivated land area per capita is calculated as the ratio of cultivated land area to rural population. Similarly, water resources per capita represent the condition of rural land and water resources. The irrigation area per capita is determined by the combined area of paddy fields and irrigated land that can be effectively irrigated with irrigation equipment, reflecting the suitable tillage condition of cultivated land. Furthermore, the forest coverage rate serves as a crucial indicator for assessing the abundance of forest resources.

2.4.2. Rural Agricultural Subsystem Health (RAS)

The RAS is a vital characteristic of the agricultural production system, as it helps to avoid “maladjustment symptoms”, manage stress, and ensure sustainable agricultural production. It encompasses chemical technique use, human production disturbance, and agricultural production capacity. Four indicators have been selected to characterize the health status of rural agricultural subsystems; sown area of farm crops per capita refers to the area sown or transplanted by agricultural production operators on all land (arable or non-arable) in the calendar year. Chemical fertilizer use intensity and chemical pesticide use intensity represents the disturbance of human production activities, reflecting human production activities’ impact and the adoption of cleaner production technology. The grain output per capita represents the sustainable production capacity of rural agricultural products.

2.4.3. Rural Environmental Subsystem Health (REnvS)

The REnvS aligns with the Sustainable Development Goals’ objectives of promoting “clean water and sanitation, responsible consumption and production, and climate action.” The focus is on enhancing the resilience of rural ecosystems to sustain themselves and regenerate. This is contingent upon factors such as rural disasters and interruptions to agricultural production. Six indicators have been selected to characterize the health status of the REnvS. Comprehensive energy consumption characterizes the intensity of rural production activities, while acid rain frequency and crop disaster area per year indicate disaster disturbance. The rate of water quality up to standard, the proportion of high-quality days, and the biological richness index in rural areas represent the basic ability to maintain healthy production. Among these indicators, the rate of water quality is up to standard, and the proportion of high-quality days reflects the condition of rural water and air quality. The biological richness index refers to the stable state of the rural ecosystem obtained by calculating the three indicators of plant richness, the proportion of the area of the nature reserve, and wildlife richness according to HJ 623-2011 Evaluation Criteria for Regional Biodiversity.

2.4.4. Rural Socioeconomic Subsystem Health (RSecS)

The RSecS represents the ultimate goal of investing in rural natural capital to enhance the well-being of rural residents, which reflects the production and living conditions of rural residents and aligns with the Sustainable Development Goals, including “no poverty, decent work, and economic growth, industrial innovation and infrastructure, no poverty, zero hunger, affordable clean energy”. Eight indicators are selected to characterize the health status of the rural socioeconomic subsystem, per capita self-owned housing, and general public budgetary expenditure represent rural material construction conditions. The per capita output value of agriculture, forestry, animal husbandry and fishery, the density of rural population, per capita rural electricity consumption, rural employment population, and the Engel coefficient of rural residents represent the production and living conditions of rural residents.

2.5. Determination of Indicator Weights and Rural Ecosystem Health Evaluation Models

2.5.1. Standardizing the Initial Indicators

Rural ecosystem health assessment includes 22 indicators; each indicator has different numerical units and meanings. Therefore, it is necessary to eliminate the influence of units and dimensions and obtain dimensionless results ranging from 0 to 1. The standardization of indicators is divided into positive indicators and negative indicators:
Positive   indicator :   Y i j = X i j min X i max x i min x i
Negative   indicator :   Y i j = max X i j X i max X i min X i
where X i j and Y i j refer to the initial and the standardized value of indicator j in system i, respectively, max Xi and min Xi are to the maximum and minimum values of similar indicator j in system i, respectively.

2.5.2. Calculating Entropy Value of Indicators Using Entropy Weight Method

The key to employing the index system method for evaluating the REH lies in the scientific determination of index weights. Research indicates that common methods for establishing these weights include the entropy method, principal component analysis, and analytic hierarchy [5,39]. Among them, the entropy weight method primarily ranks indicators based on the information derived from observations or statistics. Specifically, a lower information entropy associated with an indicator signifies a reduced level of informational disorder; thus, it provides more valuable insights and results in a higher weight assigned to that indicator [41,42,43]. In this paper, the entropy method is used to calculate the index weight of the REH evaluation, and Matlab is used to calculate the weight coefficient of each index (Table 1). The specific calculation steps are as follows:
(1) Calculating the proportion of the j indicator in system i:
P i j = Y i j i = 1 n Y i j ( j = 1,2 , 3 . n )
(2) Calculating entropy value of the j indicator, the formula is:
e j = k i = 1 n P i j log ( P i j )
In the formula, where k > 0, k = 1/ln(n), the constant k is related to the number of samples n, P i j is the proportion of the j indicator, e j ≥ 0.
(3) Calculating the j indicator difference coefficient g i , the greater the difference coefficient g i , the greater the effect on evaluation, and the smaller the entropy value, the formula is:
g j = 1 e j
(4) Calculating the j indicator weight W i , the formula is:
W j = g j j = 1 n g j , j = 1,2 , 3 . n
j = 1 n W j = 1 ,   ( 0 W j 1 )

2.5.3. Calculating the REH Comprehensive Level

R R S = j = 1 n Y i j W j
R A S = j = 1 n Y i j W j
R E n v S = j = 1 n Y i j W j
R S e c S = j = 1 n Y i j W j
R E H = R R S + R A S + R E n v S + R S e c S
where R R S , R A S , R E n v S , a n d R S e c S are comprehensive level values of rural resources subsystem, agricultural subsystem, environmental subsystem and socioeconomic subsystem, respectively, Yij ( j = 1,2 , 3 . n ) is normalized indicator i values of R i subsystems ranged from 0 to 1, and W j are the weight coefficient of indicators i.

2.6. Identification of the Rural Ecosystem Health Spatial Types

The identification of the REH spatial types aims to accurately pinpoint areas of weakness within the REH framework and to explore suitable planning methodologies. Given the complex composition and mechanism of the rural ecosystem, the impacts from various subsystems, namely rural resources, agriculture, environment, economy, and society subsystems, exhibit significant variability. To effectively judge the REH spatial types, HC (hierarchical cluster analysis) is used to calculate the similar Euclidean distance of the comprehensive health level of rural ecosystems. This analysis categorizes them into four types: disease type, unhealthy type, sub-healthy type, and healthy type. Then, using the dominant element method and referencing classification criteria established by Wang et al. [44] and Li et al. [45]., twelve sub-categories are delineated based on the number of leading elements in each sub-system across districts and counties. The specific delineation criteria and methods are as follows:
Firstly, the similarity coefficient of the comprehensive level of the REH was calculated using Euclidean distance, and the comprehensive level of the REH was divided into four primary categories: disease type, unhealthy type, sub-healthy type, and healthy type. The calculation formula is as follows.
F i j = 1 n i = 1 n R i R j 2
In the formula, F i j is the Euclidean distance similarity coefficient of the comprehensive level of the REH in counties i and j, R i and R j are the comprehensive level values of the REH in counties i and j, and n is the number of counties in Chongqing, n = 36. The classification criteria of comprehensive health level are disease type < unhealthy type < sub-healthy type < healthy type.
Then, sub-classification is made according to the number of leading elements (auxiliary elements) of the subsystem:
C R i j = R i j R j ¯
(1)
When the number of dominant elements is n ≥ 3 (n ≤ 4) (CRij > 0), the REH type is defined as a comprehensive health type. This classification indicates that there are at least three sub-systems involved in the ecosystem health assessment of District I, encompassing five distinct types of comprehensive health categories.
(2)
When the number of dominant elements is n = 2 (n ≤ 4) (CRij > 0), the REH is defined as the compound health type. This indicates that there are two sub-systems in the ecosystem health assessment of district i, encompassing six distinct types of compound health classifications.
(3)
When the number of dominant elements is n = 1 (n ≤ 4) (CRij > 0), the REH type is defined as a single health type. This classification indicates that a sub-system exists associated with the dominant element in the ecosystem health assessment of district i. Based on the types of dominant elements, four categories can be identified: resource single health type, environment single health type, agriculture single health type, and socioeconomic single health type.
Sub-health, unhealthy, and disease are divided according to the health type, in which unhealthy and disease are determined according to the number of auxiliary factors.

3. Results

3.1. Weights of the REH Indicators System in Chongqing

The historical data of 22 indicators in 2018 was selected for entropy analysis, respectively, considering the time series characteristics of historical data and their mutual interference influence. The average weight was derived as the weight coefficient. Significant differences were observed among the four subsystems, with the key indicators of REH ranked from largest to smallest as follows: RSecS (33.36%), REnvS (27.84%), RRS (19.89%), and RAS (18.91%). Notably, RSecS and REnvS together accounted for over 62.2%, indicating that these two factors exerted the most substantial influence on the REH in Chongqing. Additionally, the five critical indicators with the highest weight coefficients were identified as follows: intensity of agricultural fertilizer use (6.98%), intensity of chemical pesticide use (6.49%), biological richness index (6.41%), Engel coefficient of rural residents (6.24%), and forest coverage rate (6.08%).

3.2. The Temporal Evolution of the Comprehensive Scores of the REH in Chongqing from 2000 to 2018

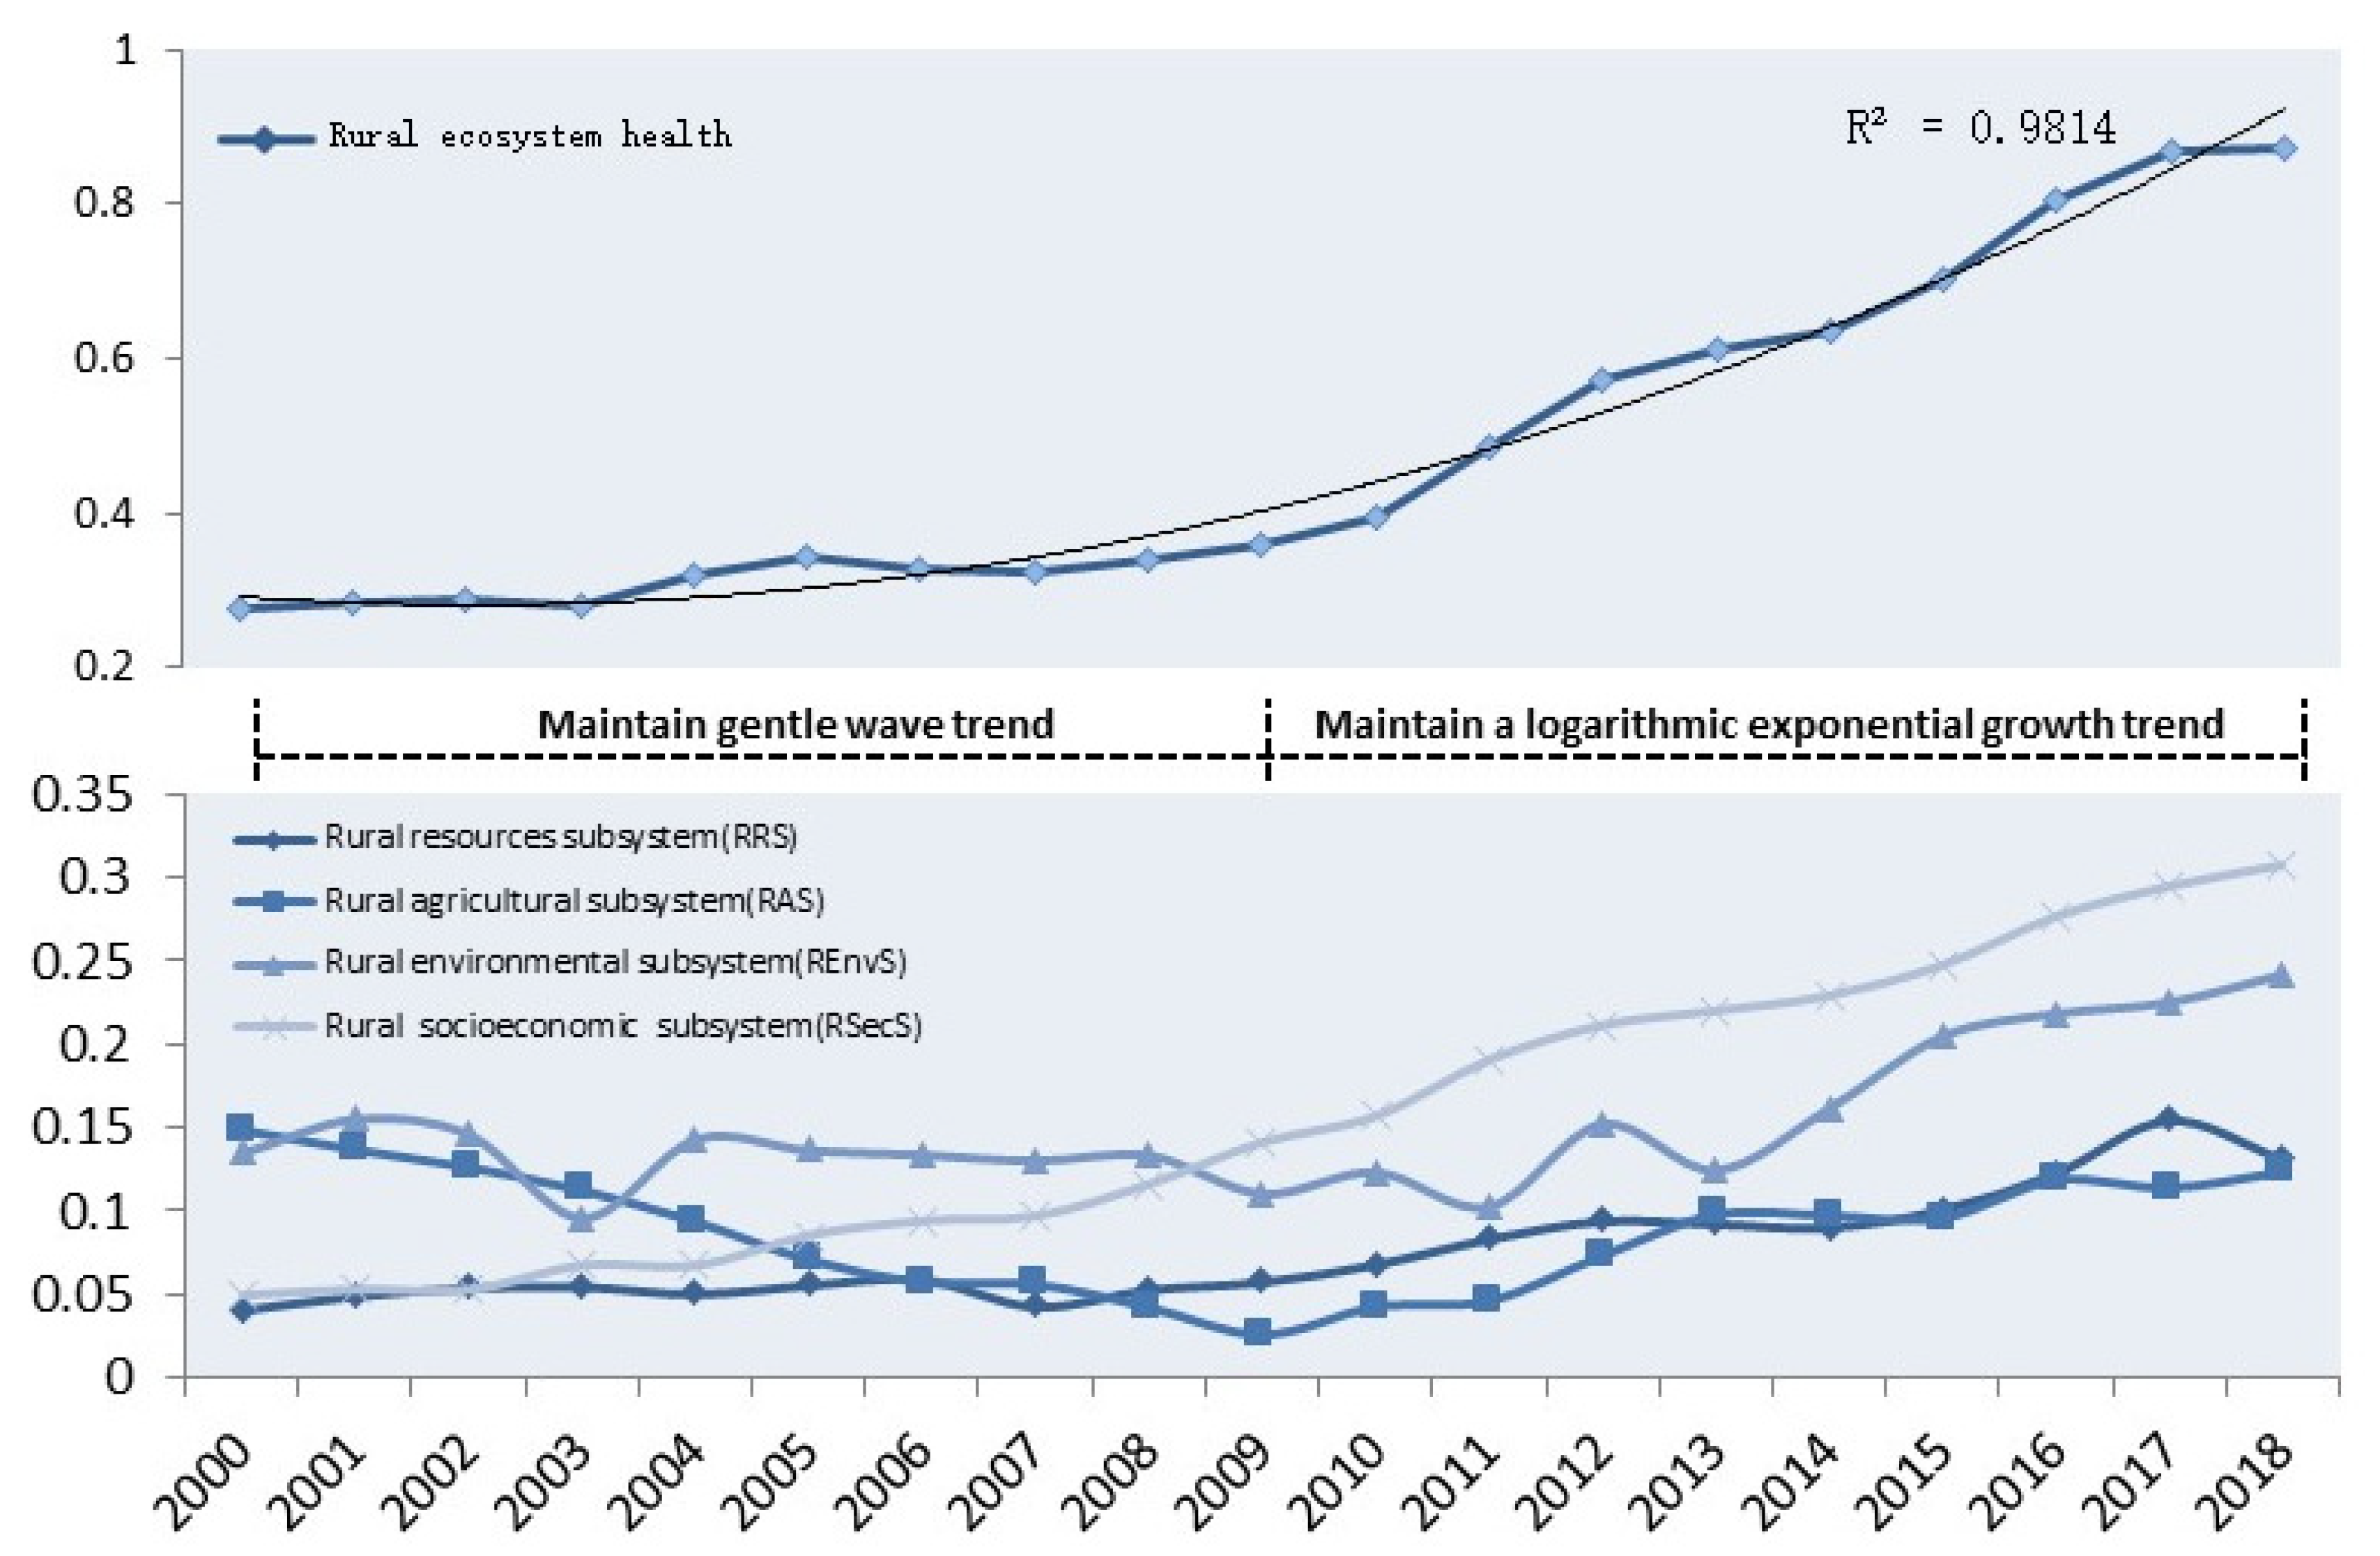
The comprehensive scores of the REH and its four subsystems were calculated from 2000 to 2018 in Chongqing using established models (9). As depicted in Figure 4, the scores curves of the REH in Chongqing displayed a distinct evolutionary pattern characterized by “slow decrease followed by rapid increase” from 2008 to 2018, with values ranging from 0.363 to 0.872, reaching a low point of 0.363 in 2007. This evolution can be classified into two stages: (1) From 2000 to 2009, there was a gradual decline in the REH scores from 0.430 to 0.363, primarily influenced by a reduction in RAS performance. During this period, it is evident that the REH was significantly impacted by the fertilizer and pesticide use in rural agriculture production; (2) From 2010 to 2018, there was a marked increase of the REH scores from 0.420 to 0.872, reflecting an overall growth trend of approximately 107.62%.
The scores of the four subsystems have demonstrated a consistent trend of growth; the growth of the RSecS and REnvS has made a significant impact on the REH scores. It is clear that there has been substantial improvement in REnvS, while the RSecS has also experienced rapid development within a short timeframe. These enhancements can be attributed to the implementation of strategies such as strict farmland protection, control of rural agricultural non-point source pollution, conversion of rural farmland to forest, and ecological green agriculture development. Upon examining the contribution and evolutionary trend of the RRS, RAS, REnvS, and RSecS subsystems, it becomes evident that both the REnvS and RSecS subsystems have made the greatest contributions to overall scores. Before 2009, the primary contributor was identified as the REnvS subsystem and then was gradually surpassed by improvements in the RSecS subsystem. The scores of the RRS and RSecS subsystems generally presented an upward trend; the RAS and REnvS presented a trend of slowly decreasing and then rising. For example, the RSecS has maintained a continuing trend of growth from 0.06 to 0.270, with an increase of up to 350%. The scores of the RAS and REnvS generally showed an evolutionary trend of decreasing first and then increasing, reaching the trough value (0.029, 0.134) in 2009, respectively, and then rising.
The time series prediction results of the REH and four subsystems in Chongqing from 2000 to 2018 show that the RSecS and RRS, which have maintained a growth trend, are the most stable. This suggested that rural social and economic development has benefited from the external driving influence, showing a continuing trend of growth with the acceleration of urbanization. The experience of rapid urbanization and rural development in Chongqing demonstrated that the strategies such as farmland protection, cultivated land improvement, rural ecological green agriculture development, and comprehensive urban and rural reform policies adopted by Chongqing have not only fostered rural social and economic advancement but also ensured sustainable utilization of rural resources. However, it is important to note that the overall stability of the rural environment and rural agriculture remained low, and significant fluctuations were evident. Issues such as rural agricultural non-point source pollution, unnatural compression of rural production space, rural air quality and pollutant emission, natural disasters, and damage to rural biodiversity have emerged as critical factors limiting the REH state.

3.3. Spatial Differentiation of the Comprehensive Scores of the REH in 36 Districts and Counties in Chongqing

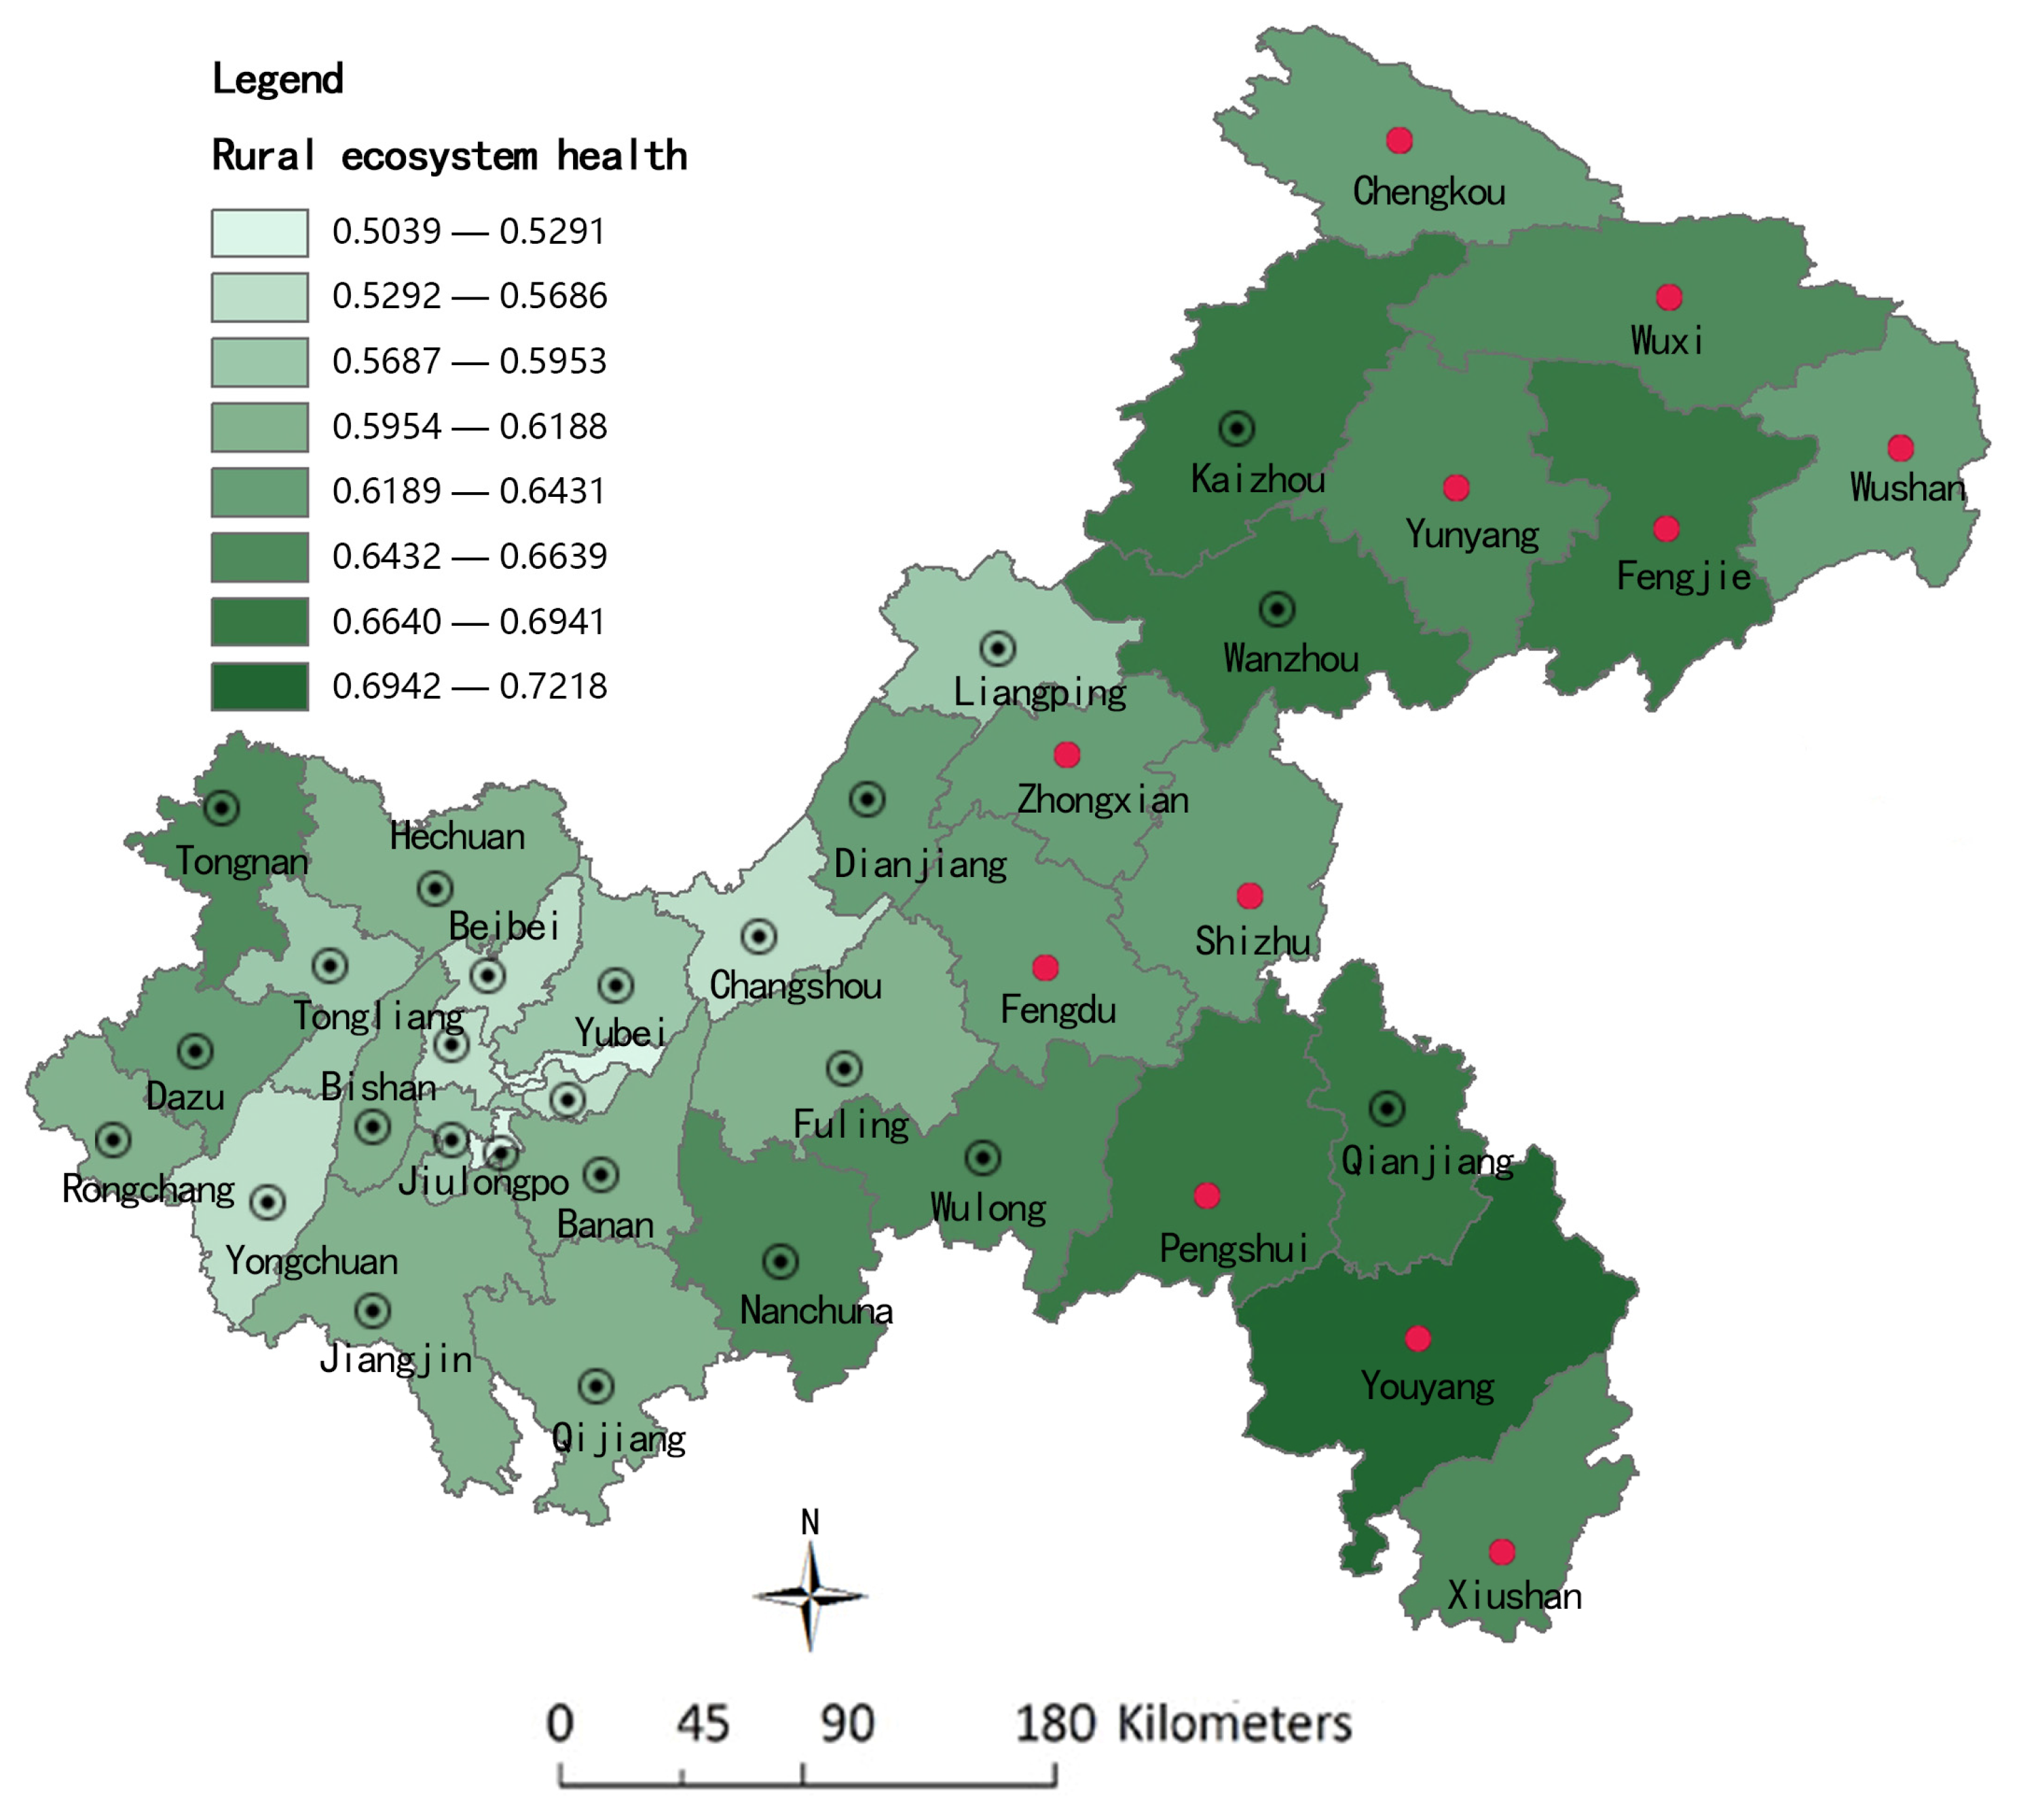
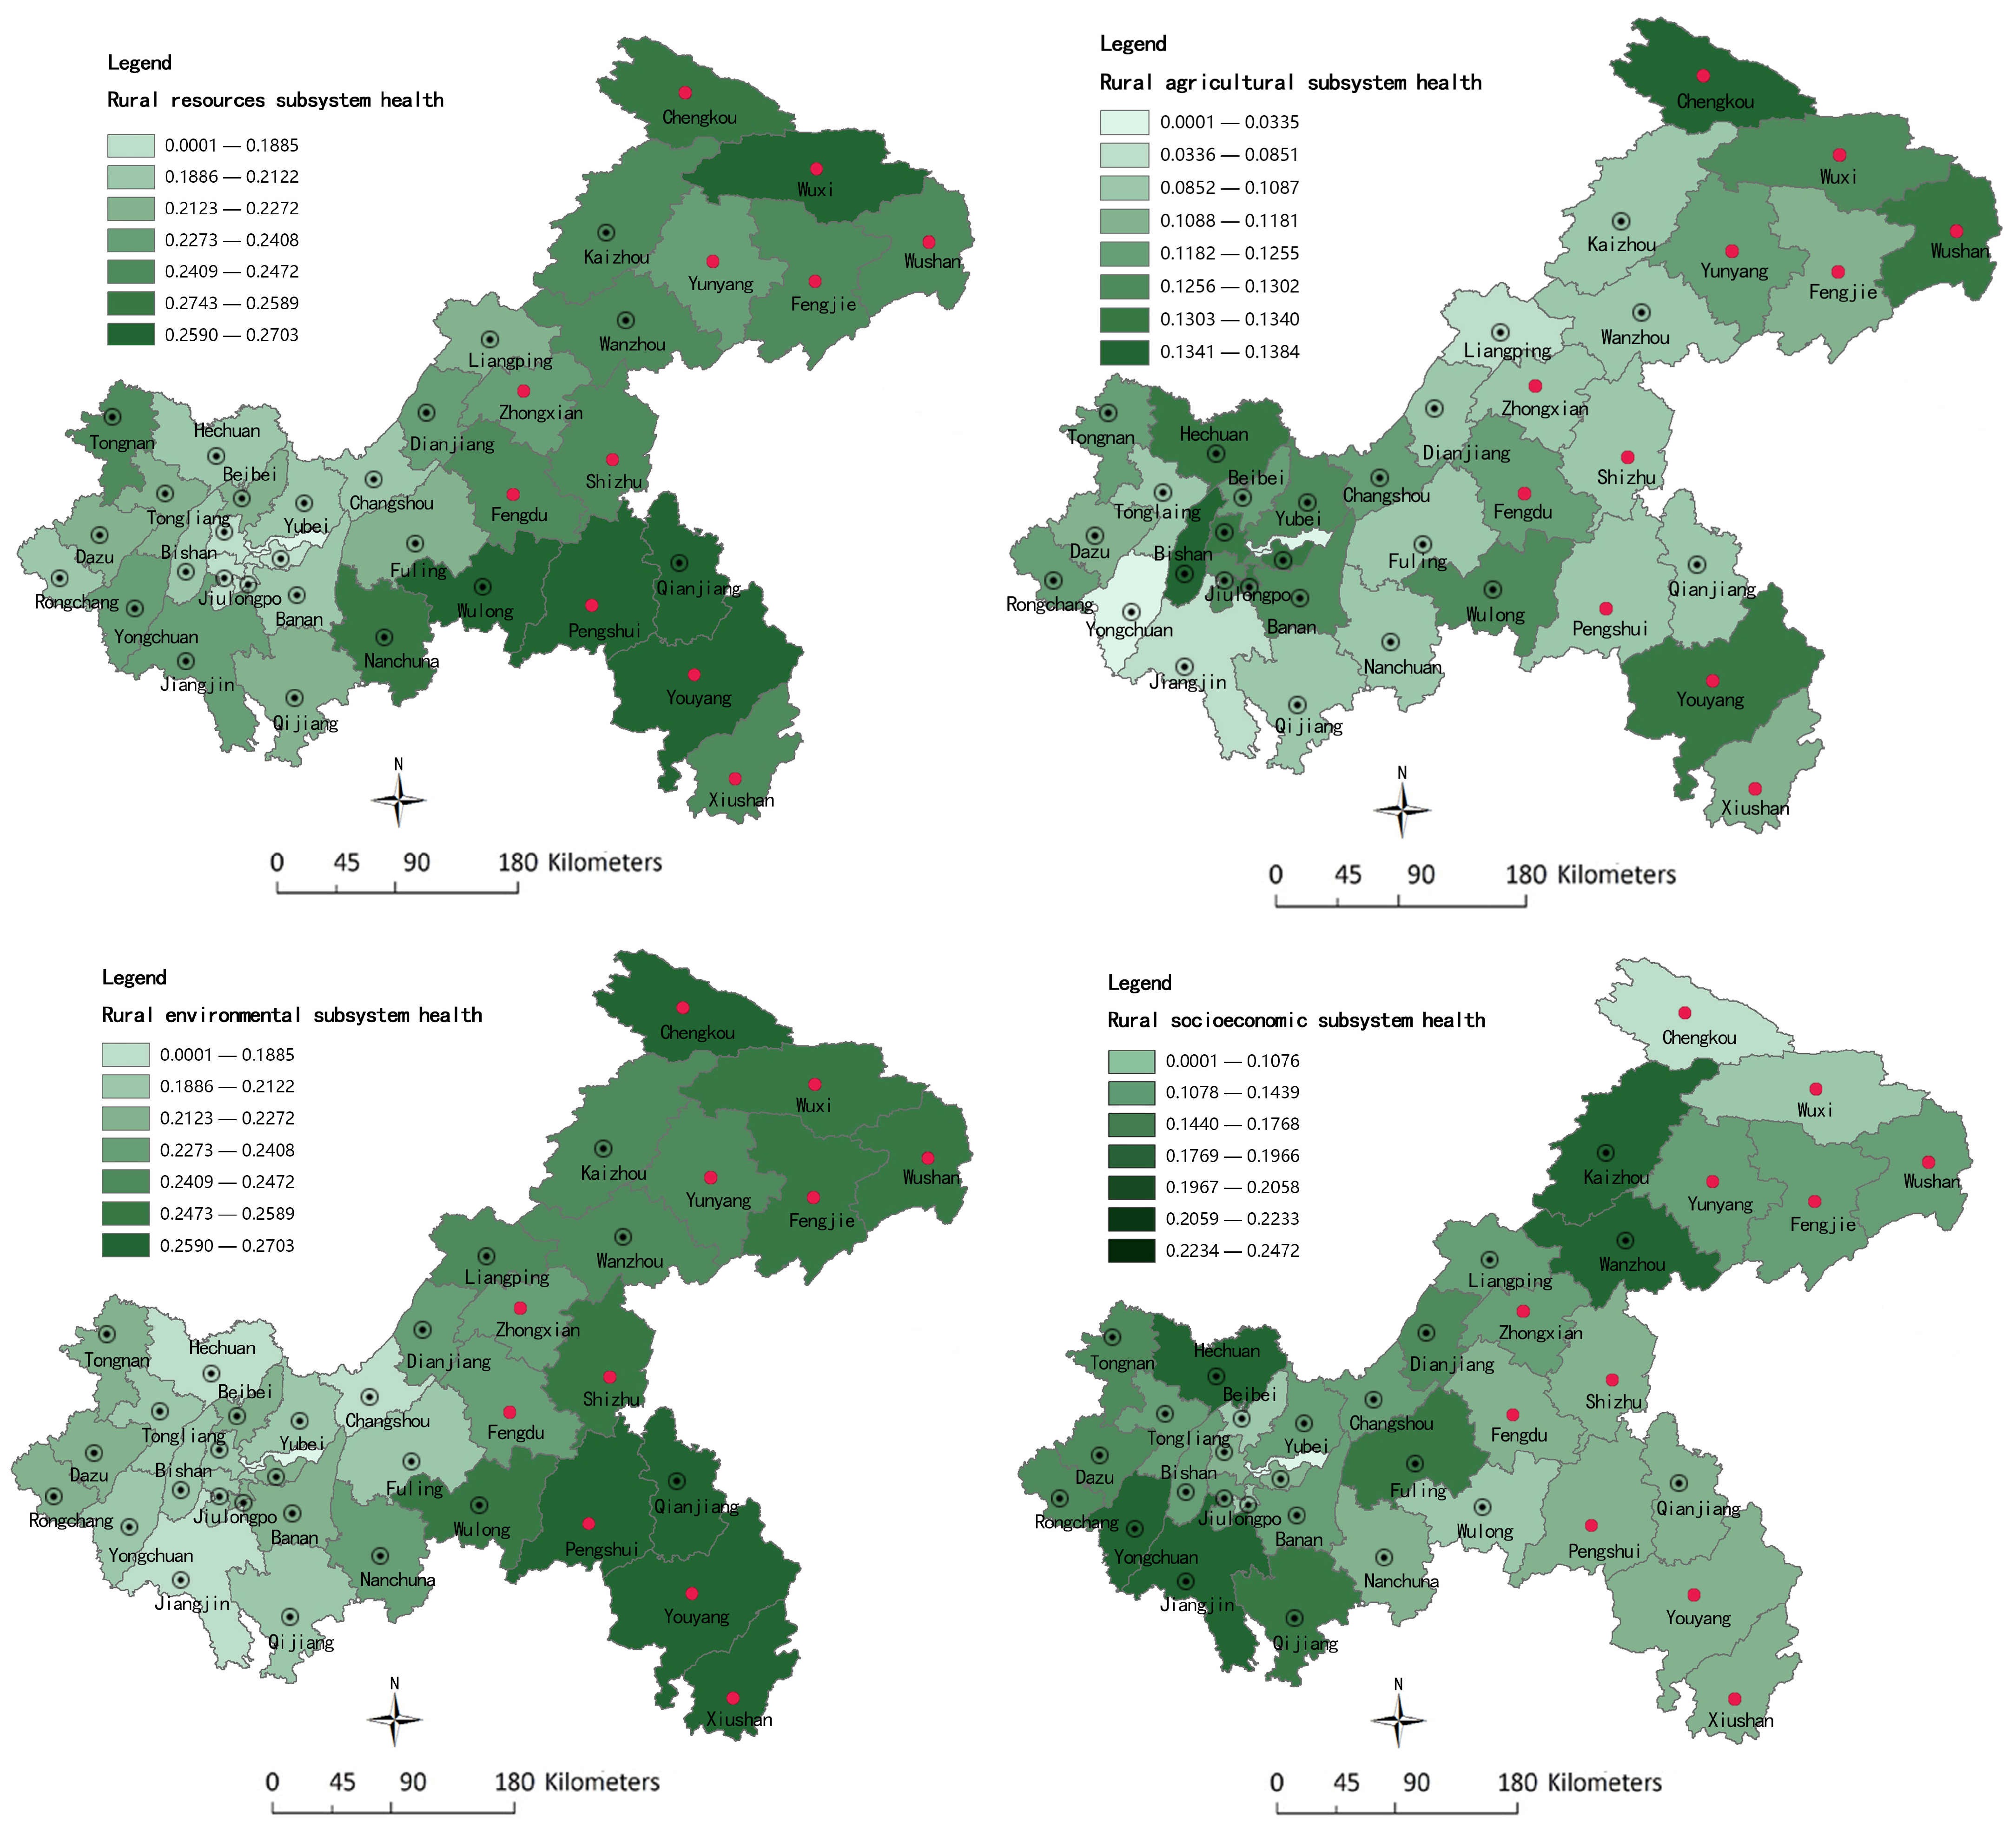
The comprehensive scores of the REH and its four subsystems of 36 districts and counties in Chongqing in 2018 were calculated based on the established REH evaluation model. Figure 5 revealed the spatial distribution of the REH and its four subsystems in northeast, southeast, and west Chongqing. Firstly, it is observed that the state of the REH gradually diminished from southeast Chongqing and the metropolitan area towards west Chongqing and northeast Chongqing area, demonstrating a differentiation trend characterized by “one core and two wings”. The spatial pattern revealed characteristics of “central and western collapse, high northeast wings, local protrusion”. The comprehensive level of the REH was highest in the northeast and southeast Chongqing areas, where natural resource conditions, agricultural resources, and socio-economic development were more favorable, including Wanzhou, Kaizhou, Fengjie, Youyang, and Pengshui. Additionally, these areas with higher socio-economic development levels and urbanization in the metropolitan areas and west Chongqing had a lower comprehensive health level of the REH.
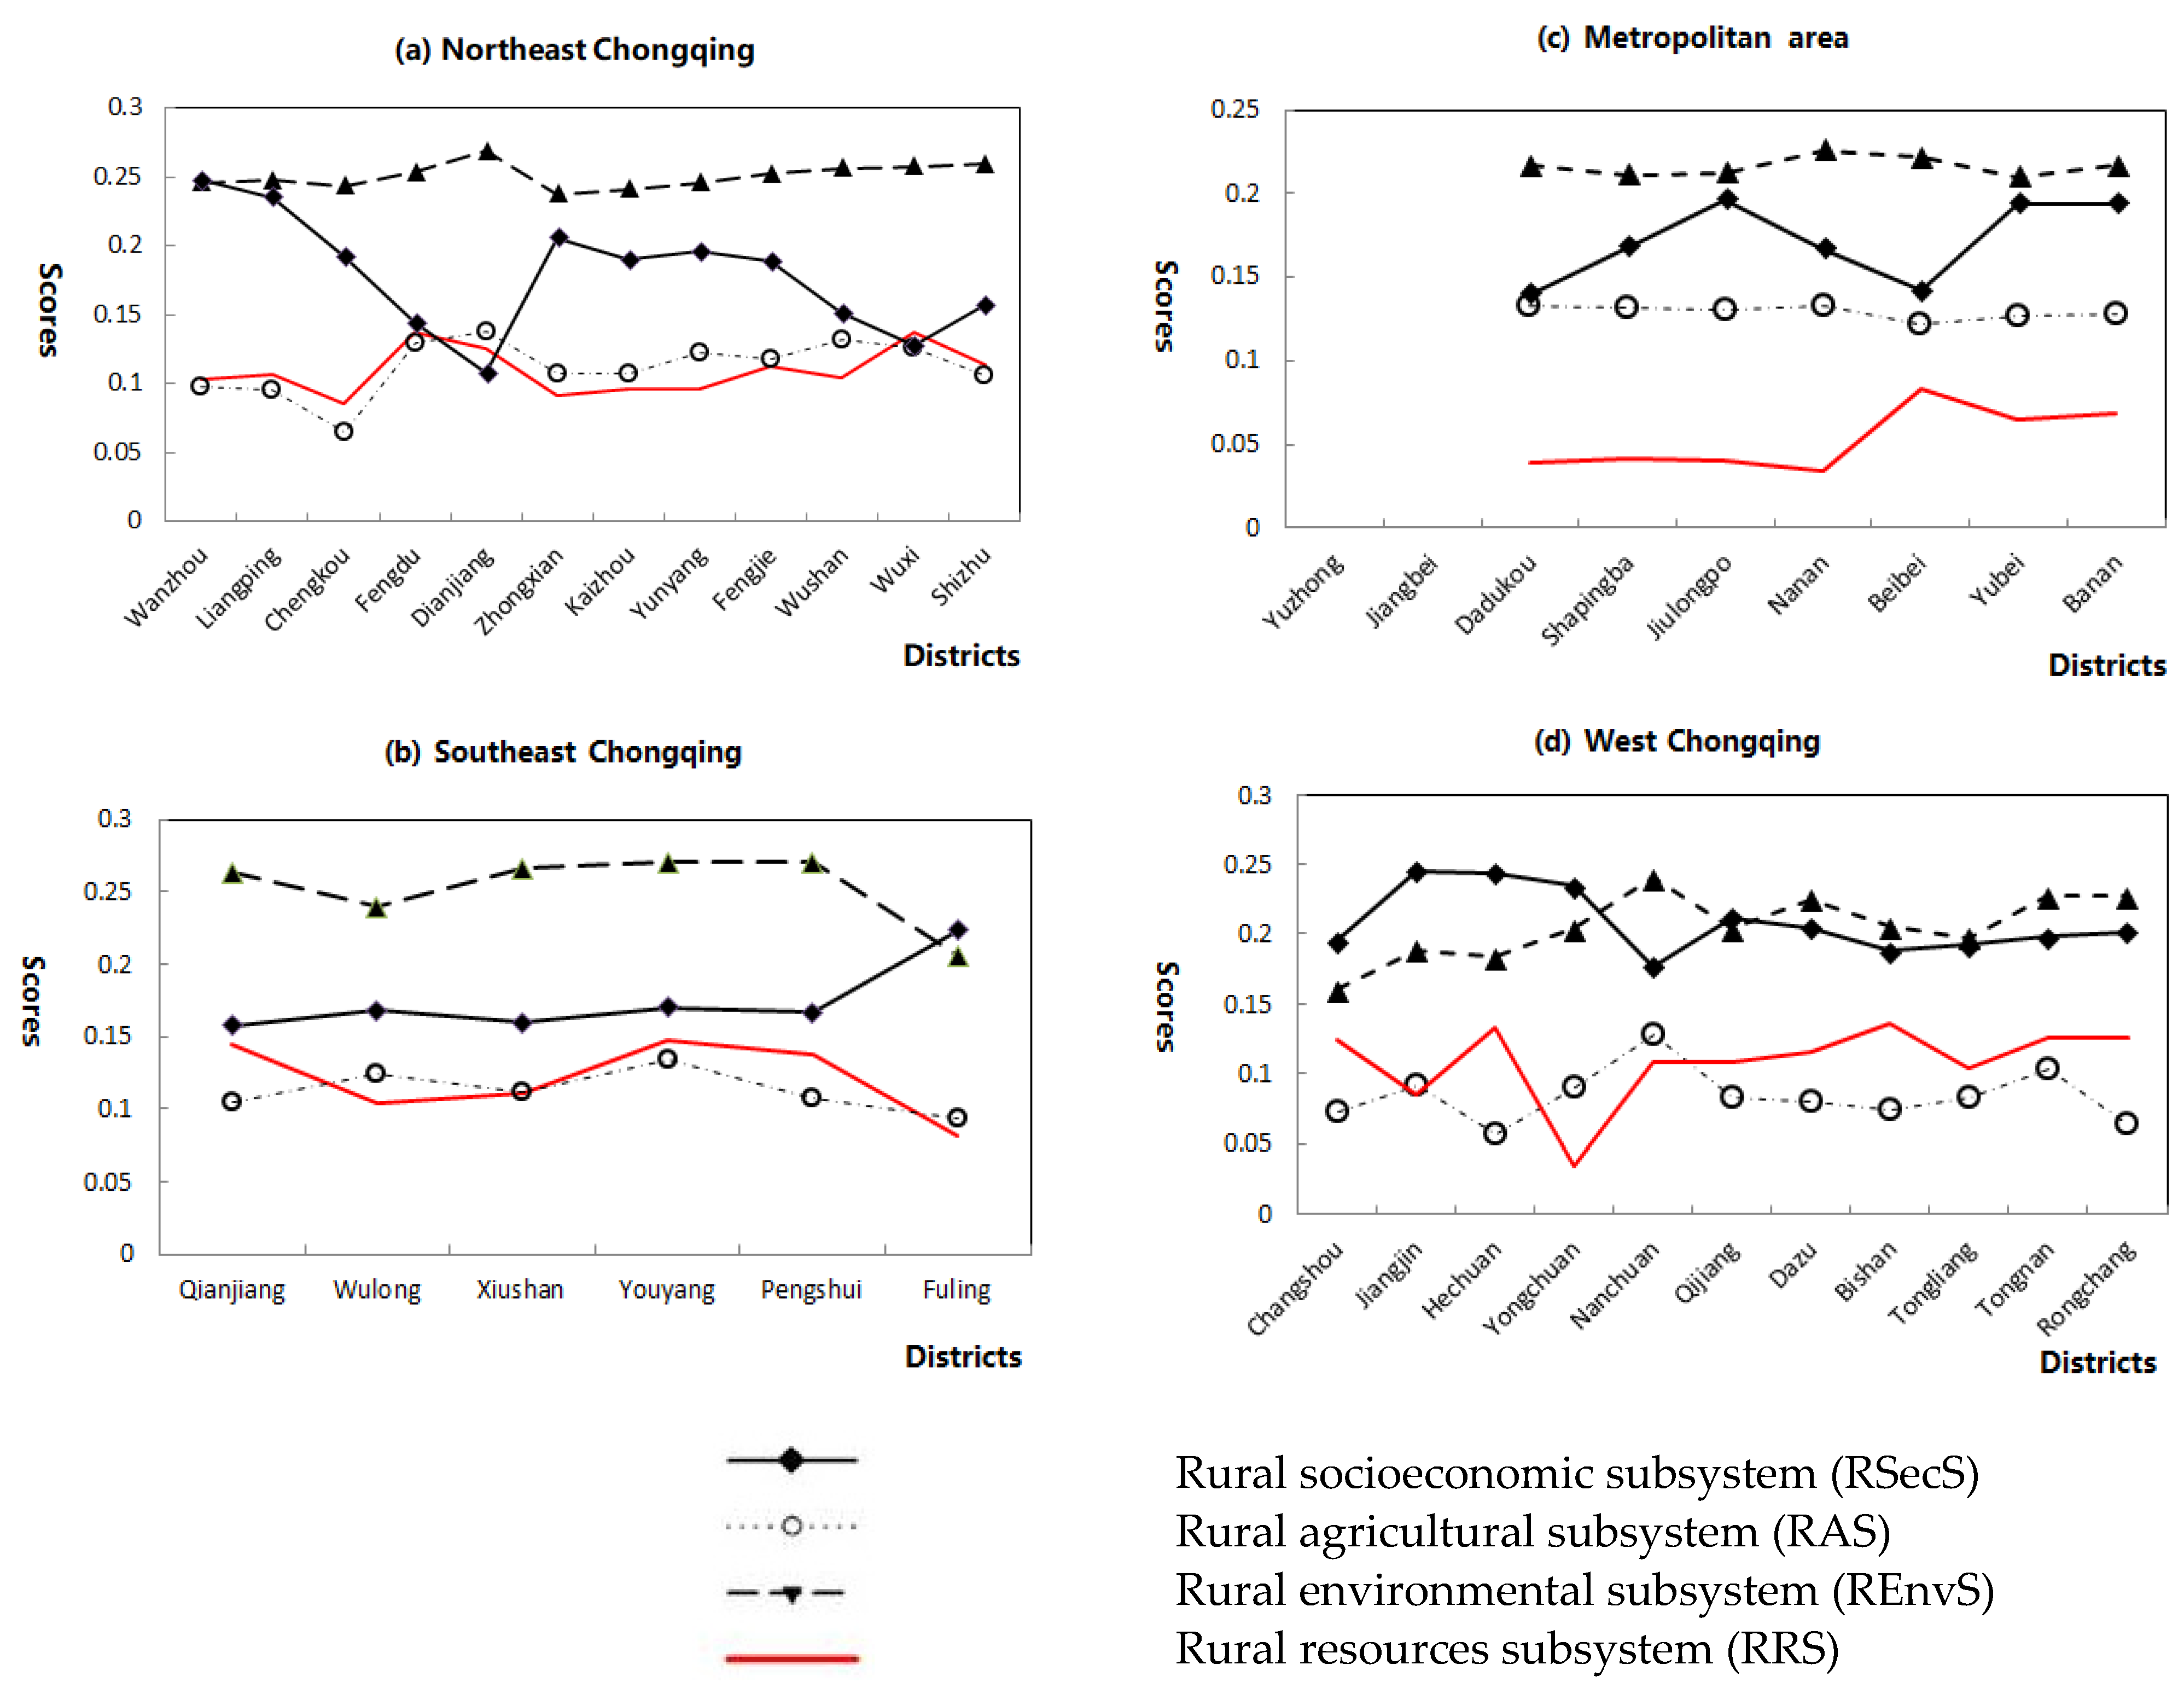
As depicted in Figure 6, the comprehensive levels, in descending order, were northeast Chongqing > southeast Chongqing > west Chongqing > metropolitan areas. Among them, Youyang County has the highest scores (0.72), with Wanzhou (0.69) > Kaizhou (0.685) > Pengshui (0.68) > Fengjie (0.67) > Qianjiang (0.67), while the lowest scores were in Dadukou (0.53), Changshou (0.55), and Shapingba (0.55). The findings indicated a spatial correspondence between the REH and socio-economic development in northeast and southeast Chongqing. In contrast, western Chongqing and metropolitan areas with a higher socio-economic development level have a lower comprehensive score of the REH, while northeast Chongqing and southeast Chongqing in less developed areas have a higher comprehensive score of the REH. The reasons for this phenomenon were as follows: (1) Western Chongqing and metropolitan areas, characterized by a higher level of development, confronted significant challenges such as the expansion of urban construction land, the extensive use of pesticides and fertilizers in agricultural production, and a shortage of agricultural resources per capita. These factors contributed to energy pollution emissions, farmland encroachment, surface water pollution, and air pollution. Furthermore, the intensity of pesticide and fertilizer use in these areas was generally higher, resulting in severe degradation of the REnvS and RAS. (2) In contrast, the less urbanized regions in northeast and southeast Chongqing attained relatively higher comprehensive REH scores. This can be attributed to their typical development characteristics known as “larger rural and smaller cities”, influenced by limited agricultural acreage coupled with complex terrain. (3) It was noteworthy that natural disasters occurred frequently in Wushan, Fengjie, Wanzhou, and Xiushan in the three Gorges reservoir areas, leading to lower comprehensive health levels within the rural agriculture and resource systems. Despite facing challenges posed by intricate terrain features and diverse ecological environments, factors that could hinder environmental quality, these same characteristics also play a role in enhancing it. Consequently, this region exhibited the highest comprehensive level of REH among all studied areas.
The spatial distribution differences of the four sub-systems (Figure 7) revealed distinct trends in health levels. The RRS health level demonstrated “one core and two wings” differentiation, characterized by lower levels in metropolitan areas and western regions, while higher levels were observed in northeastern and southeastern regions. In both western and metropolitan areas, the notably low RRS health level can be attributed to a historical emphasis on urban development at the expense of rural advancement. Economic growth and urbanization have led to significant expansion of construction land, resulting in reduced per capita suitable agricultural land and diminished rural irrigated areas. The spatial distribution of RAS health level remained relatively stable, but overall levels were not high (0.06–0.138) due to limited cultivable land, a substantial proportion of agricultural land with slopes exceeding 25°, and delayed rural agricultural mechanization. Agriculture production mainly depended on pesticides and chemical fertilizers for increased crop yields, which has resulted in severe non-point source pollution. Furthermore, an evident spatial inverse relationship existed between REvS and RSecS, with lower RSecS health levels observed in underdeveloped areas of northeastern and southeastern Chongqing. Conversely, lower REvS health levels were evident in the western regions as well as urban developed areas, indicating a consistent pattern of lower values within these specific geographical locations.

3.4. Identification of the REH Types in Chongqing

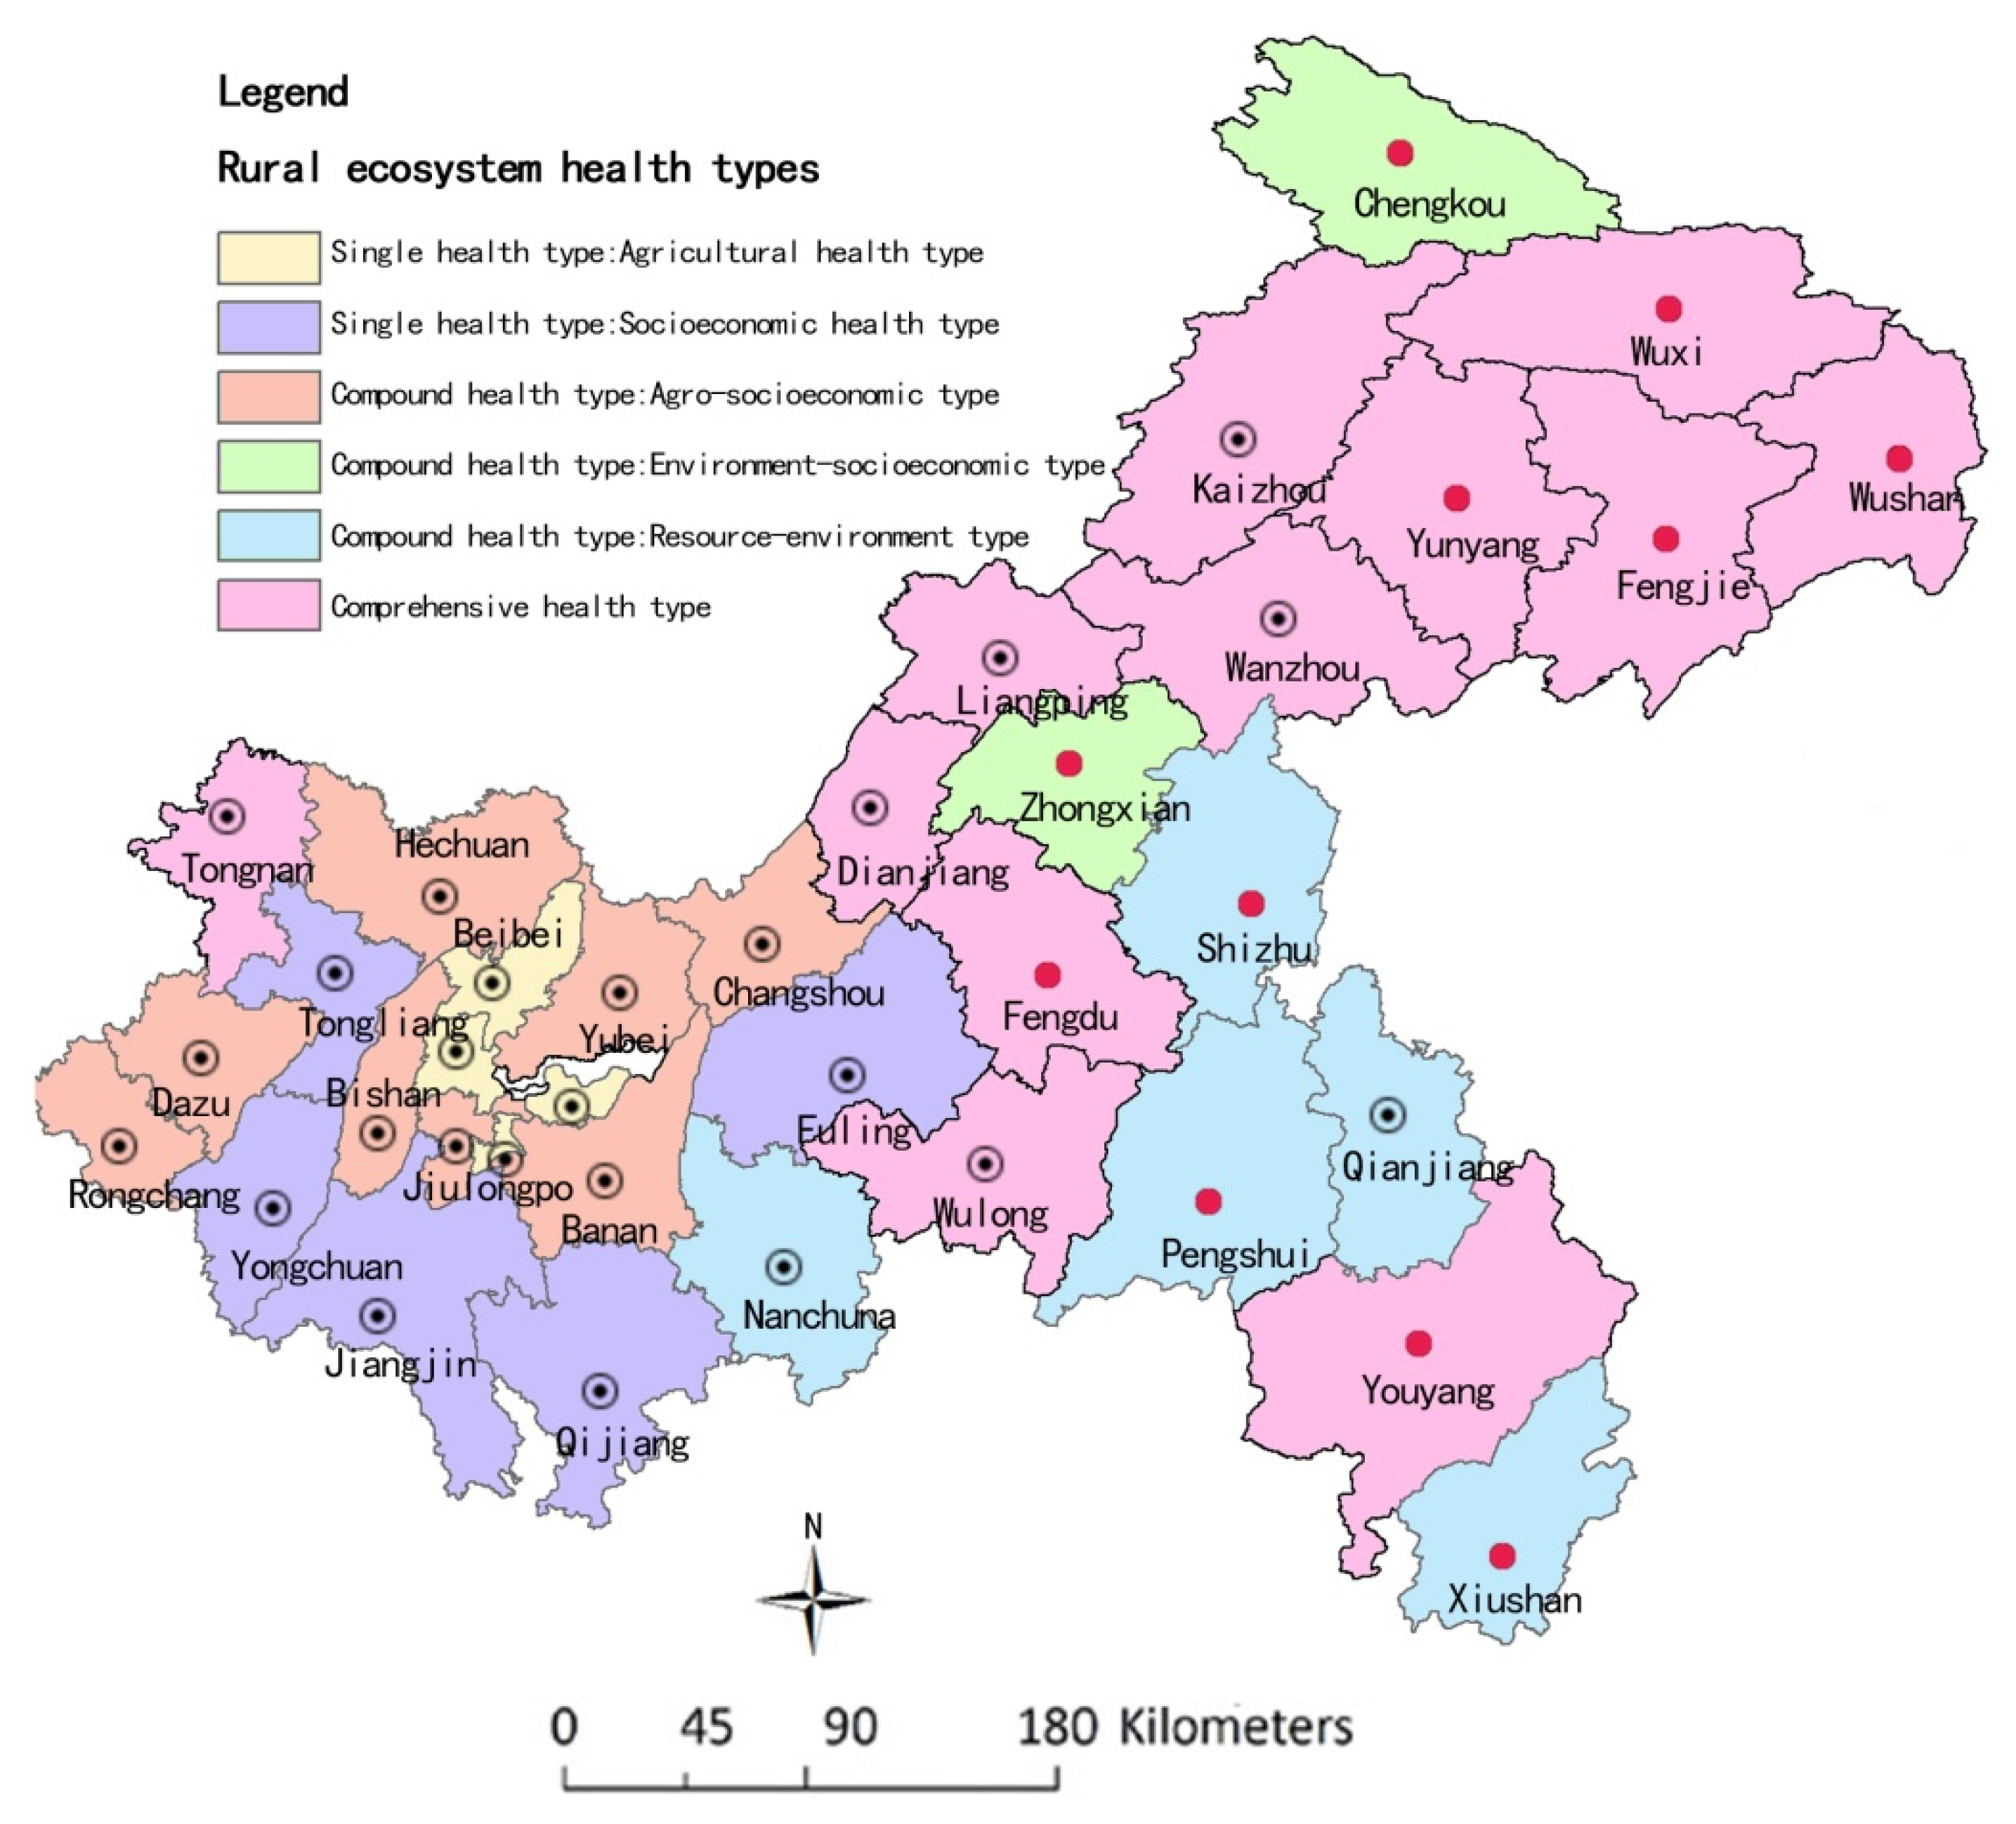
Our study conducted a comprehensive overlay analysis to classify the healthy types into four major types and twelve subtypes. The findings further elucidated the differences in type and spatial distribution characteristics of the REH. The classification results indicated a spatial proximity effect, where most adjacent areas had a similar type (Figure 8). Among them:
Comprehensive health types: the spatial distribution of comprehensive health types accounted for 33.33% and is primarily concentrated in the northeast and southeast Chongqing, including Wanzhou, Tongnan, Kaizhou, Liangping, Wulong, and Fengdu 12 districts and counties. This distribution exhibits distinct local characteristics, with a higher concentration in the northeast compared to the southwest. The elevated levels of REH in these areas can be attributed to several factors: The presence of the Three Gorges reservoir and rich biological diversity in ecologically sensitive areas have contributed to this phenomenon. Additionally, favorable natural resources coupled with minimal human activities have resulted in enhanced regional environmental quality.
Compound health types: The spatial distribution of compound health types constitutes the predominant categories of rural ecosystem health in Chongqing, accounting for over 41.67%. These types are primarily concentrated in three key areas: mainly distributed in the northeast, west, and the main metropolitan three areas of Chongqing, including Qianjiang, Jiulongpo, Yubei, Banan, Changshou, Hechuan, Shizhu, Xiushan and Pengshui fifteen districts and counties. In western Chongqing, agro-socio-economic compound health types are predominantly observed; conversely, northeastern Chongqing is characterized mainly by resource-environment and resource-socio-economic compound health types.
Single health types: The proportion of spatial units characterized by single health types accounted for 25%, predominantly located in western Chongqing and metropolitan areas, including Fuling, Dadukou, Shapingba, Nanan, Beibei, and Jiangjin, nine districts and counties. In these regions, rural agricultural health and rural socioeconomic health were identified as the primary health types.

4. Discussion

4.1. The Driving Factors of Affecting REH

4.1.1. Urbanization and REH

In the context of global socioeconomic sustainable development, urban and villages exhibit a relationship characterized by mutual dependence and promotion, where the advancement of urban areas is intrinsically linked to the prosperity of rural regions, while the revitalization of rural communities cannot be realized without the significant influence and impetus provided by urban centers. The “Rural Revitalization Strategic Plan (2018–2022)” in China emphasizes the necessity of adhering to a dual-wheel approach that integrates rural revitalization with new-type urbanization. In China, many scholars and government officials believe that the success of rural revitalization depends on sustainable urban-rural integration, with the key being the compatibility between urban development and the health of rural ecosystems. According to Sustainable Development Goals (SDGs) Agenda 1, 2, 12, and 15, urban development can achieve Agenda 1, 2, and 12 to eliminate poverty, end hunger, achieve food security, improve nutrition, and promote sustainable agriculture. Meanwhile, SDGs 15 also focus on protecting, restoring, and promoting sustainable use of terrestrial ecosystems, sustainable forest management, combating desertification, stopping and reversing land degradation, and curbing the loss of biodiversity. Nowadays, deforestation and desertification caused by human activities and climate change pose significant challenges to sustainable development and impact the livelihoods of millions of people, including efforts to eradicate poverty. China is currently working to manage forests and combat desertification, and rural ecosystem protection has become a key element in implementing this agenda. It is essential to promote a harmonious relationship between urbanization and REH to achieve sustainable development. For developing countries such as China, urbanization will continue to serve as a primary driving force in the future. Effectively addressing the compatibility between urbanization and REH will be a crucial issue for sustainable development in China. This perspective aligns with the research findings of Wang (2023) et al., which highlight the coupled and coordinated relationship between urbanization and REH [46].
Chongqing has experienced a rapid urbanization rate, increasing from 36.6% to 67.32% since 2000. This swift population agglomeration in the city has led to a continuous expansion of urban construction land, which now exceeds 6931.6 square kilometers. Consequently, a significant amount of agricultural land surrounding the town has been converted into construction land, resulting in ongoing encroachment on arable and woodland areas; these proof data have been discovered by Bryan et al. (2018). and extrapolated to predict the future trend of China’s arable land and forest land [47]. The comprehensive levels of RAS and REnvS have exhibited a trend characterized by an initial slow decline followed by a rapid increase. This indicates that early-stage excessive urbanization interventions have heightened pressures on rural agriculture and the environment, leading to unnatural compression of rural production space, air quality pollution in rural areas, increased natural disasters, and damage to rural biodiversity. Simultaneously, it is important to note that the socio-economic conditions in rural areas have significantly improved due to economic growth, technological advancements, and social welfare benefits stemming from urbanization development; these conclusions are broadly consistent with those drawn by Meng et al. [2]. The evolution trend of socio-economic subsystem health in Chongqing from 2000 to 2018 demonstrates that urbanization development has had a substantial positive impact on the rural economy. Furthermore, spatial differentiation within REH reveals that western metropolitan regions with higher levels of urbanization exhibit lower health levels concerning rural resources and environmental conditions as well as agricultural viability. In contrast, northeastern and southeastern areas with lower levels of urbanization show higher health levels regarding their rural environments, resources, and agriculture. These findings indicate a clear spatial correspondence between urbanization and REH, suggesting that urbanization serves as the primary driving factor influencing both spatial and temporal variations in REH across Chongqing.

4.1.2. Development Strategy, Environment Regulation and REH

For an extended period, policy-driven urban-rural integration has served as the primary catalyst for rural development in China. The diverse regional development policies and environmental regulations have shaped the varying conditions experienced by rural areas; the ultimate goal is to achieve the SDGs agenda 15. Chongqing recognized as a pivotal demonstration area for the national promotion of urban-rural integration and coordinated development, has implemented a substantial array of policies and strategies aimed at rural revitalization and protection. These efforts have yielded significant outcomes in the preservation and enhancement of rural revitalization initiatives. These accomplishments were validated in Liu’s research, which not only enhanced the rural social and economic environment but also improved the quality of reproductive health services [39]. The rural agriculture, environment, and social economy in Chongqing have experienced significant improvements from 2000 to 2018. This progress can be attributed to the implementation of various initiatives, including the urban and rural comprehensive reform pilot area in Chongqing, regionalization of main body functions, the land sold ticket system, agricultural supply-side structural reforms, zero increase policy on agricultural fertilizers, cultivated land protection measures, demarcation of permanent basic farmland, and a series of ecological, environmental regulatory actions. For instance, in recent years, Chongqing has enforced stringent regulations regarding farmland protection and water resource management. The region has taken the lead in enhancing cultivated land quality while comprehensively addressing non-point source pollution from rural agriculture. Additionally, efforts have been made to convert farmland on slopes greater than 25° into forested areas as part of an initiative to effectively stabilize the red line for protecting basic farmland. Over the past eighteen years, per capita water resources increased from 28.1 million m3 per 10,000 people to 50.94 million m3 per 10,000 people—a growth rate of 111.33%. Furthermore, irrigated areas and grain output rose by 13.3% and 6.9%, respectively. In agreement with Meng et al. and Liu et al., development strategies and government policy regulations significantly contribute to promoting rural social and economic development while alleviating ecological pressures within these regions—ultimately improving the health levels across rural resources as well as environmental and agricultural subsystems [2,39].

4.1.3. Urban-Rural Mobility Factors and REH

The dual urban-rural structural system poses a significant obstacle to China’s economic and social development. This challenge is primarily manifested through urban-rural household registration barriers, the existence of two distinct systems for resource allocation, and various other issues stemming from these household registration discrepancies between urban and rural areas. The mobility of urban and rural factors has been regarded by many scholars as the key to solving China’s urban-rural dualistic problem. Wang et al. (2023) proposed that there was an obvious positive correlation relationship between the urban-rural factors mobility and the REH [46]; population, resources, and capital flows were the main driving factors affecting the spatiotemporal evolution of the REH. On the one hand, the rural labor outflow from underdeveloped and remote mountainous areas has expanded the urban population in metropolitan areas, Wanzhou, Kaizhou, Tongliang, Bishan, Beibei, Changshou, and Dazu, the population of metropolitan areas has reached 9.7 million accounting for 36.9%. The agglomerated population caused serious environmental pollution and ecological disturbance problems, which put pressure on rural resources and agricultural and environmental subsystems in these areas. On the other hand, the capital, technology, and social services brought by urban development have also promoted the rural social economy and agricultural development. For example, the less developed mountainous villages in the northeast and southeast Chongqing benefited from the promotion of urban capital and technology, rural farming conditions, rural employment, rural agricultural economy, rural public services, and infrastructure have significantly been improved, Liu et al., (2023) also confirmed this [39]. Therefore, urban-rural factors such as mobility caused the ecological load pressure on the rural ecosystem but promoted rural socio-economic development.

4.1.4. Rural Regional Difference and REH

Rural and regional differences are fundamental factors in determining the health of the rural ecosystem (REH). Variations in geomorphological types, hydrogeology, soil characteristics, and human society contribute to the regional disparities observed within rural ecosystems. For instance, significant differences in rural agriculture, resources, and environmental conditions exist between northeast, southeast, and western Chongqing due to the region’s typical mountainous landforms and soil types. Northeast Chongqing, situated within the Three Gorges reservoir area, is characterized by substantial elevation variations, complex geological structures, and rugged topography. In particular, agricultural development in Wanzhou, Fengjie, Yunyang, Wushan, and Wuxi primarily relies on traditional decentralized farming practices. The ecological environment here is sensitive; frequent occurrences of soil erosion and natural disasters have resulted in lagging social and economic development within these rural areas. This observation aligns with Yang et al.’s (2020) assertion that mountainous topography has a clear correlation with rural socio-economic levels [5]. However, Meng et al. did not adequately consider the influence of rural topography and landform features [2]. In contrast, agricultural development in Bishan, Dazu, and Nanchuan districts, where landforms and agricultural conditions are more favorable, largely depends on the use of chemical fertilizers and pesticides. Consequently, the ecological quality of these areas is lower than that found in northeast or southeast Chongqing due to urban land expansion, human activities, and pollution emissions exerting a significant impact.

4.2. Differentiation Recommendations and Policies for REH in Choingqing

The comprehensive level of the REH and its spatial types in Chongqing exhibit significant variations in both spatial and temporal patterns. Numerous pressing issues, such as land occupation, degradation, and the deterioration of rural environmental quality, severely hinder the socio-economic development of these areas. The primary challenge lies in formulating appropriate planning and regulatory recommendations to address the current dilemmas faced by rural ecosystems. Particularly within the framework of national spatial planning that prioritizes ecological civilization, it is essential for promoting sustainable rural development. According to the classification results of the REH, this study adheres to the principle of “graded classification-key analysis tailored to local conditions shortcomings addressed”. It categorizes the comprehensive level of the REH while also classifying the health spatial types of rural ecosystems. Subsequently, planning recommendations are provided that are specifically tailored to local conditions, with a focus on mitigating deficiencies in disease-related and unhealthy areas across northeast Chongqing, southeast Chongqing, west Chongqing, and metropolitan regions.
Fourteen districts and counties in metropolitan areas and west Chongqing, including Dadukou, Shapingba, Jiulongpo, Nanan, Yubei, Beibei, Banan, Bishan, Liangping, Hechuan, Yongchuan, Rongchang, Dazu, Tongliang are identified as poor health level areas of the REH in Chongqing. Urbanization development and urban construction land expansion bring stress pressure on rural cultivated land, environment, and natural resources, resulting in damage to the rural ecosystem. Therefore, the government should prioritize “intensive use of construction land, prevention and control of the ecological environment, disaster prevention, and control” as a key focus; these correspond to the SDGs Agenda 1, 2, 12, and 15, aiming at achieving food security, promoting sustainable agriculture, and protecting sustainable use of the terrestrial ecosystem. The recommendations and policies include: (1) Reducing excessive intervention in rural agricultural activities in the western Chongqing area, with a focus on green ecological development as the fundamental program. The government should actively promote ecological planting and healthy breeding in Changshou, Hechuan, Dazu, Tongliang, Tongnan, and other areas. This includes transitioning away from traditional agricultural cultivation methods that heavily rely on fertilizers and pesticides to boost production. Additionally, it is essential to promote emerging farming technologies such as agroecological regulation, agricultural physical control, and agricultural biological control, and carry out precise agricultural green actions relating to the SDGs agenda 15; (2) Actively engage in dual evaluation work to clarify the carrying capacity of the territorial space and the suitability of urban, agricultural, and ecological areas with the assistance of territorial spatial planning. This approach aims to optimize the spatial distribution of three crops and scientifically delineate the three control lines: permanent basic farmland, ecological red line, and urban development boundary. The final goal is to ensure rigid constraint bottom lines such as rural arable land, basic farmland, ecological red line, and four mountains control line to control the growth scale of construction land in these areas. Furthermore, local government should promote intensive and efficient use of urban construction land to reduce natural resource exploitation and agricultural encroachment in rural areas such as Dadukou, Shapingba, Jiulongpo, and Beibei, also relating to the SDGs agenda 15; (3) Promoting the protection of cultivated land is essential for consolidating the advantages of food crop production, thereby ensuring a fundamental level of food security in Chongqing. Furthermore, it is crucial to coordinate the production of food and cash crops in Dadukou, Shapingba, Jiulongpo, Beibei, and other areas. This approach aims to enhance agricultural benefits while simultaneously safeguarding food security and supporting farmers’ interests. This is related to the SDGs Agenda 1 and 2, aiming at eliminating hunger, achieving food security, improving nutrition, and promoting sustainable agriculture.
Seventeen districts and counties in northeast Chongqing and southeast Chongqing, including Liangping, Yunyang, Wanzhou, Changshou, Kaizhou, Chengkou, Fengdu, Dianjiang, Zhongxian, Fengjie, Wushan, Yongchuan, Qijiang, Rongchang, Wuxi, Xiushan, Youyang are identified as health level areas of the REH in Chongqing. The government should prioritize the protection of rural cultivated land, enhance agricultural production capacity, increase rural economic income, and promote integrated industrial development. The emphasis should be placed on “maintaining farmland and promoting yield, increasing agricultural efficiency and quality, and agricultural modernization” as a strategic approach to improve the socio-economic conditions in underdeveloped regions of southeast and northeast Chongqing. These correspond to the SDGs Agenda 2, 6, 8, 9, 12, and 15, aiming at achieving sustainable agriculture, promoting sustainable, inclusive, and sustainable economic growth, building agriculture infrastructure with resilience against risk, and protecting sustainable use of the terrestrial ecosystem. The recommendations and policies include: (1) Northeast Chongqing is characterized as a fragile and sensitive region, facing challenges such as karst desertification, sloping farmland exceeding 25°, and severe soil erosion. These factors hinder social and economic development due to the limited rural resources and environmental endowments available. Considering the development situation of karst, desertification, and sloping land > 25° in Liangping, Yunyang, Wanzhou, Zhou, Chengkou, Fengdu, Dianjiang, Zhongxian, Fengjie, and Wushan, it is essential to implement the cultivated land rotation system according to local conditions and land mass production. The delineation of sloping lands exceeding 25° that are unsuitable for cultivation will be prioritized. Special emphasis will be placed on controlling soil erosion in Wanzhou and Yunyang while also undertaking ecological restoration efforts alongside water management initiatives for tributaries within the Daba Mountains area, relating to the SDGs Agenda 2 and 15; (2) Enhancing the living conditions in the underdeveloped mountainous regions of the northeast and southeast Chongqing can be achieved by expanding agricultural output. Concurrently, it is essential for the government to promote the development of new forms of large-scale agricultural households, specialized cooperatives, and small and micro-farms. This initiative aims to increase their economic earnings and improve rural socio-economic conditions. The ultimate objectives are to facilitate the revitalization and development of industries and poverty alleviation in economically underdeveloped areas. These are related to the SDGs Agenda 2, 8, 9, and 12.

5. Conclusions and Discussion

This paper drew the following conclusions:
(1) The temporal evolution law of the REH in Chongqing generally exhibited a decreasing trend followed by an increasing fluctuation, which presented a gradual decline from 2000 to 2009 and succeeded by a rapid increase from 2010 to 2018. The comprehensive scores of the REH in Chongqing decreased from 0.430 to 0.363 before rising again to reach 0.872, with four subsystems also demonstrating an upward trajectory. The RSecS (33.36%) and REnvS (27.84%) were the primary contributors to the overall scores of the REH.
(2) The spatial differentiation of the REH in Chongqing was notably pronounced in 2018. The REH comprehensive scores exhibited a gradual increase from western Chongqing (mean 0.36) and metropolitan areas (mean 0.21) to northeastern Chongqing (mean 0.69) and southeastern Chongqing (mean 0.81). This trend reflected a spatial pattern characterized by “collapse in the west and the west, high in the northeast and local outburst”, northeast Chongqing (0.64) > southeast Chongqing (0.66) > west Chongqing (0.61) > metropolitan areas (0.56). The RRS presented a differentiation trend described as “one core and two wings”. Meanwhile, the RAS levels tended to be stable, although their overall level remained relatively low, ranging from 0.06 to 0.138. Notably, there was an evident inverse spatial correspondence between REnvS and RSecS; that is, the health level of rural society was the highest in western Chongqing and metropolitan areas with the developed rural economy, higher REnvS health levels were observed in underdeveloped areas of northeastern and southeastern Chongqing, showing obvious spatial distribution characteristics of “high in the east and west, low in the two wings”.
(3) The health spatial types of the REH in Chongqing were divided into four categories and 12 sub-categories, including disease type, single health type, compound health type, and comprehensive health type, according to the dominant factor method. The analysis examined driving factors from four perspectives: urbanization development, policy regulation, urban-rural factor flow, and regional differences. In line with the principles of “classification, selective analysis, local conditions, and addressing weaknesses”, this paper puts forward differentiated planning and regulatory suggestions to steer the healthy development of rural ecosystems in the northeast, southeast, west, and metropolitan areas of Chongqing where diseases and health issues are prevalent.
The REH serves as a measure of the stable state inherent in rural production, living, and ecological space. It reflects the interactions and balanced relationships among complex systems encompassing social, economic, and natural elements within rural areas. This concept embodies the essence of sustainable development that integrates human systems with ecosystems while emphasizing their inseparable overall connection, including five components: humans, resources, agriculture, environment, and socio-economic condition [34]. Consequently, the evaluation of the REH should objectively understand its connotation from a holistic perspective. Rural ecosystems should be regarded as the sum of interrelated relations between different subsystems and human beings. The evaluation dimension should include socio-economic subsystems based on natural ecological subsystems. As Liu Yu et al. have noted, the crux of assessing the REH lies in reflecting interactive checks and balances among rural subsystems from an ecosystem integrity standpoint [39]. This approach avoids evaluating only a single natural ecological subsystem operating states or function indications through the comprehensive diagnosis of the disorder. Therefore, our study posits that interpreting mountainous REH through an ecosystem integrity lens is essential for establishing a scientifically robust quantitative evaluation system tailored to mountainous contexts. Furthermore, revealing its spatio-temporal evolutionary characteristics will be fundamental in addressing coordination issues between rural ecological protection and development in the process of mountain urbanization, particularly given the complexities associated with natural ecosystems alongside social and economic underdevelopment prevalent in southwestern China’s mountainous countryside.
Our study enhances the understanding of regional category and discipline research paradigms for assessing the regional ecosystems’ health and provides a valuable evaluation method, index system, and spatial classification basis for quantitatively studying the mountainous REH. In contrast to traditional assessment methods such as VOR/PSR, which focus on single regional natural ecosystems, the assessment framework proposed in this study takes into account the integrity of rural socio-economic-natural complex ecosystems, aligning more closely with the actual development situation in Chongqing. The research specifically targets mountainous rural areas characterized by unique geographical ecological environments and pronounced conflicts between human-land coupling relationships. Furthermore, it not only evaluates the health status of rural natural ecological subsystems but also assesses the comprehensive health level of rural social and economic subsystems. Additionally, this study innovatively integrates sustainable SDGs17 standards into the evaluation index for the REH, aligning well with international standards. Our research findings suggest that the Sustainable Development Goals (SDGs) Agenda 1, 2, 6, 8, 9, 12, and 15 are closely related to RAS and RsecS, namely achieving sustainable agriculture, promoting sustainable, inclusive, and sustainable economic growth, build agriculture infrastructure with resilience against risk, and protecting sustainable use of terrestrial ecosystem are important measure for REH in Chongqing.
The study reveals that the health evolution of rural ecosystems in Chongqing exhibits distinct stage development characteristics and spatial differentiation. The most significant impact comes from the rural socio-economic and environmental subsystems, which share certain similarities and differences with research conclusions drawn from developed plain areas [5,44,45]: (1) Similarities can be observed in that the level of rural socio-economic development serves as a core index affecting the REH, aligning with the current situation of rural development in Chongqing. In recent years, there have been substantial improvements in rural socio-economic development due to vigorous implementation of measures for rural revitalization and urban-rural integration experimental reform; (2) In comparison to plain rural areas, mountainous rural areas face more prominent constraints stemming from differences in environment endowment. Constrained by transportation limitations, external factor flow, and geographical agricultural location, mountainous rural areas must rely more on their environment and resource endowment conditions for socio-economic development. This involves accumulating economic and material wealth through continuous investment in the natural environment to promote the development of rural socio-economic subsystems. Practical experiences derived from a series of policy guidance adopted by Chongqing demonstrate that targeted and differentiated planning and regulation can significantly promote healthy developments within rural ecosystems. These include the main function of zoning, a rural land trading system, “dipiao” trading mode, cultivated land protection and quality improvement actions, control over non-point source pollution originating from agriculture within rural areas, as well as promoting ecological green agricultural development [5]. Such practical experiences can serve as valuable references for other mountainous regions while also significantly improving the health of mountainous rural ecosystems through differentiated planning and regulation.
In addition, this paper is limited by constraints related to cognition and data availability. The selection of evaluation indicators for the RSecS involves living conditions, consumption, education, and healthcare, among other aspects of rural residents. However, insufficient attention has been given to indicators pertaining to rural culture. Consequently, the evaluation indicator system for the health of mountain rural ecosystems still requires further improvement and optimization. The study focuses solely on districts and counties as the spatial statistical scale, overlooking discussions on differentiation, correlation, and cascade effects at other scales such as towns, townships, villages, and peasant households. Finally, the issue related to compatibility between vector data and panel data exists when the county area is utilized as the spatial statistical sampling unit. Therefore, it is essential to develop an effective method for ensuring compatibility between vector point data and panel statistical data.

Author Contributions

C.Y.: Methodology, Software, Validation, Formal analysis, Investigation, Resources, Data curation. S.T.: Formal analysis, Conceptualization, Methodology, Investigation, Resources, Visualization. H.Z.: Writing—review & editing, Visualization. W.Z.: Software, Resources, Data curation, Writing—original draft, Writing—review & editing. All authors have read and agreed to the published version of the manuscript.

Funding

This study is supported by the National Natural Science Foundation of China (No. 52408074).

Data Availability Statement

The data presented in this study are available on request from the corresponding author. The data are not publicly available due to privacy.

Conflicts of Interest

Author Hantao Zhou was employed by the company China Railway Eryuan Engineering Group Co., Ltd. The remaining authors declare that the research was conducted in the absence of any commercial or financial relationships that could be construed as a potential conflict of interest.

References

  1. Long, H.L.; Jian, Z.; Liu, Y.S. Differentiation of rural development driven by industrialization and urbanization in eastern coastal China. Habitat Int. 2009, 33, 454–462. [Google Scholar] [CrossRef]
  2. Meng, L.G.; Huang, J.; Dong, J.H. Assessment of rural ecosystem health and type classification in Jiangsu province, China. Sci. Total Environ. 2018, 615, 1218–1228. [Google Scholar] [CrossRef] [PubMed]
  3. Vitousek, P.M.; Mooney, H.A.; Lubchenco, J. Human domination of Earth’s ecosystems. Science 1997, 277, 494–499. [Google Scholar] [CrossRef]
  4. Liu, Z.; Guan, D.; Wei, W.; Davis, S.J.; Ciais, P.; Bai, J.; Peng, S.; Zhang, Q.; Hubacek, K.; Marland, G.; et al. Reduced carbon emission estimates from fossil fuel combustion and cement production in China. Nature 2015, 524, 335–338. [Google Scholar] [CrossRef]
  5. Yang, C.; Zeng, W.; Yang, X. Coupling coordination evaluation and sustainable development pattern of geo-ecological environment and urbanization in Chongqing municipality, China. Sustain. Cities Soc. 2020, 61, 102271–102283. [Google Scholar] [CrossRef]
  6. Wu, M.W.; Wu, J.Q.; Zang, C.F. A comprehensive evaluation of the eco-carrying capacity and green economy in the Guangdong-Hong Kong-Macao Greater Bay Area, China. J. Clean. Prod. 2021, 281, 124945–124968. [Google Scholar] [CrossRef]
  7. Li, Q.; Li, W.Y.; Zhao, Y.; Zhu, Y.E.; Chen, Z.F.; Qiao, J.J. Exploration on the basic connotation and evaluation system of rural ecosystem health. Ecol. Environ. Sci. 2009, 18, 1604–1608. [Google Scholar]
  8. Xu, W.; Julius, A.M. A review of concepts and criteria for assessing agroecosystem health including a preliminary case study of southern Ontario. Agric. Ecosyst. Environ. 2001, 83, 215–233. [Google Scholar] [CrossRef]
  9. Long, H.L. Land consolidation and rural spatial restructurin. Acta Geogr. Sin. 2013, 68, 1019–1028. (In Chinese) [Google Scholar]
  10. Peng, J.; Liu, Y.X.; Li, T.Y.; Wu, J.S. Regional ecosystem health response to rural land use change: A case study in Lijiang City, China. Ecol. Indic. 2017, 72, 399–410. [Google Scholar] [CrossRef]
  11. Neri, A.C.; Dupin, P.; Sanchez, L.E. A pressure-state-response approach to cumulative impact assessment. J. Clean. Prod. 2016, 126, 288–298. [Google Scholar] [CrossRef]
  12. Styers, D.M.; Chappelka, A.H.; Marzen, L.; Somerrs, G.L. Developing a land-cover classification to select indicators of forest ecosystem health in a rapidly urbanizing landscape. Landsc. Urban Plan. 2010, 94, 158–165. [Google Scholar] [CrossRef]
  13. Lepold, J.C. Getting a handle on ecosystem health. Science 1997, 276, 887–901. [Google Scholar]
  14. Rapport, D.J. What constitute ecosystem health? Perspect. Biol. Med. 1989, 33, 120–132. [Google Scholar] [CrossRef]
  15. Lackey, R.T. Values, policy, and ecosystem health. Bioscience 2001, 51, 437–443. [Google Scholar] [CrossRef]
  16. Shrader-Frechette, K.S. Ecosystem health: A new paradigm for ecological assessment? Trends Ecol. Evol. 1994, 9, 456–457. [Google Scholar] [CrossRef]
  17. Shear, H. The development and use of indicators to assess the state of ecosystem health in the Great Lakes. Ecosyst. Health 1996, 2, 241–258. [Google Scholar]
  18. Ma, S.J.; Wang, R.S. The social-economic-natural complex ecosystem. Acta Ecol. Sinca 1984, 4, 1–9. (In Chinese) [Google Scholar]
  19. Apport, D.J.; Costanza, R.; Mcmichael, A.J. Assessing eco-system health. Trends Ecol. Evol. 1998, 13, 397–402. [Google Scholar] [CrossRef]
  20. Qi, F.; Li, Q.X.; Zhu, L. Assessment method of marine ecosystem health. Mar. Sci. Bull. 2007, 26, 97–104. [Google Scholar]
  21. Zhao, Z.Y.; Xu, F.L.; Zhan, W.; Hao, J.Y.; Zhang, Y.; Zhao, S.S.; Hu, W.P.; Tao, S. A quantitative method for assessing lake ecosystem health. Acta Ecol. Sin. 2005, 25, 1466–1474. (In Chinese) [Google Scholar]
  22. Pinto, U.; Maheshwari, B.L.; Ollerton, R.L. Analysis of long-term water quality for effective river health monitoring in peri-urban landscapes—a case study of the Hawkesbury—Nepean river system in NSW, Australia. Environ. Monit. Assess. 2013, 185, 4551–4569. [Google Scholar] [CrossRef] [PubMed]
  23. Shen, C.C.; Shi, H.H.; Zheng, W.; Ding, D.W. Spatial heterogeneity of ecosystem health and its sensitivity to pressure in the waters of nearshore archipelago. Ecol. Indic. 2016, 61, 822–832. [Google Scholar] [CrossRef]
  24. Zhang, Y.; Yang, Z.F.; Yu, X.Y. Measurement and evaluation of interactions in complex urban ecosystem. Ecol. Model. 2006, 196, 77–89. [Google Scholar] [CrossRef]
  25. Chaves, H.M.L.; Alipaz, S. An integrated indicator based on basin hydrology, environment, life, and policy: The watershed sustainability index. Water Resour. Manag. 2007, 21, 883–895. [Google Scholar] [CrossRef]
  26. Mageau, M.T.; Costanza, R.; Ulanowicz, R.E. The development and initial testing of a quantitative assessment of ecosystem health. Ecosyst. Health 1995, 1, 201–213. [Google Scholar]
  27. Zhang, J.E.; Luo, S.M. A discussion on basic content and evaluation index system of agroecosystem health. Chin. J. Appl. Ecol. 2004, 15, 1473–1476. (In Chinese) [Google Scholar]
  28. Van, N.L.; Adams, J.B.; Bate, G.C.; Forbes, A.T.; Forbess, N.T.; Huizinga, P.; Lamberth, S.J.; Mackay, C.F.; Petersen, C.; Talijaard, S.; et al. Country-wide assessment of estuary health: An approach for integrating pressures and ecosystem response in a data limited environment. Estuar. Coast. Shelf Sci. 2013, 130, 239–251. [Google Scholar]
  29. Bebianno, M.J.; Pereira, C.G.; Rey, F.; Cravo, A.; Duarte, D.; D’Errico, G.; Regoli, F. Integrated approach to assess ecosystem health in harbor areas. Sci. Total Environ. 2015, 514, 92–107. [Google Scholar] [CrossRef]
  30. Sun, C.; Wu, Y.; Zou, W.; Zhao, L.; Liu, W. A Rural Water Poverty Analysis in China Using the DPSIR-PLS Model. Water Resour. Manag. 2018, 32, 1933–1951. [Google Scholar] [CrossRef]
  31. Wang, F.; Zhang, R.; Kang, P.; Zhao, H. An evaluation of the ecological security of the Dongting lake, China. Desalination Water Treat. 2018, 110, 283–297. [Google Scholar] [CrossRef]
  32. Zhao, R.; Shao, C.; He, R. Spatiotemporal Evolution of Ecosystem Health of China’s Provinces Based on SDGs. Int. J. Environ. Res. Public Health 2021, 18, 10569. [Google Scholar] [CrossRef] [PubMed]
  33. Pan, Z.; He, J.; Liu, D.; Wang, J.; Guo, X. Ecosystem health assessment based on ecological integrity and ecosystem services demand in the middle reaches of the yangtze river economic belt, China. Sci. Total Environ. 2021, 774, 144837. [Google Scholar] [CrossRef]
  34. Ostrom, E. A general framework for analyzing sustainability of social-ecological systems. Science 2009, 325, 419–422. [Google Scholar] [CrossRef]
  35. Liu, J.; Dietz, T.; Carpenter, S.R.; Alberti, M.; Folke, C.; Moran, E.; Pell, A.N.; Deadman, P.; Kratz, T.; Lubchenco, J.; et al. Complexity of coupled human and natural systems. Science 2007, 317, 1513–1516. [Google Scholar] [CrossRef]
  36. Shen, W.; Zheng, Z.; Qin, Y.; Li, Y. Spatiotemporal characteristics and driving force of ecosystem health in an important ecolog-ical function region in China. Int. J. Environ. Res. Public Health 2020, 17, 5075. [Google Scholar] [CrossRef]
  37. Costanza, R. Ecosystem health and ecological engineering. Ecol. Eng. 2012, 45, 24–29. [Google Scholar] [CrossRef]
  38. Li, W.; Wang, Y.; Xie, S.; Cheng, X. Coupling coordination analysis and spatiotemporal heterogeneity between urbanization and ecosystem health in Chongqing municipality, China. Sci. Total Environ. 2021, 791, 148311. [Google Scholar] [CrossRef]
  39. Liu, Y.; Yang, C.; Tan, S.; Zhou, H.; Zeng, W. An approach to assess spatio-temporal heterogeneity of rural ecosystem health: A case study in Chongqing mountainous area, China. Ecol. Indic. 2022, 136, 108644. [Google Scholar] [CrossRef]
  40. Lu, Y.; Wang, R.; Zhang, Y.; Su, H.; Wang, P.; Jenkins, A.; Ferrier, R.C.; Bailey, M.; Squire, G. Ecosystem health towardssustainability. Ecosyst. Health Sustain. 2015, 1, 1–15. [Google Scholar]
  41. Hu, M.; Sarwar, S.; Li, Z. Spatio-Temporal Differentiation Mode and Threshold Effect of Yangtze River Delta Urban Ecological Well-Being Performance Based on Network DEA. Sustainability 2021, 13, 4550. [Google Scholar] [CrossRef]
  42. Ji, Y.; Huang, G.H.; Sun, W. Risk assessment of hydropower stations through an integrated fuzzy entropy-weight multiple criteria decision making method: A case study of the Xiangxi River. Expert Syst. Appl. 2015, 42, 5380–5389. [Google Scholar] [CrossRef]
  43. Shemshadi, A.; Shirazi, H.; Toreihi, M.; Tarokh, M.J. A fuzzy VIKOR method for supplier selection based on entropy measure for objective weighting. Expert Syst. Appl. 2011, 38, 12160–12167. [Google Scholar] [CrossRef]
  44. Wang, C.; He, Y.Z. Spatio-temporal differentiation and differentiated regulation of the vulnerability of rural production space system in Chongqing. Acta Geogr. Sin. 2020, 75, 1680–1698. (In Chinese) [Google Scholar]
  45. Li, P.X.; Chen, W.; Sun, W. Spatial differentiation and influencing factors of rural territorial multifunctions in developed regions: A case study of Jiangsu Province. Acta Geogr. Sin. 2014, 69, 797–807. [Google Scholar]
  46. Wang, X.; Yang, C.; Liu, T.; Chen, G.; Yue, H. Assessment spatio-temporal coupling coordination relationship between mountain rural ecosystem health and urbanization in Chongqing municipality, China. Environ. Sci. Pollut. Res. 2022, 29, 48388–48410. [Google Scholar] [CrossRef]
  47. Bryan, B.A.; Gao, L.; Ye, Y.; Sun, X.; Connor, J.D.; Crossman, N.D.; Stafford-Smith, M.; Wu, J.; He, C.; Yu, D.; et al. China’s response to a national land-system sustainability emergency. Nature 2018, 559, 193–204. [Google Scholar] [CrossRef]
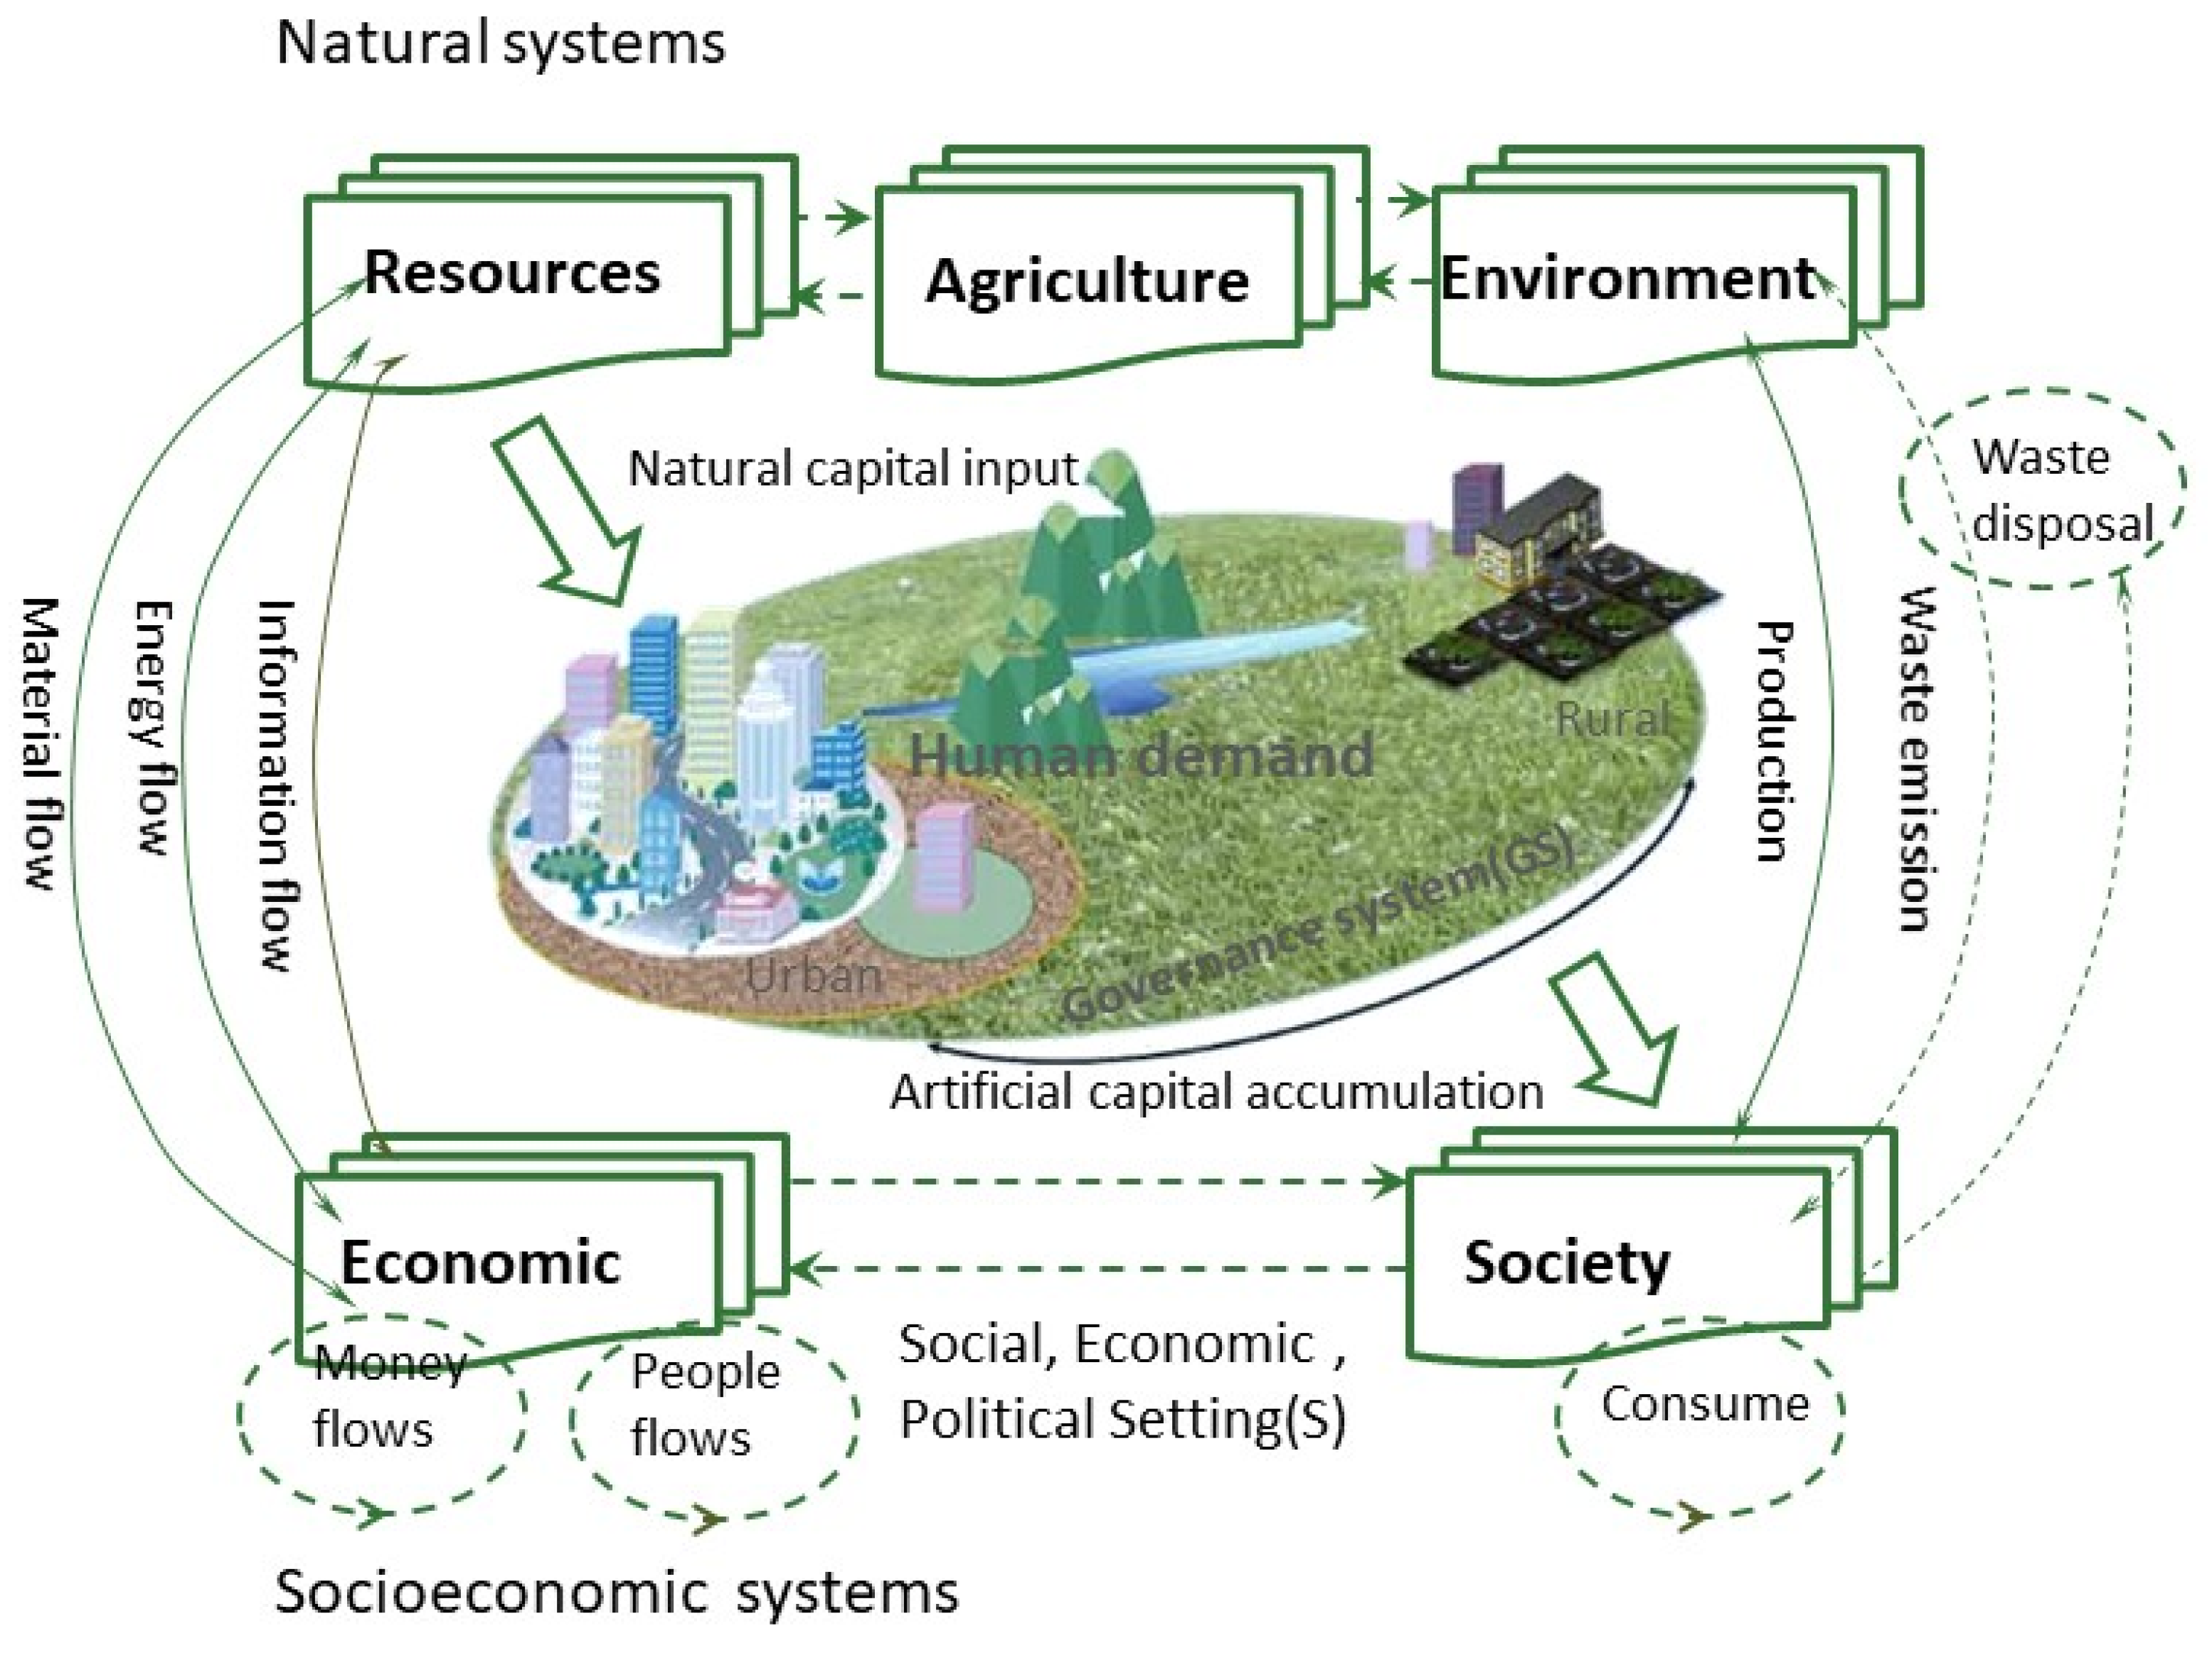
Figure 1. Connotation interpretation of the REH.
Land 13 01672 g001
Figure 2. The improved REH assessment framework.
Land 13 01672 g002
Figure 3. The study area (Source: Chongqing Municipality 2018).
Land 13 01672 g003
Figure 4. Time series evolution of the REH in Chongqing from 2000 to 2018.
Land 13 01672 g004
Figure 5. Spatial distribution of comprehensive scores of the REH in 36 districts and counties in Chongqing in 2018.
Land 13 01672 g005
Figure 6. Spatial distribution statistics of four subsystems health level in Chongqing.
Land 13 01672 g006
Figure 7. Spatial distribution of rural resources, agricultural, environmental, and socioeconomic ecosystem health in 36 districts and counties in Chongqing in 2018.
Land 13 01672 g007
Figure 8. Spatial distribution of rural ecosystem health types in Chongqing.
Land 13 01672 g008
Table 1. Rural ecosystem health indicator system.
SystemSubsystemNo.IndicatorsConnotationUnits2018
Value
Indicator
Character
Benchmark
Rural
Ecosystem health (R)
Rural resources subsystem (RES)R11Cultivated land area per capitaTotal cultivated area/rual total populationha0.7PositiveSDG6
SDG13
SDG15
R12Water resources per capitaTotal water resources/rural total populationm3/per capita225.59Positive
R13Irrigated area per capitaIrrigated area is equal to the sum area of paddy field and irrigated land that could be normally irrigated with irrigation equipment, reflecting the suitable tillage condition of cultivated land/rual total populationha0.32Positive
R14Forest coverage rateForest coverage rate reflects the richness of forest resources and the status of ecological balance%48.3Positive
rural agricultural subsystem (RAS)R21Sown area of farm corps per capitaSown area of farm crops refers to agricultural production operators sown or transplant area on all the land (arable or non-arable land) in the calendar year, reflecting the rural crop production situation/rual total populationha0.16PositiveSDG2
SDG15
R22Chemical fertilizer use intensityFertilizer application rate/cultivated areaTon/km23.91Negative
R23Chemical pesticides use intensityPesticide application rate/cultivated areaTon/km20.72Negativ
R24The grain output per capitaThe grain output refers to the total amount of grain produced by agricultural producers and operators during the calendar year/rual total populationTon5.16Positive
rural environmental subsystem (REnvS)R31The rate of water quality up to the standardPercentage of drinking water sources up to standard%100Positive
R32Proportion of high quality daysHigh air quality days/per year%86.6PositiveSDG6
SDG13
SDG15
R33Biological richness index Biological richness index is obtained by calculating the three indicators of plant richness, proportion of area of nature reserve and wildlife richness%71.32Positive
R34Acid rain frequencyNumber of acid rain days/per year%14Negativ
R35Comprehensive energy consumptionTotal energy consumption/GDPTon standard coal/ten thousand yuan0.422Negativ
R36Crop disaster area per year ②The area of crops lostkm270.86Negativ
Rural socioeconomic subsystem (RSecS)R41The per capita output value of agriculture, forestry, animal husbandry and fisheryGross output value of agriculture, forestry, animal husbandry and fishery/rural total populationten thousand yuan/Person1.1742PositiveSDG1
SDG2
SDG3
SDG4
SDG5
SDG7
SDG8
SDG9
SDG12
R42Density of rural populationRural population/total areaPerson/km2212.12Positive
R43Per capita self-owned housing area in ruralRural residential area/rural resident populationm253.93Positive
R44Per capita rural electricity consumptionRural electricity consumption/rural populationkw·h/person454.98Positive
R47Per capita living expenditure of rural residentsPer capita living expenditure of rural residents reflects the average income level of rural residents according to the average net income level of the population, Yuan13,781Positive
R46Rural employment populationRural personnel engaged in social labor for the purpose of obtaining remuneration or income from business operationsPeopel1285.41Positive
R47General public budgetary expenditureGovernment expenditures for the provision of basic public administration and servicesYuan45,409.49 × 105Positive
R48Engel coefficient of rural residentsRural residents total expenditure on food, tobacco and alcohol/total expenditure on consumption%34.9Negativ
Notes: ① Biological richness index is obtained by referring to the calculation method of Meng et al. [2] according to HJ 623-2011 Evaluation Criteria for Regional Biodiversity, three indicators of plant richness, proportion of area of nature reserve and wildlife richness are adopted, part of the data were derived from the research data of the Chongqing Biodiversity Assessment project jointly undertaken by Chongqing University and Southwest University. ② Crop disaster area per year data is obtained from Chongqing Ecological Environment Status Bulletin 2019 issued by Chongqing Ecological Environment Bureau http://sthjj.cq.gov.cn/hjzl_249/, accessed on 9 October 2024.
Disclaimer/Publisher’s Note: The statements, opinions and data contained in all publications are solely those of the individual author(s) and contributor(s) and not of MDPI and/or the editor(s). MDPI and/or the editor(s) disclaim responsibility for any injury to people or property resulting from any ideas, methods, instructions or products referred to in the content.