Article

Using Local Entropy Mapping as an Approach to Quantify Surface Temperature Changes Induced by Urban Parks in Mexico City

by
Juan Manuel Núñez
1,*,
Andrea Santamaría
2,
Leonardo Avila
2 and
D. A. Perez-De La Mora
3
1
Centro Transdisciplinar Universitario para la Sustentabilidad, Universidad Iberoamericana, Mexico City 01219, Mexico
2
Sustentabilidad Ambiental, Universidad Iberoamericana, Mexico City 01219, Mexico
3
Instituto de Investigación Aplicada y Tecnología, Universidad Iberoamericana, Mexico City 01219, Mexico
*
Author to whom correspondence should be addressed.
Land 2024, 13(10), 1701; https://doi.org/10.3390/land13101701
Submission received: 20 September 2024 / Revised: 13 October 2024 / Accepted: 16 October 2024 / Published: 18 October 2024

Abstract

:
Understanding the mechanisms whereby parks contribute to cooling urban settings is critical to effectively addressing the challenges posed by rising temperatures in densely populated cities and ultimately improving the quality of urban life. This study employs a spatial approach with advanced analytical techniques, including local entropy mapping, to quantify surface temperature changes induced by urban parks across different geographical areas. Using satellite imagery to estimate land surface temperature (LST) during a heat wave in Mexico City, the study provides a practical approach to understanding the complex relationship between urban park size and urban heat island intensity within 300 m. The study’s findings indicate that while parks exert a cooling influence on their immediate vicinity, the extent of this effect varies spatially and depends on factors such as the size and location of the park and the nature of the surrounding terrain. Specifically, the results indicate that this relationship is not randomly distributed across the urban landscape. Instead, there is a clear pattern of spatial clustering within the city. Consequently, this research underlines the complexity of the problem, emphasizing the indispensable role of urban design and planning strategies to harness the full potential of parks as cooling agents within cities.

1. Introduction

Global warming is increasing the occurrence of extreme weather events worldwide, meaning that heat waves, dry periods, storms, and heavy rainfall will increase in number and severity in the coming years [1]. In mid- and low-latitude cities, the typical intensity of a heat island averages between 3 and 5 °C on a summer day, increasing discomfort and the demand for air conditioning [2]. In cities threatened by global warming and the urban heat island (UHI) phenomenon, buildings are both major causes and victims of urban overheating [3].
In highly urbanized areas affected by global warming, urban green and blue spaces are essential for adapting to extreme climate events such as heat and drought [4]. These and other benefits materialize in a wide range of ecosystem services, making it possible to combat these urban evils by improving the quality of life of city residents [5]. Specifically, urban green spaces are viewed as an appropriate means of reducing the effects of urban heat islands and providing recreation for the occupants of urbanized areas. Specifically, trees, green roofs, and vegetation can help reduce the effects of urban heat islands by shading building surfaces, deflecting radiation from the sun, and releasing moisture into the atmosphere [6,7]. In addition to cooling the urbanized area, urban green spaces can also influence the surrounding area, a phenomenon known as the urban green space cooling effect (CE) [8].
In this context, research on the impact of urban green spaces on creating a cooling effect, reducing urban heat islands, and providing thermal comfort in urban environments has seen a steady increase in recent years [9,10,11,12]. Traditionally, the cooling effect of green spaces in the UHI has been analyzed by evaluating the strength of the statistical relationship between land surface temperature (LST) and the landscape pattern or mix of vegetation elements in a space [13]. The cooling effect can be evaluated in terms of cooling intensity and cooling amplitude [14]. The former is the maximum difference between the average temperature of a specific area outside the green space or aquascape and the average temperature of that area [15]. The latter is the range of the cooling effect, usually expressed as the distance corresponding to the cooling intensity [16].
These approaches are designed to determine the distribution and size of urban green spaces that can partially reduce the intensity of UHI, fostering a resilient urban environment and contributing to the adaptation and mitigation of climate change. Some of the methods reported employ a wide range of approaches and data to understand the effect of urban parks and gardens in creating a cooling effect and counteracting the urban heat island effect [17]. Generally speaking, the cooling effect of green spaces has been recognized as a promising approach for mitigating urban heat islands. However, the results of quantitative analyses of the effect of size and distribution thresholds for cooling are as yet unclear [18].
Studies on the cooling effect of urban parks or green spaces in cities have revealed that the cooling effect of parks varies in terms of time, magnitude, and spatial distribution [18,19,20,21,22]. Other articles have found that the CE of parks is influenced by the composition and configuration of the landscape within and around parks [23,24]. Characteristics of the area around parks, such as land cover and particularly impervious surfaces such as parking lots, have been reported as significant in the CE of parks [25,26]. Furthermore, the relationship between green spaces and land surface temperature (LST) has been a focal point in analyzing the effectiveness of green spaces in reducing UHI effects. Bivariate analyses of these two variables help in understanding the cooling impact of urban parks and identifying different configurations for cooling.
The purpose of this study is assessing Local Entropy Mapping as a methodology to quantify surface temperature changes induced by urban parks in Mexico City. The objectives were to (1) estimate the Intensity of the Urban Heat Island from the temperature difference between land surface temperature (LST) and the maximum ambient temperature for the third heat wave in Mexico City in June 2023; (2) use local entropy mapping to quantify surface temperature changes induced in the surroundings of urban parks. The results of this study can provide information on the impact of the different urban parks and encourage further research on the CE of urban parks in future urban planning of Mexico City.

2. Materials and Methods

2.1. General Description of the Study Area

Mexico City, the capital of Mexico, is a city of 9.2 million inhabitants, located approximately 2200 m above sea level on a lake plain surrounded by a mountainous area, giving it special environmental characteristics, such as the predominantly temperate, subhumid climate, with average temperatures ranging from 25 °C from March to May to 5 °C in January. Although the urban area occupies most of the territory, in the south and southeast, there are mainly rainfed agricultural areas and grassland, as well as a considerable expanse of temperate forest (Figure 1).

2.2. Methodological Proposal

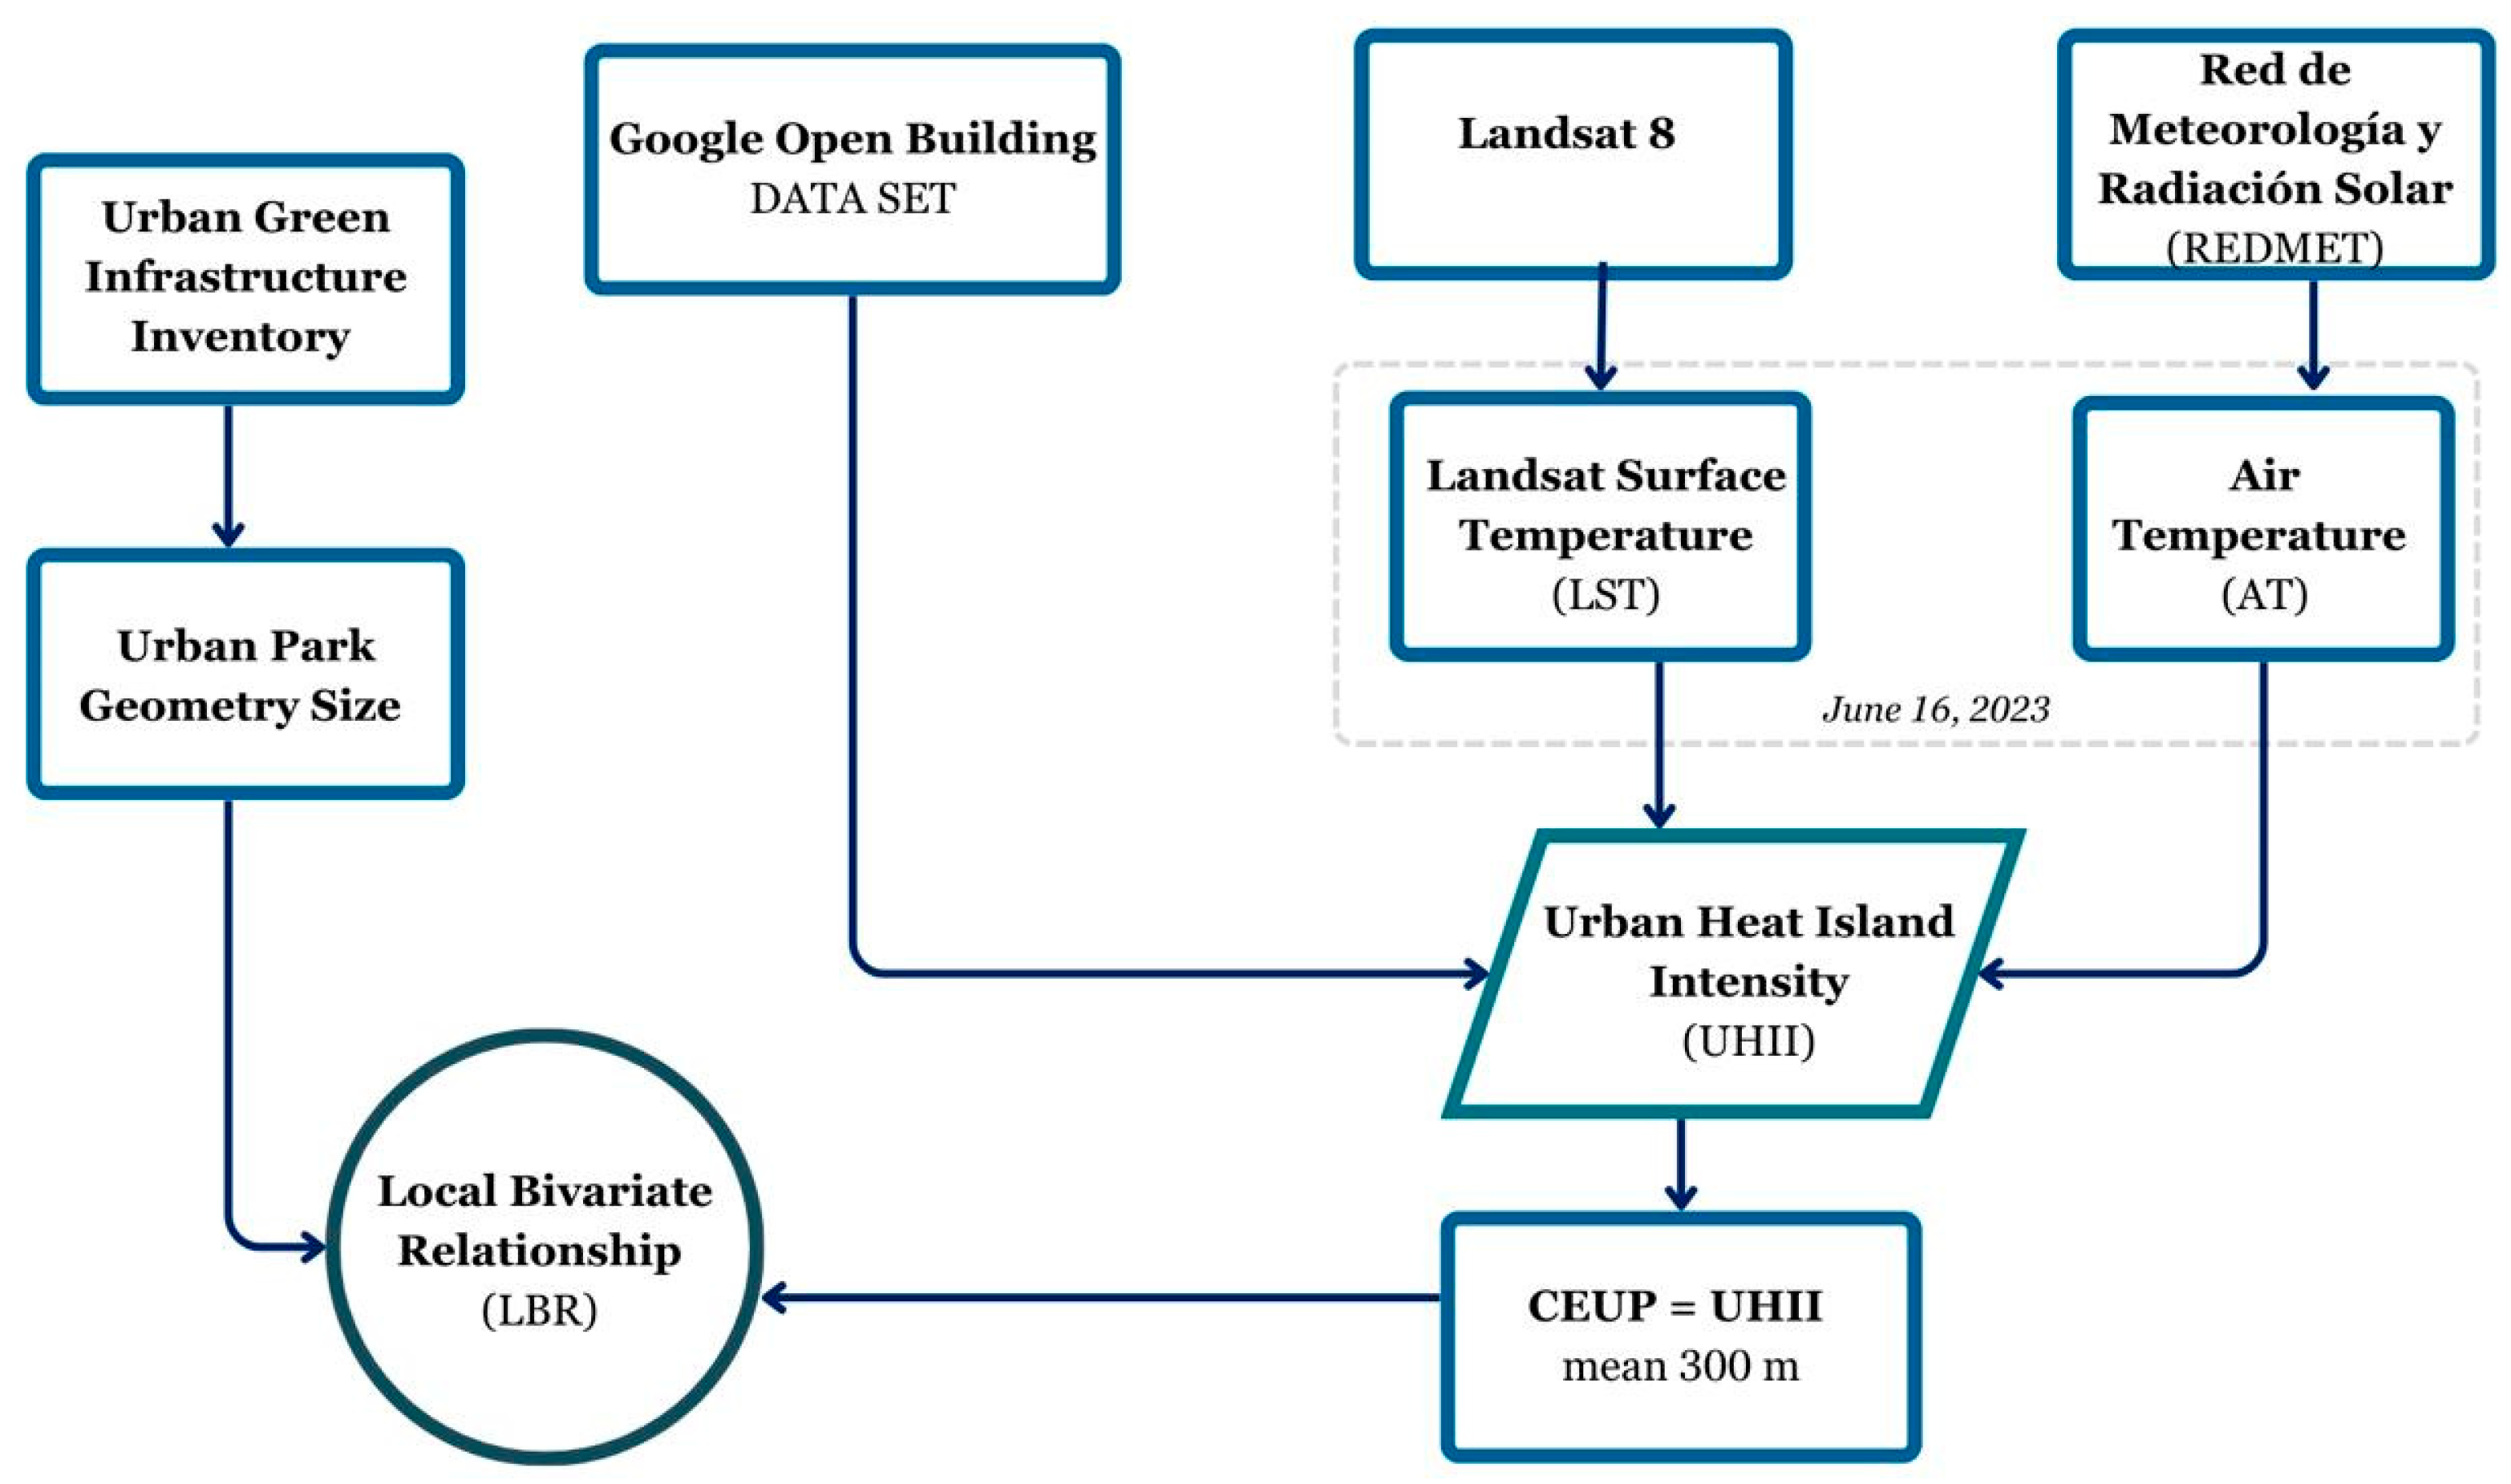
This methodological proposal uses LST estimation from Landsat images as well as meteorological data of maximum air temperature to assess the cooling effect of urban parks in Mexico City during the third heat wave, which affected most of the country from 1 January to 22 June 2023 [27]. To conduct the urban scale analysis of this effect, vector data on urban parks drawn from the Mexico City inventory [28] were incorporated, together with a set of global data on the contours of buildings derived from high-resolution satellite images, from the third version (v3) by the Google research team in Accra, Ghana [29]. These data were combined to analyze the cooling effect of Mexico City urban parks on the surrounding building footprints within a radius of 300 m by calculating the Local Bivariate Relationships, one spatial tool that analyzes two variables to find statistically significant relationships using local entropy (Figure 2).

2.3. Obtaining Data on Urban Parks and Building Contours

In Mexico City, the Environmental Law for Land Protection in the Federal District (LAPTDF), modified in 2017, states that green spaces are any surface covered by natural or induced vegetation located in Mexico City. It also mandates the permanent updating of the Green Spaces Inventory that must at least contain the location, area, and types of green spaces, in addition to the flora and fauna species comprising them, and places where new green spaces have been planned [30].
As part of this amendment to the law, in 2017, the Mexico City Urban Green Space Inventory began to be updated, using Geographic Information Systems and high-resolution satellite images to create a basic tool for planning and implementing actions that will make it possible to visualize their management, distribution and creation [28]. The results of this inventory showed the number of green spaces by management category according to the following classification (Table 1).
For this study, the categories of parks, groves, and avenues, as well as squares and gardens, have been chosen to bring them into line with the category of urban parks, defined as areas of delimited open spaces, mostly dominated by vegetation and water, and generally reserved for public use [31]. These urban parks are mostly larger, although they can also be in the form of smaller, “pocket parks”, but locally they are usually defined by the authorities as “parks”. According to the Mexico City Green Space Inventory, urban parks concentrate 24.2% of all the green spaces inventoried in the city. After the data had been cleaned and duplicates eliminated, a total of 1853 records identified 1762 unique polygons, with a surface area of between 10 m and 229 ha, and an average size of 0.84 ha.
In addition to the Mexico City parks, building footprints were obtained from the third version (v3) of the Google Open Buildings database. This is a deep learning model for determining building footprints from high-resolution satellite images useful for a variety of applications, from population estimates, urban planning, and humanitarian response to environmental and climate sciences [29]. In addition to footprint geometry, Google provides a confidence value for each footprint, together with guidelines on suggested confidence thresholds to achieve 80%, 85%, or 90% accuracy [32]. This confidence value enables Google to include many more geometries in its data, many of which may be false detections that can be filtered out using prescribed confidence thresholds, especially in areas where natural building materials are common and buildings can often be mistaken for rocks and other landscape features [33]. For Mexico City, this database consists of nearly 3.2 million records with an average accuracy of 81.2%. This type of record has a set of attributes with a confidence score indicating the accuracy of the building boundary, as well as a unique alphanumeric code corresponding to the center of each building [34].

2.4. Image Processing for Land Surface Temperature (LST) Estimate

The urban land surface is a complex feature that can be described as a combination of impermeable surface materials, green vegetation, water surfaces, and exposed soils [35]. As a result of this complexity, the variation between land surface temperature (LST) within a city and its surrounding area is the result of variations in surface coverage, thermal capacity, and three-dimensional geometry [36]. The differences between material compositions and their configuration in urban and suburban areas is therefore the main contributor to the Surface Urban Heat Island (SUHI) effect.
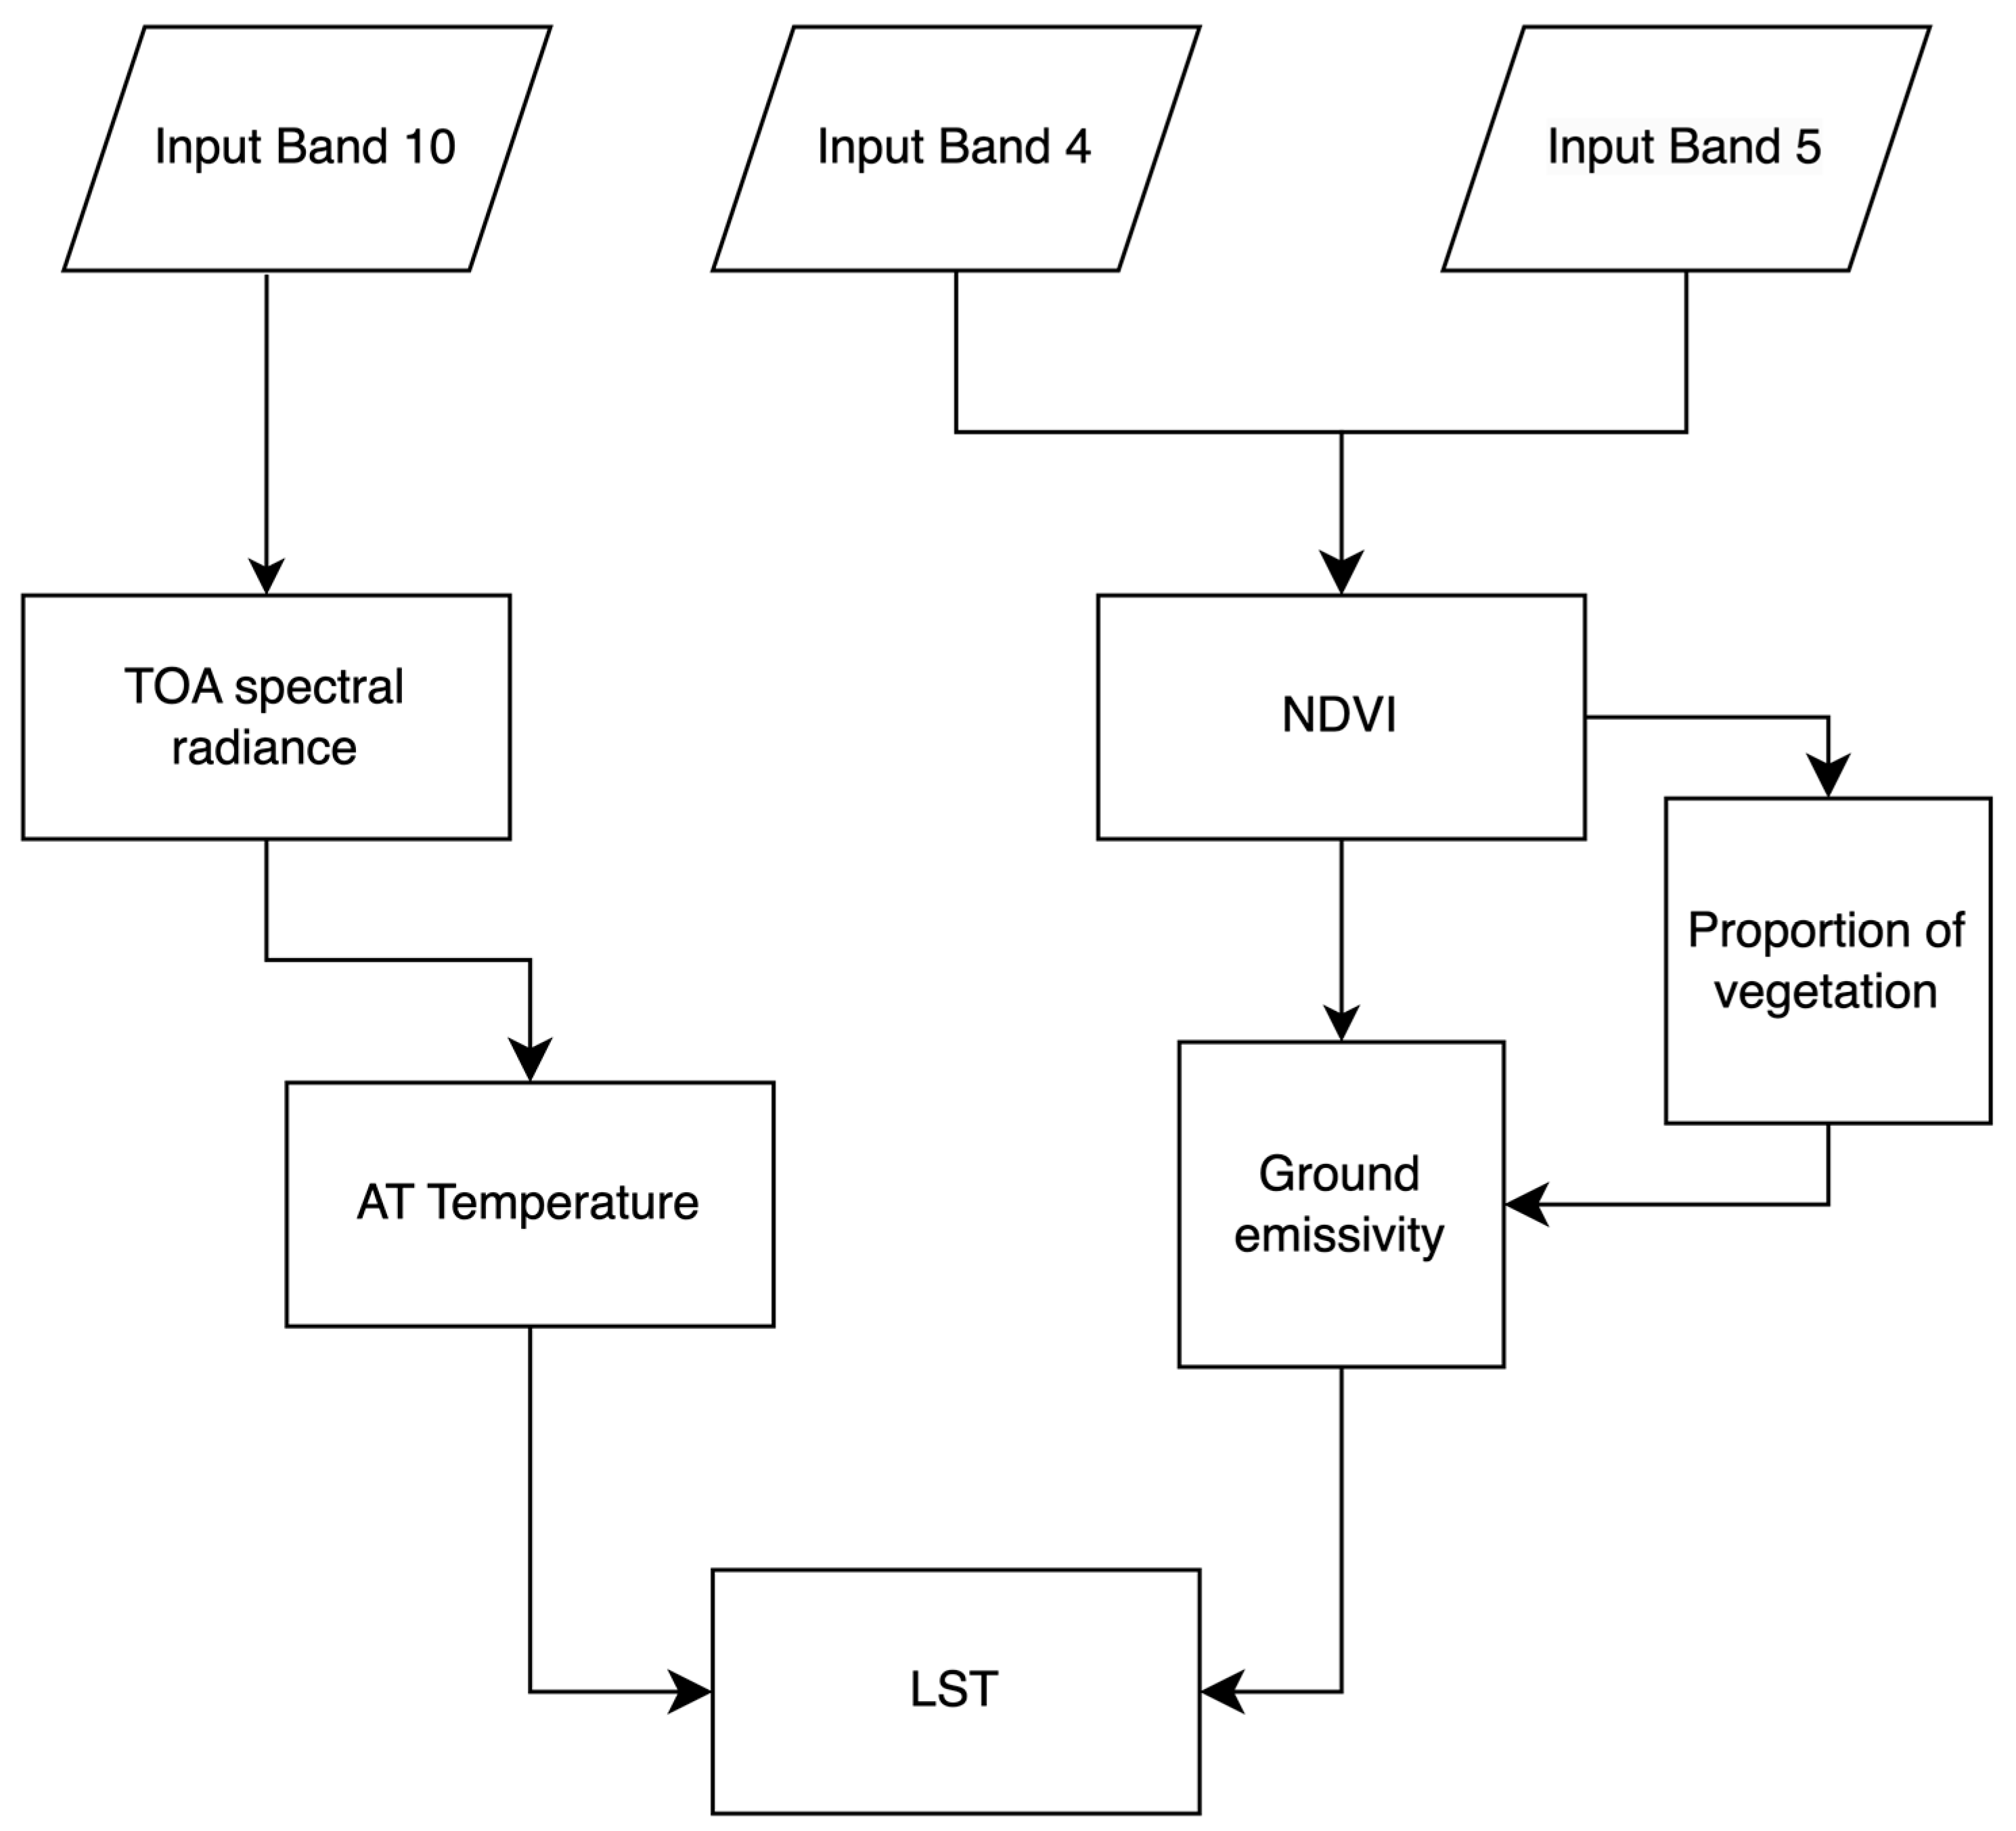
Within urban areas, the intensity of SUHI is determined by the variations in LST between areas with artificial materials and surrounding green and blue areas with similar geographical characteristics. To estimate the LST in this article, a Landsat-8 (OLI/TIRS) sensor image was obtained (USGS; http://www.usgs.gov/ (accessed 14 September 2024)) for 16 June 2023, corresponding to the warmest days in the high pressure system that caused the third heat wave of the year throughout most of the country, with temperatures above 30 °C, creating an extremely hot environment for Mexico City, considered the most extensive, severe heat wave in recent years [27]. Landsat images are widely used to investigate the increase in SUHI and assess the relationship between LST and the land uses/covers (LULC) related to the materials present in urban environments [37]. Figure 3 shows the method used to estimate the LST from the use of bands 4, 5, 10 and 11 of the Landsat 8 Images selected with 30 m spatial resolution and the WGS84 UTM Zone 13 coordinate reference system (EPSG: 32614) according to recently reported methodologies [38,39]. All calculations in this procedure were made using the QGIS free software (version 3.28) with the RS&GIS plugin [40].

2.5. Calculation of the Intensity of the Urban Heat Island and the Cooling Effect of Urban Parks

Urban parks, a key component of urban ecosystems, are essential for regulating the urban microclimate [21]. Analyzing the cooling effect of urban parks (CEUP) is therefore an approach used to mitigate the effects of heat islands. Various Multiple Ring buffer analyses have been widely used to assess the CEUP in previous studies [22,41,42,43]. These studies have used various buffer zone sizes, such as 300, 500, 900 and 1200 m. However, these recent studies mainly focus on comparing the air temperature inside and outside parks. Only a few studies have explored the general pattern of temperature-cooling effects of a park within a surrounding environment [44]. To ensure correspondence with the 30 m spatial resolution of the Landsat 8 image, a 300 meter radius buffer zone was established from each urban park centroid to measure the cooling effect of urban parks.
We retrieved the LST from band 11 and the maximum air temperature on 16 June 2023, to obtain the warming effect in an urban area, quantified by the intensity of urban heat island (UHII), calculated as the surface temperature difference between the pixels of building contours (urban LST) and the maximum ambient temperature (Tair max), obtained from the data of the Red de Meteorología y Radiación Solar (REDMET) of Mexico City. The UHII is not an absolute temperature but a temperature difference that consequently tends to weaken the effects of local weather conditions and other sources of error.
UHII = LST − Tair max,
Subsequently, to explore the relationships between urban park characteristics and the cooling effects in the surroundings of urban parks in Mexico City, we calculate the CEUP as the average of the SUHII value around each urban park in Mexico City within a 300 m radius.
CEUP = UHII mean 300 m,
The SUHII, especially in highly urbanized areas, may be higher than in areas with green and blue spaces due to the absorption by materials such as concrete, iron, glass, and other building materials heat [45]. This variable implies how a higher surface temperature can influence the maximum ambient temperature since the heat stored in urban materials is radiated into the surrounding air, raising overall temperatures [46]. Positive values of SUHII therefore imply a higher surface temperature than that of the environment, whereas negative values represent areas with lower surface temperature values than that of the environment.

2.6. Local Bivariate Relationships

The Local Bivariate Relationships tool in ArcGIS Pro 3.2.2 is used to considerable benefit in this analysis. This method differs from conventional methods of documenting bivariate relationships, calculative methods, which usually capture only the linear correlations between the two variables [47]. To use this information, it is helpful to identify the type of relationship between the variables based on how the explanatory variable predicts the value of the dependent variable. According to [48], each input entity will be classified into one of the following relationship types: not significant: the relationship between the variables is not statistically significant; positive linear: the dependent variable increases linearly as the explanatory variable increases; negative linear: the dependent variable increases linearly as the explanatory variable decreases; concave: the dependent variable changes in the shape of a concave curve as the explanatory variable increases. Concave curves typically curve or arch downward; convex: the dependent variable changes in the shape of a convex curve as the explanatory variable increases. Convex curves typically curve or arch upward; undefined complex: the variables have a significant relationship, but none of the other categories reliably describe the type of relationship.
The correct approach lies in understanding Bivariate Spatial Correlation as the relationship between the value of a variable at a specific location and the spatial lag of another variable [49]. Entropy, a key concept providing a quantitative measure of the uncertainty associated with uncertain variables [50], can be used as a measure of bivariate correlation when evaluating the joint uncertainty of two variables. Unlike traditional methods, this approach does not assume a predefined relationship form and can detect multivariate relationships of various forms simultaneously.
The map calculates Rényi entropy for multivariate data in each geographic region and compares these values with a permutation distribution to determine their significance. The results are statistically tested to control for multiple testing and subsequently mapped to allow interactive location and the examination of significant local relationships [51].
In this study, we used the Local Bivariate Relationships tool in ArcGIS Pro 3.2.2 to measure the cooling effect of urban parks. We used the average CEUP within a 300 m radius buffer zone as a dependent variable and the surface area of urban parks in Mexico City as an independent variable.

3. Results

3.1. Intensity of the Urban Heat Island Intensity in Mexico City

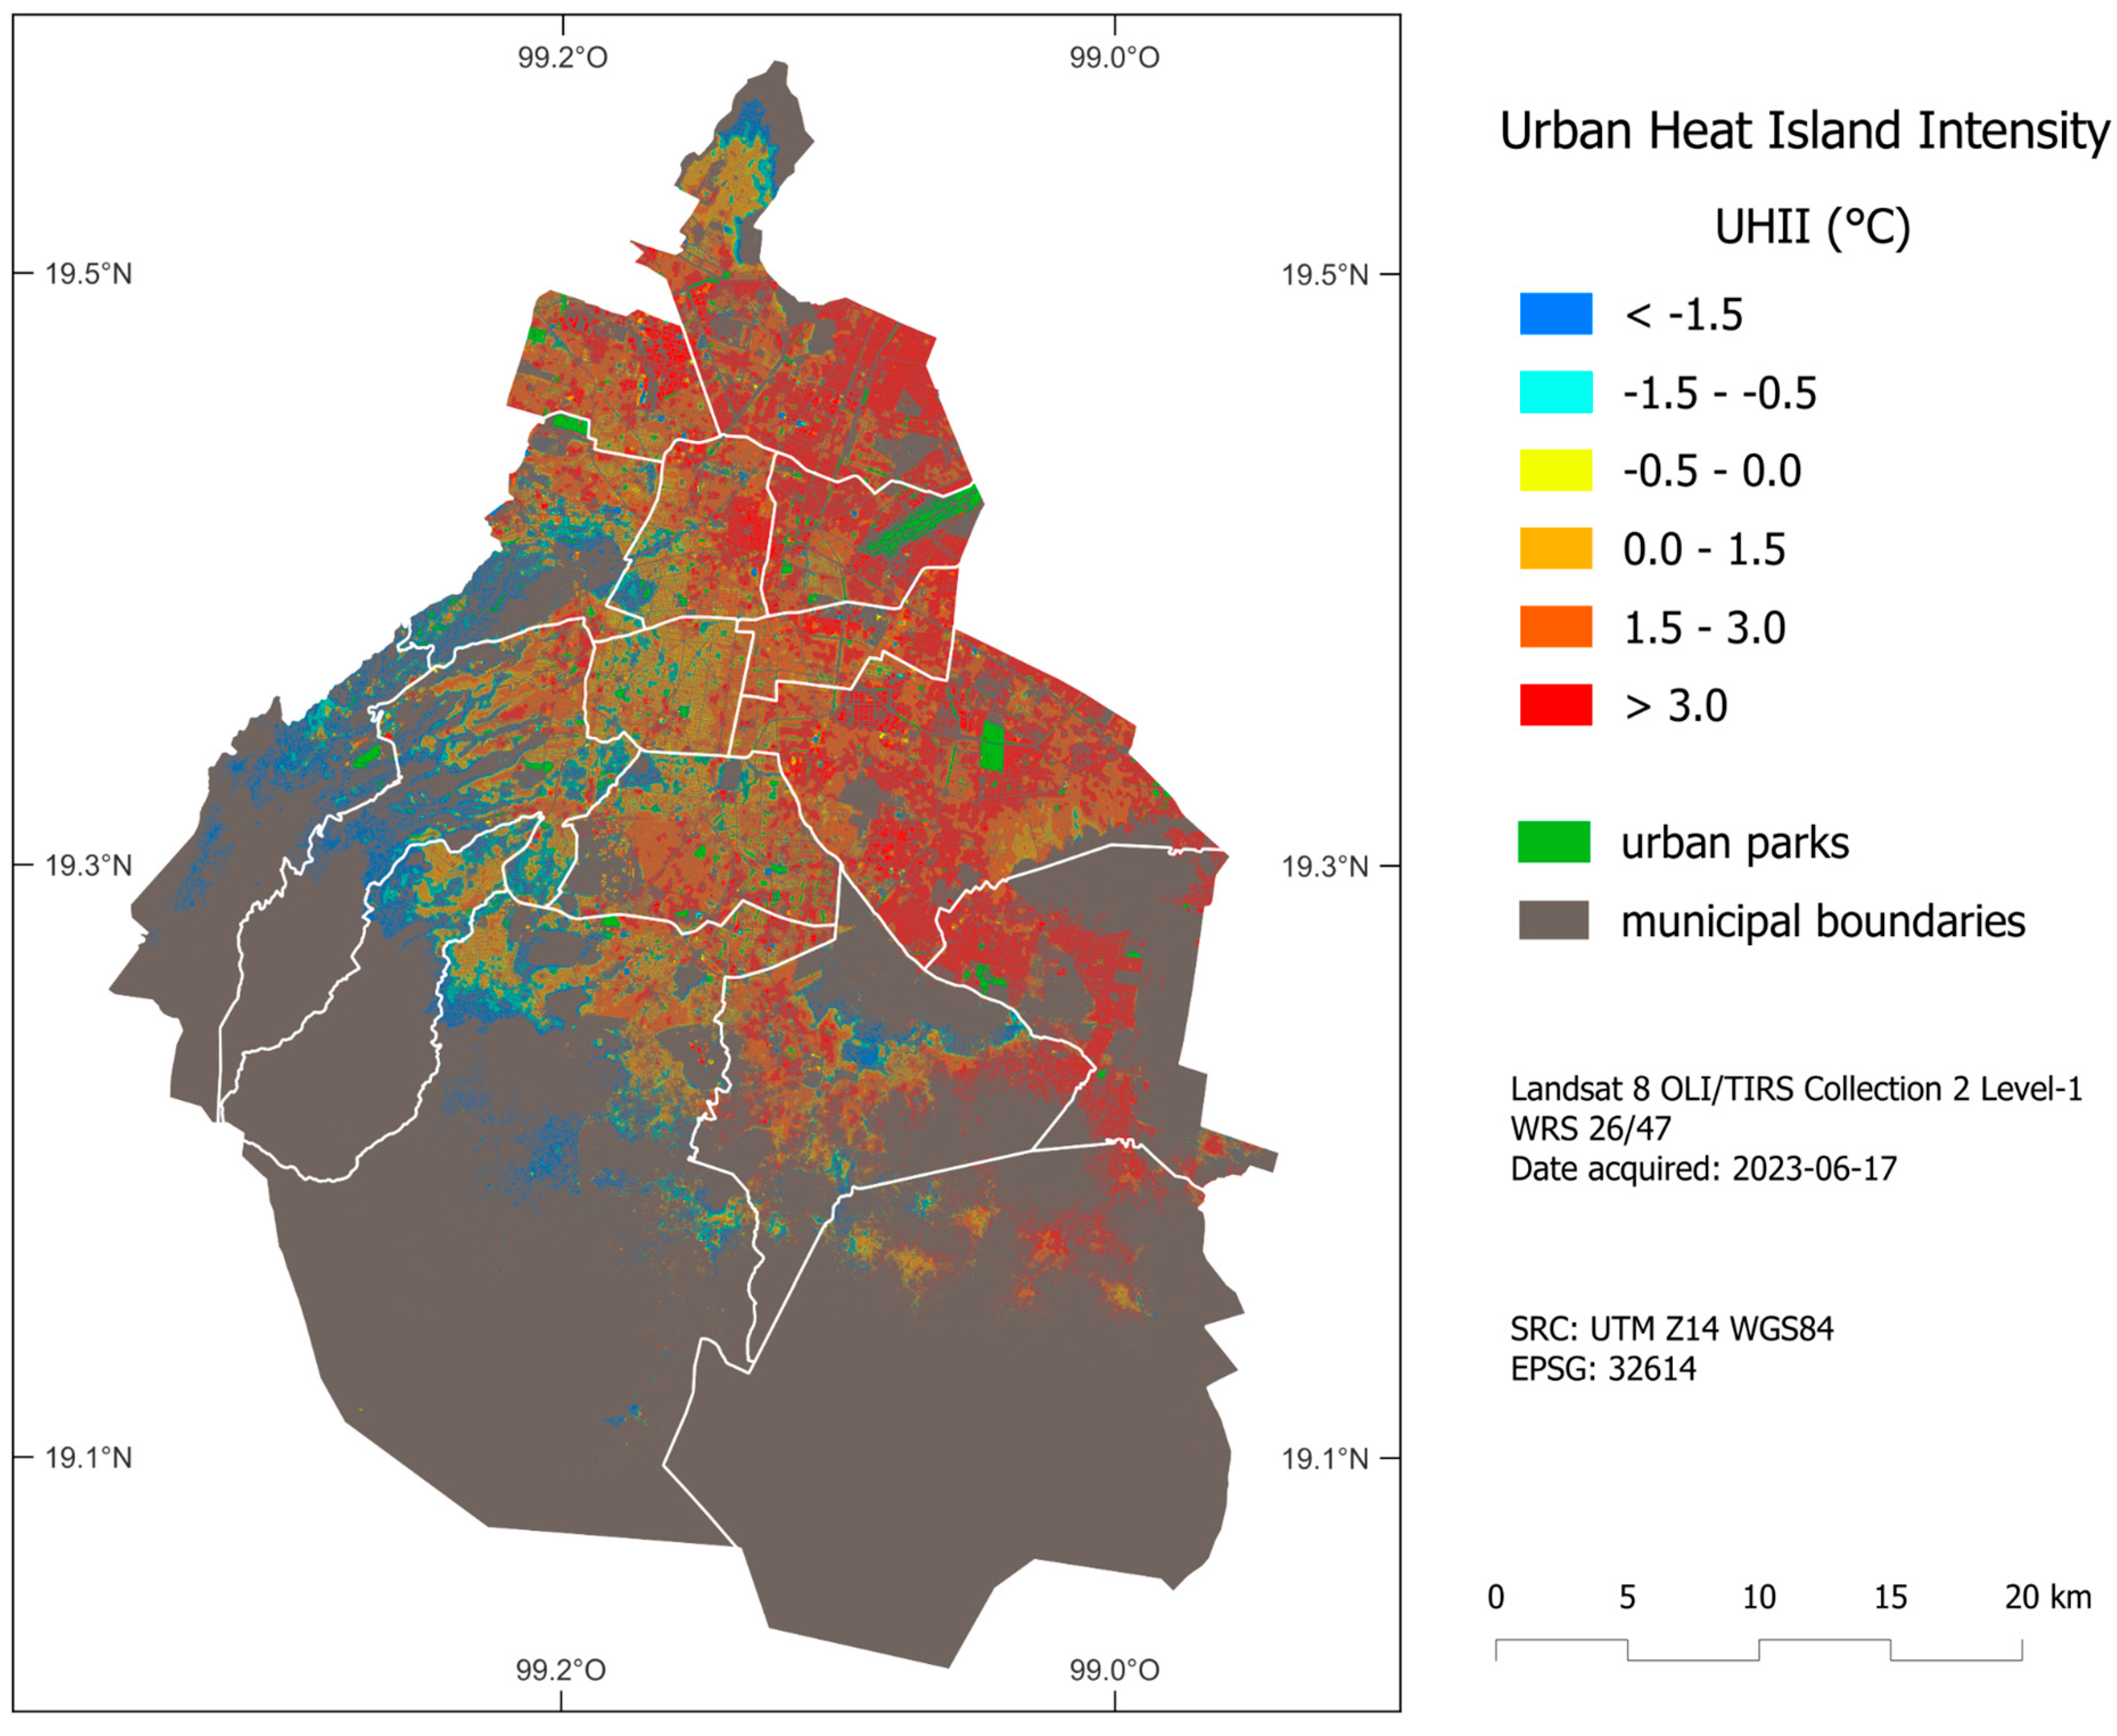
Figure 4 presents the map showing the Urban Heat Island Intensity (UHII), expressed as the difference between the LST and the maximum air temperature of the built surface of Mexico City for 16 June 2023. The positive values, which are predominantly observed in the east of Mexico City, show the areas most affected by the urban heat island effect in the city, mainly areas with a temperature difference of more than 3 °C. Conversely, the upper parts of the city, located primarily in the south-west of the city, show negative temperature values, which translates into greater thermal comfort in the face of the effects of the urban heat island. This result represents an overview of the UHII pattern of the urban area of Mexico City, making it possible to identify the areas of the city most severely affected by the urban heat island effect, in addition to analyzing the cooling effect of urban parks in great detail.

3.2. Understanding Cooling Effect of Urban Parks

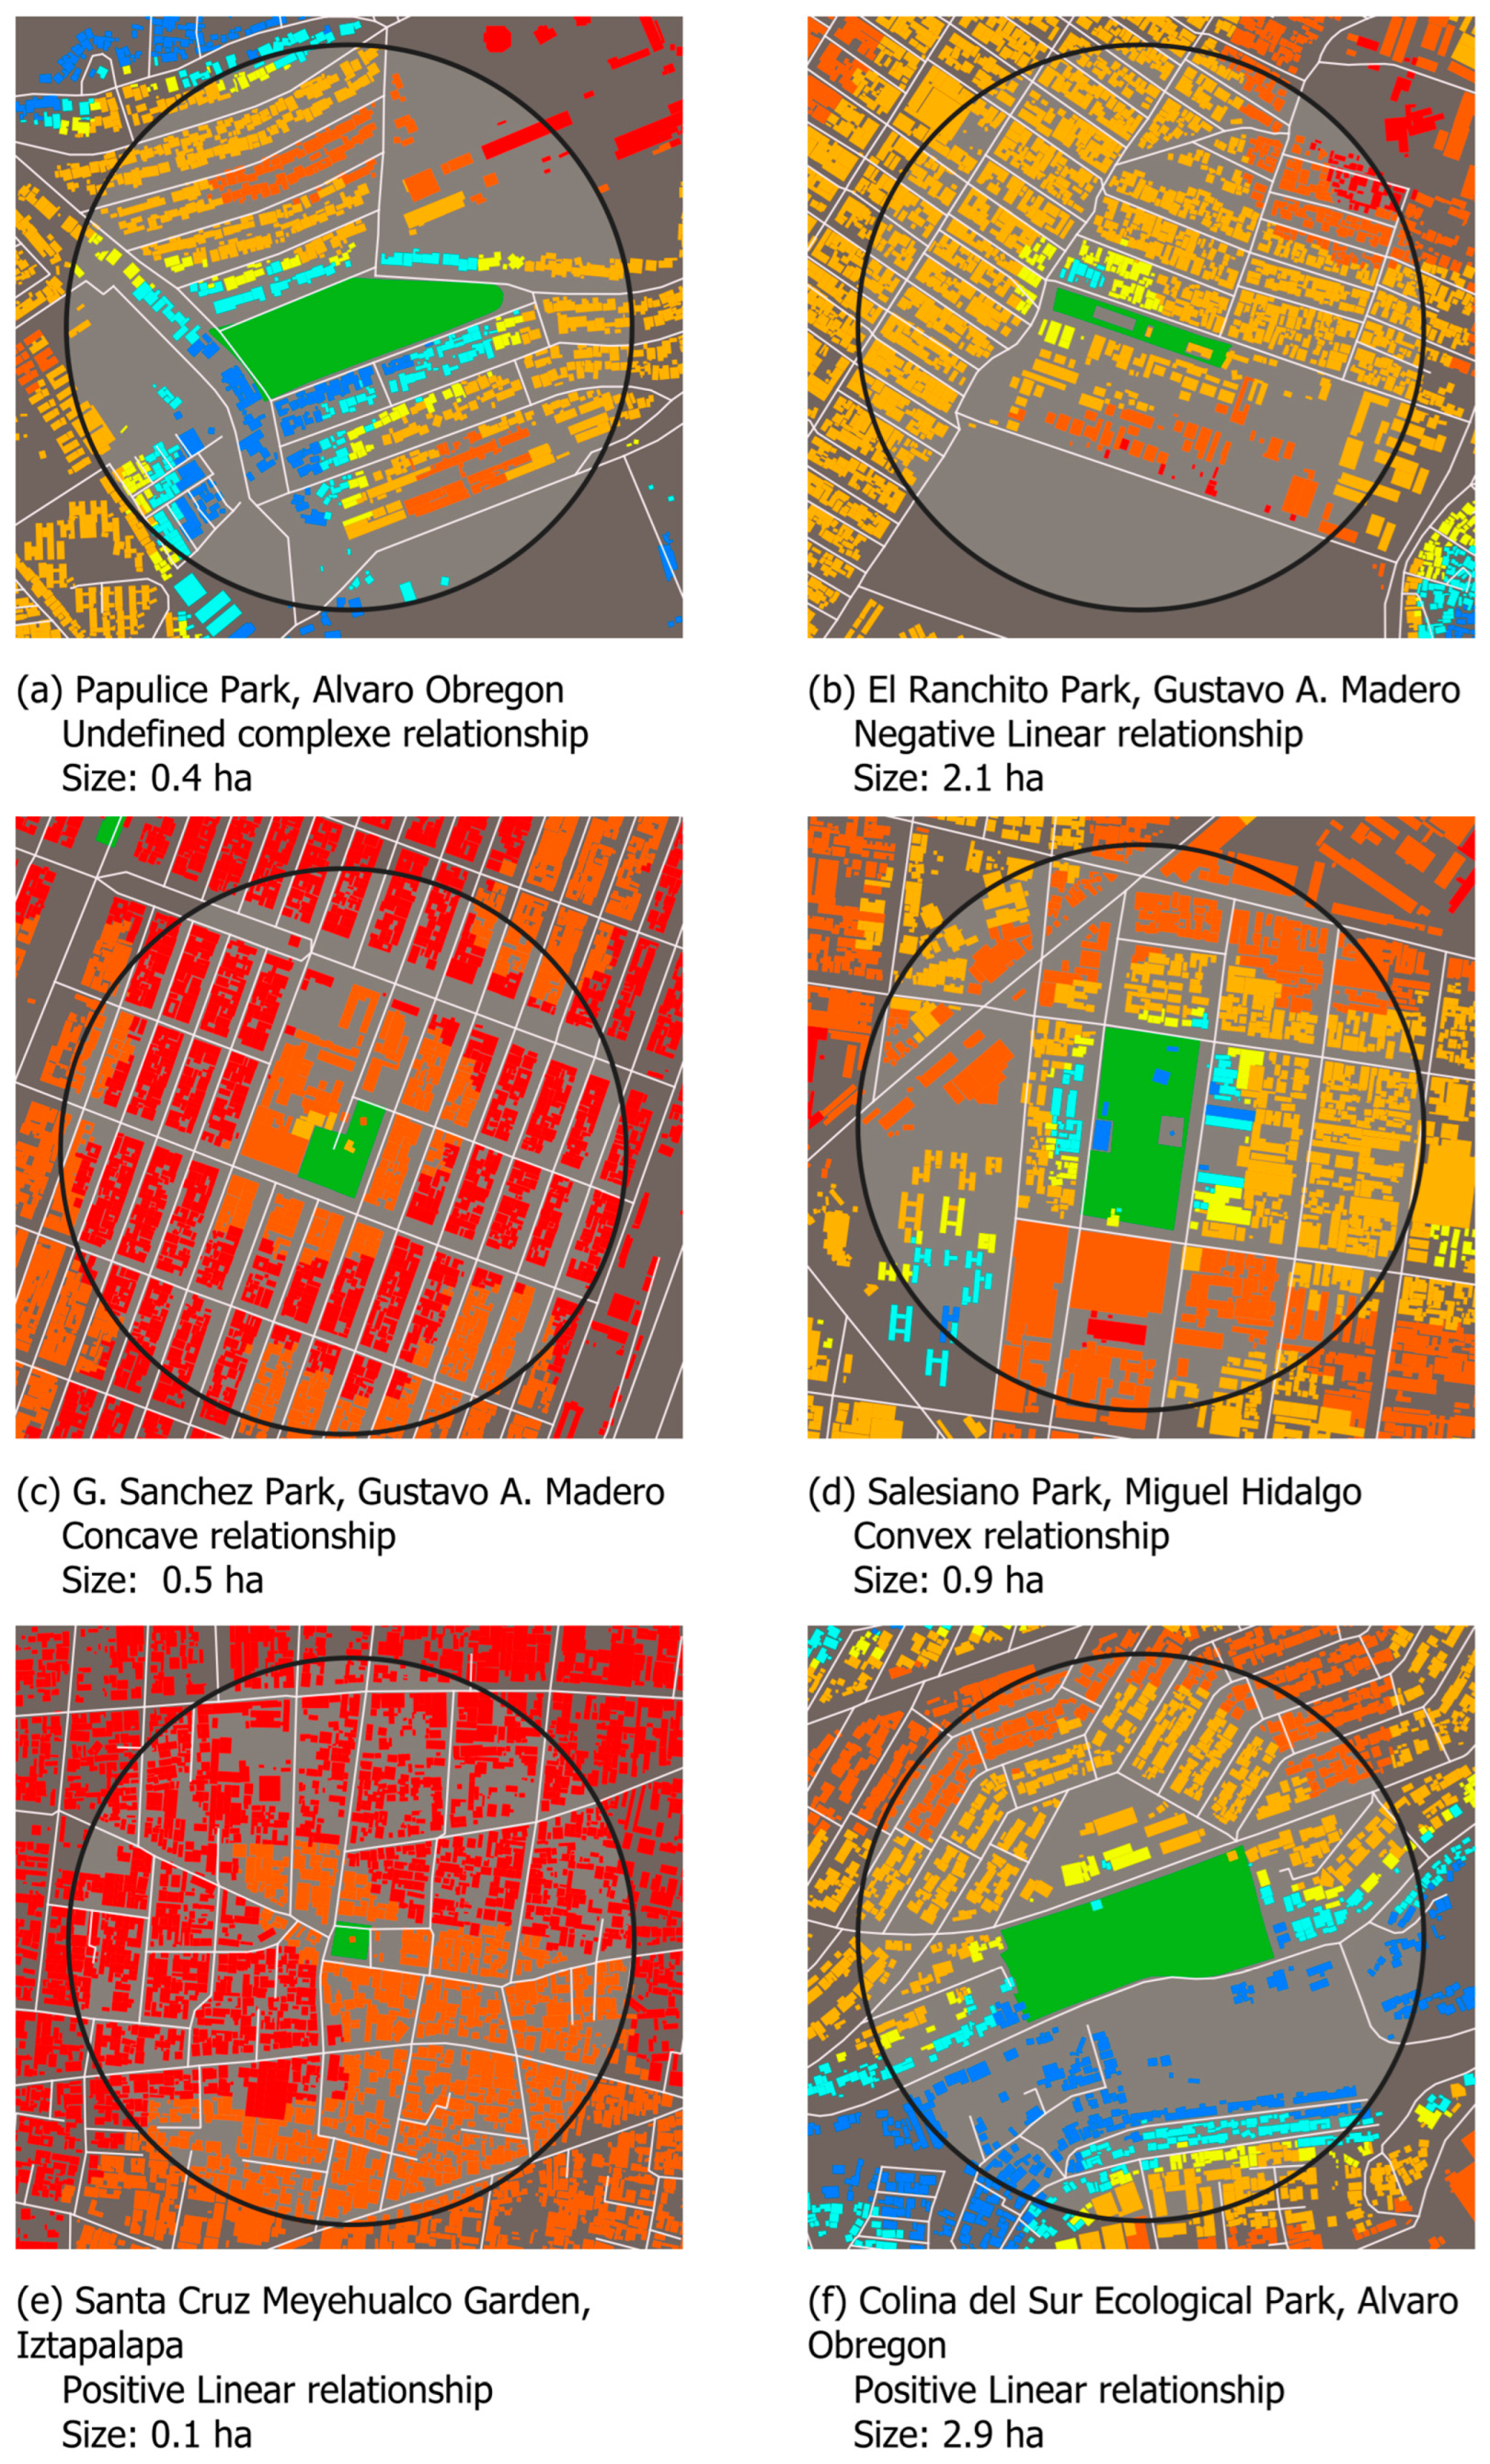
To understand the relationship between the CEUP and the surface of urban parks in Mexico City, an analysis of local bivariate relationships was conducted within an area of influence of 300 m around parks. Of the total of 1762 observations, 80.4% were statistically significant, varying considerably throughout the geographic space of the city. Five different types of significant relationships emerged in the analysis, including positive linear, negative linear, concave, convex, and complex indefinite relationships. Within the five types of correlations identified, there is a predominance in terms of size of complex indefinite relationships, which account for 30.1%. This means that there is a greater tendency towards complex relationships in terms of the relationship between the cooling effect in the surroundings of urban parks (Figure 5).
The undefined complex relationship is mainly observed in the central-western boroughs of Mexico City, primarily in the central municipalities of Benito Juárez, Cuauhtémoc, Azcapotzalco and Coyoacán, as well as the upper areas of the Miguel Hidalgo, Cuajimalpa, Álvaro Obregón, and Magdalena Contreras boroughs. This situation can also be seen in the Sierra de Santa Catarina south of the borough of Iztapalapa and north of the borough of Tláhuac, as well as the upper parts of Xochimilco and Milpa Alta.
In addition, observing the two types of linear relationships shows that there is a greater proportion of negative linear relationships with 17.3%, indicating that in the areas of influence analyzed, the greater the surface area of urban parks, the lower the temperature of the buildings within them. The negative linear relationship is mainly observed along a north–south axis that divides Mexico City into two. This relationship is present on the borders between the boroughs of Coyoacán, Xochimilco and Iztapalapa, as well as those between Gustavo A. Madero and Azcapotzalco. This relationship is also present in the borough of Venustiano Carranza, and, to a lesser extent, in those of Cuauhtémoc and Benito Juárez. Regarding this relationship, in theory it should be the predominant function in urban parks since vegetation tends to be an environmental cooling factor. However, in these areas, it is possible to observe a negative linear relationship, uniformly distributed with a clearly identifiable pattern.
The third function that is most important in the study area is the concave relationship with 16.6%, present in the eastern municipalities of Mexico City, mainly in the boroughs of Iztapalapa and Iztacalco, as well as on the borders between the boroughs of Gustavo A. Madero and Venustiano Carranza. The correlation that occurs in a concave function means, in this case, that temperature responds in a concave way in terms of its relationship with the area of the urban park. In other words, it increases in a non-linear way as the surface increases. There is a certain point on that curve in which the existing relationship is inverted and the temperature begins to decrease depending on the increase in the area of the park.
The next most predominant type of relationship in the territory is the convex relationship, with 10%. In other words, temperature decreases in a non-linear way as the area of the urban parks increases, up to a point where this function is inverted and begins to act in the opposite way. This type of relationship occurs mainly in the central borough of Coyoacán, continuing towards the boroughs of Alvaro Obregón and Tlalpan, as well as Cuauhtemoc and a small portion adjacent to Miguel Hidalgo.
Finally, the linear positive relationship is just 6.4%, meaning that in this case, temperature increases as the area of the park increases. This type of function may be due more to factors such as the percentage and type of vegetation present in these areas, such as bare soils or species that tend to dry the soil or species that accumulate temperature during the day yet tend to cool at night. This type of relationship is exclusively present in Iztapalapa, Tláhuac and a small portion of Milpa Alta. An example of each of the different types of relationship is presented below (Figure 6).
The results of tests of local spatial relationships suggest that all relationships between the value of the urban heat island intensity within a 300 m radius and the area of urban parks vary considerably across the geographic space of Mexico City. In the analysis, the different types of relationships, including positive linear, concave, convex, undefined complex, and non-significant relationships, show entropy values, which measure the amount of uncertainty in the variable, as well as relevant p values (Table 2).
In general, the less predictable the variable, the greater the entropy. This relationship is therefore observed in non-linear groups. The reason for nonlinearity requires further research, which is beyond the scope of this study. Overall, the results obtained show that the way the size of urban parks is related to surface temperature does not occur randomly in space and instead presents a series of clearly defined spatial patterns.

4. Discussion

4.1. Relevance and Context of the Study

Urban heat islands represent a localized climatic phenomenon in urban areas, characterized by higher temperatures in urban environments compared to their surrounding natural environments, also known as microclimates. This thermal increase is attributed to the accumulation of heat in urban structures, construction materials and anthropogenic activities that generate heat, such as energy consumption, in a context of high air temperatures. All this accumulated heat is slowly released at night, which means that there is no self-regulation of temperature. This problem increases in the summer when solar radiation is greater and therefore more heat accumulates [52].
Green spaces, such as parks and gardens, can help reduce temperatures in urban areas by providing shade and releasing moisture into the air through a process called transpiration, effectively cooling the environment. Cities, centers of demographic growth and economic activity, face significant challenges in maintaining habitable, sustainable environments, with efforts being made to demonstrate how this impacts people’s health and sleep and the productivity of the population. Identifying and adopting strategies to achieve greater resilience to climate change in cities are essential to counteract the adverse effects of this phenomenon. Urban resilience to heat islands has become a critical aspect in the context of climate change [53].
Implementing green infrastructure solutions can be a key measure to mitigate heat islands [54]. These interventions not only promote heat absorption but also contribute to improving air quality and providing recreational spaces for the population. Selecting urban materials with reflective properties and promoting architectural designs that foster natural ventilation are essential elements for reducing heat accumulation in urban environments [55].
The analysis in Mexico City identified significant temperature differences, with some urban areas showing increases of over 3 °C. These results underline the severity of UHII in densely urbanized areas. Better thermal comfort was observed in areas with the presence of vegetation, although a more in-depth analysis is required to evaluate the effectiveness of different types of green infrastructure. Future research should conduct detailed analyses of how various green infrastructures can mitigate UHI. This study highlights the importance of incorporating green infrastructure considerations into urban planning and architectural design to combat UHI. Although the implementation of parks and gardens can moderate urban temperatures, more research is required to confirm these benefits and provide clear guidelines on the most effective design practices.

4.2. Cooling Effects Dynamics in the Context of the Study

The authors of this article undertook a detailed scale analysis to quantify surface temperature changes induced by urban parks. The analysis uses the Local Bivariate Relationships tool in ArcGIS Pro to find patterns linking the cooling effect of urban parks. This analysis explores the complex relationship between urban green spaces and the urban heat island intensity effect, analyzing how this interaction varies across different areas of the city.
Several types of relationships between park size and temperature were identified, including linear (both positive and negative), concave and complex indefinite relationships, showing that the effect of parks on temperature is both indirect and varies across the city. The study found that urban parks in Mexico City have a cooling effect on surrounding areas, with a significant relationship existing between the size of green spaces and lower temperatures in nearby environments. This relationship has already been documented in a number of articles [18].
The most common relationship observed was complex and indefinite, particularly in the central-western neighborhoods of Mexico City, suggesting that the cooling effect of urban parks is influenced by various factors and does not follow a simple pattern. This suggests a non-linear relationship between the size of parks and their cooling effects. In these cases, various authors point out that the factors that could influence how much a park can lower temperatures depend on the type of vegetation, soil conditions present, and other design elements [16,56,57].
The second most important relationship found that urban parks located along the south–north axis of Mexico City tend to lower the temperature of nearby buildings, showing a negative linear relationship between park size and temperature. This means that these types of traditional urban city parks can help cool urban areas more effectively. A concave relationship was also observed in certain areas, suggesting that the cooling effect of parks increases with park size up to a certain point, after which the effect stabilizes or can even be reversed. Finally, convex and positive linear relationships presented the lowest proportion of occurrence, meaning that in some cases, temperatures increased with the size of the park or up to a certain threshold, possibly due to the type of vegetation or soil conditions present. This may mean that large parks do not necessarily have advantages over small ones in regard to the efficiency of cooling the surrounding environment [58].
The fact that larger parks do not always cool the surrounding area more effectively than smaller parks shows that the relationship between park size and its cooling effect is not simple and varies depending on other factors that should be incorporated into future studies. Specifically, this study focuses on the surface of green spaces without considering other important factors of urban park design such as vegetation type, species diversity, and percentage of green cover, which could also significantly impact the cooling effect of urban parks [59]. Although the implementation of urban parks can moderate urban temperatures, more research is required to confirm these benefits and provide clear guidelines on the most effective urban design practices.

4.3. Methodological Limitations of the Study

Local entropy mapping is a novel method enabling one to understand the complex relationship of the cooling effect of urban parks on their immediate environment by analyzing how the interaction between green spaces and temperature varies in different parts of a city. The findings highlight the importance of not only increasing the amount of green spaces but also of considering the urban context in which they are inserted. Future research should address these limitations by expanding the scope of the data collected to include a broader range of variables associated with green spaces. This would include the analysis of vegetation density, species diversity, and the quality of green infrastructure. It would also be beneficial to incorporate methods that allow a more accurate assessment of the direct impact of types of vegetation and green space configurations on surface and atmospheric temperature. Finally, to assess the cooling effect of urban parks in built-up areas, you need to look at the effects on air temperature and not only on surface temperatures because the air temperature is determining the cooling in the built-up environment [60].
Recognizing these methodological limitations is crucial to interpreting study results and planning future research. Improving the accuracy and scope of studies on green infrastructure and its cooling effects will help optimize urban design strategies and promote more sustainable, livable urban environments.

5. Conclusions

This article applies a method known as local entropy mapping to analyze how the relationship between variables linked to green spaces and urban heat can change across geographical areas, providing a more detailed understanding of the effects of urban heat islands. The study uses high-resolution geospatial inputs, satellite imagery and meteorological data to assess the CEUP during a heat wave in Mexico City, providing a practical approach for measuring the intensity of the urban heat island effect and cooling impact of urban parks.
The results shed light on the cooling effect of urban parks in Mexico City, enabling one to understand how green spaces can reduce urban heat and improve thermal comfort in urban environments. This article highlights the importance of the spatial distribution of urban green spaces in reducing the urban heat island effect, suggesting a proposal for cities to know where to incorporate more parks and green spaces to cool urban areas and improve the well-being of residents.
The method used made it possible to evaluate the cooling effects of urban parks more accurately, providing a new tool for urban environmental planning and management.
The findings highlight the variability of cooling effects in urban parks, demonstrating that not all green spaces contribute equally to heat mitigation, which could be used as part of a larger effort to ensure more effective and targeted urban landscaping in the city. The study observes how urban parks of similar size can have differentiated effects on the patterns of the cooling effect, which implies, for example, considering the complexity of the city in terms of topographic relief, urban density, as well as the economic activity of the city. Finally, the results can help decision-makers understand the importance of having a better spatial distribution of parks and green spaces to make cities more comfortable to live in and help combat the heat.

Author Contributions

Conceptualization, J.M.N.; methodology, J.M.N. and A.S.; software, J.M.N. and A.S.; validation, J.M.N. and D.A.P.-D.L.M.; formal analysis, J.M.N., A.S. and L.A.; research, J.M.N., A.S. and L.A.; resources, J.M.N. and L.A.; data curation, L.A.; writing—original draft preparation, J.M.N., A.S. and L.A.; writing—review and editing, D.A.P.-D.L.M.; visualization, L.A.; supervision, J.M.N. and D.A.P.-D.L.M.; project administration, J.M.N.; funding acquisition, D.A.P.-D.L.M. All authors have read and agreed to the published version of the manuscript.

Funding

This research was supported by the Universidad Iberoamericana Mexico City campus and the APC was funded by the Universidad Iberoamericana (2024).

Data Availability Statement

The original contributions presented in the study are included in the article, further inquiries can be directed to the corresponding author.

Acknowledgments

The authors would like to thank the Universidad Iberoamericana, Mexico City campus, for funding the publication of this study. We are also grateful to Gabriela Quiroz Cázares, CentroGeo academic, for preparing the cartographic design.

Conflicts of Interest

The authors declare no conflicts of interest.

References

  1. IPCC. Summary for Policymakers. In Climate Change 2023: Synthesis Report. Contribution of Working Groups I, II and III to the Sixth Assessment Report of the Intergovernmental Panel on Climate Change; Core Writing Team, Lee, H., Romero, J., Eds.; IPCC: Geneva, Switzerland, 2023; pp. 1–34. [Google Scholar]
  2. Taha, H.; Akbari, H. Residential cooling loads and the urban heat island—The effects of albedo. Build. Environ. 1988, 23, 271–283. [Google Scholar] [CrossRef]
  3. He, B.J. Towards the next generation of green building for urban heat island mitigation: Zero UHI impact building. Sustain. Cities Soc. 2019, 50, 101647. [Google Scholar] [CrossRef]
  4. Kraemer, R.; Kabisch, N. Parks under stress: Air temperature regulation of urban green spaces under conditions of drought and summer heat. Front. Environ. Sci. 2022, 10, 318. [Google Scholar] [CrossRef]
  5. Wolch, J.R.; Byrne, J.; Newell, J.P. Urban green space, public health, and environmental justice: The challenge of making cities ‘just green enough’. Landsc. Urban Plan. 2014, 125, 234–244. [Google Scholar] [CrossRef]
  6. Aflaki, A.; Mirnezhad, M.; Ghaffarianhoseini, A.; Ghaffarianhoseini, A.; Omrany, H.; Wang, Z.H.; Akbari, H. Urban heat island mitigation strategies: A state-of-the-art review on Kuala Lumpur, Singapore and Hong Kong. Cities 2017, 62, 131–145. [Google Scholar] [CrossRef]
  7. Knight, T.; Price, S.; Bowler, D.; Hookway, A.; King, S.; Konno, K.; Richter, R.L. How effective is ‘greening’ of urban areas in reducing human exposure to ground-level ozone concentrations, UV exposure and the ‘urban heat island effect’? An updated systematic review. Environ. Evid. 2021, 10, 1–38. [Google Scholar] [CrossRef]
  8. Aram, F.; García, E.H.; Solgi, E.; Mansournia, S. Urban green space cooling effect in cities. Heliyon 2019, 5, 1–31. [Google Scholar] [CrossRef]
  9. Rajagopal, P.; Priya, R.S.; Senthil, R. A review of recent developments in the impact of environmental measures on urban heat island. Sustain. Cities Soc. 2023, 88, 104279. [Google Scholar] [CrossRef]
  10. Jabbar, H.K.; Hamoodi, M.N.; Al-Hameedawi, A.N. Urban heat islands: A review of contributing factors, effects and data. In IOP Conference Series: Earth and Environmental Science; IOP Publishing: Bristol, UK, 2023; Volume 1129, p. 012038. [Google Scholar]
  11. Ren, J.; Shi, K.; Li, Z.; Kong, X.; Zhou, H. A Review on the Impacts of Urban Heat Islands on Outdoor Thermal Comfort. Buildings 2023, 13, 1368. [Google Scholar] [CrossRef]
  12. Liu, Y.; Xu, X.; Wang, F.; Qiao, Z.; An, H.; Han, D.; Luo, J. Exploring the cooling effect of urban parks based on the ECOSTRESS land surface temperature. Front. Ecol. Evol. 2022, 10, 1031517. [Google Scholar] [CrossRef]
  13. Wang, J.; Wei, L.; Gao, G.; Zhu, J.; Su, X.; Sun, L. Comprehensive investigation of pharmacodynamic material basis of Wikstroemia indica (L.) C.A. Mey. by serum pharmacochemistry and bivariate correlation analysis. J. Chromatogr. B Analyt. Technol. Biomed. Life Sci. 2021, 1179, 122770. [Google Scholar] [CrossRef] [PubMed]
  14. Huang, R.; Yang, M.; Lin, G.; Ma, X.; Wang, X.; Huang, Q.; Zhang, T. Cooling Effect of Green Space and Water on Urban Heat Island and the Perception of Residents: A Case Study of Xi’an City. Int. J. Environ. Res. Public Health 2022, 19, 14880. [Google Scholar] [CrossRef] [PubMed]
  15. Du, H.; Wang, D.; Wang, Y.; Zhao, X.; Qin, F.; Jiang, H.; Cai, Y. Influences of land cover types, meteorological conditions, anthropogenic heat and urban area on surface urban heat island in the Yangtze River Delta Urban Agglomeration. Sci. Total Environ. 2016, 571, 461–470. [Google Scholar] [CrossRef] [PubMed]
  16. Yang, G.; Yu, Z.; Jørgensen, G.; Vejre, H. How can urban blue-green space be planned for climate adaption in high-latitude cities? A seasonal perspective. Sustain. Cities Soc. 2020, 53, 101932. [Google Scholar] [CrossRef]
  17. Almeida, C.R.D.; Teodoro, A.C.; Gonçalves, A. Study of the urban heat island (UHI) using remote sensing data/techniques: A systematic review. Environments 2021, 8, 105. [Google Scholar] [CrossRef]
  18. Yu, Z.; Yang, G.; Zuo, S.; Jørgensen, G.; Koga, M.; Vejre, H. Critical review on the cooling effect of urban blue-green space: A threshold-size perspective. Urban For. Urban Green. 2020, 49, 126630. [Google Scholar] [CrossRef]
  19. Yang, P.; Xiao, Z.N.; Ye, M.S. Cooling effect of urban parks and their relationship with urban heat islands. Atmos. Ocean. Sci. Lett. 2016, 9, 298–305. [Google Scholar] [CrossRef]
  20. Das, M.; Das, A.; Momin, S. Quantifying the cooling effect of urban green space: A case from urban parks in a tropical mega metropolitan area (India). Sustain. Cities Soc. 2022, 87, 104062. [Google Scholar] [CrossRef]
  21. Qiu, X.; Kil, S.H.; Jo, H.K.; Park, C.; Song, W.; Choi, Y.E. Cooling Effect of Urban Blue and Green Spaces: A Case Study of Changsha, China. Int. J. Environ. Res. Public Health 2023, 20, 2613. [Google Scholar] [CrossRef]
  22. Feng, X.; Yu, J.; Xin, C.; Ye, T.; Wang, T.A.; Chen, H.; Zhang, L. Quantifying and Comparing the Cooling Effects of Three Different Morphologies of Urban Parks in Chengdu. Land 2023, 12, 451. [Google Scholar] [CrossRef]
  23. Han, D.; Yang, X.; Cai, H.; Xu, X. Impacts of neighboring buildings on the cold island effect of central parks: A case study of Beijing, China. Sustainability 2020, 12, 9499. [Google Scholar] [CrossRef]
  24. Gao, Z.; Zaitchik, B.F.; Hou, Y.; Chen, W. Toward park design optimization to mitigate the urban heat Island: Assessment of the cooling effect in five US cities. Sustain. Cities Soc. 2022, 81, 103870. [Google Scholar] [CrossRef]
  25. Feng, X.; Myint, S.W. Exploring the effect of neighboring land cover pattern on land surface temperature of central building objects. Build. Environ. 2016, 95, 346–354. [Google Scholar] [CrossRef]
  26. Lin, P.; Song, D.; Qin, H. Impact of parking and greening design strategies on summertime outdoor thermal condition in old mid-rise residential estates. Urban For. Urban Green. 2021, 63, 127200. [Google Scholar] [CrossRef]
  27. CONAGUA (Comisión Nacional del Agua). Reporte del clima en México. Coordinación General del Servicio Meteorológico Nacional. Año 13, Número 6. 2023. Available online: https://smn.conagua.gob.mx/tools/DATA/Climatología/Diagnóstico%20Atmosférico/Reporte%20del%20Clima%20en%20México/RC-Junio23.pdf (accessed on 30 April 2023).
  28. SEDEMA (Secretariat of Environment of Mexico City). “Inventory of Green spaces”. Mexico City, Secretariat of Environment of Mexico City. 2020. Available online: https://sedema.cdmx.gob.mx/programas/programa/inventario-de-areas-verdes (accessed on 30 April 2023).
  29. Sirko, W.; Kashubin, S.; Ritter, M.; Annkah, A.; Bouchareb, Y.S.E.; Dauphin, Y.; Keysers, D.; Neumann, M.; Cisse, M.; Quinn, J. Continental-scale building detection from high resolution satellite imagery. arXiv 2021, arXiv:2107.12283. [Google Scholar]
  30. Núñez, J.M. Análisis espacial de las áreas verdes urbanas de la Ciudad de México. Econ. Soc. Territ. 2021, 21, 803–833. [Google Scholar]
  31. Sadeghian, M.M.; Vardanyan, Z. The benefits of urban parks, a review of urban research. J. Nov. Appl. Sci. 2013, 2, 231–237. [Google Scholar]
  32. Gonzales, J.J. Building-Level Comparison of Microsoft and Google Open Building Footprints Datasets (Short Paper). In Proceedings of the 12th International Conference on Geographic Information Science (GIScience 2023), Leeds, UK, 12–15 September 2023; Schloss-Dagstuhl-Leibniz Zentrum für Informatik: Wadern, Germany, 2023; pp. 1–35. [Google Scholar]
  33. Wen, X.; Yang, L.; Zhang, Y.; Wang, Q.; Ye, J.; McBroom, M. Analyzing temporal and spatial forest carbon storage using Google Plus Code: A case study of Zijin Mountain National Forest Park, China. Carbon Balance Manag. 2024, 19, 13. [Google Scholar] [CrossRef]
  34. Biljecki, F.; Chow, Y.S.; Lee, K. Quality of crowdsourced geospatial building information: A global assessment of OpenStreetMap attributes. Build. Environ. 2023, 237, 110295. [Google Scholar] [CrossRef]
  35. Núñez, J.M. Mapeo de la composición urbana, contraste entre dispersión y formas compactas en el sur de la Ciudad de México. In Ciudad Compacta: Del Concepto a la Práctica; Rothe, H.Q., Ed.; Universidad Nacional Autónoma de México: Mexico City, Mexico, 2015; pp. 211–225. ISBN 978-607-0271-76-2. [Google Scholar]
  36. Rasul, A.; Balzter, H.; Smith, C.; Remedios, J.; Adamu, B.; Sobrino, J.A.; Weng, Q. A review on remote sensing of urban heat and cool islands. Land 2017, 6, 38. [Google Scholar] [CrossRef]
  37. Li, Y.Y.; Zhang, H.; Kainz, W. Monitoring patterns of urban heat islands of the fast-growing Shanghai metropolis, China: Using time-series of Landsat TM/ETM+ data. Int. J. Appl. Earth Obs. Geoinf. 2012, 19, 127–138. [Google Scholar] [CrossRef]
  38. Moreira, P.; Duarte, L.; Cunha, M.; Teodoro, A.C. Modeling Spatial-Temporal Wine Yield Based on Land Surface Temperature, Vegetation Indices and GIS-The Case of the Douro Wine Region. In Proceedings of the 2021 IEEE International Geoscience and Remote Sensing Symposium (IGARSS), Brussels, Belgium, 11–16 July 2021; pp. 6431–6434. [Google Scholar] [CrossRef]
  39. Herlawati, H.; Handayanto, R.T.; Saimima, I.D.S.; Khaerudin, M.; Prayitno, M.H.; Kustanto, P.; Ismaniah, I.; Yusuf, A.Y.P.; Andrian, A. Evaluating the Effects of Mobility Restrictions during COVID-19 on Land Surface Temperature with GIS and Satellite Data. In Proceedings of the 2023 Eighth International Conference on Informatics and Computing (ICIC), Manado, Indonesia, 8–9 December 2023; pp. 1–5. [Google Scholar] [CrossRef]
  40. Barane, P.K.; Dwarakish, G.S. Development of a tool for land surface temperature retrieval from Landsat data products. In Proceedings of the Global Civil Engineering Challenges in Sustainable Development and Climate Change, Moodbidri, India, 17–18 March 2017; pp. 17–18. [Google Scholar]
  41. Peng, J.; Dan, Y.; Qiao, R.; Liu, Y.; Dong, J.; Wu, J. How to quantify the cooling effect of urban parks? Linking maximum and accumulation perspectives. Remote Sens. Environ. 2021, 252, 112135. [Google Scholar]
  42. Chen, M.; Jia, W.; Yan, L.; Du, C.; Wang, K. Quantification and mapping cooling effect and its accessibility of urban parks in an extreme heat event in a megacity. J. Clean. Prod. 2022, 334, 130252. [Google Scholar] [CrossRef]
  43. Geng, X.; Yu, Z.; Zhang, D.; Li, C.; Yuan, Y.; Wang, X. The influence of local background climate on the dominant factors and threshold-size of the cooling effect of urban parks. Sci. Total Environ. 2022, 823, 153806. [Google Scholar] [CrossRef] [PubMed]
  44. Chen, X.; Su, Y.; Li, D.; Huang, G.; Chen, W.; Chen, S. Study on the cooling effects of urban parks on surrounding environments using Landsat TM data: A case study in Guangzhou, southern China. Int. J. Remote Sens. 2012, 33, 5889–5914. [Google Scholar] [CrossRef]
  45. Irfeey, A.M.M.; Chau, H.W.; Sumaiya, M.M.F.; Wai, C.Y.; Muttil, N.; Jamei, E. Sustainable mitigation strategies for urban heat island effects in urban areas. Sustainability 2023, 15, 10767. [Google Scholar] [CrossRef]
  46. Wang, X.; Li, H.; Sodoudi, S. The effectiveness of cool and green roofs in mitigating urban heat island and improving human thermal comfort. Build. Environ. 2022, 217, 109082. [Google Scholar] [CrossRef]
  47. Zhao, J.S.; Zhang, Y. Proactive policing embedded in two models: A geospatial analysis of proactive activities by patrol officers and COP officers. J. Crim. Justice 2022, 82, 101972. [Google Scholar] [CrossRef]
  48. Schiller Pinar, I.C. Observatorio de bienestar ambiental del Área Metropolitana de Santiago para el periodo 2016-2021: En función de la temperatura y el vigor vegetacional. Bachelor’s Thesis, Universidad de Chile, Santiago, Chile, 2022. [Google Scholar]
  49. Blanco, A.J.A.; Quintana, V.M. Dependencia espacial de la tasa municipal de desempleo en Andalucía. Un análisis espacial exploratorio. Empiria Rev. Metodol. Cienc. Soc. 2021, 51, 89–124. [Google Scholar]
  50. Dai, W.; Chen, X. Entropy of function of uncertain variables. Math. Comput. Model. 2012, 55, 754–760. [Google Scholar] [CrossRef]
  51. Guo, D. Local entropy map: A nonparametric approach to detecting spatially varying multivariate relationships. Int. J. Geogr. Inf. Sci. 2010, 24, 1367–1389. [Google Scholar] [CrossRef]
  52. Heisler, G.M.; Brazel, A.J. The urban physical environment: Temperature and urban heat islands. Urban Ecosyst. Ecol. 2010, 55, 29–56. [Google Scholar]
  53. Salimi, M.; Al-Ghamdi, S.G. Climate change impacts on critical urban infrastructure and urban resiliency strategies for the Middle East. Sustain. Cities Soc. 2020, 54, 101948. [Google Scholar] [CrossRef]
  54. Marando, F.; Heris, M.P.; Zulian, G.; Udías, A.; Mentaschi, L.; Chrysoulakis, N.; Parastatidis, D.; Maes, J. Urban heat island mitigation by green infrastructure in European Functional Urban Areas. Sustain. Cities Soc. 2022, 77, 103564. [Google Scholar] [CrossRef]
  55. Lai, D.; Liu, W.; Gan, T.; Liu, K.; Chen, Q. A review of mitigating strategies to improve the thermal environment and thermal comfort in urban outdoor spaces. Sci. Total Environ. 2019, 661, 337–353. [Google Scholar] [CrossRef]
  56. Bowler, D.E.; Buyung-Ali, L.; Knight, T.M.; Pullin, A.S. Urban greening to cool towns and cities: A systematic review of the empirical evidence. Landsc. Urban Plan. 2010, 97, 147–155. [Google Scholar] [CrossRef]
  57. Monteiro, M.V.; Doick, K.J.; Handley, P.; Peace, A. The impact of greenspace size on the extent of local nocturnal air temperature cooling in London. Urban For. Urban Green. 2016, 16, 160–169. [Google Scholar] [CrossRef]
  58. Cheng, X.; Wei, B.; Chen, G.; Li, J.; Song, C. Influence of park size and its surrounding urban landscape patterns on the park cooling effect. J. Urban Plan. Dev. 2015, 141, A4014002. [Google Scholar] [CrossRef]
  59. Barradas, V.L.; Miranda, J.A.; Esperón-Rodríguez, M.; Ballinas, M. (Re) Designing Urban Parks to Maximize Urban Heat Island Mitigation by Natural Means. Forests 2022, 13, 1143. [Google Scholar] [CrossRef]
  60. Amani-Beni, M.; Zhang, B.; Xie, G.D.; Odgaard, A.J. Impacts of the microclimate of a large urban park on its surrounding built environment in the summertime. Remote Sens. 2021, 13, 4703. [Google Scholar] [CrossRef]
Figure 1. Location of Mexico City.
Land 13 01701 g001
Figure 2. Methodological proposal to assess the cooling effect of urban parks (CEUP) in the urbanized area of Mexico City.
Land 13 01701 g002
Figure 3. Methodology for calculating LST for Landsat-8 images (OLI/TIRS). Compiled by the author from [38].
Land 13 01701 g003
Figure 4. Distribution of the urban heat island intensity (UHII) in Mexico City on 16 June 2023.
Land 13 01701 g004
Figure 5. Spatial distribution of categories of analysis of bivariate local relationships for Mexico City.
Land 13 01701 g005
Figure 6. A detailed examples of local spatial relationships between CEUP as the average of the SUHII within a 300 m radius buffer zone and the surface area of urban parks in Mexico City.
Land 13 01701 g006
Table 1. Green space categories in Mexico City, Mexico (2020).
CategoryCategory KeyArea (m2)Percentage (%)Number of Records per Category
Spaces with protective features9009746.90.01%1
Spaces in protection categories5007,178,264.910.66%31
Spaces with reminiscent vegetation8001,964,258.02.92%68
Green spaces complementary to or linked to the road network2009,530,119.814.16%5776
Green spaces with urban structure100023,511.10.03%36
Fragmented urban green spaces7003,354,209.74.98%312
Urban facilities with vegetation60028,479,055.142.31%3653
Urban forestry10025,317.60.04%4
Parks, groves, and avenues40012,669,913.418.82%1538
Squares and gardens3003,649,563.55.42%315
Nursery1100427,613.90.64%5
TOTAL 67,311,573.8100.00%1173
Source: Inventario de Áreas Verdes (Green Space Inventory) [28].
Table 2. Local relationships between the cooling effect and the surface of urban parks.
CategoriesEntropyp-Value
#%Min–MaxMeanMedianMin–MaxMeanMedian
Positive Linear1126.40.329–0.6450.4580.4460.001–0.0780.0150.004
Negative Linear30517.30.333–0.5510.4010.370.001–0.0790.010.003
Concave29216.60.389–0.5590.4560.4420.001–0.0060.0010.001
Convex177100.351–0.5640.4640.4620.001–0.0760.0150.005
Undefined Complex53030.10.371–0.6450.5040.4990.001–0.0800.0140.003
Not significant34619.60.329–0.6450.4460.4320.081–0.8690.210.157
Total17621000.329–0.6450.4580.4460.001–0.8690.050.004
Disclaimer/Publisher’s Note: The statements, opinions and data contained in all publications are solely those of the individual author(s) and contributor(s) and not of MDPI and/or the editor(s). MDPI and/or the editor(s) disclaim responsibility for any injury to people or property resulting from any ideas, methods, instructions or products referred to in the content.