
Human and Natural Activities Effects on Soil Erosion in Karst Plateau Based on QAM Model: A Case Study of Bijie City, Guizhou Province, China


Abstract
:1. Introduction
2. Study Area and Methods
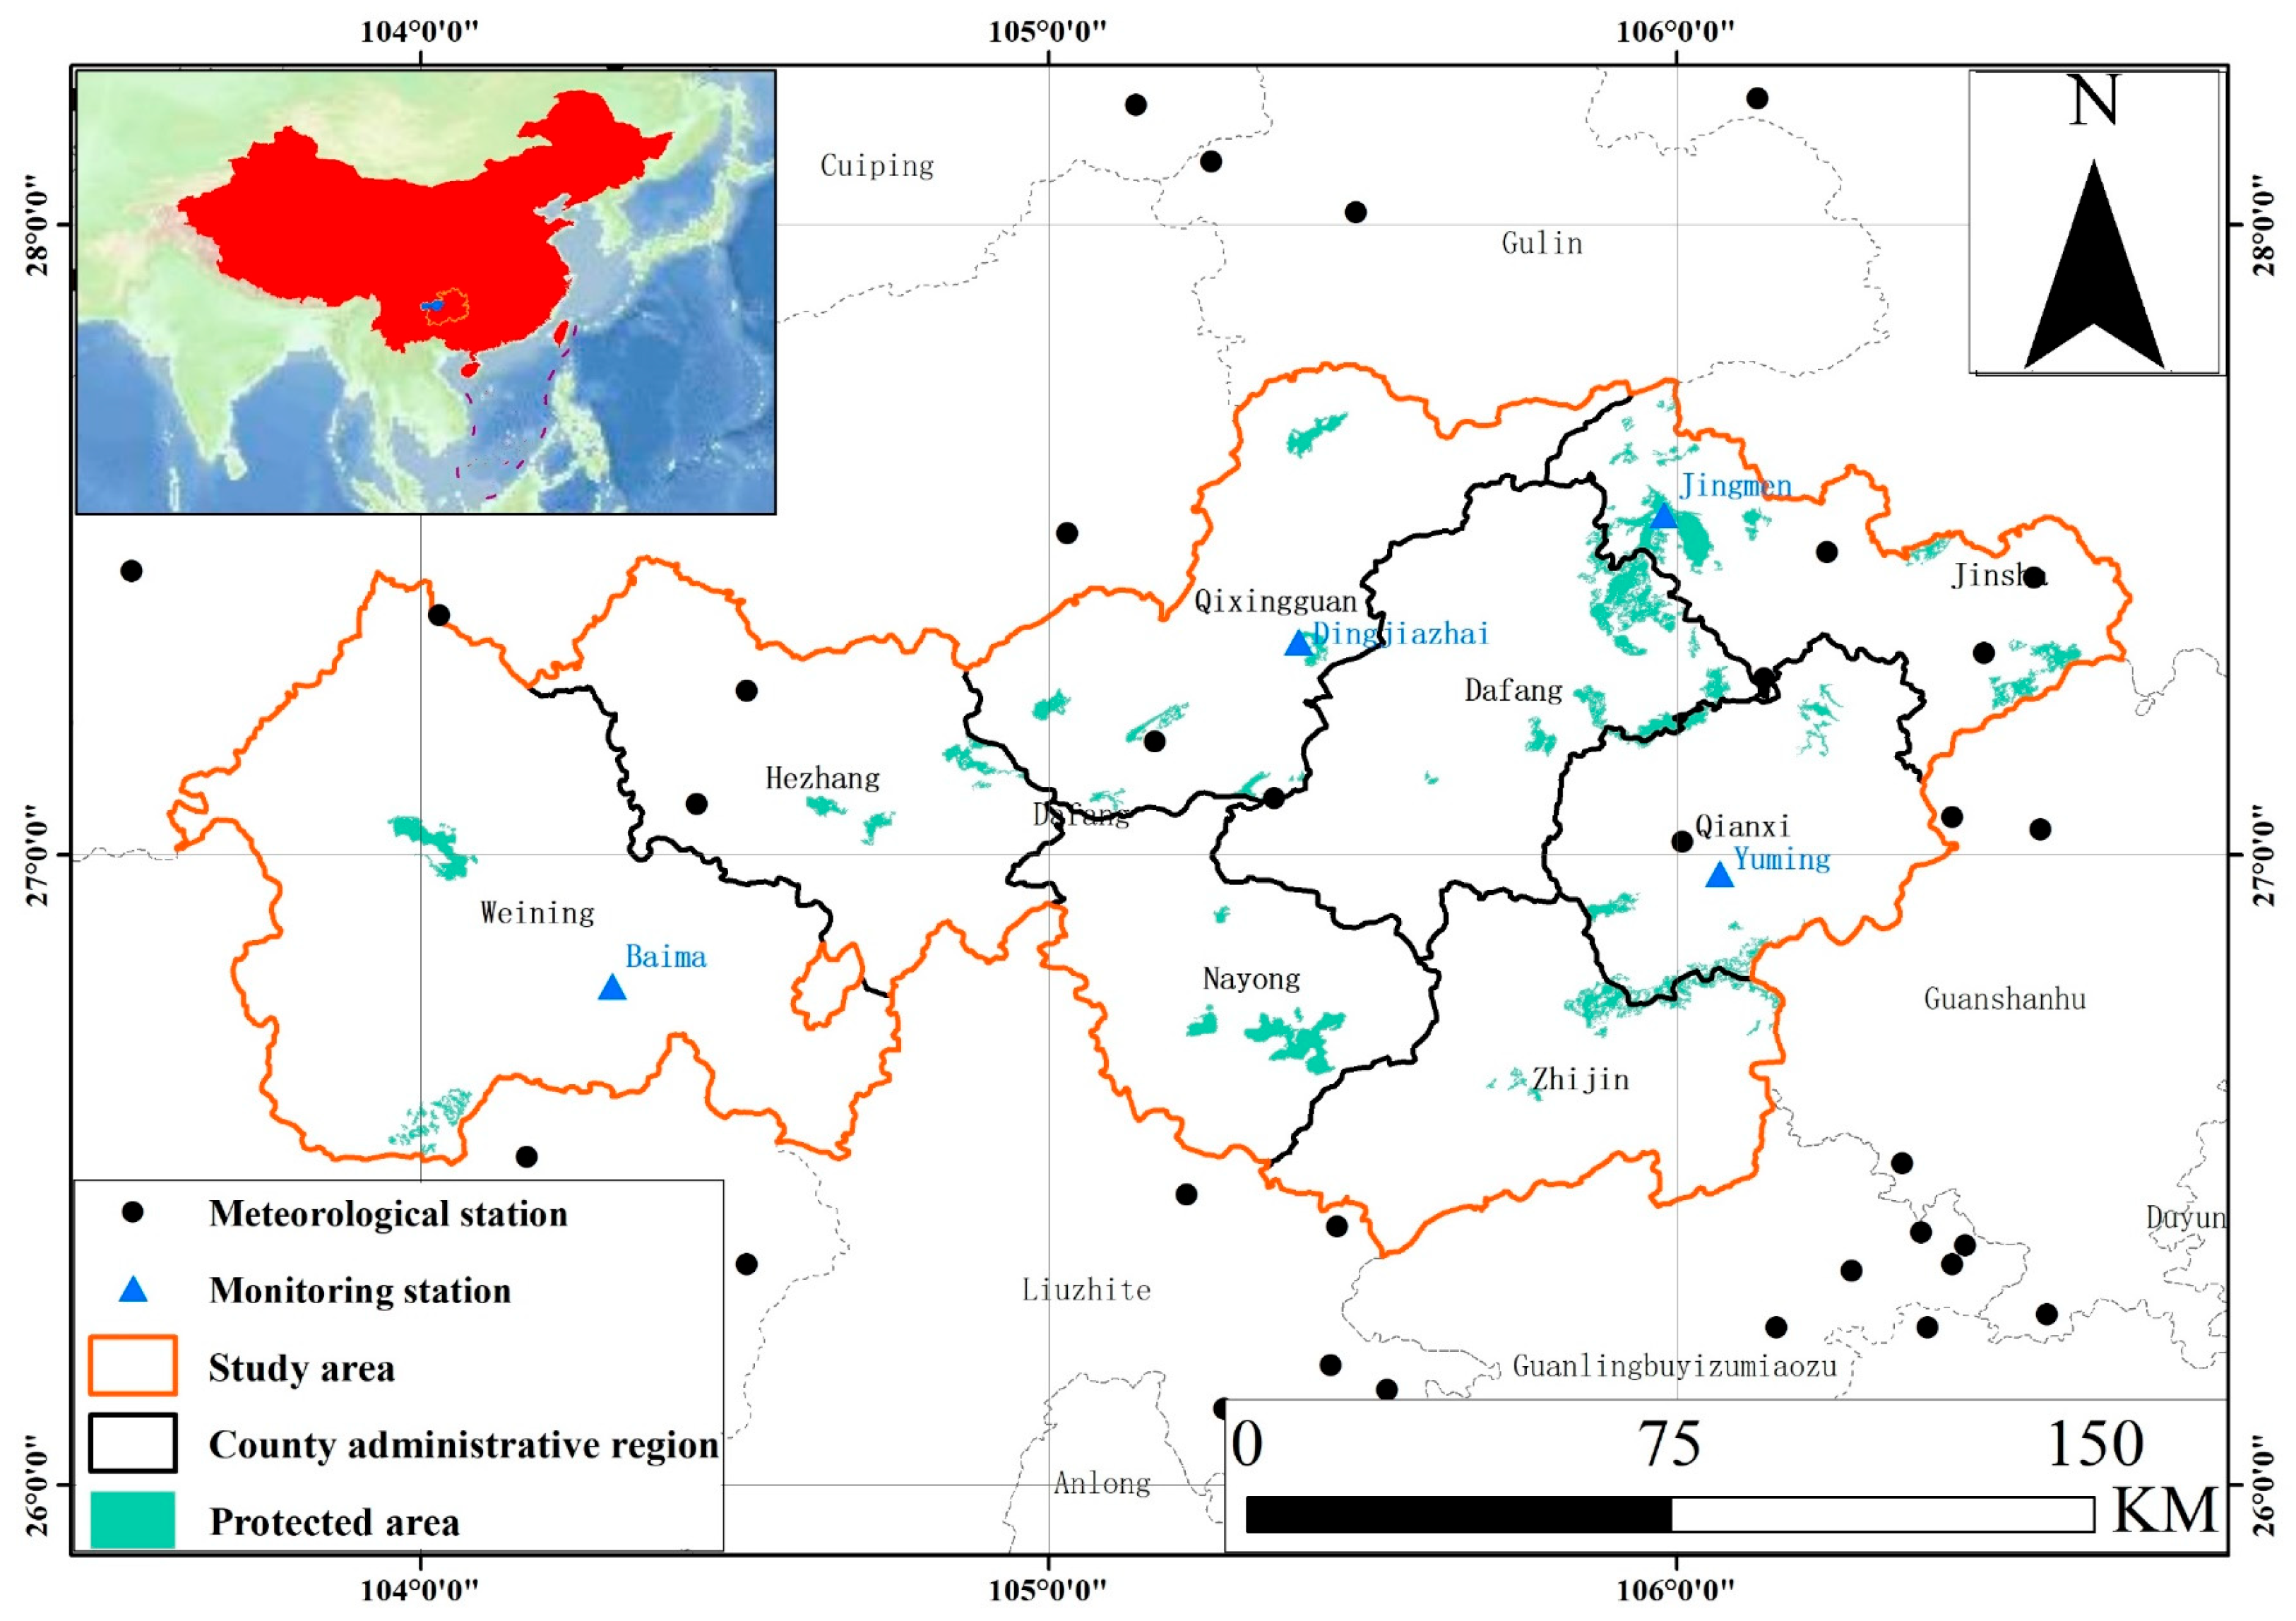
2.1. Study Area
2.2. Data Sources
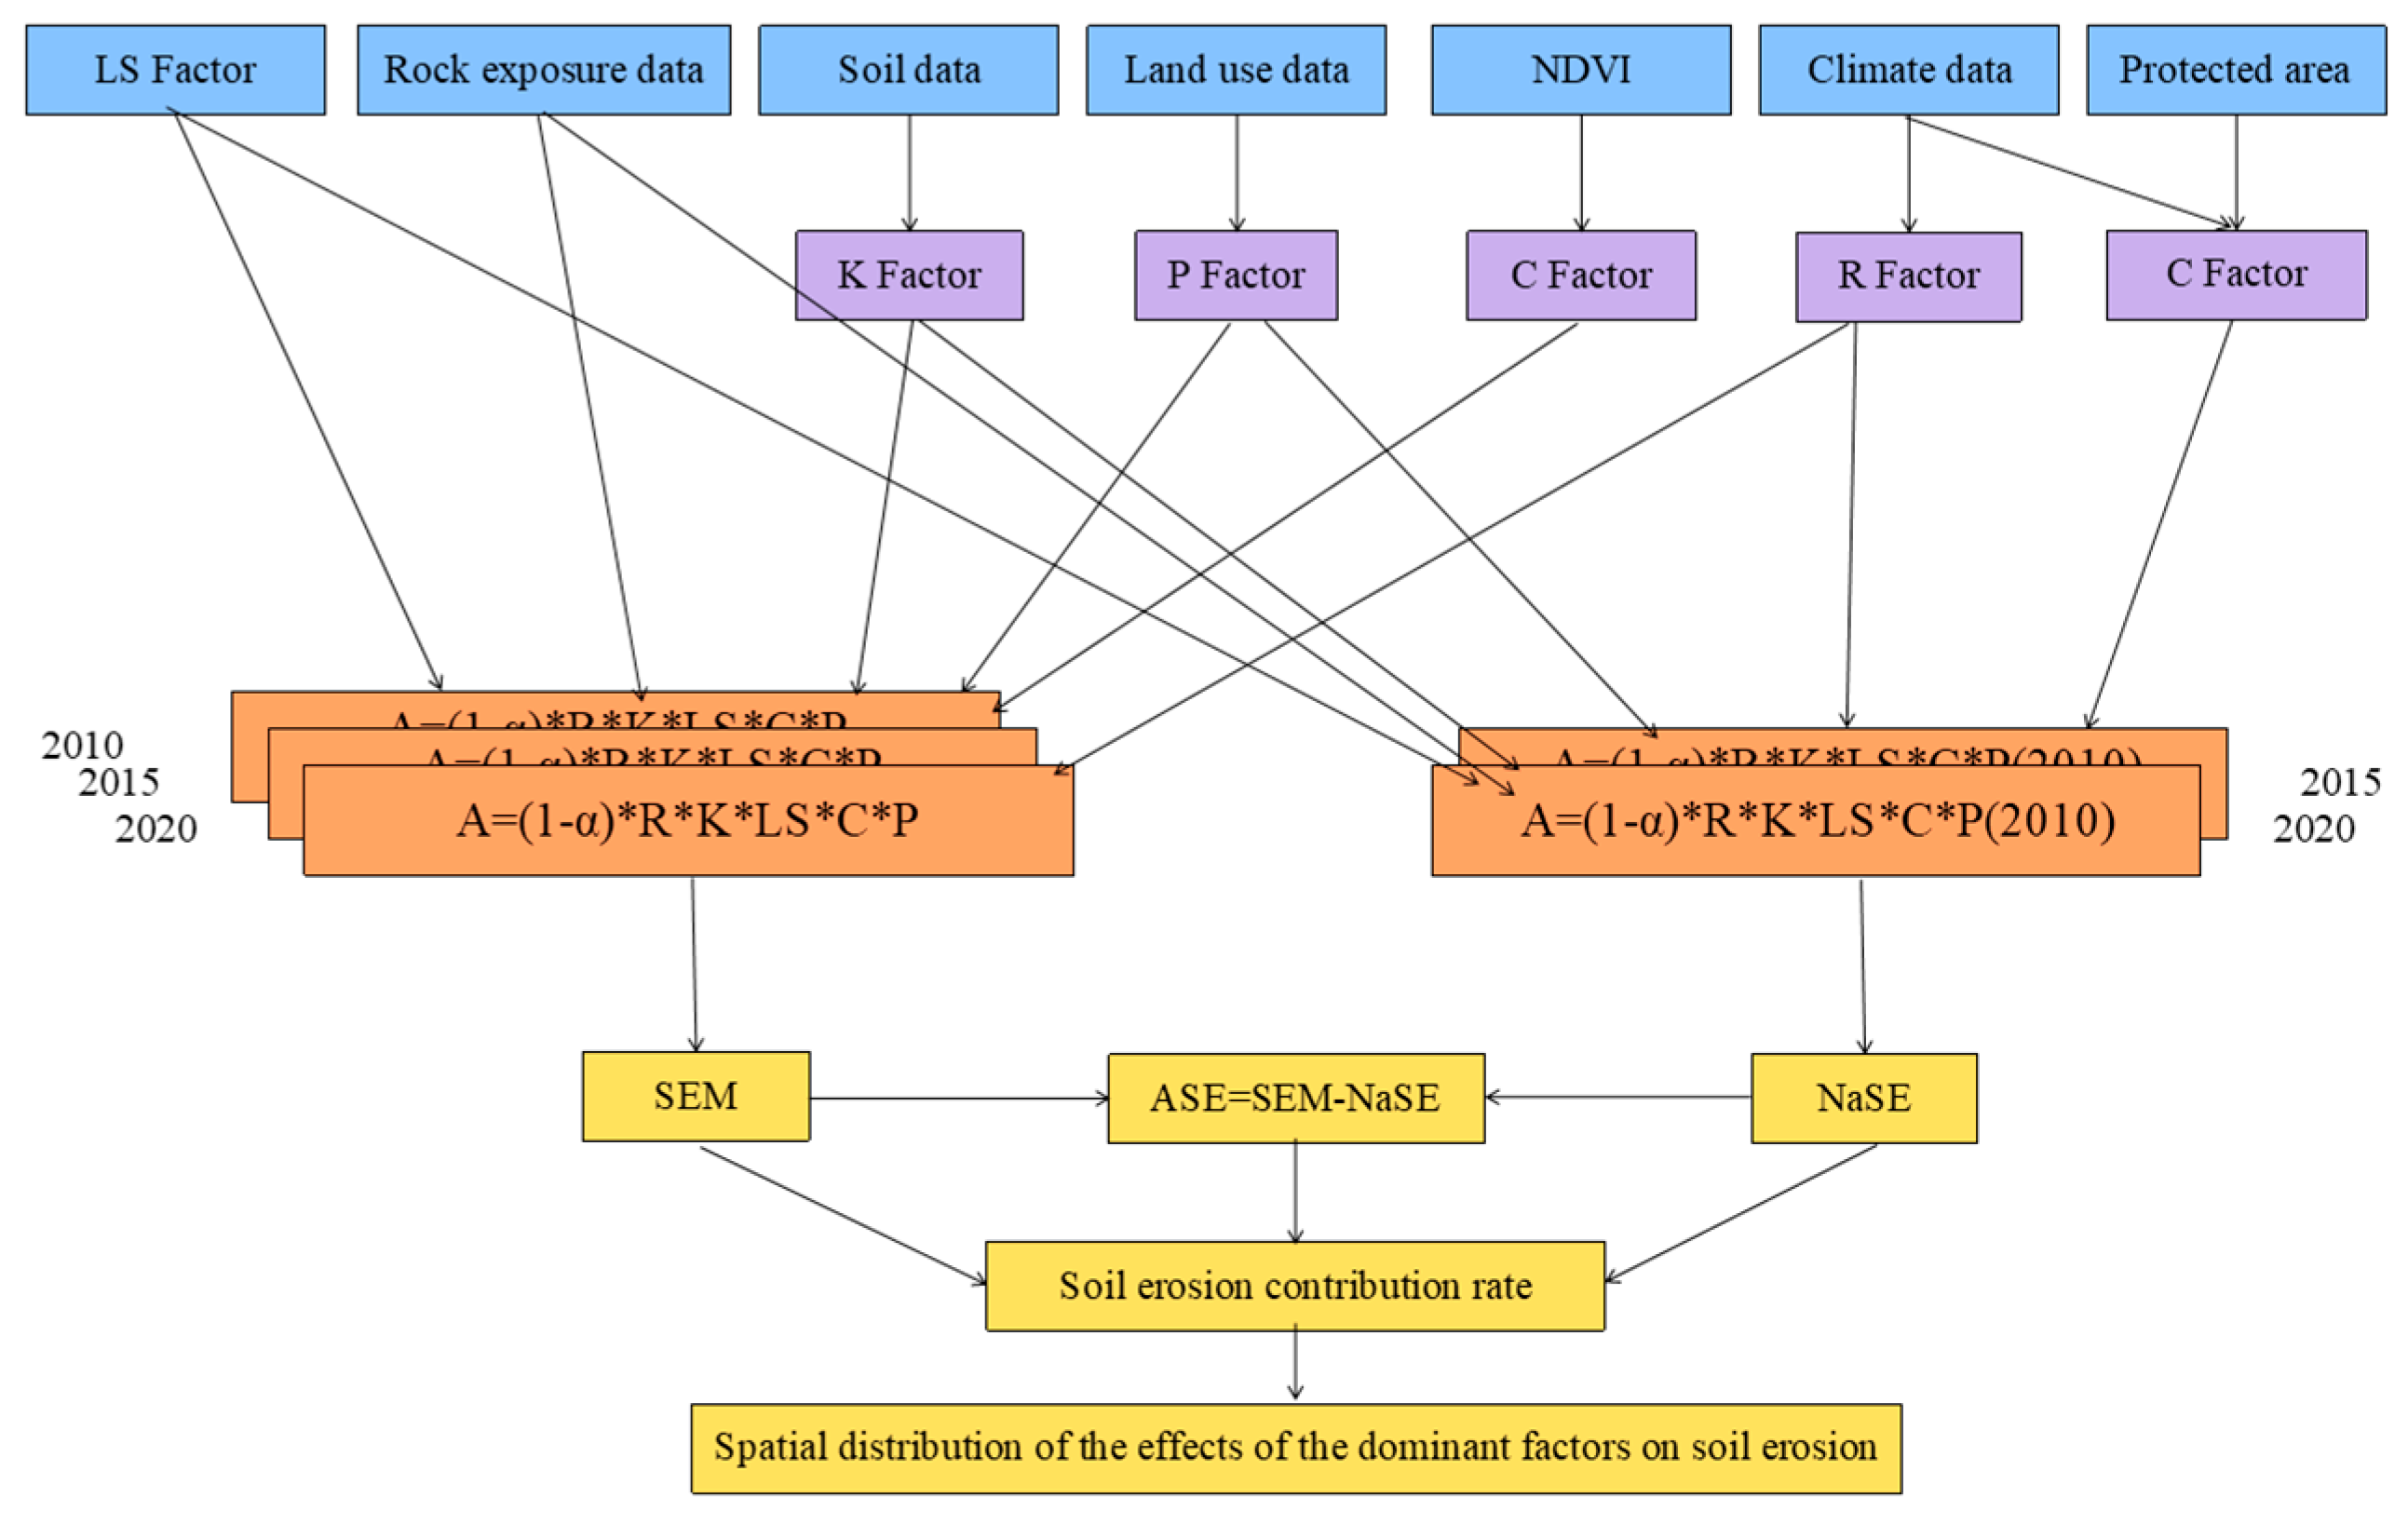
2.3. Research Methods
2.3.1. RUSEL Model
2.3.2. QAM Model
Correlation Analysis of NDVI and Temperature
Land Cover Background
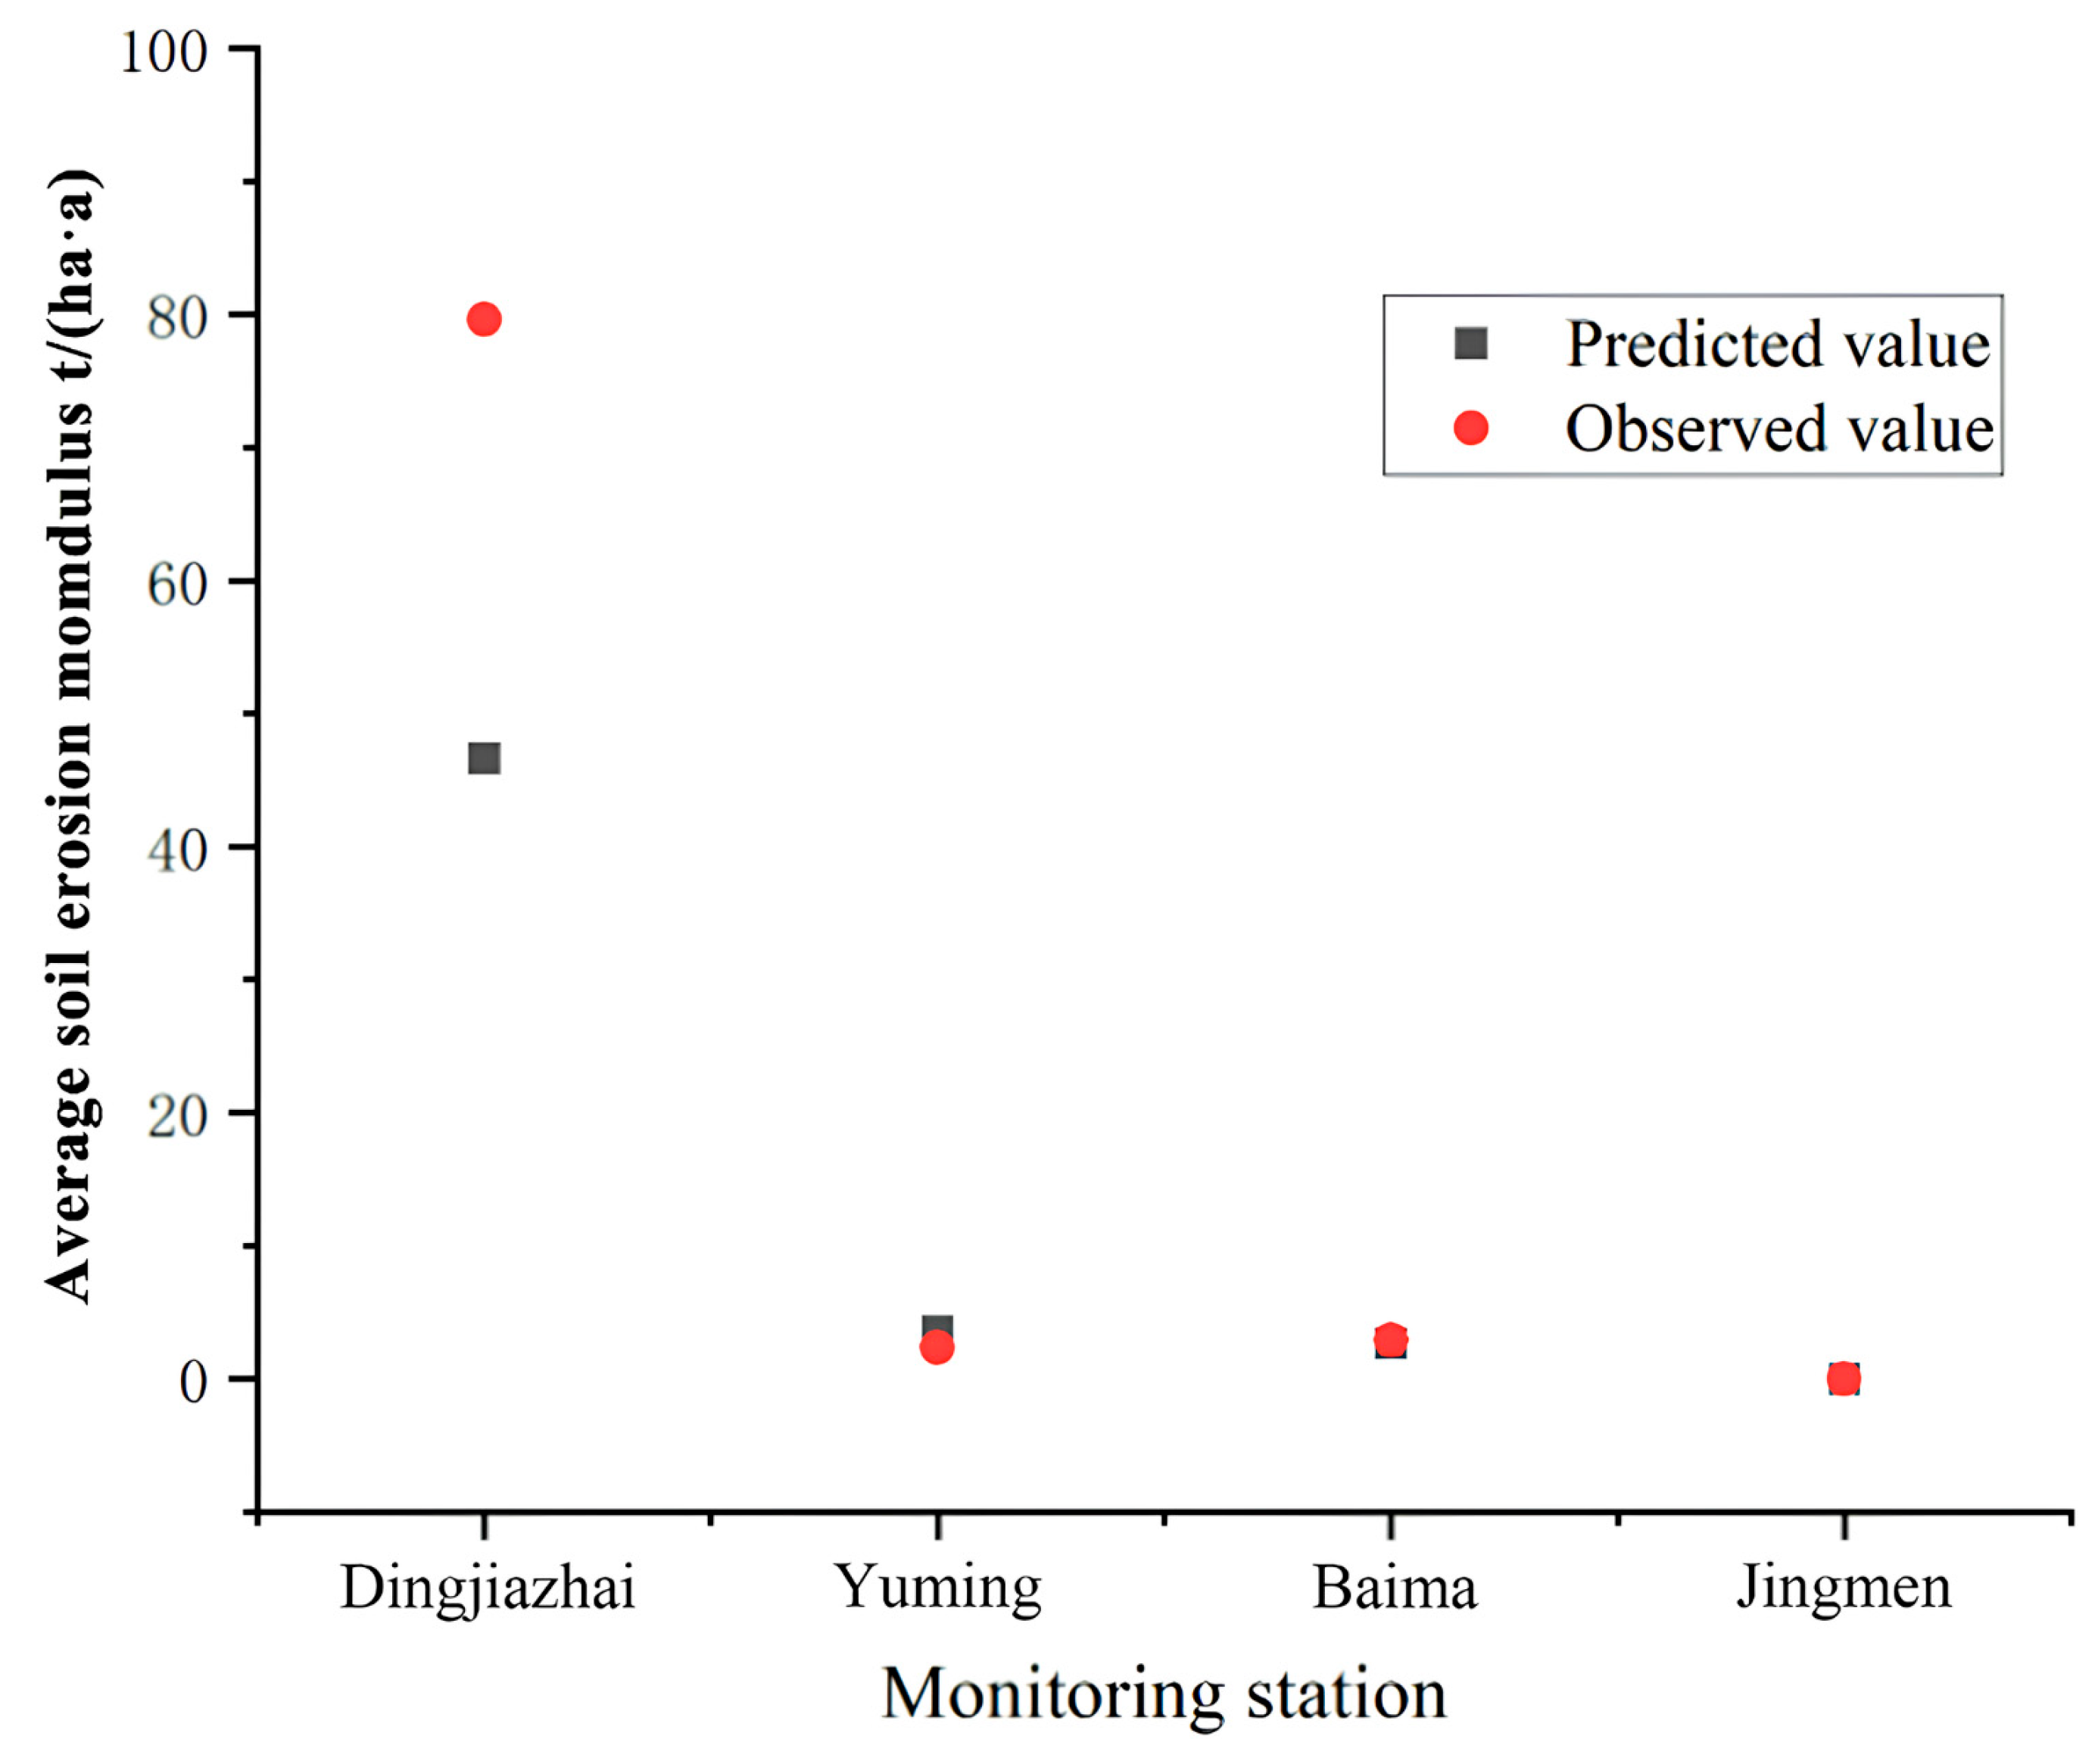
2.3.3. Nash–Sutcliffe Efficiency (NSE)
3. Results and Analyses
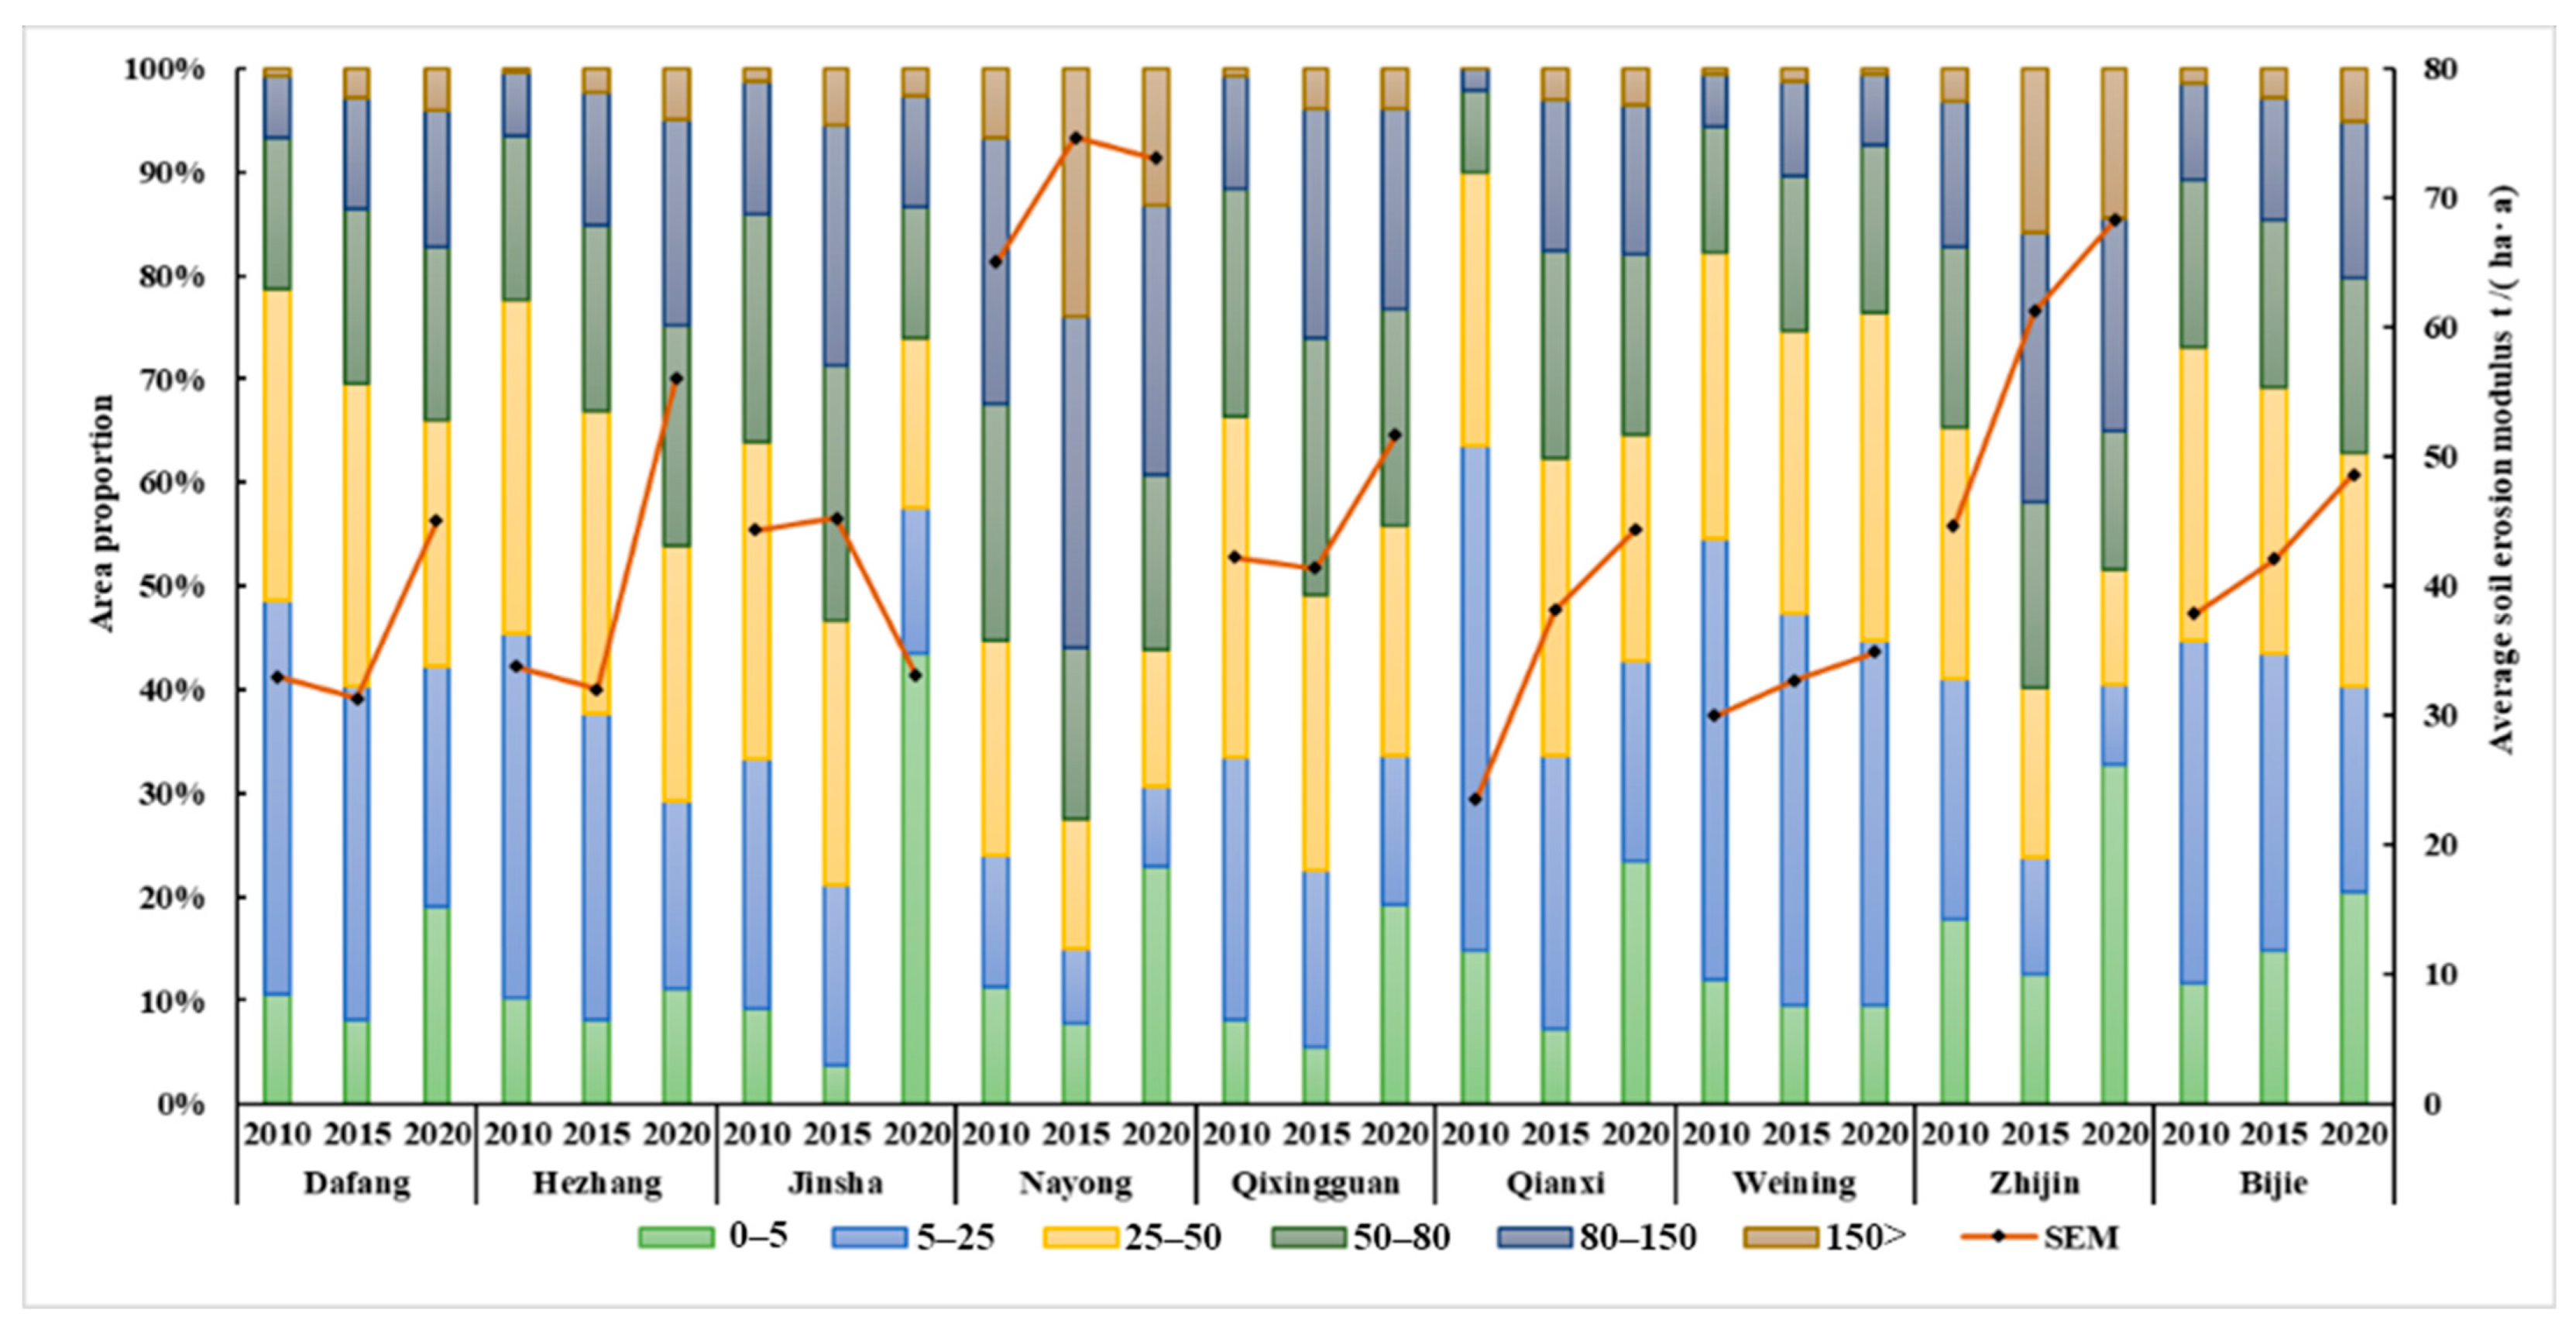
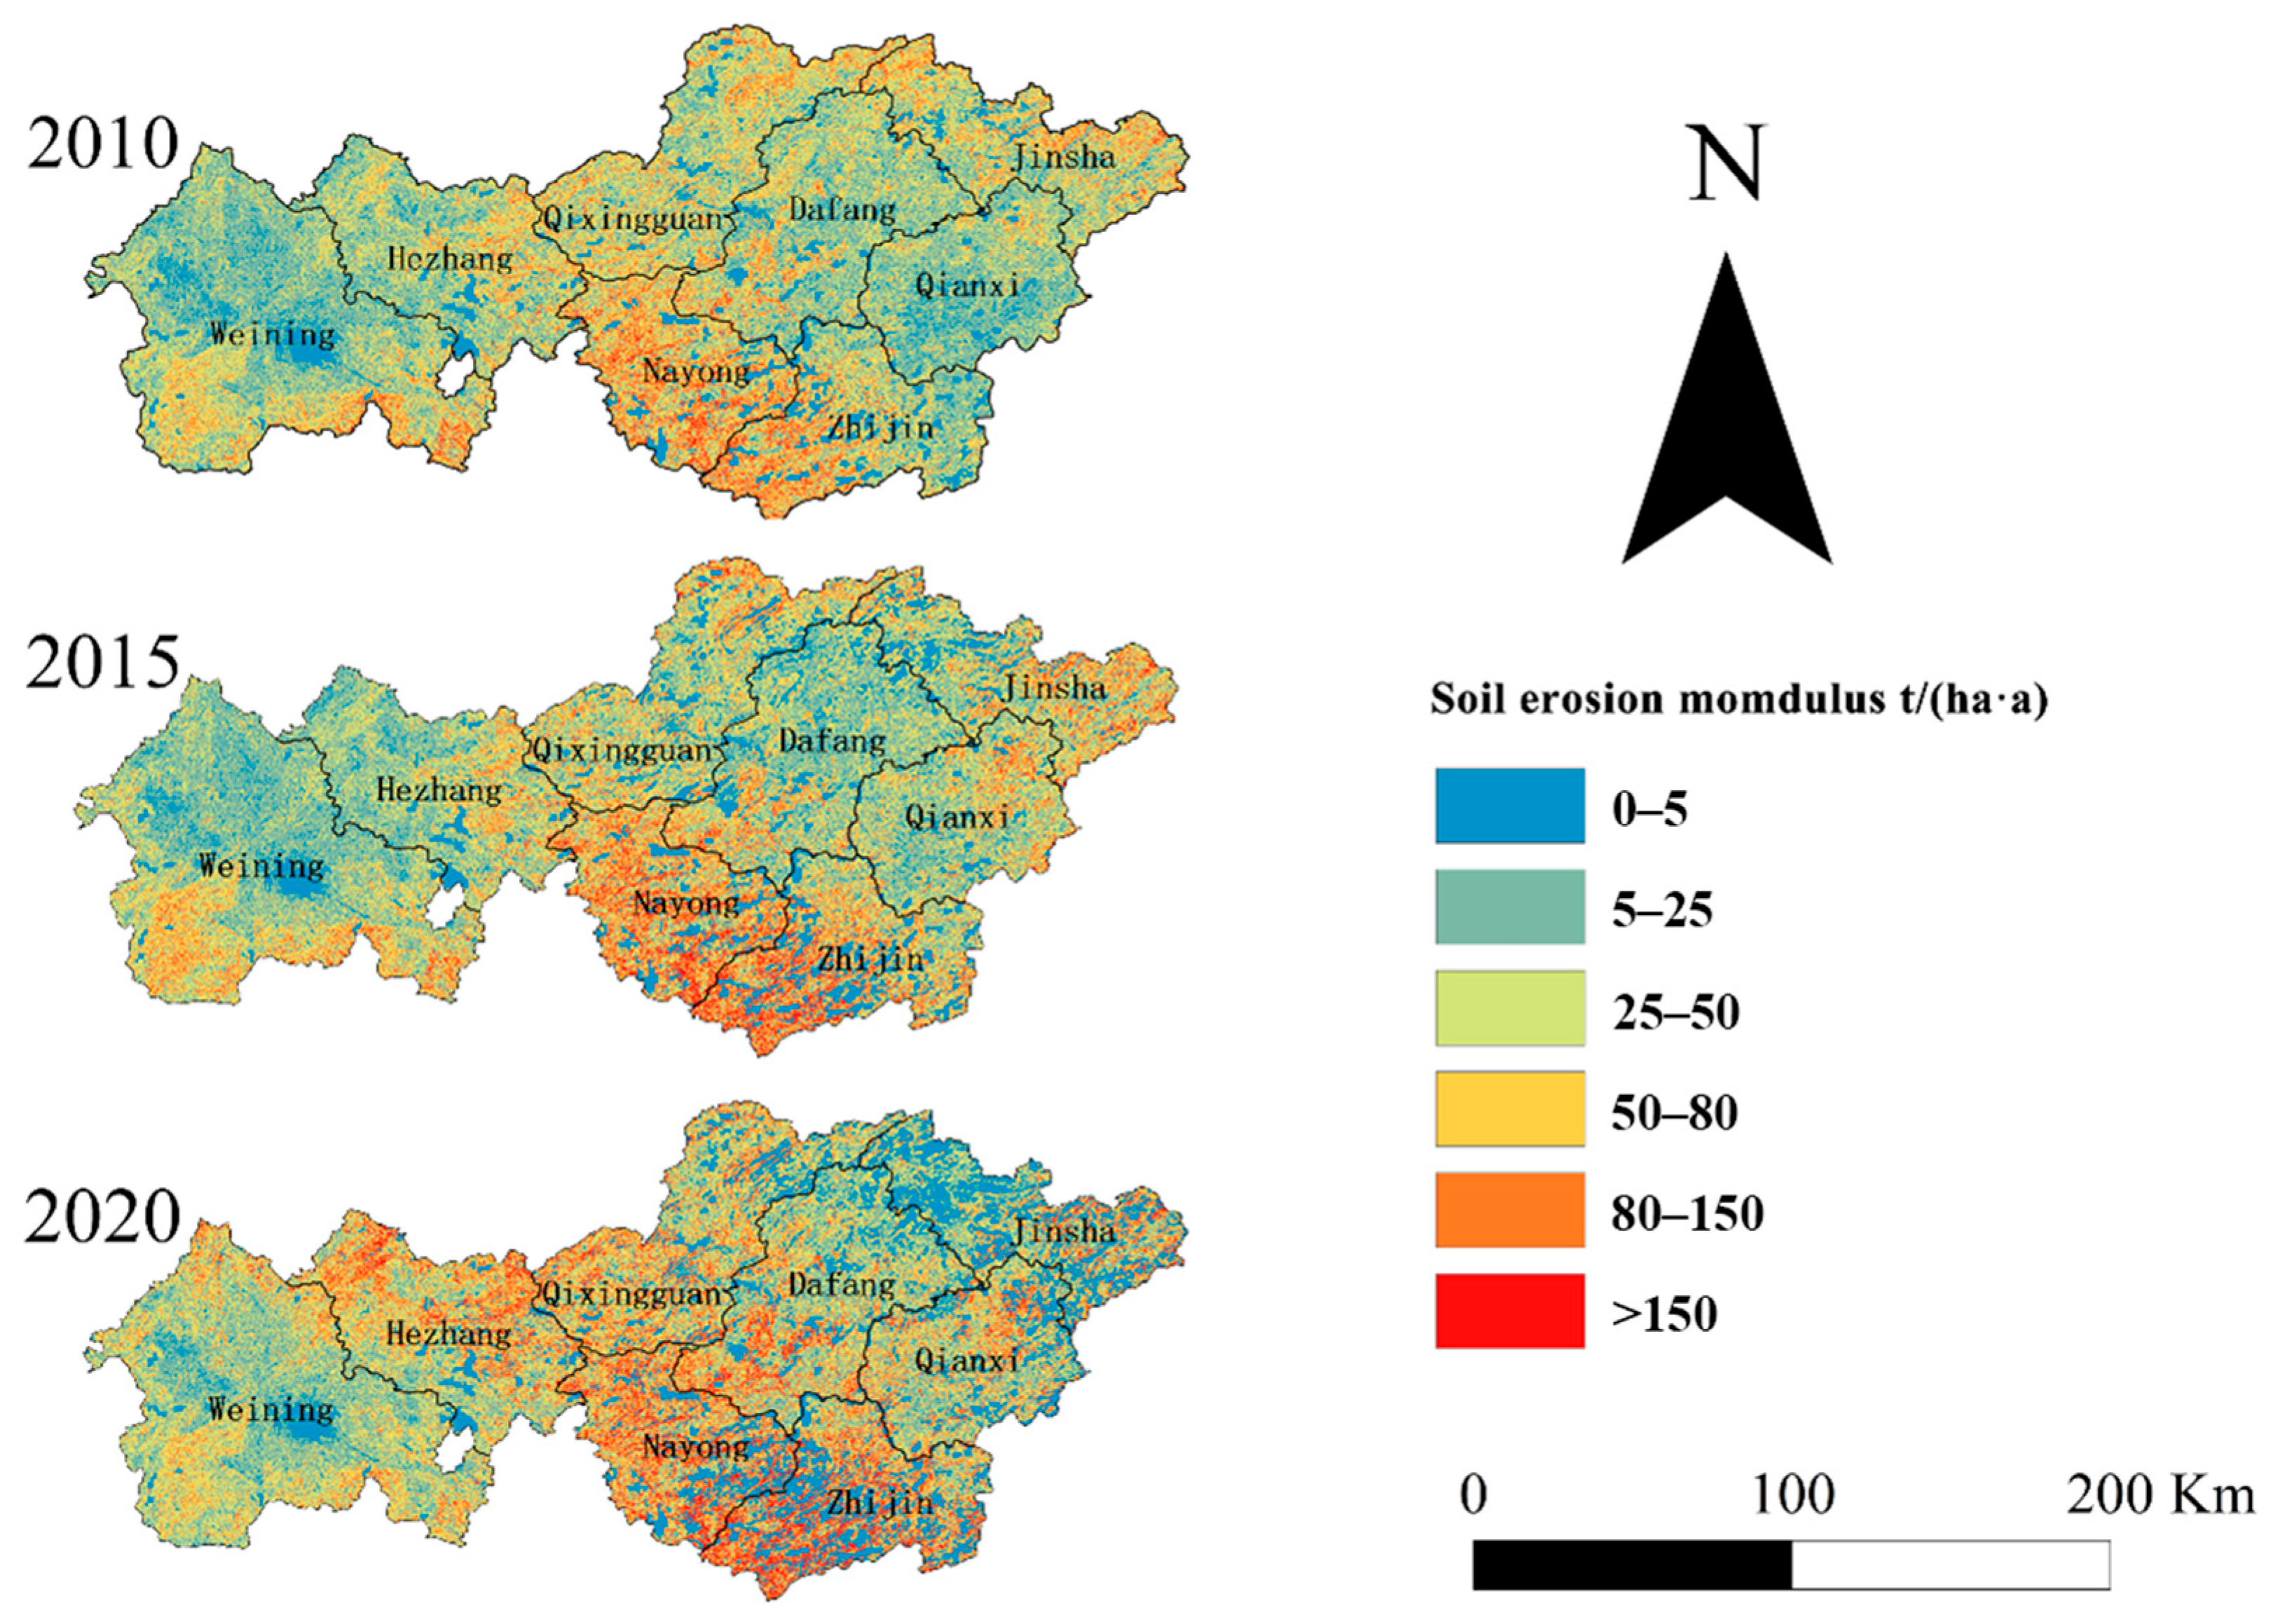
3.1. The Total Soil Erosion Characteristics
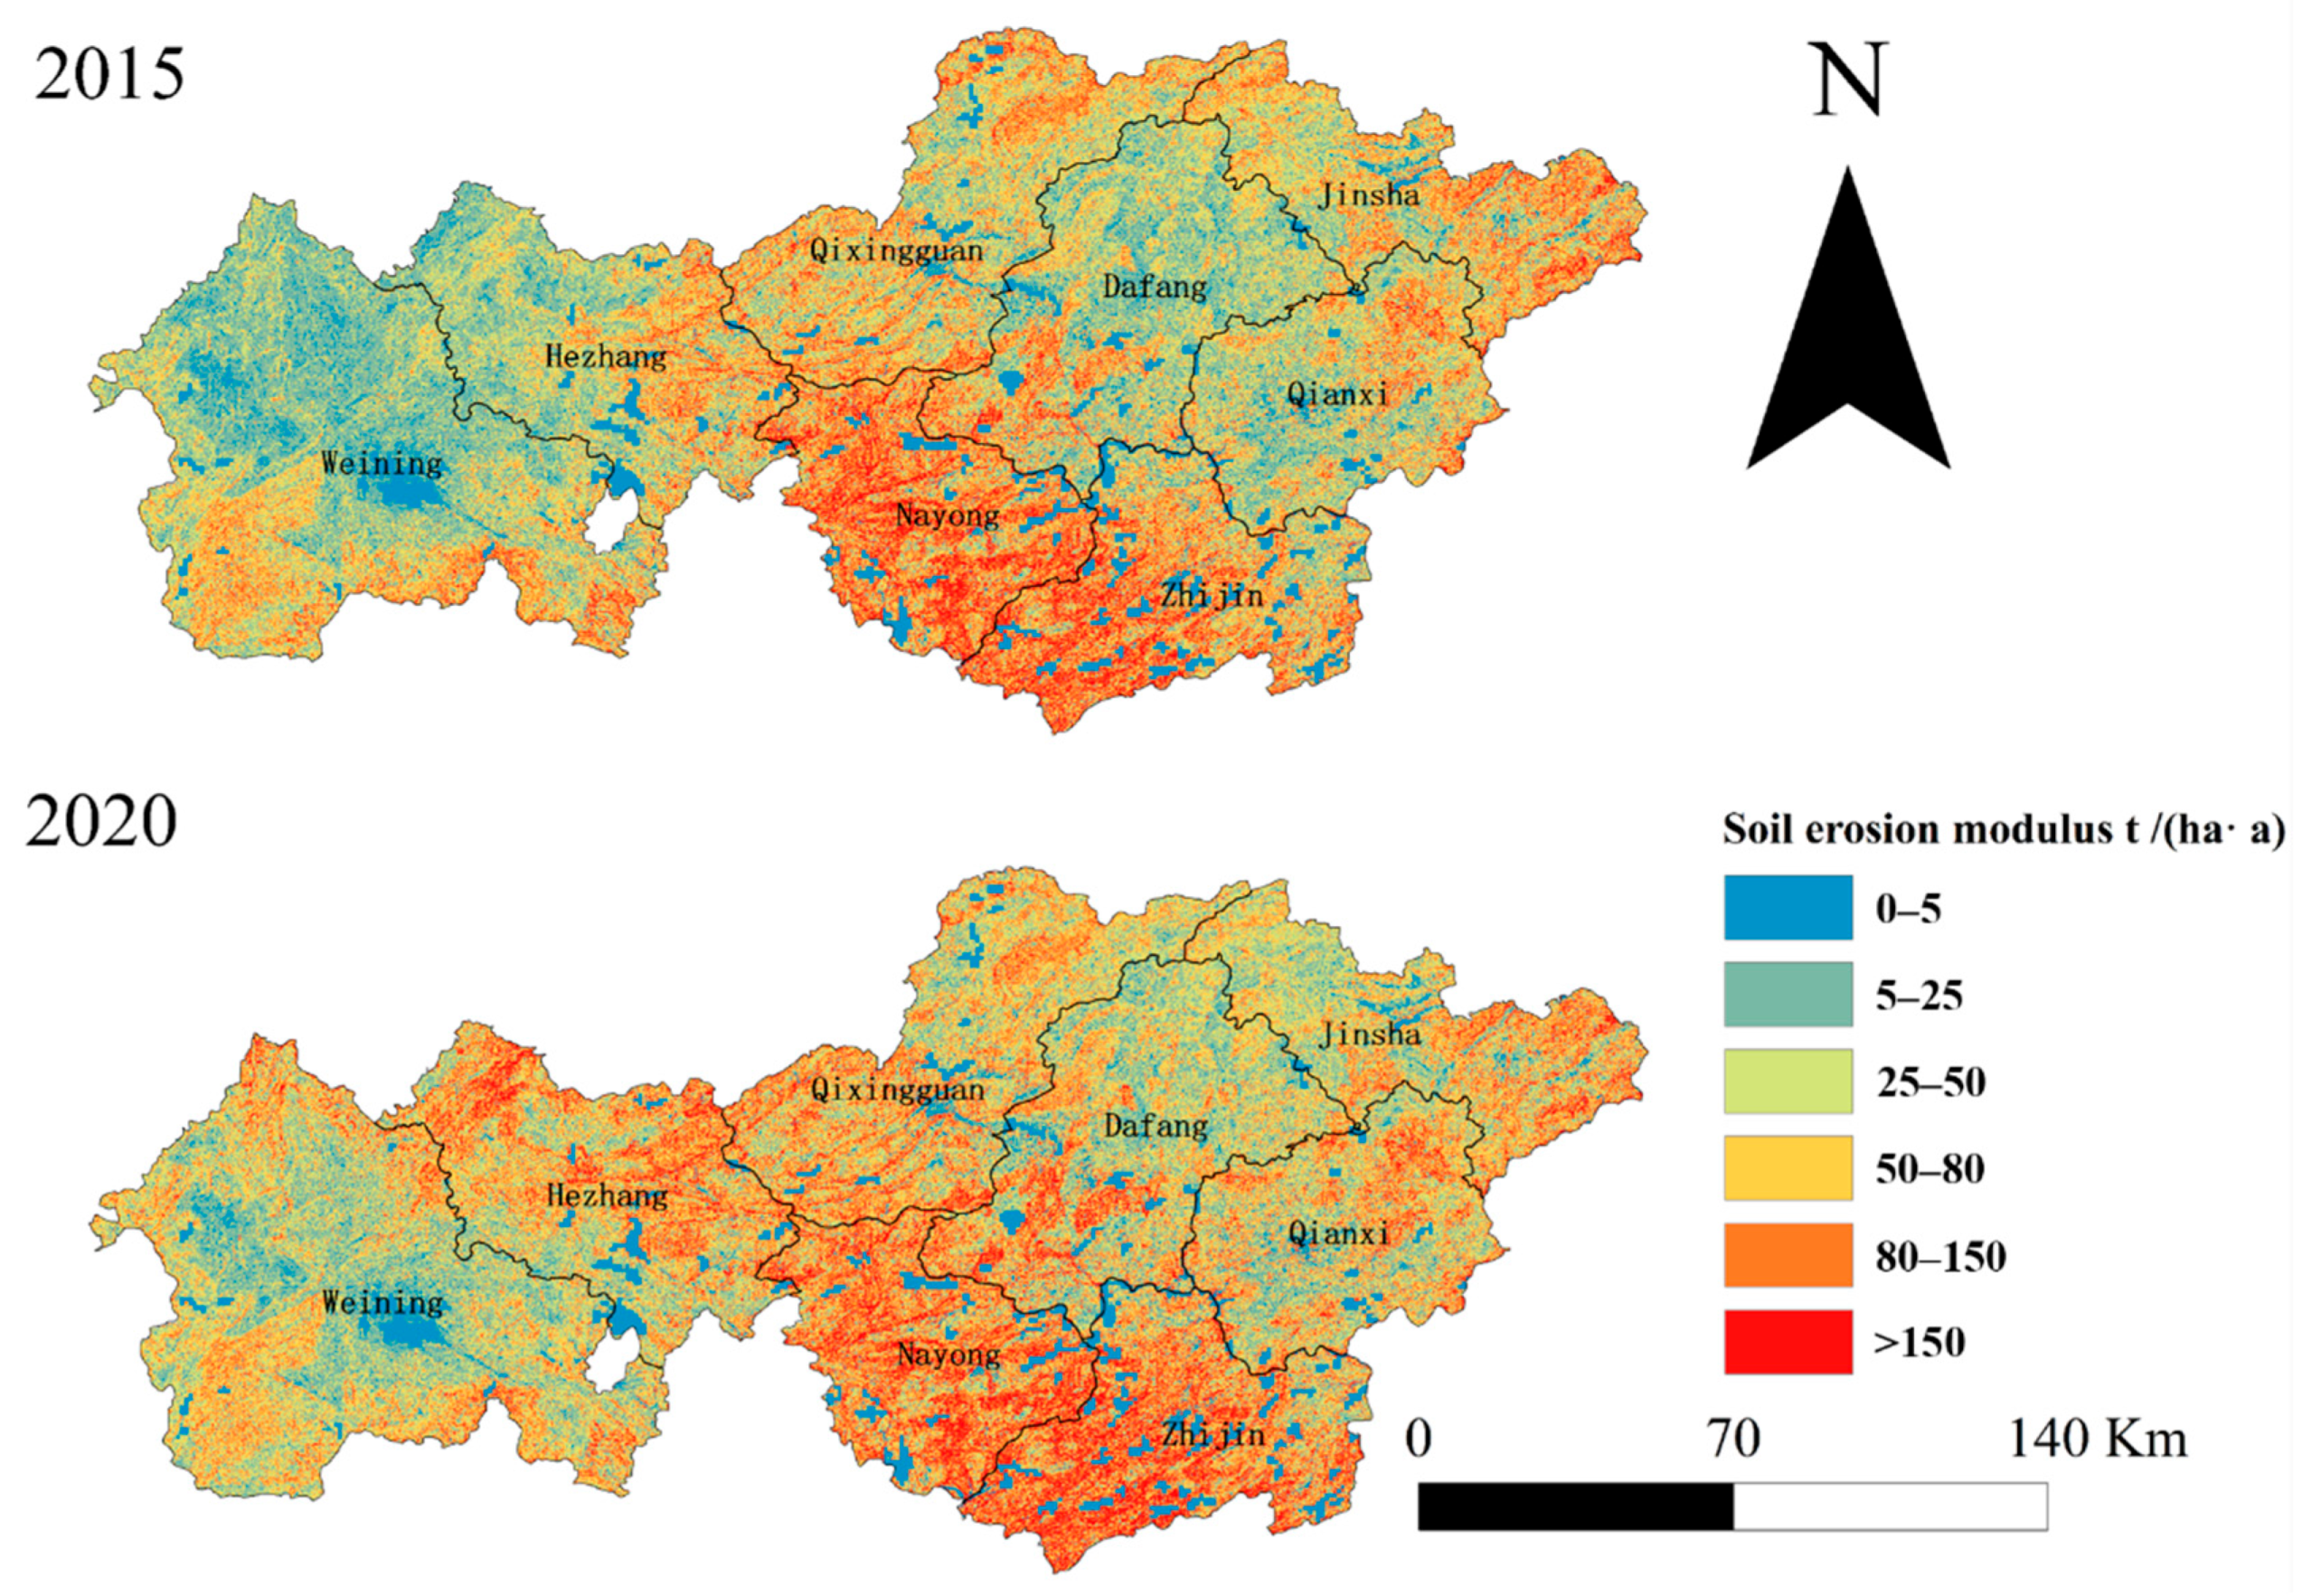
3.2. Characteristics of Natural Soil Erosion Change (NaSE)
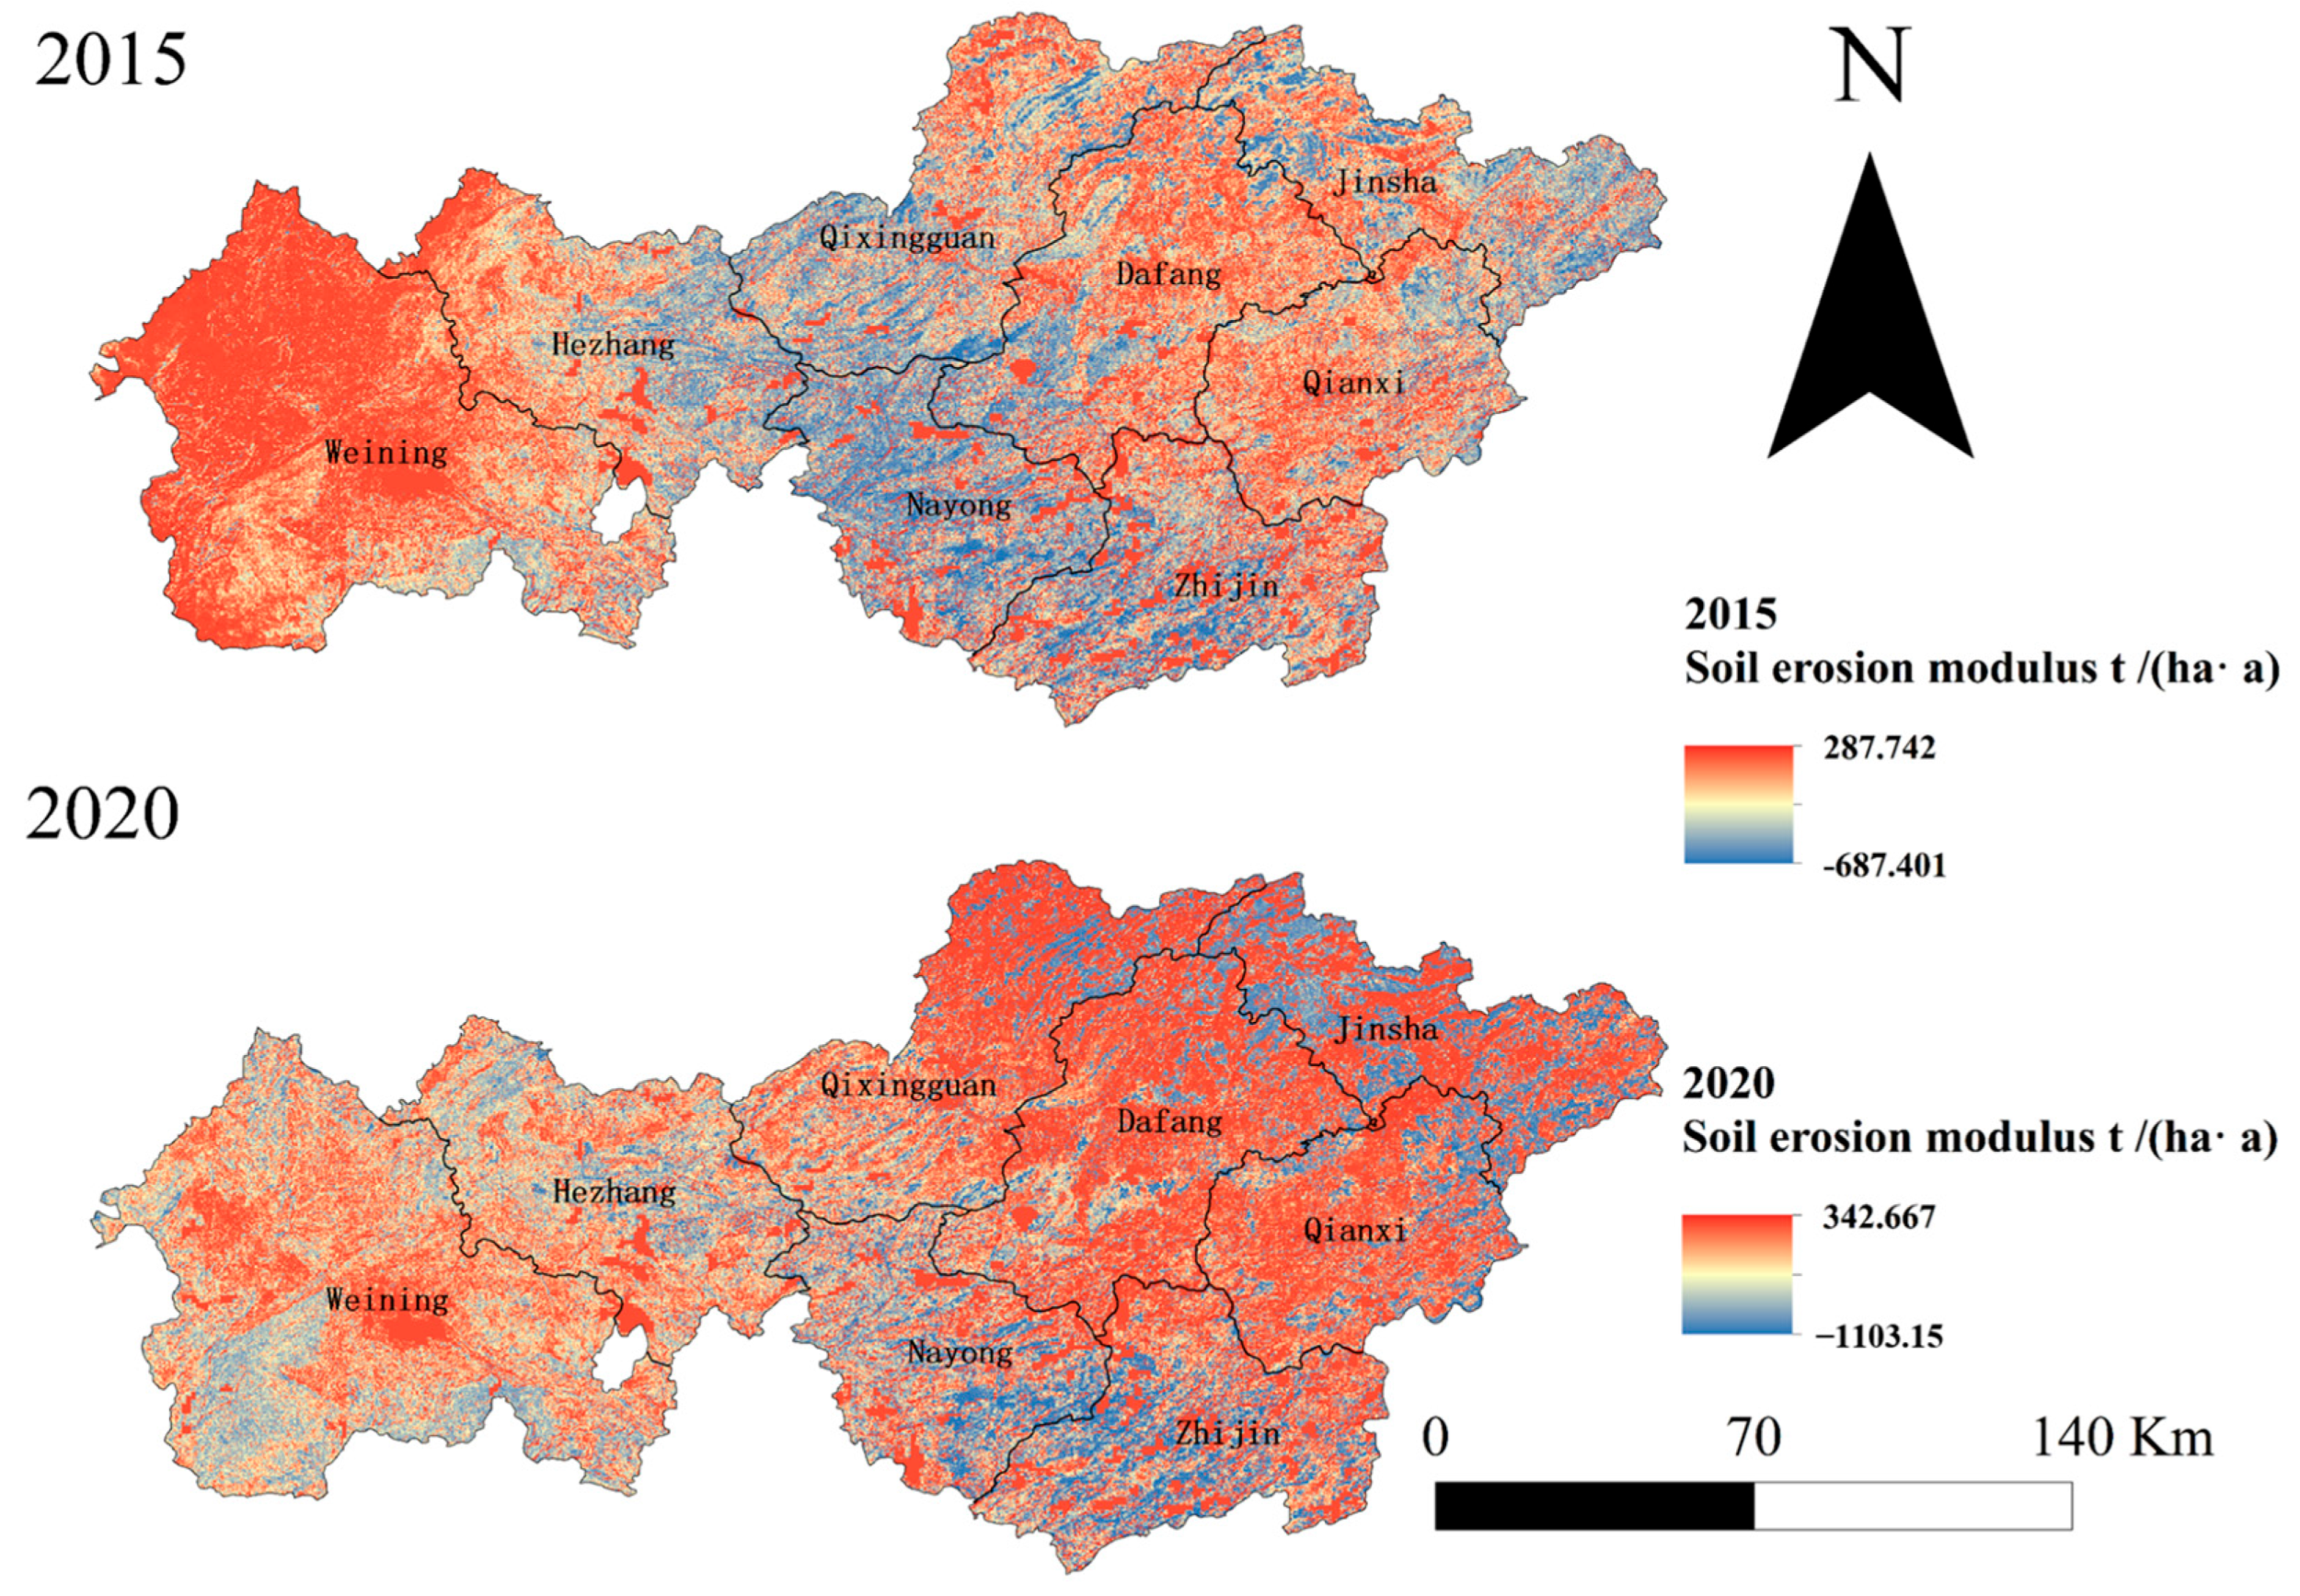
3.3. Characteristics of Anthropogenic Soil Erosion (ASE)
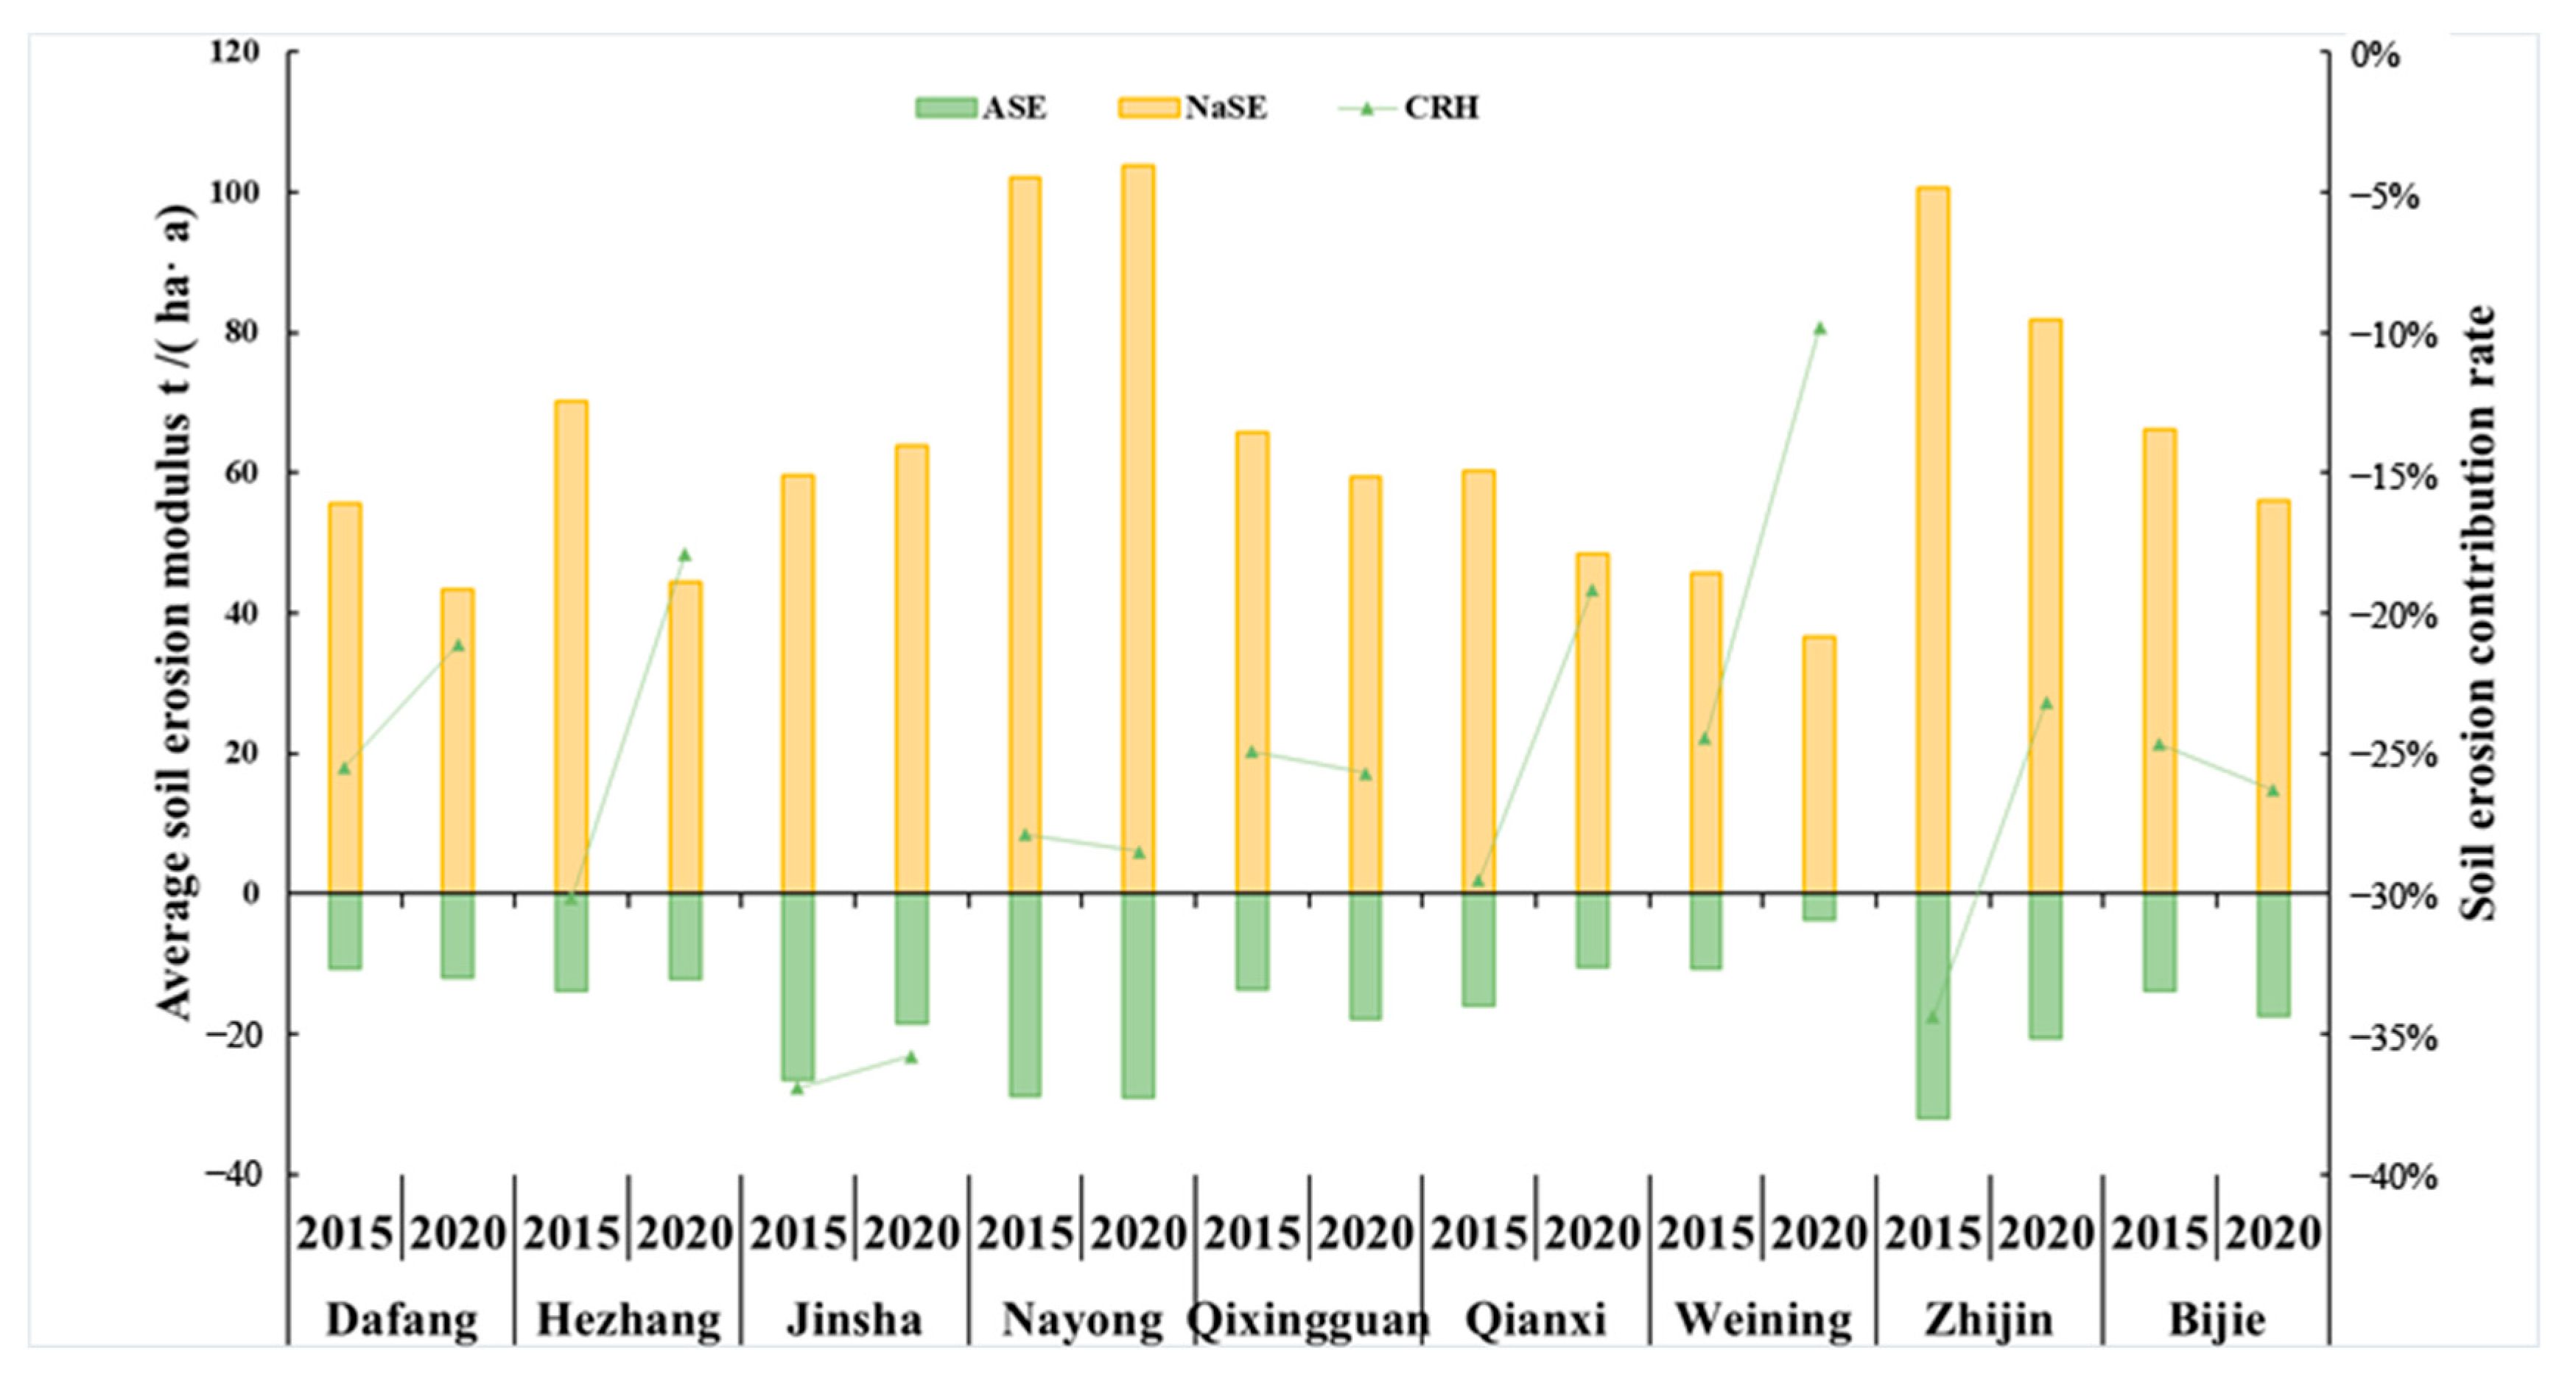
3.4. Soil Erosion Contribution and Soil Erosion Type
4. Discussion
4.1. Natural Soil Erosion
4.2. Anthropogenic Soil Erosion
4.3. Total Soil Erosion
4.4. Type of Soil Erosion
4.5. The Relationship Between Vegetation and Soil Erosion on Different Land Types
4.6. Deficiencies and Prospects
5. Conclusions
- (1)
- The SEM in the study area increased year by year from 2010 to 2020, and the rate of increase was accelerating. The average erosion modulus rose by 11% in 2015 compared to 2010, and by 16% in 2020 compared to 2015;
- (2)
- The anthropogenic soil erosion modulus in the study area was −13.79, and −17.36 t/(ha·a) in 2015 and 2020, respectively, indicating that human activities have reduced soil erosion in general;
- (3)
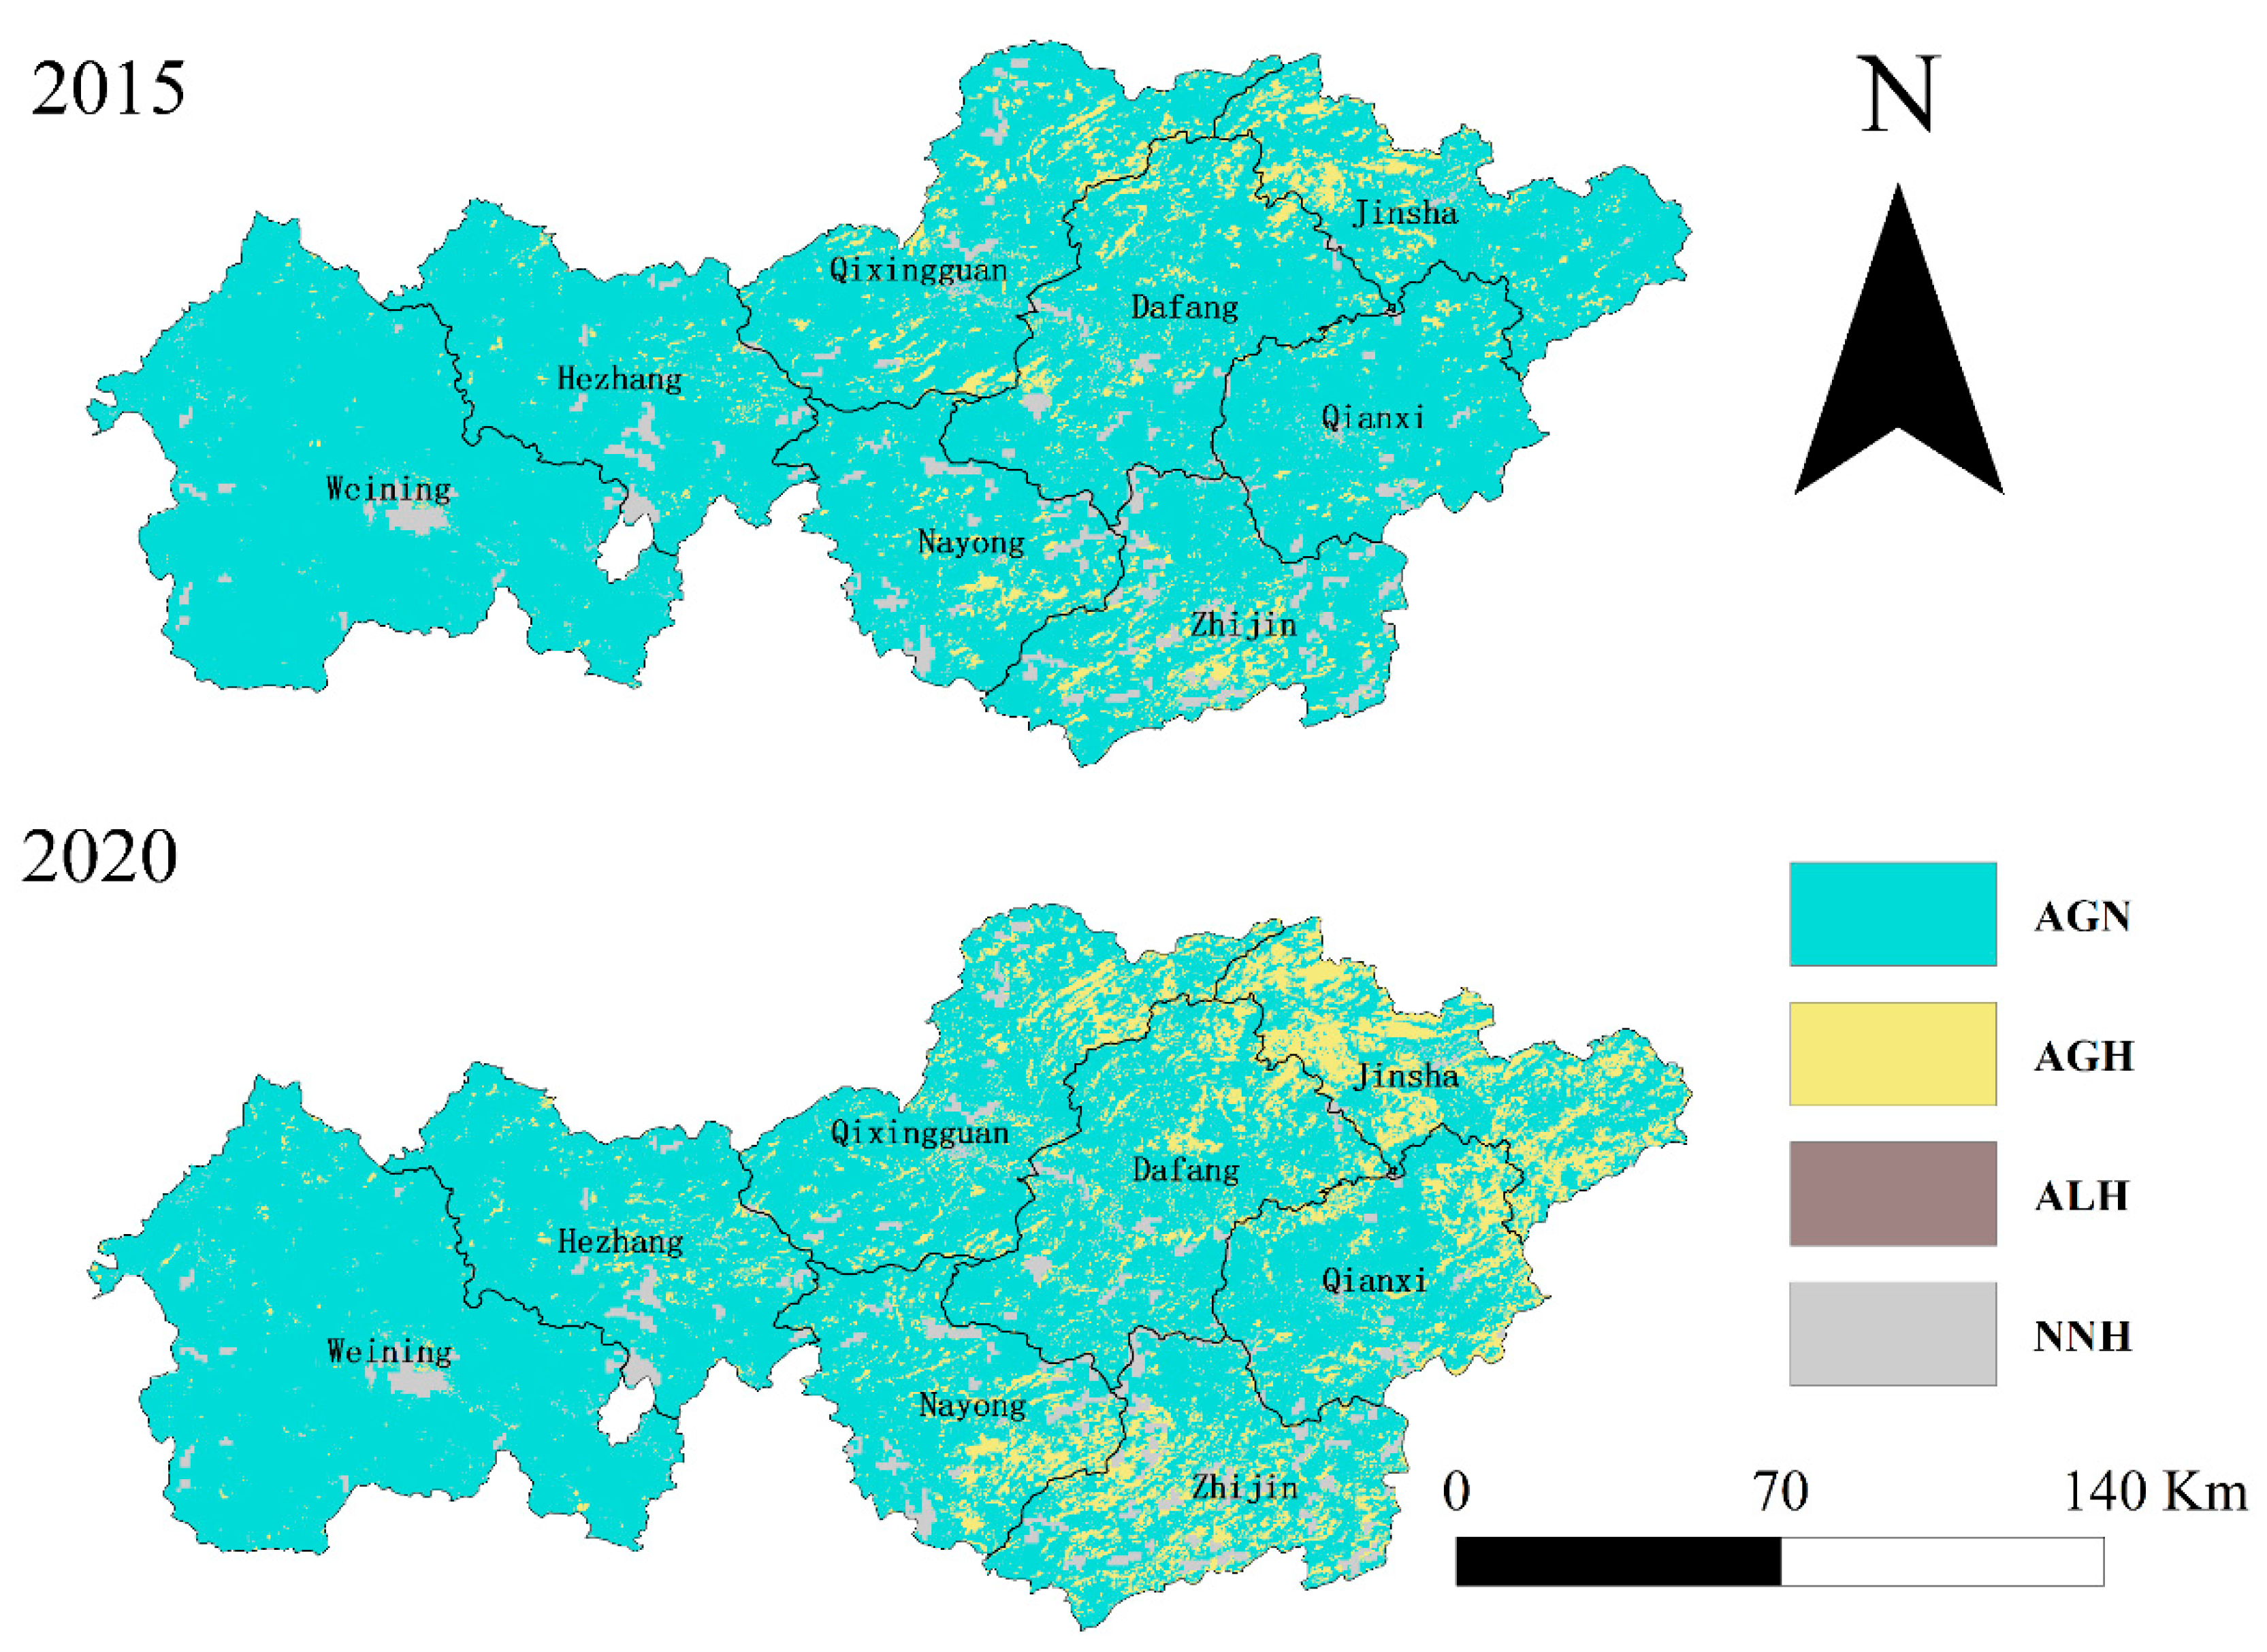
- The type of study area is characterized by a dominance of natural factors (AGN) in soil erosion, with a proportion of human-induced factors (AGH) increasing.
Author Contributions
Funding
Data Availability Statement
Conflicts of Interest
References
- Pimentel:, D. Soil Erosion: A Food and Environmental Threat. Environ. Dev. Sustain. 2006, 8, 119–137. [Google Scholar] [CrossRef]
- Zuazo, V.H.D.; Pleguezuelo, C.R.R. Soil-Erosion and Runoff Prevention by Plant Covers: A Review; Springer eBooks: New York, NY, USA, 2009; pp. 785–811. [Google Scholar] [CrossRef]
- Lang, Y.; Yang, X.; Cai, H. Quantifying anthropogenic soil erosion at a regional scale—The case of Jiangxi Province, China. CATENA 2023, 226, 107081. [Google Scholar] [CrossRef]
- Lal, R. Soil Erosion and Gaseous Emissions. Appl. Sci. 2020, 10, 2784. [Google Scholar] [CrossRef]
- Jin, F.; Yang, W.; Fu, J.; Li, Z. Effects of vegetation and climate on the changes of soil erosion in the Loess Plateau of China. Sci. Total Environ. 2021, 773, 145514. [Google Scholar] [CrossRef]
- Ma, X.; Zhao, C.; Zhu, J. Aggravated risk of soil erosion with global warming—A global meta-analysis. CATENA 2021, 200, 105129. [Google Scholar] [CrossRef]
- Zhang, C.; Zhou, A.; Zhang, H.; Zhang, Q.; Zhang, X.; Sun, H.; Zhao, C. Soil erosion in relation to climate change and vegetation cover over the past 2000 years as inferred from the Tianchi lake in the Chinese Loess Plateau. J. Asian Earth Sci. 2019, 180, 103850. [Google Scholar] [CrossRef]
- Wang, L.; Zhang, F.; Fu, S.; Shi, X.; Chen, Y.; Jagirani, M.D.; Zeng, C. Assessment of soil erosion risk and its response to climate change in the mid-Yarlung Tsangpo River region. Environ. Sci. Pollut. Res. Int. 2019, 27, 607–621. [Google Scholar] [CrossRef] [PubMed]
- Liu, Y.; Fu, B.; Lü, Y.; Wang, Z.; Gao, G. Hydrological responses and soil erosion potential of abandoned cropland in the Loess Plateau, China. Geomorphology 2012, 138, 404–414. [Google Scholar] [CrossRef]
- Nearing, M.A.; Jetten, V.; Baffaut, C.; Cerdan, O.; Couturier, A.; Hernandez, M.; Bissonnais, Y.L.; Nichols, M.H.; Nunes, J.P.; Renschler, C.S.; et al. Modeling response of soil erosion and runoff to changes in precipitation and cover. CATENA 2005, 61, 131–154. [Google Scholar] [CrossRef]
- Bodí, M.B.; Doerr, S.H.; Cerdà, A.; Mataix-Solera, J. Hydrological effects of a layer of vegetation ash on underlying wettable and water-repellent soil. Geoderma 2012, 191, 14–23. [Google Scholar] [CrossRef]
- Zhou, J.; Fu, B.; Gao, G.; Lü, Y.; Liu, Y.; Lü, N.; Wang, S. Effects of precipitation and restoration vegetation on soil erosion in a semi-arid environment in the Loess Plateau, China. CATENA 2016, 137, 1–11. [Google Scholar] [CrossRef]
- Wang, H.; Zhao, W.; Li, C.; Pereira, P. Vegetation greening partly offsets the water erosion risk in China from 1999 to 2018. Geoderma 2021, 401, 115319. [Google Scholar] [CrossRef]
- Zhang, X.; Song, J.; Wang, Y.; Sun, H.; Li, Q. Threshold effects of vegetation coverage on runoff and soil loss in the Loess Plateau of China: A meta-analysis. Geoderma 2022, 412, 115720. [Google Scholar] [CrossRef]
- Diatta, A.A.; Thomason, W.E.; Abaye, O.; Thompson, T.L.; Battaglia, M.L.; Vaughan, L.J.; Lo, M.; Filho, J.F.D.C.L. Assessment of Nitrogen Fixation by Mungbean Genotypes in Different Soil Textures Using 15N Natural Abundance Method. J. Soil Sci. Plant Nutr. 2020, 20, 2230–2240. [Google Scholar] [CrossRef]
- Spurgeon, D.J.; Keith, A.M.; Schmidt, O.; Lammertsma, D.R.; Faber, J.H. Land-use and land-management change: Relationships with earthworm and fungi communities and soil structural properties. BMC Ecol. 2013, 13, 46. [Google Scholar] [CrossRef]
- Adeyemi, O.; Keshavarz-Afshar, R.; Jahanzad, E.; Battaglia, M.L.; Luo, Y.; Sadeghpour, A. Effect of Wheat Cover Crop and Split Nitrogen Application on Corn Yield and Nitrogen Use Efficiency. Agronomy 2020, 10, 1081. [Google Scholar] [CrossRef]
- Babur, E.; Uslu, M.S.; Battaglia, M.L.; Diatta, A.; Fahad, S.; Datta, R.; Zafar-Ul-Hye, M.; Hussain, G.S.; Danish, S. Studying soil erosion by evaluating changes in physico-chemical properties of soils under different land-use types. J. Saudi Soc. Agric. Sci. 2021, 20, 190–197. [Google Scholar] [CrossRef]
- Gocić, M.; Dragićević, S.; Radivojević, A.; Bursać, N.M.; Stričević, L.; Đorđević, M. Changes in Soil Erosion Intensity Caused by Land Use and Demographic Changes in the Jablanica River Basin, Serbia. Agriculture 2020, 10, 345. [Google Scholar] [CrossRef]
- Zhao, J.; Wang, Z.; Dong, Y.; Yang, Z.; Govers, G. How soil erosion and runoff are related to land use, topography and annual precipitation: Insights from a meta-analysis of erosion plots in China. Sci. Total Environ. 2022, 802, 149665. [Google Scholar] [CrossRef]
- Obiahu, O.H.; Elias, E. Effect of land use land cover changes on the rate of soil erosion in the Upper Eyiohia river catchment of Afikpo North Area, Nigeria. Environ. Chall. 2020, 1, 100002. [Google Scholar] [CrossRef]
- Borrelli, P.; Robinson, D.A.; Fleischer, L.R.; Lugato, E.; Ballabio, C.; Alewell, C.; Meusburger, K.; Modugno, S.; Schütt, B.; Ferro, V.; et al. An assessment of the global impact of 21st century land use change on soil erosion. Nat. Commun. 2017, 8, 2013. [Google Scholar] [CrossRef]
- Zhen, L. The national census for soil erosion and dynamic analysis in China. Int. Soil Water Conserv. Res. 2013, 1, 12–18. [Google Scholar] [CrossRef]
- Han, X.; Lv, P.; Zhao, S.; Sun, Y.; Yan, S.; Wang, M.; Han, X.; Wang, X. The Effect of the Gully Land Consolidation Project on Soil Erosion and Crop Production on a Typical Watershed in the Loess Plateau. Land 2018, 7, 113. [Google Scholar] [CrossRef]
- Han, Z.; Yang, X.; Yin, X.; Fang, Q.; Zhao, L. How do the distribution patterns of exposed roots affect the rainfall-runoff processes of sloped land under simulated multi-rainfall conditions in karst region? CATENA 2024, 236, 107708. [Google Scholar] [CrossRef]
- Wang, L.C.; Lee, D.W.; Zuo, P.; Zhou, Y.K.; Xu, Y.P. Karst environment and eco-poverty in southwestern China: A case study of Guizhou Province. Chin. Geogr. Sci. 2004, 14, 21–27. [Google Scholar] [CrossRef]
- Yang, R.; Zhong, C.; Yang, Z.; Liu, F.; Peng, H. Analysis on poverty influencing factors in deep poverty county of Karst Rocky-desertified Area in Southwest China. World Geogr. Res. 2022, 31, 1298–1309. [Google Scholar] [CrossRef]
- Zhang, J.Y.; Dai, M.H.; Wang, L.C.; Zeng, C.F.; Su, W.C. The challenge and future of rocky desertification control in karst areas in southwest China. Solid Earth 2016, 7, 83–91. [Google Scholar] [CrossRef]
- Qiao, Y.; Jiang, Y.; Zhang, C. Contribution of karst ecological restoration engineering to vegetation greening in southwest China during recent decade. Ecol. Indic. 2021, 121, 107081. [Google Scholar] [CrossRef]
- Tong, X.; Brandt, M.; Yue, Y.; Horion, S.; Wang, K.; De Keersmaecker, W.; Tian, F.; Schurgers, G.; Xiao, X.; Luo, Y.; et al. Increased vegetation growth and carbon stock in China karst via ecological engineering. Nat. Sustain. 2018, 1, 44–50. [Google Scholar] [CrossRef]
- Yang, F.; Lu, C. Spatiotemporal variation and trends in rainfall erosivity in China’s dryland region during 1961–2012. CATENA 2015, 133, 362–372. [Google Scholar] [CrossRef]
- Peng, J.; Tian, L.; Zhang, Z.; Zhao, Y.; Green, S.M.; Quine, T.A.; Liu, H.; Meersmans, J. Distinguishing the impacts of land use and climate change on ecosystem services in a karst landscape in China. Ecosyst. Serv. 2020, 46, 101199. [Google Scholar] [CrossRef]
- Zhu, D.; Xiong, K.; Xiao, H. Multi-time scale variability of rainfall erosivity and erosivity density in the karst region of southern China, 1960–2017. CATENA 2021, 197, 104977. [Google Scholar] [CrossRef]
- Shi, J. Evaluation and countermeasure analysis of comprehensive control of stony desertification in Bijie City. Master’s Thesis, Guizhou University, Guiyang, China, 2021. (In Chinese). [Google Scholar]
- Pan, L.D.; Li, R.; Shu, D.C.; Zhao, L.N.; Chen, M.; Jing, J. Effects of rainfall and rocky desertification on soil erosion in karst area of Southwest China. J. Mt. Sci. 2022, 19, 3118–3130. [Google Scholar] [CrossRef]
- Yu, B.; Rosewell, C. An assessment of a daily rainfall erosivity model for New South Wales. Soil Res. 1996, 34, 139. [Google Scholar] [CrossRef]
- Sharpley, A.; Williams, J.R. EPIC-Erosion/Productivity Impact Calculator: 1. Model Documentation; US Government Printing Office: Washington, DC, USA, 1990. [Google Scholar]
- Cai, C.; Ding, S.; Shi, H.; Huang, L.; Zhang, G. Prediction of soil erosion in a small watershed using USLE model and IDRISI. J. Soil Water Conserv. 2000, 2, 19–24. (In Chinese) [Google Scholar]
- McCool, N.D.K.; Brown, N.L.C.; Foster, N.G.R.; Mutchler, N.C.K.; Meyer, N.L.D. Revised Slope Steepness Factor for the Universal Soil Loss Equation. Trans. ASAE 1987, 30, 1387–1396. [Google Scholar] [CrossRef]
- McCool, N.D.K.; Foster, N.G.R.; Mutchler, N.C.K.; Meyer, N.L.D. Revised Slope Length Factor for the Universal Soil Loss Equation. Trans. ASAE 1989, 32, 1571–1576. [Google Scholar] [CrossRef]
- Ghosal, K.; Bhattacharya, S.D. A Review of RUSLE Model. Photonirvachak 2020, 48, 689–707. [Google Scholar] [CrossRef]
- Rao, W.; Shen, Z.; Duan, X. Spatiotemporal patterns and drivers of soil erosion in Yunnan, Southwest China: RULSE assessments for recent 30 years and future predictions based on CMIP6. CATENA 2023, 220, 106703. [Google Scholar] [CrossRef]
- Getachew, B.; Manjunatha, B.R.; Bhat, G.H. Assessing current and projected soil loss under changing land use and climate using RUSLE with Remote sensing and GIS in the Lake Tana Basin, Upper Blue Nile River Basin, Ethiopia. Egypt. J. Remote Sens. Space Sci. 2021, 24, 907–918. [Google Scholar] [CrossRef]
- Wu, Y.; Yang, J.; Li, S.; Guo, C.; Yang, X.; Xu, Y.; Yue, F.; Peng, H.; Chen, Y.; Gu, L.; et al. NDVI-Based Vegetation Dynamics and Their Responses to Climate Change and Human Activities from 2000 to 2020 in Miaoling Karst Mountain Area, SW China. Land 2023, 12, 1267. [Google Scholar] [CrossRef]
- Yang, Q. Study on the Contribution Rate of Soil Surface-Subsurface Loss and Its Influencing Factors in a Typical Areas of Karst Rocky Desertification in Plateau Mountains. Master’s Thesis, Guizhou Normal University, Gui Yang, China, 2023. Available online: https://link.cnki.net/doi/10.27048/d.cnki.ggzsu.2023.001274 (accessed on 27 September 2024). (In Chinese).
- Guizhou Provincial Development and Reform Commission. The Ecological Construction of Guizhou Province Will Enter a Stage to Ensure the Harmonious Development of Man and Nature. Guizhou Provincial People’s Government 2011, March 10. Available online: https://www.guizhou.gov.cn/home/gzyw/202109/t20210913_70337228.html (accessed on 1 September 2023).
- Jain, S.K.; Goel, M.K. Assessing the vulnerability to soil erosion of the Ukai Dam catchments using remote sensing and GIS. Hydrol. Sci. J. 2002, 47, 31–40. [Google Scholar] [CrossRef]
- Jiang, Y.; Gao, J.; Yang, L.; Wu, S.; Dai, E. The interactive effects of elevation, precipitation and lithology on karst rainfall and runoff erosivity. CATENA 2021, 207, 105588. [Google Scholar] [CrossRef]
- Qu, K. Study on Evaluation of Geological Hazard Susceptibility of Collapse and Landslide in Bijie City, Guizhou Province. Master’s Thesis, Jilin University, Changchun, China, 2020. Available online: https://link.cnki.net/doi/10.27162/d.cnki.gjlin.2019.000616 (accessed on 27 September 2024). (In Chinese).
- Huang, Z.; Yu, J.; Fang, L.; Fang, F.; Miao, Y.; Zhi, J.; Xu, G.; Shui, H.; Cao, Y. Study on soil erosion and its influencing factors in Qingyijiang River Basin based on InVEST model. J. Soil Water Conserv. 2023, 37, 189–197. (In Chinese) [Google Scholar]
- Zhang, Y. Soil Erosion Patterns and Driving Mechanisms Based on the Degree of Karst Development. Master’s Thesis, Guizhou Normal University, Gui Yang, China, 2023. Available online: https://link.cnki.net/doi/10.27048/d.cnki.ggzsu.2023.001161 (accessed on 27 September 2024). (In Chinese).
- Assouline, S.; Ben-Hur, M. Effects of rainfall intensity and slope gradient on the dynamics of interracial erosion during soil surface sealing. CATENA 2006, 66, 211–220. [Google Scholar] [CrossRef]
- Devia, G.K.; Ganasri, B.; Dwarakish, G. A Review on Hydrological Models. Aquat. Procedia 2015, 4, 1001–1007. [Google Scholar] [CrossRef]
- Wakiyama, Y.; Onda, Y.; Mizugaki, S.; Asai, H.; Hiramatsu, S. Soil erosion rates on forested mountain hillslopes estimated using 137Cs and 210Pbex. Geoderma 2010, 159, 39–52. [Google Scholar] [CrossRef]
- Juan, J.; Dongdong, L.; YuanHang, F.; Pu, L. Combined effects of moss colonization and rock fragment coverage on sediment losses, flow hydraulics and surface microtopography of carbonate-derived laterite from karst mountainous lands. CATENA 2023, 229, 107202. [Google Scholar] [CrossRef]
- Mushi, C.; Ndomba, P.; Trigg, M.; Tshimanga, R.; Mtalo, F. Assessment of basin-scale soil erosion within the Congo River Basin: A review. CATENA 2019, 178, 64–76. [Google Scholar] [CrossRef]
- Wen, X.; Deng, X. Current soil erosion assessment in the Loess Plateau of China: A mini-review. J. Clean. Prod. 2020, 276, 123091. [Google Scholar] [CrossRef]
- Li, Y.; Bai, X.; Zhou, Y.; Qin, L.; Tian, X.; Tian, Y.; Li, P. Spatial–Temporal Evolution of Soil Erosion in a Typical Mountainous Karst Basin in SW China, Based on GIS and RUSLE. Arab. J. Sci. Eng. Sect. B Eng. 2015, 41, 209–221. [Google Scholar] [CrossRef]
- Yang, X.; Sun, W.; Li, P.; Mu, X.; Gao, P.; Zhao, G. Reduced sediment transport in the Chinese Loess Plateau due to climate change and human activities. Sci. Total Environ. 2018, 642, 591–600. [Google Scholar] [CrossRef] [PubMed]
- Zhang, G.; Shen, R.; Luo, R.; Cao, Y.; Zhang, X. Effects of sediment load on hydraulics of overland flow on steep slopes. Earth Surf. Process. Landf. 2010, 35, 1811–1819. [Google Scholar] [CrossRef]
- Wang, H.; Gao, J.; Hou, W. Quantitative attribution analysis of soil erosion in different geomorphological types in karst areas: Based on the geodetector method. J. Geogr. Sci. 2019, 29, 271–286. [Google Scholar] [CrossRef]
- Santhanam, H.; Majumdar, R. Quantification of green-blue ratios, impervious surface area and pace of urbanisation for sustainable management of urban lake—Land zones in India—A case study from Bengaluru city. J. Urban Manag. 2022, 11, 310–320. [Google Scholar] [CrossRef]
- Li, R.; Wu, Q.; Zhang, J.; Wen, Y.; Li, Q. Effects of Land Use Change of Sloping Farmland on Characteristic of Soil Erosion Resistance in Typical Karst Mountainous Areas of Southwestern China. Pol. J. Environ. Stud. 2019, 28, 2707–2716. [Google Scholar] [CrossRef]
- Niu, L.; Shao, Q. Soil Conservation Service Spatiotemporal Variability and Its Driving Mechanism on the Guizhou Plateau, China. Remote Sens. 2020, 12, 2187. [Google Scholar] [CrossRef]
- Chen, M.; Gao, J.Y.; Chen, H.L.; Jing, J.; Li, R. Elevation, bedrock exposure, land use, interbedded limestone and clastic rock, and vegetation coverage dominate the spatiotemporal variability of soil erosion in karst basin. J. Mt. Sci. 2023, 20, 2519–2535. [Google Scholar] [CrossRef]
- Ma, Y.; Zuo, L.; Gao, J.; Liu, Q.; Liu, L. The karst NDVI correlation with climate and its BAS-BP prediction based on multiple factors. Ecol. Indic. 2021, 132, 108254. [Google Scholar] [CrossRef]
- Xu, Y.; Dai, Q.Y.; Lu, Y.G.; Zhao, C.; Huang, W.T.; Xu, M.; Feng, Y.X. Identification of ecologically sensitive zones affected by climate change and anthropogenic activities in Southwest China through a NDVI-based spatial-temporal model. Ecol. Indic. 2024, 158, 111482. [Google Scholar] [CrossRef]
- Xu, X.; Yan, Y.; Dai, Q.; Yi, X.; Hu, Z.; Cen, L. Spatial and temporal dynamics of rainfall erosivity in the karst region of southwest China: Interannual and seasonal changes. CATENA 2023, 221, 106763. [Google Scholar] [CrossRef]
- Lian, Y.; You, G.J.Y.; Lin, K.; Jiang, Z.; Zhang, C.; Qin, X. Characteristics of climate change in southwest China karst region and their potential environmental impacts. Environ. Earth Sci. 2014, 74, 937–944. [Google Scholar] [CrossRef]
- Liu, Z.; Zhang, Y. Vegetation cover change and its response to human activities in the southwestern karst region of China. Front. Ecol. Evol. 2024, 12, 1326601. [Google Scholar] [CrossRef]
- He, X.; Zhou, J.; Zhang, X.; Tang, K. Soil erosion response to climatic change and human activity during the Quaternary on the Loess Plateau, China. Reg. Environ. Change 2006, 6, 62–70. [Google Scholar] [CrossRef]
- Sysoev, A. Sensitivity Analysis of Mathematical Models. Computation 2023, 11, 159. [Google Scholar] [CrossRef]
- Ouyang, W.; Hao, F.; Skidmore, A.K.; Toxopeus, A. Soil erosion and sediment yield and their relationships with vegetation cover in upper stream of the Yellow River. Sci. Total Environ. 2010, 409, 396–403. [Google Scholar] [CrossRef] [PubMed]
- Xu, J.; Zhang, Y.; Huang, C.; Zeng, L.; Teng, M.; Wang, P.; Xiao, W. Forest restoration shows uneven impacts on soil erosion, net primary productivity and livelihoods of local households. Ecol. Indic. 2021, 134, 108462. [Google Scholar] [CrossRef]
- Fonseca, M.R.S.; Uagoda, R.E.S.; Chaves, H.M.L. Runoff, soil loss, and water balance in a restored Karst area of the Brazilian Savanna. CATENA 2022, 222, 106878. [Google Scholar] [CrossRef]
- Liang, P.; Wang, X.; Xu, Q.; Zhang, J.; Fang, R.; Fu, Z.; Chen, H. Lithology-mediated soil erodibility characteristics after vegetation restoration in the karst region of Southwest China. Land Degrad. Dev. 2023, 35, 1070–1086. [Google Scholar] [CrossRef]
- Jiang, Y.; Li, L.; Groves, C.; Yuan, D.; Kambesis, P. Relationships between rocky desertification and spatial pattern of land use in typical karst area, Southwest China. Environ. Earth Sci. 2009, 59, 881–890. [Google Scholar] [CrossRef]
- Yan, Y.; Dai, Q.; Yang, Y.; Lan, X. Effects of vegetation restoration types on soil erosion reduction of a shallow karst fissure soil system in the degraded karst areas of Southwestern China. Land Degrad. Dev. 2023, 34, 2241–2255. [Google Scholar] [CrossRef]
- Liu, M.; Han, G. Assessing soil degradation under land-use change: Insight from soil erosion and soil aggregate stability in a small karst catchment in southwest China. PeerJ 2020, 8, e8908. [Google Scholar] [CrossRef] [PubMed]
- Liu, Y.; Fang, H.; Huang, Z.; Leite, P.A.; Liu, Y.; López-Vicente, M.; Zhao, J.; Shi, Z.; Wu, G. Shrub encroachment increases soil erosion risk in hillside alpine meadows of the Qinghai-Tibetan Plateau, NW China. CATENA 2022, 222, 106842. [Google Scholar] [CrossRef]
- Fattet, M.; Fu, Y.; Ghestem, M.; Ma, W.; Foulonneau, M.; Nespoulous, J.; Bissonnais, Y.L.; Stokes, A. Effects of vegetation type on soil resistance to erosion: Relationship between aggregate stability and shear strength. CATENA 2011, 87, 60–69. [Google Scholar] [CrossRef]
- Leite, P.A.M.; Wilcox, B.P.; McInnes, K.J. Woody plant encroachment enhances soil infiltrability of a semiarid karst savanna. Environ. Res. Commun. 2020, 2, 115005. [Google Scholar] [CrossRef]
- Zeng, F.; Jiang, Z.; Shen, L.; Chen, W.; Yang, Q.; Zhang, C. Assessment of multiple and interacting modes of soil loss in the karst critical zone, Southwest China (SWC). Geomorphology 2018, 322, 97–106. [Google Scholar] [CrossRef]
- Fan, C.; Zhao, L.; Hou, R.; Fang, Q.; Zhang, J. Quantitative analysis of rainwater redistribution and soil loss at the surface and belowground on karst slopes at the microplot scale. CATENA 2023, 227, 107113. [Google Scholar] [CrossRef]
- Feng, S.; Wu, L.; Liang, B.; Wang, H.; Liu, H.; Zhu, C.; Li, S. Forestation does not necessarily reduce soil erosion in a karst watershed in southwestern China. Prog. Phys. Geogr. Earth Environ. 2020, 45, 82–97. [Google Scholar] [CrossRef]


| Description | Name | Source |
|---|---|---|
| Climate data | The daily data set of China’s ground climate data V3.0 | ftp://ftp.ncdc.noaa.gov/pub/data/noaa/isd-lite/ (accessed on 1 September 2023) |
| Soil data | World Unified Soil Database 1.1 (HWSD) | https://doi.org/10.12072/ncdc.westdc.db3647.2023 |
| DEM | GDEMV3 30M | https://lpdaac.usgs.gov/products/astgtmv003/ (accessed on 27 September 2024) |
| NDVI | MODIS | https://modis.gsfc.nasa.gov/ (accessed on 1 September 2023) |
| Land use data | 1990–2021 China 30 m Resolution Annual Land Cover Dataset and Its Dynamics | https://doi.org/10.5281/zenodo.4417810 |
| Stony desertification survey data and protected area data | Guizhou’s Third Rocky and Forestry Survey data | Guizhou Forestry Bureau |
| Cropland | Forest | Shrub | Grassland | Water | Snow/Ice | Barren | Impervious | |
|---|---|---|---|---|---|---|---|---|
| P | 0.23 | 0.24 | 0.23 | 0.15 | 0 | 0 | 1 | 0 |
| Influencing Factor | Contribution Rate % | Effect Factor | ||||
|---|---|---|---|---|---|---|
| NF | HA | NF | HA | EC | DF | EFFECT |
| NaSE > 0 | ASE > 0 | CRN = NaSE/SEM × 100 | CRH = ASE/SEM × 100 | CRN > CRH | NF | aggregate |
| CRN < CRH | HA | aggregate | ||||
| CRN = CRH | HA&NF | equivalent | ||||
| ASE = 0 | CRN = 100 | CRH = 0 | CRN > CRH | NF | aggregate | |
| ASE < 0 | CRN = (1 − CRH) × 100 | CRH = ASE/(NaSE + |ASE|) × 100 | CRN > 1 | NF | aggregate | |
| CRN = 100 | CRH = −100 | CRN = |CRH| | HA | alleviation | ||
| NaSE = 0 | ASE > 0 | CRN = 0 | CRH = 100 | CRN < CRH | HA | aggregate |
| ASE = 0 | CRN = 0 | CRH = 0 | CRN = CRH | - | unaffected | |
| Jan | Feb | Mar | Apr | May | Jun | Jul | Aug | Sept | Oct | Nov | Dec | |
|---|---|---|---|---|---|---|---|---|---|---|---|---|
| 2015 | −0.37 | 0.54 ** | 0.48 | 0.68 ** | 0.28 | −0.29 | 0.31 ** | 0.10 | −0.39 | 0.36 | 0.36 ** | −0.15 |
| 2020 | −0.37 | 0.10 | 0.61 ** | 0.71 ** | 0.59 ** | 0.25 | 0.39 | −0.05 | −0.27 | 0.75 ** | −0.52 | −0.52 |
| Monitoring Station (2019) | RUSLE (2020) | ||||||||
|---|---|---|---|---|---|---|---|---|---|
| Site | Slope ° | Vegetation Type | Vegetation Cover % | Erosion Modulus t/(ha·a) | Slope ° | Vegetation Type | Vegetation Cover % | Erosion Modulus t/(ha·a) | |
| Surface | Surface and Subsurface | ||||||||
| Dingjiazhai | 15 | Pyrus nivalis | 50 | 13.07 | 79.6 | 15 | Bush | 50 | 46.63 |
| Yuming | 23 | Natural vegetation | 50 | 0.38 | 2.33 | 23 | Arbor | 50 | 3.53 |
| Baima | 15.8 | Fallow land | 23 | 0.48 | 2.91 | 15 | Grass | 39 | 2.675 |
| Jingmen | 15 | Privet microphyll | 50 | 1.86 | 0 | 17 | Bush | 50 | 0 |
| Soil Erosion Models | 2015 | 2020 |
|---|---|---|
| 0–5 | 7.75% | 6.39% |
| 5–25 | 24.95% | 18.77% |
| 25–50 | 25.28% | 24.05% |
| 50–80 | 18.74% | 20.80% |
| 80–150 | 17.23% | 21.37% |
| 150> | 6.05% | 8.62% |
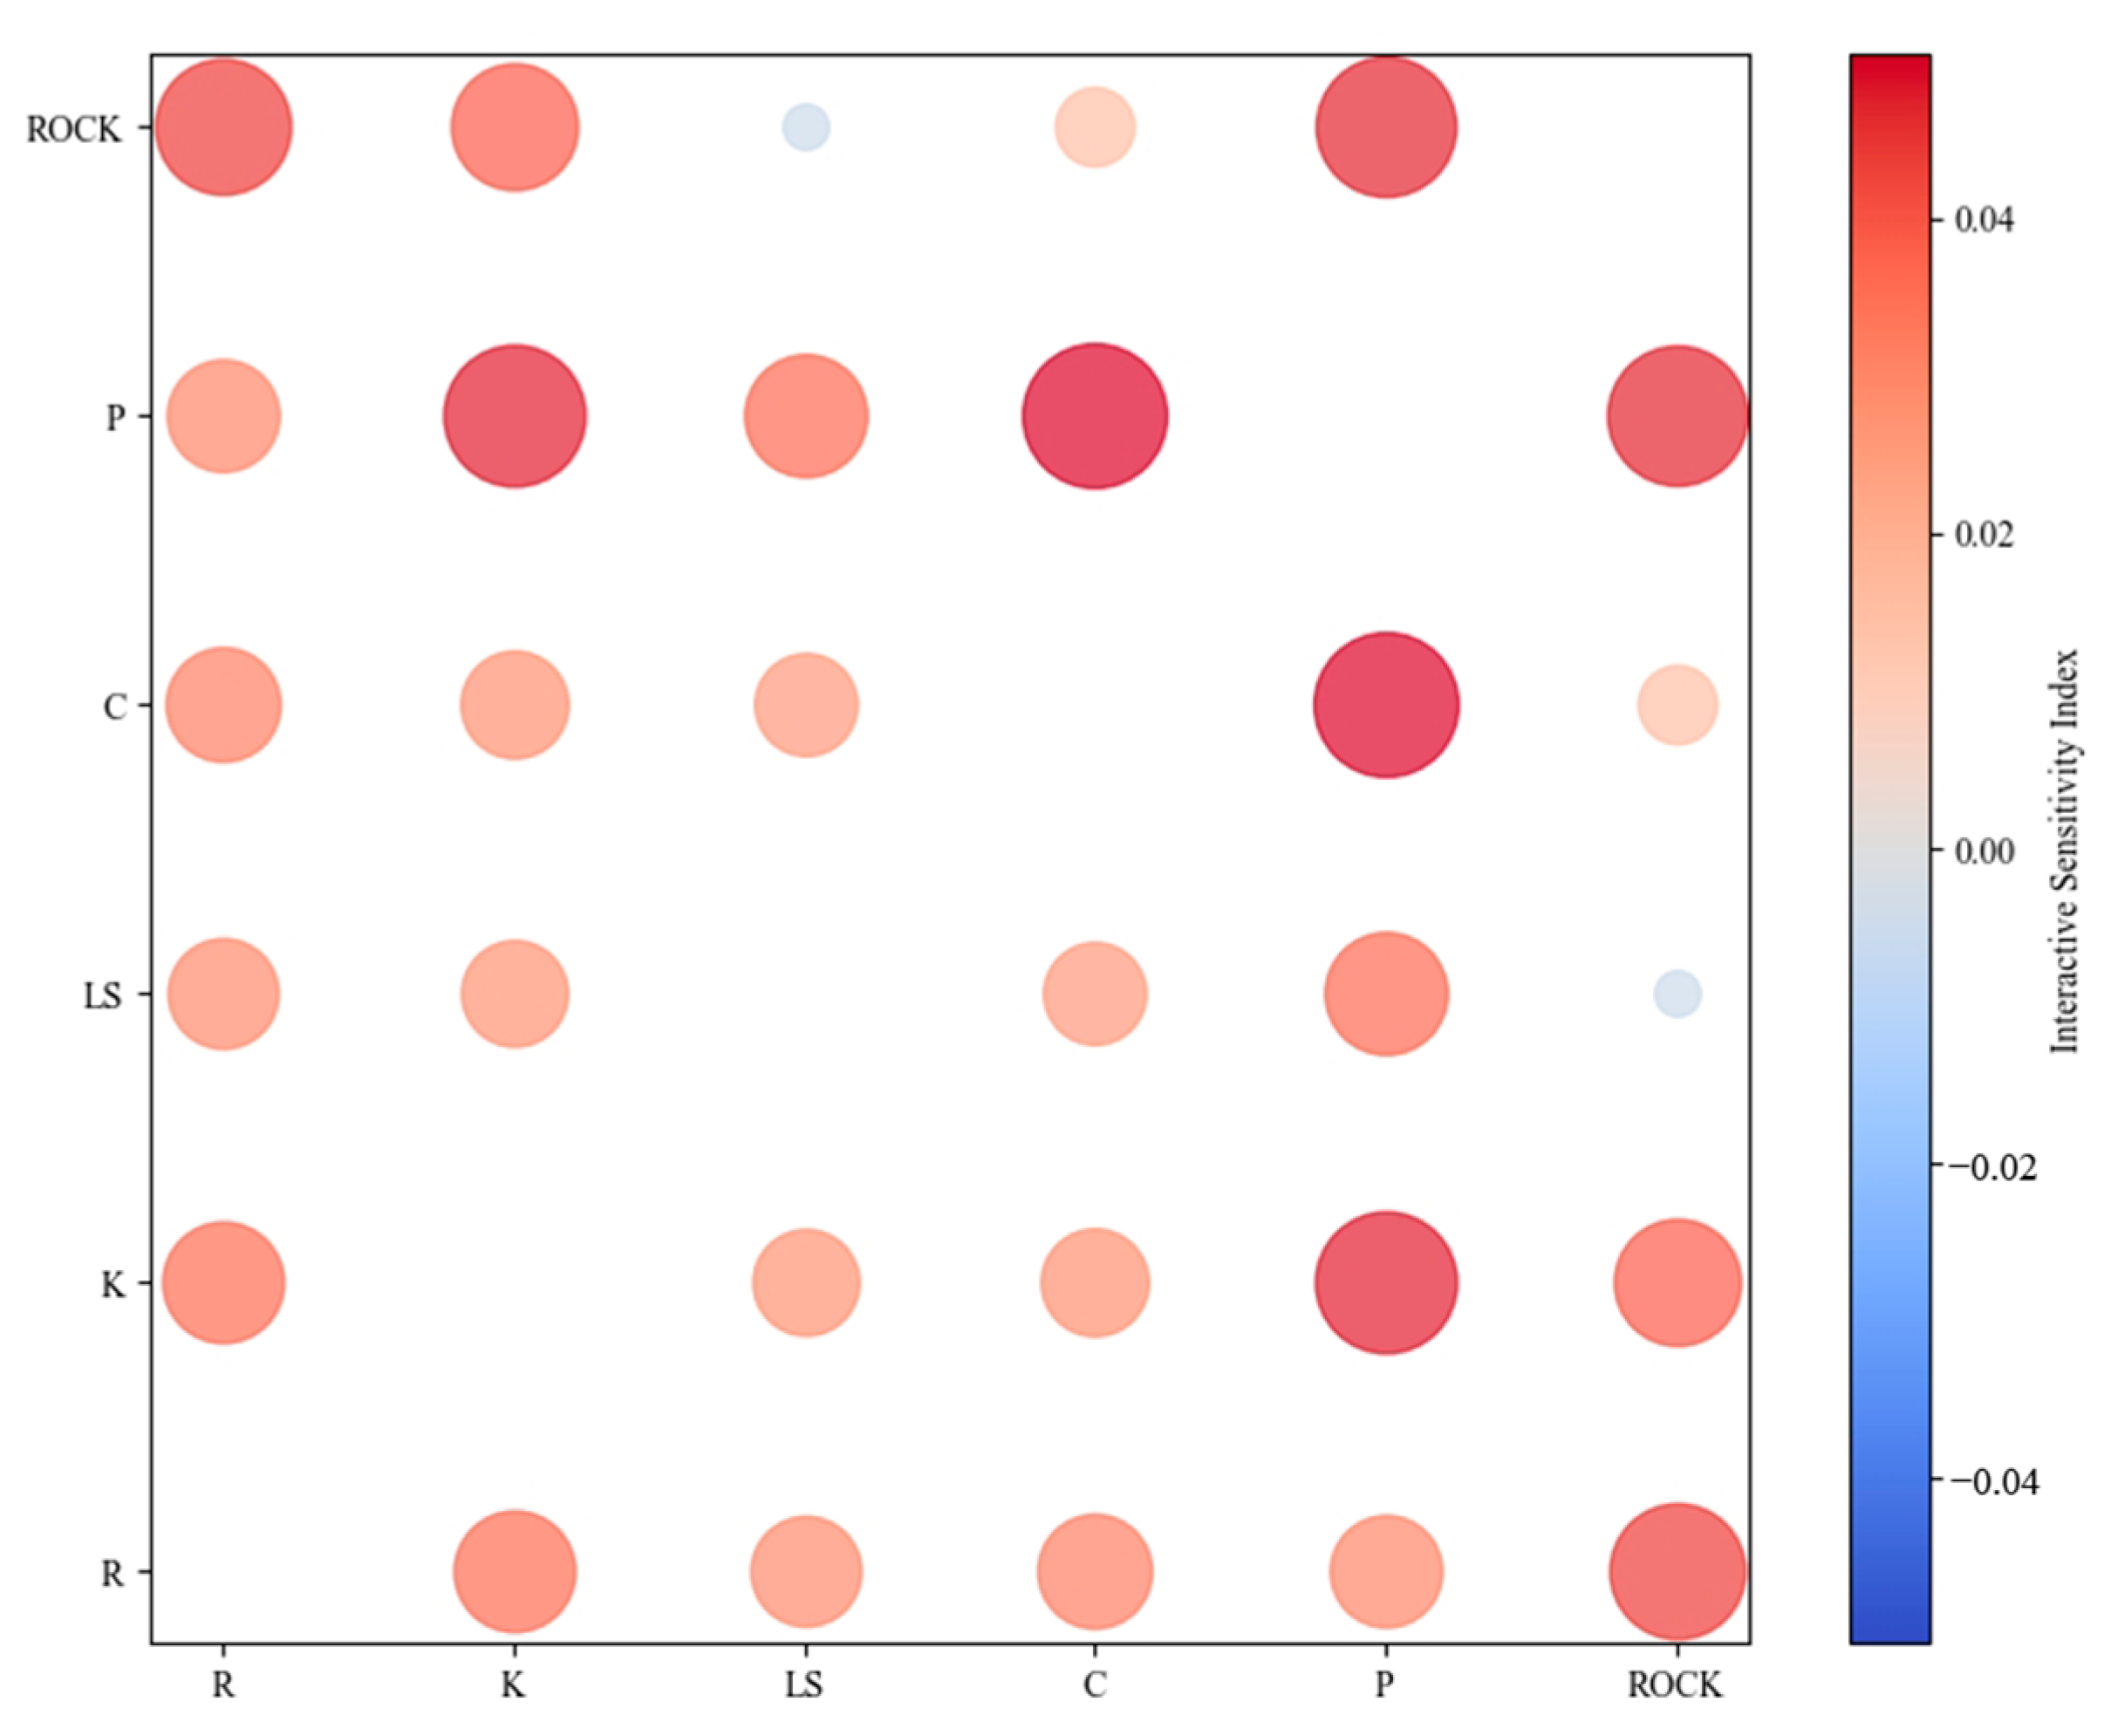
| Factor | First-Order Sensitivity Index | Total Sensitivity Index |
|---|---|---|
| R | −0.0008 | 0.0423 |
| K | 0.0987 | 0.3064 |
| LS | 0.1041 | 0.3334 |
| C | 0.0984 | 0.3009 |
| P | 0.0754 | 0.2935 |
| ROCK | 0.1056 | 0.3445 |
Disclaimer/Publisher’s Note: The statements, opinions and data contained in all publications are solely those of the individual author(s) and contributor(s) and not of MDPI and/or the editor(s). MDPI and/or the editor(s) disclaim responsibility for any injury to people or property resulting from any ideas, methods, instructions or products referred to in the content. |
© 2024 by the authors. Licensee MDPI, Basel, Switzerland. This article is an open access article distributed under the terms and conditions of the Creative Commons Attribution (CC BY) license (https://creativecommons.org/licenses/by/4.0/).
Share and Cite
Gao, X.; Yang, P.; Zhou, Z.; Zhu, J.; Yang, C. Human and Natural Activities Effects on Soil Erosion in Karst Plateau Based on QAM Model: A Case Study of Bijie City, Guizhou Province, China. Land 2024, 13, 1841. https://doi.org/10.3390/land13111841
Gao X, Yang P, Zhou Z, Zhu J, Yang C. Human and Natural Activities Effects on Soil Erosion in Karst Plateau Based on QAM Model: A Case Study of Bijie City, Guizhou Province, China. Land. 2024; 13(11):1841. https://doi.org/10.3390/land13111841
Chicago/Turabian StyleGao, Xiong, Pingping Yang, Zhongfa Zhou, Jinqi Zhu, and Changxin Yang. 2024. "Human and Natural Activities Effects on Soil Erosion in Karst Plateau Based on QAM Model: A Case Study of Bijie City, Guizhou Province, China" Land 13, no. 11: 1841. https://doi.org/10.3390/land13111841
APA StyleGao, X., Yang, P., Zhou, Z., Zhu, J., & Yang, C. (2024). Human and Natural Activities Effects on Soil Erosion in Karst Plateau Based on QAM Model: A Case Study of Bijie City, Guizhou Province, China. Land, 13(11), 1841. https://doi.org/10.3390/land13111841