Article

Terrain Analysis According to Multiscale Surface Roughness in the Taklimakan Desert †

by
Sebastiano Trevisani
1,* and
Peter L. Guth
2
1
Dipartimento di Culture del Progetto, University Iuav of Venice, Terese-Dorsoduro 2206, 30123 Venice, Italy
2
Department of Oceanography, US Naval Academy, Annapolis, MD 21402, USA
*
Author to whom correspondence should be addressed.
This paper is partially based on the research results presented in our extended abstract published in Trevisani, S.; Guth, P.L. Landscape according to surface roughness: Experimenting in the Taklimakan Desert. In Proceedings of the Geomorphometry Conference, Iași, Romania, 10–14 July 2023.
Land 2024, 13(11), 1843; https://doi.org/10.3390/land13111843
Submission received: 17 September 2024 / Revised: 28 October 2024 / Accepted: 3 November 2024 / Published: 5 November 2024
(This article belongs to the Section Land, Soil and Water)

Abstract

:
Surface roughness, interpreted in the wide sense of surface texture, is a generic term referring to a variety of aspects and scales of spatial variability of surfaces. The analysis of solid earth surface roughness is useful for understanding, characterizing, and monitoring geomorphic factors at multiple spatiotemporal scales. The different geomorphic features characterizing a landscape exhibit specific characteristics and scales of surface texture. The capability to selectively analyze specific roughness metrics at multiple spatial scales represents a key tool in geomorphometric analysis. This research presents a simplified geostatistical approach for the multiscale analysis of surface roughness, or of image texture in the case of images, that is highly informative and interpretable. The implemented approach is able to describe two main aspects of short-range surface roughness: omnidirectional roughness and roughness anisotropy. Adopting simple upscaling approaches, it is possible to perform a multiscale analysis of roughness. An overview of the information extraction potential of the approach is shown for the analysis of a portion of the Taklimakan desert (China) using a 30 m resolution DEM derived from the Copernicus Glo-30 DSM. The multiscale roughness indexes are used as input features for unsupervised and supervised learning tasks. The approach can be refined both from the perspective of the multiscale analysis as well as in relation to the surface roughness indexes considered. However, even in its present, simplified form, it can find direct applications in relation to multiple contexts and research topics.

Graphical Abstract

1. Introduction

Surface roughness analysis, interpreted in the wide sense of surface texture and hence related to the spatial variability structure of surfaces, is a general concept that is useful for a wide range of applications in many fields of science and technology. Among these, there are multiple examples of applications in environmental engineering, Earth sciences, forestry, planetary morphology, surface metrology, and others [1,2,3,4,5,6,7,8,9,10]. In Earth sciences and ecological studies, the analysis of surface roughness is attracting wide interest; this growth is fueled by the ever-growing quantity of digital topographic data, increased computing power, and increased environmental concerns, requiring the detailed and multitemporal characterization of solid Earth surface morphology not only on land but also in submarine environments [11]. Even in planetary geomorphology, there is a growing interest in the topic (e.g., [12]), in addition to the fact that in this context surface roughness was considered a key element decades ago for evaluating spacecraft landing sites [13].
In Earth sciences and in geographical information systems (GIS) communities, there is no consensus on the definition and terminology concerning surface roughness analysis (e.g., [7,14]). The majority of authors implicitly use the term “roughness” as a synonym of surface texture, as intended in this work. However, similarly to the surface metrology discipline, this term could be used to refer to a specific aspect of the surface texture related to the fine-grain spatial variability. Even from the perspectives of algorithms, there is a lack of standards in formulations, and, often, users misuse or misinterpret roughness indexes (RIs). A first frequent misunderstanding is that it is not meaningful to refer to “the roughness index”; conversely, there is a wide set of RIs capable of describing specific aspects of surface roughness. Frequently, users are unaware of the limitations and purposes of specific roughness indexes. For example, popular simple RIs, such as the standard deviation of elevation and the topographic ruggedness index (TRI [15]), are often used without acknowledging that, given their formulations, are all proxies of the slope [16]. This implies that when these indexes are computed on a perfectly flat planar surface but with a steep slope would provide a high roughness, and most of the times this is not the intended result. Moreover, the correlation with the slope can be very high, and hence the information provided is redundant (e.g., [16,17]). This may lead to the wrong conclusion that “roughness” is not important in the process being analyzed just because an unsuitable roughness index has been selected. Another misuse is related to not recognizing that indexes, such as vector dispersion of normal vectors to the surface and standard deviation of residual DEM [14,17,18], even if they have a much lower dependency on the slope, provide a compound measure of roughness, without the ability to describe specific aspects and scales of roughness. This behavior can be or cannot be a desired property, depending on the study objectives and the characteristics of the morphology being analyzed. Other indexes can be regarded as directional RIs because they compute the roughness in a specific direction, such as the standard deviation of the slope or the flow directional roughness [19], which consider the gradient direction. Again, the selection of these indexes should be justified in relation to the aims of the geomorphometric characterization, e.g., the modeling and analysis of surface flow processes. Finally, a further issue is the fact that a great part of popular roughness indexes, including the ones cited, compute roughness metrics using mean-alike estimators, and hence these are very sensitive to non-stationarity in the spatial field, including outliers and sharp morphological variations. For this reason, the application of these indexes to high-resolution topographic data often leads to a blurred and noisy representation of surface roughness [20]. Accordingly, robust estimators should be adopted, or the input DEM should be preprocessed by means of some filtering approach. However, DEM preprocessing is a delicate step that may also filter out a real component of the surface roughness.
These considerations lead to the development and adaptation of geostatistical-based estimators for roughness analysis [14,20,21] in high-resolution geomorphometry and image analysis. In general, these methodologies are applied to DEMs that are a 2.5D representation of the surface morphology (i.e., a projection on a horizontal plane), even if the algorithms could also be adapted for the analysis of true 3D surfaces [5]. It should be highlighted that given the characteristics of conventional 2.5D DEMs, a projected roughness is computed and not the true surface roughness; as such, it is kind of an apparent roughness, i.e., as perceived looking at the surface from above. A 2.5D DEM is analogous to an image, and, in fact, surface texture indexes are totally analogous to image texture indexes [22,23], and what it is changing is the interpretation of the indexes, not the mathematics behind them. From this perspective, the geostatistical algorithms for surface/image texture analysis have clear connections with other data analysis approaches, such as fractal analysis, spectral analysis, wavelets, and pattern recognition [24,25,26,27]. Geostatistical approaches are specifically tailored for the analysis of the spatial variability of spatial fields, and the indexes provided are easily interpretable and easily implemented. The geostatistical approaches provide ample flexibility and the possibility to derive ad hoc indexes catching specific features and scales of surface roughness or of the image texture. However, this flexibility comes at the price of many user decisions concerning calculation parameters, and this makes it less attractive for many users. For this reason, a simplified yet informative geostatistical algorithm for the analysis of surface/image texture has been designed [14].
This case study aims to highlight the potentialities of the simplified geostatistical algorithm, based on the median of absolute differences of order 2 (MADk2), for the multiscale analysis of surface roughness or, more generally, surface texture. The algorithm can be applied to any gridded data, such as satellite imagery; in this context, the approach would provide a multiscale analysis of image texture. The algorithm is designed for the analysis of surface roughness and image texture, with opensource implementations [28] coded in R (version 4.4.1) as well as in Python (2.7) for ArcMap (ArcGis Desktop version 10.8.2, 1995–2021 Esri, Published in the Redlands, CA, USA). The algorithm has been devised to provide an easy to use yet powerful geostatistical approach for the spatial variability analysis, reducing at a minimum level the user-dependent choices. Differently from conventional geostatistical approaches, it bypasses the detrending procedure; the effect of the local slope/trend is filtered out, exploiting the increments of the order k, a well-known approach in spatial statistics to filter out the trend of the order k − 1 [14,21]. The algorithm permits calculating short-range roughness indexes, where short-range means that the spatial variability is computed considering differences between pixels at a short distance (e.g., lags of 1 or 2 pixels). The developed implementation permits calculating two key aspects of short-range roughness: omnidirectional roughness (OR) and roughness anisotropy (RA). Concerning RA, the algorithm provides the strength of anisotropy (ranging from 0, no anisotropy, to 1, maximum anisotropy) and the direction of maximum spatial continuity (e.g., the direction of a lineament). By combining this algorithm with upscaling and smoothing approaches, it is possible to perform a multiscale analysis of roughness by partitioning the information according to the different scales (e.g., [6,17,18]). It should be highlighted that the present implementation is conceived for the analysis of DEMs and imagery on a projected coordinate system. For working in geographical coordinate systems, custom kernels can be designed to consider the irregular and latitude-dependent grid spacing inherent to the geographical representation of gridded data, such as 1 arc second global DEMs [29].
To show the potential of the approach, a portion of the Taklimakan desert (China) has been selected. This study area is well-suited to these purposes because of the multiscale characteristics of the sand dune fields and the presence of anisotropic and heterogenous morphological features. Moreover, the geomorphological interpretation of the morphological features is relatively straightforward. The main morphological domains include sand dune fields with different spatial patterns, mountain ridges with outcropping bedrock, flat areas with a minor presence of dunes, and fluvial environments. The transitions between the different geomorphological domains are in some areas gradual and in others abrupt. In addition, the study area is almost without vegetation and anthropic cover. To facilitate the reproducibility of the results, open and freely available data have been used. The satellite-derived Esa-Copernicus GLO-30 DEM (COP) https://doi.org/10.5270/ESA-c5d3d65 (accessed on 2 November 2024), which can be safely considered a digital terrain model (DTM) in this context, and Sentinel-2 imagery have been used to integrate the geomorphological interpretation. The informative content of the calculated multiscale RIs (MRIs) is then analyzed and exploited both by means of visual analysis as well as unsupervised and supervised machine learning (ML) experiments.

2. Materials and Methods

2.1. Study Area and Digital Elevation Model

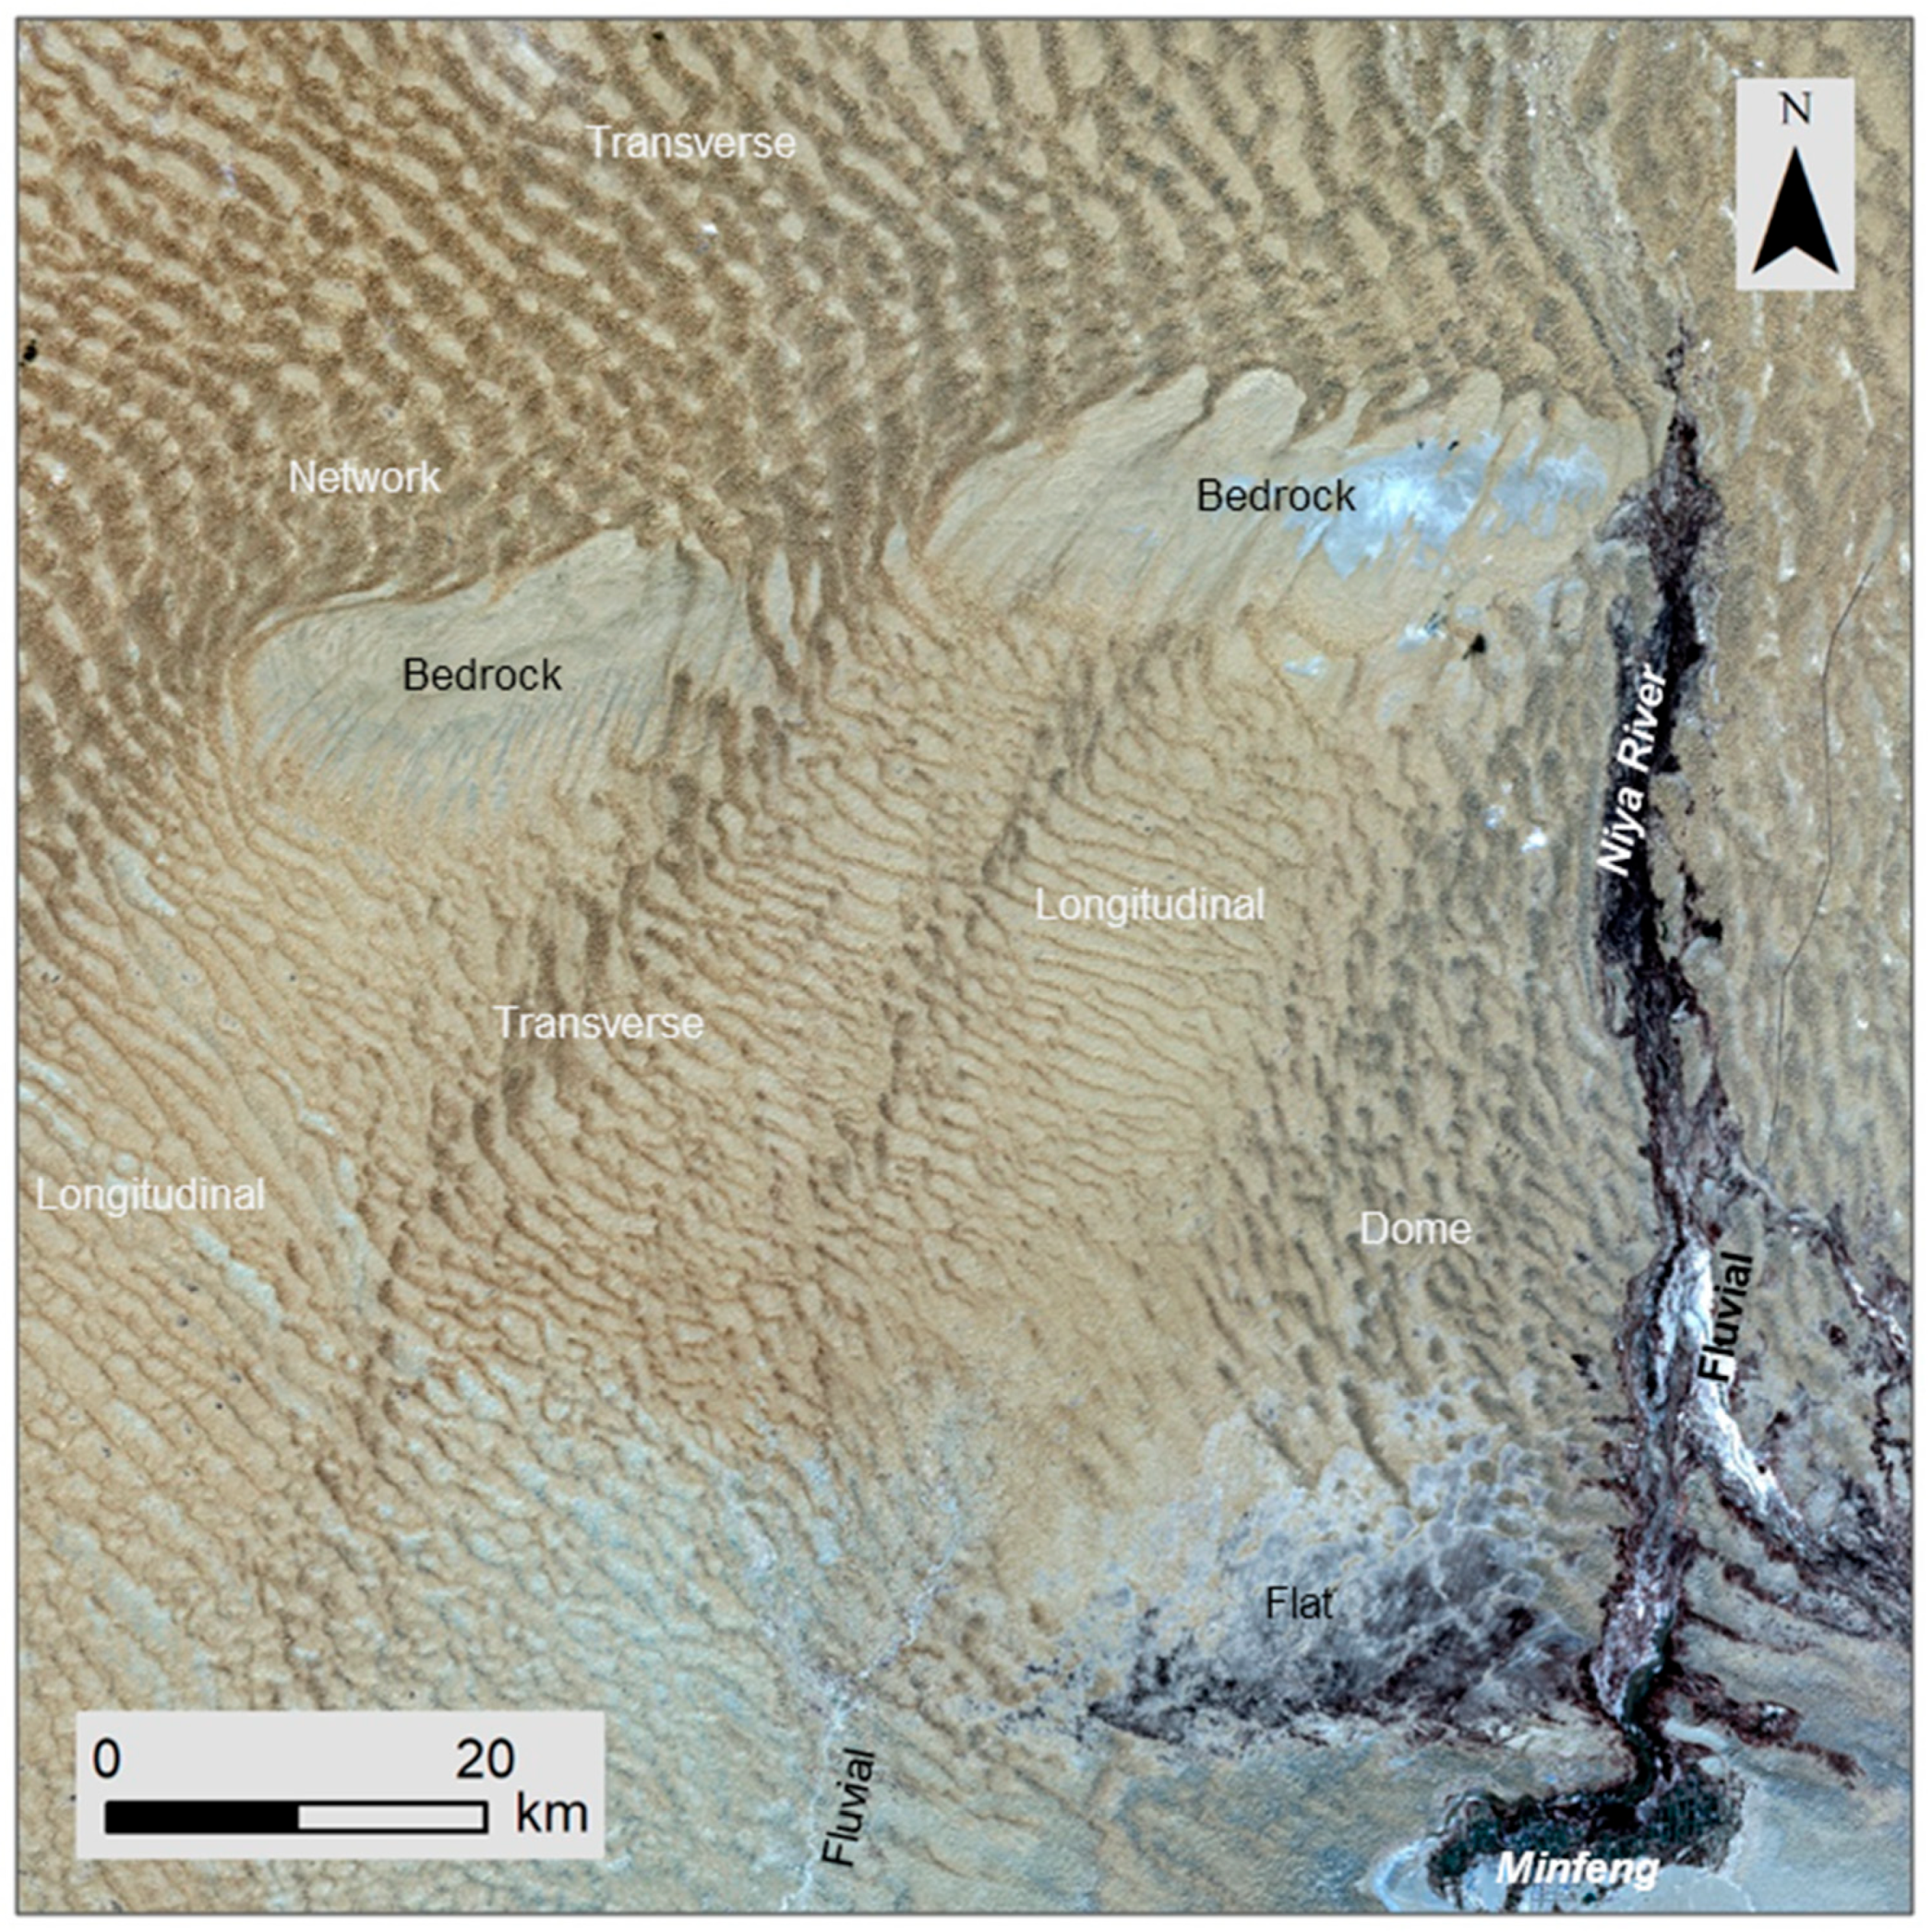
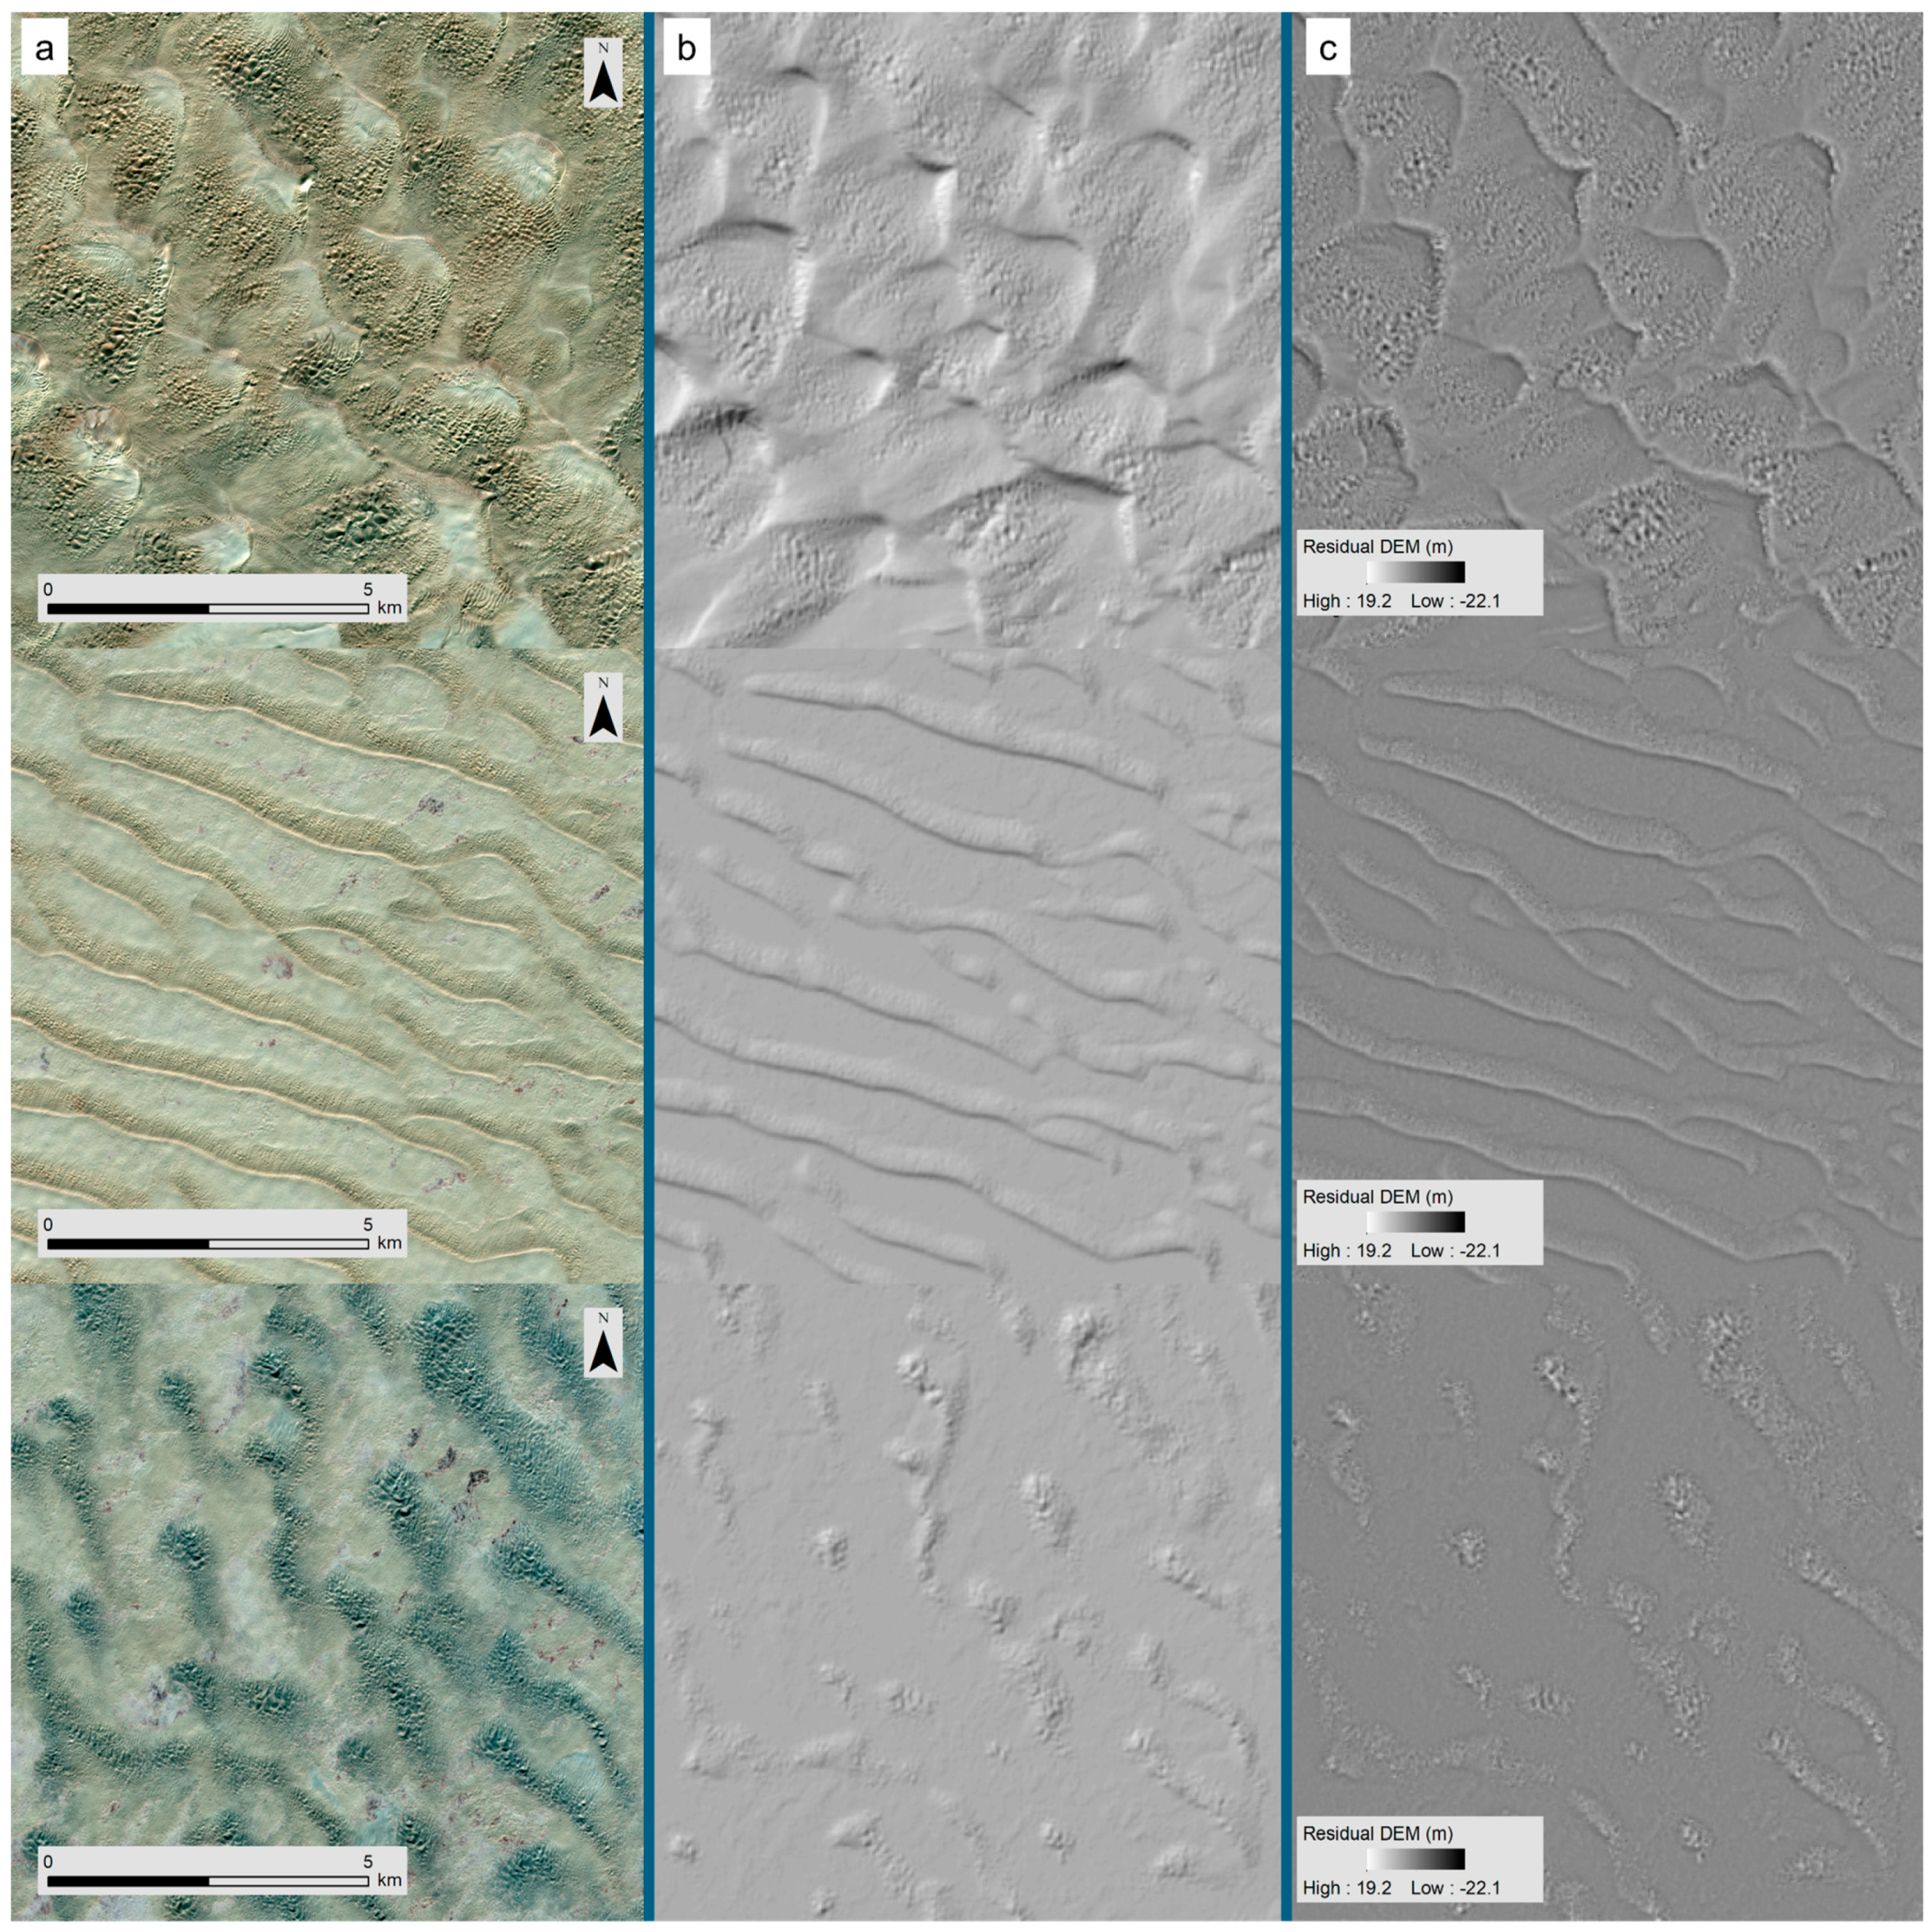
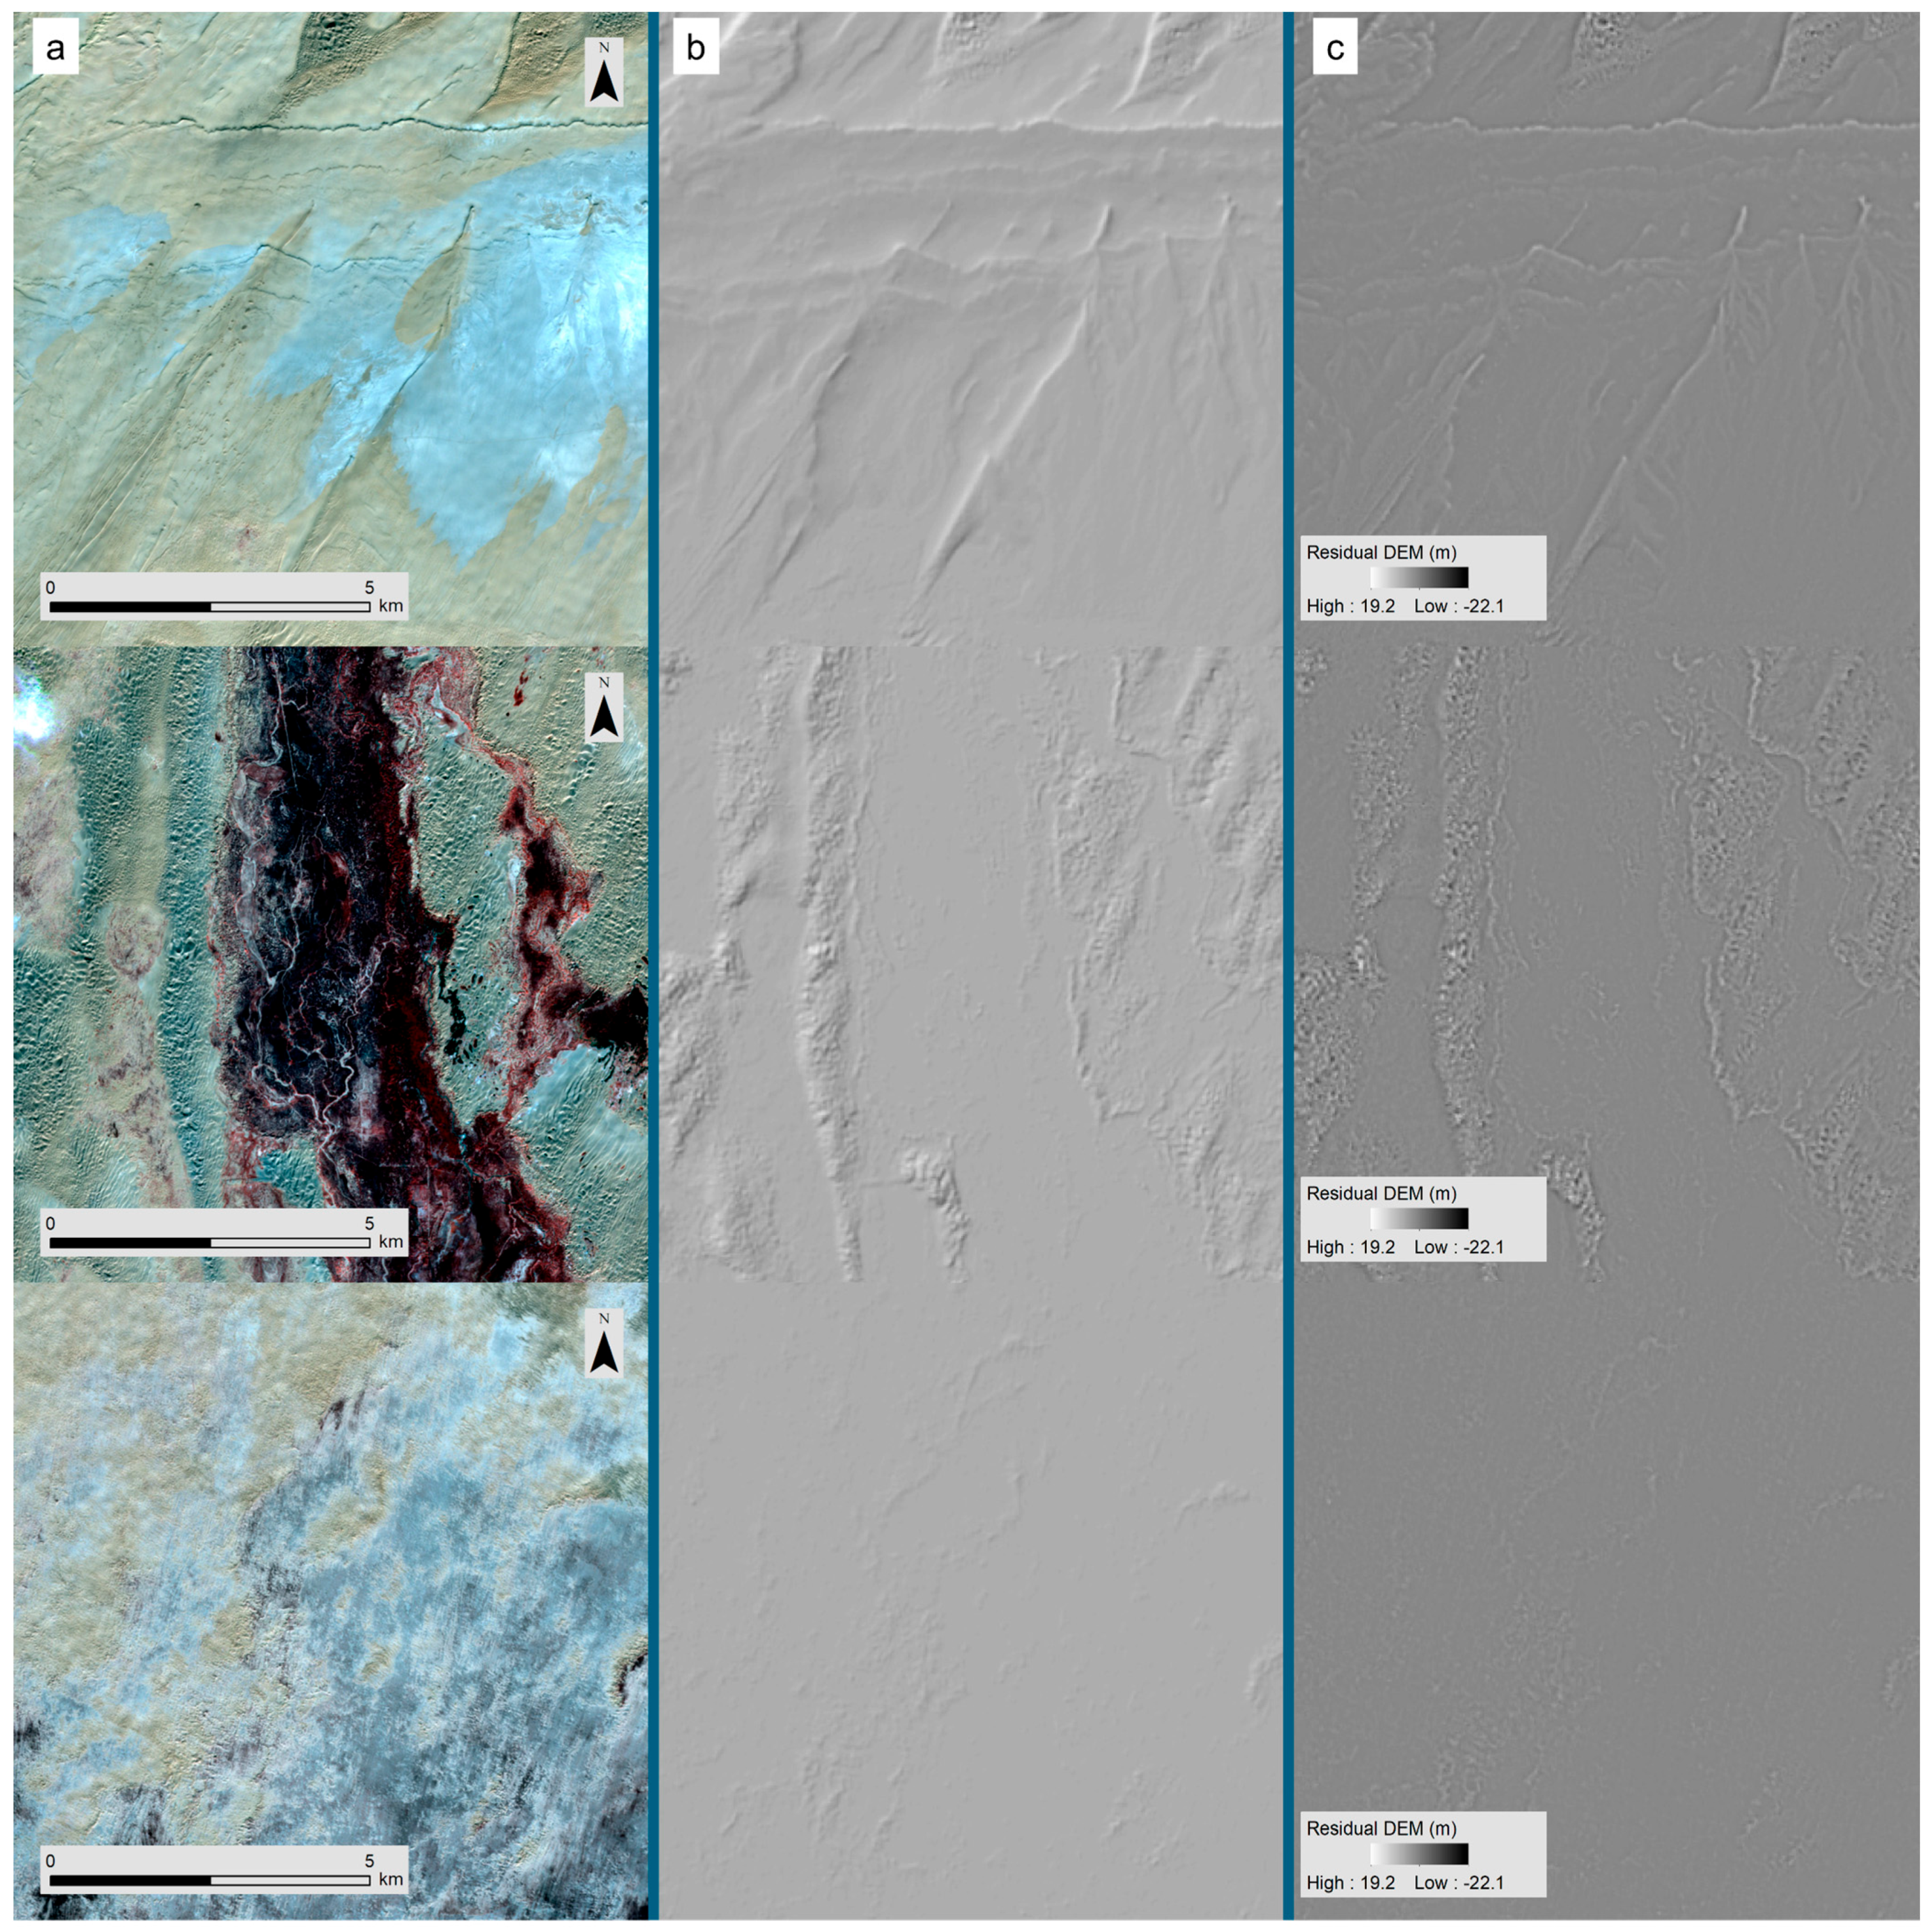
The study area is in the Taklimakan desert (China), just north of Minfeng County and east of the Keriya river, with elevations ranging from 1200 to 1500 m (Figure 1 and Figure 2). Taklimakan desert is one of the largest deserts in China, and it has been the object of several studies (e.g., [30,31,32,33,34]). The area of interest (AOI) has an extent of approximately 10,000 km2, covering an area mostly without vegetation and anthropic cover, except for the lower SE corner, where some agriculture fields and anthropic features are present. The morphology of the area (Figure 1 and Figure 2) is characterized by complex and multiscale dune fields with different spatial patterns, including network dunes, transverse dunes, longitudinal dunes, and dome-shaped dunes (Figure 3). The morphology and dynamics of the dune fields are profoundly influenced by the mountain ridge elongated along the west–east direction where the bedrock is shallow and outcropping (Figure 4). This mountain ridge creates a boundary marking a relatively abrupt transition between the field of network and transverse dunes in the north and the complex dune fields in the south. The southern dune fields are heterogenous, and the patterns are partly influenced by the morphology of the mountain ridge. In the wind-shadowed area by the two main mountain reliefs, large longitudinal and transverse dune fields prevail, while downwind [32] of the saddle in the mountain ridge there is some morphological mixing with the patterns of the network dune field of the north. Then, moving towards the fluvial area (Figure 3 and Figure 4), dome-shaped dune fields are present. In the southern parts of the study area, there is an almost flat area with a minor presence of eolian features (Figure 4).
The geomorphometric analysis is conducted using the COP DEM, which, as reported in different studies [35,36,37], is the most promising global DEM currently available. ALOS DEM [38] has been tested in consideration of its applications in desert environments [39]; however, in this area, it is characterized by several artifacts and spurious roughness. The application of satellite-derived global DEMs in desert environments has shown some level of success (e.g., [39,40,41]), and the new COP DEM with its improved quality seems to be an optimal candidate for moving forward in this direction. The COP, originally available at 1 arc second resolution, has been reprojected on UTM zone 44N on a regular grid with a resolution of 30 m by means of the ArcMap projecting tool using bilinear interpolation. It should be noted that the analysis of spatial variability indexes, such as roughness metrics, can be influenced by the reprojection process or by the necessary corrections that should be performed when working directly with geographical coordinates, such as in the computation of the slope [29]. The percentage of DEM gap filling or editing in the area is low (approximately 3%, with gaps mostly filled by SRTM 30 m), and the visual analysis of hill shade and of the residual DEM (also known as TPI [42,43,44]) does not reveal evident artifacts. The residual DEM was derived by subtracting a smoothed version of the COP DEM from the original COP DEM. The smoothed version was obtained using moving window averaging with a circular window with a 3 pixel radius. The analysis is integrated with satellite imagery from Sentinel-2 sensors (bands 2, 3, 4, 8, at 10 m resolution).

2.2. Simplified Multiscale Geostatistical Approach

The surface roughness/image texture algorithm proposed in this work is the result of several efforts towards the adaptation and simplification of geostatistical spatial variability indexes for complex spatial fields. The complexity of spatial fields can be represented by several challenging characteristics from the perspective of signal analysis, e.g., non-stationarity, abrupt transitions, hotspots, multi-fractality, presence of white noise and spatially correlated noise, presence of spatial discontinuities, etc. These characteristics are common, for example, in geomorphometric analysis when analyzing high-resolution DEMs or in remote sensing when analyzing satellite imagery. For a full description of the approaches, the readers can refer to [14,20]; here, the main formulation and characteristics of the approach are reported. In the geomorphometric context, bivariate geostatistical estimators of spatial continuity [45], such as the variogram and the madogram, can represent a multidirectional and multiscale fingerprint of surface fine-scale morphology [4], and the approach could be extended to more complex spatial continuity estimators, such as multipoint geostatistics [27]. The main issue with conventional geostatistical estimators, such as the variogram and the madogram (Equations (1) and (2)), is that they are highly sensitive to non-stationarity; hence, the description of the surface/image texture can appear blurred.
γ ( h ) = 1 2 N ( h ) α = 1 N ( h ) [ z ( u α ) z ( u α + h ) ] 2 = 1 / 2 1 N ( h ) α = 1 N ( h ) Δ 2 ( h ) α = 1 / 2 m e a n ( Δ   2 ( h ) )
where
Δ ( h ) α = z u α z u α + h ,
and h is the separation vector (lag) between two locations (u), z ( u ) is the value of the variable of interest in the location u (e.g., elevation, residual elevation, band intensity, etc.), and N ( h ) is the number of point pairs with a separation vector h found in the search window considered.
The equation of the variogram can be generalized to a wider set of functions:
γ ( h ) p = 1 2 N h α = 1 N h | z u α z u α + h | p = 1 2 m e a n Δ h p
With p = 2, it is the variogram, and with p = 1, it is the madogram; the higher the exponent, the greater the sensitivity to outliers of the spatial continuity index. However, even with a small exponent, the sensitivity to contamination is high due to the use of the mean as the estimator. For this reason, in the formulation of MAD (Equation (3)), the median is adopted as the estimator of the central tendency [46]. The median is a non-parametric estimator much less sensitive to contamination than the mean and with many other positive characteristics for texture analysis (see [20]). The MAD estimator is defined in this way:
M A D h = | Δ ( h ) α = m e d i a n |
In the context of geomorphometry, the interpretation of MAD is immediate. For a given separation vector h (lag) and a given search window, MAD provides the median absolute differences in (residual) elevation between the points separated by vector h. Both variogram estimators and the MAD should be applied to a detrended DEM; otherwise, they would violate the underlying assumptions of stationarity, and, above all, they would be another proxy of the slope, such as TRI. The problem with detrending is that there are multiple ways to derive a detrended surface, changing, for example, the level of smoothing adopted for deriving it. This provides flexibility to users, but it also increases the complexity of the approach and induces subjectivity in selecting the different settings of the calculation parameters. For this reason, a simplified approach not requiring user intervention has been devised using increments of order 2, i.e., considering differences of differences, which filter out automatically a trend of order 1, i.e., a planar surface. This kind of trend is a reasonable approximation when considering short lag distances (e.g., max 2 pixels) in most conditions.
The simplified geostatistical algorithm MADk2, as currently implemented [14,28], characterizes two main aspects of short-range surface roughness: omnidirectional roughness (OR) and roughness anisotropy (RA). OR is the mean of the short-range MADs calculated in four directions (the two cardinals and the two diagonals). The RA is characterized by two parameters: the strength, from 0 (no anisotropy) to 1 (maximum anisotropy), and the direction of maximum continuity (a geographical angle). The algorithm is devised for calculating RIs for lag distances of 1 and 2 pixels; however, it is easily adaptable for multiscale analysis by performing the calculation at multiple resolutions of the input DEM (e.g., [18,47]). The approach is relatively simple, and it consists of upscaling (intended here as coarsening the resolution) the input DEM (or image) and calculating the RIs at each resolution level. According to the relationship between dispersion variance and the spatial support [45], upon reducing the resolution, the intra-pixel spatial variability is filtered out, and longer distances between pixels’ centers are considered. The same approach can be applied to any geomorphometric derivatives, as well [48]. The upscaling can be performed according to different approaches, from the simplest one based on pixel aggregation via averaging to Gaussian filtering and wavelet-based approaches [48,49,50]. Here, we adopt a simple approach based on pixel aggregation via averaging because it conforms better to the change in spatial support approaches performed in geostatistics, and the impact on dispersion variance [45] is easily predicted. For this study, the approach permits us to convey the intended message.
The coarsening of the original DEM resolution has been conducted via simple pixel aggregation using the mean as the estimator. The following coarsening factors of the original pixel (30 m) have been selected: 1, 2, 4, 8, 16, and 32. Accordingly, the DEMs’ resolution ranges from 30 m to 960 m (further referred to as levels L1–L32), and the lag distance ranges from 60 m to 1920 m. For each of the 6 levels, L1–L32, the short-range RIs, OR, and RA have been calculated and then resampled via bilinear interpolation to the original resolution at 30 m.
Most of the computations have been computed in the R statistical programming environment. Saga GIS 9.3 [51] has been adopted for the classification of the landscape according to roughness indexes by means of the K-means clustering method. ArcMap has been deployed for data management and the creation of the maps presented here. Whitebox for R [52,53] has been used to compute the slope and the curvature indexes.

2.3. Unsupervised and Supervised Learning

In addition to the visual analysis of multiscale RIs, well-known unsupervised and supervised ML approaches have been adopted to highlight the informative content of multiscale roughness analysis. In both approaches, the computed multiscale RIs represent input features [54] for the ML.
The aim of the unsupervised learning approach is to show the ability of MRIs to characterize the landscape from the geomorphometric perspective. After testing various unsupervised clustering algorithms (K-means, Isodata, and DBscan, [54,55]), the K-means clustering of normalized input features has been adopted. K-means has been selected for its simplicity, for the well-known algorithm, and because the definition of clusters is based only on the data features space without any forcing on the spatial contiguity of clusters or on the number of samples in each cluster. Accordingly, the spatial patterns resulting from clustering are dependent exclusively on the characteristics of input features (i.e., multiscale RIs). For performing the clustering analysis, both the R packages NbCLust [56] and Factoextra and the SAGA GIS have been used.
For supervised learning, a simple predictive experiment has been designed consisting of the prediction of the crest lines of the large dunes [39,57]. A random forest (RF) algorithm has been adopted [58] using the R package randomForest (https://cran.r-project.org/package=randomForest, accessed on 2 November 2024), which is the implementation in R of the original code of Breiman [58]. According to the conventional approach, the reference dataset has been split into training (80%) and testing (20%) datasets. Moreover, a further evaluation has been performed in a unseen area not considered in testing and training, where the crest lines have been manually digitized. The RF has been chosen because it is a benchmark approach in ML, it is very well-known in its behavior, and it is easily interpretable [59], especially when providing information on input features’ importance.

3. Results and Discussion

3.1. Multiscale Analysis of Surface Roughness

MRIs have been computed considering a lag distance of two pixels; this lag has been chosen to better represent anisotropy and to filter out very short wavelength noise present in the projected DEM. The OR and RA strengths have been considered. It is worth noting that the RA direction (Figure 5) has been excluded as it is not a rotation invariant metric; however, this metric could be extremely useful for studies focusing on the orientation of dunes’ crest lines (e.g., [32]).
The selected RIs have been computed at levels L1 (30 m resolution) to L32 (960 m resolution), derived according to the simplified upscaling approach described in Section 2.2. The purpose here is to show how even a very simple multiscale approach based on RIs can be highly informative. However, the approach can be refined in multiple respects, including the upscaling function, the transition between levels, and the possibility of considering overlapping windows in the upscaling process.
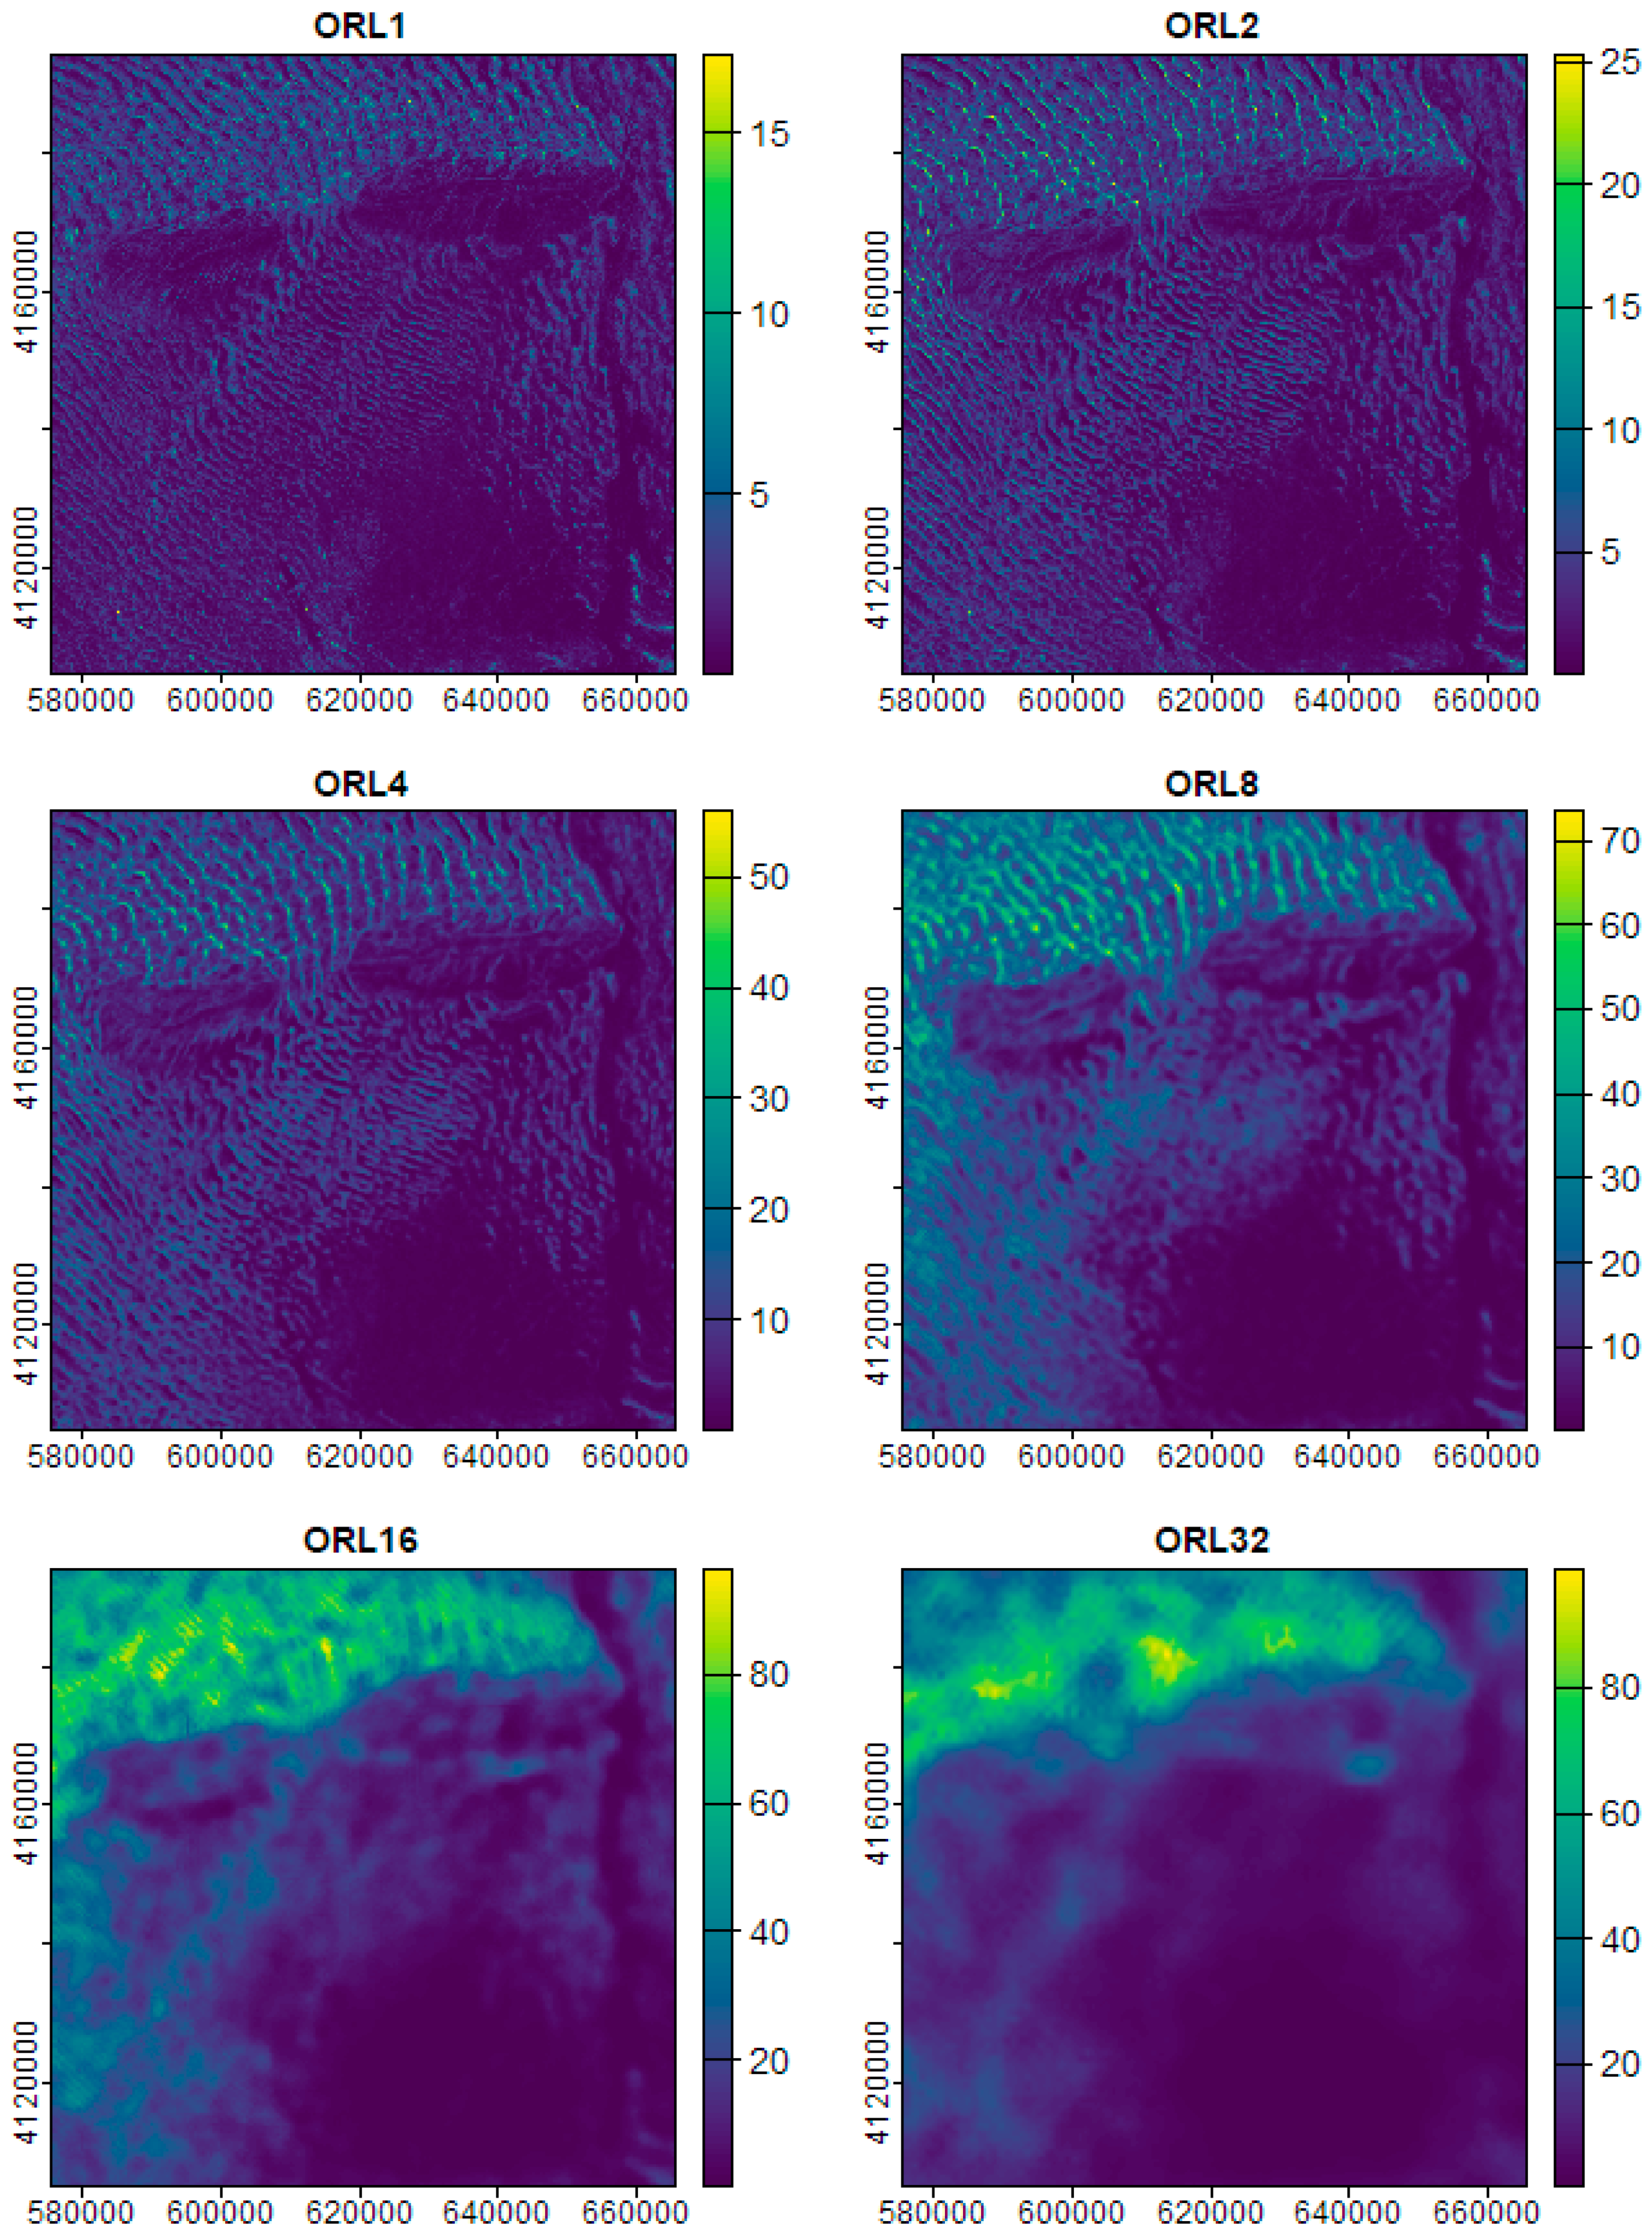
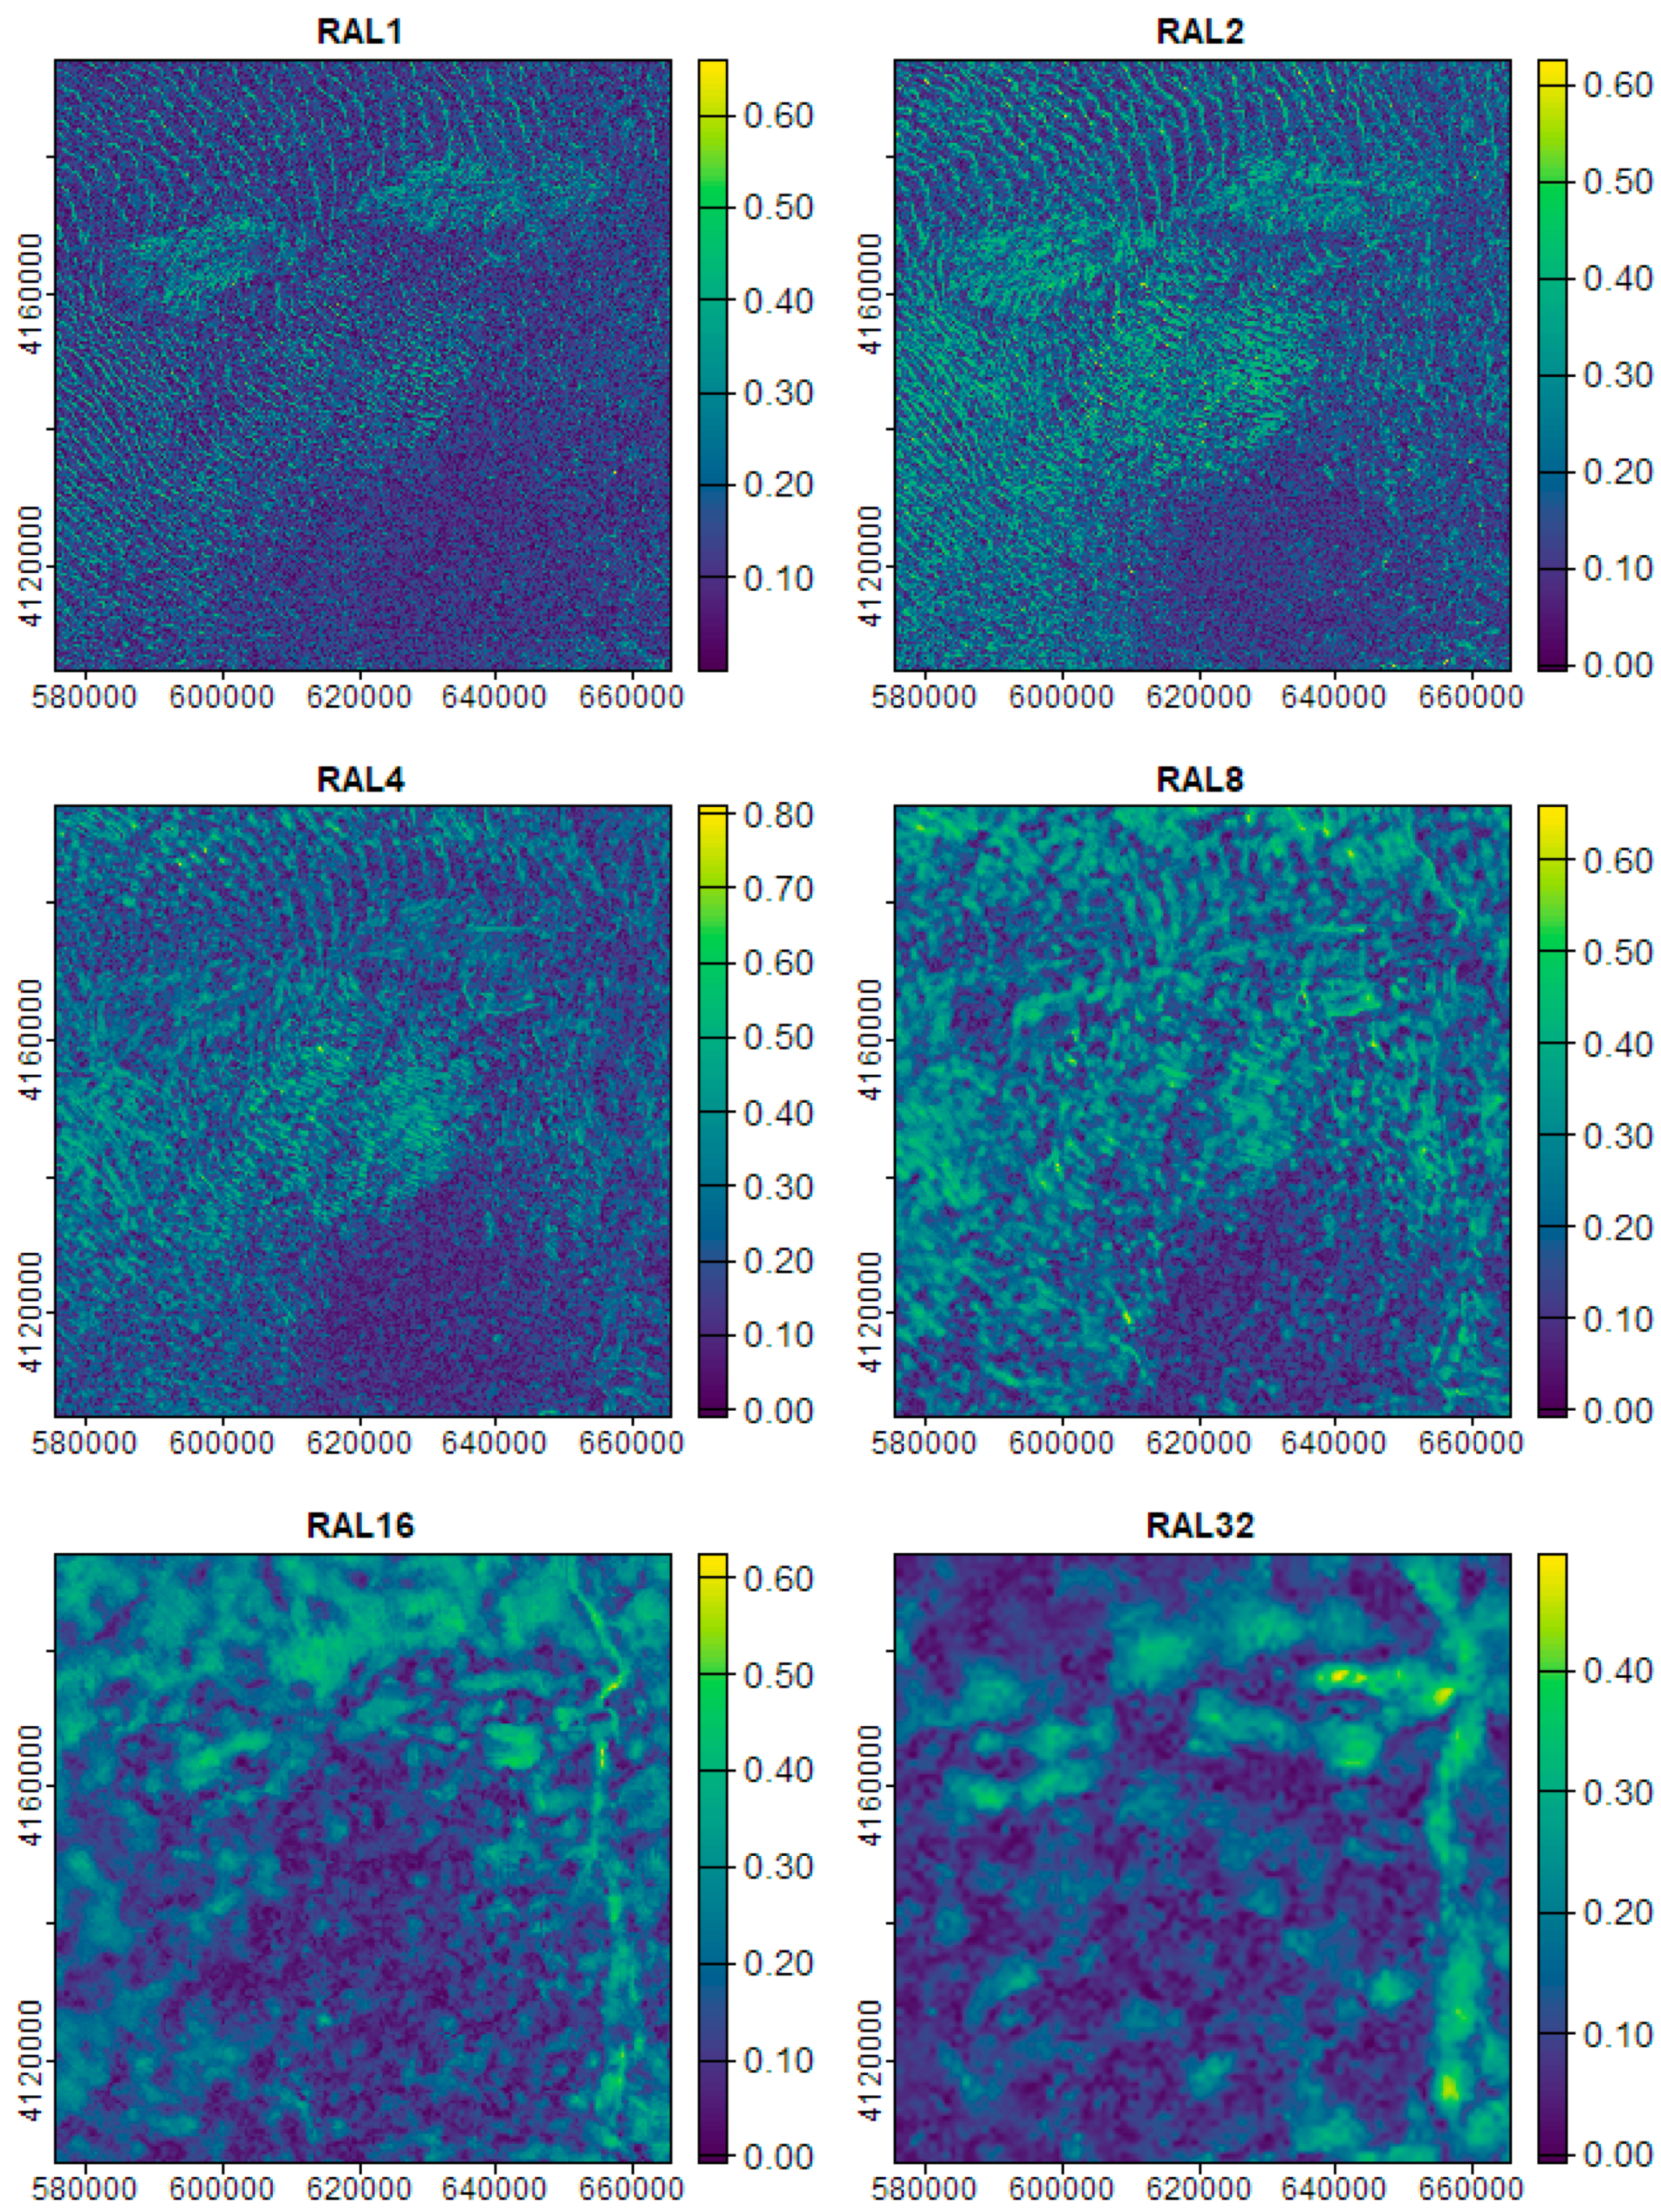
For each level, OR and RA (Figure 6 and Figure 7) are computed. As the scale changes, the RIs highlight different morphological features in relation to their specific wavelengths. Another way to appreciate visually the information carried by the MRIs is to represent the MRIs via RGB images (Figure 8 and Figure 9), thus associating the RGB bands according to the resolution of the levels, i.e., the red band corresponds to RI computed at the level with the coarsest resolution (large spacing). Considering OR (Figure 8), for the first three levels, it is possible to visually differentiate very well the main morphologies described in Section 2.1. For example, the large transverse and network dunes of the northern sector are characterized by high roughness at the finest level in the interdune areas (the light blue color), which is different from the longitudinal dunes just south of the mountain ridge with very smooth interdune areas (black). Even the RGB image of RA is very informative (Figure 9), highlighting the scale with the highest anisotropy. For example, the network and transverse dune fields on either side of the mountain ridges have clearly different scales. North of the ridge, the anisotropy is higher at the lowest resolution (red); hence, there are longer wavelengths. Meanwhile, to the south, the higher anisotropy is at the intermediate level (green). Figure 8 and Figure 9 characterize very well the area with shallow/outcropping bedrock in the mountain ridge. Here, the morphology is complex due to the interaction of morphological features related to the geostructural setting (e.g., outcropping strata) and aeolian processes (e.g., shadow and linear dunes). In this area, there is a prevalence of high values of OR at the level L2, as manifested by the prevalence of the green color in Figure 8. In contrast, for RA (Figure 9), a variety of scales of anisotropic features is encountered.

3.2. Unsupervised Learning

The visual analysis of the MRIs suggests that the multiscale approach can extract useful information concerning the morphology of the desert landscape. To evaluate quantitatively the ability of the approach to discern landscape morphologies, the RIs are used as input features in an unsupervised learning approach based on the well-known K-means clustering algorithm.
The analysis of various metrics for finding the best number of clusters (up to 20 clusters have been tested) showed that for this dataset, it is not possible to define an “optimal” number of clusters, but many sub-optimal solutions are possible, with a minimum and maximum number of clusters ranging from 4 to 11. We selected seven as a tradeoff between simplification and discrimination and because it is compatible with the best number of clusters from the Isodata approach tested on the same dataset.
It is worth noting that other geomorphometric derivatives have been not considered as input features because the aim is to evaluate the information potential of the MRIs. However, it should be clear that from the perspective of geomorphometric fingerprinting [60] and terrain classification, an ensemble of different geomorphometric derivatives, including roughness indexes, should be used, as, for example, in Iwahashi et al., 2018 [8].
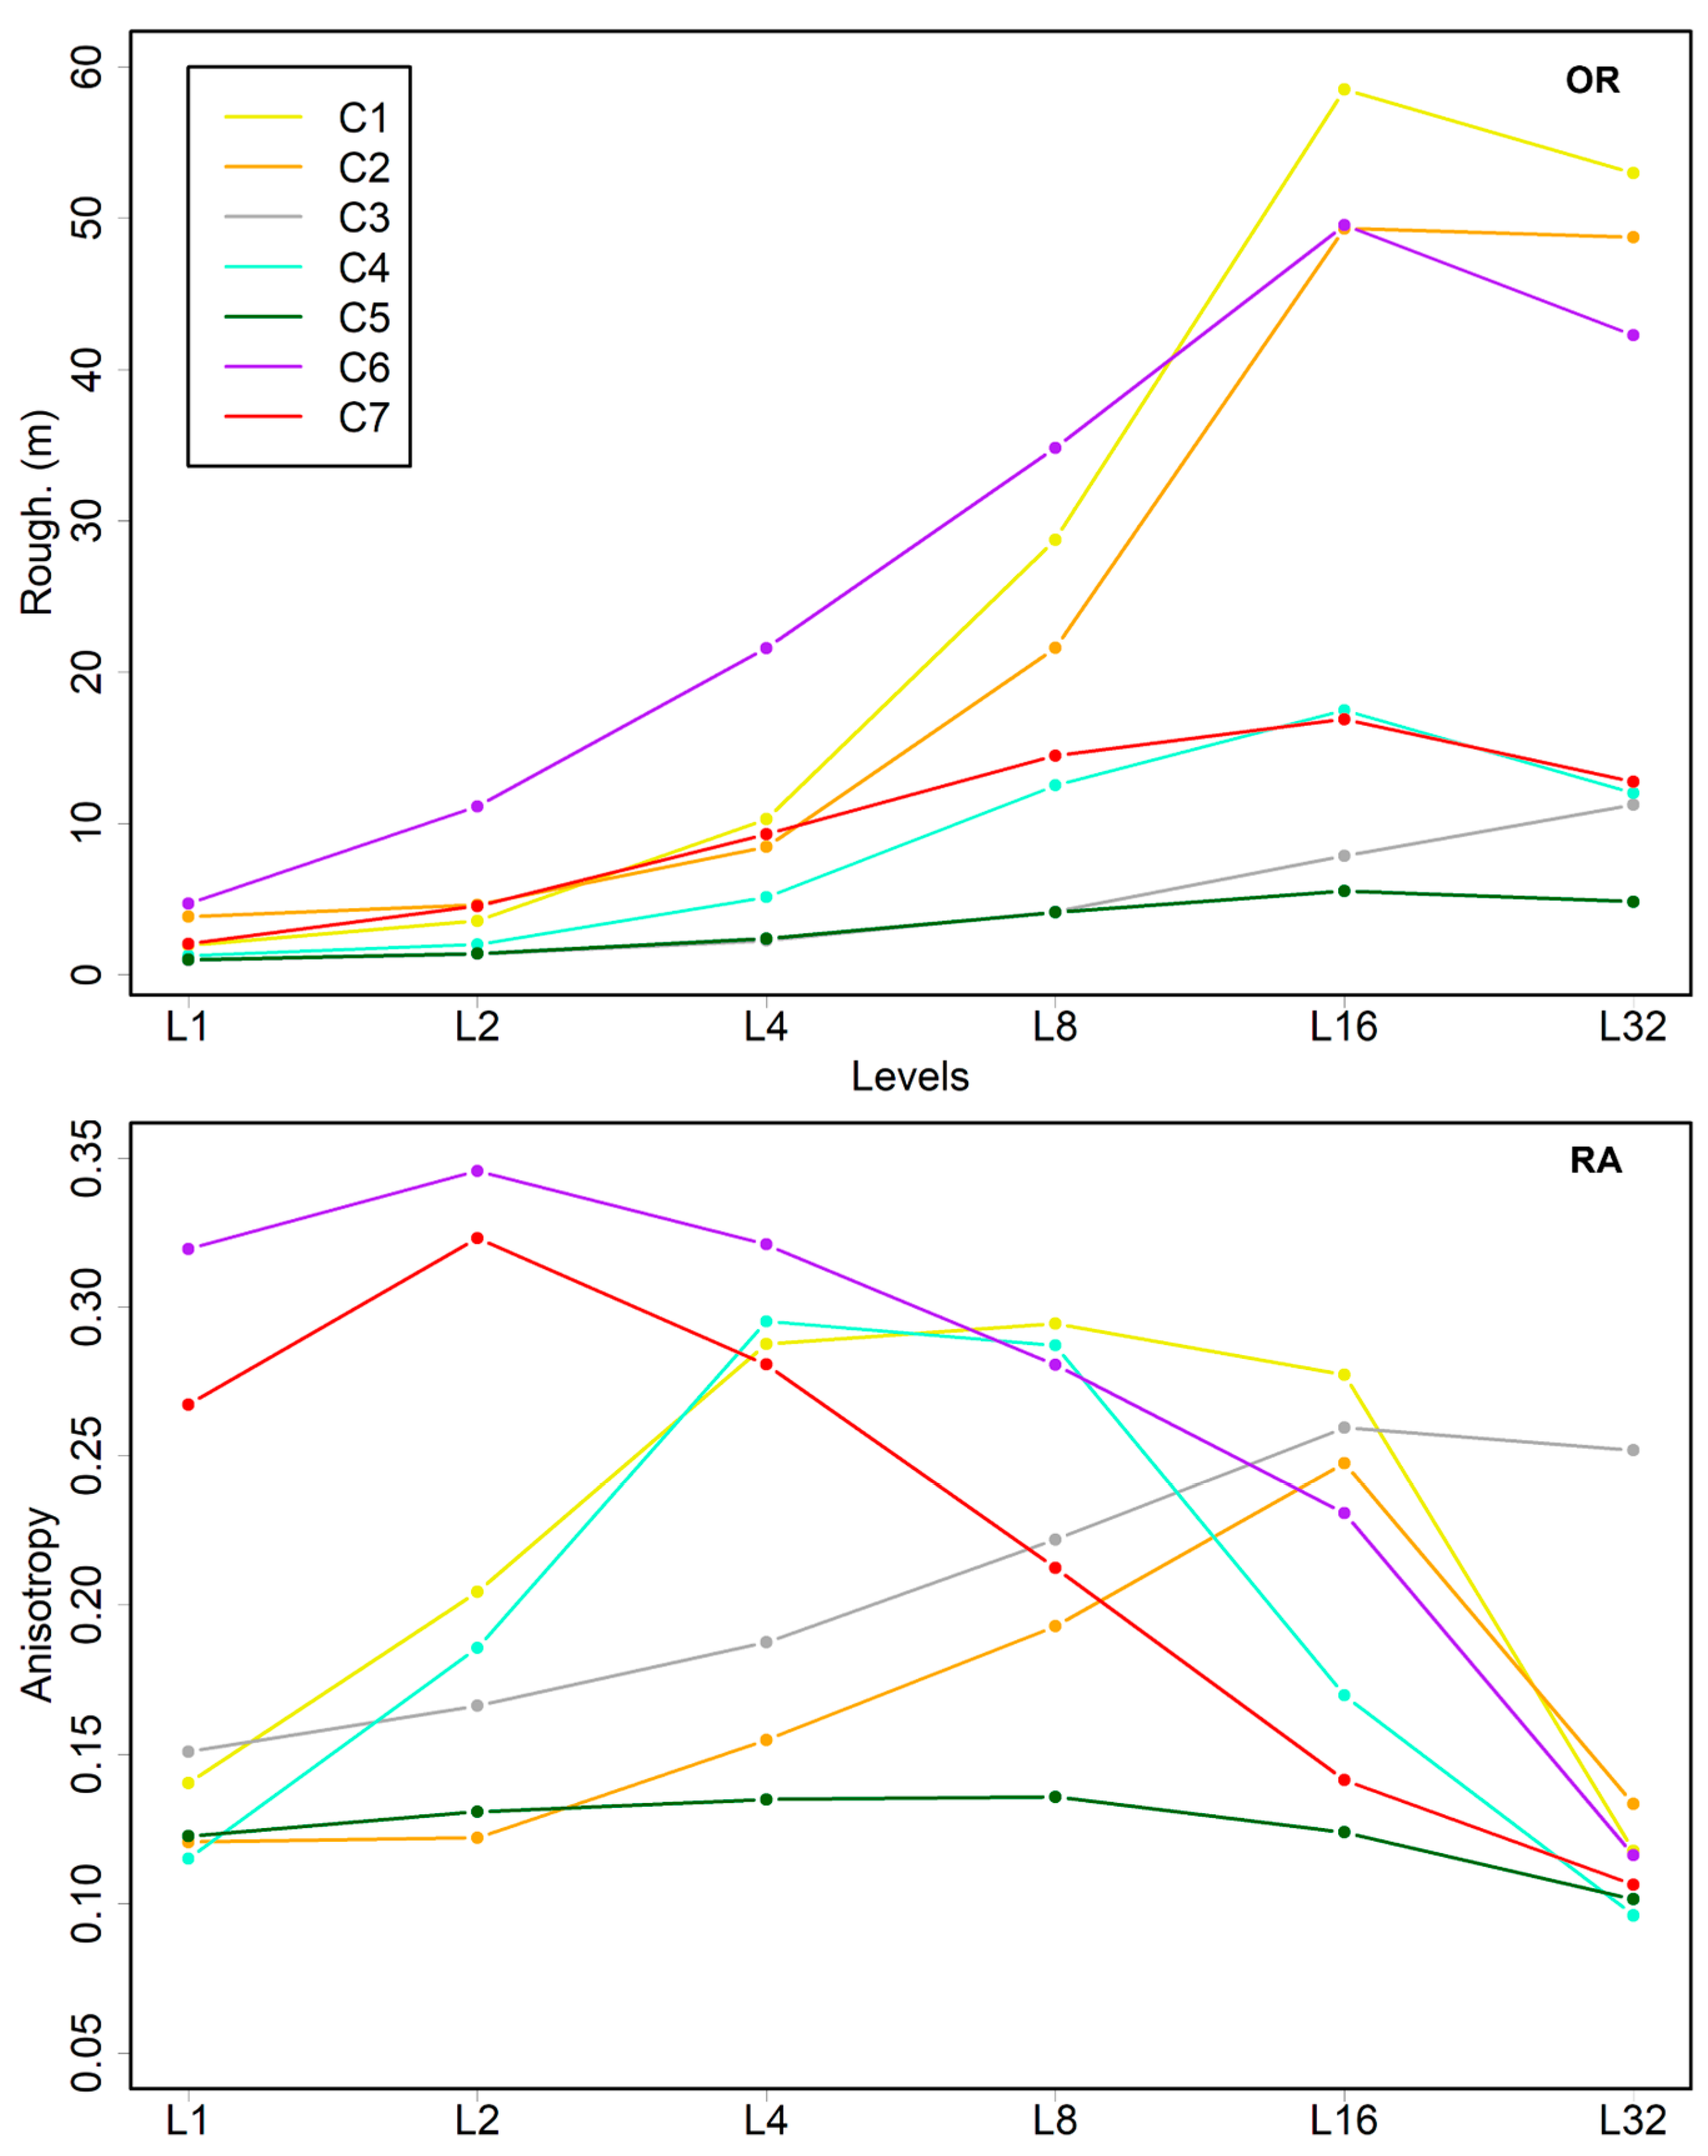
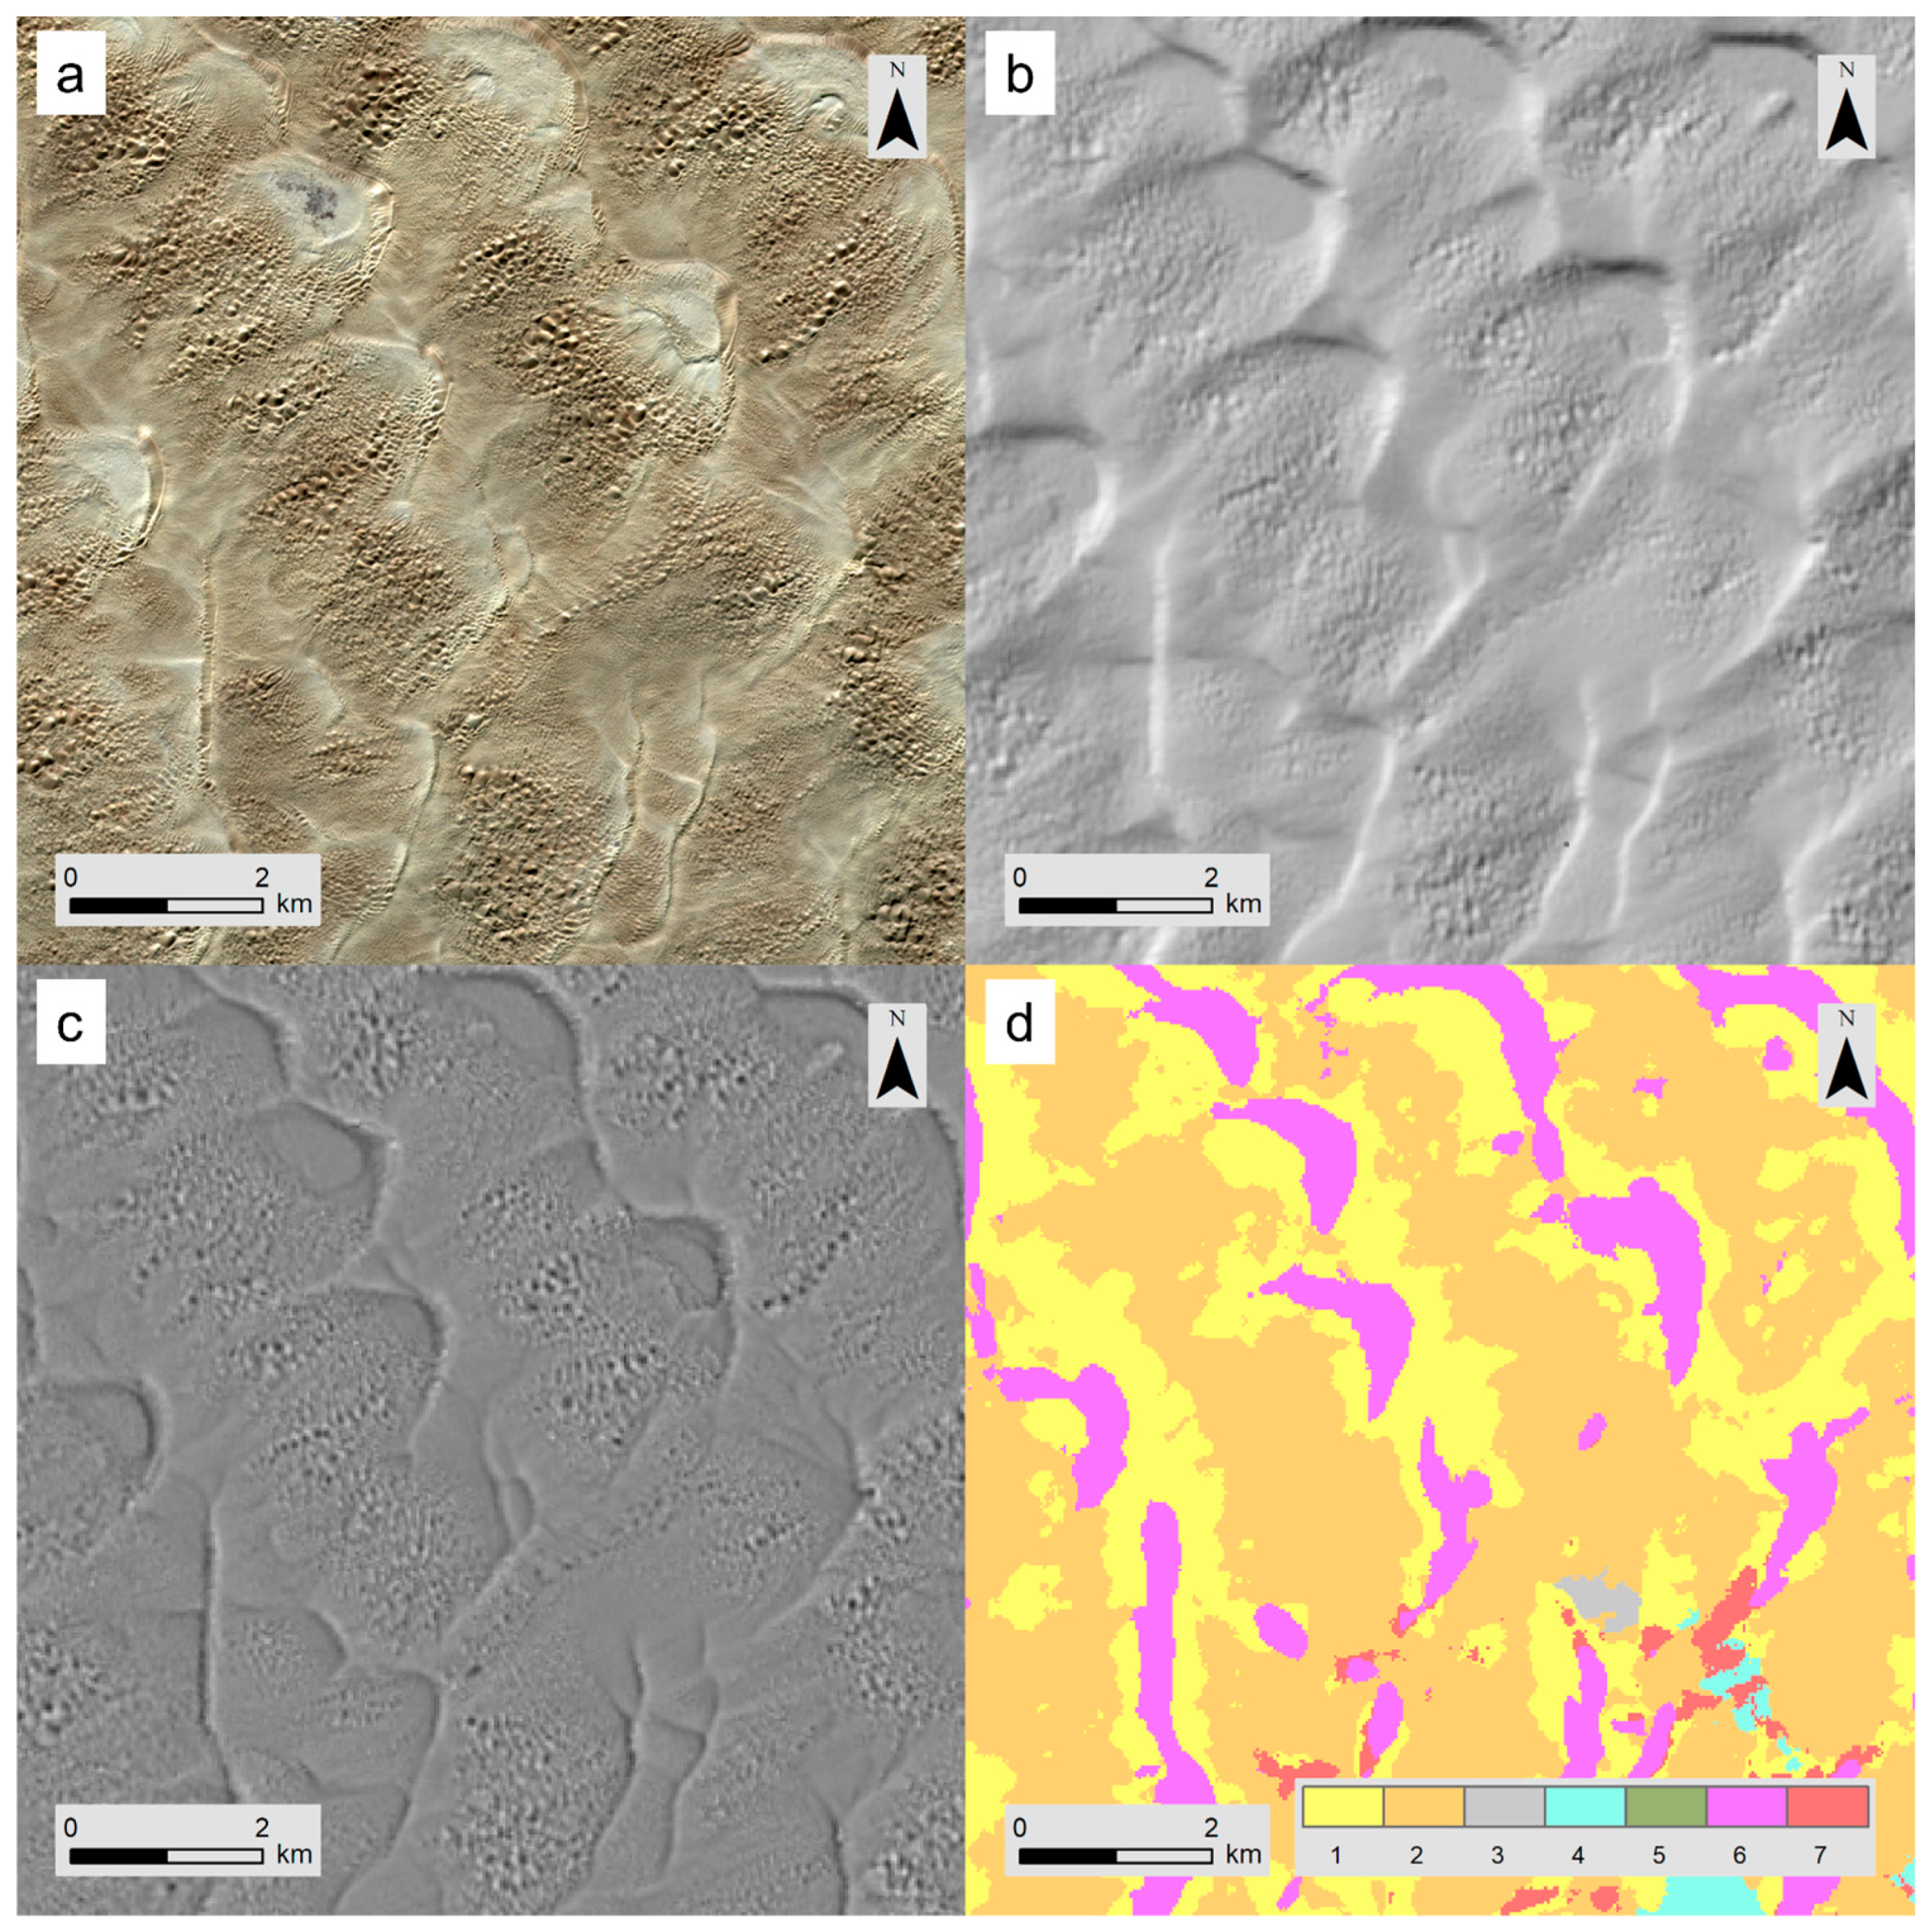
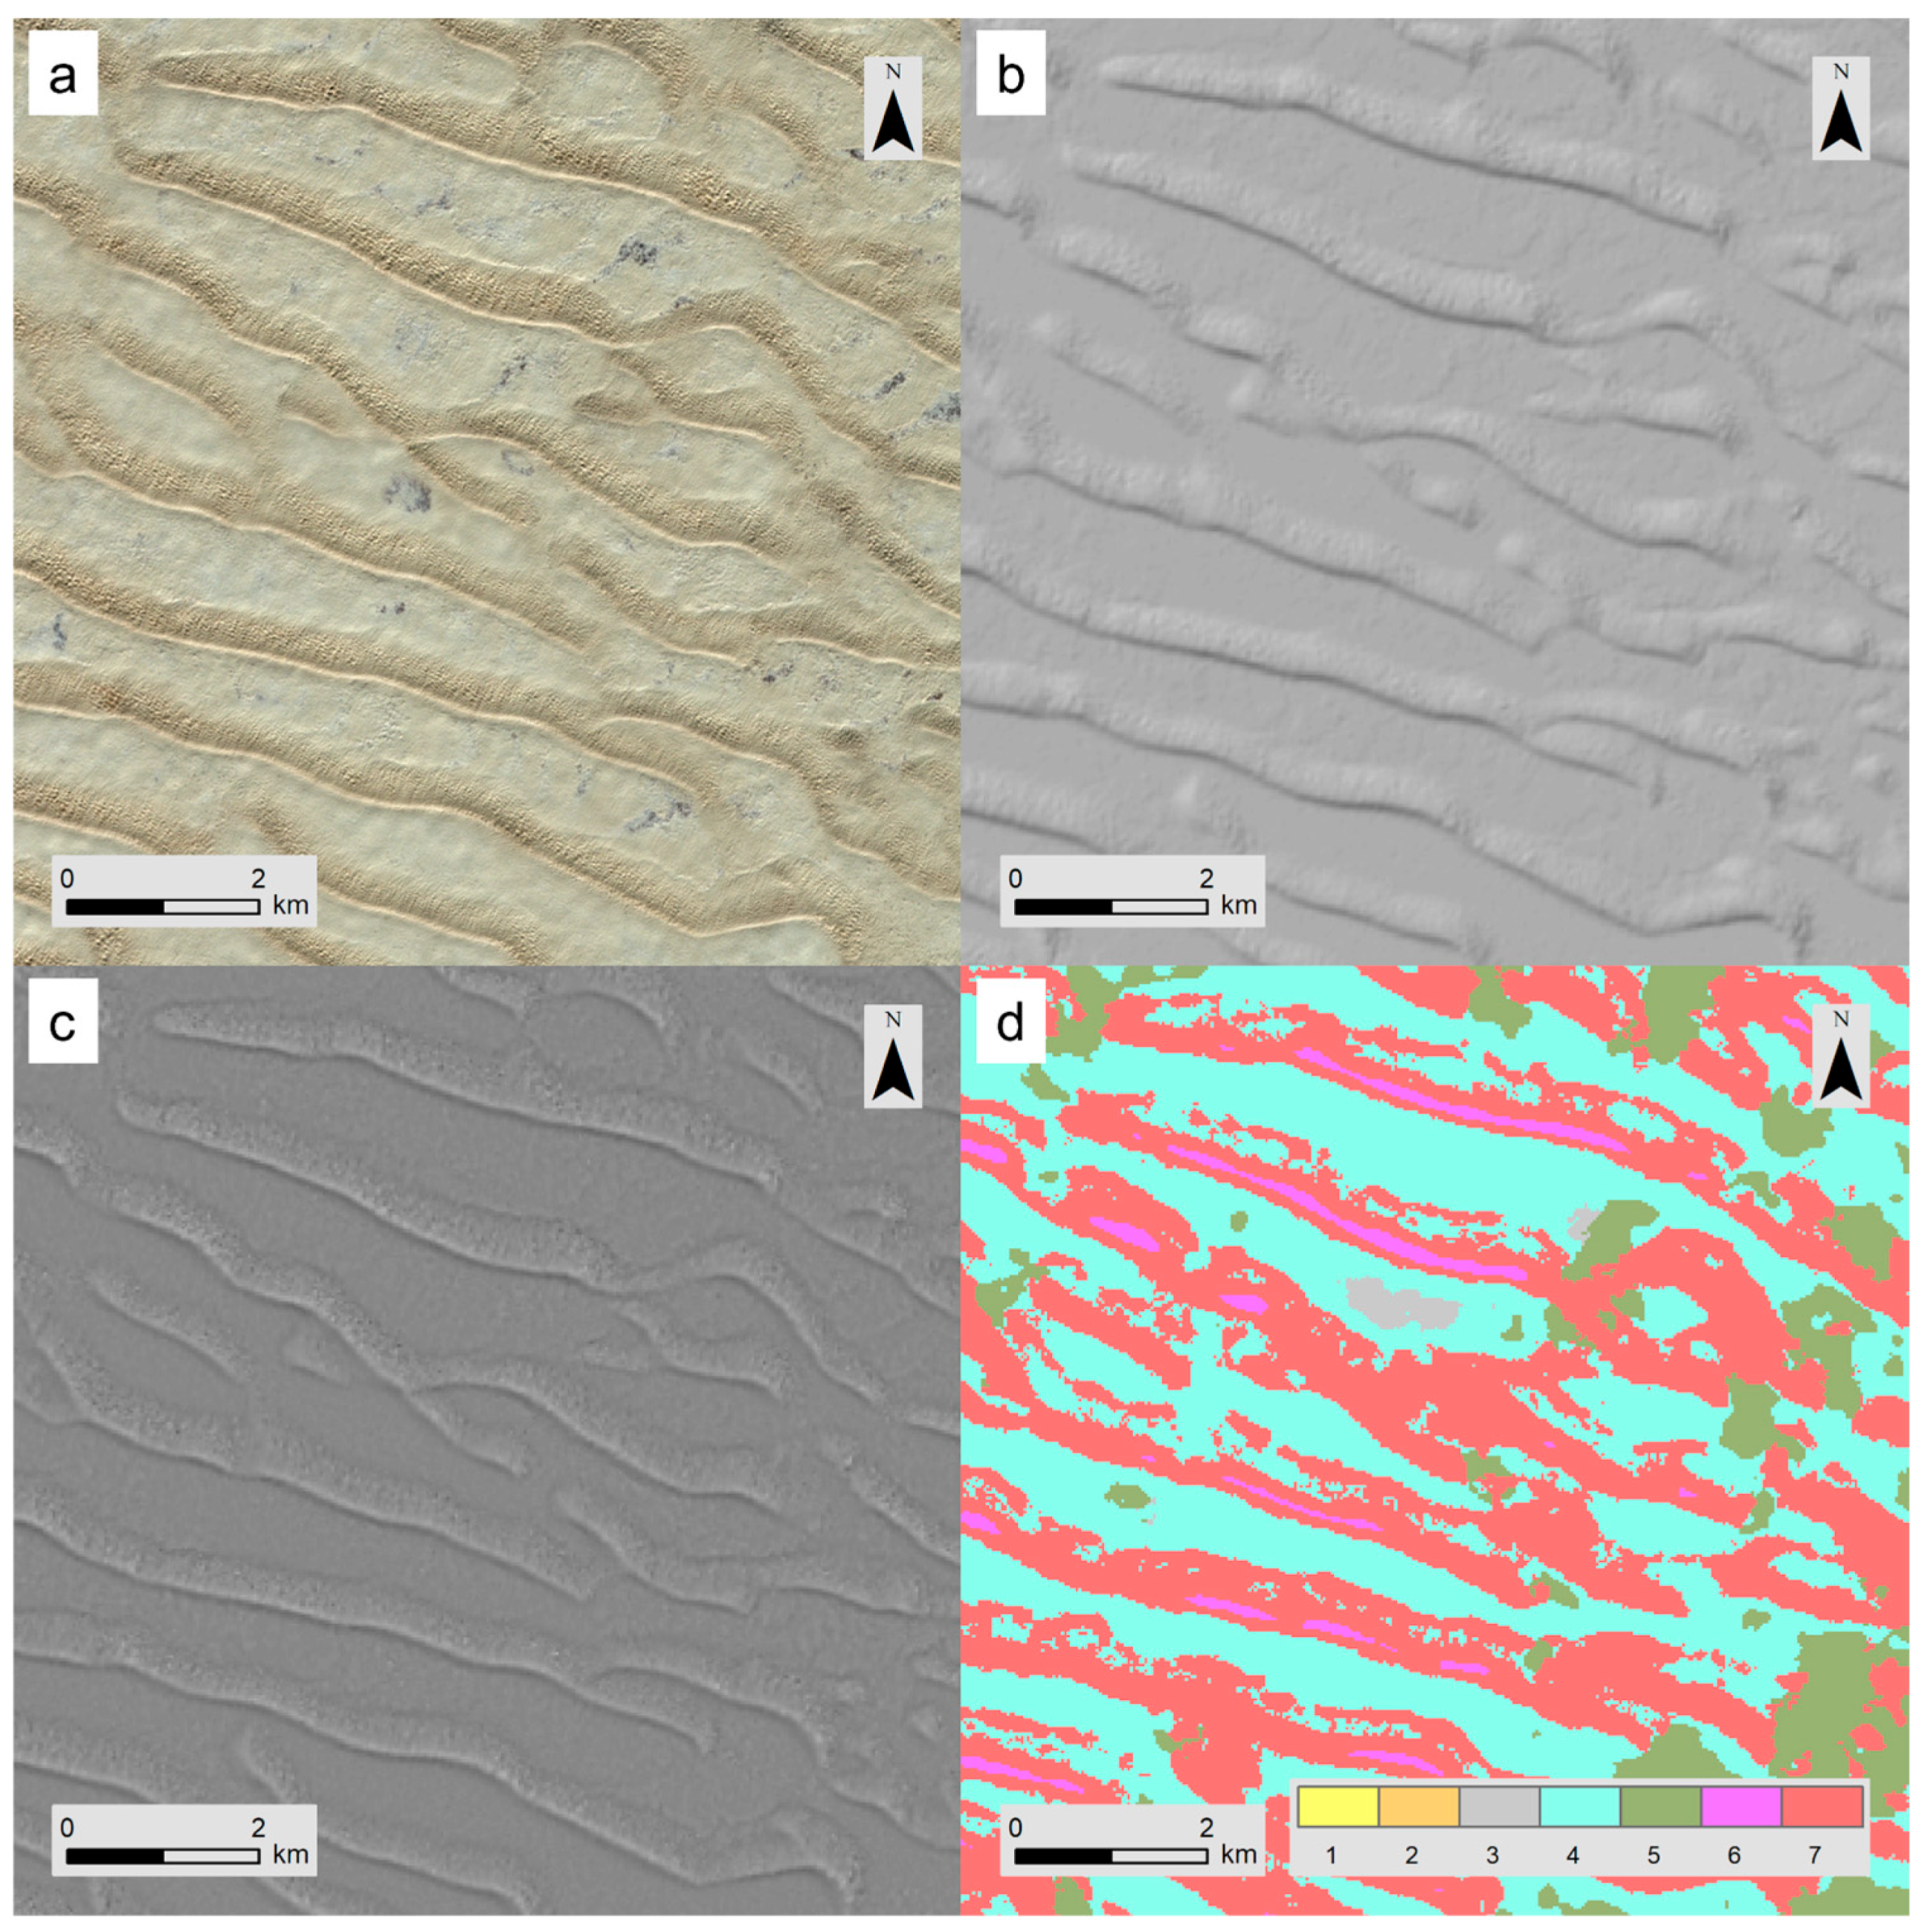
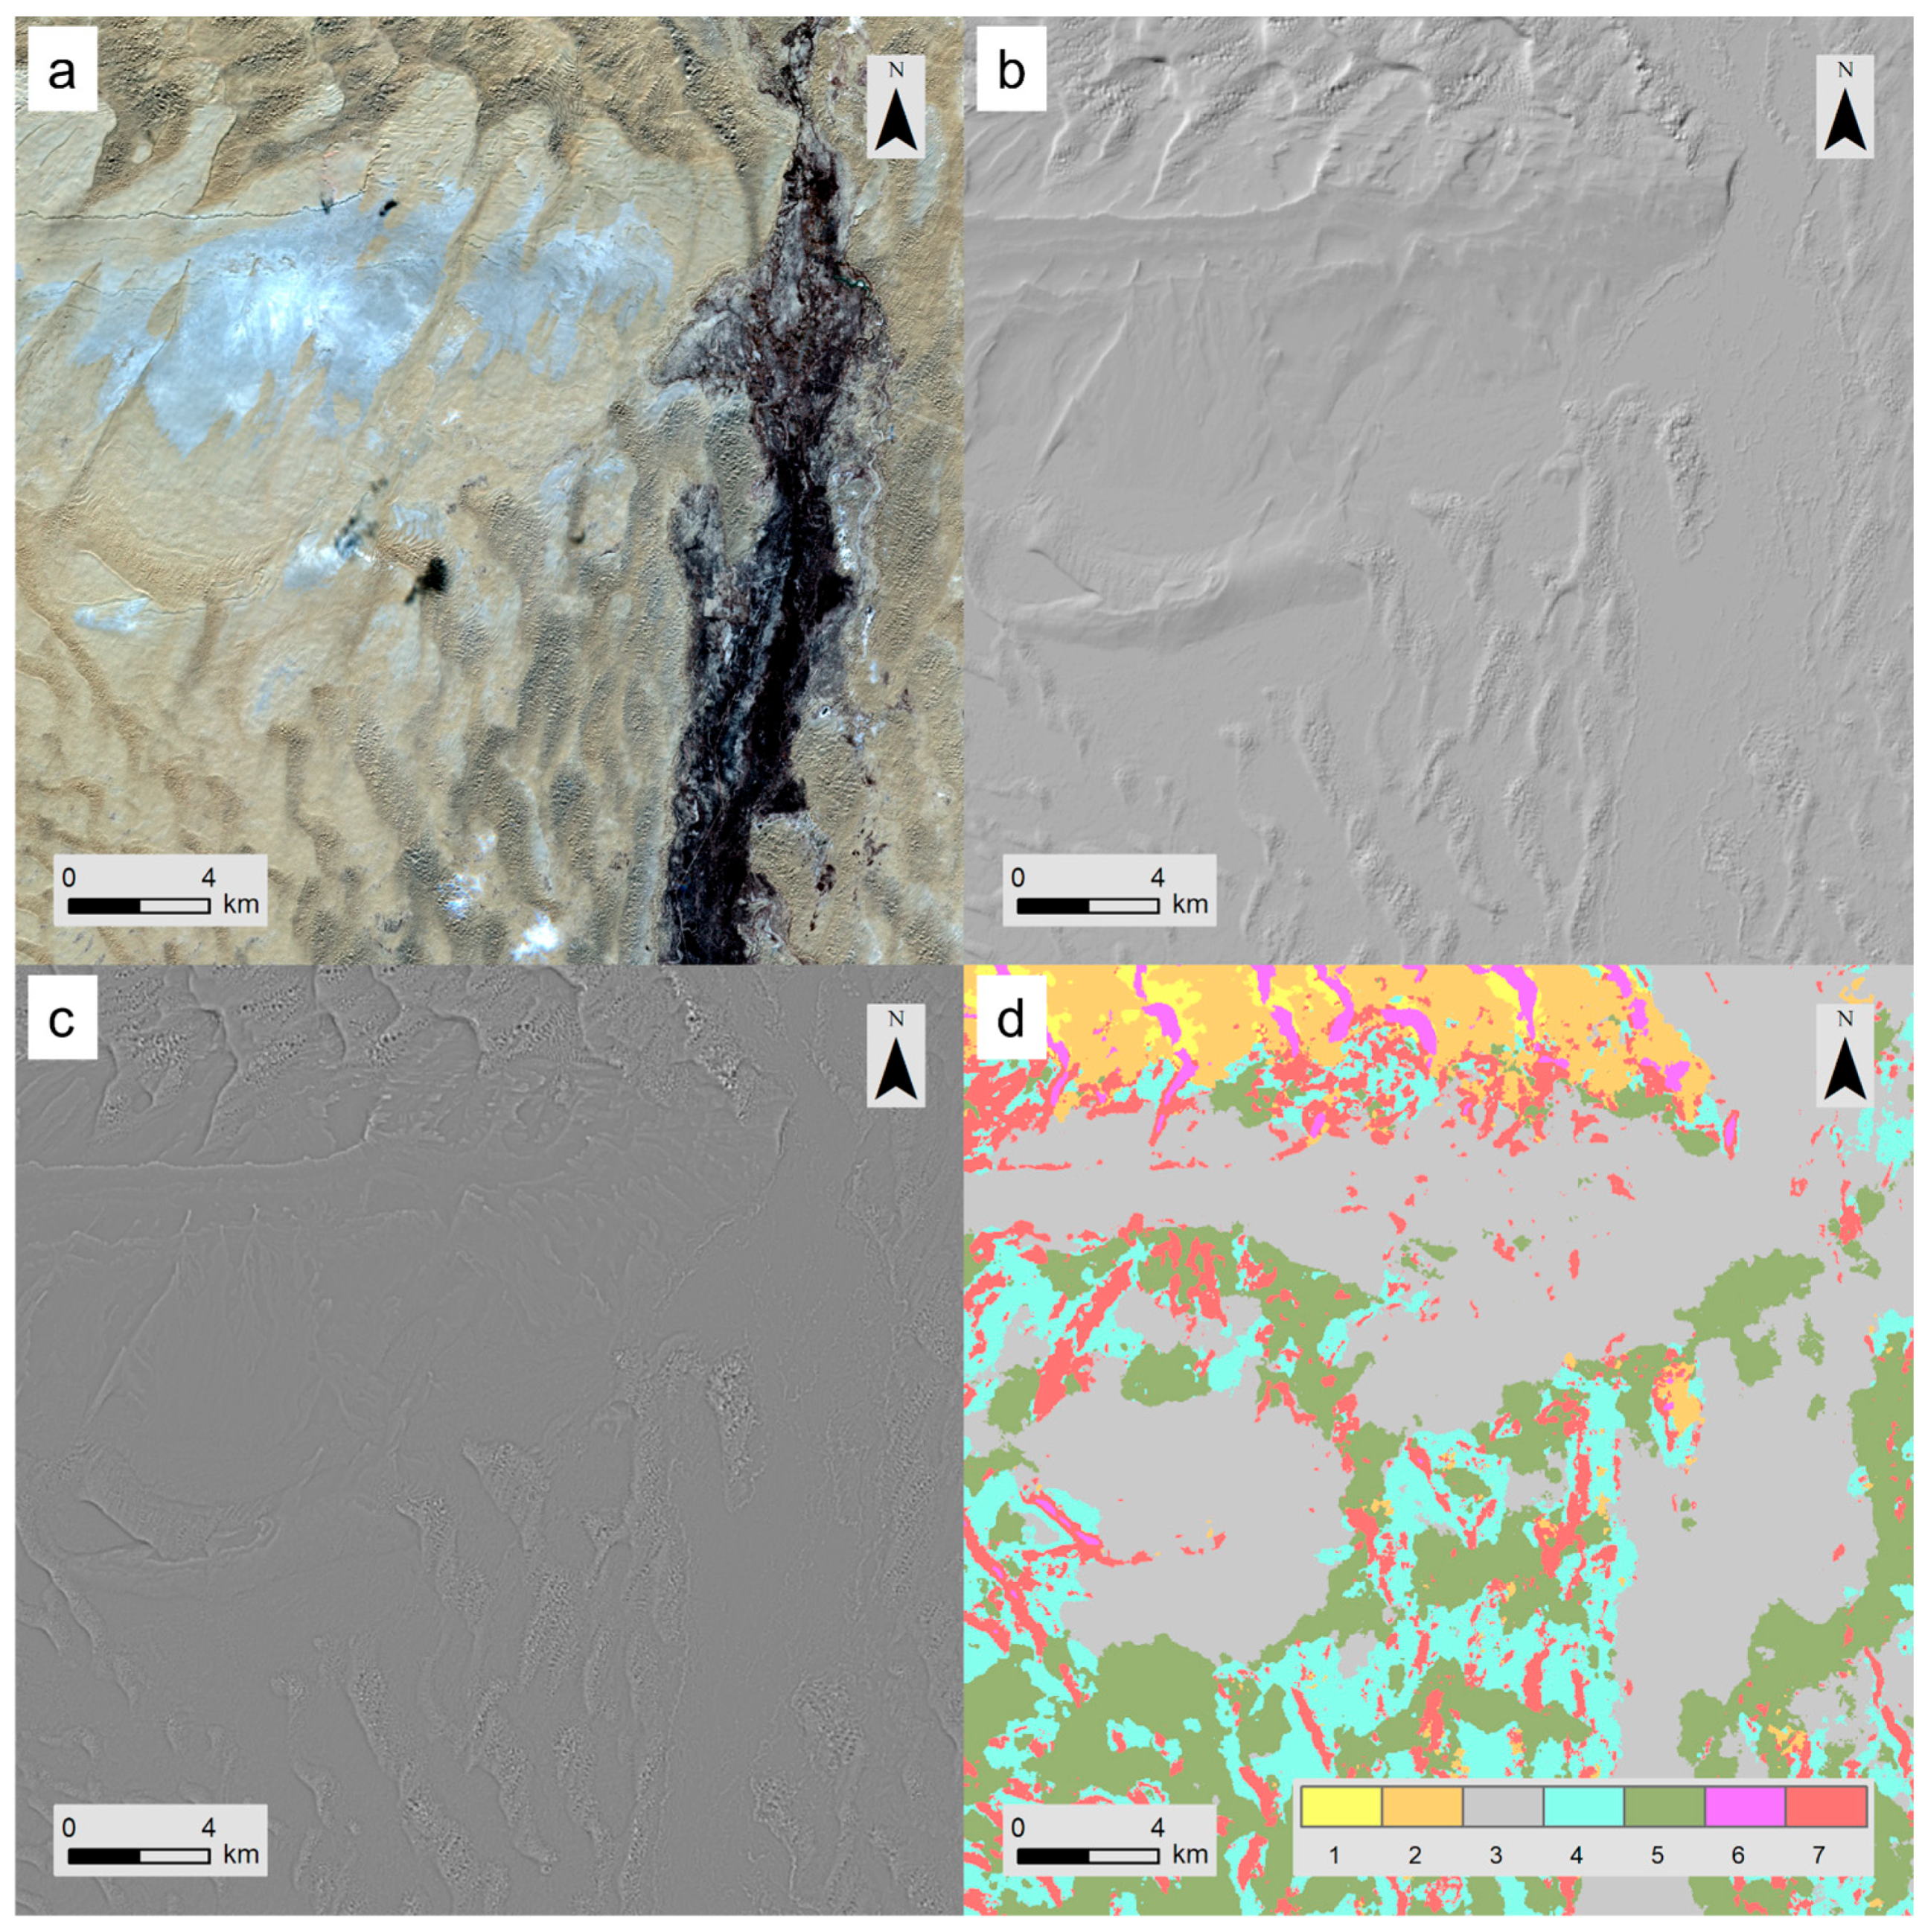
The spatial distribution of clusters (Figure 10) shows an evident spatial organization, such as the relatively sharp distinction between the northern large dune field and the other dune complexes. The interpretation of the spatial distribution of the clusters according to the local morphology is straightforward considering cluster centers and by representing separately OR and RA centers at the different resolutions (Figure 11). It is also quite evident that RA is a distinctive characteristic of the surface morphology in this setting. To facilitate the interpretation, Figure 12, Figure 13 and Figure 14 represent some details of the main morphological features of the area, pairing the clustering results (Figure 12d, Figure 13d and Figure 14d) with Sentinel-2 imagery (Figure 12a, Figure 13a and Figure 14a), hillshade (Figure 12b, Figure 13b and Figure 14b), and residual DEM (Figure 12c, Figure 13c and Figure 14c).
The northern transverse and network dune fields (Figure 12a,d) are characterized by a prevalence of clusters, including C1 (yellow), C2 (orange), and C6 (purple). C6 essentially represents steep scarps of the large dunes, and it is also present in a limited number of the longitudinal dunes southwest of the rocky outcrops. From the perspective of roughness anisotropy, C6 behaves similarly to C7 (red), with a high value of anisotropy at a short scale decreasing at longer scales (Figure 11). C7 has a much higher OR at all scales. C1 and C2 are associated with dunes fields of shorter wavelengths internal to the large dune field. Both C1 and C2 have a high OR at the different scales (Figure 11); C2 is characterized by much higher values at the highest resolution (L1) due to presence of short-wavelength dune fields (Figure 12b,c). C1 is representative of a smoother morphology, with quite high anisotropy at levels L4–L16.
The southern longitudinal dune field (Figure 13a,d) is characterized by the clusters C4 (aquamarine) and C7 (red). C7 (red) highlights the ridge and scarp of longitudinal dunes, just south of the rocky outcrops, and it is generally associated with C4 (aquamarine), which characterizes the interdune areas. Cluster 7 is also found in other parts of the study area, such as, for example, in the mountain ridge, in correspondence with linear dunes and outcropping strata. Clusters (Figure 11) C4 and C7 are similar with regard to OR, with C7 characterized by higher roughness at the finest levels, and the significant differences relate to the scales at which the high values of RA are observed.
The areas with shallow bedrock in the mountains and with fluvial morphology (Figure 14a,d) have a prevalence of classes C3 (gray) and C5 (green). These classes (Figure 11) are characterized by low OR, with slightly higher values for C3 at the coarser resolution levels (L16 and L32). The main difference relies on the anisotropy, with C3 showing high anisotropy at levels L8-L32 while C5 is isotropic at all levels. C3 is representative of the fluvial area of the Niya River and of the two mountain ridges. Both areas have, in fact, anisotropic long-range morphological features. The class C5 represents a transition/mixed morphology frequently encountered in the interdune areas in the proximity of the Niya River (Figure 3 and Figure 14) and in the large and flat southeastern area characterized by a limited presence of large dune fields (Figure 4 and Figure 10).

3.3. Supervised Learning: Predicting Crest Lines

In this section, the informativeness of the MRIs is shown from the perspective of a supervised learning task focused on automatic mapping of the large dunes’ crest lines (e.g., [39,57]). From a geomorphometric and theoretical perspective, this can be seen as a straightforward task, because even a simple combination of basic geomorphometric derivatives, such as profile curvature, residual DEM, and slope, should be able to highlight these features (e.g., Figure 15). However, the real Earth surface morphology, beyond the aspects related to its digital representation, may present some challenges for automatic recognition [56]. One criticality can be represented by the presence of morphological convergence, i.e., a similar morphology related to different geomorphic processes; this is the case of the outcropping strata scarps in the mountain ridges that may resemble crest lines of linear and shadow dunes. Another one is related to the multiscale character of landforms, given that the dune fields are characterized by a hierarchy of wavelengths with the possibility of multifractal spatial patterns. Finally, real landforms are sometimes characterized by fuzziness, e.g., due to the different degree of activity and/or the coalescence of different morphologies. Another typology of issues arises from the characteristics of the reference data used for training and validation, because these data can be characterized by different levels of quality and uncertainty. In this context, the MRIs are able to improve the supervised learning of specific morphologies with respect to the use of conventional geomorphometric derivatives.
In supervised ML, the main criticalities rely on the selection of relevant and not redundant input features and on the reference data used for training, validation, and testing. The design and build up of reference data for the prediction of crest lines present some challenges. One is related to the inherent uncertainty in manually locating and digitizing these features from the DEM and its derivatives (Figure 15). Another is related to statistical considerations, given that crest lines, being isolated, linear features, cover a limited portion of the AOI. To consider the latter aspect, a mixed approach with a balance between random sampling and expert-based sampling [61] has been adopted. The mixed approach consists of creating a portion of the dataset (800 points) by randomly locating the points in the AOI and manually classifying the points as crest and not-crest. Within the randomly located points, only 38 points are classified as crests (4.75%). Another portion of the dataset (400 points) has been manually located in morphological informative locations. In particular, the manually added points are located on crest lines covering a variety of dune fields and in areas of morphological convergence (e.g., outcropping strata that may resemble a crest line). Of the 400 manually selected features created, 370 are crests and 30 are not-crests. The random and manually selected points are merged to create the reference dataset, consisting of 1200 points (Figure 14), 30% of which are classified as crest lines. The reference data for training and testing have been derived as point features labeled with an indicator code as crest (prob = 1) or not-crest (prob = 0). The values of the reference points are then associated with the nearest pixel according to the common grid of the COP DEM. The labeling has been performed by means of visual analysis of the DEM and of three geomorphometric derivatives (e.g., Figure 15): the slope, the residual DEM, and the profile curvature.
The crest lines have been predicted by means of RF using two different sets of input features: (1) conventional geomorphometric derivatives directly related to crest morphologies (RF GDs) and (2) conventional geomorphometric derivatives plus MRIs (RF GDs + MRIs), i.e., the six OR and six RA indexes (Figure 6 and Figure 7). The following conventional geomorphometric features have been considered: elevation (m), slope (percent), tangential curvature (log m−1), profile curvature (log m−1), and residual DEM (m). In general, a very low slope (Figure 15b), a high positive profile curvature (Figure 15c), and a positive residual DEM (Figure 15d) are very characteristic of crest lines. The RF models have been run randomly by splitting the reference dataset into a training dataset (80%, 960 samples) and a test dataset (20%, 240 samples). The RF GD model considered three variables at each split, while the RF GDs + MRIs considered four variables [58].
The results obtained (Table 1) by means of the two models are very good from the perspective of the diagnostics, both in terms of the ones derived from out-of-bag (OOB) observations of the training dataset as well as the ones derived from the test dataset. The RF model based on the integrated approach, with the input features consisting of the GDs plus the MRIs, has better test RSME with respect to the one based solely on the five GDs. However, the real improvement of the model is evident upon looking at the spatial patterns of the predicted probability to observe a crest line (Figure 16a,b) and upon comparing the classification results (Figure 16c) of the two RF models.
The possibility of evaluating the relevance of the input features in RF models provides several insights into the role of the surface metrics considered. One way to evaluate input features’ importance is by means of the mean decrease in the Gini index of each variable [58]; the higher the decrease, the higher the relevance of the variable in prediction (Figure 17). The model based on the five GDs (Figure 17a), as expected, shows that the more relevant features are the profile curvature, the slope, and the residual DEM. In the model based on GDs plus MRIs (Figure 17b), the profile curvature is still the most important variable, followed by the RIs, such as OR of the level 2. The input features that induce an appreciable reduction of the Gini index are represented by the profile curvature, the residual DEM, MRIs at the first three levels, and the slope. The relevance of OR and of RA at the higher-resolution levels is not surprising given that these indexes are “activated” in crest lines due to the high anisotropy, the abrupt morphological transitions, and the presence of nested dune fields at shorter wavelengths. The MRIs provide information regarding the local spatial structure that complements the information provided by the profile curvature and the residual DEM.
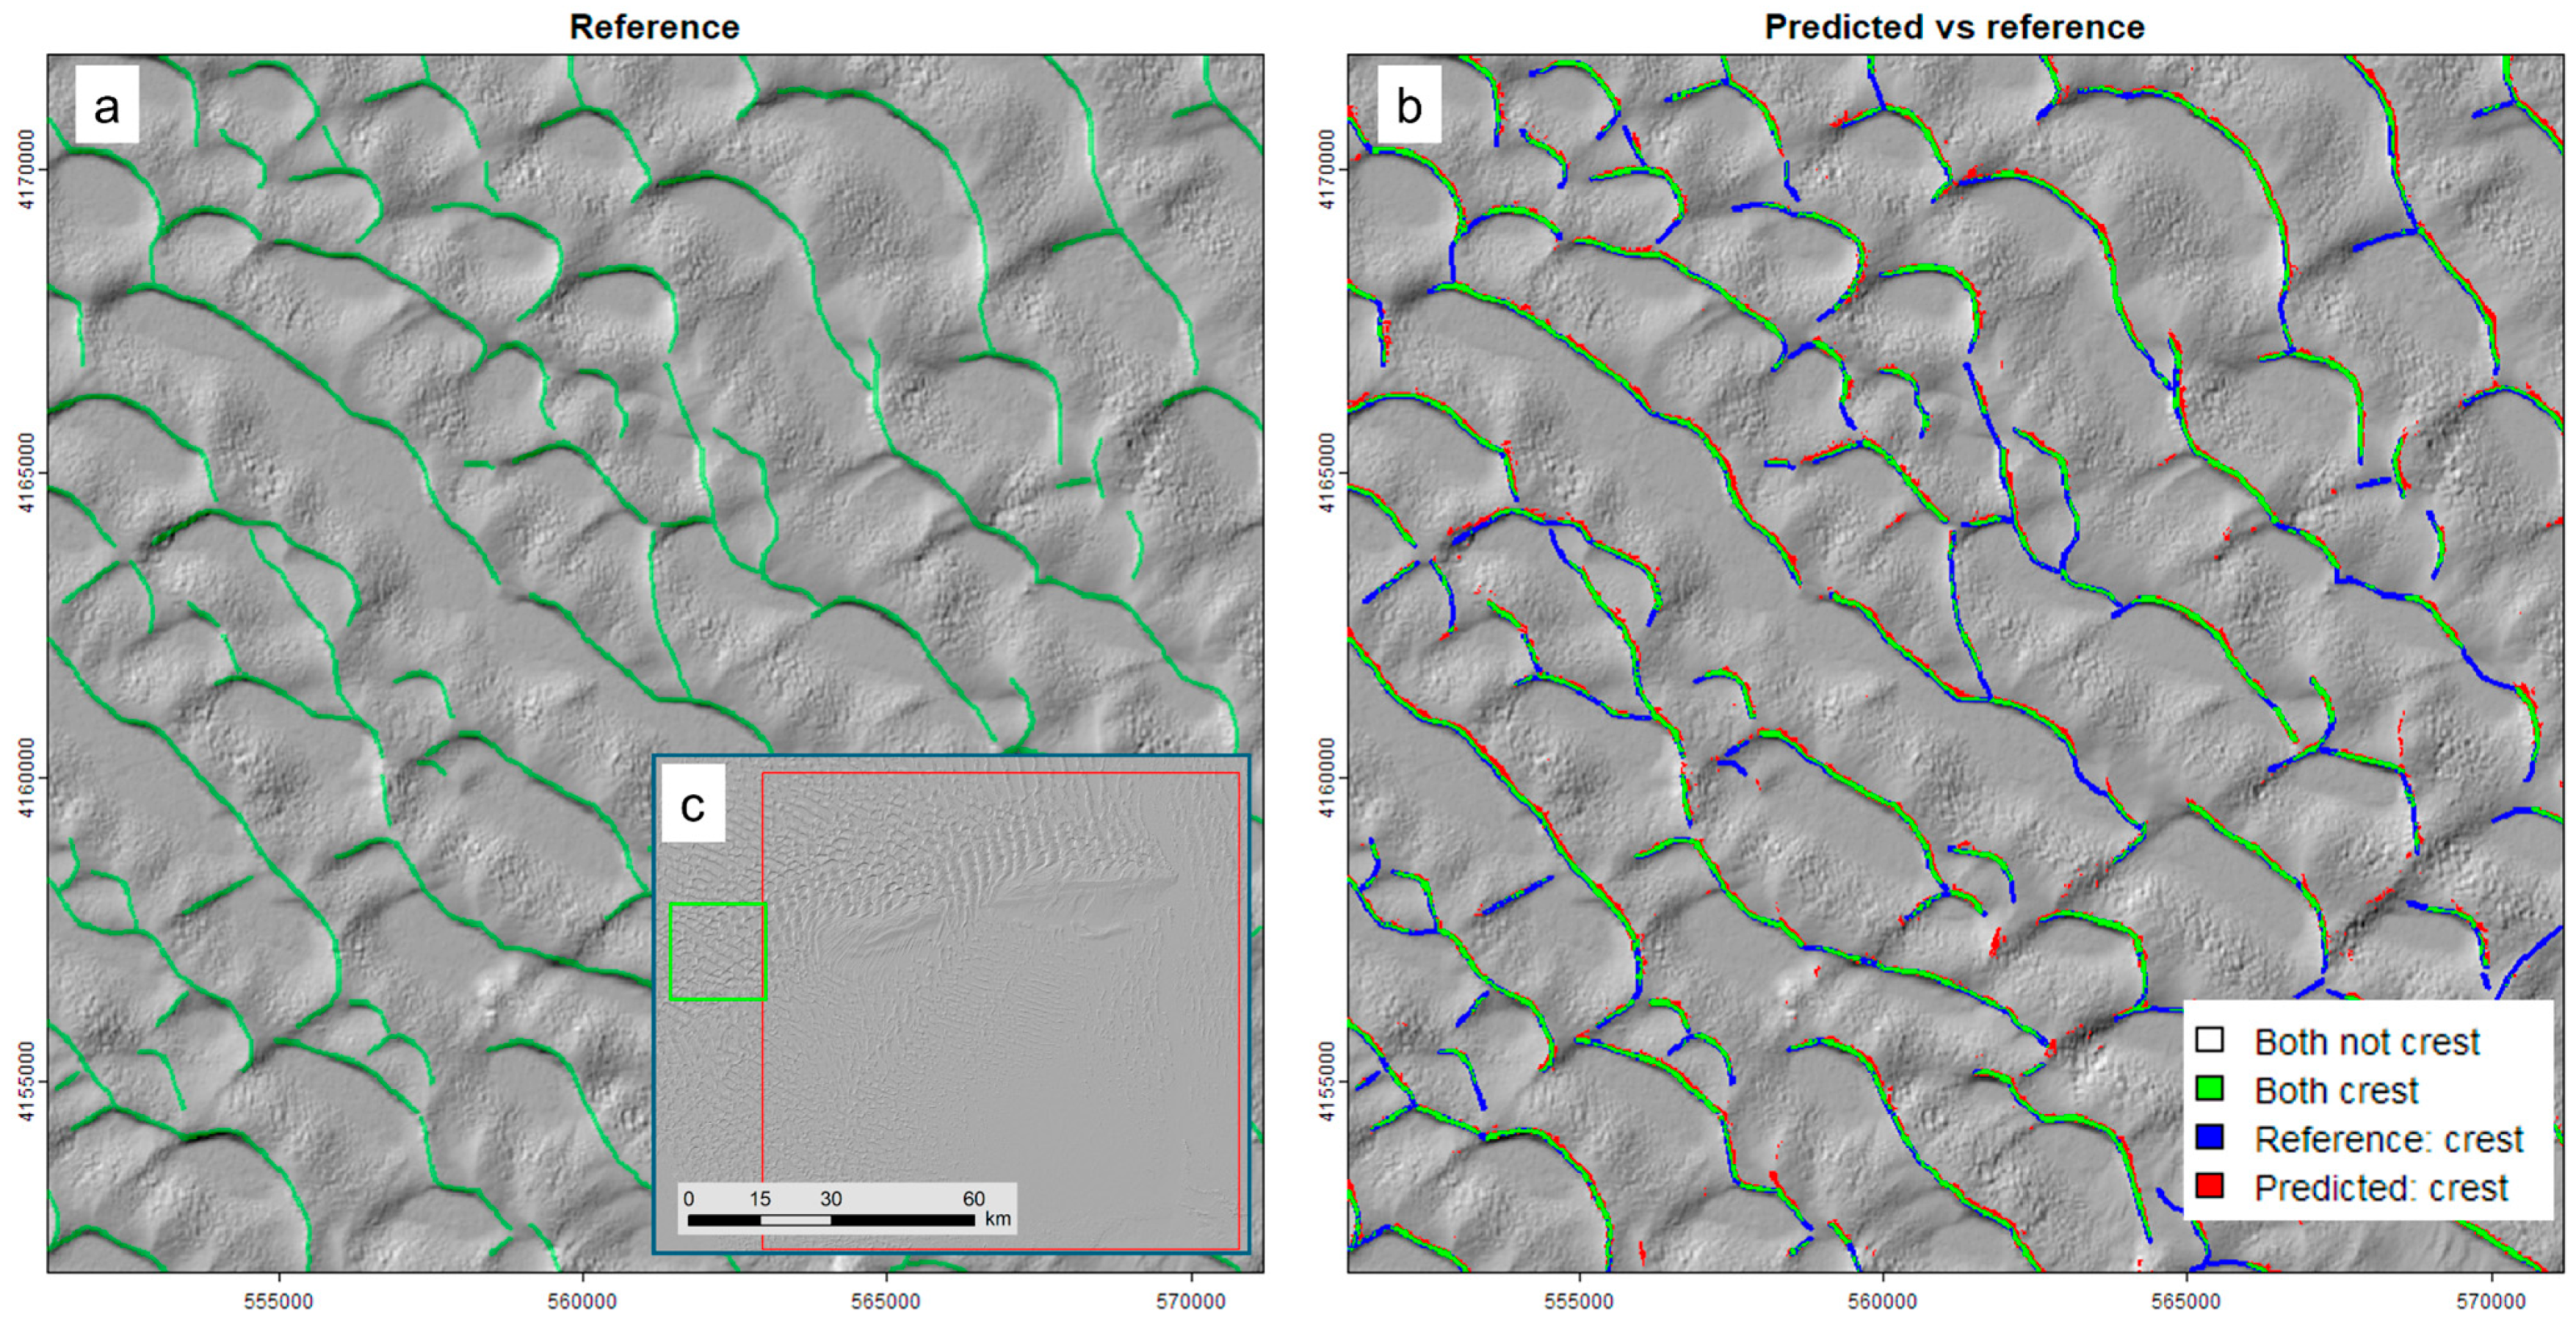
A further evaluation, which is also useful to assess model overfitting, is based on the prediction of the crest lines in an unseen area (Figure 18), i.e., external to the one covered by the reference data. In this area, the crest lines have been manually digitized by means of visual analysis of DEM derivatives. A buffer of 45 m (one pixel and a half) has been considered for classifying pixels with a crest to take into account some uncertainty in the digitizing process. After testing different probability thresholds against performance diagnostics (Table 2), the pixels have been classified as a crest line where the predicted probability is above 0.8. The performances diagnostics are good; however, this kind of model performance evaluation does not take into account the distance of pixels wrongly classified as crest lines to the reference crest lines, which, in many cases in this case study, is short (Figure 18b).

4. Conclusions

The results of this explorative analysis show the potential of multiscale roughness indexes in geomorphometric analysis, both from the perspective of visual interpretation of the landscape as well as for statistical supervised and unsupervised learning tasks. The approach has been conducted in a desert environment, so its effectiveness in other morphological settings can be the object of further studies. The principles of the multiscale approach can reasonably be exported to the analysis of other spatial fields characterized by complex multiscale spatial patterns representing elevation or other spatial properties, such as imagery band intensity. The two short-range roughness indexes considered, omnidirectional roughness and roughness anisotropy, captured relevant morphological features at the different scales. Depending on the morphological environment investigated and on the tasks of the study, other aspects of surface/image texture can be considered in the analysis. The multiscale approach adopted is based on a simple pixel aggregation approach, which may be improved and fine-tuned to improve specific machine learning tasks, such as for the automatic mapping of morphologies and landscape segmentation. However, the core idea of the approach remains valid: the multiscale derivation of RIs provides useful and interpretable input features in machine learning tasks. In the specific desert environment explored, the geomorphological and process-based interpretation of this geomorphometric analysis will be the subject of further studies.

Author Contributions

Conceptualization, S.T.; Methodology, S.T.; Software, S.T.; Validation, P.L.G. and S.T.; Formal Analysis, S.T.; Investigation, P.L.G. and S.T.; Data Curation, S.T.; Writing—Original Draft Preparation, S.T.; Writing—Review and Editing, P.L.G. and S.T. All authors have read and agreed to the published version of the manuscript.

Funding

This research received no external funding.

Data Availability Statement

The data presented in this study (COP DEM) are openly available at https://spacedata.copernicus.eu/collections/copernicus-digital-elevation-model, accessed on 2 November 2024.

Conflicts of Interest

The authors declare no conflict of interest.

References

  1. Guth, P.L. Quantifying Terrain Fabric in Digital Elevation Models. GSA Rev. Eng. Geol. 2001, 14, 13–25. [Google Scholar] [CrossRef]
  2. Shepard, M.K.; Campbell, B.A.; Bulmer, M.H.; Farr, T.G.; Gaddis, L.R.; Plaut, J.J. The Roughness of Natural Terrain: A Planetary and Remote Sensing Perspective. J. Geophys. Res. Planets 2001, 106, 32777–32795. [Google Scholar] [CrossRef]
  3. Lucieer, A.; Stein, A. Texture-Based Landform Segmentation of LiDAR Imagery. Int. J. Appl. Earth Obs. Geoinf. 2005, 6, 261–270. [Google Scholar] [CrossRef]
  4. Trevisani, S.; Cavalli, M.; Marchi, L. Variogram Maps from LiDAR Data as Fingerprints of Surface Morphology on Scree Slopes. Nat. Hazards Earth Syst. Sci. 2009, 9, 129–133. [Google Scholar] [CrossRef]
  5. Pollyea, R.M.; Fairley, J.P. Estimating Surface Roughness of Terrestrial Laser Scan Data Using Orthogonal Distance Regression. Geology 2011, 39, 623–626. [Google Scholar] [CrossRef]
  6. Grohmann, C.H.; Smith, M.J.; Riccomini, C. Multiscale Analysis of Topographic Surface Roughness in the Midland Valley, Scotland. IEEE Trans. Geosci. Remote Sens. 2011, 49, 1200–1213. [Google Scholar] [CrossRef]
  7. Smith, M.W. Roughness in the Earth Sciences. Earth-Sci. Rev. 2014, 136, 202–225. [Google Scholar] [CrossRef]
  8. Iwahashi, J.; Kamiya, I.; Matsuoka, M.; Yamazaki, D. Global Terrain Classification Using 280 m DEMs: Segmentation, Clustering, and Reclassification. Prog. Earth Planet. Sci. 2018, 5, 1. [Google Scholar] [CrossRef]
  9. Dusséaux, R.; Vannier, E. Soil Surface Roughness Modelling with the Bidirectional Autocorrelation Function. Biosyst. Eng. 2022, 220, 87–102. [Google Scholar] [CrossRef]
  10. Doane, T.H.; Gearon, J.H.; Martin, H.K.; Yanites, B.J.; Edmonds, D.A. Topographic Roughness as an Emergent Property of Geomorphic Processes and Events. AGU Adv. 2024, 5, 1–25. [Google Scholar] [CrossRef]
  11. Misiuk, B.; Lecours, V.; Prampolini, M.; Giona Bucci, M.; Araújo, T.C. Editorial: Frontiers in Marine Geomorphometry. Front. Mar. Sci. 2024, 11, 1419518. [Google Scholar] [CrossRef]
  12. Huang, G.; Yang, L.; Cai, Y.; Zhang, D. Terrain Classification-Based Rover Traverse Planner with Kinematic Constraints for Mars Exploration. Planet. Space Sci. 2021, 209, 105371. [Google Scholar] [CrossRef]
  13. Rowan, L.C.; McCauley, J.F.; Holm, E.A. Lunar Terrain Mapping and Relative-Roughness Analysis; US Geological Survey Professional Paper; US Government Printing Office: Washington, DC, USA, 1971. [Google Scholar]
  14. Trevisani, S.; Teza, G.; Guth, P. A Simplified Geostatistical Approach for Characterizing Key Aspects of Short-Range Roughness. CATENA 2023, 223, 106927. [Google Scholar] [CrossRef]
  15. Riley, S.J.; DeGloria, S.D.; Elliot, R. A Terrain Ruggedness Index That Quantifies Topographic Heterogeneity. Intermt. J. Sci. 1999, 5, 23–27. [Google Scholar]
  16. Trevisani, S.; Teza, G.; Guth, P.L. Hacking the Topographic Ruggedness Index. Geomorphology 2023, 439, 108838. [Google Scholar] [CrossRef]
  17. Ilich, A.R.; Misiuk, B.; Lecours, V.; Murawski, S.A. MultiscaleDTM: An Open-Source R Package for Multiscale Geomorphometric Analysis. Trans. GIS 2023, 27, 1164–1204. [Google Scholar] [CrossRef]
  18. Lindsay, J.B.; Newman, D.R.; Francioni, A. Scale-Optimized Surface Roughness for Topographic Analysis. Geosciences 2019, 9, 322. [Google Scholar] [CrossRef]
  19. Trevisani, S.; Cavalli, M. Topography-Based Flow-Directional Roughness: Potential and Challenges. Earth Surf. Dyn. 2016, 4, 343–358. [Google Scholar] [CrossRef]
  20. Trevisani, S.; Rocca, M. MAD: Robust Image Texture Analysis for Applications in High Resolution Geomorphometry. Comput. Geosci. 2015, 81, 78–92. [Google Scholar] [CrossRef]
  21. Herzfeld, U.C. Vario Functions of Higher Order—Definition and Application to Characterization of Snow Surface Roughness. Comput. Geosci. 2002, 28, 641–660. [Google Scholar] [CrossRef]
  22. Haralick, R.M.; Dinstein, I.; Shanmugam, K. Textural Features for Image Classification. IEEE Trans. Syst. Man Cybern. 1973, SMC-3, 610–621. [Google Scholar] [CrossRef]
  23. Atkinson, P.M.; Lewis, P. Geostatistical Classification for Remote Sensing: An Introduction. Comput. Geosci. 2000, 26, 361–371. [Google Scholar] [CrossRef]
  24. Xu, Y.; Zhang, S.; Li, J.; Liu, H.; Zhu, H. Extracting Terrain Texture Features for Landform Classification Using Wavelet Decomposition. ISPRS Int. J. Geo-Inf. 2021, 10, 658. [Google Scholar] [CrossRef]
  25. Booth, A.M.; Roering, J.J.; Perron, J.T. Automated Landslide Mapping Using Spectral Analysis and High-Resolution Topographic Data: Puget Sound Lowlands, Washington, and Portland Hills, Oregon. Geomorphology 2009, 109, 132–147. [Google Scholar] [CrossRef]
  26. Abedini, M.J.; Shaghaghian, M.R. Exploring Scaling Laws in Surface Topography. Chaos Solitons Fractals 2009, 42, 2373–2383. [Google Scholar] [CrossRef]
  27. Mariethoz, G.; Lefebvre, S. Bridges between Multiple-Point Geostatistics and Texture Synthesis: Review and Guidelines for Future Research. Comput. Geosci. 2014, 66, 66–80. [Google Scholar] [CrossRef]
  28. Trevisani, S. MADSurfaceTexture: V1.1 plus R Package. Available online: https://zenodo.org/records/7716927 (accessed on 2 November 2024).
  29. Guth, P.; Kane, M. Slope, Aspect, and Hillshade Algorithms for Non-Square Digital Elevation Models. Trans. GIS 2021, 25, 2309–2332. [Google Scholar] [CrossRef]
  30. Dong, Z.; Wang, X.; Chen, G. Monitoring Sand Dune Advance in the Taklimakan Desert. Geomorphology 2000, 35, 219–231. [Google Scholar] [CrossRef]
  31. Ma, F.; Lü, P.; Cao, M.; Yu, J.; Xia, Z. Morphological and Sedimentary Characteristics of Raked Linear Dunes in the Southeastern Taklimakan Desert, China. Aeolian Res. 2024, 67–69, 100923. [Google Scholar] [CrossRef]
  32. Sun, W.; Gao, X. Geomorphology of Sand Dunes in the Taklamakan Desert Based on ERA5 Reanalysis Data. J. Arid Environ. 2022, 207, 104848. [Google Scholar] [CrossRef]
  33. Wang, X.; Dong, Z.; Zhang, J.; Qu, J. Formation of the Complex Linear Dunes in the Central Taklimakan Sand Sea, China. Earth Surf. Process. Landf. 2004, 29, 677–686. [Google Scholar] [CrossRef]
  34. Wang, X.; Dong, Z.; Zhang, J.; Chen, G. Geomorphology of Sand Dunes in the Northeast Taklimakan Desert. Geomorphology 2002, 42, 183–195. [Google Scholar] [CrossRef]
  35. Trevisani, S.; Skrypitsyna, T.N.; Florinsky, I.V. Global Digital Elevation Models for Terrain Morphology Analysis in Mountain Environments: Insights on Copernicus GLO-30 and ALOS AW3D30 for a Large Alpine Area. Environ. Earth Sci. 2023, 82, 198. [Google Scholar] [CrossRef]
  36. Bielski, C.; Lopez-Vazquez, C.; Grohmann, C.H.; Guth, P.L.; Hawker, L.; Gesch, D.; Trevisani, S.; Herrera-Cruz, V.; Riazanoff, S.; Corseaux, A.; et al. Novel Approach for Ranking DEMs: Copernicus DEM Improves One Arc Second Open Global Topography. IEEE Trans. Geosci. Remote Sens. 2024, 62, 1–22. [Google Scholar] [CrossRef]
  37. Guth, P.L.; Trevisani, S.; Grohmann, C.H.; Lindsay, J.; Gesch, D.; Hawker, L.; Bielski, C. Ranking of 10 Global One-Arc-Second DEMs Reveals Limitations in Terrain Morphology Representation. Remote Sens. 2024, 16, 3273. [Google Scholar] [CrossRef]
  38. Tadono, T.; Nagai, H.; Ishida, H.; Oda, F.; Naito, S.; Minakawa, K.; Iwamoto, H. Generation of the 30 M-MESH Global Digital Surface Model by Alos Prism. Int. Arch. Photogramm. Remote Sens. Spat. Inf. Sci. 2016, 41, 157–162. [Google Scholar] [CrossRef]
  39. Shumack, S.; Hesse, P.; Farebrother, W. Deep Learning for Dune Pattern Mapping with the AW3D30 Global Surface Model. Earth Surf. Process. Landf. 2020, 45, 2417–2431. [Google Scholar] [CrossRef]
  40. White, K.; Bullard, J.; Livingstone, I.; Moran, L. A Morphometric Comparison of the Namib and Southwest Kalahari Dunefields Using ASTER GDEM Data. Aeolian Res. 2015, 19, 87–95. [Google Scholar] [CrossRef]
  41. Zheng, Z.; Du, S.; Taubenböck, H.; Zhang, X. Remote Sensing Techniques in the Investigation of Aeolian Sand Dunes: A Review of Recent Advances. Remote Sens. Environ. 2022, 271, 112913. [Google Scholar] [CrossRef]
  42. Guisan, A.; Weiss, S.B.; Weiss, A.D. GLM versus CCA Spatial Modeling of Plant Species Distribution. Plant Ecol. 1999, 143, 107–122. [Google Scholar] [CrossRef]
  43. Hiller, J.K.; Smith, M. Residual Relief Separation: Digital Elevation Model Enhancement for Geomorphological Mapping. Earth Surf. Process. Landf. 2008, 33, 2266–2276. [Google Scholar] [CrossRef]
  44. Wilson, M.F.J.; O’Connell, B.; Brown, C.; Guinan, J.C.; Grehan, A.J. Multiscale Terrain Analysis of Multibeam Bathymetry Data for Habitat Mapping on the Continental Slope. Mar. Geod. 2007, 30, 3–35. [Google Scholar] [CrossRef]
  45. Isaaks, E.H.; Srivastava, R.M. An Introduction to Applied Geostatistics; Oxford University Press: New York, NY, USA, 1989. [Google Scholar]
  46. Chilès, J.-P.; Delfiner, P. Geostatistics: Modeling Spatial Uncertainty, 2nd ed.; John Wiley & Sons: Hoboken, NJ, USA, 2012. [Google Scholar]
  47. Hani, A.F.M.; Sathyamoorthy, D.; Asirvadam, V.S. A Method for Computation of Surface Roughness of Digital Elevation Model Terrains via Multiscale Analysis. Comput. Geosci. 2011, 37, 177–192. [Google Scholar] [CrossRef]
  48. Fisher, P.; Wood, J.; Cheng, T. Where Is Helvellyn? Fuzziness of Multi-Scale Landscape Morphometry. Trans. Inst. Br. Geogr. 2004, 29, 106–128. [Google Scholar] [CrossRef]
  49. Kovesi, P. Fast Almost-Gaussian Filtering. In Proceedings of the 2010 Digital Image Computing: Techniques and Applications, DICTA 2010, Sydney, NSW, Australia, 1–3 December 2010; pp. 121–125. [Google Scholar]
  50. Newman, D.R.; Cockburn, J.M.H.; Drǎguţ, L.; Lindsay, J.B. Evaluating Scaling Frameworks for Multiscale Geomorphometric Analysis. Geomatics 2022, 2, 36–51. [Google Scholar] [CrossRef]
  51. Conrad, O.; Bechtel, B.; Bock, M.; Dietrich, H.; Fischer, E.; Gerlitz, L.; Wehberg, J.; Wichmann, V.; Böhner, J. System for Automated Geoscientific Analyses (SAGA) v. 2.1.4. Geosci. Model Dev. 2015, 8, 1991–2007. [Google Scholar] [CrossRef]
  52. Lindsay, J.B. Whitebox GAT: A Case Study in Geomorphometric Analysis. Comput. Geosci. 2016, 95, 75–84. [Google Scholar] [CrossRef]
  53. Wu, Q.; Brown, A. “Whitebox”: “WhiteboxTools” R Frontend; 2022. Available online: https://cran.r-project.org/package=whitebox (accessed on 2 November 2024).
  54. James, G.; Witten, D.; Hastie, T.; Tibshirani, R. An Introduction to Statistical Learning (with Applications in R); Springer Texts in Statistics; Springer: New York, NY, USA, 2021. [Google Scholar]
  55. Memarsadeghi, N.; Mount, D.M.; Netanyahu, N.S.; Le Moigne, J. A Fast Implementation of the Isodata Clustering Algorithm. Int. J. Comput. Geom. Appl. 2007, 17, 71–103. [Google Scholar] [CrossRef]
  56. Charrad, M.; Ghazzali, N.; Boiteau, V.; Niknafs, A. Nbclust: An R Package for Determining the Relevant Number of Clusters in a Data Set. J. Stat. Softw. 2014, 61, 1–36. [Google Scholar] [CrossRef]
  57. Daynac, J.; Bessin, P.; Pochat, S.; Mourgues, R.; Shumack, S. A New Workflow for Mapping Dune Features (Outline, Crestline and Defects) Combining Deep Learning and Skeletonization from DEM-Derived Data. Geomorphology 2024, 463, 109369. [Google Scholar] [CrossRef]
  58. Breiman, L. Random Forests. Mach. Learn. 2001, 45, 5–32. [Google Scholar] [CrossRef]
  59. Jiang, S.; Sweet, L.-B.; Blougouras, G.; Brenning, A.; Li, W.; Reichstein, M.; Denzler, J.; Shangguan, W.; Yu, G.; Huang, F.; et al. How Interpretable Machine Learning Can Benefit Process Understanding in the Geosciences. Earth’s Future 2024, 12, e2024EF004540. [Google Scholar] [CrossRef]
  60. Pike, R.J. The Geometric Signature: Quantifying Landslide-Terrain Types from Digital Elevation Models. Math. Geol. 1988, 20, 491–511. [Google Scholar] [CrossRef]
  61. Wang, Z.; Brenning, A. Unsupervised Active–Transfer Learning for Automated Landslide Mapping. Comput. Geosci. 2023, 181, 105457. [Google Scholar] [CrossRef]
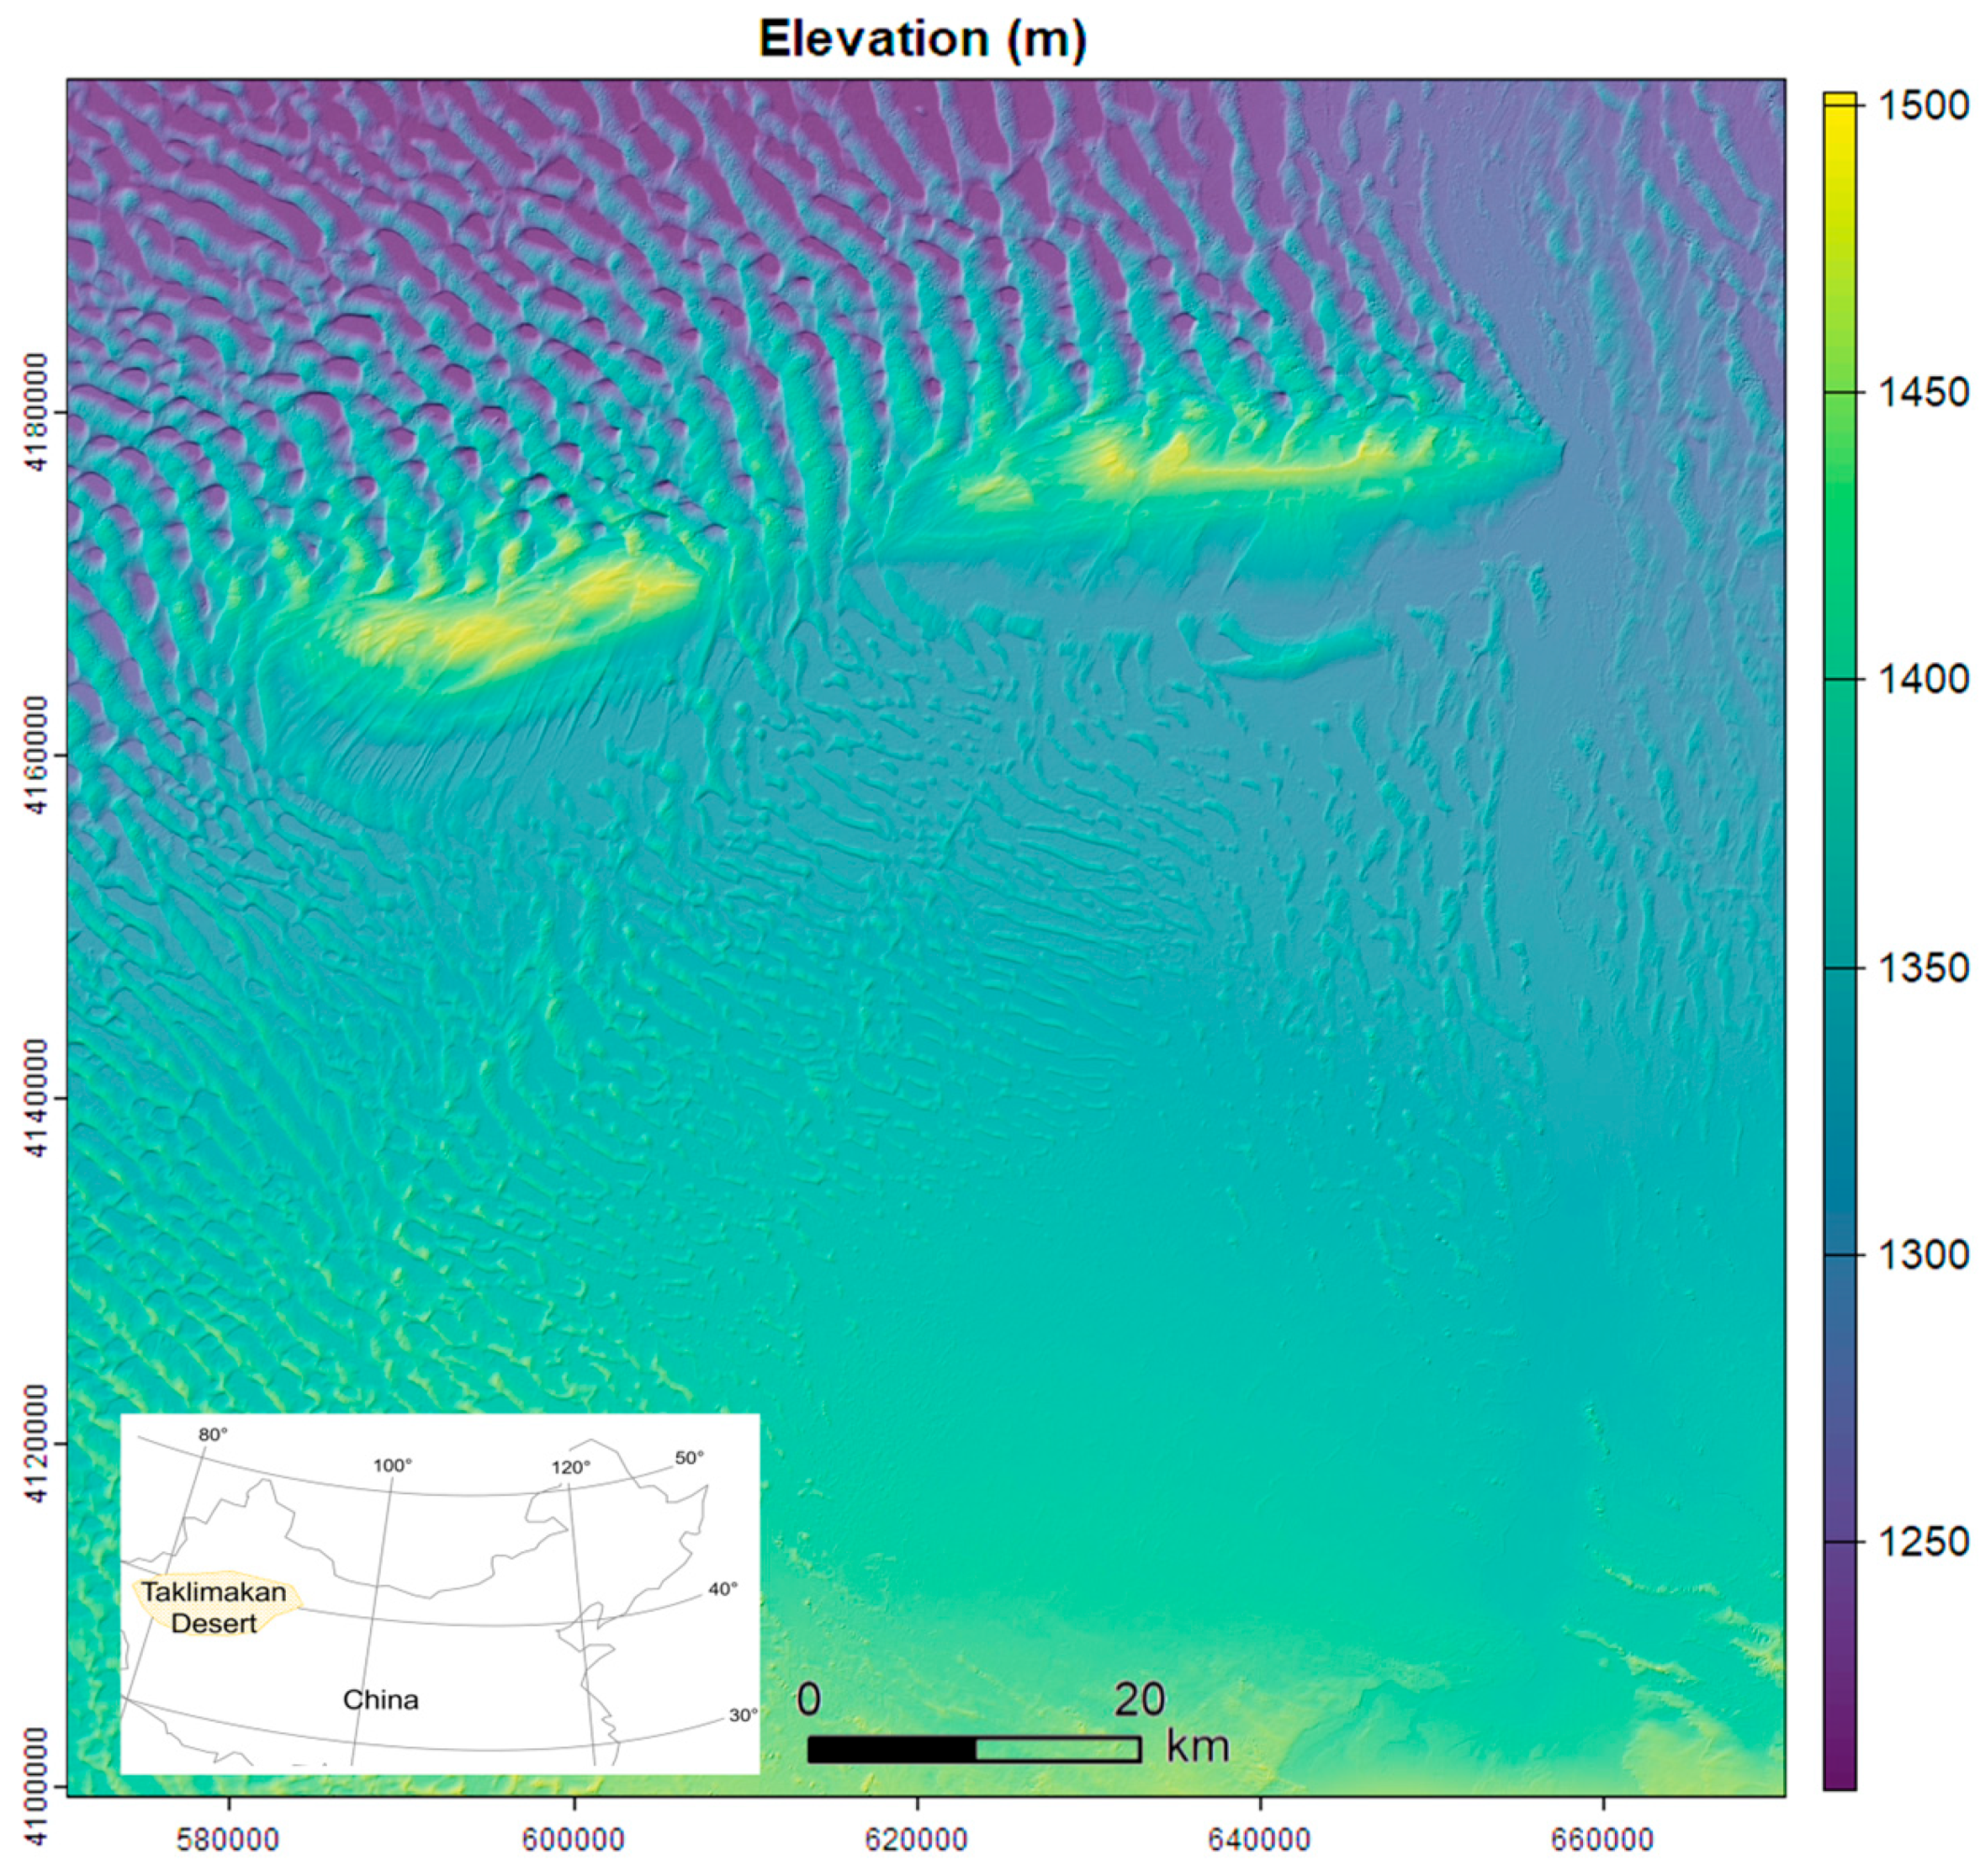
Figure 1. Reprojected COP DEM (30 m resolution, UTM F44) of the area of interest overlaid on the hillshade.
Land 13 01843 g001
Figure 2. Sentinel-2 true color RGB image (bands 4, 3, and 2) of the study area, with the main dune morphologies labeled.
Land 13 01843 g002
Figure 3. Main dune morphologies in the study area, visualized using Sentinel-2 imagery (a), hillshade (b), and residual DEM (c). From top to bottom: network/transverse dunes, longitudinal and transverse dunes, and dome-shaped dunes.
Land 13 01843 g003
Figure 4. Mixed morphologies in the area of interest, visualized using Sentinel-2 imagery (a), hillshade (b), and residual DEM (c). From top to bottom: outcropping bedrock with shadow and linear dunes, fluvial morphology, and a flat area with minor dune morphologies.
Land 13 01843 g004
Figure 5. RA direction, where the RA strength is higher than 0.3, overlaid on the hillshade (a) and the residual DEM (b) calculated for level L2.
Land 13 01843 g005
Figure 6. Omnidirectional short-range roughness (m) for the different resolutions. Different color scales for each diagram.
Land 13 01843 g006
Figure 7. Roughness anisotropy strength at different resolutions. Different color scales for each diagram.
Land 13 01843 g007
Figure 8. RGB image (each band normalized) of 3 omnidirectional roughness indexes computed at different resolutions (B = L1; G = L2; R = L4). Despite the high correlation of the three indexes, they differentiate very well the morphological features of the area. For example, they markedly highlight the characteristic smoothness of interdune areas of the longitudinal dunes south of the mountain ridge.
Land 13 01843 g008
Figure 9. RGB image (each band normalized) of 3 anisotropy strength roughness indexes computed at different resolutions (B = L1; G = L4; R = L16). In the dune fields north of the mountains, long-wavelength anisotropic features prevail; in contrast, for the southern longitudinal dunes, shorter anisotropic features (L4) are highlighted.
Land 13 01843 g009
Figure 10. Landscape clustered according to multiscale surface roughness indexes. The cluster centers in terms of OR and RA are described in Figure 11.
Land 13 01843 g010
Figure 11. Cluster centers of the 7 classes resulting from K-means clustering for OR and RA at the different levels.
Land 13 01843 g011
Figure 12. MRI clustering results in the area of the northern dune field, characterized by network and transverse dunes. Clustering results (d), Sentinel-2 imagery (a), hillshade (b), and residual DEM (c).
Land 13 01843 g012
Figure 13. MRI clustering results in the area of the southern longitudinal dune fields. Clustering results (d), Sentinel-2 imagery (a), hillshade (b), and residual DEM (c).
Land 13 01843 g013
Figure 14. MRI clustering results in the area with fluvial morphology, outcropping bedrock, and dome dune fields. Clustering results (d), Sentinel-2 imagery (a), hillshade (b), and residual DEM (c).
Land 13 01843 g014
Figure 15. Manual classification of crest lines (a) for large dunes using visual analysis of slope (b), profile curvature (c), and residual DEM (d). Crest lines are associated with high positive profile curvature, strongly positive residual DEM, and low slope. These locations are then located in areas in which the neighborhood is characterized by an abrupt variation in the selected geomorphometric derivatives.
Land 13 01843 g015
Figure 16. Probability of observing a crest obtained by means of RF considering the GDs integrated with the MRIs (a) and only the five GDs (b) to obtain details of the study area, which is located on the western mountain ridge. The RF model integrating the MRIs provides a more focused prediction of crest lines of large dunes. In (c), the prediction of the crest lines of the two RF models is compared. Pixels with a probability higher than 0.8 have been classified as crests. The transparent color is where both models predicted a not-crest pixel, green is where both models predicted a crest, and red and blue are where, respectively, only RF GDs and RF GDs + MRIs predicted a crest.
Land 13 01843 g016
Figure 17. Variables’ importance in the two RF models according to the mean decrease in the Gini index ((a), RF based on GDs; (b), RF based on GDs integrated with MRIs).
Land 13 01843 g017
Figure 18. Prediction of crest lines with the RF model based on GDs and MRIs of an unseen area ((c), green box) external to the one with reference data used for training and testing ((c), red box). The reference crest lines (a) have been manually digitized by means of visual analysis of the profile curvature, the residual DEM, and the slope; the predicted crest lines have been derived as crests of all of the pixels with a probability above 0.8. The predicted crest lines are compared with the reference data (b). Green pixels are correctly classified as crests; red and blue pixels are incorrectly classified, respectively, as crests and not crests.
Land 13 01843 g018
Table 1. Main diagnostics of the RF models related to the out-of-bag (OOB) and test samples. The RF model using the MRIs is characterized by better performance, as represented by the area under the curve (AUC) and by the root mean squared error computed on the test dataset (RMSEtest).
RF GDs
Confusion Matrix (Training)
Reference DataClass Error
OOB = 6.56% Not CrestCrest
AUC = 0.973PredictedNot Crest605310.049
RMSEtest = 0.249Crest322920.099
RF GDs + MRIs
Confusion Matrix (Training)
Reference DataClass Error
OOB = 5.31% Not CrestCrest
AUC = 0.995PredictedNot Crest617190.03
RMSEtest = 0.153Crest322920.099
Table 2. Classification diagnostics of crest lines obtained by means of RF and by classifying the pixel as a crest line when the probability is above 0.8.
Contingency Table
Reference DataRow Totals
Not CrestCrest
PredictedNot Crest412,4349298421,732
Crest688514,93921,824
Column Totals419,31924,237443,556
Class Statistics
ClassUser’s AccuracyProducer’s AccuracyOverall Accuracy = 96.35%
Not Crest97.80%98.36%Kappa2 = 0.629
Crest68.45%61.64%
Average83.12%80.00%
Disclaimer/Publisher’s Note: The statements, opinions and data contained in all publications are solely those of the individual author(s) and contributor(s) and not of MDPI and/or the editor(s). MDPI and/or the editor(s) disclaim responsibility for any injury to people or property resulting from any ideas, methods, instructions or products referred to in the content.