Article

The Pollen Representation of Vegetation and Climate Along an Altitudinal Gradient on the Eastern Tibetan Plateau

1
College of Geography and Tourism/HIST Hengyang Base, Hengyang Normal University, Hengyang 421010, China
2
Key Laboratory of Land Surface Pattern and Simulation, Institute of Geographic Sciences and Natural Resources Research, Chinese Academy of Sciences, Beijing 100101, China
3
Department of Land Resource and Urban Planning, Hebei GEO University, Shijiazhuang 050031, China
4
College of Earth and Planetary Sciences, University of Chinese Academy of Sciences, Beijing 100049, China
*
Author to whom correspondence should be addressed.
Land 2024, 13(11), 1866; https://doi.org/10.3390/land13111866
Submission received: 13 October 2024 / Revised: 31 October 2024 / Accepted: 6 November 2024 / Published: 8 November 2024
(This article belongs to the Special Issue Pollen-Based Reconstruction of Holocene Land-Cover)

Abstract

:
Understanding the relationship between modern pollen assemblages and vegetation/climate for various elevations is essential for accurately interpreting fossil pollen records and conducting quantitative climate reconstructions in mountainous regions. However, these relationships for the Tibetan Plateau, which is the highest and one of the most ecologically sensitive regions globally, are still scarce. We present modern pollen assemblages from 78 topsoil samples collected along altitudinal gradients from 498 to 4046 m above sea level on the eastern Tibetan Plateau. They were distributed in alpine shrub meadows, coniferous forests, and mixed broad-leaved and coniferous forest vegetation types. Multivariate statistical methods, including discriminant analysis, indicator species analysis, logistic regression, and redundancy analysis, were employed to identify relationships among modern pollen assemblages, vegetation types, and climate along an altitudinal gradient. The results revealed that (1) vegetation types along the altitudinal gradient can be effectively differentiated by comparing pollen assemblages, discriminant analysis, and indicator species analysis; (2) the conifer/broadleaf pollen ratio (C/B) efficiently distinguished coniferous forests (C/B > 5) from mixed forests (C/B < 5); and (3) variations in modern pollen assemblages are primarily influenced by temperature, with pollen ratios, such as Artemisia/Cyperaceae (Art/Cy) and Tsuga/(Tsuga + Abies + Picea) (T/TAP), displaying notable altitudinal and temperature differences. These findings demonstrate that variations in modern pollen assemblages on the eastern Tibetan Plateau differentiate between vegetation types and correlate with temperature variations associated with elevation. The results provide insights for future paleovegetation and paleoclimatic reconstructions for similar mountainous regions.

1. Introduction

Vegetation in mountainous regions is fragile and highly sensitive to climate change [1,2,3], making the reconstruction of past vegetation a key research focus [4,5]. Reconstructing past vegetation improves ecological modeling in mountainous regions by supplying critical data on vegetation dynamics and climate interactions, which are crucial for forecasting ecosystem responses to climate change [6]. Pollen analysis has been commonly used as the primary approach for quantitative vegetation and climate reconstruction. The reconstruction accuracy depends on utilizing a broad range of modern pollen samples and establishing robust statistical relationships between modern pollen and the current vegetation and climate in mountainous regions.
Currently, modern pollen studies in typical mountainous regions are limited, and the relationships between pollen, vegetation, and climate along altitudinal gradients remain complex. Pollen dispersal patterns in lowlands do not apply to mountainous regions [7]. In these regions, modern pollen distributions are closely linked to the spatial arrangement of vegetation. Previous studies have shown that vegetation types along altitudinal transects can be effectively distinguished by their modern pollen assemblages (e.g., Kilimanjaro [8]; Kunlun and Qilian Mountains [9,10]) and pollen indicators (e.g., Altai Mountains [11]; southeastern Tibetan Plateau [12]). Furthermore, strong correlations between pollen ratios and climatic factors such as temperature (e.g., deciduous/evergreen tree pollen in the Shennongjia Mountains [13]) and precipitation (e.g., Artemisia/Chenopodiaceae in the Tianshan, Kunlun, and Qilian Mountains [9,14]) have been established. However, unique pollen dispersal patterns influenced by up- and down-valley winds and rainfall have been reported. For example, (1) pollen from low-elevation anemophilous taxa (e.g., Pinus, Betula, Juglans) is often transported to higher subalpine and alpine regions ([12]), a pattern observed in various mountain ranges worldwide [15,16,17,18,19]. Moreover, (2) some pollen, such as Tsuga, is carried downslope by rainfall and surface runoff [20], (3) while nonlinear relationships between pollen assemblages and environmental factors have also been documented [12,20,21]. Therefore, systematically clarifying the complex interactions between modern pollen, vegetation, and climate across altitudinal gradients in mountainous regions is essential.
Modern pollen studies in some mountainous areas of the Tibetan Plateau (TP) do exist, including research on the northwestern Kunlun Mountains [22] and the mountains of southern TP [12,15,17,20,21] and northern TP [9,10]. Previous studies have laid essential groundwork for understanding pollen distribution, vegetation patterns, and climate impacts in mountainous regions. For instance, studies on the Yunnan–Guizhou Plateau [12] and Western Himalaya [21] identified major vegetation types and their associated pollen taxa, providing a baseline for altitudinal pollen transport under variable climate conditions. Others, including studies on the Big Bend region of the Yarlung Zangbo River [20] and Yulong Mountain [23], have specifically highlighted the role of winds in pollen dispersal across elevation gradients. However, research on the relationship between modern pollen, vegetation, and climatic factors along altitudinal gradients in the eastern TP remains limited. Most studies in this region have predominantly focused on desert, meadow, and steppe vegetation types in basins [24,25,26], leaving a potential gap in our understanding of pollen assemblages across different altitudes.
This study presents modern pollen assemblages collected from the mountainous regions of the eastern TP. We explored the relationship between modern pollen, contemporary vegetation, and climate along an altitudinal gradient, by using numerical analyses, including indicator species, ordination, discriminant, logistic regression, and correlation analyses. The objectives were to identify specific differences in pollen composition among vegetation types, and to examine the correlation between modern pollen data and climate variables.

2. Materials and Methods

2.1. Regional Setting

This study was conducted on the northern edge of the Hengduan Mountains on the eastern TP (longitude: 102°26′–104°49′ E, latitude: 31°32′–33°43′ N, elevation range: 498–4046 m above sea level (a.s.l.), Figure 1). The northeast–southwest-oriented mountains act as a barrier to the Asian summer monsoon vapor transmission. The climate is mainly controlled by the southeastern subtropical monsoon. Mean annual temperature (MAT) and mean annual precipitation (MAP) are 1.7 °C and 678 mm at Zoige station, 6.0 °C and 730 mm at Songpan station, and 15.6 °C and 1186 mm at Dujiangyan station, respectively (Figure 2 and Figure 3). There is a general gradient from low summer temperatures (as low as 8.2 °C) in the highlands, to high summer temperatures (up to 25.7 °C) in the lowlands.
Three major vegetation types (shrub meadows, coniferous forests, and mixed forests) followed the altitudinal belts. The boundaries of the vegetation types were approximately 4000 and 3000 m a.s.l. (Figure 1B,C). Biogeographically, the study area and the surrounding mountains primarily display alpine and subalpine characteristics, with subtropical elements at lower elevations.
A subtropical climate prevails below 2000 m a.s.l., with the MAT exceeding 14 °C and a MAP of approximately 1000 mm. Evergreen broad-leaved species are dominated by Quercus semecarpifolia and Q. aquifolioides. The subtropical coniferous species are dominated by Pinus massoniana and Cunninghamia lanceolata. Common species within this elevation range include Cotinus coggygria var. cinereus, Symplocos sumuntia, Rhododendron simsii, Cupressus funebris, Artemisia argyi, Carex spp., and Urtica fissa. Mountain yellow and red soils predominantly develop under the forest [28].
At 2000–3000 m, the vegetation is dominated by mixed coniferous and deciduous forests and includes Betula platyphylla, B. potaninii, Pinus armandii, Picea wilsonii, P. purpurea, Tsuga chinensis, and Acer davidii, accompanied by some species of Ericaceae, Abies, Lauraceae, Asteraceae, Fabaceae, and Artemisia. Leached brown forest soils are mainly present in this area [28,29,30].
At 3000–4000 m, subalpine evergreen coniferous forests are dominated by spruce (Picea purpurea, P. asperata, P. balfouriana) and fir (Abies faxoniana, A. squamata, A. faberi). The associated species include Caragana sinica, Rhododendron spp., Sorbus sp., Aconitum tanguticum, Lonicera tangutica, Carex spp., and Poa sp. High-mountain Quercus shrubberies are sporadically found on southern slopes. These species are distinct from southwestern China and are likely remnants of vegetation from the plateau uplift process. Additionally, organic-rich meadow soils dominate, with slightly acidic pH levels. [28,29,30].
At 4000–4400 m, the alpine shrubs and meadow vegetation are dominated by Carex spp., Kobresia spp., Rhododendron spp., Salix sp., and Anemone spp., accompanied by Juniperus sp. and Eremogone kansuensis. Soil layers are thinner with reduced organic matter content in this area [28,29,30]. An alpine periglacial desert appears between 4400 and 4600 m a.s.l. and is sparsely vegetated with cushions or rosette-like species, such as Saussurea spp., Soroseris sp., and Meconopsis horridula [28,30]. Additionally, the landscape is characterized by bare rocks or perennial ice and snow cover above 4600 m a.s.l. [29].

2.2. Sample Collection and Vegetation Survey

Seventy-eight topsoil samples were collected from natural vegetation (shrub meadow, coniferous forest, and mixed forest) along an altitudinal gradient ranging from 498 to 4046 m a.s.l. on the eastern TP (Figure 3, Table S1) in July and August 2022. At each site, five topsoil samples (1 cm depth) were collected from a flat area of approximately 5 × 5 m and subsequently amalgamated. The top 1 cm of soil contains high pollen concentrations, well-preserved and representative of recent deposition. The homogenization process involved combining and thoroughly mixing subsamples in a sterile container to ensure uniform representation of the sample area and reduce within-site variability. To prevent cross-contamination, sterile instruments were used at each sampling location, with tools rigorously cleaned with ethanol between each site. Samples were stored in a vehicle-mounted cooler and transported under refrigeration to the laboratory. The vegetation composition was meticulously documented within distinct layers: the tree layer (~100 × 100 m quadrat), the shrub layer (~10 × 10 m quadrat), and the herb layer (~1 × 1 m quadrat). The coverage of each taxon was estimated visually and recorded in the field. The latitude, longitude, and elevation of the sampling sites were measured using a handheld GPS (Garmin Extrex 32X, Beijing, China).

2.3. Pollen Analysis and Data Processing

The samples were treated according to standard methods [31]. Before chemical treatment, the plant residues of each sample were sieved using a 2 mm screen. An exotic Lycopodium tablet (10,315 spores/tablet) was added to estimate the pollen concentration. Standard procedures were followed, involving HCl, KOH, HF, and acetolysis (9 H2SO4:1 CH3COOH) treatments. Pollen residues were obtained through a 10 μm mesh sieve and were identified using the optical microscopy of ZEISS (Shanghai, China) at 400× magnification. The microscope was equipped with Koehler illumination and a high-resolution microscopy camera. A minimum of 500 terrestrial pollen grains were counted per sample. In some samples (e.g., ZB22-62, ZB22-64 and ZB22-70), due to the exceptionally high pollen count of Salix, Cupressaceae, and Alnus, at least 1000 terrestrial pollen grains were counted to ensure a statistical representation of other less widespread taxa.
Pollen was identified to the lowest possible taxonomic level using pollen atlas [32,33] and reference collections. The pollen percentages were calculated based on the terrestrial pollen sum. Pollen diagrams were generated using Tilia 2-0-29 software, and pollen zonation was determined using CONISS [34].

2.4. Modern Climate Data

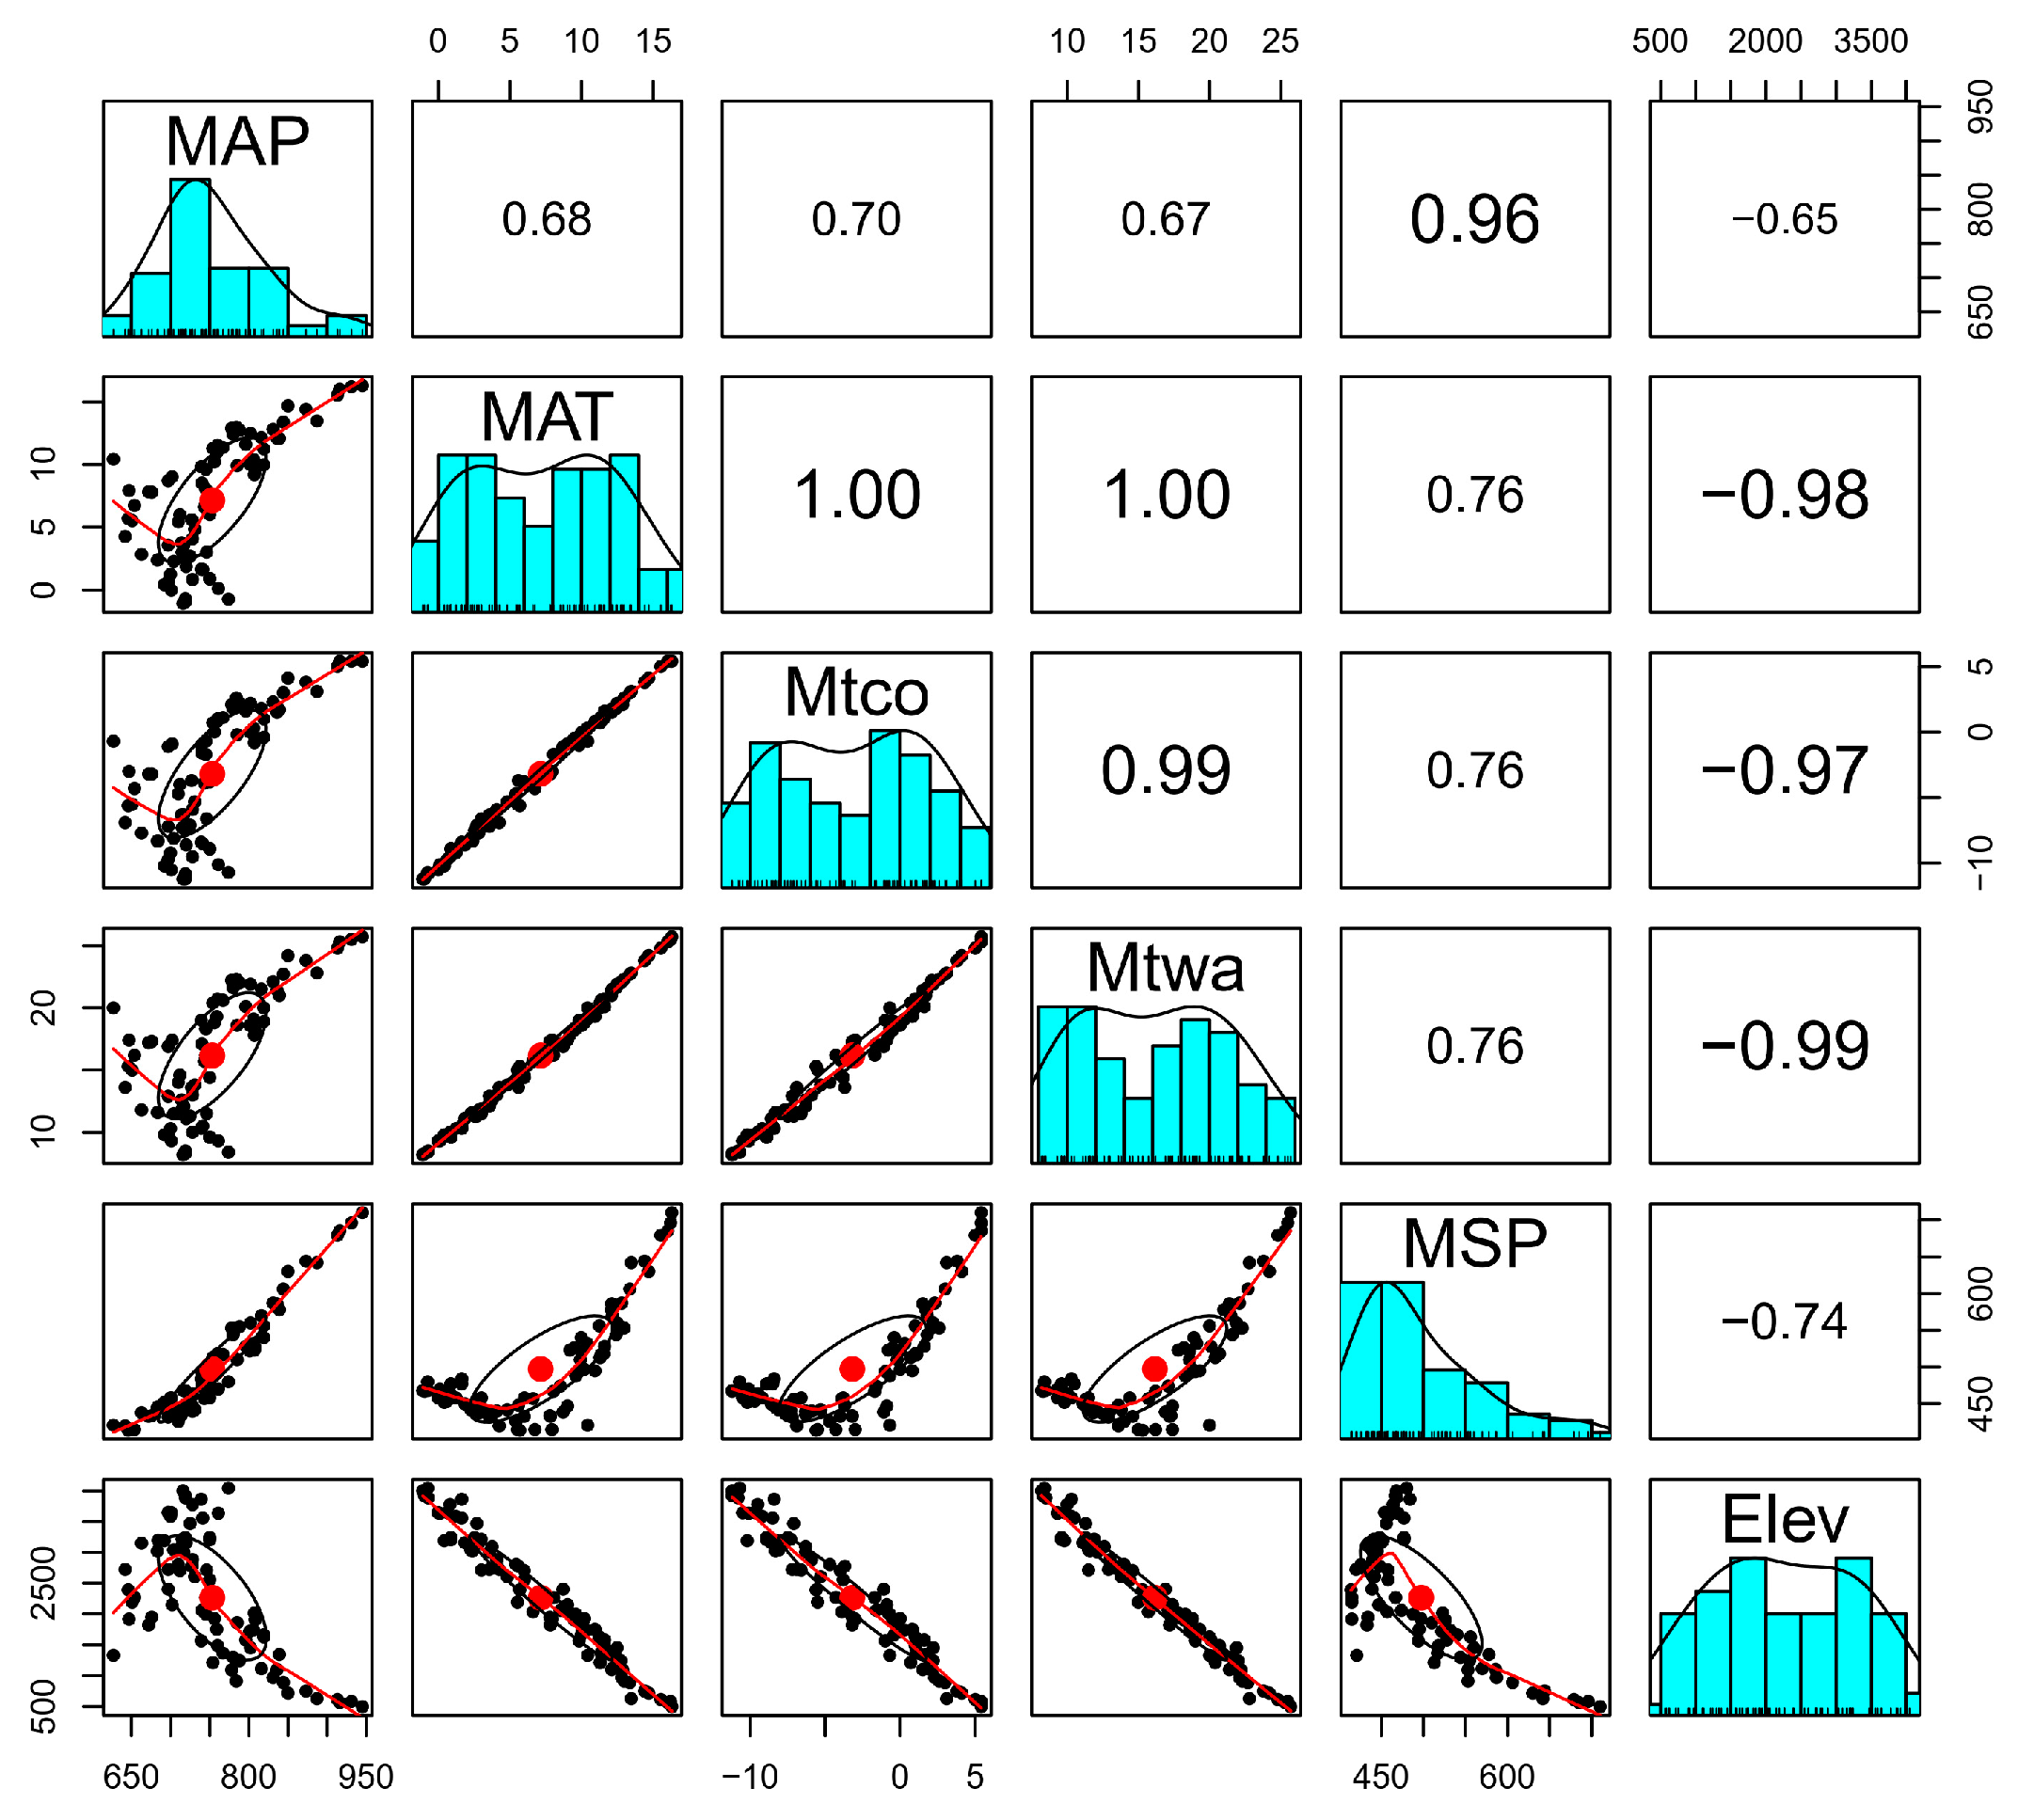
To investigate the relationship between pollen assemblages and climate, five climatic variables were computed for each site: mean annual precipitation (MAP); mean annual temperature (MAT); mean temperature of coldest month (Mtco); mean temperature of warmest month (Mtwa); and mean summer precipitation (MSP). The climate data for the 78 sample sites were obtained from WorldClim (https://www.worldclim.org, (accessed on 28 March 2024)). This dataset provides spatially interpolated monthly climate data for global land areas at a high resolution of approximately 1 km2 and is recognized for its reliability in ecological studies [14,35]. The ‘pairs.panels’ function, part of the package “psych” in R [36], is commonly used to create scatterplot matrices, displaying the relationships between multiple variables simultaneously. The ‘pairs.panels’ function was used to visualize the correlations among the climate variables.

2.5. Multivariate Analyses

Indicator species analysis was applied to identify species characterizing specific vegetation types by using the “multipatt” function from the package “indicspecies” [37,38] in R software (R-4.3.3). The indicator value (IndVal) in the results, a combination of specificity and fidelity values, determined indicator species, and the p-value of the permutational test indicated the significance of the indicator species [39].
Detrended correspondence analysis for modern pollen data indicated homogeneity (first ordination axis length: 2.13 SD ‘standard deviation unit’). Therefore, redundancy analysis (RDA) was adopted to explore pollen samples, taxon variations, and their relationships with climatic variables [40,41,42]. Ordination analysis included 29 pollen taxa that occurred in at least two samples, with percentages > 2% in at least one sample. The raw percentages of the selected pollen taxa were standardized using a square-root transformation before analysis. Variance Inflation Factors (VIFs) from the RDA were used to detect multicollinearity among the variables, and those with highly correlated predictors were excluded until the VIF values were minimized [43,44,45]. Ordination analysis was performed using the package “vegan” in the R 4.3.3 software [46,47].
Discriminant analysis was used to verify the pollen–vegetation relationship using SPSS 25.0 software [48,49,50]. Discriminant functions can classify samples into a priori group, and new samples into one of the priori groups. Discriminant analysis can validate classifications from the cluster analysis of CONISS and the results of the RDA and evaluate the effectiveness of modern pollen assemblages as analogs for specific vegetation types. The practicality of the discriminant functions was assessed using published samples from adjacent areas (ZB17 samples from [27]) to support the identification of modern analogs in future fossil pollen studies.
Logistic regression modeling was applied to the conifer/broadleaf (C/B) ratio to examine the threshold for separating vegetation types. Coniferous forest and mixed forest were coded as “1” and “0” prior to analysis, respectively. The Grubbs statistic (also known as the Pearson–Hartley or the Extreme Studentized Deviate) was used to test for outliers. Pollen threshold values were consistent with pollen–vegetation relationships, and pollen distributions with probabilities greater than 0.5 matched the current geographical ranges of plants [51]. Logistic regression was performed using Past 4.17 software [52].

3. Results

3.1. Vegetation Investigation Results

The altitudinal vegetation gradient in the study area encompasses alpine shrub meadows, subalpine coniferous forests, and mixed forests (Figure 1 and Figure 3). More than 600 taxa were recorded across the 78 surveyed sites (Table S1). Dominant herbaceous taxa around sampling sites included Cyperaceae (e.g., Carex, Hypolytrum), Poaceae (e.g., Elymus dahuricus), Rosaceae (e.g., Argentina anserina), Asteraceae (e.g., Artemisia stechmanniana, Taraxacum platypecidum), Polygonaceae (e.g., Rumex patientia), Ranunculaceae (e.g., Thalictrum), Apiaceae (e.g., Conioselinum smithii), and Fabaceae (e.g., Melilotus officinalis). The shrubby layer was primarily composed of Rosaceae (e.g., Dasiphora fruticose and Sorbaria sorbifoli), Ericaceae (e.g., Rhododendron przewalskii), Elaeagnaceae (e.g., Hippophae rhamnoides), and Salicaceae (e.g., Salix integra). The trees were mainly Picea (e.g., Picea asperata), Abies (e.g., Abies fabri), Pinus (e.g., Pinus densata), Quercus (e.g., Quercus aquifolioides), Cupressaceae (e.g., C. lanceolata, Platycladus orientalis), Betula (e.g., Betula albosinensis), and Juglandaceae (e.g., Juglans regia).
Different vegetation types were characterized by distinct plant taxa in the study area (Table 1). The shrub meadows were dominated by Salix, Rosaceae, Cyperaceae, and Ericaceae. The coniferous forest was marked with Picea, Salix, Abies, and Betula. Mixed forests predominantly contained Pinus, Alnus, Juglans, Populus, and Cupressaceae species. Vegetation cover was the lowest in the shrub meadow (mean of approximately 77%), whereas coniferous forest (approx. 92%) and mixed forest (approx. 90%) exhibited higher vegetation coverage.

3.2. Pollen Assemblages in the Three Vegetation Types

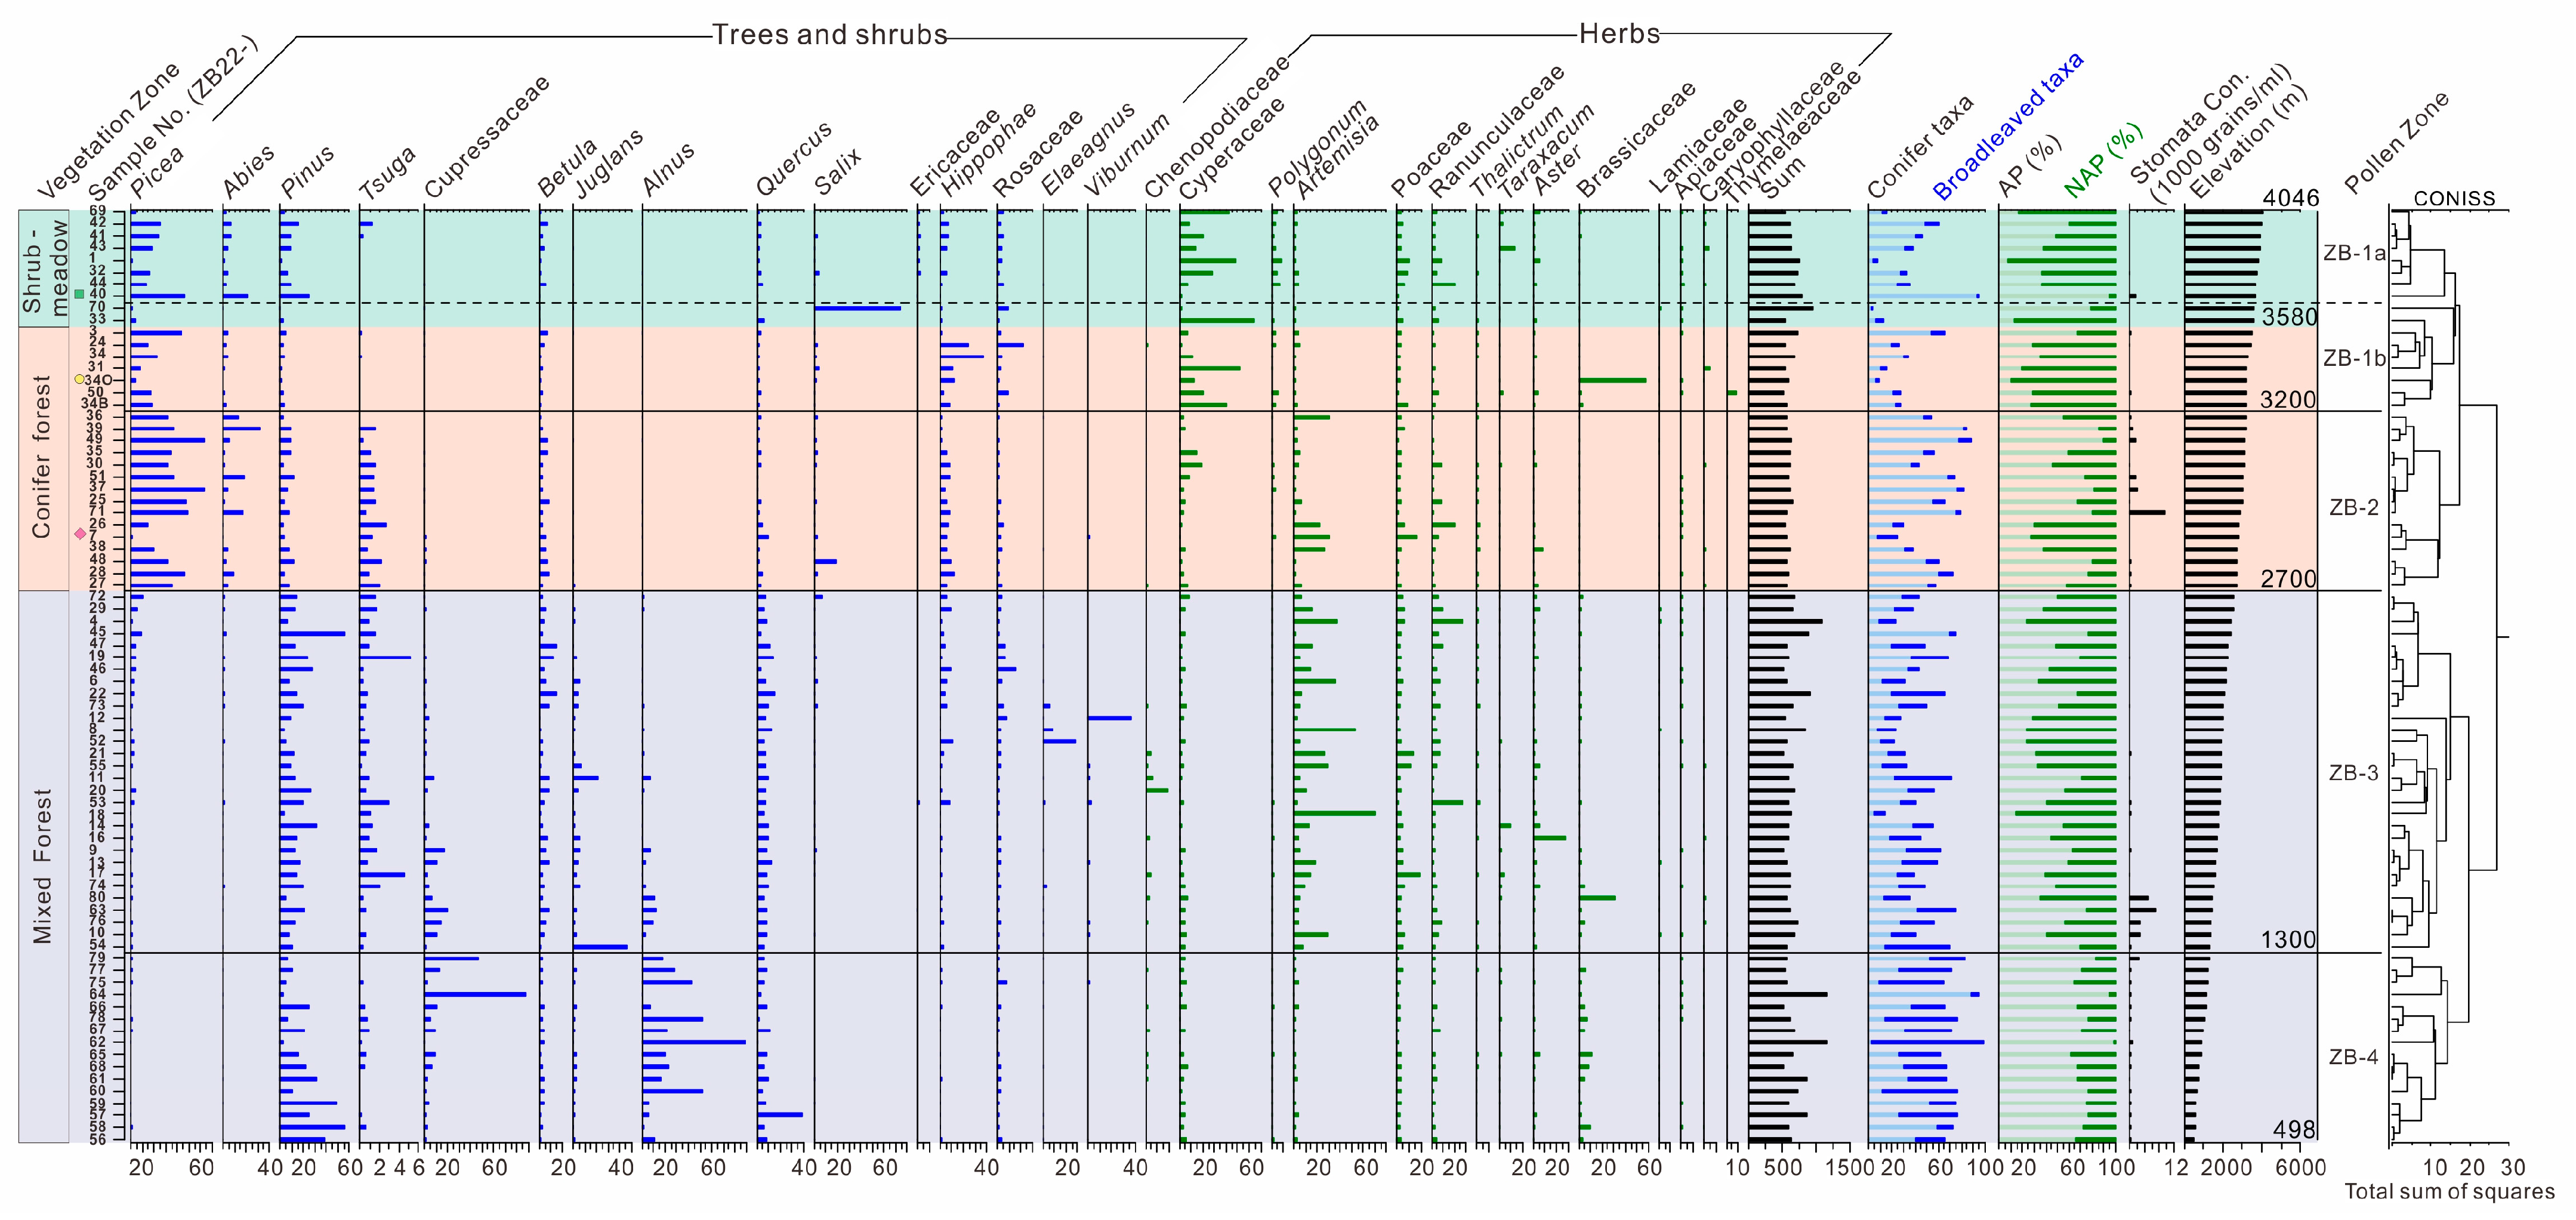
One hundred pollen taxa were identified in topsoil samples. Tree pollen, dominated by Picea, Abies, Pinus, Betula, Cupressaceae, Juglans, Alnus, Quercus, and Tsuga, accounted for >60% of most coniferous forest and mixed forest samples, but <40% in the shrub meadow. Shrub pollen was dominated by Salix, Hippophae, and Rosaceae. Ericaceae were consistently observed at a lower level. Herb pollen contained mainly Cyperaceae, Artemisia, Poaceae, and Ranunculaceae, with some frequently observed taxa, such as Polygonum, Brassicaceae, Taraxacum, and Aster. The zonation of the pollen diagrams supported by the cluster analysis was denoted as ZB-1a, ZB-1b, ZB-2, ZB-3, and ZB-4 (Figure 4). The pollen percentages varied significantly across the three vegetation types, as described below.
Subzone ZB-1a (8 sites) mainly corresponded to the shrub meadow. This zone showed high proportions of herbal pollen (4.3–85.5%, the lowest and highest values, respectively; 47.7%, the mean value) and was dominated by Cyperaceae (2.1–48.7%, 21.2%), Poaceae (0.3–9.4%, 4.8%), and Ranunculaceae (0.4–20.5%, 6.0%). There were low amounts of tree and shrub pollen, with notable contributions from Picea (1.5–46.8%, 18.4%), Pinus (0.9–25.4%, 9.8%), and Abies (0.7–20.6%, 6.1%). Hippophae, Rosaceae, and Ericaceae pollen were commonly found in this zone.
The samples from subzones ZB-1b and ZB-2 (21 sites) were mainly from coniferous forests. The pollen assemblages in the two zones exhibited a substantial influx of tree pollen (16.6–92.7%, 64.7%), predominantly Picea (1.2–63.0%, 28.2%), Abies (0–32.3%, 5.4%), Pinus (0.3–12.1%, 5.1%), and Betula (0.5–8.1%, 3.7%). Shrub and herb pollen were common, including Hippophae (0.9–37.1%; 7.9%), Cyperaceae (0.5–64.5%; 12.0%), Artemisia (0.9–30.3%; 6.7%), Poaceae (0.3–16.9%; 3.4%), and Ranunculaceae (0.4–21.0%; 3.9%).
ZB-3 and ZB-4 (46 sites) were all from a mixed forest. The pollen assemblages of the two zones were dominated by tree pollen (16.8–99.1%, 66.8%) including Pinus (1.8–55.9%, 17.1%), Cupressaceae (0–86.9%, 6.9%), Betula (0.3–15%, 4.4%), Juglans (0–46.6%, 3.3%), Alnus (0–88.9%, 10.0%), and Quercus (0.4–39.2%, 8.2%). Shrub and herb pollen displayed lower percentages and primarily consisted of Cyperaceae, Poaceae, Ranunculaceae, and Hippophae. The two pollen zones were primarily distinguished by higher percentages of Pinus, Cupressaceae, Alnus, and Brassicaceae in ZB-4, and lower percentages of Tsuga, Juglans, and Artemisia.

3.3. Numerical Analysis Results

A total of 29 major terrestrial pollen taxa (see Figure 4) were utilized in indicator species analysis, discriminant analysis, and redundancy analysis. Indicator species analysis highlighted Ericaceae and Apiaceae as good indicators of shrub meadows. No significant indicator species were found in coniferous forests. The three indicator pollen taxa in the mixed forest were Juglans, Cupressaceae, and Alnus. However, Picea, Abies, Salix, and Caryophyllaceae could be used as indicator species for combined shrub meadows and coniferous forests. Tsuga was an indicator of both coniferous and mixed forests (Table 1).
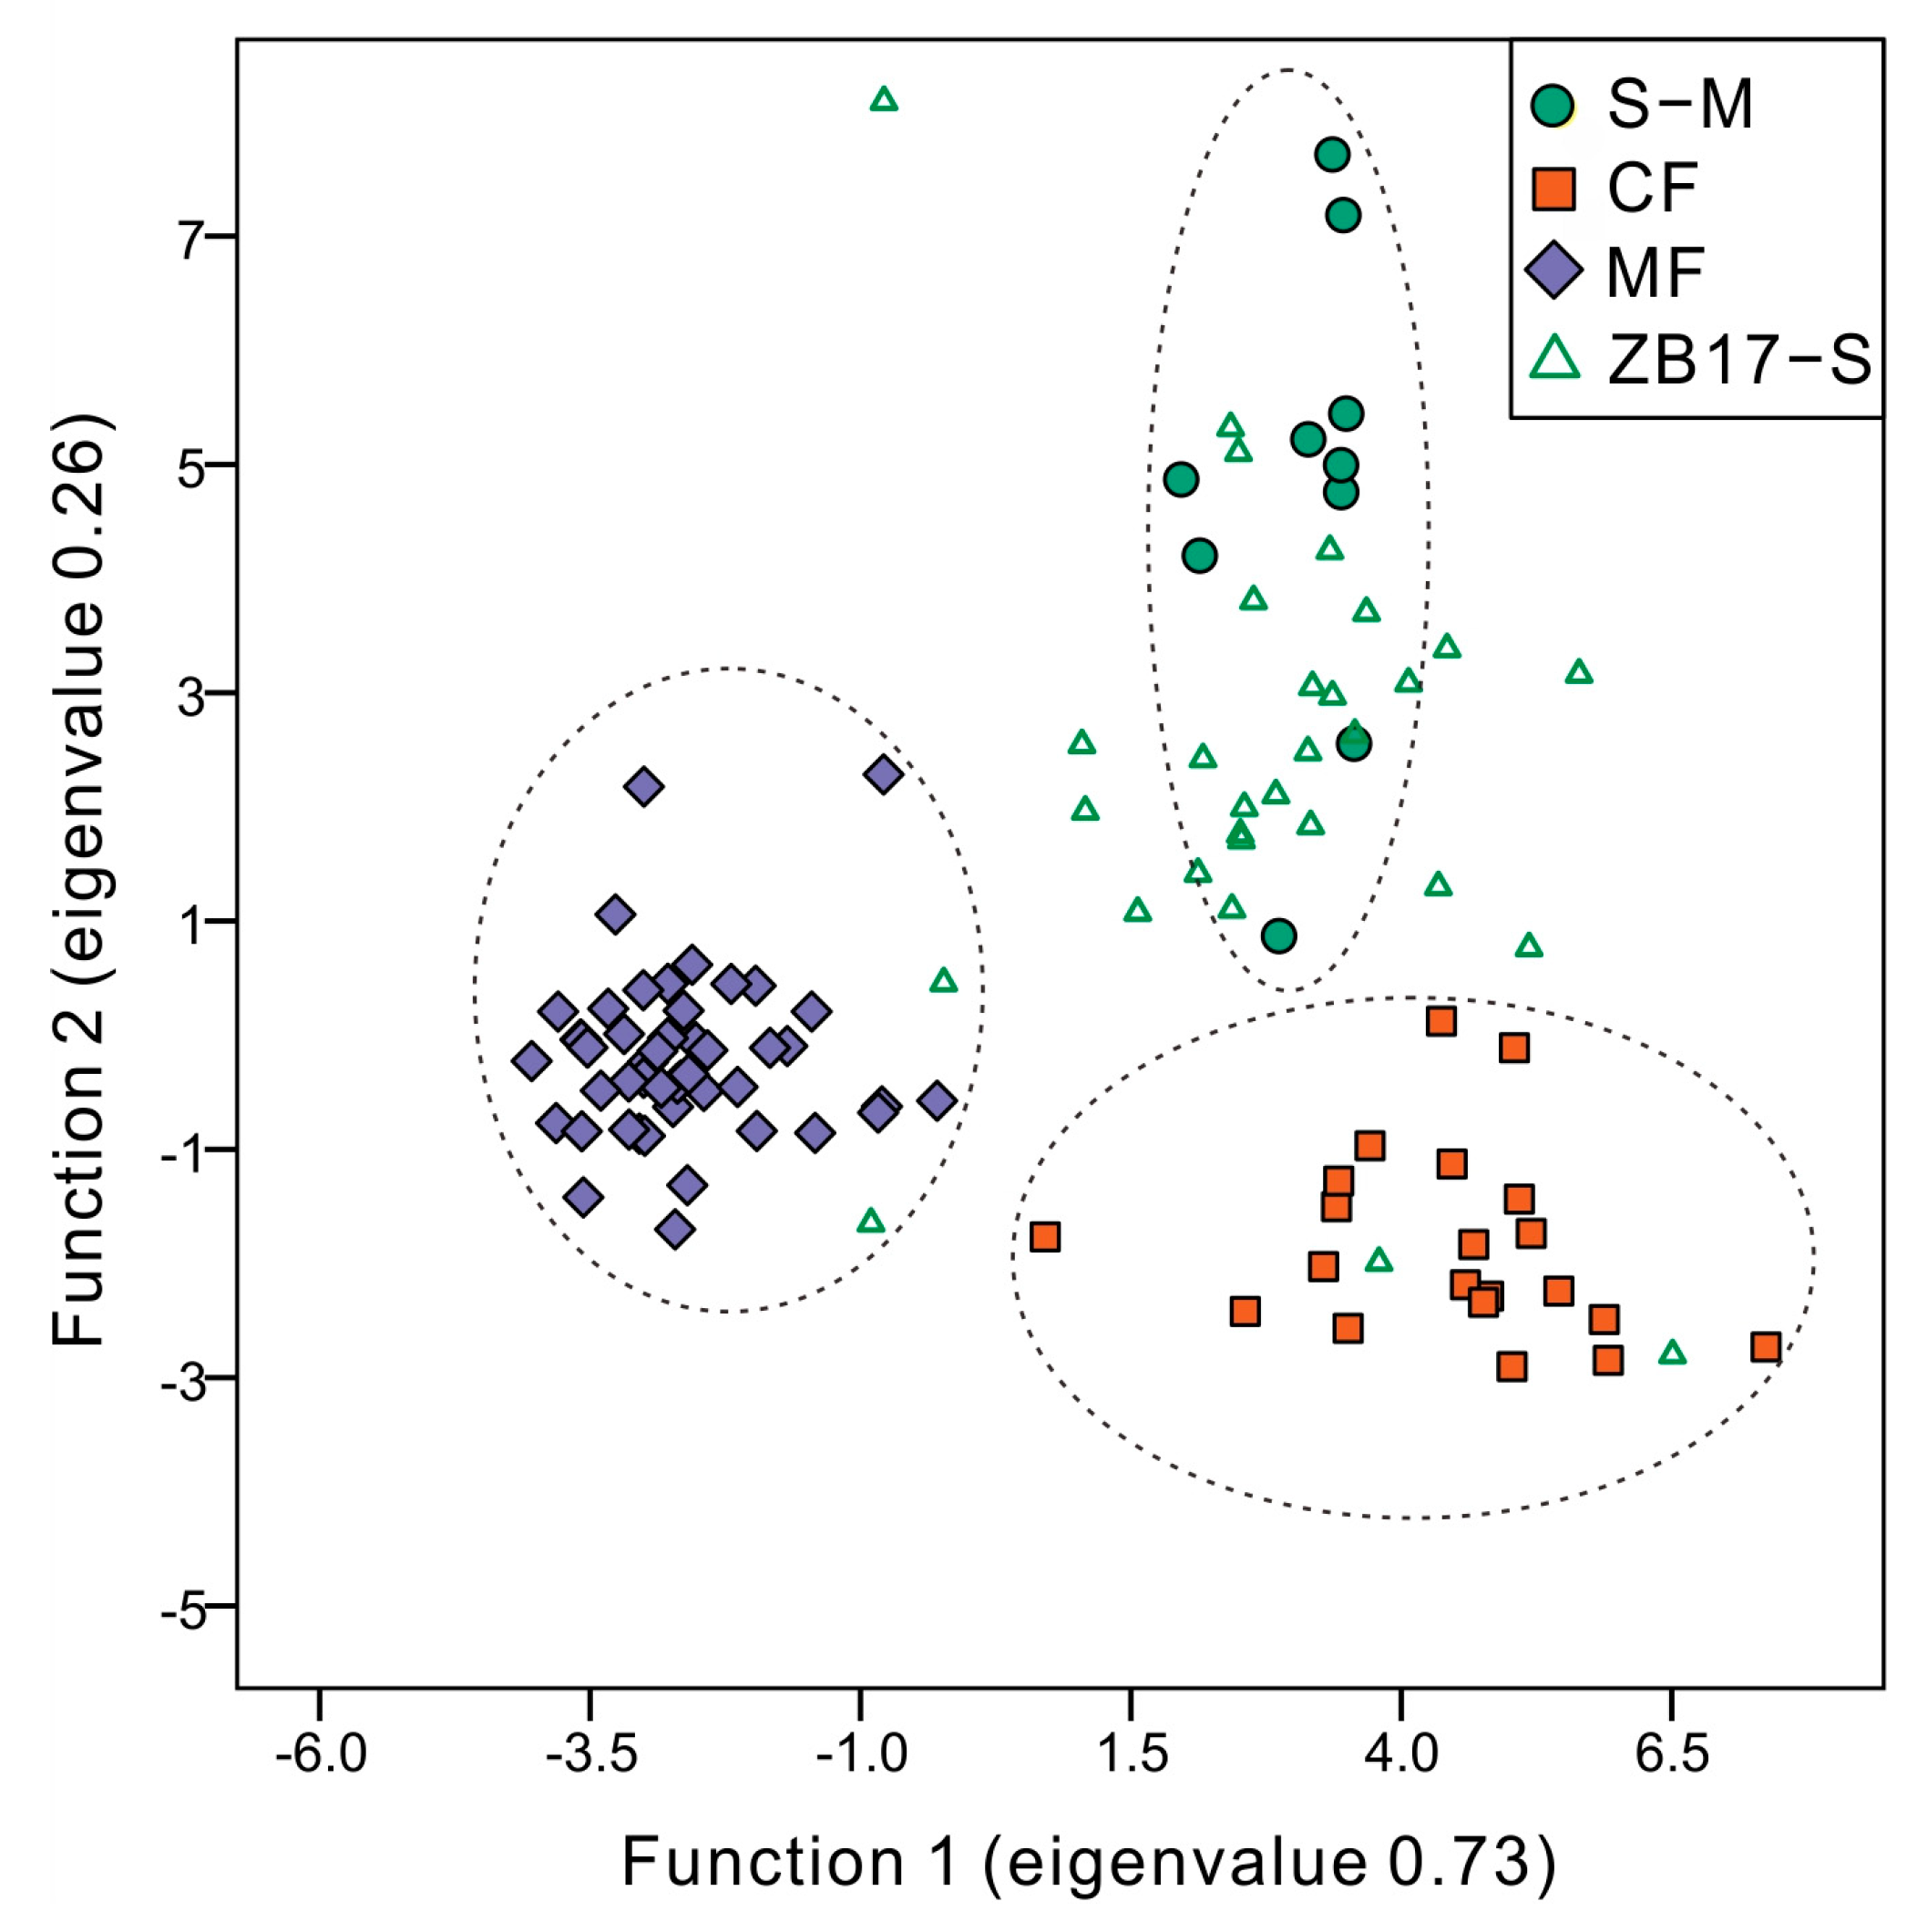
The discriminant analysis results show that approximately 97.4% (76/78) of the samples were correctly classified into their actual vegetation types (Table 2). Only two samples were misclassified: sample No. 42, which originally belonged to the shrub meadow, was classified as coniferous forest, while sample No. 26, originally a coniferous forest, was classified as mixed forest (Table 2, Figure 5). The first two discriminant axes, which accounted for 99% of the total variance, clearly distinguished the three vegetation types. The established discriminant functions were then used to classify the modern pollen data from the alpine meadow of the Zoige Basin, and yielded a correct classification rate of 76.7% (Table 2, Figure 5).
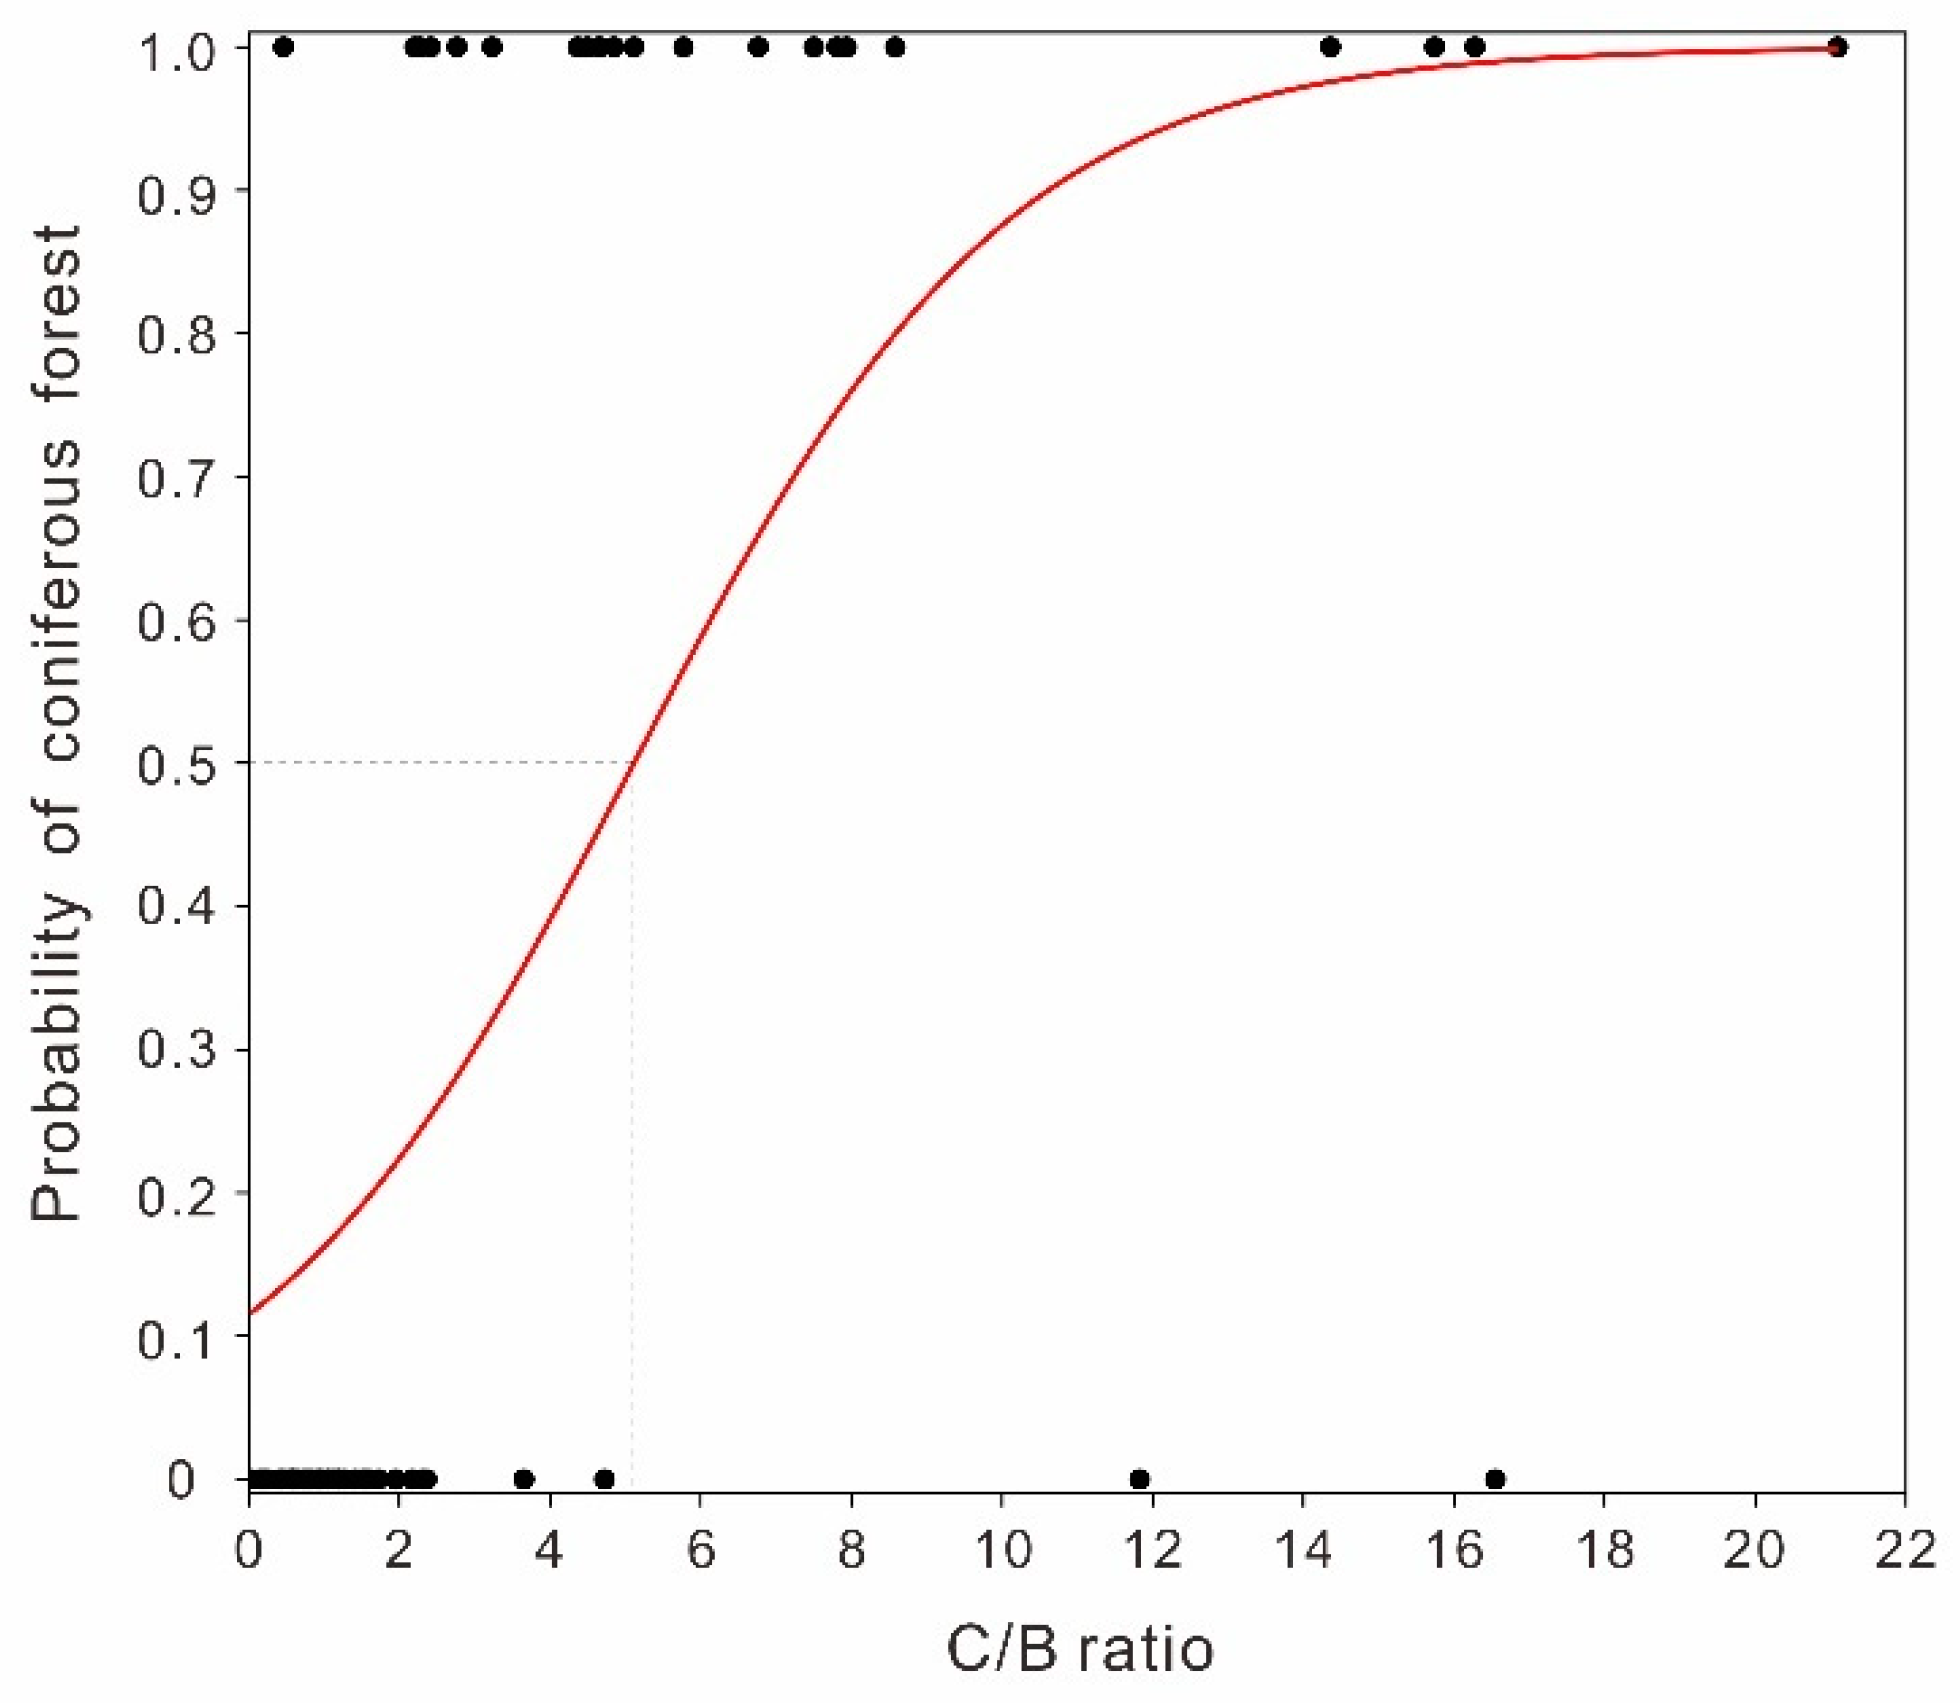
Next, logistic regression analysis provided critical insight into the relationship between the C/B ratio and vegetation types. The logistic function depicts an S-shaped probability curve, as illustrated in Figure 6. The low p-values of the Grubbs test (p < 0.01) indicated a significant relationship between the C/B ratio and conifer/broad-leaved vegetation. The C/B ratio threshold of 5.1 had a probability of 0.5, which could be used to effectively distinguish between coniferous and mixed forests.
The correlations between climatic variables are shown in Figure 7. The threshold of a correlation coefficient greater than 0.7 guided the variable selection for the RDA. MAT and MAP were chosen for RDA because they displayed a weak correlation between themselves (r = 0.68), and a strong correlation with Mtco, Mtwa, MSP, and elevation (r values > 0.96). Low VIF values for MAT and MAP were also found (all below 2) after removing the four overlapping climatic variables. The RDA showed low VIF values, indicating negligible multicollinearity issues with MAT and MAP.
The RDA results, based on modern pollen and climate, revealed the first axis (explaining 27.1% of the variance), predominantly separating the mixed forest samples from those of the shrub meadow and coniferous forest. The second axis (3.4% of the variance) partially distinguished the coniferous forests from the shrub meadows (Figure 8). The first RDA axis was strongly correlated with MAT (r2 = 0.85) and a minimal correlation between the second axis and MAT (r2 = 0.00085). In contrast, the first axis had a modest positive correlation with MAP (r2 = 0.35) and a weak negative correlation between the first axis and MAP (r2 = 0.21). The positive direction of the first axis signifies warmer and wetter conditions, favoring mixed forests (e.g., Alnus, Cunninghamia, Quercus, Juglans, and Pinus). Coniferous forests (e.g., Picea and Abies) and alpine shrub meadow taxa (e.g., Hippophae and Cyperaceae) were mainly clustered on the negative side of the first axis, indicating colder and drier conditions. Therefore, the first axis, aligned with the altitudinal vegetation gradient, was mainly linked to temperature.
Overall, the study region, spanning an elevation range of approximately 498 to 4046 m a.s.l., allowed for detailed insights into both altitudinal pollen and vegetation changes. The pollen assemblages, discriminant analysis, and RDA scatter plots distinguished three modern vegetation types: shrub meadows, coniferous forests, and mixed forests. Logistic regression analysis could be used to effectively distinguish between coniferous and mixed forests.

4. Discussion

4.1. Modern Pollen Representation of Altitudinal Vegetation Types

The results indicate that surface pollen assemblages generally reflect modern vegetation types and dominant taxa, supporting the use of fossil pollen data for the qualitative paleovegetation reconstruction of the TP and surrounding mountains. These findings are consistent with those of previous studies conducted on other parts of the TP (e.g., [12,26,53,54]).
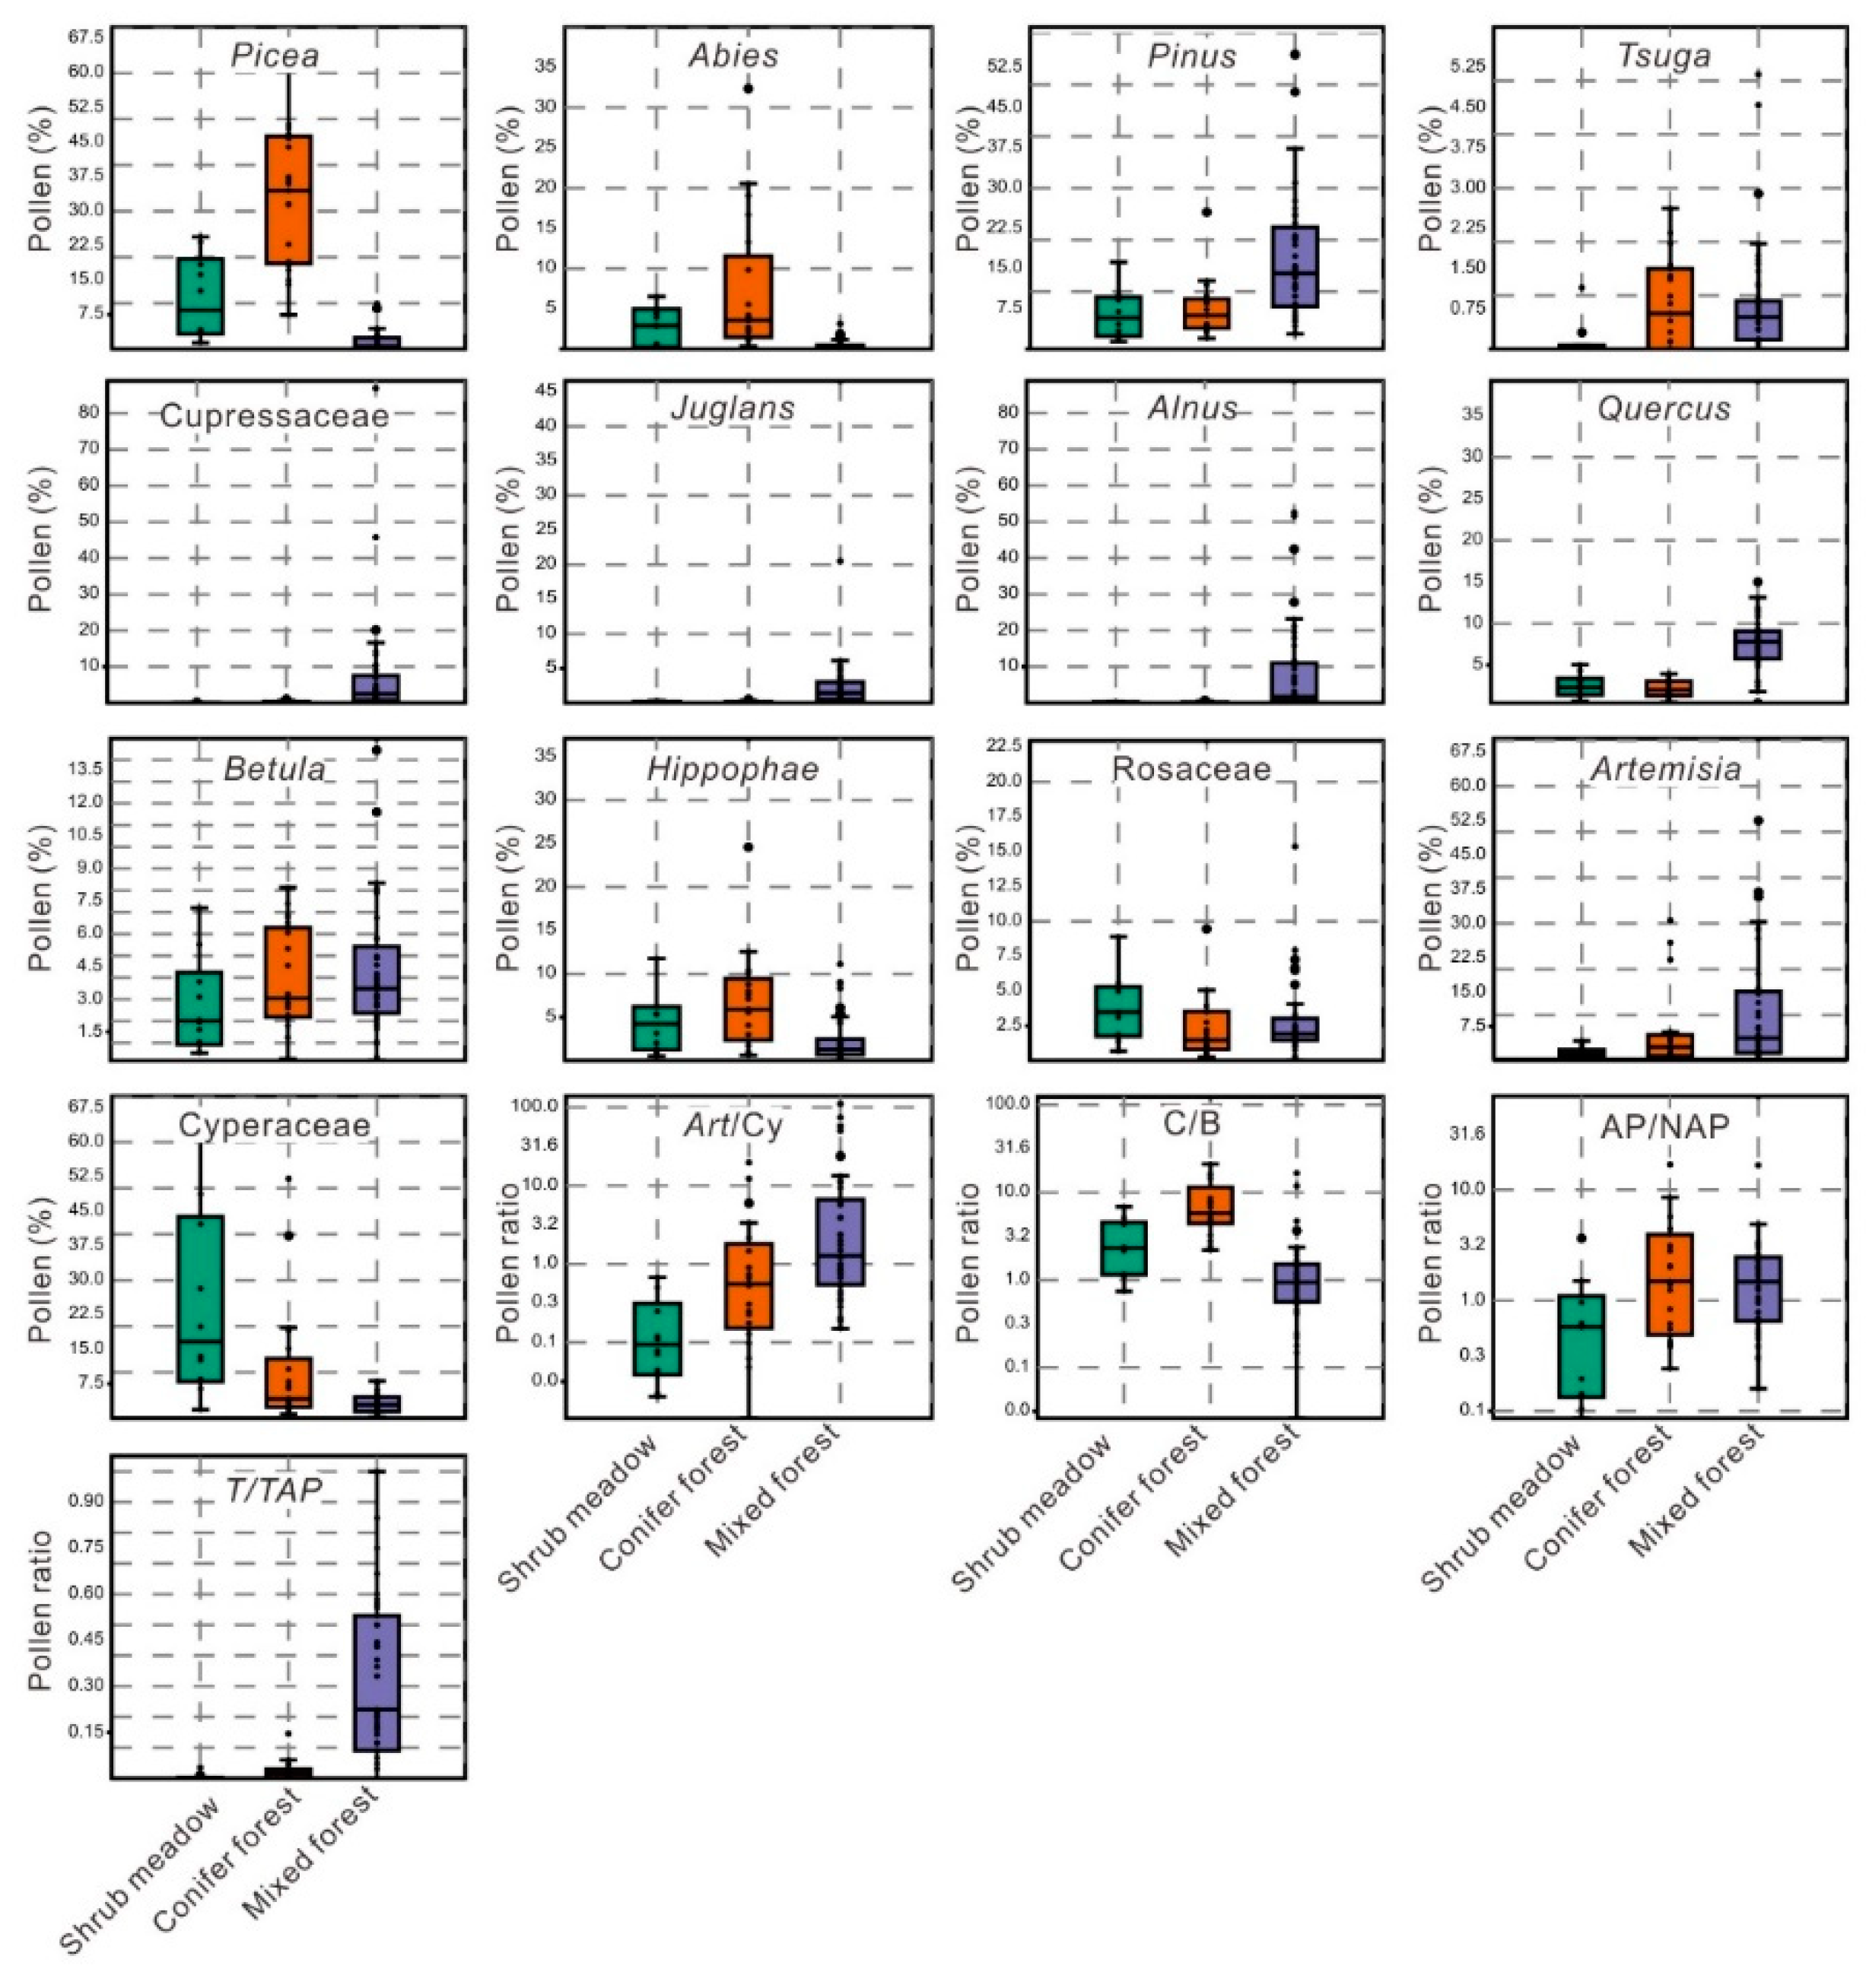
The mixed forest, predominantly found in warm low-altitude areas (~500–2700 m a.s.l.), features prominent species such as Juglans regia, Populus cathayana, Quercus fabri, Pinus sp., and C. lanceolata (Table S1). Pollen from these species contributed to high percentages of the pollen assemblages of the mixed forests (Pinus, Cupressaceae, Juglans, and Quercus), except for Populus cathayana (Figure 4 and Figure 9). Certain pollen types, such as Pinus, Cupressaceae, and Juglans generally reflect the importance of the parent plants. The percentage of Populus pollen may underrepresent its true proportion. High amounts of Betula and Alnus were found in the pollen assemblages, especially at low elevations (~500–1300 m a.s.l.), although their parent plants were not as numerous within the local vegetation. These two pollen taxa might therefore be considered as overrepresentations of the abundance of their parent plants. Some herbal taxa also contributed significantly, such as Artemisia, Poaceae, and Ranunculaceae. Indicator species analysis and RDA results highlighted Juglans, Cupressaceae, and Alnus as reliable indicators of mixed forests (Table 1 and Figure 8). Previous studies on the southeastern TP have underscored the crucial roles of these three pollen taxa in subtropical mixed forests [12,20]. Thus, in stratigraphic pollen diagram analyses for this region, these taxa can serve as indicators supporting a shift towards mixed forest vegetation.
The coniferous forest, found between approximately 2700 and 3580 m a.s.l., is mainly composed of Picea wilsonii, Abies ernestii, Salix chaenomeloides, and Hippophae rhamnoides (Table S1). The pollen assemblages were dominated by Picea, Abies, and Hippophae with minor contributions from Salix (Figure 4 and Figure 9). Picea and Abies pollen increased between 2700 and 3200 m a.s.l., peaking at approximately 3100 m a.s.l. High Hippophae pollen count was aligned with the presence of parent plants between 2700 and 3555 m a.s.l. Cyperaceae pollen increased at higher elevations, possibly because of valley winds and upslope monsoons, which blurred the distinction between coniferous forests and shrub meadows (Figure 4; [12,23,55,56]). Although no significant indicator species were identified, high Picea and Hippophae pollen percentages were used to distinguish coniferous forests from shrub meadows (Figure 4). Discriminant analysis showed 95.2% correct classifications for coniferous forest samples, with one misclassification (No. 26) due to the high Ranunculaceae and Tsuga content (Table 2, Figure 5).
The alpine shrub meadow, found mainly above 3580 m a.s.l., features Dasiphora fruticosa, Carex, and Salix. The pollen assemblages resembled those in the alpine meadow, but with higher contributions from Picea and Pinus (Figure 4 and Figure 9), surpassing those in the Zoige Basin [27]. The upslope transport of tree pollen from forests driven by strong summer monsoons likely influenced this pattern [12,23,55,56]. At high elevations, strong winds might cause pollen mixing between vegetation zones, notably affecting Cyperaceae and Picea in our study region, which should be accounted for in stratigraphic pollen interpretation. However, Ericaceae pollen was abundant in shrub meadows and served as a reliable indicator (Table 1, Figure 4). Despite the prevalence of Potentilla, their pollen equivalence (Rosaceae) was underrepresented (<5%). Qin et al. (2020) highlighted this discrepancy in alpine meadow pollen [27]. Discriminant analysis effectively distinguished shrub meadows with one misclassified sample (No.42) (Table 2, Figure 5). Of the 31 alpine meadow samples tested, 76% were correctly classified, confirming the reliability of the discriminant analysis functions for alpine meadows on the eastern TP. However, further testing is required for mixed and coniferous forest classification.

4.2. Pollen–Climate Relationships

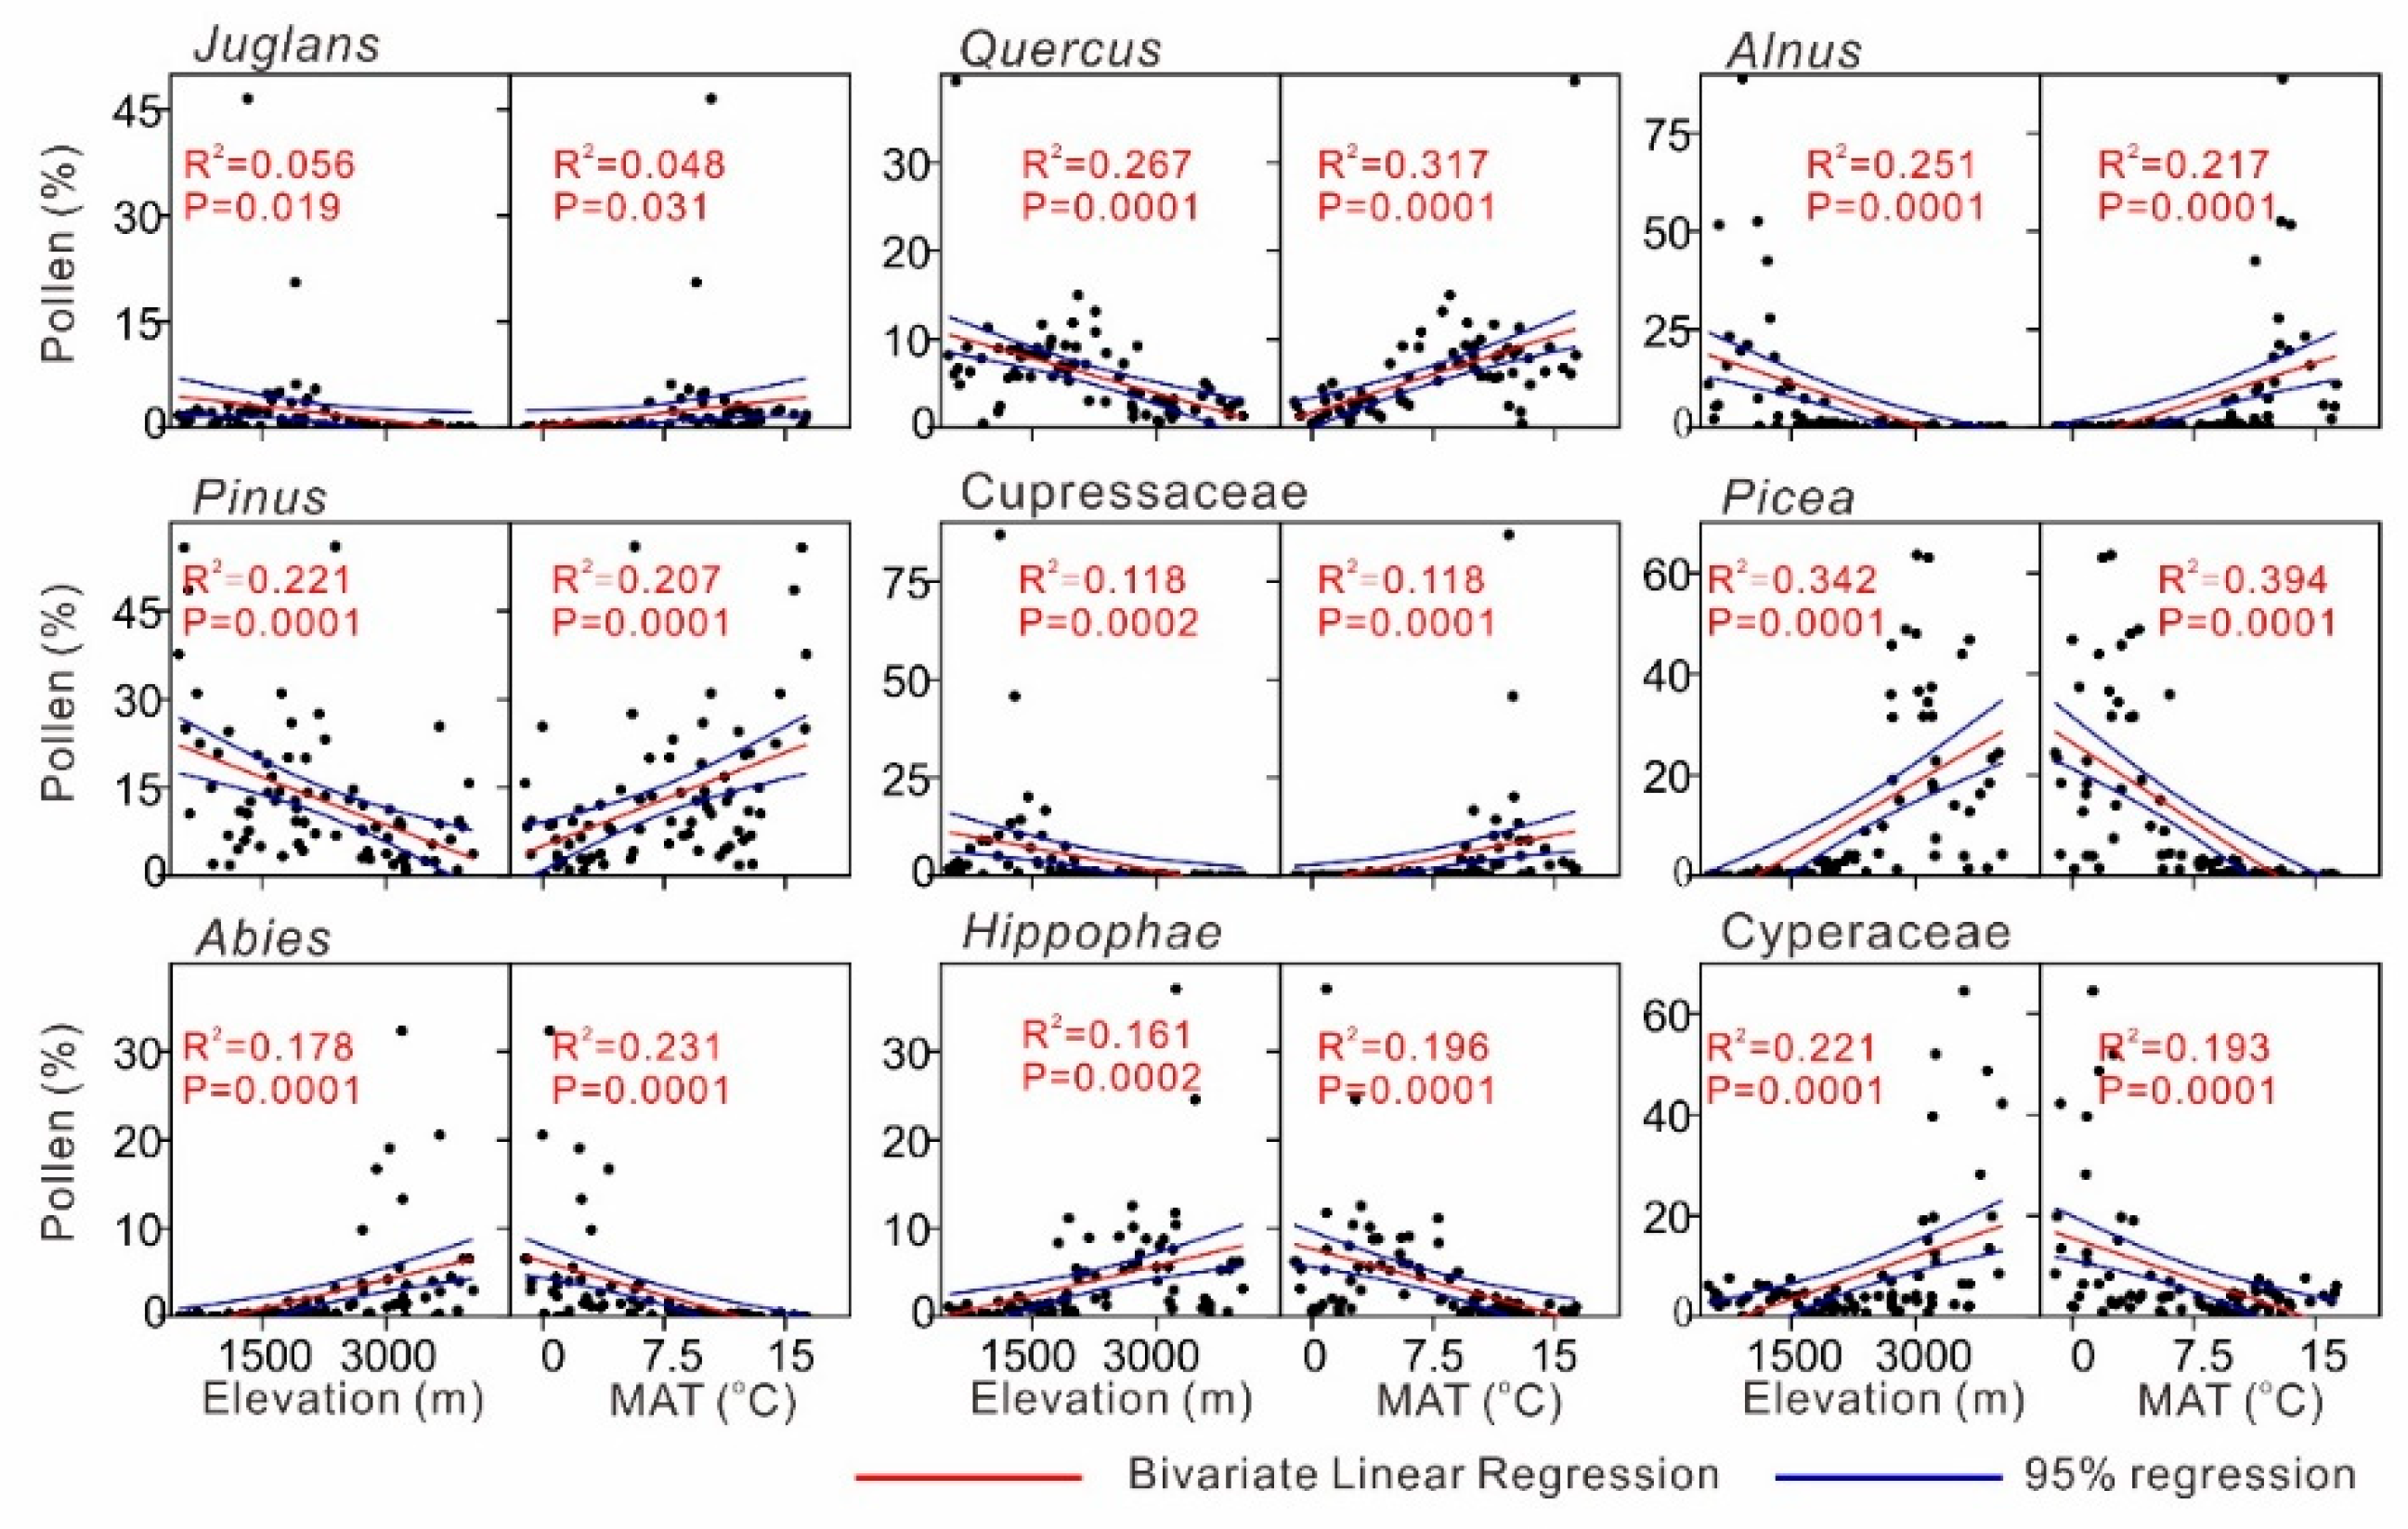
RDA underscored the pivotal role of temperature in modern pollen variation, with precipitation exerting an impact (Figure 8 and Figure 10). Furthermore, linear relationships were established among pollen, MAT, and elevation. The results revealed strong correlations among pollen, MAT, and elevation (Figure 10 and Figure 11). Juglans, Quercus, Alnus, Pinus, and Cupressaceae displayed a positive correlation with MAT, while Picea, Abies, Hippophae, and Cyperaceae had a negative correlation. These results are generally consistent with published modern pollen climate analyses of the TP (e.g., [12,15,57,58,59,60]), underscoring the critical role of temperature in vegetation distribution.
Linear regression analysis indicated a threshold effect for pollen response to MAT and elevation (i.e., sharp pollen percentage changes occurred at a MAT of approximately 7.5 °C and an elevation of 2500 m a.s.l.) (Figure 10). Similar threshold phenomena have also been observed in the Gongga Mountains (between 2500 and 3000 m a.s.l.) and the mountainous regions of the southeastern TP (~2 °C and ~6 °C) [12,48]. Zhao et al. (2017) demonstrated that shifts in vegetation types can occur when environmental conditions approach a certain threshold, leading to distinct changes in pollen assemblages [61]. In the study region, approximately 7.5 °C of MAT appeared to be a threshold for vegetation shift between mixed forest and coniferous forest. Higher pollen percentages of Juglans, Quercus, Alnus, Pinus, and Cupressaceae corresponded to >7.5 °C, while Picea, Abies, Cyperaceae, and Hippophae related to <7.5 °C. The threshold provides a reference for paleoenvironmental reconstructions, indicating critical temperature and elevation limits for major vegetation shifts. Future studies are needed to refine this threshold across diverse mountain systems, thereby enhancing the precision of paleoecological models.
While the relationships between the previously discussed pollen types and climate are significant, Tsuga pollen also plays an important role in paleoenvironmental reconstructions [62,63], particularly in the Tibetan Plateau and surrounding regions. Along the altitudinal gradient on the eastern TP, a relatively high percentage of Tsuga pollen was observed at 1450–3190 m a.s.l., mirroring Tsuga plant distribution in western Sichuan (up to 3200 m a.s.l.) [28]. Tsuga pollen occurred on the southern TP (peaks at 2100 and 2800 m a. s.l.) [20]. Moreover, higher limits of Tsuga pollen and plants have been observed in the warmer and more humid regions of Yunnan (3200–4100 m a.s.l.) and southwestern Sichuan (2400–3300 m a.s.l.) [12,64]. This pattern indicates a consistent relationship between Tsuga pollen and elevation, suggesting that the distribution of Tsuga in both present and past climates is closely related to specific elevational ranges [63]. Furthermore, this correlation offers insights for reconstructing the paleoclimate and paleoelevation, as well as understanding vegetation responses to future climate change across altitudinal gradients in these regions. Additionally, Tsuga plants were sparsely distributed in the study region, and were mainly found at site #53, within a radius of 100 m quadrats (Table S1). However, Tsuga pollen occurred in most samples (Figure 4), highlighting its tendency for long-distance transport [65] and overrepresentation [54].

4.3. Implications of Pollen Ratios

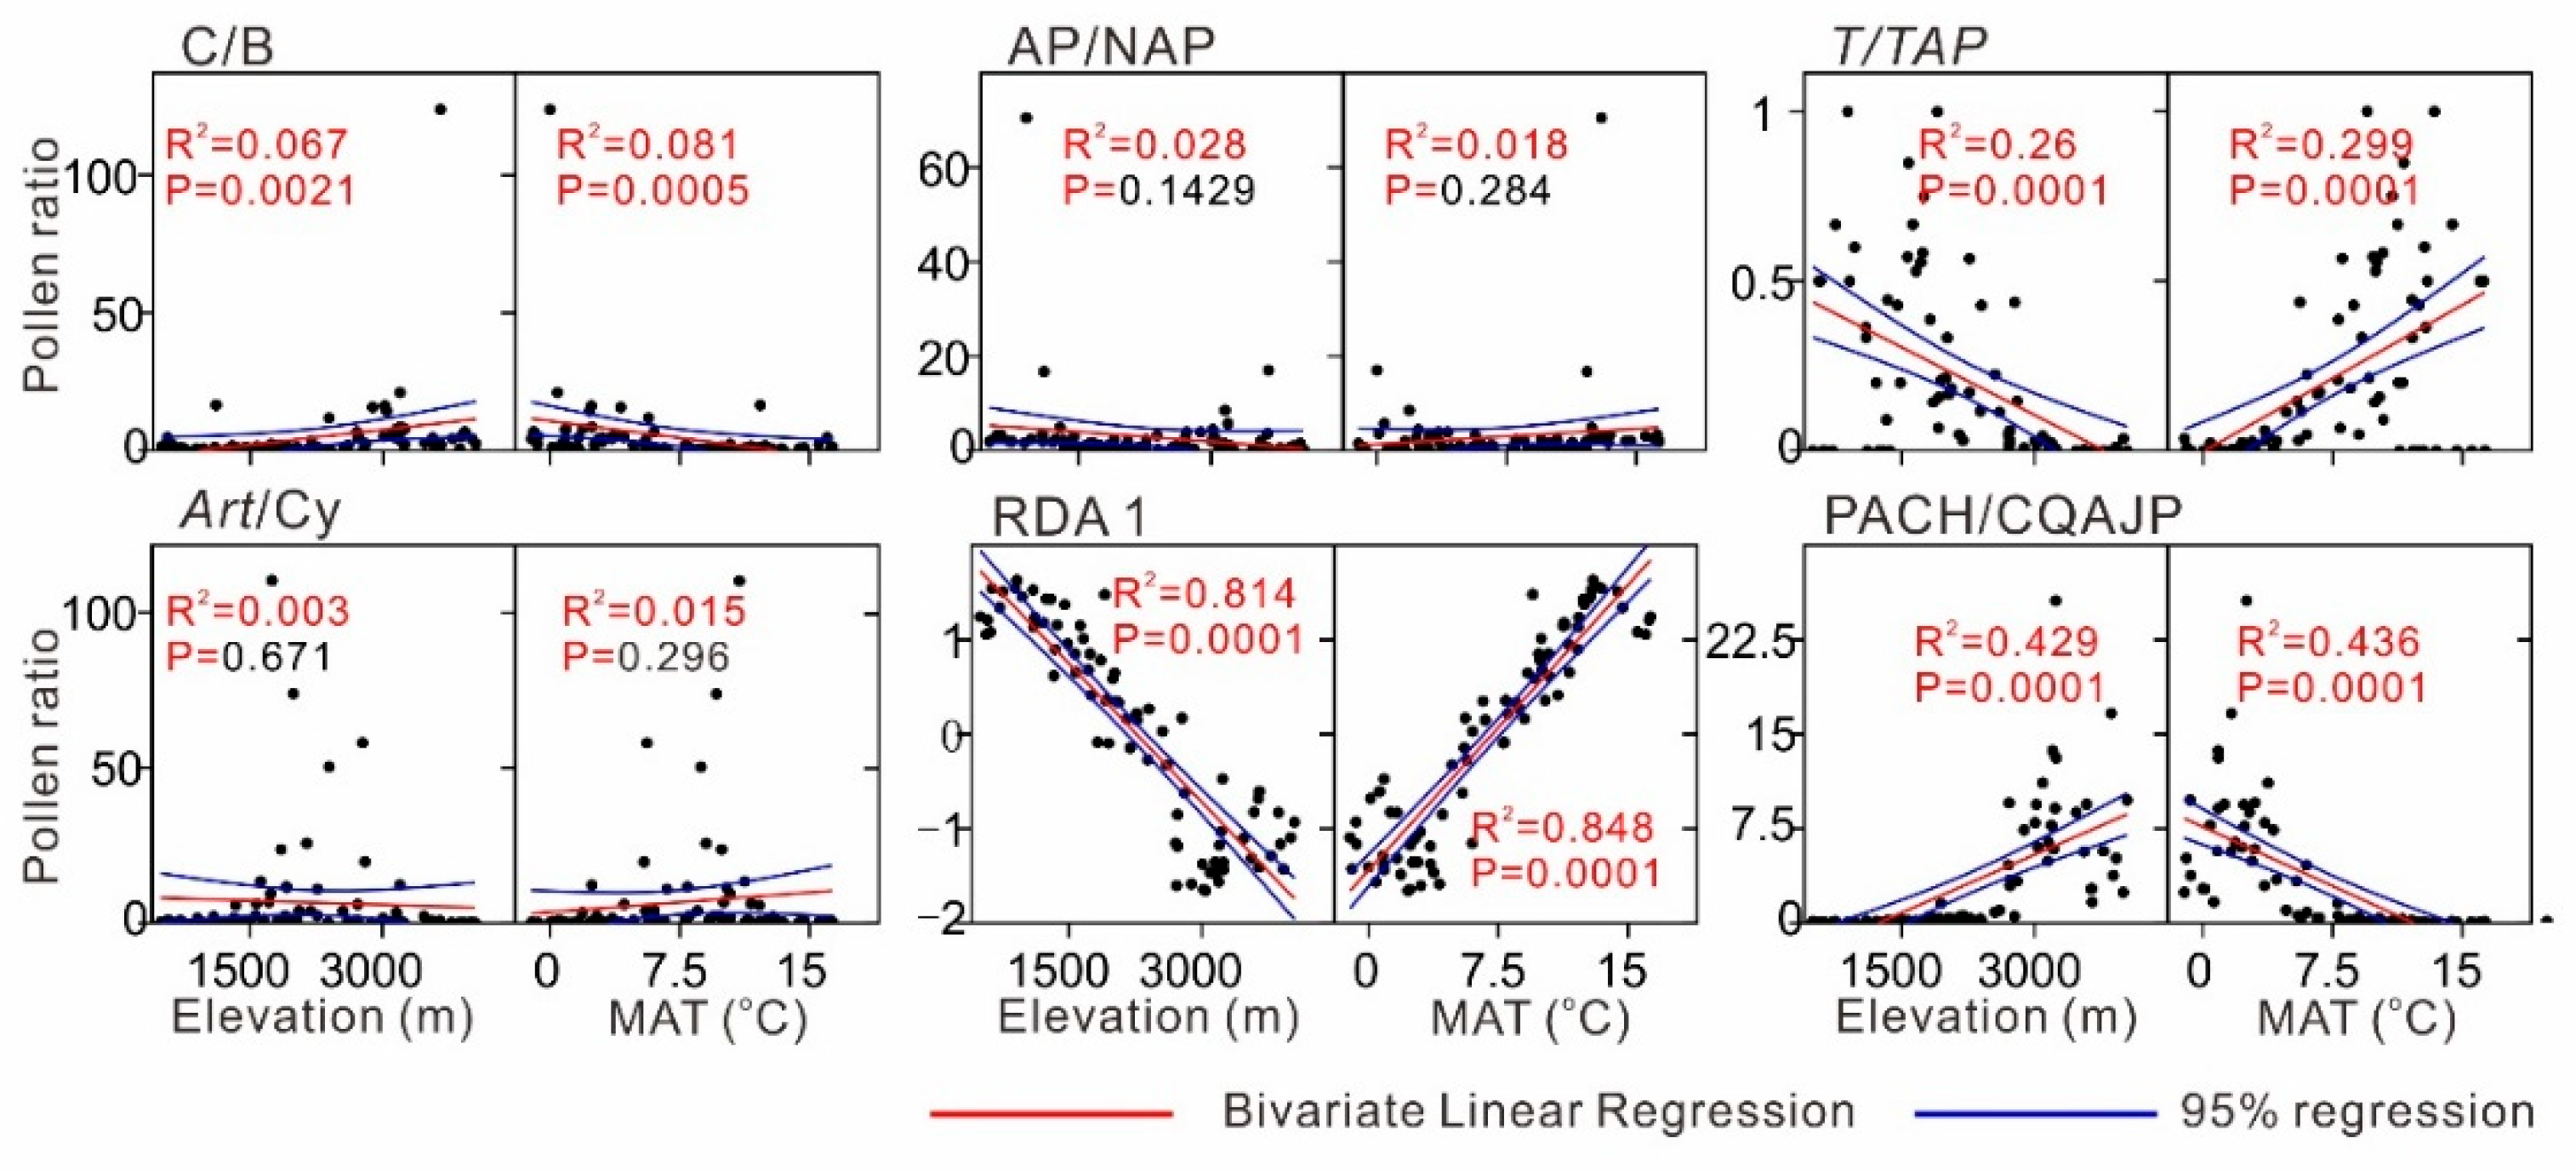
Our results also revealed significant variations in pollen ratios, including C/B, arboreal pollen/non-arboreal pollen (AP/NAP), T/TAP, and Art/Cy, which correlated with vegetation types and climatic factors. Although the C/B values showed a weak correlation with MAT (Figure 11), logistic regression established 5.1 as the C/B ratio threshold, effectively separating coniferous and mixed forests (Figure 6). The C/B value of 5.1 approximately corresponded to the MAT of 7.5 °C and elevation of 2500 m a.s.l. (Section 4.2). The scatter plots revealed higher C/B values in coniferous forests (C/B > 5.1) and lower values in mixed forests (C/B < 5.1) (Figure 9). The C/B ratio was also calculated to indicate the relative cover of coniferous and broad-leaved plants [66]. Thus, a higher C/B value in this region implies more conifer coverage, which is potentially useful for future analyses of relative coniferous forest changes based on fossil pollen.
The AP/NAP ratio was lower in shrub meadows than in forests (Figure 9) and weakly correlated with elevation and MAT (Figure 11), indicating that AP/NAP has a good gradient in accordance with vegetation type. The AP/NAP ratio (or AP%) was used to reflect changes in tree cover [19,67,68]. Herzschuh (2007) suggested that the AP% in samples from forest or shrub areas situated close to the tree line on the TP was greater than 5% [53]. This was also true in the study region, where the AP% of all the samples exceeded 5% (Figure 4). Previous studies have found that AP/NAP ratios are between 0.2 and 0.8 for forested areas on the TP [53]. An AP/NAP ratio of 0.2 has implications for distinguishing between forested and non-forested areas in southern Inner Mongolia [69]. The AP/NAP ratios from forested areas on the eastern TP presented here overlapped with the AP/NAP ratios from shrub meadows (Figure 9), possibly because of the influence of strong upslope transportation of tree pollen [55,56] The pollen percentages were also calculated, revealing an overlap in forested (coniferous and mixed forests) and non-forested (shrub meadow) areas (Figure 9). However, the median AP/NAP values (>2) from coniferous and mixed forests were significantly higher than those from shrub meadows (<0.5) (Figure 9), indicating that the AP/NAP ratio has the potential to distinguish between forested and non-forested areas in this region.
Tsuga predominantly appears at low elevations, whereas Picea and Abies thrive in colder conditions and at higher elevations, indicating that they have elevation-specific habitats (Section 4.2). Additionally, the pollens of Tsuga, Abies, and Picea showed co-occurrence within an elevational range of 2700–3200 m a.s.l. Thus, the Tsuga/(Tsuga + Abies + Picea) (T/TAP) ratio was proposed as an elevational proxy. The T/TAP ratio has a distinct gradient (Figure 9) and shows strong linear correlations with elevation (r2 = 0.26) and MAT (r2 = 0.3) (Figure 11), indicating its potential as a reliable proxy for elevation. Miao et al. (2022) proposed the (Tsuga + Podocarpus)/(Tsuga + Podocarpus + Abies + Picea) (TP/TPAP) ratio as an elevational proxy and reconstructed the uplift of northern TP over the past 15 million years [63]. Podocarpus pollen was not found in the surface soils of this region, and equivalent plants were not found in the vegetation. Nevertheless, the T/TAP ratio can effectively reflect elevational variations.
Artemisia and Cyperaceae pollen occurred in all samples, with Artemisia dominating between 1300 and 3200 m a.s.l., and Cyperaceae prevailing above 3200 m a.s.l. (Figure 4). The Artemisia/Cyperaceae (Art/Cy) ratio increased from shrub meadow to coniferous forest and mixed forest from high to low elevations (Figure 9) but showed a very weak correlation with temperature (Figure 11). The Art/Cy ratio was originally proposed as a proxy for summer temperature on the TP [70] and then used in arid and semi-arid areas as a summer temperature proxy (e.g., [10,71]). Overall, the Art/Cy ratio negatively correlated with the altitudinal vegetation gradient (Figure 9), indicating its potential as an altitudinal proxy for the eastern TP. However, applying the Art/Cy ratio for environmental reconstruction requires the consideration of its applicability across different elevation ranges.
Although the mean values of the pollen ratios C/B, AP/NAP, TP/TAP, and Art/Cy varied significantly across vegetation types (Figure 9), their liner correlation with temperature was relatively weak (r2 < 0.3) (Figure 11), suggesting limited effectiveness in temperature reconstruction. The first RDA axis (Figure 8) revealed negative correlations between Picea, Abies, Cyperaceae, and Hippophae with MAT. By contrast, Cupressaceae, Quercus, Alnus, Juglans, and Pinus displayed positive correlations. Additionally, Picea and Abies were generally discovered in high elevation and cold climate regions, and their pollen sum has been applied to indicate the cold condition (MAT < 4 °C) [12,72]. Therefore, we introduced the pollen ratio (Picea + Abies + Cyperaceae + Hippophae)/(Cupressaceae + Quercus + Alnus + Juglans + Pinus) (PACH/CQAJP) to strengthen the correlation with MAT (r2 = 0.436), showing its potential as a temperature index for use on the eastern TP (Figure 11). A further validation of the PACH/CQAJP ratio requires modern pollen data and regional fossil pollen records.

5. Conclusions

This study demonstrates the strong relationship between modern pollen spectra and vegetation along an altitudinal transect, leading to the following conclusions:
(1) Modern pollens reliably represent the primary altitudinal vegetation types in the study region, including alpine shrub meadows, coniferous forests, and mixed forests. Shrub meadows are characterized by the dominance of Cyperaceae and Picea pollen, coniferous forests by Picea, Abies, and Hippophae, and mixed forests by tree pollen, such as Juglans, Cupressaceae, and Alnus.
(2) The distribution of major pollen taxa shows distinct correlations with temperature and elevation. Quercus, Alnus, Juglans, Pinus, and Cupressaceae display a positive correlation with the MAT, whereas Picea, Abies, Hippophae, and Cyperaceae are negatively correlated. A notable threshold occurs around a MAT of 7.5 °C and 2500 m a.s.l., where shifts in pollen abundance align with vegetation changes.
(3) Some pollen ratios could be used as indications of vegetation cover and climatic conditions. The C/B ratio differentiates coniferous forests from mixed forests, whereas the AP/NAP ratio distinguishes forested areas from non-forested areas. The Art/Cy ratio indicates variations across altitudinal vegetation types, and the T/TAP ratio serves as a potential elevational proxy.
This study offers critical insights into pollen–vegetation–climate relationships on the eastern TP and provides threshold data which are valuable for managing sensitive mountainous ecosystems. Further paleovegetation reconstructions and ecological monitoring are essential for anticipating shifts in vegetation and pollen dispersal under future climate change.

Supplementary Materials

The following supporting information can be downloaded at https://www.mdpi.com/article/10.3390/land13111866/s1: Table S1: Original records about the 78 sampling sites along the altitudinal gradient on the eastern Tibetan Plateau.

Author Contributions

Conceptualization, W.R.; funding acquisition, W.R. and Y.Z.; investigation, W.R., M.L., F.Q., Q.L., G.Y., W.C., S.L. and Z.L.; methodology and software, W.R., Q.P. and C.L.; writing—original draft, W.R.; writing—review and editing, Y.Z. All authors have read and agreed to the published version of the manuscript.

Funding

This research was funded by the National Natural Science Foundation of China [#42107475], the National Key Research and Development Program of China [#2022YFF0801501], the Foundations of Hunan Province [#2023JJ40099, 23B0678], the National Natural Science Foundation of China [#42372352, 42277454, 42071114, 42107471, 41977395], and the Open fund project of HIST Hengyang Base. This work was supported by the Dagu Glacier Administration.

Data Availability Statement

The datasets used and generated in this study are available from the corresponding author on a reasonable request.

Conflicts of Interest

The authors declare no conflicts of interest.

References

  1. Myers, N.; Mittermeier, R.A.; Mittermeier, C.G.; Da Fonseca, G.A.; Kent, J. Biodiversity hotspots for conservation priorities. Nature 2000, 403, 853–858. [Google Scholar] [CrossRef] [PubMed]
  2. Rahbek, C.; Borregaard, M.K.; Antonelli, A.; Colwell, R.K.; Holt, B.G.; Nogues-Bravo, D.; Rasmussen, C.M.Ø.; Richardson, K.; Rosing, M.T.; Whittaker, R.J.; et al. Building mountain biodiversity: Geological and evolutionary processes. Science 2019, 365, 1114–11191. [Google Scholar] [CrossRef] [PubMed]
  3. Rahbek, C.; Borregaard, M.K.; Colwell, R.K.; Dalsgaard, B.; Holt, B.G.; Morueta-Holme, N.; Nogues-Bravo, D.; Whittaker, R.J.; Fjeldså, J. Humboldt’s enigma: What causes global patterns of mountain biodiversity? Science 2019, 365, 1108–1113. [Google Scholar] [CrossRef] [PubMed]
  4. Lézine, A.-M.; Izumi, K.; Kageyama, M.; Achoundong, G. A 90,000-year record of Afromontane forest responses to climate change. Science 2019, 363, 177–181. [Google Scholar] [CrossRef] [PubMed]
  5. Zhao, Y.; Tzedakis, P.C.; Li, Q.; Qin, F.; Cui, Q.Y.; Liang, C.; Birks, H.J.B.; Liu, Y.L.; Zhang, Z.Y.; Ge, J.Y.; et al. Evolution of vegetation and climate variability on the Tibetan Plateau over the past 1.74 Myr. Sci. Adv. 2020, 6, eaay6193. [Google Scholar] [CrossRef]
  6. Dearing, J.A.; Bullock, S.; Costanza, R.; Dawson, T.P.; Edwards, M.E.; Poppy, G.M.; Smith, G.M. Navigating the Perfect Storm: Research Strategies for Socialecological Systems in a Rapidly Evolving World. Environ. Manag. 2012, 49, 767–775. [Google Scholar] [CrossRef]
  7. Markgraf, V. Pollen Dispersal in a Mountain Area. Grana 1980, 19, 127–146. [Google Scholar] [CrossRef]
  8. Schüler, L.; Hemp, A.; Behling, H. Relationship between vegetation and modern pollen-rain along an elevational gradient on Kilimanjaro, Tanzania. Holocene 2014, 24, 702–713. [Google Scholar] [CrossRef]
  9. Wei, H.C.; Ma, H.Z.; Zheng, Z.; Pan, A.D.; Huang, K.Y. Modern pollen assemblages of surface samples and their relationships to vegetation and climate in the northeastern Qinghai-Tibetan Plateau, China. Rev. Palaeobot. Palynol. 2011, 163, 237–246. [Google Scholar] [CrossRef]
  10. Zhao, Y.; Herzschuh, U. Modern pollen representation of source vegetation in the Qaidam Basin and surrounding mountains, north-eastern Tibetan Plateau. Veg. Hist. Archaeobot. 2009, 18, 245–260. [Google Scholar] [CrossRef]
  11. Pelánková, B.; Chytrý, M. Surface pollen–vegetation relationships in the forest-steppe, taiga and tundra landscapes of the Russian Altai Mountains. Rev. Palaeobot. Palynol. 2009, 157, 253–265. [Google Scholar] [CrossRef]
  12. Xiao, X.Y.; Shen, J.; Wang, S.M. Spatial variation of modern pollen from surface lake sediments in Yunnan and southwestern Sichuan Province, China. Rev. Palaeobot. Palynol. 2011, 165, 224–234. [Google Scholar] [CrossRef]
  13. Fang, Y.M.; Ma, C.M.; Mao, L.M.; Zhu, C.; Zhang, W.Q. Surface pollen spectra from Shennongjia Mountains, central China: An interpretation aid to Quaternary pollen deposits. Rev. Palaeobot. Palynol. 2015, 214, 40–50. [Google Scholar] [CrossRef]
  14. Wei, H.C.; Zhao, Y. Surface pollen and its relationships with modern vegetation and climate in the Tianshan Mountains, northwestern China. Veg. Hist. Archaeobot. 2016, 25, 19–27. [Google Scholar] [CrossRef]
  15. Ali, S.N.; Quamar, M.F.; Dubey, J.; Morthekai, P.; Bisht, P.; Pandey, P.; Shekhar, M.; Ghosh, R. Surface pollen distribution in alpine zone of the higher Himalaya: A case study from the Kalla glacier valley, India. Bot. Lett. 2020, 167, 340–352. [Google Scholar] [CrossRef]
  16. Cañellas-Boltà, N.; Rull, V.; Vigo, J.; Mercadé, A. Modern pollen—Vegetation relationships along an altitudinal transect in the central Pyrenees (southwestern Europe). Holocene 2009, 19, 1185–1200. [Google Scholar] [CrossRef]
  17. Chi, C.T.; Xiao, X.Y.; Wang, J.J.; Ke, R.; Jia, B.Y. The vertical distribution of modern pollen in the southeastern edge of the Tibetan Plateau, China. Palynology 2023, 48, 2258941. [Google Scholar] [CrossRef]
  18. Holger, N.; Corinna, B.; Hermann, B. Vegetation/modern pollen rain relationship along an altitudinal transect between 1920 and 3185 m a.s.l. in the Podocarpus National Park region, southeastern Ecuadorian Andes. Rev. Palaeobot. Palynol. 2010, 159, 69–80. [Google Scholar]
  19. Yang, Z.J.; Zhang, Y.; Ren, H.B.; Yan, S.; Kong, Z.C.; Ma, K.P.; Ni, J. Altitudinal changes of surface pollen and vegetation on the north slope of the Middle Tianshan Mountains, China. J. Arid Land 2016, 8, 799–810. [Google Scholar] [CrossRef]
  20. Ma, Q.F.; Zhu, L.P.; Yang, R.M.; Huang, L.; Wang, J.B.; Tang, L.Y. Modern pollen distribution in moss samples along an elevational gradient in southeast Tibet. Ecol. Indic. 2023, 154, 110867. [Google Scholar] [CrossRef]
  21. Roy, I.; Ranhotra, P.S.; Shekhar, M.; Bhattacharyya, A.; Ghosh, R.; Sharma, Y.K. Modern Pollen-vegetation Relationships along the Vegetation Gradient in the Bhagirathi Valley, Western Himalaya, India. J. Geol. Soc. India 2021, 97, 571–578. [Google Scholar] [CrossRef]
  22. Cour, P.; Zheng, Z.; Duzer, D.; Calleja, M.; Yao, Z. Vegetational and climatic significance of modern pollen rain in northwestern Tibet. Rev. Palaeobot. Palynol. 1999, 104, 183–204. [Google Scholar] [CrossRef]
  23. Tong, G.B.; Yang, X.D.; Liu, Z.M.; Wang, S.M.; Zhao, H.G. Surface soil pollen distributions in the Yulong Mountain. Mar. Geol. Quat. Geol. 2003, 23, 103–107. (In Chinese) [Google Scholar]
  24. Cai, Y.; Wang, Y.; Jiang, F.C.; Li, C.Z. Characteristics of pollen assemblages in surface soils in the Maqu-Hongyuan area, Zoige Plateau, Northern Sichuan. J. Geomech. 2007, 13, 333–339. (In Chinese) [Google Scholar]
  25. Li, Y.W.; Xu, Q.H.; Zhang, S.R.; Li, Y.C.; Sun, Y.H.; Wang, T.; Shen, W.; Yang, X.L.; Zhang, R.C.; Wei, H.C. Significance of pollen assemblages for the vegetation composition of alpine shrub meadow in the Qinghai-Tibetan Plateau, China. Chin. Sci. Bull. 2019, 64, 2141–2150. (In Chinese) [Google Scholar] [CrossRef]
  26. Qin, F.; Bunting, M.J.; Zhao, Y.; Li, Q.; Cui, Q.Y.; Ren, W.H. Relative pollen productivity estimates for alpine meadow vegetation, northeastern Tibetan Plateau. Veg. Hist. Archaeobot. 2020, 29, 447–462. [Google Scholar] [CrossRef]
  27. Zhang, X.S. Vegetation of China and Its Geographic Patterns; China Geology Publishing House: Beijing, China, 2007. (In Chinese) [Google Scholar]
  28. Jiang, S. The meadows and forests of western mountains in Sichuan Province. Acta Bot. Sin. 1960, 9, 1136–1236. (In Chinese) [Google Scholar]
  29. Shen, C.M.; Tang, L.Y.; Wang, S.M.; Li, C.H.; Liu, K.B. Pollen records and time scale for the RM core of the Zoige Basin, northeastern Qinghai-Tibetan Plateau. Chin. Sci. Bull. 2005, 50, 553–562. [Google Scholar] [CrossRef]
  30. Jiang, Y.X. Ecological analysis of flora, species correlation and ordination of subalpine forest vegetation in Western Sichuan. Chin. J. Plant Ecol. 1982, 6, 281–301. (In Chinese) [Google Scholar]
  31. Faegri, K.; Iversen, J. Textbook of Pollen Analysis; John Wiley & Sons Ltd.: Chichester, UK, 1989. [Google Scholar]
  32. Tang, L.Y.; Mao, L.M.; Shu, J.W.; Li, C.H.; Shen, C.M.; Zhou, Z.Z. Atlas of Quaternary Pollen and Spores in China; Science Press: Beijing, China, 2017. [Google Scholar]
  33. Wang, F.X.; Qian, N.F.; Zhang, Y.L.; Yang, H.Q. Pollen Flora of China, 2nd ed.; Science Press: Beijing, China, 1995. (In Chinese) [Google Scholar]
  34. Grimm, E.C. CONISS—A Fortran-77 program for stratigraphically constrained cluster-analysis by the method of incremental sum of squares. Comput. Geosci. 1987, 13, 13–35. [Google Scholar] [CrossRef]
  35. Fick, S.E.; Hijmans, R.J. WorldClim 2: New 1-km spatial resolution climate surfaces for global land areas. Int. J. Climatol. 2017, 37, 4302–4315. [Google Scholar] [CrossRef]
  36. Revelle, W. psych: Procedures for Psychological, Psychometric, and Personality Research. Northwestern University, Evanston, Illinois, USA. 2023. Available online: https://CRAN.R-project.org/package=psych (accessed on 2 September 2024).
  37. De Cáceres, M.; Legendre, P. Associations between species and groups of sites: Indices and statistical inference. Ecology 2009, 90, 3566–3574. [Google Scholar] [CrossRef] [PubMed]
  38. De Cáceres, M.; Legendre, P.; Wiser, S.K.; Brotons, L. Using species combinations in indicator value analyses. Methods Ecol. Evol. 2012, 3, 973–982. [Google Scholar] [CrossRef]
  39. Dufrêne, M.; Legendre, P. Species assemblages and indicator species: The need for a flexible asymmetrical approach. Ecol. Monogr. 1997, 67, 345–366. [Google Scholar] [CrossRef]
  40. Dray, S.; Dufour, A.B.; Chessel, D. The ade4 Package--II: Two-table and K-table Methods. R News Forthcoming. 2007. Available online: https://cran.r-project.org/web/packages/ade4/citation.html (accessed on 2 November 2024).
  41. Legendre, P.; Legendre, L. Numerical Ecology, 3rd ed.; Elsevier: Amsterdam, The Netherlands, 2012. [Google Scholar]
  42. Ter Braak, C.J.F.; Prentice, I.C. A Theory of Gradient Analysis. In Advances in Ecological Research; Begon, M., Fitter, A.H., Ford, E.D., Macfadyen, A., Eds.; Academic Press: Cambridge, MA, USA, 1988; Volume 18, pp. 271–317. [Google Scholar]
  43. Dormann, C.F.; Elith, J.; Bacher, S.; Buchmann, C.; Carl, G.; Carré, G.; Marquéz, J.R.G.; Gruber, B.; Lafourcade, B.; Leitão, P.J.; et al. Collinearity: A review of methods to deal with it and a simulation study evaluating their performance. Ecography 2013, 36, 27–46. [Google Scholar] [CrossRef]
  44. Ter Braak, C.J.F.; Verdonschot, P.F.M. Canonical correspondence analysis and related multivariate methods in aquatic ecology. Aquat. Sci. 1995, 57, 255–289. [Google Scholar] [CrossRef]
  45. Zuur, A.; Ieno, E.; Elphick, C. A protocol for data exploration to avoid common statistical problems. Methods Ecol. Evol. 2010, 1, 3–14. [Google Scholar] [CrossRef]
  46. Borcard, D.; Gillet, F.; Legendre, P. Numerical Ecology with R; Springer: New York, NY, USA, 2011. [Google Scholar]
  47. Oksanen, J.; Simpson, G.L.; Simpson, F.G.; Kindt, R.; Legendre, P.; Minchin, P.R.; O’Hara, R.B.; Solymos, P.; Stevens, M.H.H.; Szoecs, E.; et al. vegan: Community Ecology Package. R Package Version 2.6-4. 2022. Available online: https://github.com/vegandevs/vegan (accessed on 2 November 2024).
  48. Li, Q.; Ge, Q.S.; Tong, G.B. Modern pollen-vegetation relationship based on discriminant analysis across an altitudinal transect on Gongga Mountain, eastern Tibetan Plateau. Chin. Sci. Bull. 2012, 57, 4600–4608. [Google Scholar] [CrossRef]
  49. Shen, C.M.; Liu, K.B.; Tang, L.Y.; Overpeck, J.T. Numerical Analysis of Modern and Fossil Pollen Data from the Tibetan Plateau. Ann. Am. Asssoc. Geeogr. 2008, 98, 755–772. [Google Scholar] [CrossRef]
  50. Zhao, K.L.; Li, X.Q. Modern pollen and vegetation relationships in the Yili Basin, Xinjiang, NW China. Chin. Sci. Bull. 2013, 58, 4133–4142. [Google Scholar] [CrossRef]
  51. Cao, X.Y.; Herzschuh, U.; Ni, J.; Zhao, Y.; Böhmer, T. Spatial and temporal distributions of major tree taxa in eastern continental Asia during the last 22,000 years. Holocene 2015, 25, 79–91. [Google Scholar] [CrossRef]
  52. Hammer, Ø.; Harper, D.A.T.; Ryan, P.D. PAST: Paleontological Statistics Software Package for Education and Data Analysis. Palaeontol. Electron. 2001, 4, 1–9. [Google Scholar]
  53. Herzschuh, U. Reliability of pollen ratios for environmental reconstructions on the Tibetan Plateau. J. Biogeogr. 2007, 34, 1265–1273. [Google Scholar] [CrossRef]
  54. Pan, T.; Dai, E.; Wu, S.H. Relationship between surface pollen and modern vegetation in Southwestern China. J. Mt. Sci. 2010, 7, 176–186. [Google Scholar] [CrossRef]
  55. Li, J.F.; Xie, G.; Yang, J.; Ferguson, D.K.; Liu, X.-D.; Liu, H.; Wang, Y.-F. Asian Summer Monsoon changes the pollen flow on the Tibetan Plateau. Earth-Sci. Rev. 2020, 202, 103114. [Google Scholar] [CrossRef]
  56. Li, W.Q.; Yao, Z.J. Study on Late Quaternary Vegetation and Environment in North and Middle Tropics of China; China Ocean Press: Beijing, China, 1993. (In Chinese) [Google Scholar]
  57. Lü, H.Y.; Wu, N.Q.; Liu, K.B.; Zhu, L.P.; Yang, X.D.; Yao, T.D.; Wang, L.; Li, Q.; Liu, X.Q.; Shen, C.M.; et al. Modern pollen distributions in Qinghai-Tibetan Plateau and the development of transfer functions for reconstructing Holocene environmental changes. Quat. Sci. Rev. 2011, 30, 947–966. [Google Scholar] [CrossRef]
  58. Shen, C.M.; Liu, K.B.; Tang, L.Y.; Jonathan, T.O. Quantitative relationships between modern pollen rain and climate in the Tibetan Plateau. Rev. Palaeobot. Palynol. 2006, 140, 61–77. [Google Scholar] [CrossRef]
  59. Zhang, Y.J.; Duo, L.; Pang, Y.Z.; Felde, V.A.; Birks, H.H.; Birks, H.J.B. Modern pollen assemblages and their relationships to vegetation and climate in the Lhasa Valley, Tibetan Plateau, China. Quat. Int. 2018, 467, 210–221. [Google Scholar] [CrossRef]
  60. Zhao, Y.; Liang, C.; Cui, Q.Y.; Qin, F.; Zheng, Z.; Xiao, X.Y.; Ma, C.M.; Felde, V.A.; Liu, Y.L.; Li, Q.; et al. Temperature reconstructions for the last 1.74-Ma on the eastern Tibetan Plateau based on a novel pollen-based quantitative method. Glob. Planet. Chang. 2021, 199, 103433. [Google Scholar] [CrossRef]
  61. Zhao, Y.; Liu, Y.; Guo, Z.; Fang, K.; Li, Q.; Cao, X. Abrupt vegetation shifts caused by gradual climate changes in central Asia during the Holocene. Sci. China Earth Sci. 2017, 60, 1317–1327. [Google Scholar] [CrossRef]
  62. An, Z.S.; Clemens, S.C.; Shen, J.; Qiang, X.K.; Jin, Z.D.; Sun, Y.B.; Prell, W.L.; Luo, J.J.; Wang, S.M.; Xu, H.; et al. Glacial-Interglacial Indian Summer Monsoon Dynamics. Science 2011, 333, 719–723. [Google Scholar]
  63. Miao, Y.F.; Fang, X.M.; Sun, J.M.; Xiao, W.J.; Yang, Y.H.; Wang, X.L.; Farnsworth, A.; Huang, K.Y.; Ren, Y.L.; Wu, F.L.; et al. A new biologic paleoaltimetry indicating Late Miocene rapid uplift of northern Tibet Plateau. Science 2022, 378, 1074–1079. [Google Scholar] [CrossRef] [PubMed]
  64. Jiang, W.Y.; Leroy, S.A.G.; Yang, S.L.; Zhang, E.L.; Wang, L.; Yang, X.X.; Rioual, P. Synchronous strengthening of the Indian and East Asian monsoons in response to global warming since the last deglaciation. Geophys. Res. Lett. 2019, 46, 3944–3952. [Google Scholar] [CrossRef]
  65. Zhao, K.L.; Zhou, X.Y.; Ji, M.; Li, X.Q. Palynological Evidence of Late Holocene Paleo-Monsoon in Eastern Pamir. Geophys. Res. Lett. 2019, 46, 10015–10023. [Google Scholar] [CrossRef]
  66. Wahl, R.E. Pollen surface samples for paleoenvironmental reconstruction from the coast and transverse ranges of southern California. Madroño 2003, 50, 286–299. [Google Scholar]
  67. Zhao, Y.; Li, F.R.; Hou, Y.T.; Sun, J.H.; Zhao, W.W.; Tang, Y.; Li, H. Surface pollen and its relationships with modern vegetation and climate on the Loess Plateau and surrounding deserts in China. Rev. Palaeobot. Palynol. 2012, 181, 47–53. [Google Scholar] [CrossRef]
  68. Zhao, Y.; Yu, Z.C.; Zhao, W.W. Holocene vegetation and climate histories in the eastern Tibetan Plateau: Controls by insolation-driven temperature or monsoon-derived precipitation changes? Quat. Sci. Rev. 2011, 30, 1173–1184. [Google Scholar] [CrossRef]
  69. Liu, H.Y.; Cui, H.T.; Pott, R.; Speier, M. The surface pollen of the woodland–steppe ecotone in southeastern Inner Mongolia, China. Rev. Palaeobot. Palynol. 1999, 105, 237–250. [Google Scholar] [CrossRef]
  70. Herzschuh, U.; Winter, K.; Wünnemann, B.; Li, S. A general cooling trend on the central Tibetan Plateau throughout the Holocene recorded by the Lake Zigetang pollen spectra. Quat. Int. 2006, 154–155, 113–121. [Google Scholar] [CrossRef]
  71. Huang, X.Z.; Chen, C.Z.; Jia, W.N.; An, C.B.; Zhou, A.F.; Zhang, J.W.; Jin, M.; Xia, D.S.; Chen, F.H.; Grimm, E.C. Vegetation and climate history reconstructed from an alpine lake in central Tienshan Mountains since 8.5 ka BP. Paleogeogr. Paleoclimatol. Paleoecol. 2015, 432, 36–48. [Google Scholar] [CrossRef]
  72. Lü, H.Y.; Wu, N.Q.; Yang, X.D.; Shen, C.M.; Zhu, L.P.; Wang, L.; Li, Q.; Xu, D.K.; Tong, G.B.; Sun, X.J. Spatial pattern of Abies and Picea surface pollen distribution along the elevation gradient in the Qinghai–Tibetan Plateau and Xinjiang, China. Boreas 2008, 37, 254–262. [Google Scholar] [CrossRef]
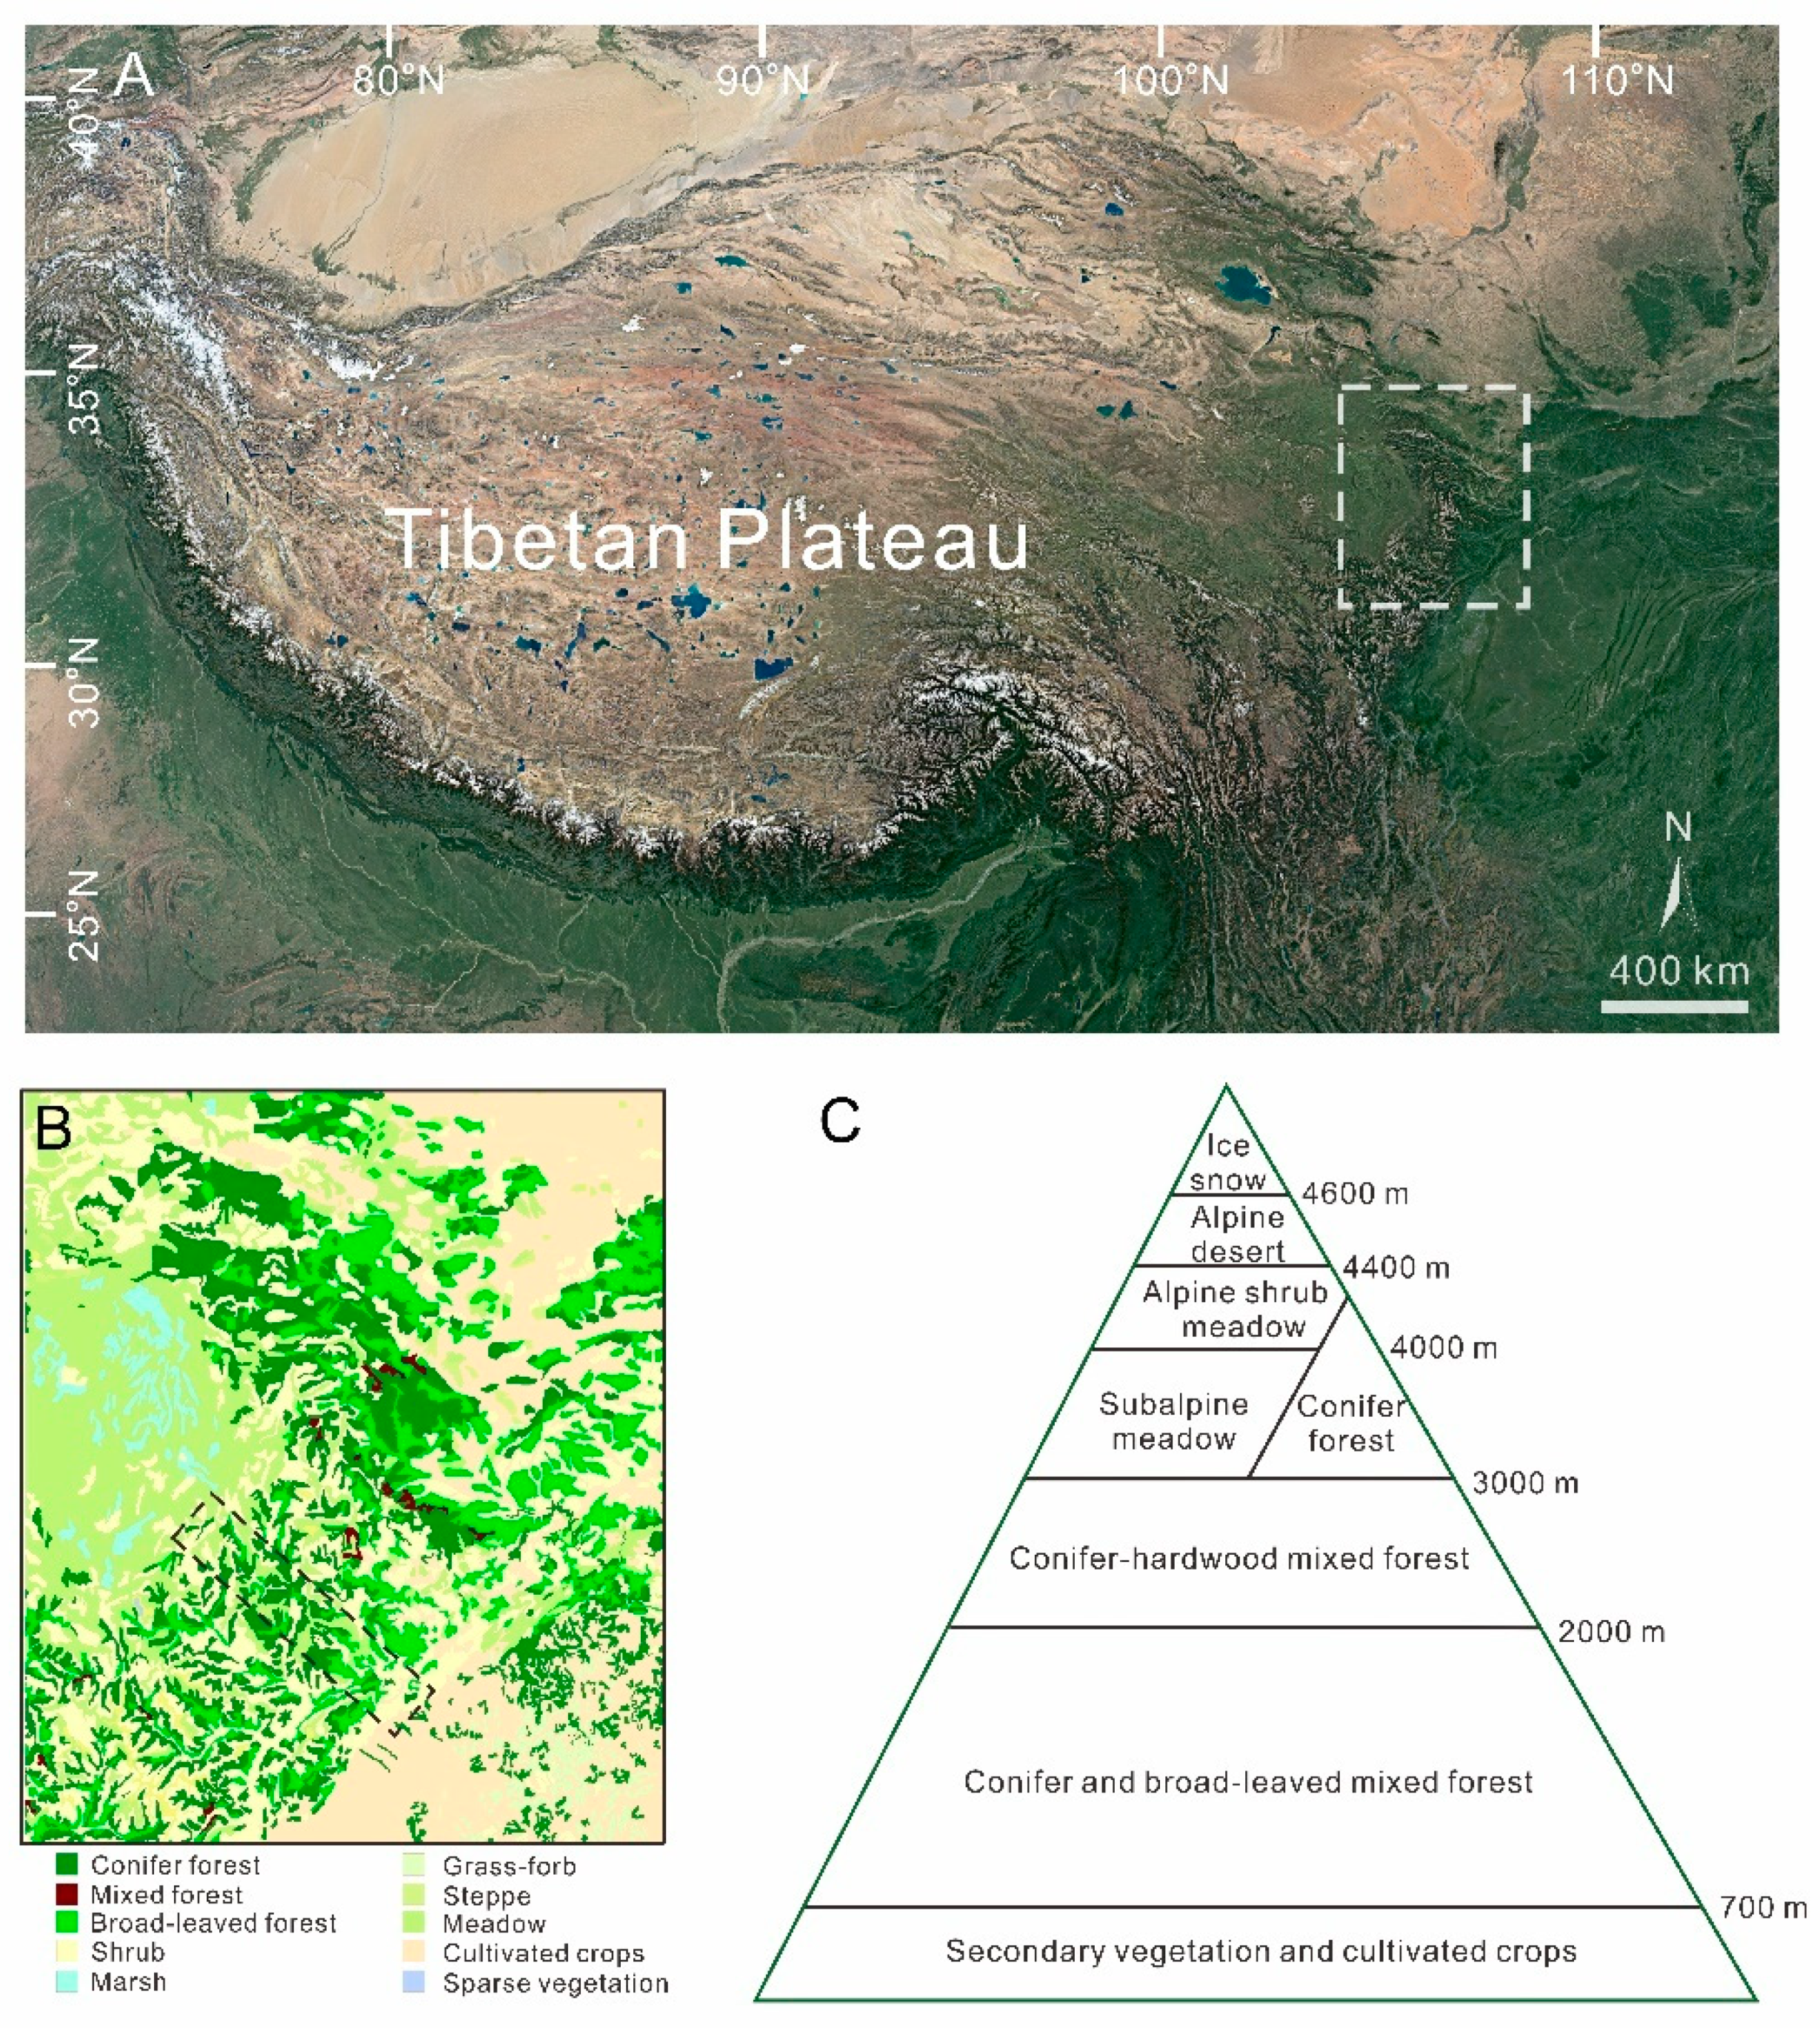
Figure 1. Map (after Google Earth) illustrating the study area location (A) and modern vegetation distribution [27] (B). Elevational zones (C) are denoted based on data from [28,29]. Dashed rectangles in (A,B) represent the study area and vegetation transect, respectively.
Land 13 01866 g001
Figure 2. Climate diagrams from Zoige (A), Songpan (B), and Dujiangyan (C) meteorological stations on the eastern TP displaying monthly temperature and precipitation (1980–2020).
Land 13 01866 g002
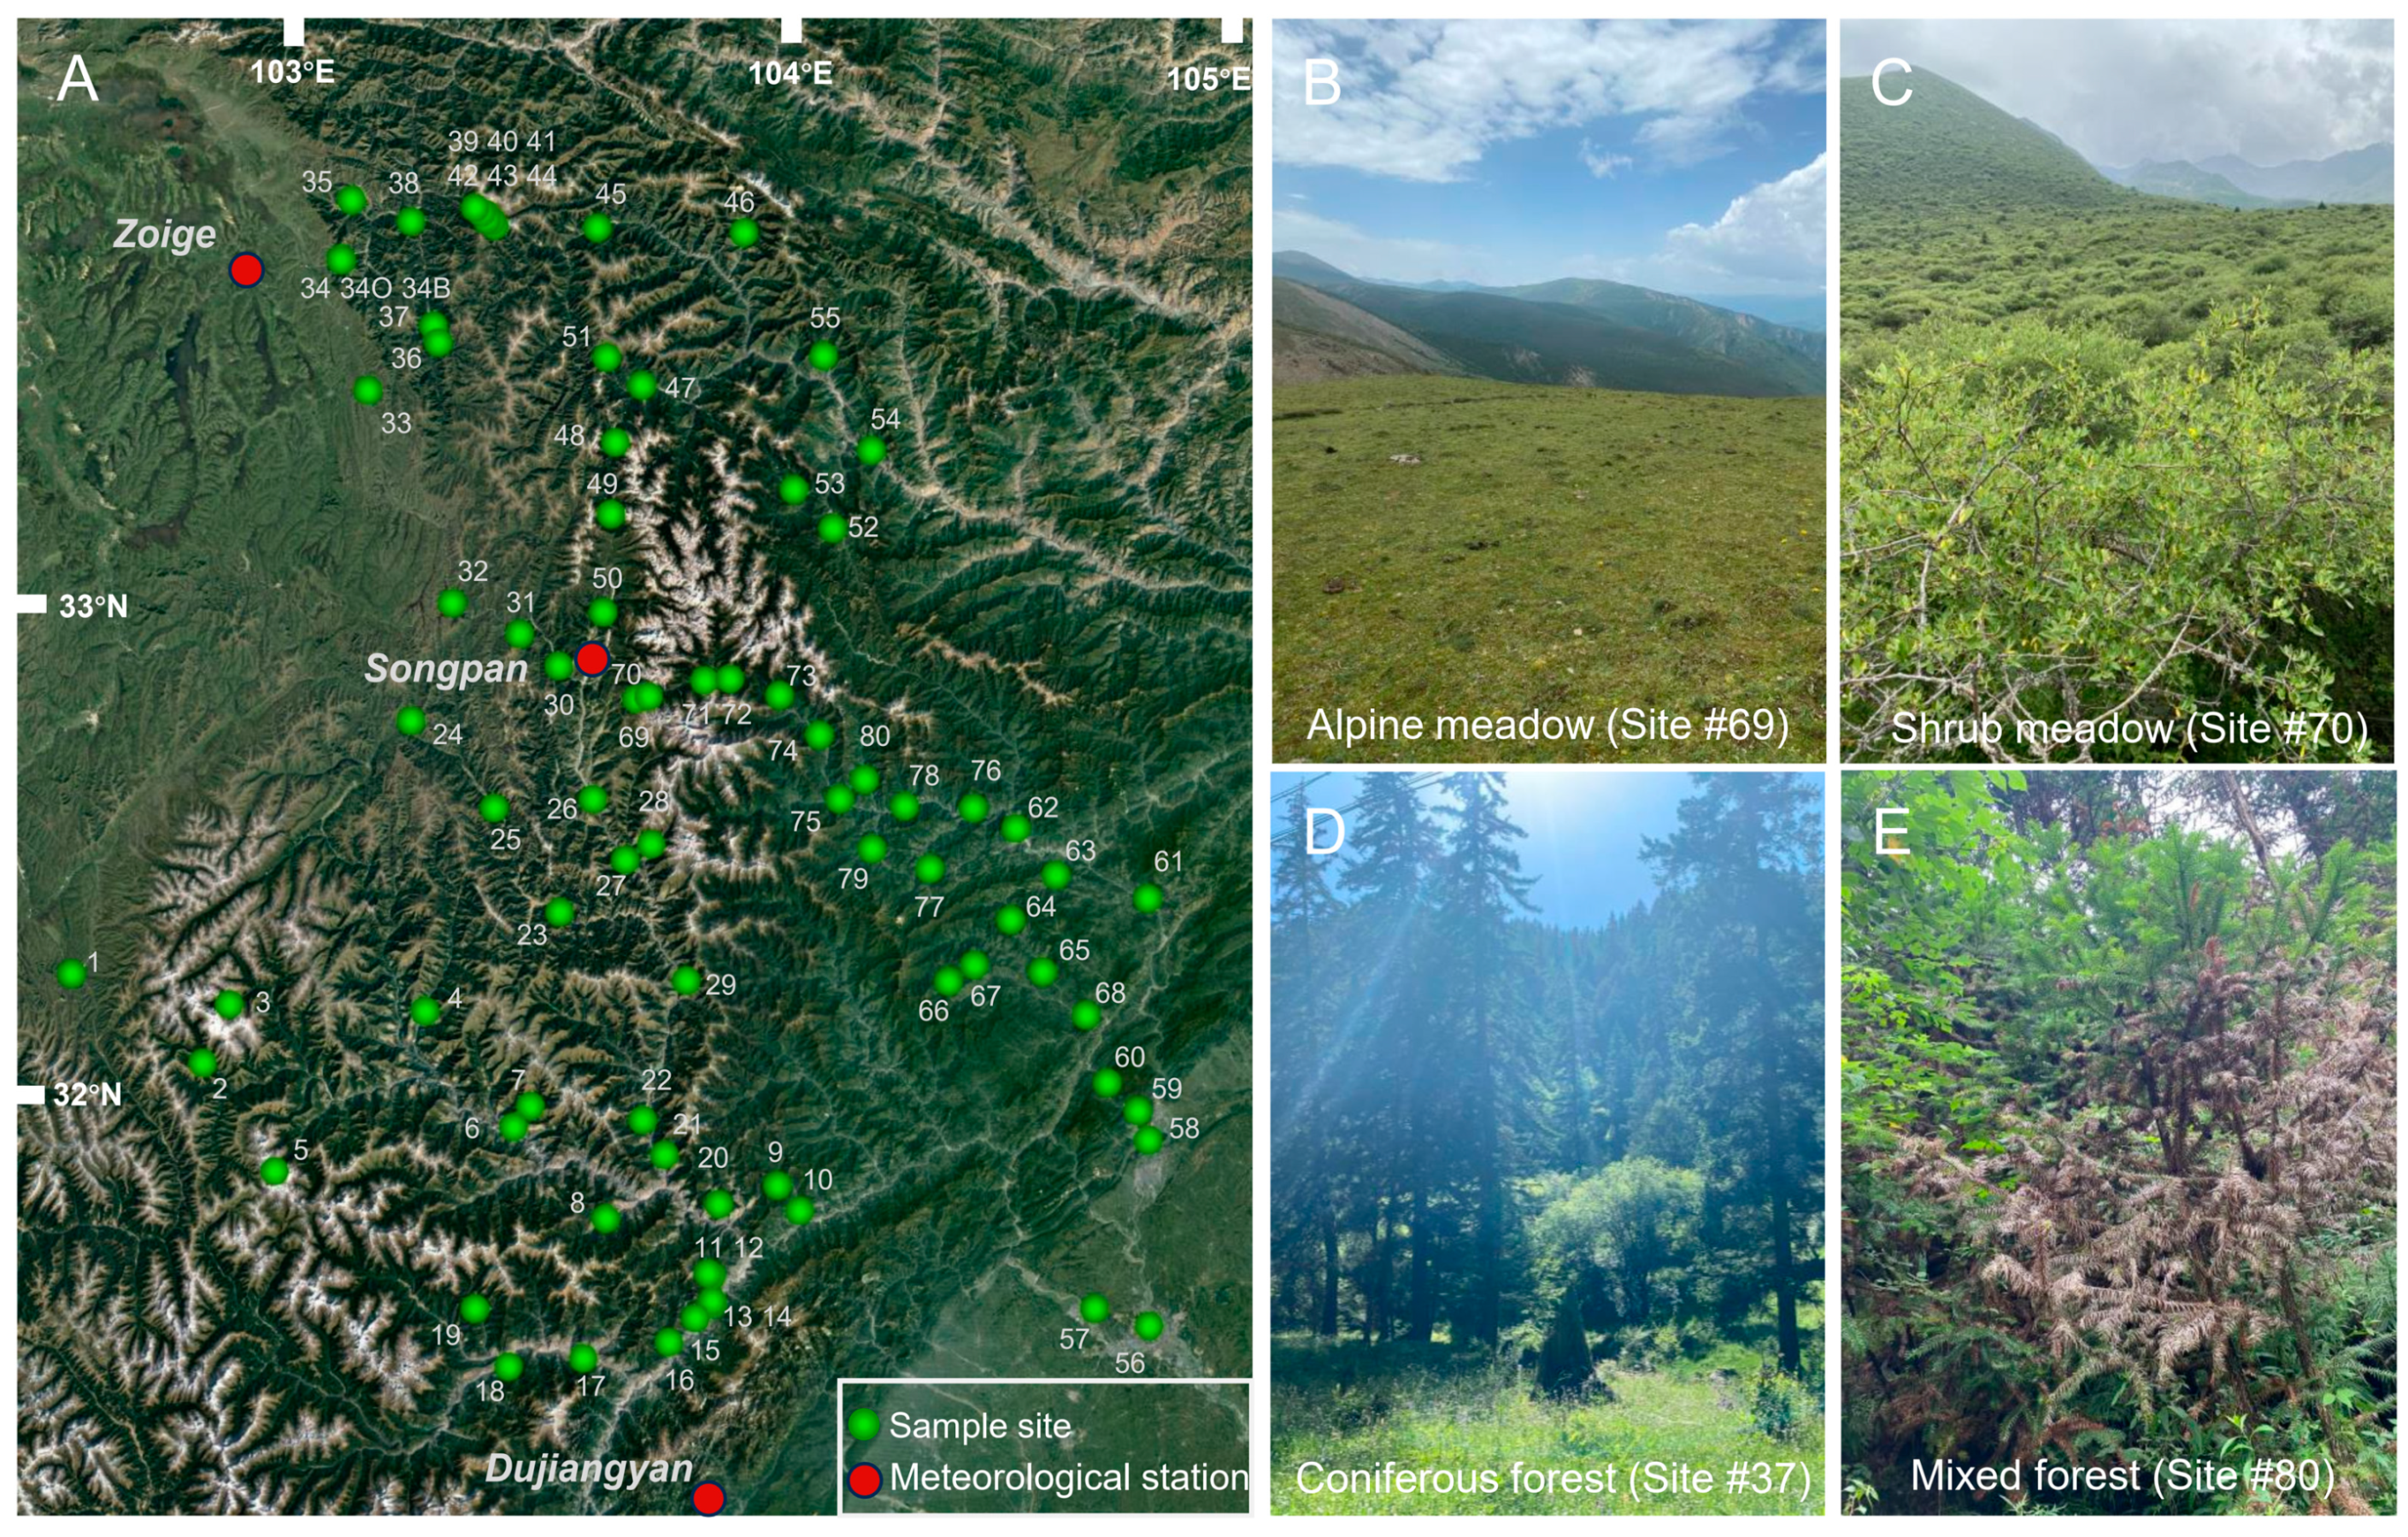
Figure 3. (A) Map (after Google Earth) showing the locations of modern samples on the eastern TP with corresponding numbers. (B) Alpine meadow at site 69 dominated by Cyperaceae-Potentilla. (C) Alpine shrub-meadow at site 70 dominated by Salix-Carex. (D) Coniferous forest of Picea at site 37. (E) Mixed forest of Cupressaceae (mainly Cunninghamia lanceolata) and Broussonetia at site 80. Vegetation in pictures (BE) mirrors other sites within the same vegetation type.
Land 13 01866 g003
Figure 4. Pollen percentages of the selected 29 terrestrial pollen taxa (> 2% at least in one sample and of ecological importance) from topsoil samples on the eastern TP. Samples no. 40, no. 34O, and no. 7, marked for coniferous forest, shrub meadow, and mixed forest, respectively. Enlarged horizontal axis scale for Tsuga.
Land 13 01866 g004
Figure 5. Predicted groups plotted against discriminant functions 1 and 2 of surface pollen data from the eastern TP. Abbreviation for vegetation types: CF = conifer forest; MF = mixed forest; S−M = shrub meadow.
Land 13 01866 g005
Figure 6. Logistic regression curves for the C/B ratio. The intersection of dashed lines indicates the C/B ratio threshold at a probability of 0.5.
Land 13 01866 g006
Figure 7. Correlation analysis of six climate variables. R−values are marked in the box to the right of the diagonal.
Land 13 01866 g007
Figure 8. Redundancy analysis plot of pollen and environmental parameters. Abbreviation for vegetation types: CF = conifer forest; MF = mixed forest; S−M = shrub meadow.
Land 13 01866 g008
Figure 9. Boxplots depicting the pollen percentages and ratios of the main taxa in three vegetation types (shrub meadow, coniferous forest, and mixed forest). The middle line and the box represent median and the first through third quartiles, respectively.
Land 13 01866 g009
Figure 10. Correlation of selected pollen percentages with elevation and MAT. The linear regression results (r2 and p-value) are shown, with the blue line area indicating the 95% confidence interval.
Land 13 01866 g010
Figure 11. Correlation of pollen ratios and RDA 1 with elevation and MAT. The linear regression results (r2 and p-value) are shown, with the blue line area indicating the 95% confidence.
Land 13 01866 g011
Table 1. Results of pollen indicator value analyses with permutation tests (n = 999).
VegetationPollen TaxaSpecificityFidelityIndValp-ValueSignificant
Shrub meadowEricaceae0.97850.60000.7660.001***
Apiaceae0.70980.80000.7540.005**
Coniferous forestThymelaeaceae0.85730.28570.4950.161-
Mixed forestJuglans0.94760.95740.9520.001***
Cupressaceae0.96210.93620.9490.001***
Alnus0.97140.91490.943 0.001***
Elaeagnus0.94930.46810.6670.03*
Viburnum1.00000.19150.4380.12-
Shrub meadow and coniferous forestPicea0.96771.00000.9840.001***
Abies0.95600.93550.9460.001***
Salix0.95480.87100.9120.002**
Caryophyllaceae0.89700.61290.7410.009 **
Coniferous forest and mixed forestTsuga0.91900.79410.8540.002**
Significant codes: 0 ‘***’ 0.001 ‘**’ 0.01 ‘*’ 0.05 ‘.’ 0.1 ‘-’ 1.
Table 2. Summary of discriminant analysis results of surface pollen assemblages from the eastern TP.
Actual GroupNo. of SamplesPredicted Group
Shrub MeadowConiferous ForestMixed Forest
Shrub meadow109 (90%)1 (10%, no.42)0
Coniferous forest21020 (95.2%)1 (4.8%, no.26)
Mixed forest470047 (100%)
Alpine meadow of [24]3023 (76.7%)5 (16.7%)3 (6.7%)
Disclaimer/Publisher’s Note: The statements, opinions and data contained in all publications are solely those of the individual author(s) and contributor(s) and not of MDPI and/or the editor(s). MDPI and/or the editor(s) disclaim responsibility for any injury to people or property resulting from any ideas, methods, instructions or products referred to in the content.