Article

Climate Change May Increase the Impact of Coastal Flooding on Carbon Storage in China’s Coastal Terrestrial Ecosystems

1
College of the Environment & Ecology, Xiamen University, No. 4221 Xiang’an South Road, Xiang’an District, Xiamen 361102, China
2
Fujian Institute for Sustainable Oceans, Xiamen University, No. 4221 Xiang’an South Road, Xiang’an District, Xiamen 361102, China
*
Author to whom correspondence should be addressed.
Land 2024, 13(11), 1871; https://doi.org/10.3390/land13111871
Submission received: 27 September 2024 / Revised: 30 October 2024 / Accepted: 6 November 2024 / Published: 8 November 2024

Abstract

:
Climate warming exacerbates the deterioration of soil and degradation of vegetation caused by coastal flooding, impairing ecosystem climate-regulating functions. This will elevate the risk of carbon storage (CS) loss, further intensifying climate change. To delve deeper into this aspect, we aimed to integrate future land use/land cover changes and global mean sea-level rise to assess the impact of coastal floods on terrestrial CS under the effects of climate change. We compared the 10-year (RP10) and 100-year (RP100) return-period floods in 2020 with projected scenarios for 2050 under SSP1-26, SSP2-45, SSP3-70, and SSP5-85. The study findings indicate that CS loss caused by coastal flooding in China’s coastal zones was 198.71 Tg (RP10) and 263.46 Tg (RP100) in 2020. In 2050, under the SSP1-26, SSP2-45, and SSP3-70 scenarios, the CS loss is projected to increase sequentially, underscoring the importance of implementing globally coordinated strategies for mitigating climate change to effectively manage coastal flooding. The value of CS loss is expected to increase in 2050, with an anticipated rise of 97–525% (RP10) and 91–498% (RP100). This highlights the essential need to include coastal flood-induced CS changes in carbon emission management and coastal climate risk assessments.

1. Introduction

Climate change, particularly the continuous increase in global temperatures, has emerged as one of the most pressing global environmental concerns, posing a significant threat to ecosystems and societies worldwide [1]. Global warming accelerates sea level rise (SLR) [2], increasing the baseline water levels for storm surges, tides, and waves. Another major impact of global warming is ocean warming, contributing to stronger tropical cyclones which can increase the destructive power of storm surges [3]. With stronger tropical cyclones and SLR, storm surges happens more frequently [4]. Storms surges, or astronomical tides, can cause temporary (hours-to-days) local sea level anomalies (extreme sea level, ESL) [5], enhancing the destruction of flooding in coastal zones [5,6,7,8].
China’s coastal region, which spans temperate, subtropical, and tropical zones, experiences severe threats from coastal flooding due to its complex climate and geography [9,10]. This region contains 42% of China’s population and contributes to over 60% of the nation’s GDP [10], with rapid growth outpacing inland areas [11]. Intensive human activity, urbanization, land reclamation, and ecological degradation have resulted in China’s coastal regions being increasingly vulnerable to climate change, particularly coastal flooding [7,12].
Terrestrial ecosystems are important carbon reservoirs that can absorb, fix or store carbon, directly affecting the global carbon cycle and climate system. Terrestrial ecosystem carbon storage (TECS, hereafter referred to as CS) is the total carbon stored in vegetation, soil, and litter. The size of CS is related to ecosystem type and land use and management [13,14,15,16]. Forest ecosystems are the largest carbon pool among terrestrial ecosystems, while barren and built-up areas are smaller. Some man-made or natural reasons can cause changes in CS. Land-use and land-cover (LULC) change, such as urbanization, agricultural development, and industrial activities, in coastal areas, has resulted in the removal of natural vegetation and land conversion [17,18]. As global temperatures rise and precipitation patterns change, land use in some areas must be adjusted [19,20,21]. Moreover, coastal floods can reduce carbon fixation and storage by damaging vegetation [22,23], exacerbating soil erosion [24,25], causing saltwater intrusion [26,27], and altering the structure and function of carbon-dense ecosystems [28,29], thereby increasing the risk of carbon emissions [30]. It is worth noting that the carbon dioxide released in these processes will further exacerbate climate warming. Therefore, studying the impact of coastal floods on the CS of terrestrial ecosystems under the combined effects of human activities and climate change is necessary.
The economic and social impacts of coastal floods have been investigated [31,32,33]. Only a few have assessed the impacts of coastal floods on CS. With climate change intensifying, research on the synergistic impacts of SLR and coastal flooding on CS is increasing [34,35,36,37]. These studies have primarily examined the effects of coastal wetland vegetation and soil during floods [38,39,40,41] and changes in vegetation and soil carbon in wetland populations or species during floods [42,43], but often on small spatial scales, limiting their direct applicability for decision-making. Field measurements of soil organic carbon and vegetation surveys provide a solid foundation for estimating CS [44,45]. The InVEST model can calculate the CS of each region based on the LULC data and carbon density data provided by the user, enabling low-cost, high-efficiency calculations of CS over large areas [46,47,48], and facilitating widespread research on the impact of LULC changes on CS [49,50]. Furthermore, studies have used the social cost of carbon (SCC) to quantify CS and carbon sequestration [51,52,53,54]. However, there exists a gap in the literature regarding the comparison of coastal floods and terrestrial ecosystem CS.
Therefore, we aimed to fill this research gap by assessing the impact of coastal floods on CS in the coastal zones of China. Specifically, we developed a GIS-based spatial modeling framework utilizing multi-source spatial data, coupled it with the SSP-RCP framework (SSP1-26, SSP2-45, SSP3-70, and SSP5-85), and evaluated carbon storage loss (CSL) and value loss caused by coastal floods in 2020 and 2050 under different emission scenarios. Our study established an assessment framework, for the first time, to estimate and monetize the CSL caused by coastal flooding, providing a quantitative analysis of CSL across regions of China’s coastal zones. It adds a new dimension to loss assessment by evaluating the changes in carbon sinks from the perspective of coastal climate risks. Moreover, it also underscores the importance of mitigating climate change and rational land-use planning.

2. Data and Methods

2.1. Research Framework

The framework of this study is illustrated in Figure 1, comprising three main steps and three key components. The steps include data collection and pre-processing, model calculation, and result analysis. The three components, from left to right, are the inundated-land module, carbon storage module, and loss-of-value estimation module. In the inundated-land module, spatial data from various sources are processed and overlaid to determine inundated areas, taking into account LULC changes and SLR over time. In the carbon storage module, a carbon density table is developed, and the InVEST model is used to estimate carbon storage losses in inundated areas. In the loss-of-value estimation module, the carbon storage loss due to flooding is monetized using SCC. All analyses are integrated within the SSP-RCP framework, enabling an assessment of the impact of climate action and economic development on coastal flood-related losses in China.

2.2. Study Area

Figure 2 shows the study area. It was within 100 km inland from the coastline of mainland China, covering an area of 652,916.41 km2, and included the coastal regions of Jilin, Liaoning, Hebei, Tianjin, Shandong, Jiangsu, Shanghai, Zhejiang, Fujian, Guangdong, and Guangxi.

2.3. Data and Preprocessing

The NASA digital elevation model (DEM) [55], with a spatial resolution of 30 m, improves upon the SRTM DEM by incorporating data from ASTER, other remote-sensing satellites, aircraft, ground surveys, and sensor technologies, offering high-quality and extensive coverage.
The ESL data were obtained from the GTSR dataset [56,57,58], with a resolution of 0.1°. This dataset, based on the hydrodynamic model GTSM v2.0, provides a global reanalysis of storm surges and ESLs and is widely used in coastal erosion, flood forecasting, and risk analysis. We utilized extreme sea-level data corresponding to 10-year (RP10) and 100-year (RP100) return periods. It is important to acknowledge that the RP100 data carry a certain degree of uncertainty within the study period. Nevertheless, we have employed it to estimate the potential worst-case loss scenario projected for 2050. These data were sourced from the Copernicus Climate Data Store (https://cds.climate.copernicus.eu/, accessed on 20 December 2023) under the dataset name “Global sea level change indicators from 1950 to 2050 derived from reanalysis and high-resolution CMIP6 climate projections”.
LULC data in 2020 and 2050 were derived from the global LULC dataset for 2020–2100 by Zhang et al. [59], and incorporate climate and socioeconomic factors to predict LULC changes under representative SSP-RCP scenarios, with a spatial resolution of 1 km. The LULC types considered in this study were cropland, forest, grassland, construction land, barren, and water.
The global mean SLR height for 2050 was based on the IPCC Sixth Assessment Report (AR6) sea-level projection datasets [1,60,61] (https://sealevel.nasa.gov/, accessed on 10 January 2024), with specific values shown in Table 1. The total water level (TWL) is calculated using Equation (1).
TWL = ESL + SLR
Carbon density data were created from global soil carbon data [62] (0–30 cm depth, 300 m resolution) and global aboveground- and belowground-biomass carbon data [63] (300 m resolution). Because of the difficulty in obtaining the dead carbon density data, we excluded it from the calculations.
Because soil and vegetation carbon density distributions are correlated with climate zones, which allows for more accurate carbon density mapping, we used climate zoning to process the carbon density tables. The climate zoning data were from the National Earth System Science Data Center (https://www.resdc.cn, accessed on 12 January 2024).
The SCC values were from Yang et al. [64], consistent with the LULC data. We used the SCC values for the SSP1, SSP2, SSP3, and SSP5 scenarios for the assessment, with the specific values shown in Table 2.

2.4. Methods

2.4.1. GIS-Based Bathtub Method

The bathtub method is a widely used approach for large-scale inundation analysis [65]. However, this approach overlooks critical factors such as flood hydrodynamics, surface friction, and the uneven distribution of sea level rise [66,67]. While hydrodynamic models can address these limitations effectively, they are computationally inefficient for large-scale areas and high-volume data, especially for simulating 100-year and 10-year flood-inundation zones. Lowering the grid resolution could improve computational efficiency, but it significantly reduces the model’s performance. Given the study area’s size, computational efficiency requirements, and the characteristics of the ESL and LULC data, we opted to apply the bathtub method for inundation analysis. Additionally, from a risk-exposure perspective, the bathtub method enables predictions of potential flood-prone areas that may not be hydrologically connected, allowing for a better assessment of vulnerable zones. This approach enhances our ability to estimate carbon storage loss and supports ecological conservation efforts [68].
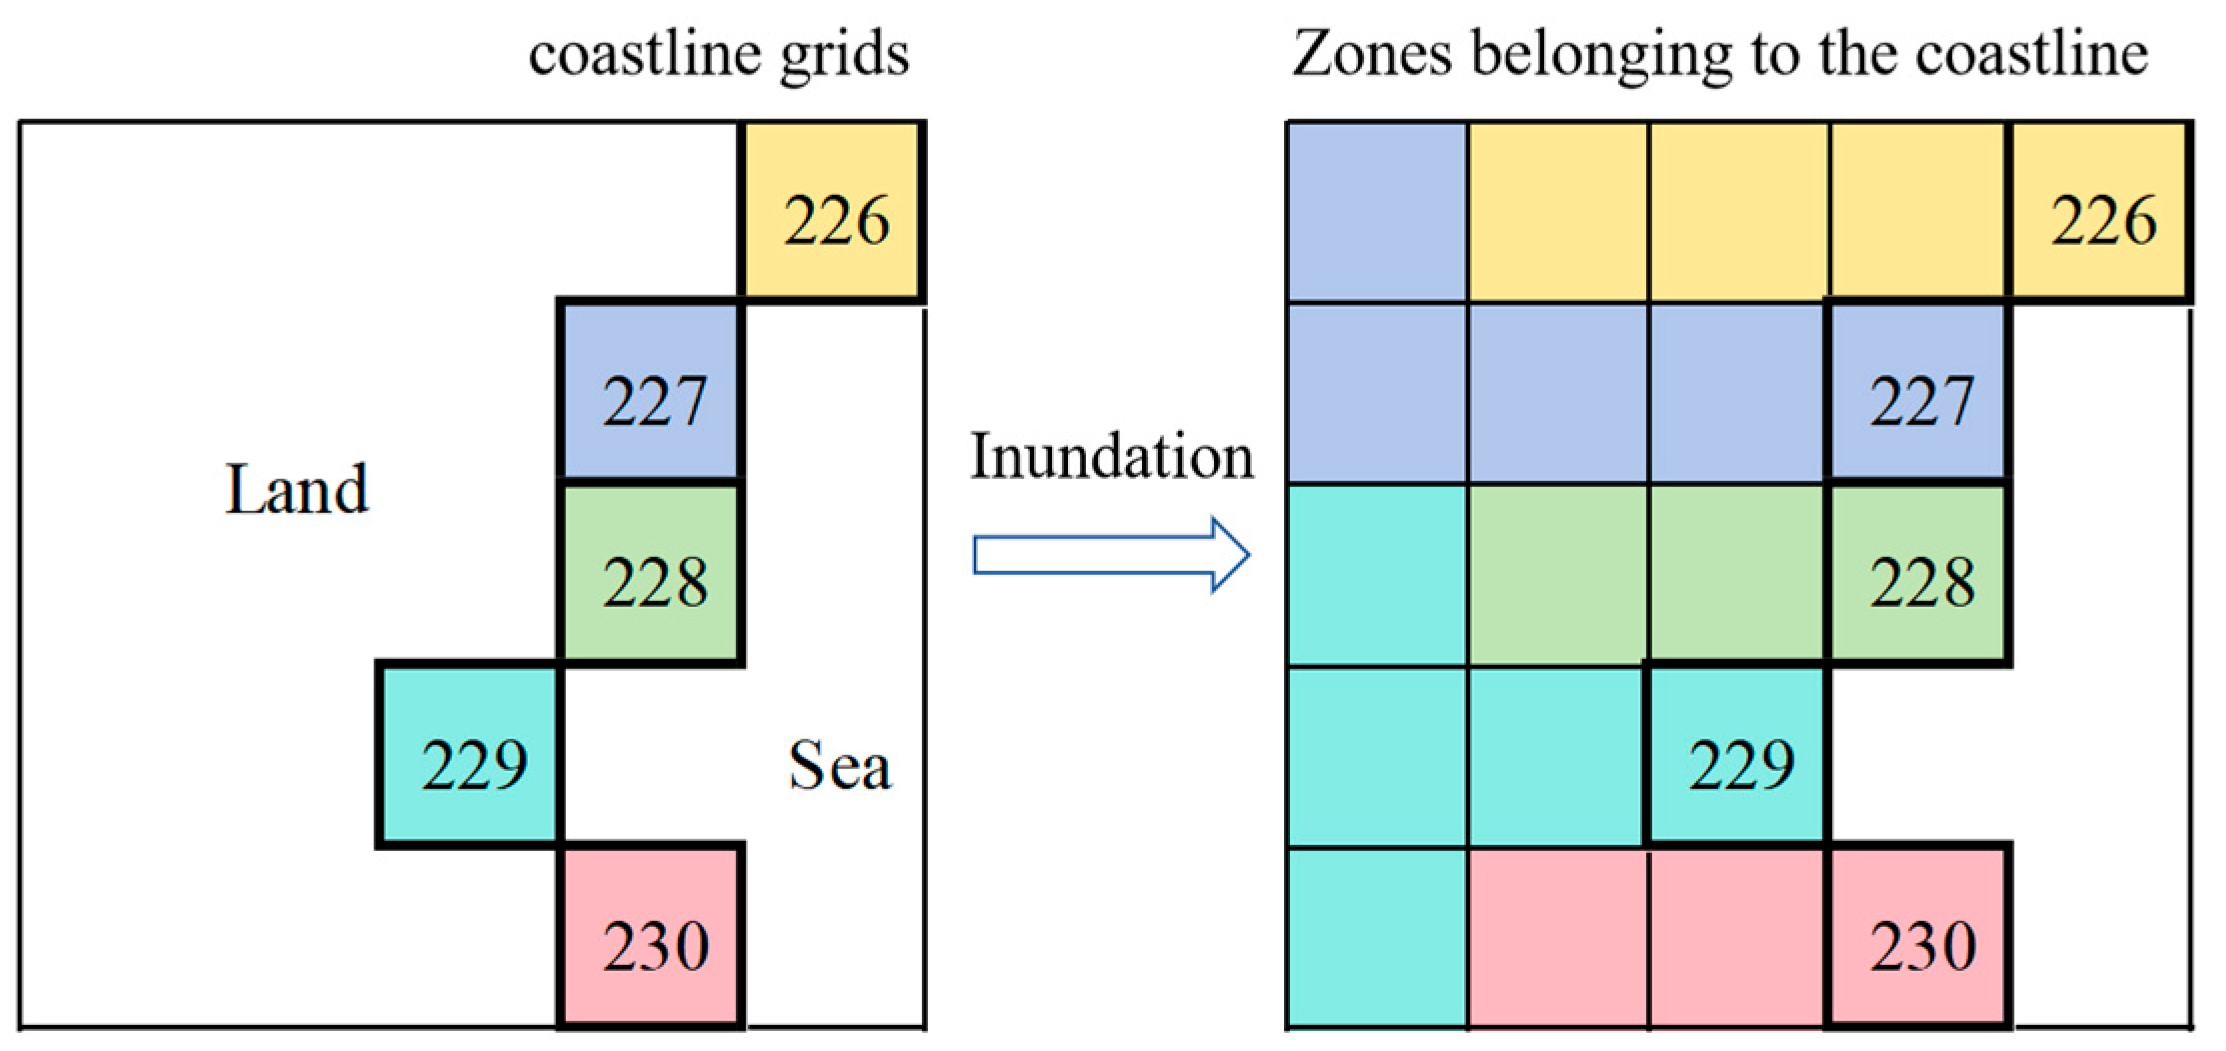
To achieve more accurate estimations of inundation areas along different sections of China’s coastline, we divided the coastline into 3149 segments, each measuring 1 km × 1 km. We applied kernel interpolation with Barriers to the point data of ESL in and around Chinese waters (Table 3), and calculated the average ESL value within each segment as the floodwater height. To align with the 30 m DEM resolution and ensure computational efficiency, we first simulated ESL using a 500 m resolution raster for inundation analysis. For LULC calculations in inundated areas, we resampled the ESL to a 1 km resolution, to match the LULC data. Given the irregularity of the coastline and in accordance with Tobler’s First Law of Geography [69], we used the Euclidean distance method to simulate inundation for each coastal segment based on the nearest ESL data, using the bathtub approach (Figure 3).

2.4.2. Calculation of CS

The InVEST model, developed jointly by Stanford University, the Nature Conservancy, and the World Wildlife Fund, is designed to support ecosystem management and decision-making. This model can be used to evaluate various ESs, including soil CS and sequestration. The module used in this study estimated CS by dividing the ecosystem’s CS into four main carbon pools: aboveground biomass carbon (carbon in all living plants above the soil), belowground biomass carbon (carbon in plant root systems), soil carbon (organic carbon in mineral and organic soils), and dead organic-matter carbon (carbon in litter, dead wood, and trash). The carbon density table in this study comprises aboveground biomass carbon, belowground biomass carbon, and soil carbon. Due to the rapid decomposition rate, high spatial and temporal variability, and challenges in measuring dead organic-matter carbon, we excluded it from our calculations. The coastal zone of China has been categorized into seven regions based on climate zones, and a carbon density table was established for each region (Table 4). The formula for this module is as follows:
C = C a b o v e   +   C b e l o w   +   C s o i l   +   C d e a d
C S = k = 1 n A k × C k   ( k = 1,2 , . . . , n )
where C is the final total carbon density for a specific LULC (t) in a climate zone, C a b o v e is the carbon density of aboveground biomass (t/ha),   C b e l o w is the carbon density of belowground biomass (t/ha),   C s o i l is the soil organic carbon density (t/ha), and   C d e a d is the carbon density of dead organic matter (t/ha), C S is the regional ecosystem CS (t), A k is the area of a specific LULC (ha) in a climate zone, and C k is the carbon density of the specific LULC type.

2.4.3. Estimation Method of Inundation Loss of CS

Due to the lack of research on models for assessing the impact of coastal flooding on CS, coastal flooding is assumed to increase soil salinity and waterlogging, leading to soil degradation and reduced productivity. This, in turn, increases the likelihood of land converting to barren area [70,71]. Additionally, the rationale is that water is less affected by temporary flooding, and construction land is heavily influenced by human activities, making it difficult to assess its carbon storage loss due to flooding. Therefore, we hypothesize that post-flood LULC will convert to barren land, except for water and construction land. The CSL was calculated using the following formula:
C S L = C b e f o r e C a f t e r
where C S L is the loss after inundation, C b e f o r e is the CS existing before inundation, C a f t e r is the CS existing before inundation.

2.4.4. Calculation of the Value of CS

The SCC represents the current societal value of the damage caused by the emission of 1 t of CO2 into the atmosphere [72]. It considers long-term impacts on agriculture, health, ecosystems, infrastructure, and other sectors [73]. Because SCC calculations are based on global and long-term impacts, they provide a consistent standard for evaluation across regions and periods. This consistency facilitates global comparisons and analyses and aids governments in the assessment and formulation of effective carbon reduction policies. Thus, the SCC is crucial for climate policy development [74]. Consequently, we used the SCC to monetize CSL by using the following specific equation:
B i = j = 0 10 3.67 S i , j × C i   ( i = 0 , 1 , 2 , 3 , 4 )
where i values from 0 to 4 represent 2020 and 2050 under SSP1-26, SSP2-45, SSP3-70, and SSP5-85; j values represent the coastal region codes from 0 to 10, corresponding to coastal zones from Liaoning to Hainan; 3.67 is the conversion factor from one ton of carbon to one ton of CO2; C i represents CS in different regions and scenarios; S i , j represents the SCC for different years and scenarios; B i and represents the value loss of CSL for different years and scenarios.

3. Results

3.1. LULC Change and CS Distribution

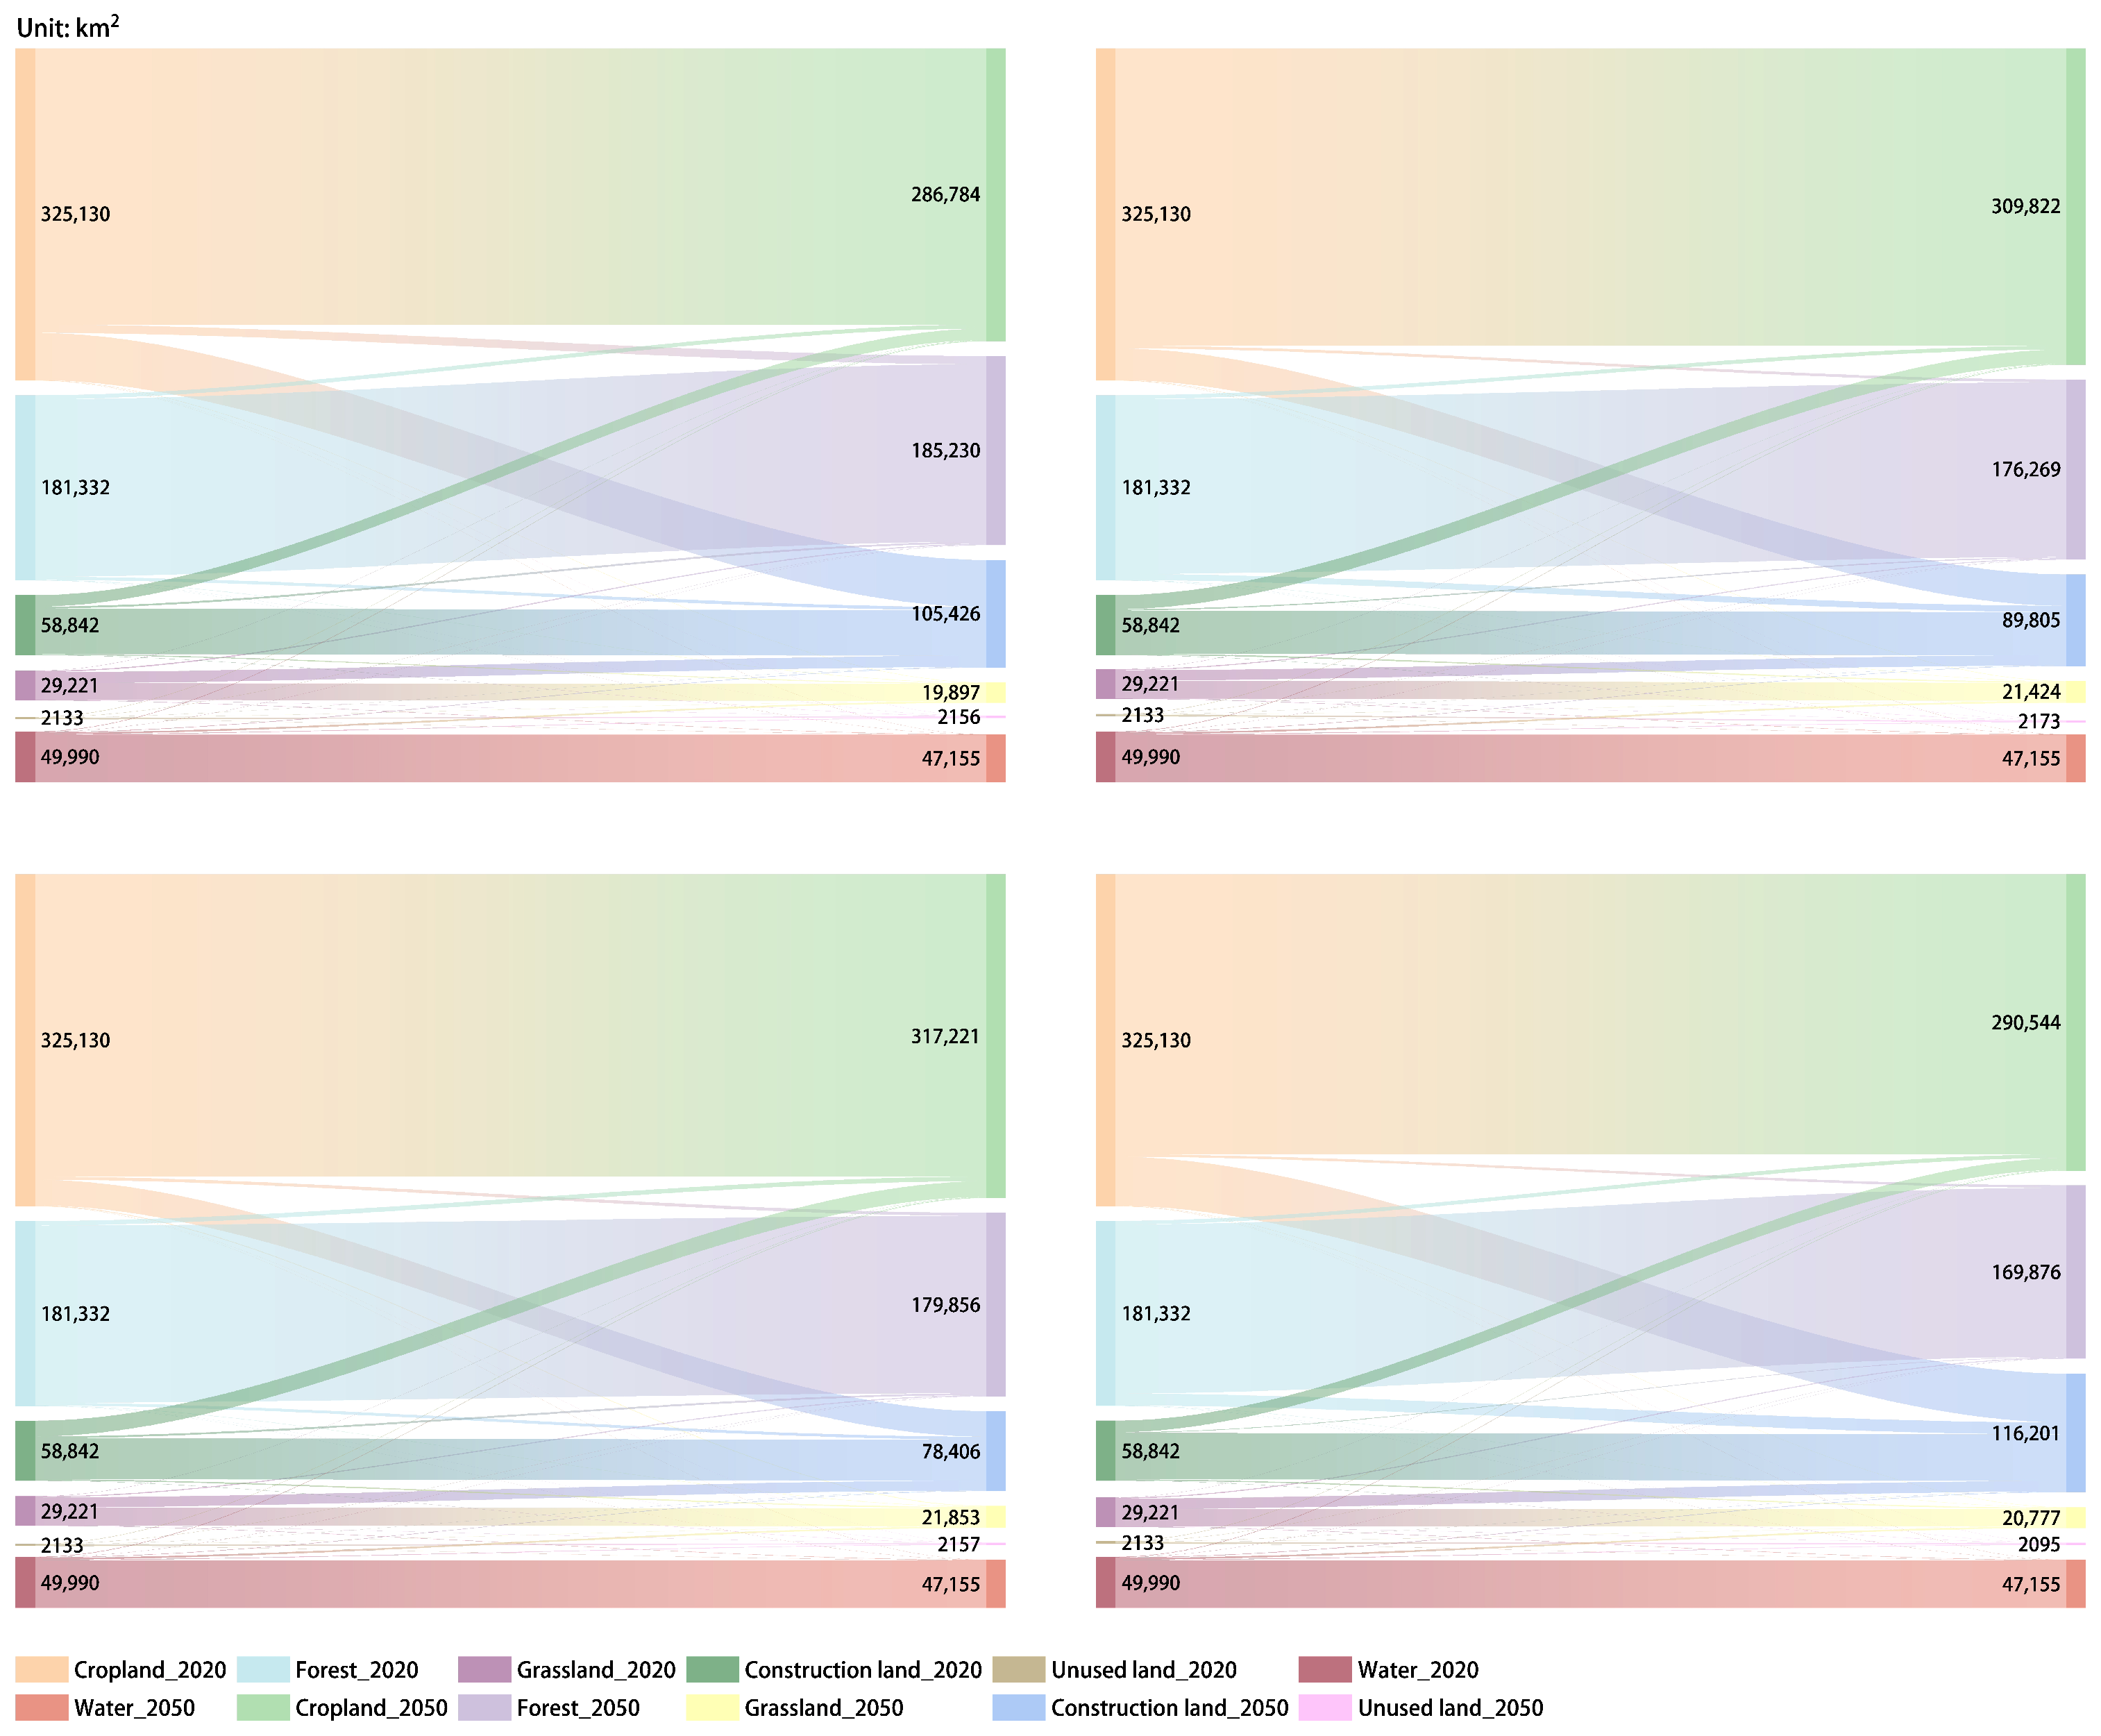
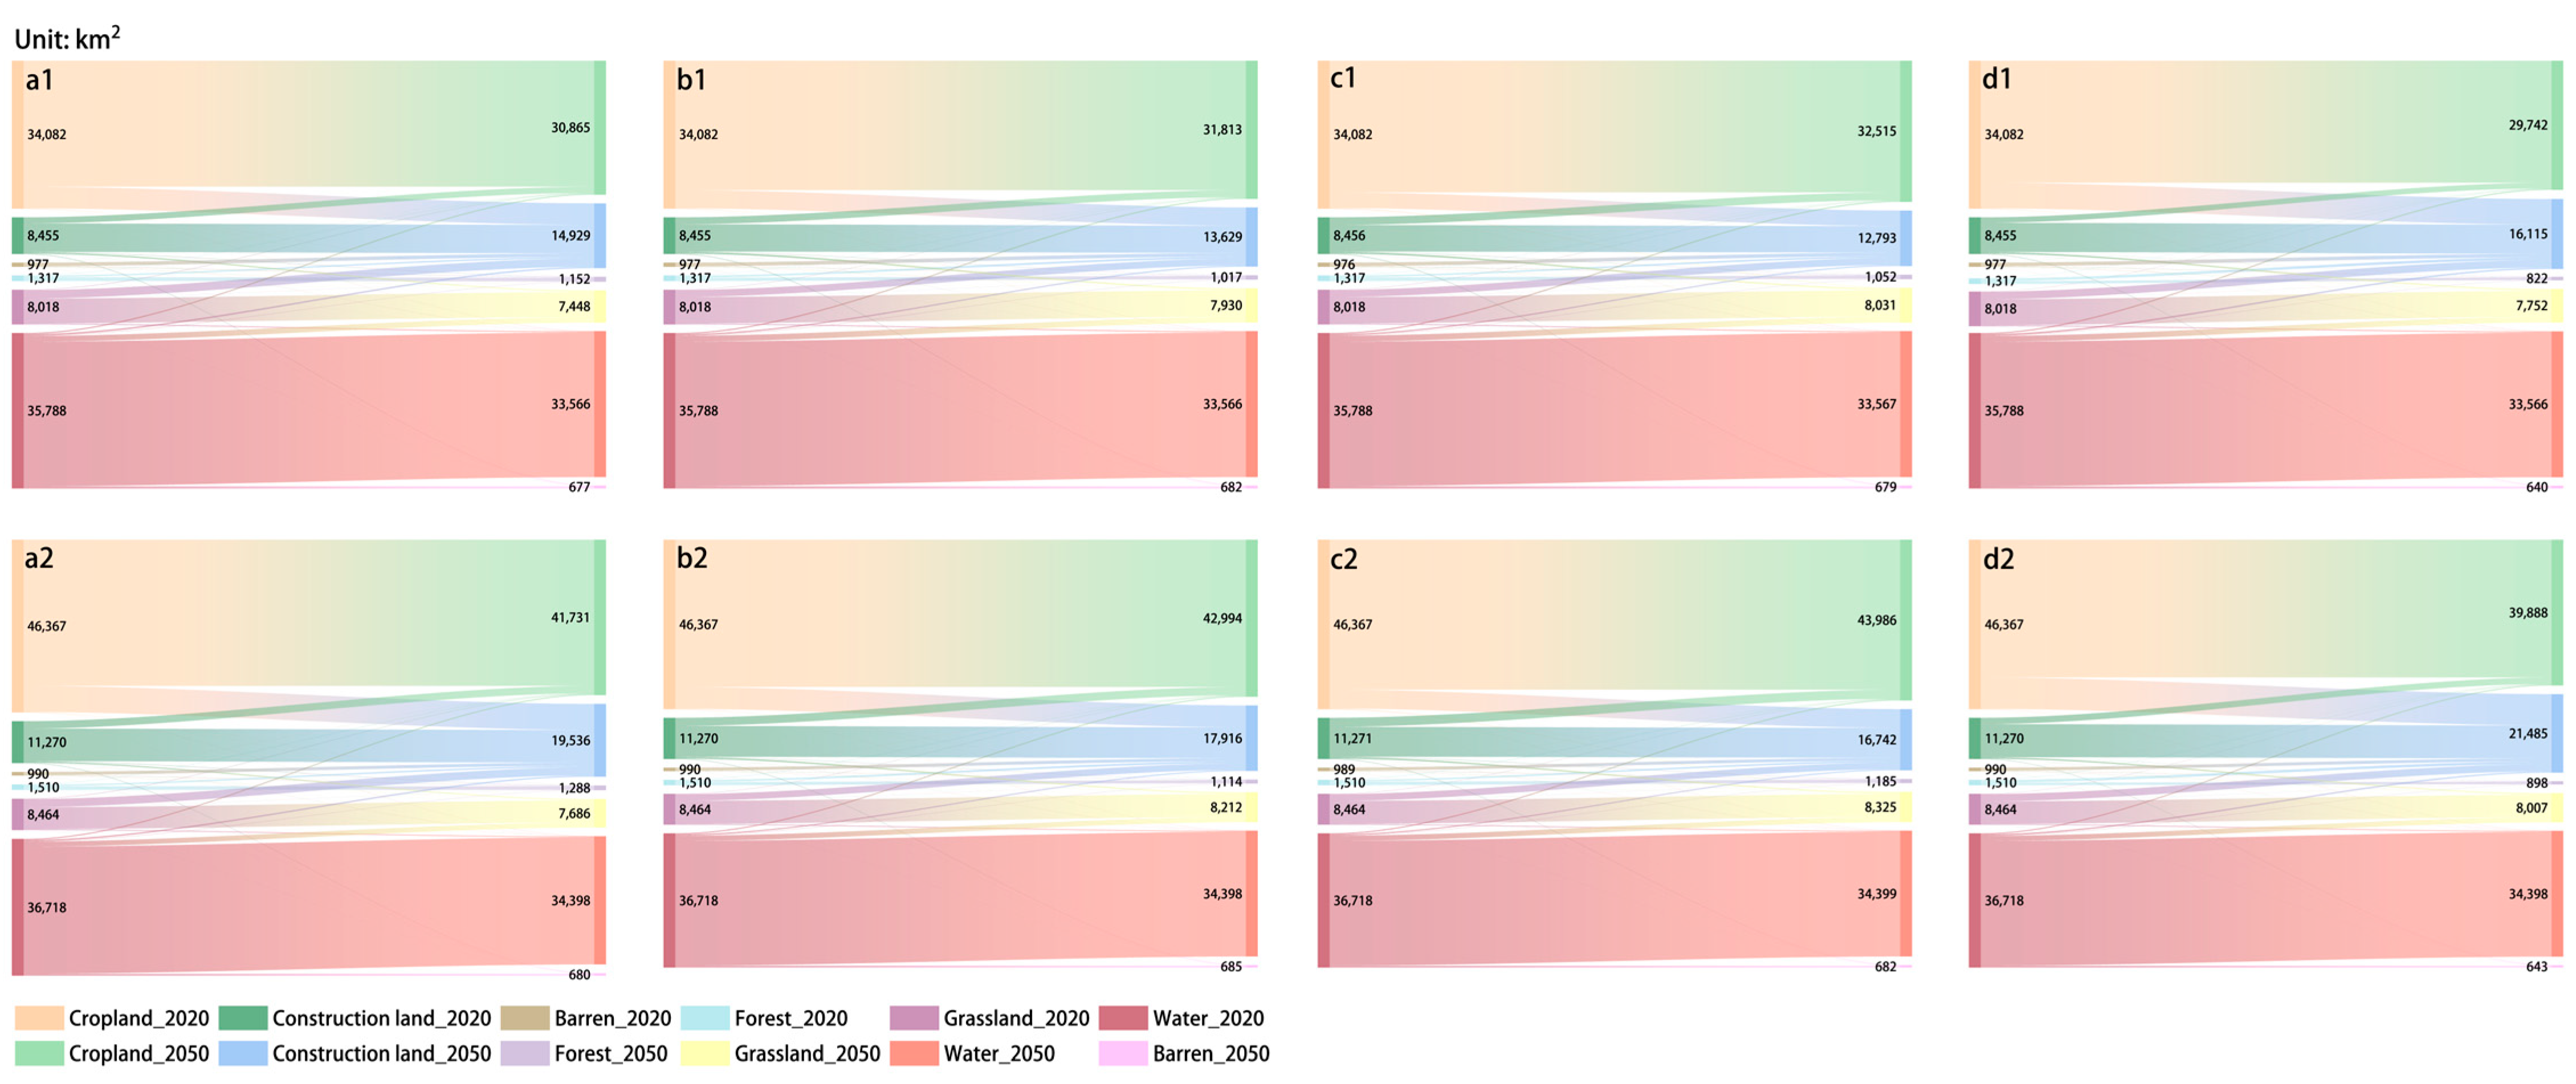
The LULC pattern in the study area was dominated by forest, cropland, and construction land. By 2050, construction land is expected to expand under various scenarios, primarily at the expense of cropland and grassland. The conversion from cropland to construction land was particularly pronounced in the SSP1-26 and SSP5-85 scenarios. Under SSP2-45 and SSP5-85, significant forest areas were also converted into construction land. The cropland area will decrease, mainly because of the conversion to construction land. The forest area expanded in SSP1-26, primarily owing to reforestation, and it decreased in the other scenarios, with the largest decrease under SSP5-85. Approximately one-third of grassland, which has a high carbon density, was converted to construction land, leading to substantial destruction (Figure 4).
In 2020, the CS of terrestrial ecosystems within 100 km of China’s coastal zones was estimated to be 11,665.69 Tg. By 2050, CS could potentially be 11,419.35 Tg (SSP1-26), 11,375.72 Tg (SSP2-45), 11,525.46 Tg (SSP3-70), or 11,091.21 Tg (SSP5-85) (Figure 5). The smallest decrease is likely to occur under SSP3-70, while the largest decrease could happen in the SSP5-85 scenario. This outcome may be due to the expansion of cropland and forest areas under SSP3-70, and the significant reduction in forest cover and conversion of cropland to construction land under SSP5-85.
From a regional perspective, CS was generally higher south of the Yangtze River than north of the river. Most areas north of the Yangtze River showed a positive change in CS, and areas to the south primarily showed negative changes. CS density in China’s coastal zone was classified into four levels: >30,000 t/km2 (Fujian and Hainan), 20,000–30,000 t/km2 (Jilin, Zhejiang, Guangdong, and Guangxi), 10,000–20,000 t/km2 (Liaoning), and <10,000 t/km2 (Hebei, Tianjin, Shandong, Jiangsu, and Shanghai).

3.2. LULC Inundation

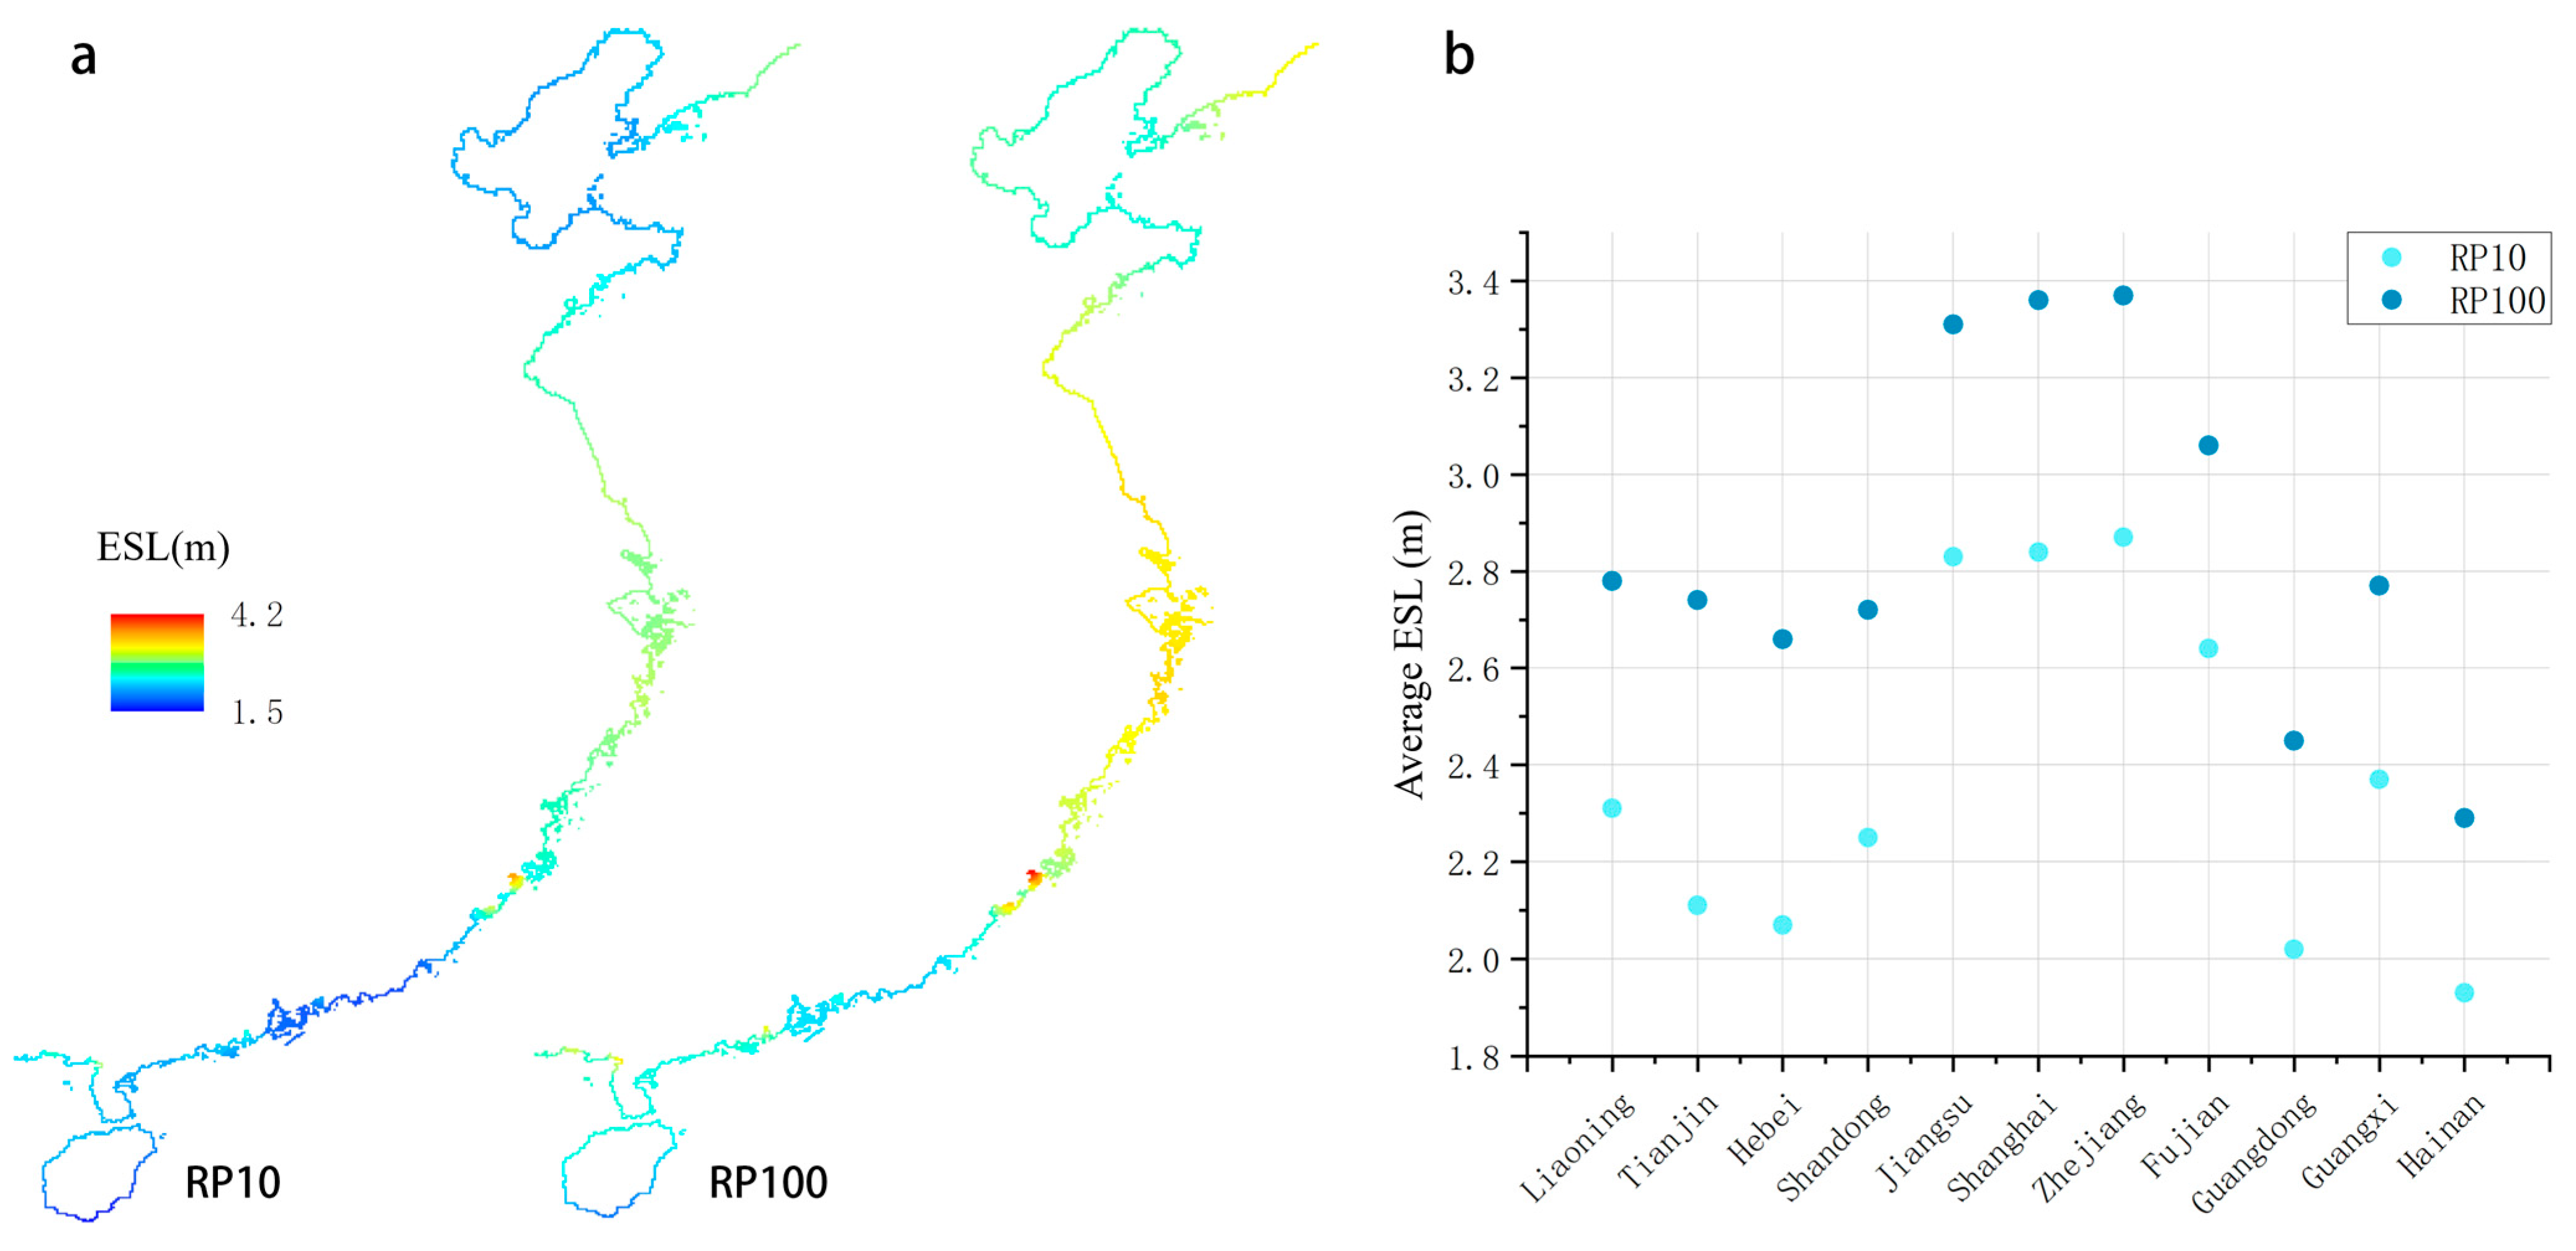
As shown in Figure 6, the ESL heights in China’s coastal areas were higher in the central region than in the southern and northern regions. In 2020, the average ESL heights were 2.38 m (RP10) and 2.84 m (RP100), resulting in inundation areas of about 88,282 km2 (RP10) and 104,953 km2 (RP100), accounting for 13.55% and 16.10% of the study area, respectively. By 2050, owing to global SLR caused by climate change, the inundation areas under the four scenarios may increase. By 2050, the growth rates of the ESL inundation areas may range from 12.75% to 14.19% (RP10) and from 0.31% to 0.37% (RP100), with a gradual increase in order, by scenario. The low growth rate of inundated areas of RP100 flood can be attributed to the fact that most low-lying regions were already submerged by 2020. Consequently, although the average sea level is projected to rise by 2050, the remaining areas with higher elevations and steeper slopes than inundated areas experience a slower increase in the extent of inundation.
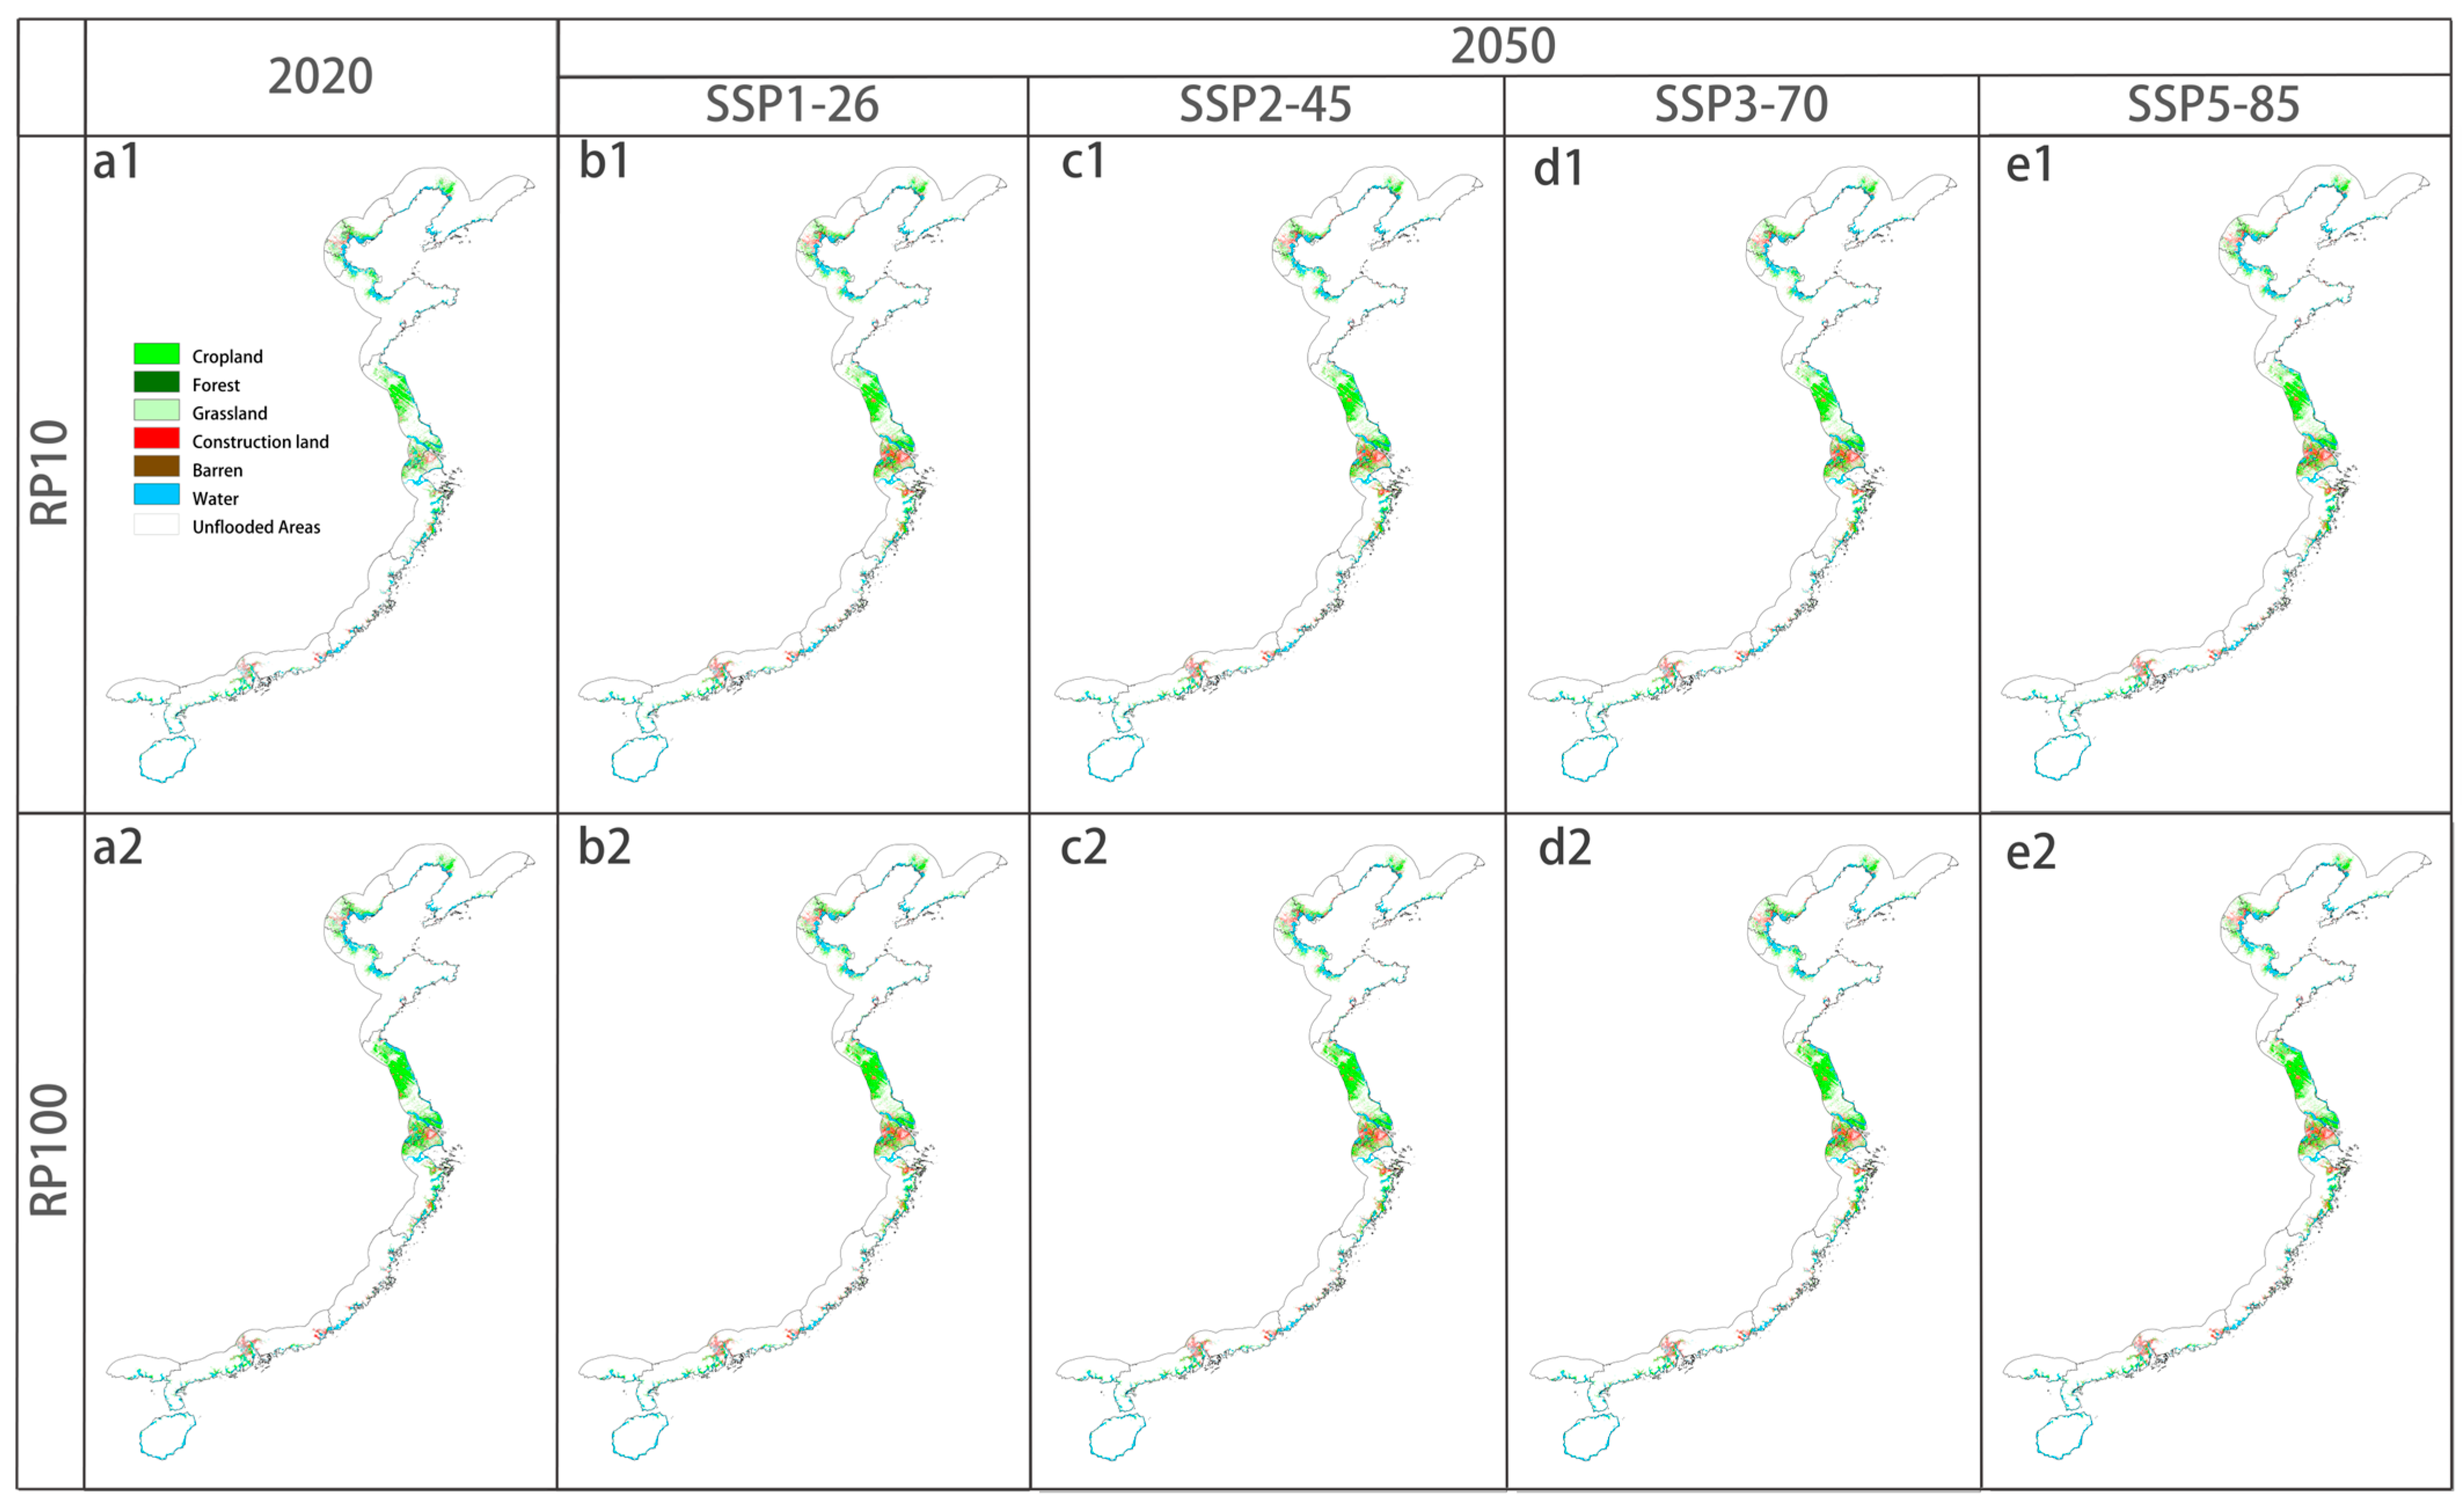
Regionally, whether in 2020, 2050, or under different ESL return periods, the spatial distribution of ESL heights along China’s coast showed a north-to-south pattern of low-high-low variation (Figure 7). The areas with high ESL were concentrated in Jiangsu, Shanghai, Zhejiang, and Fujian. Jiangsu’s coastal zone had the largest inundation area, which was significantly higher than that of other regions, accounting for more than about 30% of the study area. Other large inundation areas were Zhejiang, Guangdong, Shandong, Liaoning, Hebei, Tianjin, and Shanghai (the order varied, according to the scenario). Small inundation areas were observed in Fujian, Guangxi, and Hainan. Jilin was excluded from the discussion because it was not inundated in the coastal zone. Although Shanghai and Tianjin had small areas, the proportion of inundated areas may exceed 20%, much higher than that in other regions.
Floods primarily inundate cropland and water, accounting for nearly two-thirds of the total flooded area, followed by grassland and construction land, which constitute approximately one-third. Forest and barren areas are minimally affected. By 2050, construction land is possibly projected to increase by more than 0.5 times compared to 2020, representing the most significant LULC change. Under the SSP1-26 and SSP5-85 scenarios, less cropland and grassland and more construction land may be inundated compared to the SSP2-45 and SSP3-70 scenarios (Figure 8). However, one must note that SSP1-26 and SSP5-85 scenarios represent two extreme development pathways. Under SSP1-26, urban expansion is orderly and sustainable, with a focus on green infrastructure, ecological protection, and improved agricultural efficiency. In contrast, SSP5-85 represents unregulated urban sprawl, expansion of traditional high-carbon infrastructure, severe environmental impacts, loss of agricultural land, and ecosystem degradation.

3.3. CSL

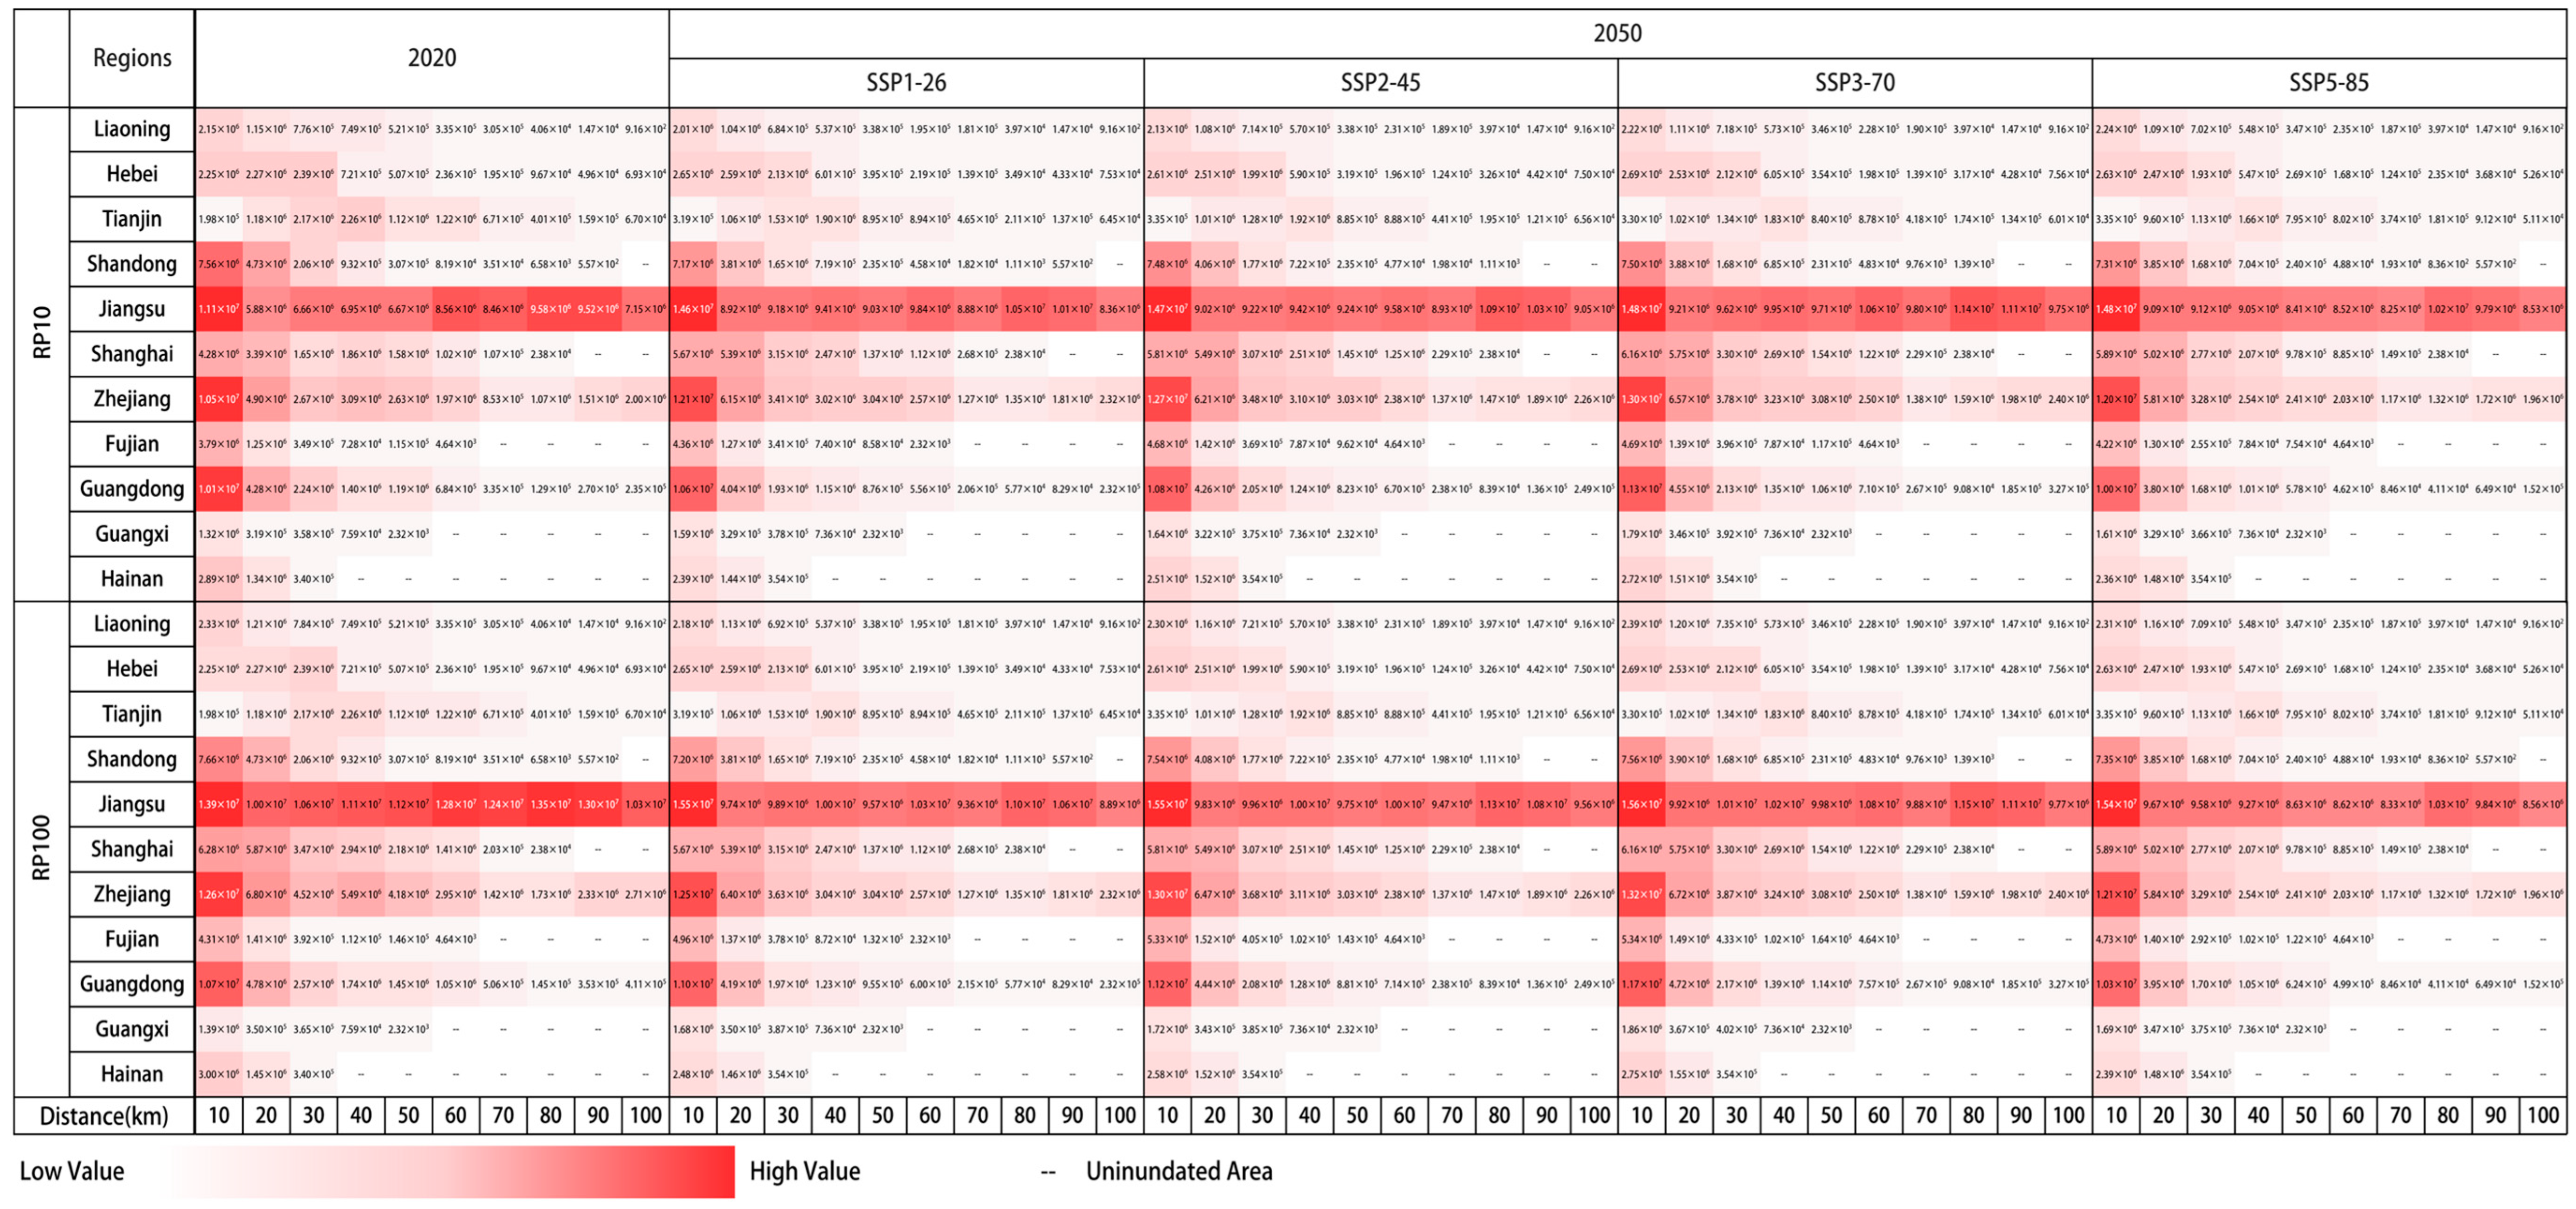
Intensified climate change increases the damage and frequency of floods in coastal areas, with 100-year floods expected to become frequent disasters, occurring every 9–15 years by 2050 [75]. These phenomena damage assets, populations, and infrastructure in coastal areas, while also significantly affecting ecosystems by releasing stored carbon and exacerbating climate change. In 2020, the CS in China’s coastal land ecosystems threatened by ESLs was approximately 198.71 Mt (RP10) and 263.46 Mt (RP100). By 2050, the projected CSLs due to flooding are about 212.11–237.55 Mt (RP10) and 216.24–242.91 Mt (RP100). The CSL under RP10 flooding in 2050 is generally higher than that in 2020, whereas the loss under RP100 flooding in 2050 is generally lower than that in 2020. This is due to the fact that in 2020, the construction land was smaller, and by 2050 the increase in inundated area under RP100 flooding was minimal, with a significant expansion of construction land. Consequently, in 2020, the RP100 flood inundated fewer construction-land zones, resulting in higher calculated ecosystem CS. The CSL in both 2020 and 2050 represents approximately 2% of the coastal zone’s total. Among the scenarios for 2050, SSP5-85 shows the lowest CSL, followed by SSP1-26, SSP2-45, and the highest loss in SSP3-70 (Figure 9).
Regionally, Jiangsu, Zhejiang, and Guangdong in the central coastal area are likely to experience the largest inundation areas and CSL, potentially accounting for more than 70% of the total loss in China’s coastal zone. Tianjin, Jiangsu, Shanghai, and Zhejiang could have the highest CSL, possibly exceeding 400 t/km2. Annual increases in losses may mainly occur in Hebei, Fujian, and Guangxi, with the largest increase projected under SSP3-70 and a potential decrease in Tianjin.
We divided the study area into 10 km interval bands. Among these, the 0–10 km band is expected to have the highest CSL due to inundation, accounting for approximately 28% (RP10) and 25% (RP100) of the total loss in 2020, potentially rising to 28–30% (RP10) and 25–30% (RP100) by 2050. The 10–20 km band might account for 15% (RP10, RP100) of the total loss in 2020, with proportions of inundation across different scenarios possibly reaching 16–17% (RP10, RP100) in 2050. The 20–30 km band is likely to maintain its share at 11% (RP10, RP100) of the total loss in both 2020 and 2050. The CSL within 30 km of the coastal zone could exceed half of the total losses, indicating it as the most critical area for monitoring. The 0–10 km band in the coastal zones of Zhejiang and Guangdong may experience the highest CSL, while Jiangsu might show more significant inland losses compared to the coast. The 0–10 km coastal band in Tianjin is anticipated to have a relatively low CSL (Figure 10).

3.4. Value of CSL

Studies have primarily focused on the direct economic losses caused by ESLs, often overlooking indirect impacts. Using the SCC, this study quantified the economic loss from increased carbon emissions due to coastal flooding. In 2020, the value of CSL due to flooding along China’s coast was estimated to be 13,462.27 million (based on the 2005 USD value, RP10) and 17,849.22 million (RP100). By 2050, the highest value of CSL could occur under SSP3-70 and the lowest might be observed under SSP1-26 (Figure 11). This variation is due to SSP3 being characterized by regional competition and fragmented development, leading to a high initial SCC due to greater mitigation and adaptation challenges. By contrast, SSP1 represents a sustainable development pathway with low emissions and mitigation efforts, resulting in the lowest SCC among all scenarios. The relatively low value of CSL in SSP5 is due to it being in the early stages of economic growth by 2050, with slower growth and relatively lower SCC than other scenarios. In 2020, the value of CSL was approximately 0.11–0.14% of the GDP in the study area (from RP10 to RP100, respectively). By 2050, the values were projected to be 0.19–0.25% (SSP1-26), 0.20–0.21% (SSP2-45), 0.48–0.49% (SSP3-70), and 0.10% (SSP5-85).

4. Discussion

4.1. Implications of CSL Value for Coastal Carbon-Emission Management and Coastal Zone Climate-Risk Evaluation

From 1982 to 2014, the annual average direct economic loss caused by coastal and maritime disasters in China was USD 2.95 billion per year [10]. By contrast, the value of the CSL in 2020 due to coastal flooding was estimated to be 5–6 times higher than the annual average. By 2050, it may reach 10–33 times higher, depending on the scenario, increasing progressively from SSP1-26 to SSP3-70. SSP5-85 is likely to fall between SSP1-26 and SSP2-45, primarily because the SCC and CSL in 2050 under SSP5-85 remains low.
We recommend incorporating changes in ecosystem CS due to climate risks, such as coastal flooding, into carbon emission management and climate risk loss-assessment systems. Our study, along with related research on wildfires [76] and hurricanes [77], demonstrated that climate risks can cause a significant release of carbon from vegetation and soil, leading to substantial economic losses that must be considered in climate risk assessments. The CO2 released by these disasters not only increases atmospheric greenhouse gas concentrations but also diminishes the carbon sequestration capacity of ecosystems, decreasing ecosystem service value. Sangha et al. emphasized the importance of monetizing the loss of ESs caused by natural disasters [78]. Incorporating CS changes caused by climate risks into carbon emissions management helps account for carbon emissions more comprehensively and accurately, resulting in carbon pricing being more reflective of their actual impact than the past. This study provides a basis for developing more scientific and equitable climate policies, enhancing the effectiveness of carbon trading markets and carbon tax policies, and ultimately promoting sustainable development in coastal areas while strengthening resilience to climate change.

4.2. Mitigating the Threat of Coastal Flooding to CS Requires Globally Coordinated Climate Action

Because of the significant human activity in construction land, measures may be implemented to protect these areas from flood damage. Therefore, estimating CSL in construction land is challenging. Our study only calculated CS in non-construction land, not in construction land. In 2020, the inundated non-construction land covered an estimated 79,881 km2 (RP10) and 93,740 km2 (RP100). By 2050, owing to the expansion of construction land, non-construction land threatened by 100-year floods could decrease under various scenarios, and those threatened by 10-year floods may increase. This difference is likely because construction-land expansion is relatively smaller within the 10-year flood-inundation zone but relatively larger within the 100-year flood-inundation zone.
Our study showed that the CSL due to coastal floods was primarily related to changes in ESLs and LULC. The ESL influenced the extent of flood inundation, while LULC changes driven by climate change and human activity affected the quantity and distribution of CS. According to Tang et al. [79], China’s terrestrial ecosystems contain 89.27 Pg. In 2020, China’s coastal zone stored approximately 13% of the national CS, with potential losses of 198.71 Tg (RP10) and 263.46 Tg (RP100) due to coastal flooding. Owing to rising global mean sea levels, by 2050, the inundation area from coastal floods could increase by 1.92–2.07% (RP10) and 1.96–2.11% (RP100). The loss is expected to increase progressively from the SSP1-26 to SSP3-70 scenarios. The SSP5-85 scenario is likely to show the smallest loss among the four scenarios, mainly because the baseline carbon storage in terrestrial ecosystems is expected to be very low in SSP5-85, resulting in less carbon being threatened by flooding.
Therefore, coastal flooding could have a significant impact on the CS of terrestrial ecosystems in China’s coastal regions. International cooperation and coordinated action may be essential to mitigate the impacts of climate change. Increasing the stringency of emission reduction measures has potential to gradually reverse global greenhouse gas emission trends.

4.3. Regional Differences in Impact of Coastal Floods on Ecosystem CS

Jiangsu Province, with its low-lying terrain and extensive water systems, may experience the most significant inundation and highest CSL, requiring focused attention on its potential inland damage. Zhejiang and Guangdong, likely impacted by typhoons, could see substantial losses, primarily within 20 km of the coast. Shandong, with its large urban areas and low carbon density, may have relatively low CSL; however, a significant increase in SCC is anticipated by 2050. Liaoning and Hebei, characterized by extensive construction land and low carbon densities, might experience lower losses than other regions, though Hebei’s losses are expected to rise significantly by 2050. Shanghai, being low-lying and located at the mouth of the Yangtze River, could have a high proportion of inundated areas, with CSL values likely to increase by 2050. Despite its small size and low carbon density, Tianjin is projected to experience a significant rise in carbon losses. Fujian, Guangxi, and Hainan, with their diverse and elevated terrains, are expected to see smaller inundation areas and lower losses compared to the other regions, with losses in Guangxi and Hainan possibly decreasing by 2050.
In conclusion, our findings imply that CSL and the value loss varied significantly across China’s coastal zones, due to the diverse natural environmental conditions present in these regions. In coastal regions, strengthening the coastal infrastructure, enhancing urban flood control and drainage capacity, and protecting and enhancing coastal ecosystems to boost natural carbon sequestration are key strategies for mitigating future SLR threats. Accurately formulating and adjusting relevant policies can safeguard and improve regional and global ecological security and promote sustainable economic development. These measures will enhance regional adaptation to future climate change, protect and promote ecological and economic prosperity, and are crucial for long-term environmental protection and societal well-being.

4.4. Limitations and Uncertainties

The primary data limitations are the following: (1) the discreteness and low spatial resolution of LULC data, which constrain carbon-storage calculation accuracy; (2) inaccuracies in carbon density data; (3) uncertainties in ESL data; (4) surface-model errors; (5) use of global SCC values, which may not represent China accurately, with no regional SCC data available for China’s coastal areas; and (6) limited coastal wetland data.
Methodological limitations include the following: (1) the inundation algorithm’s lack of hydrodynamic factors, vegetation friction, and flood infrastructure impacts, possibly leading to overestimation; and (2) limited macro-scale carbon-storage loss estimation, as mechanisms of carbon storage change due to flood inundation are under-researched, and our method reflects these losses with limited precision.
These limitations will undoubtedly guide our future work. We plan to develop region-specific LULC datasets, apply more precise surface models [80], refine flood-inundation methods [81,82], estimate SCC regionally, and enhance carbon-storage and loss algorithms to improve assessment accuracy and strengthen our research framework.

5. Conclusions

Approximately one-tenth of China’s coastal zone is threatened by floods, with global climate change, rising sea levels, and increasing urbanization. The area at risk, along with CS and its value, is expected to increase significantly by 2050. The threat escalates progressively across scenarios SSP1-26, SSP2-45, and SSP3-70, while SSP5-85 is projected to have the lowest CSL, with its value falling between SSP1-26 and SSP2-45. This result is because of the lower amount of CS included in the calculation and the higher SCC than SSP1-26. Therefore, in coastal flood prevention and mitigation, both enhancing flood infrastructure and ecological protection and considering the increased carbon emissions due to climate risks are essential. Coordinated global efforts to mitigate climate change are also crucial.

Supplementary Materials

The following supporting information can be downloaded at: https://www.mdpi.com/article/10.3390/land13111871/s1, Figure S1. Carbon Storage in the Study Area in 2000; Figure S2. Land Use and Land Cover Change from 2000 to 2020: (a) Entire Study Area; (b1) Areas Inundated by a 10-Year Flood; (b2) Areas Inundated by a 100-Year Flood; Figure S3. Carbon Storage Loss Due to Flood Inundation Under Different Return Periods (rp10, rp100) in 2000; Figure S4. Carbon Storage Value Loss Due to Flood Inundation Under Different Return Periods (rp10, rp100) in 2000.

Author Contributions

Conceptualization, J.L.; data curation, S.Y. and J.L.; formal analysis, S.Y.; funding acquisition, X.X.; methodology, S.Y.; project administration, X.X.; software, S.Y.; supervision, J.L. and X.X.; validation, S.Y. and J.L.; visualization, S.Y.; writing—original draft, S.Y.; writing—review and editing, S.Y. and J.L. All authors have read and agreed to the published version of the manuscript.

Funding

This research was funded by the Major Project of the Fujian Social Science Foundation Base, grant number FJ2023JDZ007.

Data Availability Statement

Data is contained within the article and Supplementary Materials, further inquiries can be directed to the authors.

Acknowledgments

We thank the projection authors for developing and making the sea-level rise projections available, multiple funding agencies for supporting the development of the projections, and the NASA Sea Level Change Team for developing and hosting the IPCC AR6 Sea Level Projection Tool.

Conflicts of Interest

The authors declare no conflicts of interest.

References

  1. Intergovernmental Panel On Climate Change (IPCC) Climate Change 2021—The Physical Science Basis: Working Group I. Contribution to the Sixth Assessment Report of the Intergovernmental Panel on Climate Change, 1st ed.; Cambridge University Press: Cambridge, UK, 2023; ISBN 978-1-00-915789-6. [Google Scholar]
  2. Dangendorf, S.; Hay, C.; Calafat, F.M.; Marcos, M.; Piecuch, C.G.; Berk, K.; Jensen, J. Persistent Acceleration in Global Sea-Level Rise since the 1960s. Nat. Clim. Change 2019, 9, 705–710. [Google Scholar] [CrossRef]
  3. Shu, Y.; Mimura, N. Prediction of Storm Surge in Ise Bay under Global Warming Condition. Proc. Symp. Glob. Environ. 2006, 14, 253–258. [Google Scholar] [CrossRef]
  4. Bevacqua, E.; Maraun, D.; Vousdoukas, M.I.; Voukouvalas, E.; Vrac, M.; Mentaschi, L.; Widmann, M. Higher Probability of Compound Flooding from Precipitation and Storm Surge in Europe under Anthropogenic Climate Change. Sci. Adv. 2019, 5, eaaw5531. [Google Scholar] [CrossRef] [PubMed]
  5. Gregory, J.M.; Griffies, S.M.; Hughes, C.W.; Lowe, J.A.; Church, J.A.; Fukimori, I.; Gomez, N.; Kopp, R.E.; Landerer, F.; Cozannet, G.L.; et al. Concepts and Terminology for Sea Level: Mean, Variability and Change, Both Local and Global. Surv. Geophys. 2019, 40, 1251–1289. [Google Scholar] [CrossRef]
  6. Tebaldi, C.; Ranasinghe, R.; Vousdoukas, M.; Rasmussen, D.J.; Vega-Westhoff, B.; Kirezci, E.; Kopp, R.E.; Sriver, R.; Mentaschi, L. Extreme Sea Levels at Different Global Warming Levels. Nat. Clim. Change 2021, 11, 746–751. [Google Scholar] [CrossRef]
  7. Kirezci, E.; Young, I.R.; Ranasinghe, R.; Muis, S.; Nicholls, R.J.; Lincke, D.; Hinkel, J. Projections of Global-Scale Extreme Sea Levels and Resulting Episodic Coastal Flooding over the 21st Century. Sci. Rep. 2020, 10, 11629. [Google Scholar] [CrossRef]
  8. Vousdoukas, M.I.; Mentaschi, L.; Voukouvalas, E.; Verlaan, M.; Jevrejeva, S.; Jackson, L.P.; Feyen, L. Global Probabilistic Projections of Extreme Sea Levels Show Intensification of Coastal Flood Hazard. Nat. Commun. 2018, 9, 2360. [Google Scholar] [CrossRef]
  9. Du, S.; Wen, J. Challenges and Recommendations for Flood Risk Management in China Based on the 2020 Flood Season. Disaster Reduct. China 2020, 17, 12–15. [Google Scholar]
  10. Fang, J.; Liu, W.; Yang, S.; Brown, S.; Nicholls, R.J.; Hinkel, J.; Shi, X.; Shi, P. Spatial-Temporal Changes of Coastal and Marine Disasters Risks and Impacts in Mainland China. Ocean Coast. Manag. 2017, 139, 125–140. [Google Scholar] [CrossRef]
  11. Seto, K.C. Exploring the Dynamics of Migration to Mega-Delta Cities in Asia and Africa: Contemporary Drivers and Future Scenarios. Glob. Environ. Change 2011, 21, S94–S107. [Google Scholar] [CrossRef]
  12. Liu, J.; Wen, J.; Huang, Y.; Shi, M.; Meng, Q.; Ding, J.; Xu, H. Human Settlement and Regional Development in the Context of Climate Change: A Spatial Analysis of Low Elevation Coastal Zones in China. Mitig. Adapt. Strat. Glob. Change 2015, 20, 527–546. [Google Scholar] [CrossRef]
  13. Zhang, M.; Huang, X.; Chuai, X.; Yang, H.; Lai, L.; Tan, J. Impact of Land Use Type Conversion on Carbon Storage in Terrestrial Ecosystems of China: A Spatial-Temporal Perspective. Sci. Rep. 2015, 5, 10233. [Google Scholar] [CrossRef] [PubMed]
  14. Gong, W.; Duan, X.; Mao, M.; Hu, J.; Sun, Y.; Wu, G.; Zhang, Y.; Xie, Y.; Qiu, X.; Rao, X.; et al. Assessing the Impact of Land Use and Changes in Land Cover Related to Carbon Storage by Linking Trajectory Analysis and InVEST Models in the Nandu River Basin on Hainan Island in China. Front. Environ. Sci. 2022, 10, 1038752. [Google Scholar] [CrossRef]
  15. Liu, J.; Yan, Q.; Zhang, M. Ecosystem Carbon Storage Considering Combined Environmental and Land-Use Changes in the Future and Pathways to Carbon Neutrality in Developed Regions. Sci. Total Environ. 2023, 903, 166204. [Google Scholar] [CrossRef]
  16. Cao, M.; Tian, Y.; Wu, K.; Chen, M.; Chen, Y.; Hu, X.; Sun, Z.; Zuo, L.; Lin, J.; Luo, L.; et al. Future Land-Use Change and Its Impact on Terrestrial Ecosystem Carbon Pool Evolution along the Silk Road under SDG Scenarios. Sci. Bull. 2023, 68, 740–749. [Google Scholar] [CrossRef]
  17. Intergovernmental Panel on Climate Change. Land Use, Land-Use Change, and Forestry: A Special Report of the IPCC, 1st ed.; Cambridge University Press: Cambridge, UK, 2000; ISBN 978-0-521-80495-0. [Google Scholar]
  18. Pendleton, L.; Donato, D.C.; Murray, B.C.; Crooks, S.; Jenkins, W.A.; Sifleet, S.; Craft, C.; Fourqurean, J.W.; Kauffman, J.B.; Marbà, N.; et al. Estimating Global “Blue Carbon” Emissions from Conversion and Degradation of Vegetated Coastal Ecosystems. PLoS ONE 2012, 7, e43542. [Google Scholar] [CrossRef]
  19. Gong, W.; Duan, X.; Sun, Y.; Zhang, Y.; Ji, P.; Tong, X.; Qiu, Z.; Liu, T. Multi-Scenario Simulation of Land Use/Cover Change and Carbon Storage Assessment in Hainan Coastal Zone from Perspective of Free Trade Port Construction. J. Clean. Prod. 2023, 385, 135630. [Google Scholar] [CrossRef]
  20. Ren, D.; Cao, A.; Wang, F. Response and Multi-Scenario Prediction of Carbon Storage and Habitat Quality to Land Use in Liaoning Province, China. Sustainability 2023, 15, 4500. [Google Scholar] [CrossRef]
  21. Wei, P.; Zan, M. Changes of Land Coverage and the Impact on Vegetation Carbon Storage in Yili Region. J. Northwest For. Univ. 2020, 4, 158–166. [Google Scholar]
  22. Aslam, A.; Mahmood, A.; Ur-Rehman, H.; Li, C.; Liang, X.; Shao, J.; Negm, S.; Moustafa, M.; Aamer, M.; Hassan, M.U. Plant Adaptation to Flooding Stress under Changing Climate Conditions: Ongoing Breakthroughs and Future Challenges. Plants 2023, 12, 3824. [Google Scholar] [CrossRef]
  23. Xu, C.; Wong, V.N.L.; Reef, R.E. Effect of Inundation on Greenhouse Gas Emissions from Temperate Coastal Wetland Soils with Different Vegetation Types in Southern Australia. Sci. Total Environ. 2021, 763, 142949. [Google Scholar] [CrossRef] [PubMed]
  24. Craft, C. Freshwater Input Structures Soil Properties, Vertical Accretion, and Nutrient Accumulation of Georgia and U.S Tidal Marshes. Limnol. Oceanogr. 2007, 52, 1220–1230. [Google Scholar] [CrossRef]
  25. Lal, R.; Ahmadi, M.; Bajracharya, R.M. Erosional Impacts on Soil Properties and Corn Yield on Alfisols in Central Ohio. Land Degrad. Dev. 2000, 11, 575–585. [Google Scholar] [CrossRef]
  26. Mayora, G.; Devercelli, M.; Frau, D. Spatial Variability of Chromophoric Dissolved Organic Matter in a Large Floodplain River: Control Factors and Relations with Phytoplankton during a Low Water Period. Ecohydrology 2016, 9, 487–497. [Google Scholar] [CrossRef]
  27. Stagg, C.L.; Schoolmaster, D.R.; Krauss, K.W.; Cormier, N.; Conner, W.H. Causal Mechanisms of Soil Organic Matter Decomposition: Deconstructing Salinity and Flooding Impacts in Coastal Wetlands. Ecology 2017, 98, 2003–2018. [Google Scholar] [CrossRef]
  28. Manzoni, S.; Vico, G.; Katul, G.; Palmroth, S.; Jackson, R.B.; Porporato, A. Hydraulic Limits on Maximum Plant Transpiration and the Emergence of the Safety–Efficiency Trade-off. New Phytol. 2013, 198, 169–178. [Google Scholar] [CrossRef]
  29. Huxham, M.; Whitlock, D.; Githaiga, M.; Dencer-Brown, A. Carbon in the Coastal Seascape: How Interactions Between Mangrove Forests, Seagrass Meadows and Tidal Marshes Influence Carbon Storage. Curr. For. Rep. 2018, 4, 101–110. [Google Scholar] [CrossRef]
  30. Ouyang, X.; Lee, S.Y. Updated Estimates of Carbon Accumulation Rates in Coastal Marsh Sediments. Biogeosciences 2014, 11, 5057–5071. [Google Scholar] [CrossRef]
  31. Hinkel, J.; Lincke, D.; Vafeidis, A.T.; Perrette, M.; Nicholls, R.J.; Tol, R.S.J.; Marzeion, B.; Fettweis, X.; Ionescu, C.; Levermann, A. Coastal Flood Damage and Adaptation Costs under 21st Century Sea-Level Rise. Proc. Natl. Acad. Sci. USA 2014, 111, 3292–3297. [Google Scholar] [CrossRef]
  32. Jevrejeva, S.; Jackson, L.P.; Grinsted, A.; Lincke, D.; Marzeion, B. Flood Damage Costs under the Sea Level Rise with Warming of 1.5 °C and 2 °C. Environ. Res. Lett. 2018, 13, 074014. [Google Scholar] [CrossRef]
  33. Hallegatte, S.; Green, C.; Nicholls, R.J.; Corfee-Morlot, J. Future Flood Losses in Major Coastal Cities. Nat. Clim. Change 2013, 3, 802–806. [Google Scholar] [CrossRef]
  34. Kundzewicz, Z.W.; Kanae, S.; Seneviratne, S.I.; Handmer, J.; Nicholls, N.; Peduzzi, P.; Mechler, R.; Bouwer, L.M.; Arnell, N.; Mach, K.; et al. Flood Risk and Climate Change: Global and Regional Perspectives. Hydrol. Sci. J. 2014, 59, 1–28. [Google Scholar] [CrossRef]
  35. Narayan, S.; Beck, M.W.; Wilson, P.; Thomas, C.J.; Guerrero, A.; Shepard, C.C.; Reguero, B.G.; Franco, G.; Ingram, J.C.; Trespalacios, D. The Value of Coastal Wetlands for Flood Damage Reduction in the Northeastern USA. Sci. Rep. 2017, 7, 9463. [Google Scholar] [CrossRef] [PubMed]
  36. Costanza, R.; d’Arge, R.; De Groot, R.; Farber, S.; Grasso, M.; Hannon, B.; Limburg, K.; Naeem, S.; O’Neill, R.V.; Paruelo, J.; et al. The Value of the World’s Ecosystem Services and Natural Capital. Nature 1997, 387, 253–260. [Google Scholar] [CrossRef]
  37. Daily, G.C.; Söderqvist, T.; Aniyar, S.; Arrow, K.; Dasgupta, P.; Ehrlich, P.R.; Folke, C.; Jansson, A.; Jansson, B.-O.; Kautsky, N.; et al. The Value of Nature and the Nature of Value. Science 2000, 289, 395–396. [Google Scholar] [CrossRef]
  38. Jones, S.F.; Stagg, C.L.; Krauss, K.W.; Hester, M.W. Flooding Alters Plant-Mediated Carbon Cycling Independently of Elevated Atmospheric CO2 Concentrations. JGR Biogeosci. 2018, 123, 1976–1987. [Google Scholar] [CrossRef]
  39. Hill, T.D.; Anisfeld, S.C. Coastal Wetland Response to Sea Level Rise in Connecticut and New York. Estuar. Coast. Shelf Sci. 2015, 163, 185–193. [Google Scholar] [CrossRef]
  40. Middleton, B.A.; Boudell, J. Salinification of Coastal Wetlands and Freshwater Management to Support Resilience. Ecosyst. Health Sustain. 2023, 9, 0083. [Google Scholar] [CrossRef]
  41. Zhang, M.; Zhu, X.; Wang, Y.; Jiang, H.; Cui, L. A Numerical Study of Hydrodynamic Characteristics and Hydrological Processes in the Coastal Wetlands during Extreme Events. J. Hydrodyn. 2023, 35, 963–979. [Google Scholar] [CrossRef]
  42. Fant, C.; Gentile, L.E.; Herold, N.; Kunkle, H.; Kerrich, Z.; Neumann, J.; Martinich, J. Valuation of Long-Term Coastal Wetland Changes in the U.S. Ocean Coast. Manag. 2022, 226, 106248. [Google Scholar] [CrossRef]
  43. Villoslada, M.; Sipelgas, L.; Bergamo, T.F.; Ward, R.D.; Reintam, E.; Astover, A.; Kumpula, T.; Sepp, K. Multi-Source Remote Sensing Data Reveals Complex Topsoil Organic Carbon Dynamics in Coastal Wetlands. Ecol. Indic. 2022, 143, 109329. [Google Scholar] [CrossRef]
  44. Wang, G.; Guan, D.; Peart, M.R.; Chen, Y.; Peng, Y. Ecosystem Carbon Stocks of Mangrove Forest in Yingluo Bay, Guangdong Province of South China. For. Ecol. Manag. 2013, 310, 539–546. [Google Scholar] [CrossRef]
  45. Ren, W.; Tian, H.; Tao, B.; Chappelka, A.; Sun, G.; Lu, C.; Liu, M.; Chen, G.; Xu, X. Impacts of Tropospheric Ozone and Climate Change on Net Primary Productivity and Net Carbon Exchange of China’s Forest Ecosystems: Climate and O3 Impacts on Forest Carbon. Glob. Ecol. Biogeogr. 2011, 20, 391–406. [Google Scholar] [CrossRef]
  46. Li, Y.; Liu, Z.; Li, S.; Li, X. Multi-Scenario Simulation Analysis of Land Use and Carbon Storage Changes in Changchun City Based on FLUS and InVEST Model. Land 2022, 11, 647. [Google Scholar] [CrossRef]
  47. Deng, Z.; Ding, W.; Pu, X.; Lyu, Y.; Wang, Y. Spatial-temporal Distribution of Carbon Storage in Qilian Mountain National Park Based on InVEST Model. Bull. Soil Water Conserv. 2022, 42, 324–334+396. [Google Scholar] [CrossRef]
  48. Sui, Y.; Sun, D.; Li, S.; Xu, Y.; Wu, J. Study of coastal zone ecosystem restoration in the context of carbon storage change: A case of Dongying City. Acta Ecol. Sin. 2021, 41, 8112–8123. [Google Scholar]
  49. Zhu, G.; Qiu, D.; Zhang, Z.; Sang, L.; Liu, Y.; Wang, L.; Zhao, K.; Ma, H.; Xu, Y.; Wan, Q. Land-Use Changes Lead to a Decrease in Carbon Storage in Arid Region, China. Ecol. Indic. 2021, 127, 107770. [Google Scholar] [CrossRef]
  50. Beillouin, D.; Demenois, J.; Cardinael, R.; Berre, D.; Corbeels, M.; Fallot, A.; Boyer, A.; Feder, F. A Global Database of Land Management, Land-Use Change and Climate Change Effects on Soil Organic Carbon. Sci. Data 2022, 9, 228. [Google Scholar] [CrossRef]
  51. Ersoy Mirici, M.; Berberoglu, S. Terrestrial Carbon Dynamics and Economic Valuation of Ecosystem Service for Land Use Management in the Mediterranean Region. Ecol. Inform. 2024, 81, 102570. [Google Scholar] [CrossRef]
  52. Chun, J.; Kim, C.-K.; Kang, W.; Park, H.; Kim, G.; Lee, W.-K. Sustainable Management of Carbon Sequestration Service in Areas with High Development Pressure: Considering Land Use Changes and Carbon Costs. Sustainability 2019, 11, 5116. [Google Scholar] [CrossRef]
  53. Maanan, M.; Maanan, M.; Karim, M.; Ait Kacem, H.; Ajrhough, S.; Rueff, H. Snoussi Rhinane Modelling the Potential Impacts of Land Use/Cover Change on Terrestrial Carbon Stocks in North-West Morocco. Int. J. Sustain. Dev. World Ecol. 2019, 26, 560–570. [Google Scholar] [CrossRef]
  54. Melaku Canu, D.; Ghermandi, A.; Nunes, P.A.L.D.; Lazzari, P.; Cossarini, G.; Solidoro, C. Estimating the Value of Carbon Sequestration Ecosystem Services in the Mediterranean Sea: An Ecological Economics Approach. Glob. Environ. Change 2015, 32, 87–95. [Google Scholar] [CrossRef]
  55. NASA EOSDIS Land Processes Distributed Active Archive Center. Available online: https://lpdaac.usgs.gov/products/nasadem_hgtv001/ (accessed on 18 December 2023).
  56. Muis, S.; Aerts, J.C.J.H.; Antolínez, J.A.Á.; Dullaart, J.C.; Duong, T.M.; Erikson, L.; Haarsma, R.J.; Apecechea, M.I.; Mengel, M.; Le Bars, D.; et al. Global Projections of Storm Surges Using High-Resolution CMIP6 Climate Models. Earth’s Future 2023, 11, e2023EF003479. [Google Scholar] [CrossRef]
  57. Muis, S.; Verlaan, M.; Winsemius, H.C.; Aerts, J.C.J.H.; Ward, P.J. A Global Reanalysis of Storm Surges and Extreme Sea Levels. Nat. Commun. 2016, 7, 11969. [Google Scholar] [CrossRef]
  58. Muis, S.; Apecechea, M.I.; Dullaart, J.; De Lima Rego, J.; Madsen, K.S.; Su, J.; Yan, K.; Verlaan, M. A High-Resolution Global Dataset of Extreme Sea Levels, Tides, and Storm Surges, Including Future Projections. Front. Mar. Sci. 2020, 7, 263. [Google Scholar] [CrossRef]
  59. Zhang, T.; Cheng, C.; Wu, X. Mapping the Spatial Heterogeneity of Global Land Use and Land Cover from 2020 to 2100 at a 1 km Resolution. Sci. Data 2023, 10, 748. [Google Scholar] [CrossRef]
  60. Kopp, R.E.; Garner, G.G.; Hermans, T.H.J.; Jha, S.; Kumar, P.; Reedy, A.; Slangen, A.B.A.; Turilli, M.; Edwards, T.L.; Gregory, J.M.; et al. The Framework for Assessing Changes To Sea-Level (FACTS) v1.0: A Platform for Characterizing Parametric and Structural Uncertainty in Future Global, Relative, and Extreme Sea-Level Change. Geosci. Model Dev. 2023, 16, 7461–7489. [Google Scholar] [CrossRef]
  61. Zenodo. Available online: https://zenodo.org/records/6382554 (accessed on 9 August 2021).
  62. Hengl, T.; Mendes De Jesus, J.; Heuvelink, G.B.M.; Ruiperez Gonzalez, M.; Kilibarda, M.; Blagotić, A.; Wei, S.; Wright, M.N.; Geng, X.; Bauer-Marschallinger, B.; et al. SoilGrids250m: Global Gridded Soil Information Based on Machine Learning. PLoS ONE 2017, 12, e0169748. [Google Scholar] [CrossRef]
  63. Spawn, S.A.; Sullivan, C.C.; Lark, T.J.; Gibbs, H.K. Harmonized global maps of above and belowground biomass carbon density in the year 2010. Sci. Data 2020, 7, 112. [Google Scholar] [CrossRef]
  64. Yang, P.; Yao, Y.-F.; Mi, Z.; Cao, Y.-F.; Liao, H.; Yu, B.-Y.; Liang, Q.-M.; Coffman, D.; Wei, Y.-M. Social Cost of Carbon under Shared Socioeconomic Pathways. Glob. Environ. Chang. 2018, 53, 225–232. [Google Scholar] [CrossRef]
  65. Schmid, K. Mapping and Portraying Inundation Uncertainty of Bathtub-Type Models. J. Coast. Res. 2013, 30, 548. [Google Scholar] [CrossRef]
  66. Gallien, T.W.; Schubert, J.E.; Sanders, B.F. Predicting Tidal Flooding of Urbanized Embayments: A Modeling Framework and Data Requirements. Coast. Eng. 2011, 58, 567–577. [Google Scholar] [CrossRef]
  67. Didier, D.; Baudry, J.; Bernatchez, P.; Dumont, D.; Sadegh, M.; Bismuth, E.; Bandet, M.; Dugas, S.; Sévigny, C. Multihazard Simulation for Coastal Flood Mapping: Bathtub versus Numerical Modelling in an Open Estuary, Eastern Canada. J. Flood Risk Manag. 2019, 12, e12505. [Google Scholar] [CrossRef]
  68. Seenath, A.; Wilson, M.; Miller, K. Hydrodynamic versus GIS Modelling for Coastal Flood Vulnerability Assessment: Which Is Better for Guiding Coastal Management? Ocean Coast. Manag. 2016, 120, 99–109. [Google Scholar] [CrossRef]
  69. Tobler, W. On the First Law of Geography: A Reply. Ann. Assoc. Am. Geogr. 2004, 94, 304–310. [Google Scholar] [CrossRef]
  70. Angelats, E.; Soriano-González, J.; Fernández-Tejedor, M.; Alcaraz, C. Combined Flooding and Water Quality Monitoring During Short Extreme Events Using Sentinel 2: The Case Study of Gloria Storm in Ebro Delta. ISPRS Ann. Photogramm. Remote Sens. Spat. Inf. Sci. 2022, V-3–2022, 361–368. [Google Scholar] [CrossRef]
  71. Santhanam, H.; Natarajan, T. Short-Term Desalination of Pulicat Lagoon (Southeast India) Due to the 2015 Extreme Flood Event: Insights from Land-Ocean Interactions in Coastal Zone (LOICZ) Models. Ecol. Process. 2018, 7, 10. [Google Scholar] [CrossRef]
  72. Anthoff, D.; Tol, R.S.J. The Uncertainty about the Social Cost of Carbon: A Decomposition Analysis Using Fund. Clim. Chang. 2013, 117, 515–530. [Google Scholar] [CrossRef]
  73. Guivarch, C.; Pottier, A. Climate Damage on Production or on Growth: What Impact on the Social Cost of Carbon? Environ. Model. Assess. 2018, 23, 117–130. [Google Scholar] [CrossRef]
  74. Tian, L.; Ye, Q.; Zhen, Z. A New Assessment Model of Social Cost of Carbon and Its Situation Analysis in China. J. Clean. Prod. 2019, 211, 1434–1443. [Google Scholar] [CrossRef]
  75. Boumis, G.; Moftakhari, H.R.; Moradkhani, H. Coevolution of Extreme Sea Levels and Sea-Level Rise Under Global Warming. Earth’s Future 2023, 11, e2023EF003649. [Google Scholar] [CrossRef]
  76. Keith, H.; Lindenmayer, D.B.; Mackey, B.G.; Blair, D.; Carter, L.; McBurney, L.; Okada, S.; Konishi-Nagano, T. Accounting for Biomass Carbon Stock Change Due to Wildfire in Temperate Forest Landscapes in Australia. PLoS ONE 2014, 9, e107126. [Google Scholar] [CrossRef] [PubMed]
  77. Ambinakudige, S.; Khanal, S. Assessment of Impacts of Hurricane Katrina on Net Primary Productivity in Mississippi. Earth Interact. 2010, 14, 1–12. [Google Scholar] [CrossRef]
  78. Sangha, K.K.; Russell-Smith, J.; Evans, J.; Edwards, A. Methodological Approaches and Challenges to Assess the Environmental Losses from Natural Disasters. Int. J. Disaster Risk Reduct. 2020, 49, 101619. [Google Scholar] [CrossRef]
  79. Tang, X.; Zhao, X.; Bai, Y.; Tang, Z.; Wang, W.; Zhao, Y.; Wan, H.; Xie, Z.; Shi, X.; Wu, B.; et al. Carbon Pools in China’s Terrestrial Ecosystems: New Estimates Based on an Intensive Field Survey. Proc. Natl. Acad. Sci. USA 2018, 115, 4021–4026. [Google Scholar] [CrossRef]
  80. Yunus, A.; Avtar, R.; Kraines, S.; Yamamuro, M.; Lindberg, F.; Grimmond, C. Uncertainties in Tidally Adjusted Estimates of Sea Level Rise Flooding (Bathtub Model) for the Greater London. Remote Sens. 2016, 8, 366. [Google Scholar] [CrossRef]
  81. Williams, L.L.; Lück-Vogel, M. Comparative Assessment of the GIS Based Bathtub Model and an Enhanced Bathtub Model for Coastal Inundation. J. Coast. Conserv. 2020, 24, 23. [Google Scholar] [CrossRef]
  82. Makris, C.; Mallios, Z.; Androulidakis, Y.; Krestenitis, Y. CoastFLOOD: A High-Resolution Model for the Simulation of Coastal Inundation Due to Storm Surges. Hydrology 2023, 10, 103. [Google Scholar] [CrossRef]
Figure 1. Research Framework.
Land 13 01871 g001
Figure 2. Study area.
Land 13 01871 g002
Figure 3. Schematic diagram of inundation simulation zoning.
Land 13 01871 g003
Figure 4. Land use/land cover (LULC) conversion in 2020 and 2050 under different SSP-RCP scenarios: (a) SSP1-26; (b) SSP2-45; (c) SSP3-70; (d) SSP5-85.
Land 13 01871 g004
Figure 5. Distribution and changes in carbon storage (CS): (a) distribution of CS in 2020; (b) total CS in 2020 and 2050 for SSP-RCPs (Tg); (c) distribution of changes in CS in 2050.
Land 13 01871 g005
Figure 6. (a) Extreme sea-level (ESL) distribution on shoreline, and (b) regional average ESL.
Land 13 01871 g006
Figure 7. Land-use/land-cover types within inundated areas: (a1) 10-year flood (RP10) in 2020; (a2) 100-year (RP100) flood in 2020; (b1) RP10 flood in 2050 under SSP1-26; (b2) RP100 flood in 2050 under SSP1-26; (c1) RP10 flood in 2050 under SSP2-45; (c2) RP100 flood in 2050 under SSP2-45; (d1) RP10 flood in 2050 under SSP3-70; (d2) RP100 flood in 2050 under SSP3-70; (e1) RP10 flood in 2050 under SSP5-85; (e2) RP100 flood in 2050 under SSP5-85.
Land 13 01871 g007
Figure 8. Land-use/land-cover (LULC) conversion in inundated regions: (a1d1) denote the LULC inundated by the coastal flood of RP10 in 2050 under scenarios SSP1-25, SSP2-45, SSP3-70, and SSP5-85, respectively; (a2d2) represent the individual flooding-inundation scenarios for the RP100.
Land 13 01871 g008
Figure 9. Carbon storage loss of different regions (Tg): (a1) 10-year flood (RP10) in 2020; (a2) 100-year (RP100) flood in 2020; (b1) RP10 flood in 2050 under SSP1-26; (b2) RP100 flood in 2050 under SSP1-26; (c1) RP10 flood in 2050 under SSP2-45; (c2) RP100 flood in 2050 under SSP2-45; (d1) RP10 flood in 2050 under SSP3-70; (d2) RP100 flood in 2050 under SSP3-70; (e1) RP10 flood in 2050 under SSP5-85; (e2) RP100 flood in 2050 under SSP5-85.
Land 13 01871 g009
Figure 10. Change in CSL per 10 km, 2020 and 2050 (t).
Land 13 01871 g010
Figure 11. Values of carbon storage loss in different regions (M$): (a1) 10-year flood (RP10) in 2020; (a2) 100-year (RP100) flood in 2020; (b1) RP10 flood in 2050 under SSP1-26; (b2) RP100 flood in 2050 under SSP1-26; (c1) RP10 flood in 2050 under SSP2-45; (c2) RP100 flood in 2050 under SSP2-45; (d1) RP10 flood in 2050 under SSP3-70; (d2) RP100 flood in 2050 under SSP3-70; (e1) RP10 flood in 2050 under SSP5-85; (e2) RP100 flood in 2050 under SSP5-85.
Land 13 01871 g011
Table 1. Median global SLR projections for 2050 (m).
SSP1SSP2SSP3SSP5
0.180.190.200.23
Table 2. Social cost of carbon (SCC) in 2020 and 2050 across SSP scenarios (in 2005, USD).
20202050
SSP1SSP2SSP3SSP5
18.4636.9264.62109.9254.96
Table 3. Statistics after extreme sea-level (ESL) data interpolation (m).
ESL Return PeriodsMinMaxMeanStd
101.053.671.950.56
1001.324.182.330.63
Table 4. Carbon density of various climate zone (t/ha).
LULC_NameLucodeMiddle Temperate ZoneSouth Temperate ZoneNorth Subtropical ZoneMiddle Subtropical ZoneSouth Subtropical ZoneNorth Tropical ZoneMiddle Tropical Zone
Cropland192.4864.48100.61293.63178.62192.23148.90
Forest2331.27176.24426.95453.57381.32458.42481.21
Grassland3101.52113.55189.41353.86251.61217.72198.20
Construction land453.2743.6848.57102.7271.54129.8599.44
Barren546.8761.6941.00149.74155.4471.76137.00
Water636.6726.1542.05115.7080.00109.46108.84
Disclaimer/Publisher’s Note: The statements, opinions and data contained in all publications are solely those of the individual author(s) and contributor(s) and not of MDPI and/or the editor(s). MDPI and/or the editor(s) disclaim responsibility for any injury to people or property resulting from any ideas, methods, instructions or products referred to in the content.