
Land Use Characteristics of Commuter Rail Station Areas and Their Impact on Station Ridership: A Case Study of Japan Railways in the Tokyo Metropolitan Area
Abstract
:1. Introduction
2. Literature Review
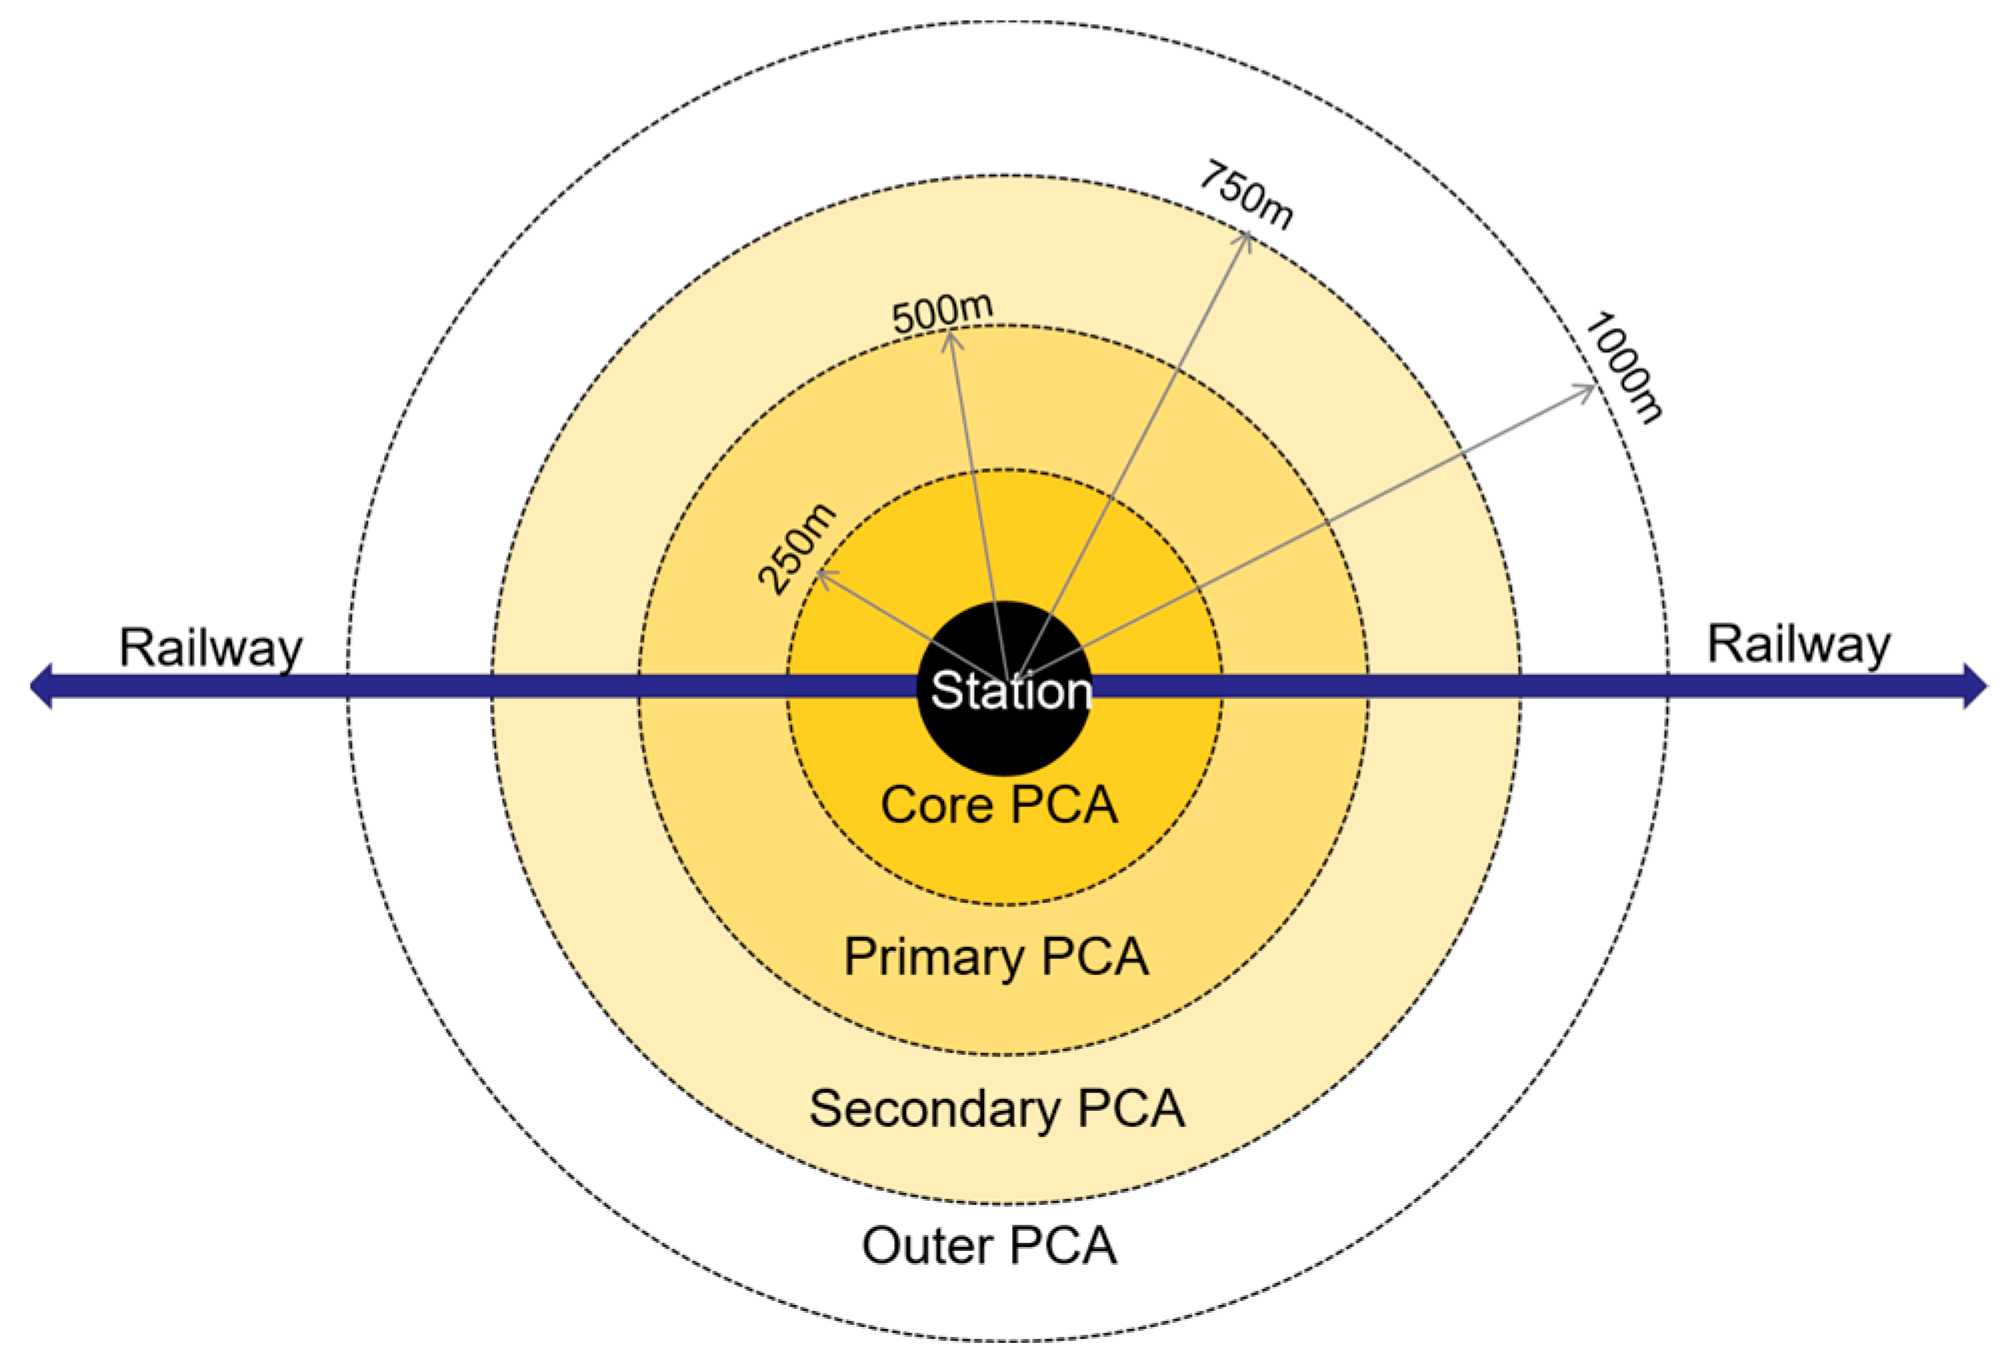
2.1. Space Scope of TOD
2.2. Land Use Characteristics and Station Attributes Influencing Transit Ridership
2.3. Methods for Exploring the Relationship Between the Land Use Characteristics and Transit Ridership
2.4. Rail Transit Ridership and Land Use in Japan
3. Materials and Methods
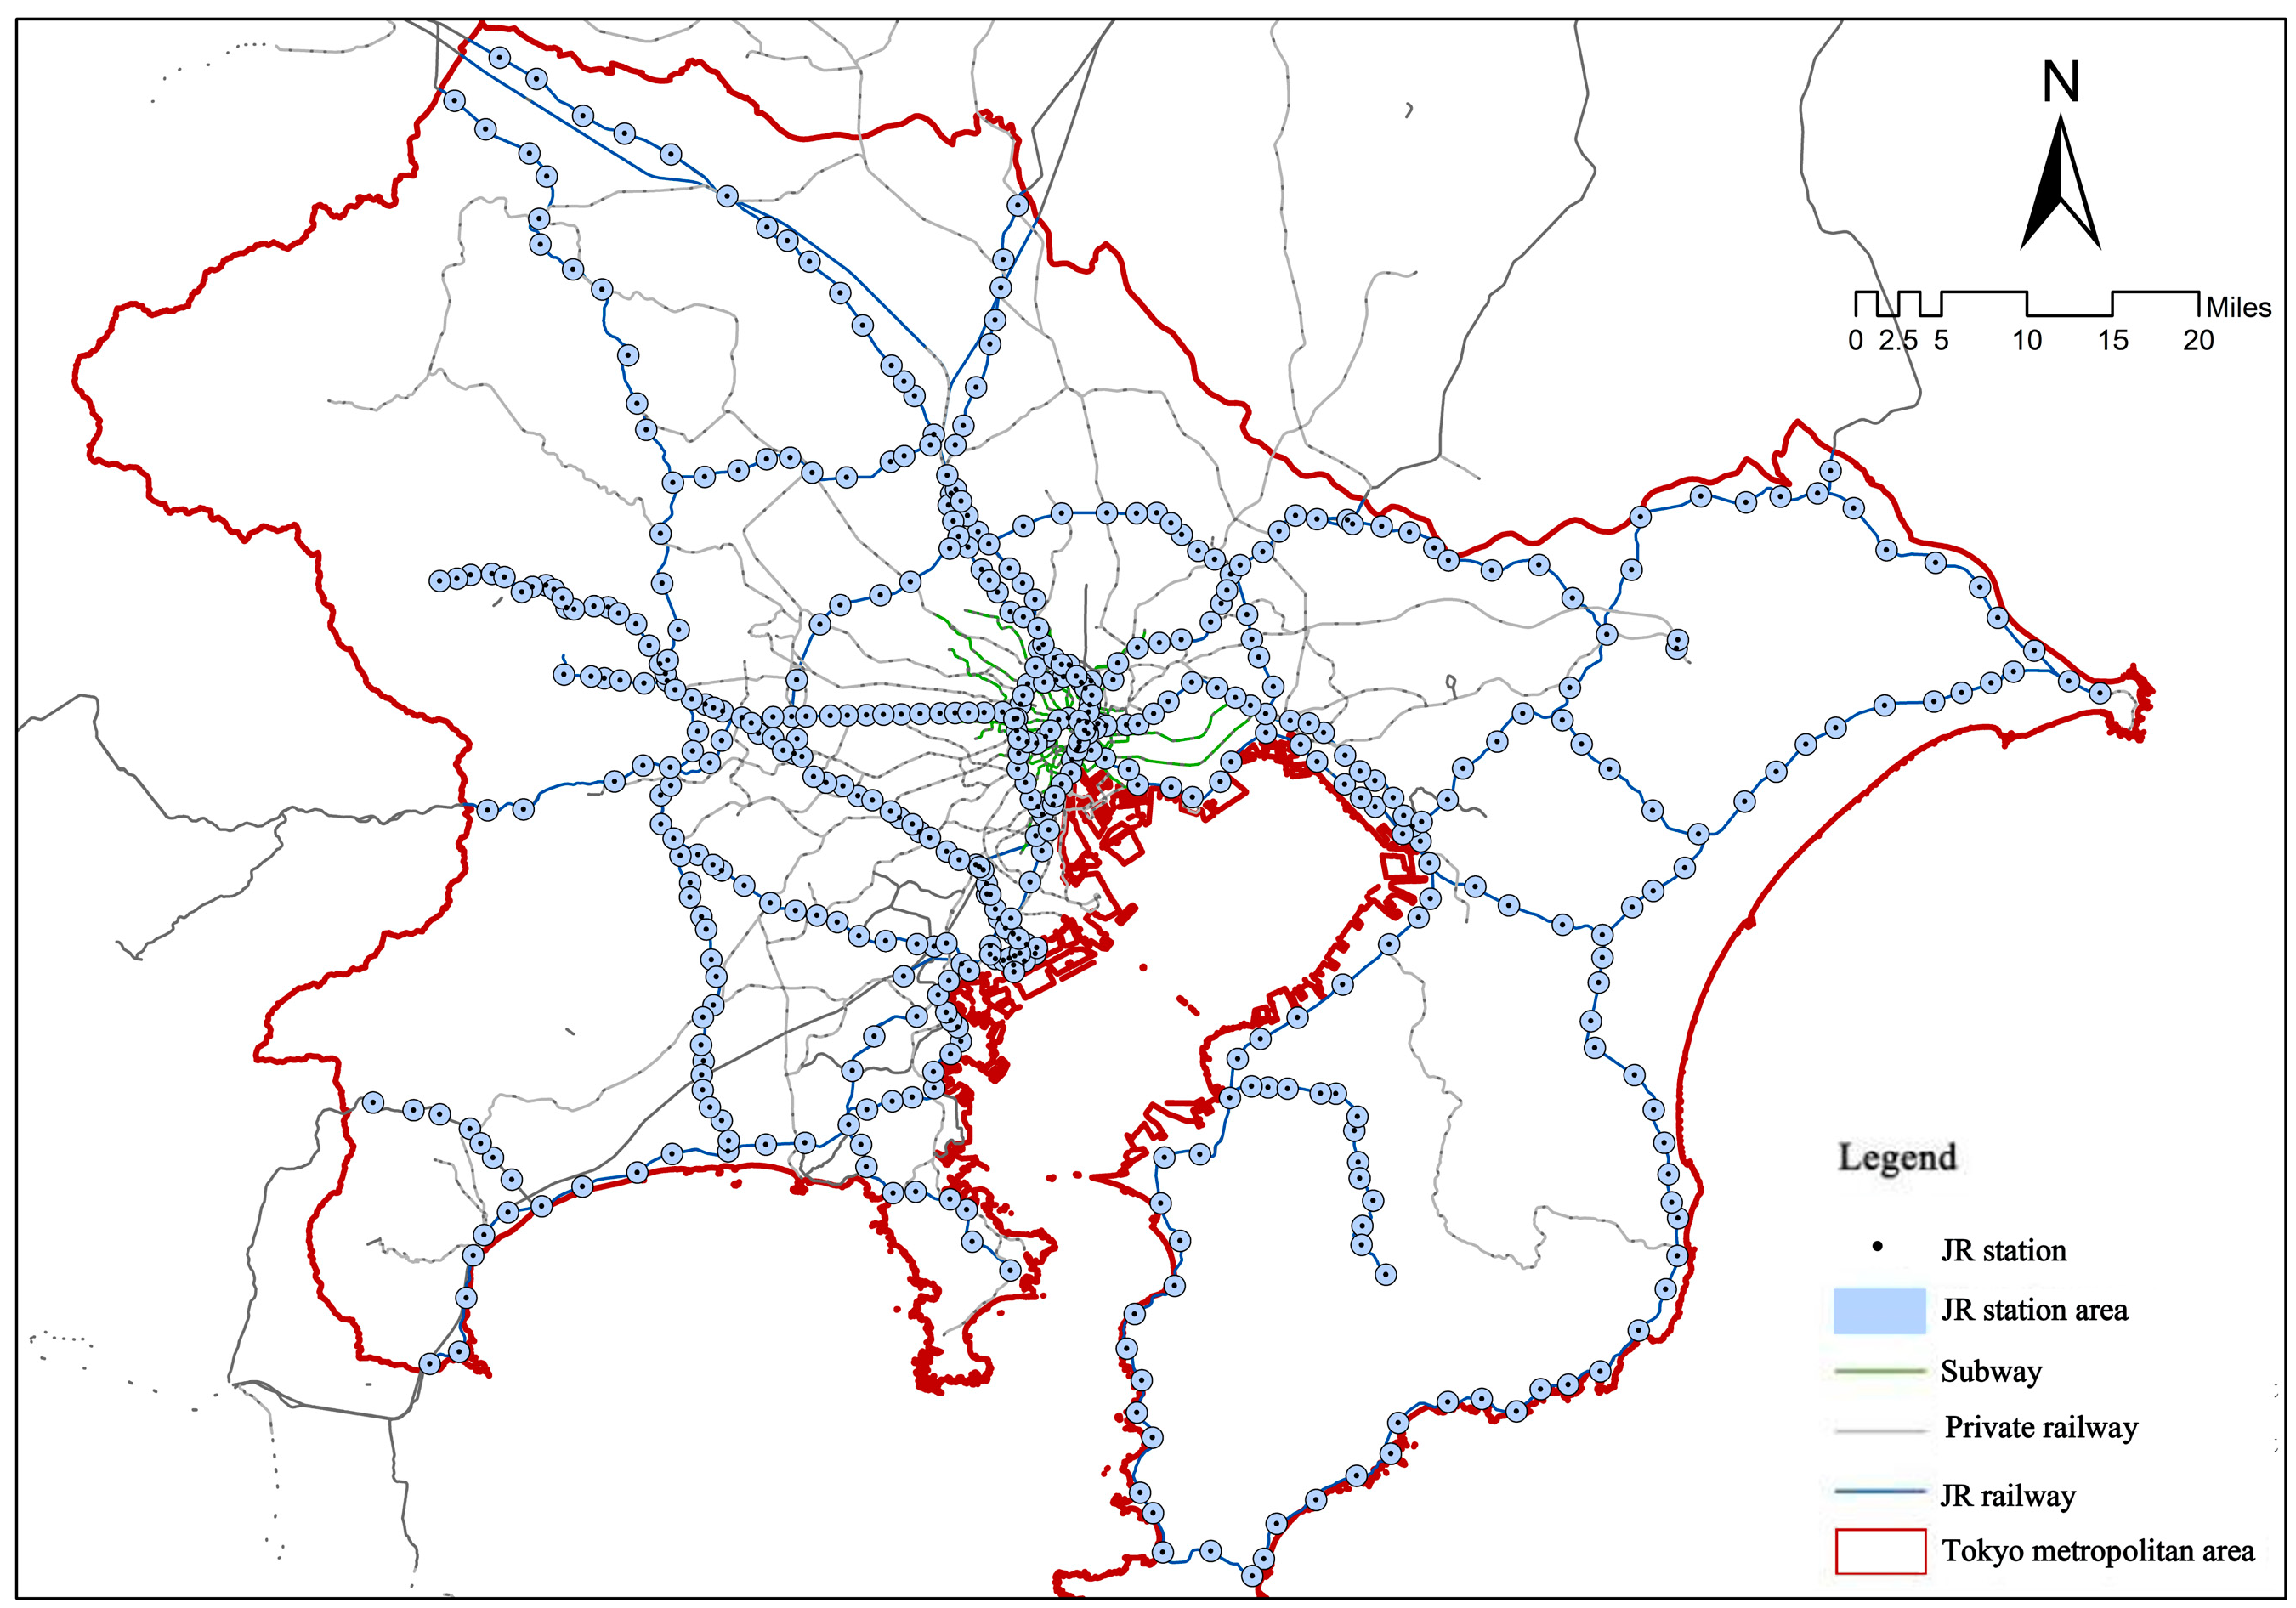
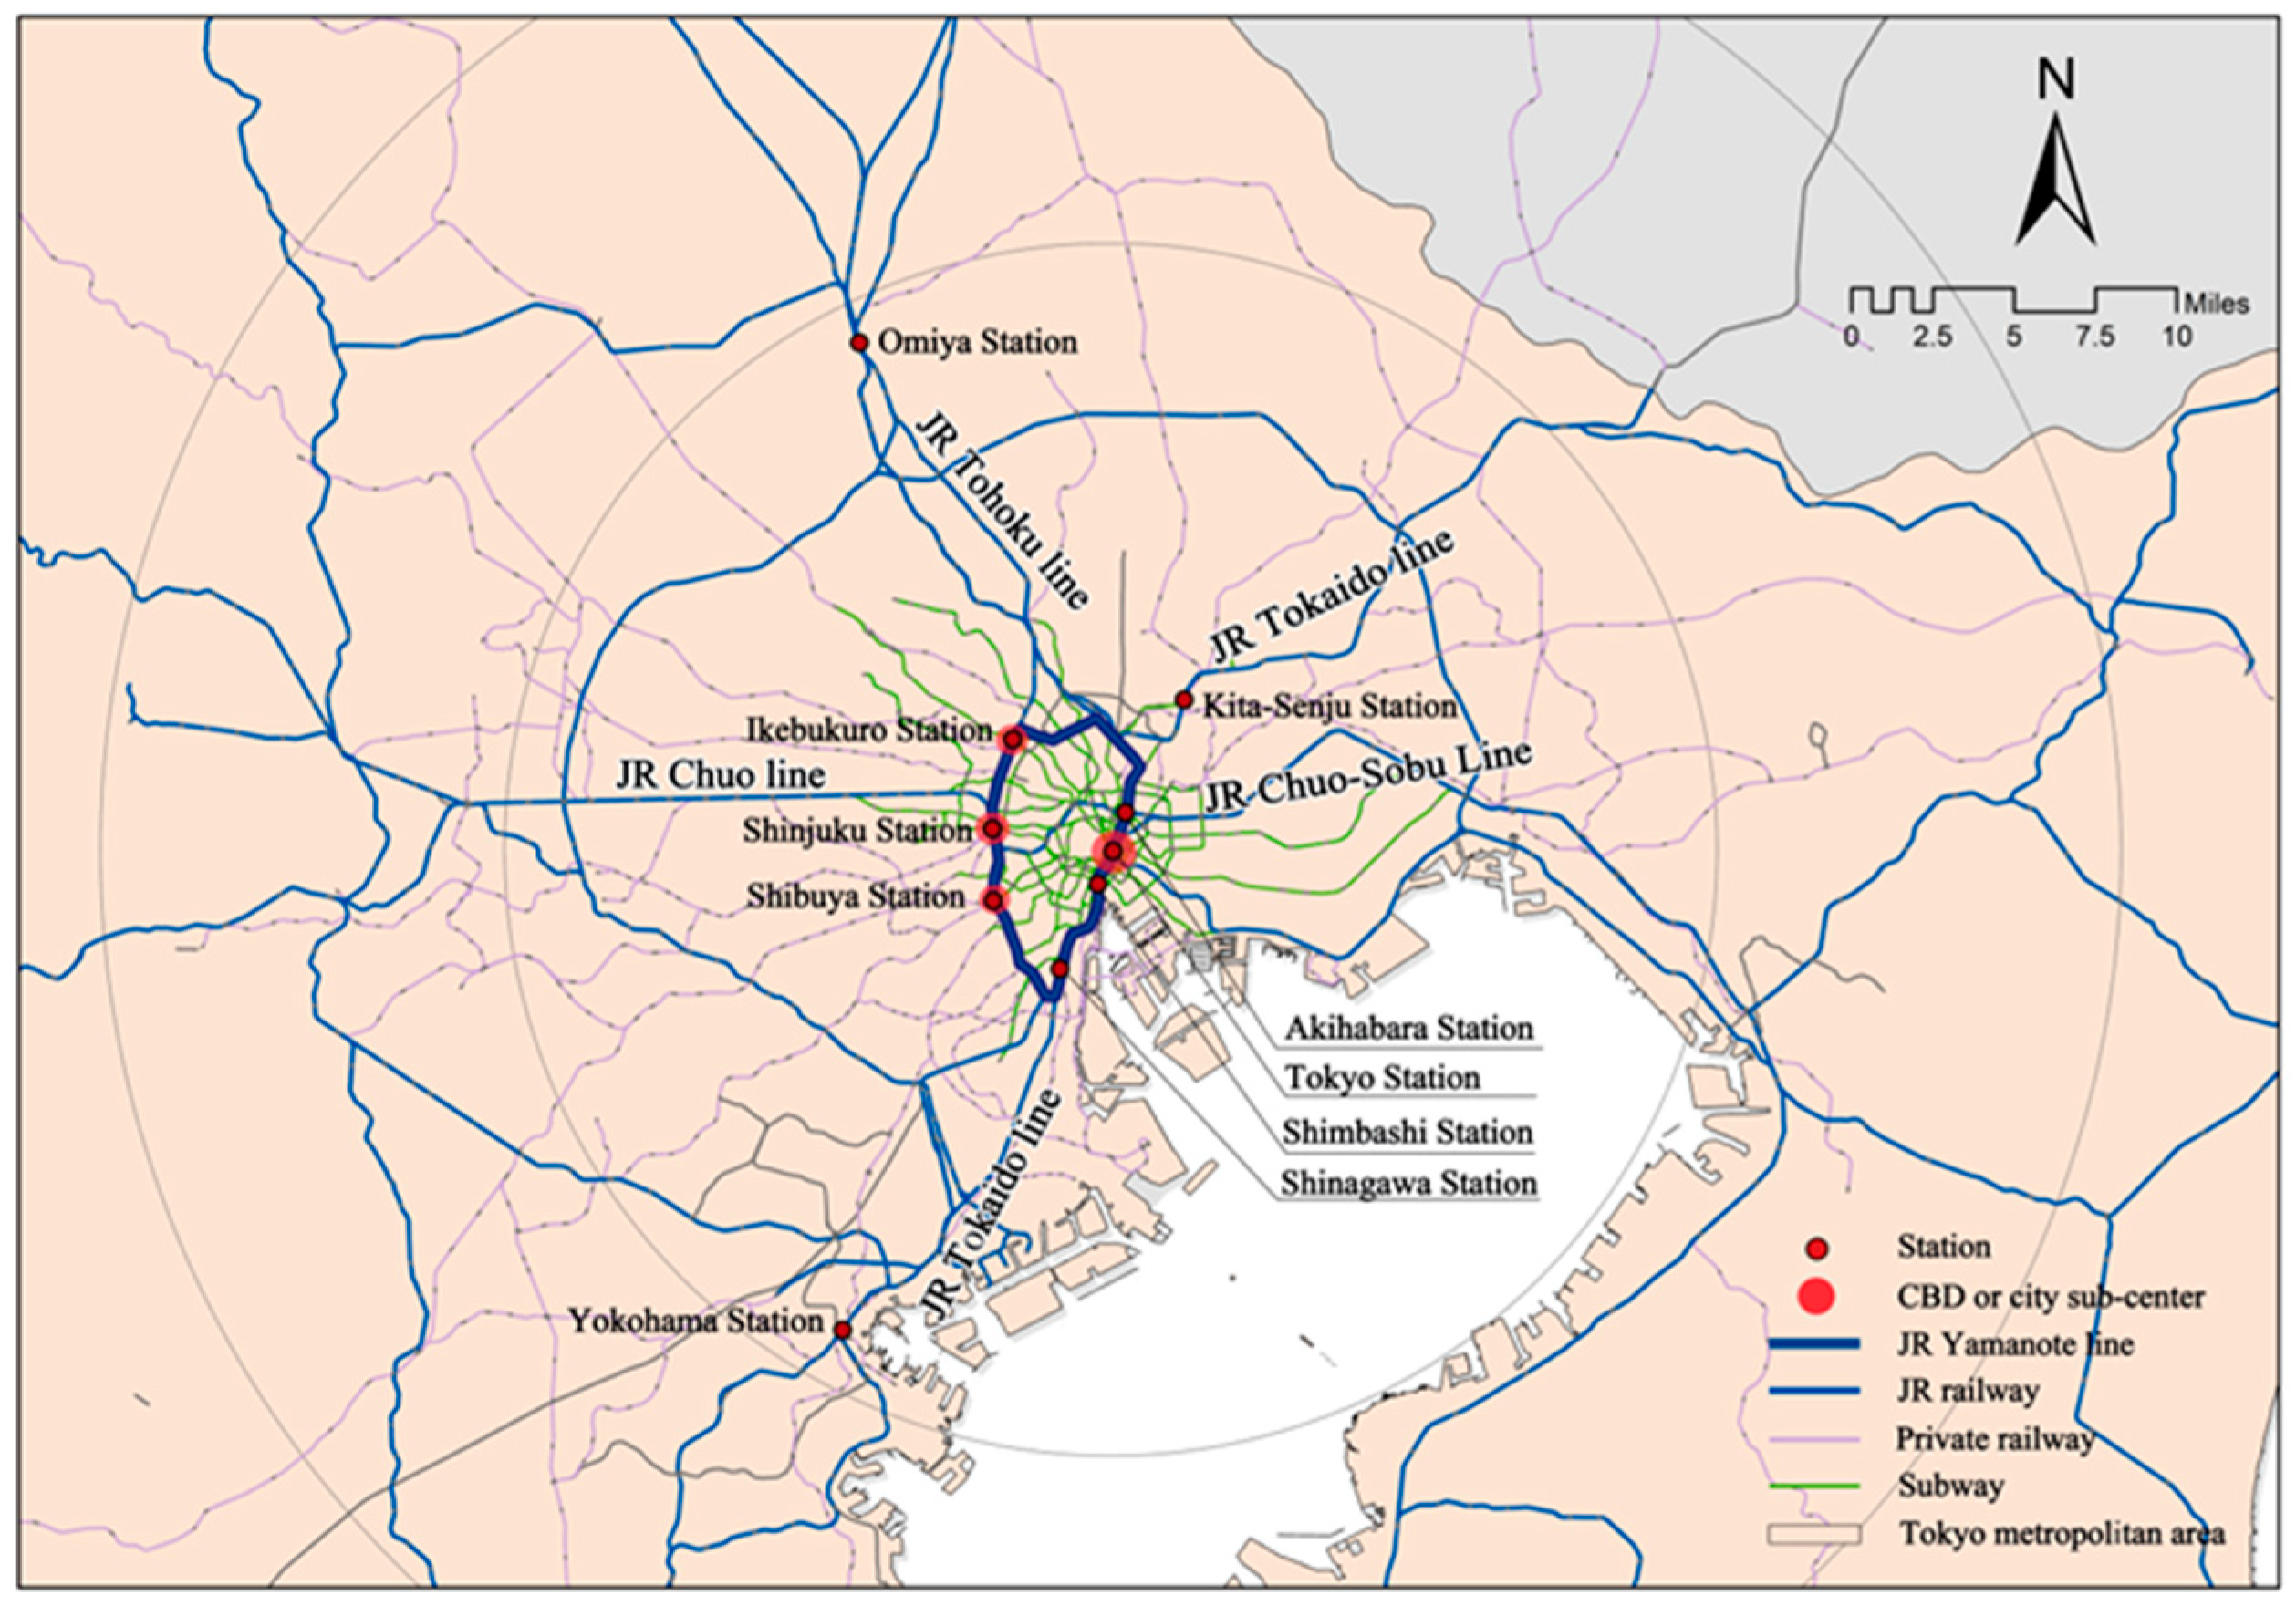
3.1. Study Area
3.2. Data and Variables
3.2.1. Density
3.2.2. Design
3.2.3. Diversity
3.2.4. Station Location Attributes and Socio-Economic Indicators
3.3. Methods
3.3.1. Multinomial Logit
3.3.2. Multiple Linear Regression and MGWR
4. Results and Discussion
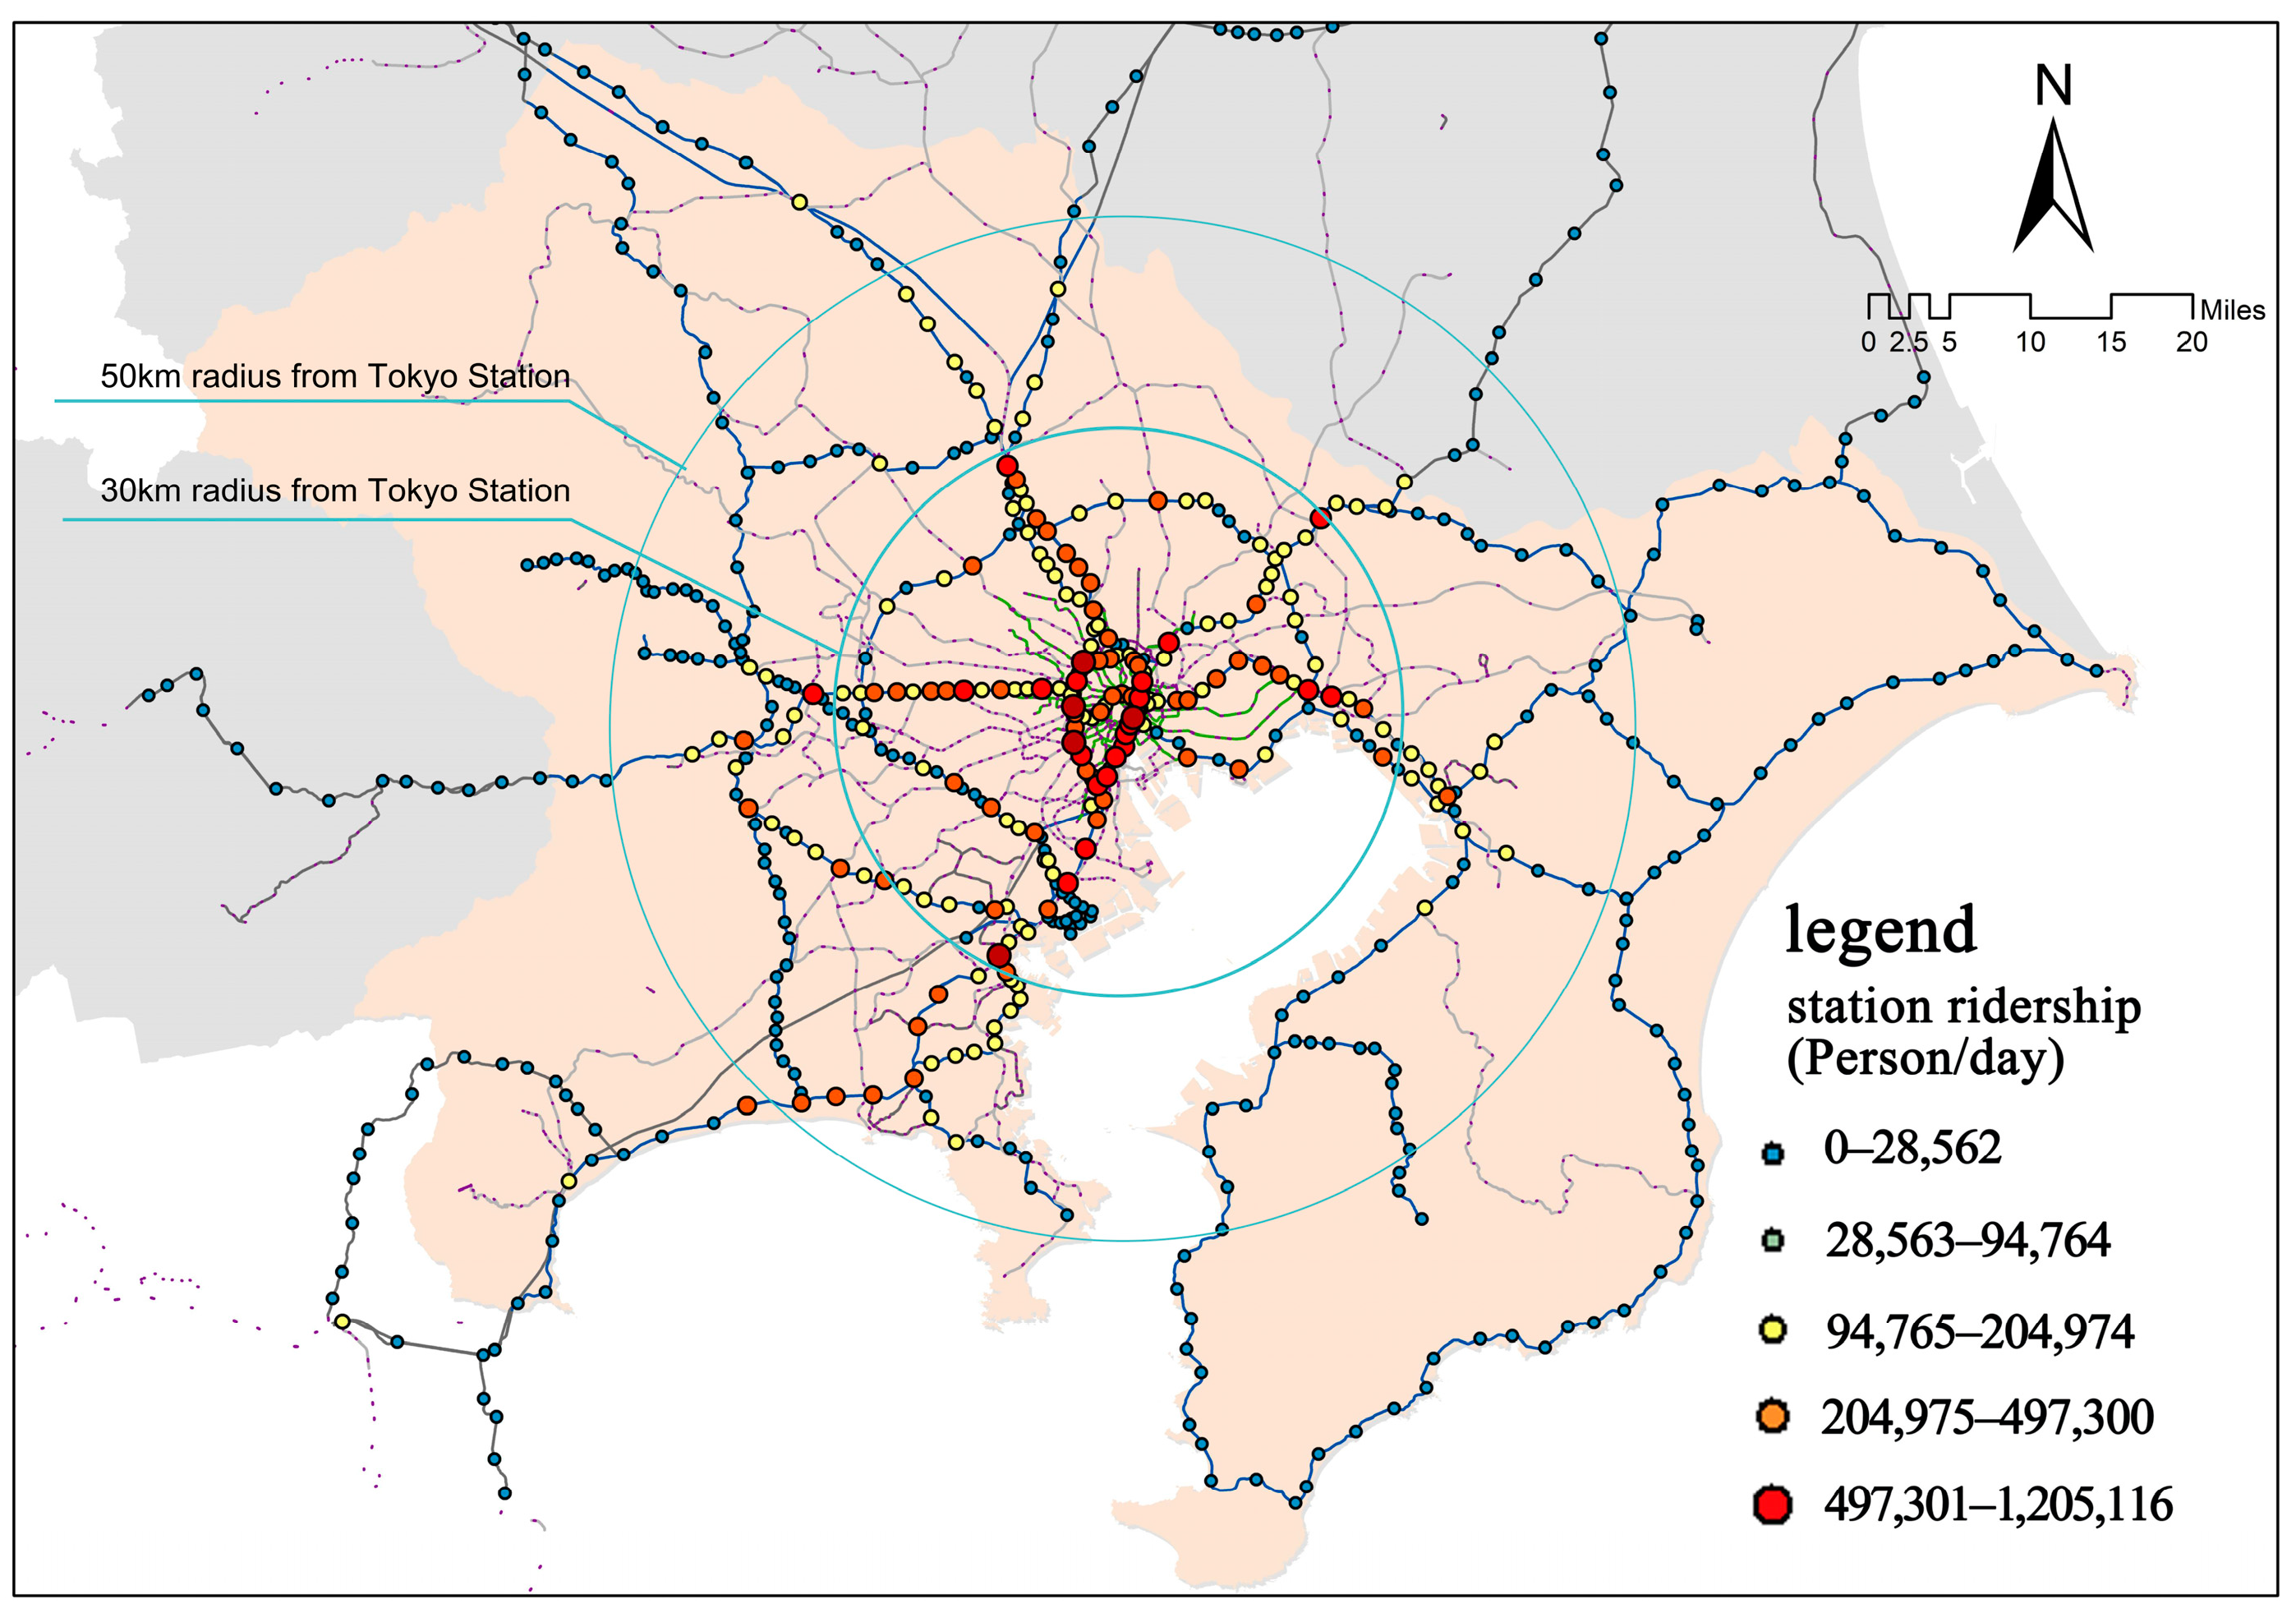
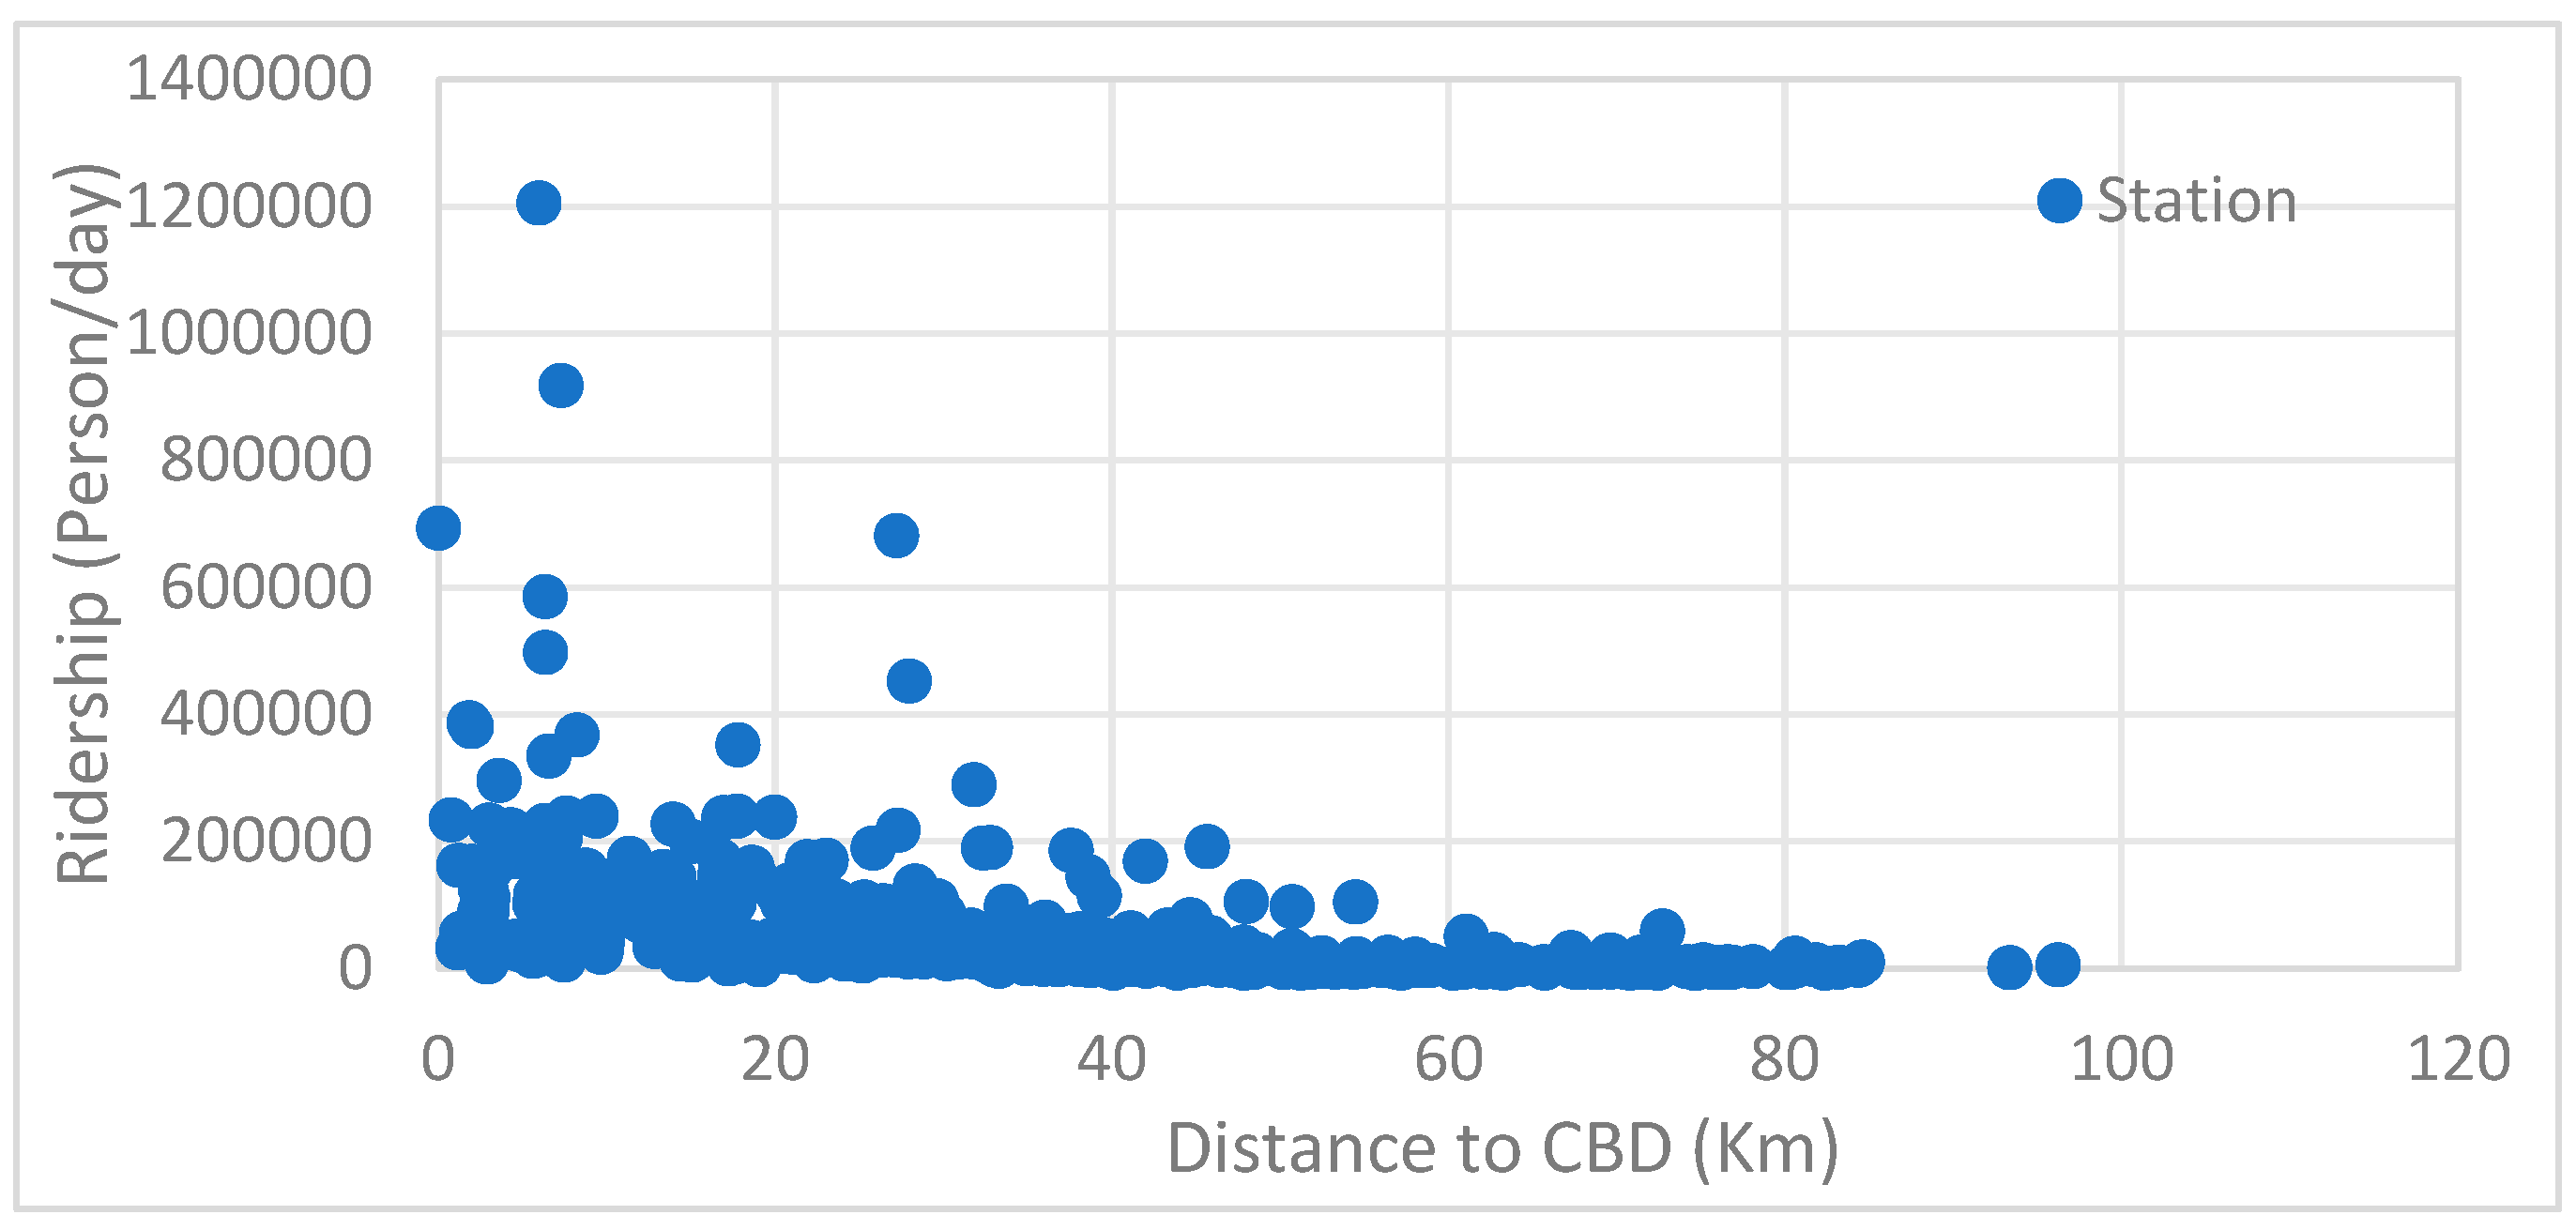
4.1. Distribution Characteristics of Station Passenger Flow
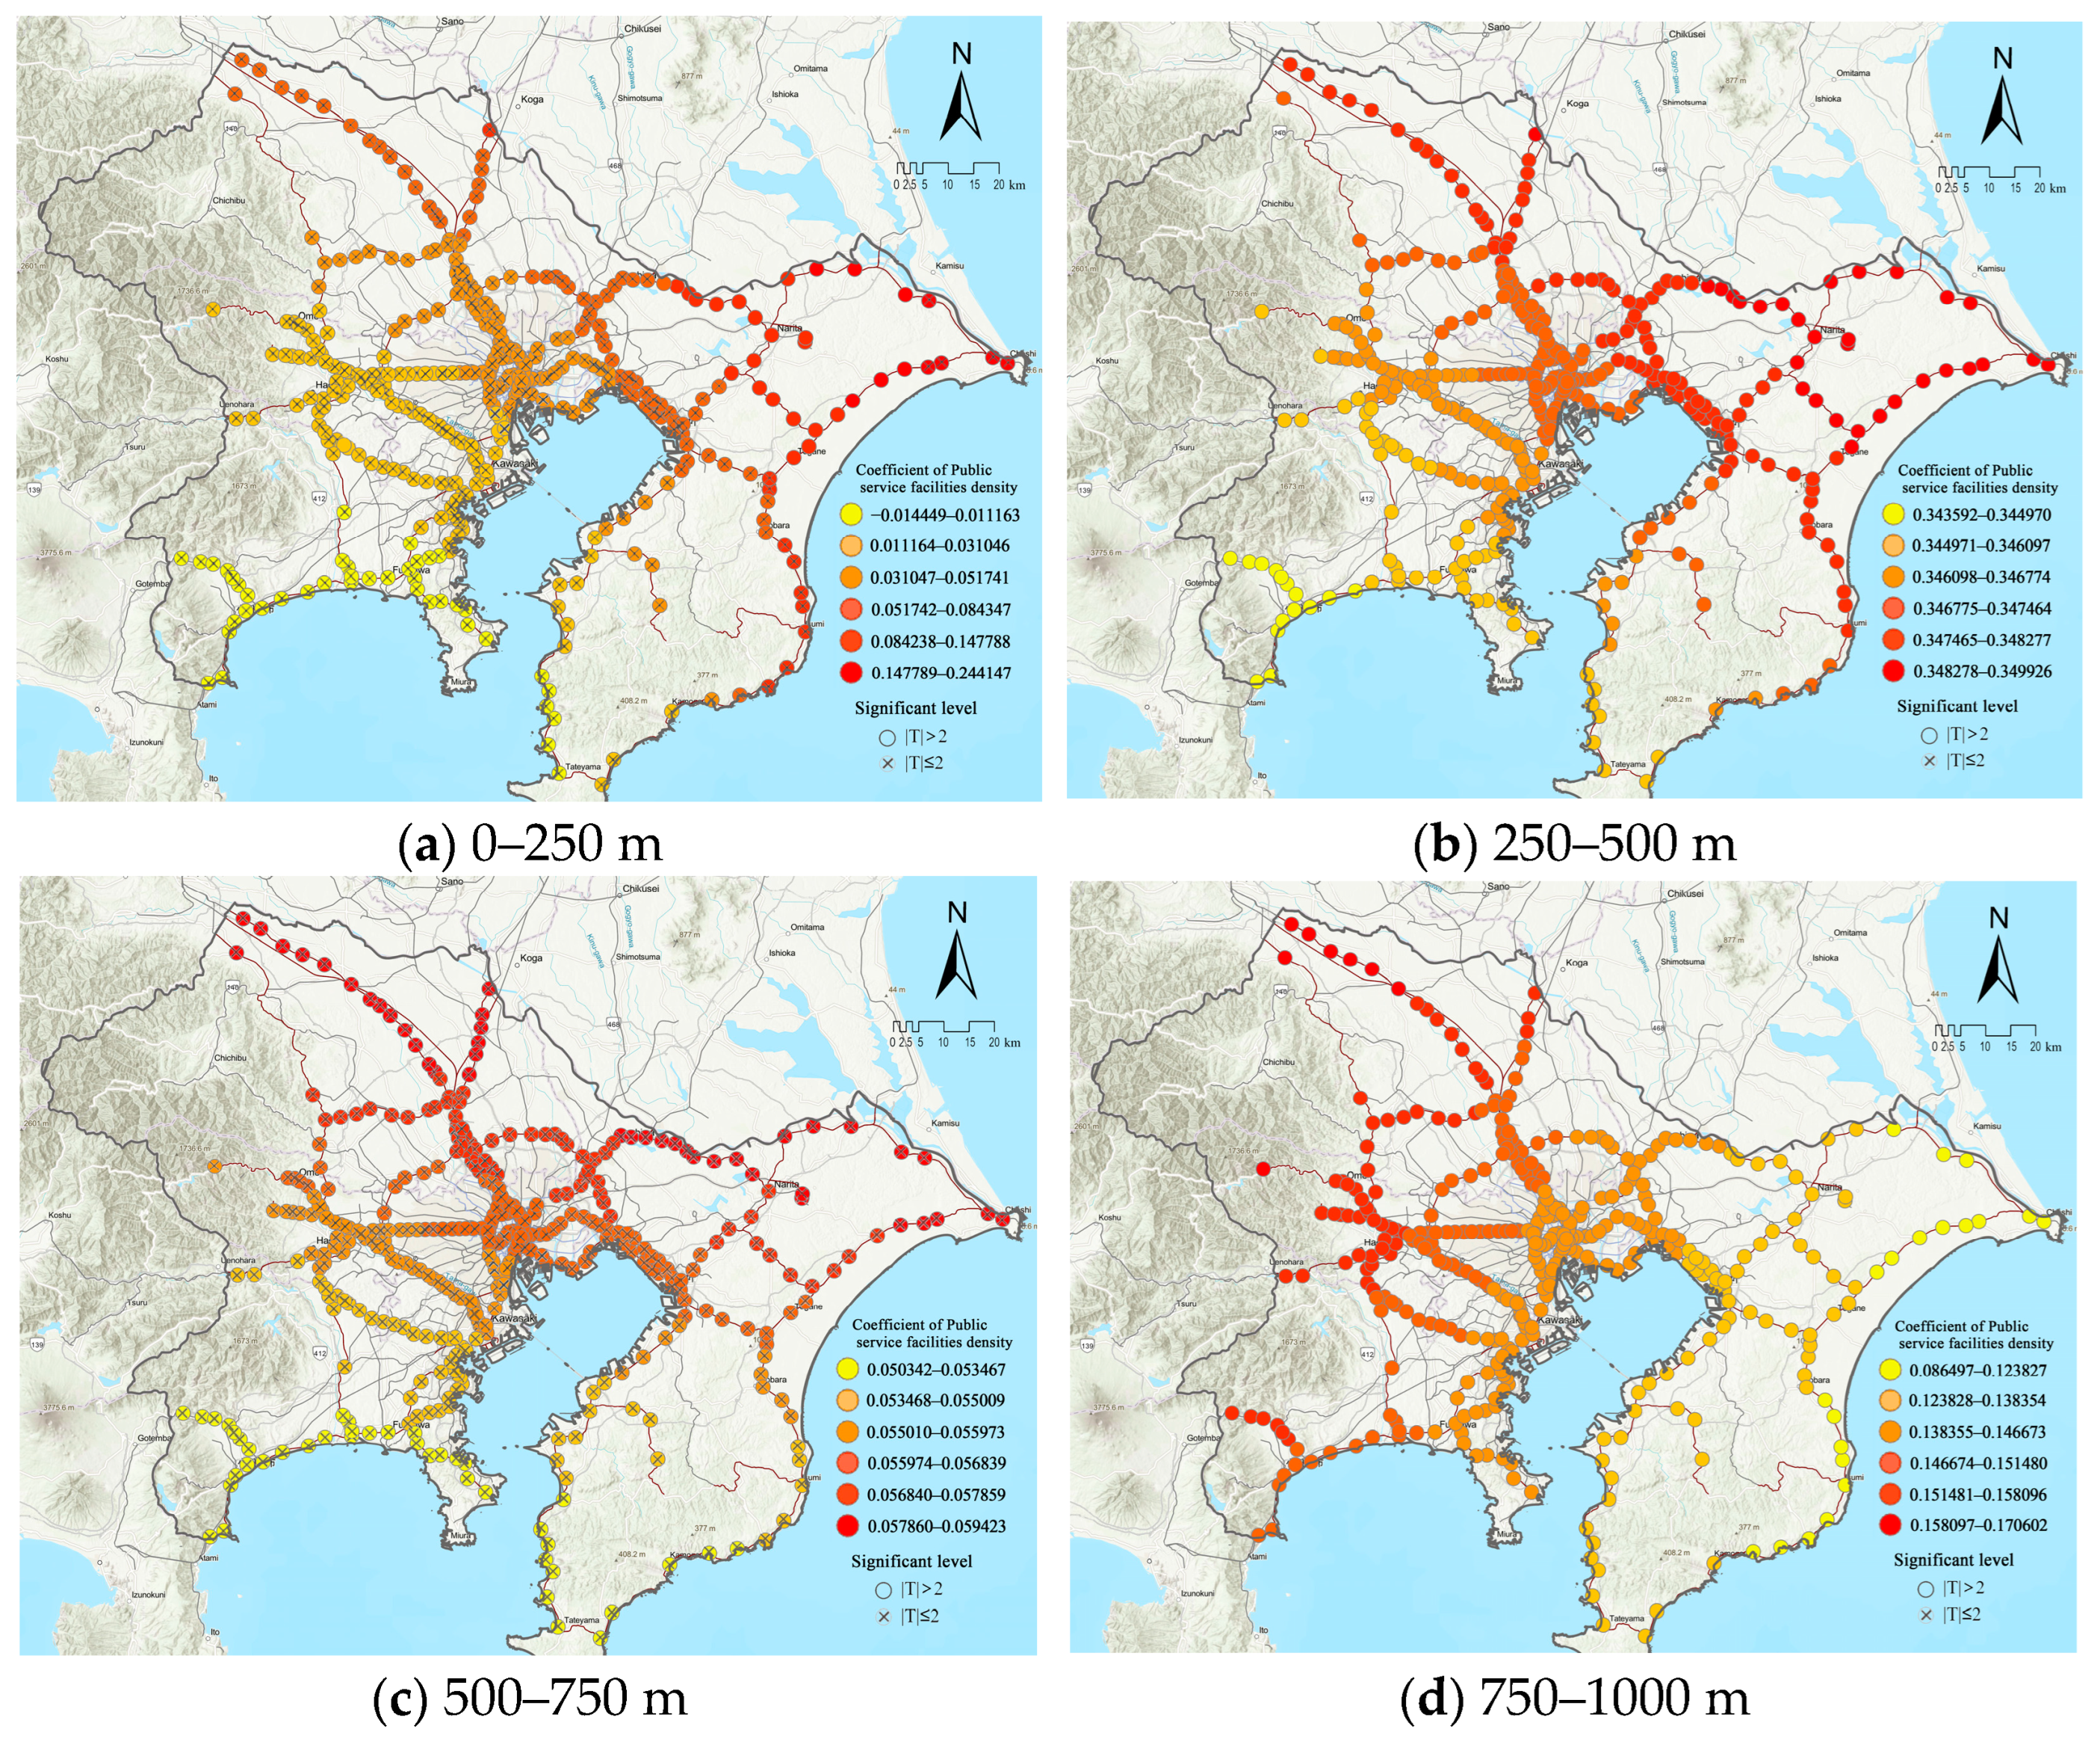
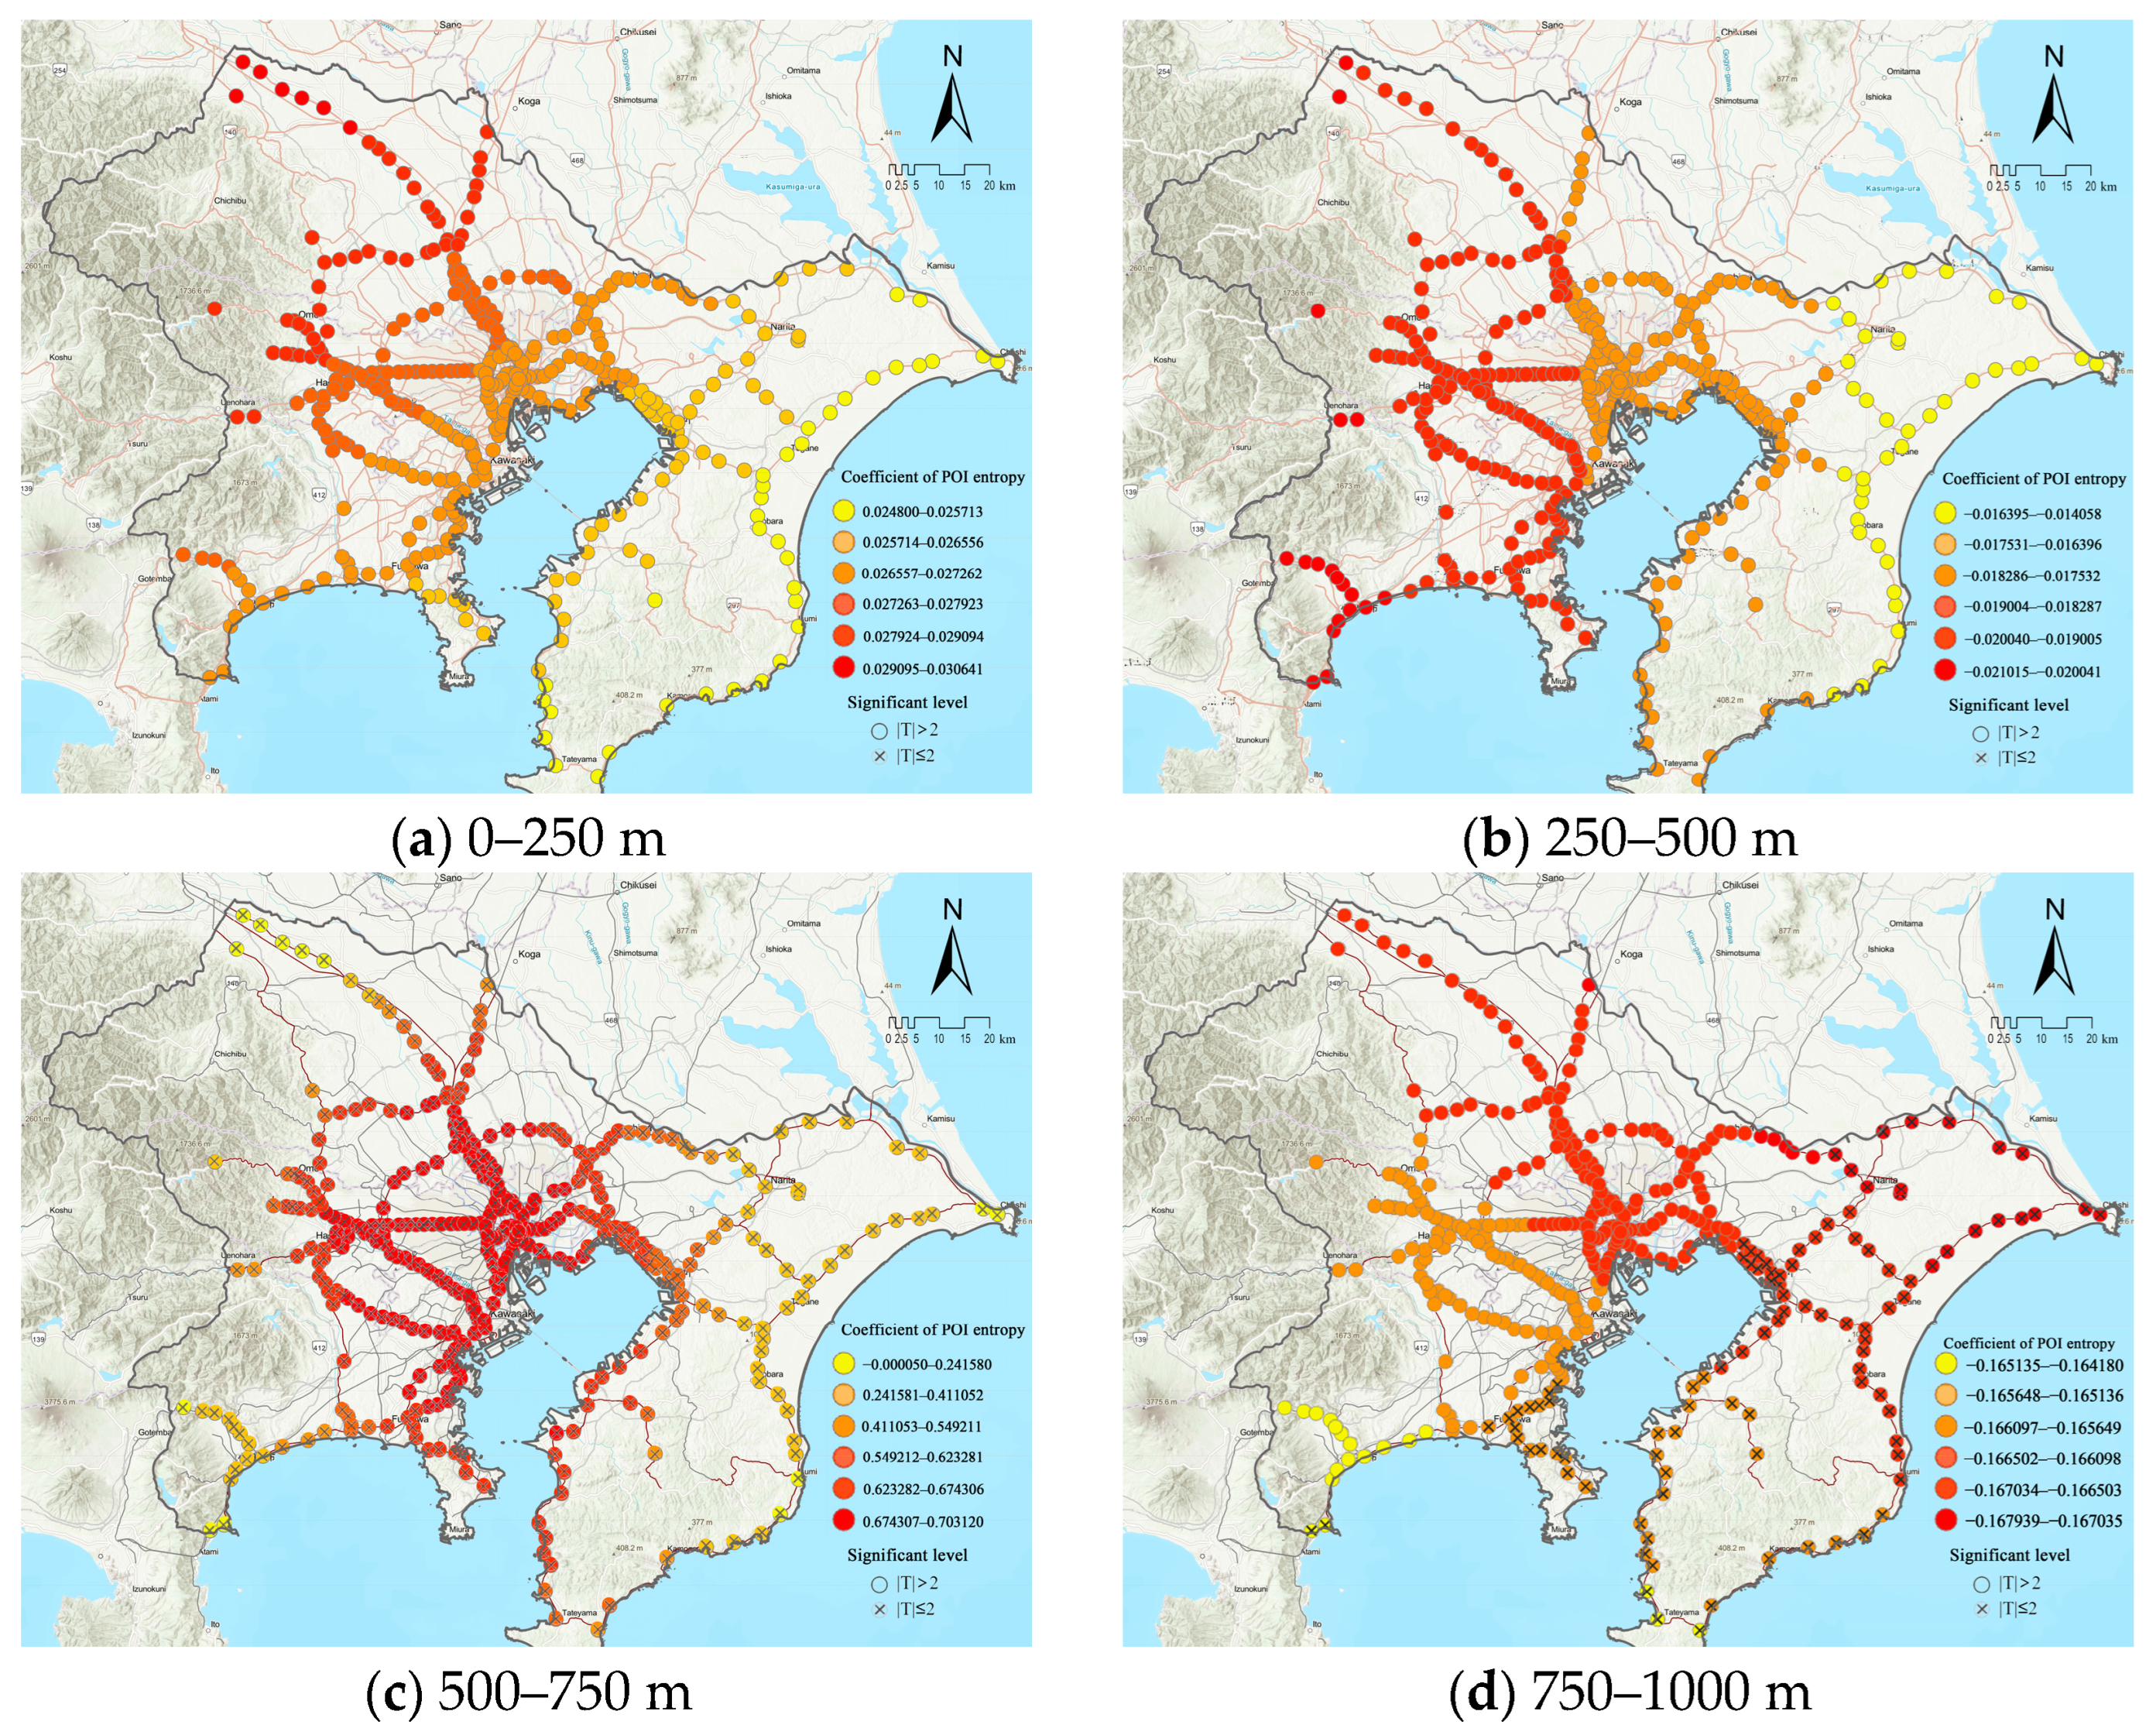
4.2. Spatial Characteristics of Land Use in Station Area
4.3. Analysis of the Impact of the Built Environment on Passenger Flow
4.3.1. Multiple Linear Regression Results
4.3.2. MGWR Model Analysis Results
4.4. Policy Recommendations
5. Conclusions
Author Contributions
Funding
Data Availability Statement
Acknowledgments
Conflicts of Interest
References
- Cao, J.; Tao, T. Using Machine-Learning Models to Understand Nonlinear Relationships between Land Use and Travel. Transp. Res. Part D-Transp. Environ. 2023, 123, 103930. [Google Scholar] [CrossRef]
- Chen, L.; Lu, Y.; Liu, Y.; Yang, L.; Peng, M.; Liu, Y. Association between Built Environment Characteristics and Metro Usage at Station Level with a Big Data Approach. Travel Behav. Soc. 2022, 28, 38–49. [Google Scholar] [CrossRef]
- Le Boennec, R.; Bulteau, J.; Feuillet, T. The Role of Commuter Rail Accessibility in the Formation of Residential Land Values: Exploring Spatial Heterogeneity in Peri-Urban and Remote Areas. Ann. Reg. Sci. 2022, 69, 163–186. [Google Scholar] [CrossRef]
- Niu, S.; Hu, A.; Shen, Z.; Lau, S.S.Y.; Gan, X. Study on Land Use Characteristics of Rail Transit TOD Sites in New Towns—Taking Singapore as an Example. J. Asian Archit. Build. Eng. 2019, 18, 16–27. [Google Scholar] [CrossRef]
- Wang, X.; Tong, D.; Gao, J.; Chen, Y. The Reshaping of Land Development Density through Rail Transit: The Stories of Central Areas vs. Suburbs in Shenzhen, China. Cities 2019, 89, 35–45. [Google Scholar] [CrossRef]
- Wang, Y.; Lu, D.; Levinson, D. Equilibrium or Imbalance? Rail Transit and Land Use Mix in Station Areas. Transportation 2022, 50, 2403–2421. [Google Scholar] [CrossRef]
- Liu, C.; Erdogan, S.; Ma, T.; Ducca, F.W. How to Increase Rail Ridership in Maryland: Direct Ridership Models for Policy Guidance. J. Urban Plan. Dev. 2016, 142, 04016017. [Google Scholar] [CrossRef]
- Ding, C.; Cao, X.; Liu, C. How Does the Station-Area Built Environment Influence Metrorail Ridership? Using Gradient Boosting Decision Trees to Identify Non-Linear Thresholds. J. Transp. Geogr. 2019, 77, 70–78. [Google Scholar] [CrossRef]
- Liu, S.; Yao, E.; Li, B. Exploring Urban Rail Transit Station-Level Ridership Growth with Network Expansion. Transp. Res. Part D-Transp. Environ. 2019, 73, 391–402. [Google Scholar] [CrossRef]
- Pan, H.; Li, J.; Shen, Q.; Shi, C. What Determines Rail Transit Passenger Volume? Implications for Transit Oriented Development Planning. Transp. Res. Part D-Transp. Environ. 2017, 57, 52–63. [Google Scholar] [CrossRef]
- Sung, H.; Cheon, S. Relationship between Land Use Pattern of Railway Station Areas and Transit Ridership in the Seoul Metropolitan Region. Korea Spat. Plan. Rev. 2014, 81, 121–131. [Google Scholar] [CrossRef]
- Hu, Z.; Wu, G.; Han, Y.; Niu, Y. Unraveling the Dynamic Changes of High-Speed Rail Network with Urban Development: Evidence from China. Socio-Econ. Plan. Sci. 2023, 85, 101380. [Google Scholar] [CrossRef]
- Mohino, I.; Loukaitou-Sideris, A.; Urena, J.M. Impacts of High-Speed Rail on Metropolitan Integration: An Examination of London, Madrid and Paris. Int. Plan. Stud. 2014, 19, 306–334. [Google Scholar] [CrossRef]
- Sasaki, K.; Ohashi, T.; Ando, A. High-Speed Rail Transit Impact on Regional Systems: Does the Shinkansen Contribute to Dispersion? Ann. Reg. Sci. 1997, 31, 77–98. [Google Scholar] [CrossRef]
- Shantz, A.; Casello, J.; Woudsma, C.; Guerra, E. Understanding Factors Associated with Commuter Rail Ridership: A Demand Elasticity Study of the GO Transit Rail Network. Transp. Res. Rec. 2022, 2676, 131–143. [Google Scholar] [CrossRef]
- Wells, S.S.; Hutchinson, B.G. Impact of Commuter-Rail Services in Toronto Region. J. Transp. Eng. 1996, 122, 270–275. [Google Scholar] [CrossRef]
- Sakano, R.; Benjamin, J. A Structural Model of Mode-Activity Choice: The Case of Commuter Rail in a Medium-Size Metropolitan Area. Transp. Policy 2011, 18, 434–445. [Google Scholar] [CrossRef]
- Durning, M.; Townsend, C. Direct Ridership Model of Rail Rapid Transit Systems in Canada. Transp. Res. Rec. 2015, 2537, 96–102. [Google Scholar] [CrossRef]
- Renne, J.L.; Hamidi, S.; Ewing, R. Transit Commuting, the Network Accessibility Effect, and the Built Environment in Station Areas across the United States. Res. Transp. Econ. 2016, 60, 35–43. [Google Scholar] [CrossRef]
- Cao, Z. Configuration of Urban Commercial Centers and Transport Centers: Evidence from Tokyo Transit Network and Urban Morphology Based on the Complex Network Analysis. Urban Plan. Int. 2020, 35, 42–53. [Google Scholar] [CrossRef]
- Calthorpe, P. The Next American Metropolis: Ecology, Community, and the American Dream; Princeton Architectural Press: New York, NY, USA, 1993. [Google Scholar]
- Cervero, R.; Kockelman, K. Travel Demand and the 3Ds: Density, Diversity, and Design. Transp. Res. Part D-Transp. Environ. 1997, 2, 199–219. [Google Scholar] [CrossRef]
- Cao, X. Examining the Effect of the Hiawatha LRT on Auto Use in the Twin Cities. Transp. Policy 2019, 81, 284–292. [Google Scholar] [CrossRef]
- Nasri, A.; Zhang, L. The Analysis of Transit-Oriented Development (TOD) in Washington, D.C. and Baltimore Metropolitan Areas. Transp. Policy 2014, 32, 172–179. [Google Scholar] [CrossRef]
- Choi, J.; Lee, Y.J.; Kim, T.; Sohn, K. An Analysis of Metro Ridership at the Station-to-Station Level in Seoul. Transportation 2012, 39, 705–722. [Google Scholar] [CrossRef]
- Sung, H.; Oh, J.-T. Transit-Oriented Development in a High-Density City: Identifying Its Association with Transit Ridership in Seoul, Korea. Cities 2011, 28, 70–82. [Google Scholar] [CrossRef]
- Calvo, F.; de Oña, J.; Arán, F. New Urban Developments and Commuter Rail: Madrid Case Study. Proc. Inst. Civ. Eng.-Transp. 2017, 170, 328–337. [Google Scholar] [CrossRef]
- Forouhar, A.; van Lierop, D. If You Build It, They Will Change: Evaluating the Impact of Commuter Rail Stations on Real Estate Values and Neighborhood Composition in the Rotterdam–The Hague Metropolitan Area, the Netherlands. J. Transp. Land Use 2021, 14, 949–973. [Google Scholar] [CrossRef]
- Park, K.; Ewing, R.; Scheer, B.C.; Tian, G. The Impacts of Built Environment Characteristics of Rail Station Areas on Household Travel Behavior. Cities 2018, 74, 277–283. [Google Scholar] [CrossRef]
- Vale, D.S. Transit-Oriented Development, Integration of Land Use and Transport, and Pedestrian Accessibility: Combining Node-Place Model with Pedestrian Shed Ratio to Evaluate and Classify Station Areas in Lisbon. J. Transp. Geogr. 2015, 45, 70–80. [Google Scholar] [CrossRef]
- Cardozo, O.D.; García-Palomares, J.C.; Gutiérrez, J. Application of Geographically Weighted Regression to the Direct Forecasting of Transit Ridership at Station-Level. Appl. Geogr. 2012, 34, 548–558. [Google Scholar] [CrossRef]
- Mayor of London. Assessing Transport Connectivity in London Transport for London; Transport for London (TfL): London, UK, 2015. Available online: https://content.tfl.gov.uk/connectivity-assessment-guide.pdf (accessed on 22 July 2024).
- Knowles, R.D. Transit Oriented Development in Copenhagen, Denmark: From the Finger Plan to Ørestad. J. Transp. Geogr. 2012, 22, 251–261. [Google Scholar] [CrossRef]
- Jun, M.-J.; Choi, K.; Jeong, J.-E.; Kwon, K.-H.; Kim, H.-J. Land Use Characteristics of Subway Catchment Areas and Their Influence on Subway Ridership in Seoul. J. Transp. Geogr. 2015, 48, 30–40. [Google Scholar] [CrossRef]
- Cao, Z.; Asakura, Y.; Tan, Z. Coordination between Node, Place, and Ridership: Comparing Three Transit Operators in Tokyo. Transp. Res. Part D-Transp. Environ. 2020, 87, 102518. [Google Scholar] [CrossRef]
- Huang, Y.; Zhang, Z.; Xu, Q.; Dai, S.; Chen, Y. Causality between Multi-Scale Built Environment and Rail Transit Ridership in Beijing and Tokyo. Transp. Res. Part D-Transp. Environ. 2024, 130, 104150. [Google Scholar] [CrossRef]
- Hu, A.; Liu, J.; Li, X.; Gan, X.; Wu, Y. Study on the Evolution of Land Use Characteristies in Typical Station Areas Ofmulti-Center Urban Rail Transit: Taking Tokyo as an Example. J. Xi’an Univ. Arch. Tech. Nat. Sci. Ed. 2021, 53, 746–757. [Google Scholar] [CrossRef]
- Cui, X.; Yu, B.; Yang, L.; Liang, Y.; Zhang, L.; Fang, H. Spatio-Temporal Characteristics and Non-Linear Influencing Factors of Urban Rail Transit: The Case of Chengdu Using the Gradient Boosting Decision Tree. Econ. Geogr. 2021, 41, 61–72. [Google Scholar]
- Liu, C.; Pan, H.; JiA, X. The Influence of Rail Transit on the Planning and Development of Metropli-Tan Peri-Urban Areas. Urban Plan. Forum 2011, 06, 60–67. [Google Scholar]
- Dueker, K.J.; Weitz, J.; Bernick, M.S.; Cervero, R. Transit Villages for the 21st Century; McGraw-Hill: New York, NY, USA, 1996. [Google Scholar]
- Cummings, C.; Mahmassani, H. Does Intercity Rail Station Placement Matter? Expansion of the Node-Place Model to Identify Station Location Impacts on Amtrak Ridership. J. Transp. Geogr. 2022, 99, 103278. [Google Scholar] [CrossRef]
- Andersson, D.E.; Shyr, O.F.; Yang, J. Neighbourhood Effects on Station-Level Transit Use: Evidence from the Taipei Metro. J. Transp. Geogr. 2021, 94, 103127. [Google Scholar] [CrossRef]
- Cervero, R. Alternative Approaches to Modeling the Travel-Demand Impacts of Smart Growth. J. Am. Plan. Assoc. 2006, 72, 285–295. [Google Scholar] [CrossRef]
- Li, S.; Lyu, D.; Huang, G.; Zhang, X.; Gao, F.; Chen, Y.; Liu, X. Spatially Varying Impacts of Built Environment Factors on Rail Transit Ridership at Station Level: A Case Study in Guangzhou, China. J. Transp. Geogr. 2020, 82, 102631. [Google Scholar] [CrossRef]
- Lee, S.; Yi, C.; Hong, S.-P. Urban Structural Hierarchy and the Relationship between the Ridership of the Seoul Metropolitan Subway and the Land-Use Pattern of the Station Areas. Cities 2013, 35, 69–77. [Google Scholar] [CrossRef]
- Zhao, J.; Deng, W.; Song, Y.; Zhu, Y. Analysis of Metro Ridership at Station Level and Station-to-Station Level in Nanjing: An Approach Based on Direct Demand Models. Transportation 2014, 41, 133–155. [Google Scholar] [CrossRef]
- Jang, S.; An, Y. Influence of Centrality Indices of Urban Railway Stations: Social Network Analysis of Transit Ridership and Travel Distance. J. Reg. City Plan. 2023, 33, 323–344. [Google Scholar] [CrossRef]
- Guerra, E.; Cervero, R.; Tischler, D. Half-Mile Circle: Does It Best Represent Transit Station Catchments? Transp. Res. Rec. 2012, 2276, 101–109. [Google Scholar] [CrossRef]
- Thompson, G.; Brown, J.; Bhattacharya, T. What Really Matters for Increasing Transit Ridership: Understanding the Determinants of Transit Ridership Demand in Broward County, Florida. Urban Stud. 2012, 49, 3327–3345. [Google Scholar] [CrossRef]
- Sohn, K.; Shim, H. Factors Generating Boardings at Metro Stations in the Seoul Metropolitan Area. Cities 2010, 27, 358–368. [Google Scholar] [CrossRef]
- Ren, T.; Luca, B. Transit-Oriented Development: Learning from International Case Studies; Palgrave Pivot: Cham, Switzerland, 2020. [Google Scholar]
- Abe, R.; Kato, H. What Led to the Establishment of a Rail-Oriented City? Determinants of Urban Rail Supply in Tokyo, Japan, 1950–2010. Transp. Policy 2017, 58, 72–79. [Google Scholar] [CrossRef]
- Cao, Z. Coordinated Development of Tokyo Rail Transit and Urban Space: The History and Its Implications. Urban Plan. Int. 2023, 38, 145–155. [Google Scholar]
- Zhou, H.; Gao, H. The Impact of Urban Morphology on Urban Transportation Mode: A Case Study of Tokyo. Case Stud. Transp. Policy 2020, 8, 197–205. [Google Scholar] [CrossRef]
- Zhuang, X.; Zhao, S. Effects of Land and Building Usage on Population, Land Price and Passengers in Station Areas: A Case Study in Fukuoka, Japan. Front. Archit. Res. 2014, 3, 199–212. [Google Scholar] [CrossRef]
- Li, C.; Mao, J.; Akashi, M. An Analysis of Commercial Spatial Pattern and Business Pattern around Railway Station Areas in Japan. Archit. J. 2016, 7, 116–121. [Google Scholar] [CrossRef]
- Yashiro, R.; Kato, H. Success Factors in the Introduction of an Intermodal Passenger Transportation System Connecting High-Speed Rail with Intercity Bus Services. Case Stud. Transp. Policy 2019, 7, 708–717. [Google Scholar] [CrossRef]
- Yuan, H.; He, Y.; Zhou, J.; Li, Y.; Cui, X.; Shen, Z. Research on Compactness Ratio Model of Urban Underground Space and Compact Development Mechanism of Rail Transit Station Affected Area. Sustain. Cities Soc. 2020, 55, 102043. [Google Scholar] [CrossRef]
- Liu, Q.; Zhang, W.; Qian, Z. Walking Scale for the Needs of the Elderly in TOD Areas: Interpretation of Location Optimization Plan in Japan. Urban Plan. Int. 2021, 36, 40–49. [Google Scholar]
- Liu, Q.; Qian, Z.; Lai, Y. Transit Oriented Shrinkage: Planning Methods of Location Optimization Plan in Japan from the perspective of TOD. Urban Plan. Int. 2023, 5, 31–40. [Google Scholar] [CrossRef]
- Japanstatistical Yearbook 2024; Statistics Bureau Ministry of Internal Affairs and Communications Japan: Tokyo, Japan, 2024. Available online: https://www.stat.go.jp (accessed on 20 July 2024).
- Regarding the Future of Urban Railways in the Tokyo Metropolitan Area (Response); Ministry of Land, Infrastructure, Transport and Tourism of Japan (MLIT), 2016. Available online: https://www.mlit.go.jp/policy/shingikai/tetsudo01_sg_000261.html (accessed on 26 July 2024).
- Xia, Z.; Zhang, Y. From “5D” to “5D+N”: Research Published in English on the Factors Influencing TOD Performance. Urban Plan. Int. 2019, 34, 109–116. [Google Scholar] [CrossRef]
- Feng, J.; Li, X.; Mao, B.; Xu, Q.; Bai, Y. Weighted Complex Network Analysis of the Beijing Subway System: Train and Passenger Flows. Physical A 2017, 474, 213–223. [Google Scholar] [CrossRef]
- Xiao, X.; Jia, L.; Wang, Y. Correlation between Heterogeneity and Vulnerability of Subway Networks Based on Passenger Flow. J. Rail Transp. Plan. Manag. 2018, 8, 145–157. [Google Scholar] [CrossRef]
- Sung, H.; Choi, K.; Lee, S.; Cheon, S. Exploring the Impacts of Land Use by Service Coverage and Station-Level Accessibility on Rail Transit Ridership. J. Transp. Geogr. 2014, 36, 134–140. [Google Scholar] [CrossRef]
- Ma, C.; Cheng, Y.; Zhang, S.; Chen, K.; Wei, J.; Hu, X. Catchment-Area Delineation Approach Considering Travel Purposes for Station-Level Ridership Prediction Task. Transp. Res. Rec. 2024, 2678, 397–415. [Google Scholar] [CrossRef]
- Gao, Y.; Cui, X.; Fei, N.; Liang, P.; Feng, H. Spatial Evolution Characteristics and Planning Strategies of Chengdu-Dujiangyan Railway Station Areas. Urban Rapid Rail Transit 2023, 36, 139–145. [Google Scholar]
- Chakour, V.; Eluru, N. Examining the Influence of Stop Level Infrastructure and Built Environment on Bus Ridership in Montreal. J. Transp. Geogr. 2016, 51, 205–217. [Google Scholar] [CrossRef]
- Chen, W.; Jiang, M.; Jiang, C.; Zhang, J. Critical Node Detection Problem for Complex Network in Undirected Weighted Networks. Physica A 2020, 538, 122862. [Google Scholar] [CrossRef]
- John, C. Rail Integrated Communities in Tokyo. J. Transp. Land Use 2012, 5, 19–32. [Google Scholar] [CrossRef]
- Nasri, A.; Zhang, L. Assessing the Impact of Metropolitan-Level, County-Level, and Local-Level Built Environment on Travel Behavior: Evidence from 19 U.S. Urban Areas. J. Urban Plan. Dev 2015, 141, 04014031. [Google Scholar] [CrossRef]
- Liu, X.; Chen, X.; Gao, Y.; Pan, H.; Tian, M. Should Transit-Oriented Development Consider Station Age Effects? Transp. Res. Part D-Transp. Environ. 2024, 133, 104273. [Google Scholar] [CrossRef]
- Lee, S.; An, Y.; Kim, K. Relationship between Transit Modal Split and Intra-City Trip Ratio by Car for Compact City Planning of Municipalities in the Seoul Metropolitan Area. Cities 2017, 70, 11–21. [Google Scholar] [CrossRef]
- Urban and regional development bureau of Japan. Guide to Site Optimization Plan; Ministry of Land, Infrastructure, Transport and Tourism of Japan (MLIT), 2020. Available online: https://www.mlit.go.jp/toshi/city_plan/toshi_city_plan_tk_000035.html (accessed on 24 July 2024).
- Urban and regional development bureau of Japan. Urban Development in a Low-Carbon City Structure; Ministry of Land, Infrastructure, Transport and Tourism of Japan (MLIT), 2009. Available online: https://www.mlit.go.jp/common/000035611.pdf (accessed on 24 May 2024).
- Nagasaki City Government. Nagasaki Municipal Land Optimization Plan. Nagasaki City Planning Division, Japan. 2024. Available online: https://www.city.nagasaki.lg.jp/sumai/650000/659001/p029291.html (accessed on 20 May 2024).


| Dimension | Indicator | Description | Mean | Std. | Min | Max | |
|---|---|---|---|---|---|---|---|
| Density | Residential population density (104 person/km2) | The number of residents per unit area in the station area. | 0–1000 m | 9534.75 | 9223.37 | 14.09 | 99,855.96 |
| 0–250 m | 1.21 | 1.55 | 0.00 | 15.27 | |||
| 250–500 m | 1.24 | 1.52 | 0.00 | 14.76 | |||
| 500–750 m | 1.24 | 1.41 | 0.00 | 10.77 | |||
| 750–1000 m | 0.62 | 0.72 | 0.00 | 6.62 | |||
| Commercial facility density (1/km2) | The ratio of the total number of commercial facilities, leisure, tourism, shops, offices, restaurants, and shopping service POIs within the station area to the area size. | 0–1000 m | 40.95 | 89.84 | 0.00 | 1039.81 | |
| 0–250 m | 137.35 | 321.38 | 0.00 | 2423.47 | |||
| 250–500 m | 58.48 | 142.60 | 0.00 | 2123.94 | |||
| 500–750 m | 31.68 | 81.72 | 0.00 | 794.54 | |||
| 750–1000 m | 27.59 | 75.39 | 0.00 | 744.28 | |||
| Public service facility density (1/km2) | The ratio of the total number of educational and medical facility POIs within the station area to the area size. | 0–1000 m | 36.10 | 36.14 | 0.00 | 236.62 | |
| 0–250 m | 89.16 | 96.81 | 0.00 | 1183.67 | |||
| 250–500 m | 45.72 | 50.52 | 0.00 | 402.38 | |||
| 500–750 m | 6.53 | 8.13 | 0.00 | 81.49 | |||
| 750–1000 m | 46.61 | 60.77 | 0.00 | 488.91 | |||
| Design | Street network density (km/km2) | The ratio of the total street network length within the station area to the area size. | 0–1000 m | 33.08 | 31.22 | 3.94 | 364.82 |
| 0–250 m | 82.51 | 73.19 | 11.54 | 588.59 | |||
| 250–500 m | 32.01 | 39.72 | 2.06 | 383.08 | |||
| 500–750 m | 40.66 | 44.06 | 0.4 | 445.25 | |||
| 750–1000 m | 23.40 | 25.90 | 3.94 | 267.80 | |||
| Crossing density (1/km2) | The number of crossings within the station area. | 0–1000 m | 34.15 | 52.60 | 0.00 | 354.46 | |
| 0–250 m | 52.92 | 58.69 | 0.00 | 408.16 | |||
| 250–500 m | 53.78 | 99.24 | 0.00 | 713.07 | |||
| 500–750 m | 9.83 | 17.25 | 0.00 | 144.64 | |||
| 750–1000 m | 42.42 | 73.13 | 0.00 | 504.91 | |||
| Bus stop density (1/km2) | The number of bus stops within the station area. | 0–1000 m | 9.73 | 7.98 | 0.00 | 36.31 | |
| 0–250 m | 24.07 | 29.08 | 0.00 | 214.28 | |||
| 250–500 m | 11.00 | 11.22 | 0.00 | 81.49 | |||
| 500–750 m | 3.12 | 3.46 | 0.00 | 21.39 | |||
| 750–1000 m | 11.93 | 10.55 | 0.00 | 67.66 | |||
| Diversity | Functional diversity | The richness and complexity of functions within the station area, measured by the entropy index of POI data. Six types of facilities were considered: commercial, public, cultural, schools, hospitals, and parks. | 0–1000 m | 1.26 | 0.27 | 0.00 | 1.66 |
| 0–250 m | 0.92 | 0.35 | 0.00 | 1.47 | |||
| 250–500 m | 1.02 | 0.37 | 0.00 | 1.55 | |||
| 500–750 m | 1.08 | 0.41 | 0.00 | 1.68 | |||
| 750–1000 m | 1.13 | 0.37 | 0.00 | 1.70 | |||
| Proportion of non-built-up land (%) | The proportion of non-built-up land, mainly referring to agricultural, forest land, and water areas | 0–1000 m | 11.61 | 21.92 | 0.00 | 87.10 | |
| 0–250 m | 5.98 | 15.45 | 0.00 | 107.15 | |||
| 250–500 m | 9.00 | 19.46 | 0.00 | 88.52 | |||
| 500–750 m | 11.68 | 22.85 | 0.00 | 92.42 | |||
| 750–1000 m | 13.44 | 24.56 | 0.00 | 90.41 | |||
| Station location attributes and socio-economic indicators | Distance to CBD (km) | Distance from the station to Tokyo Station. | 36.71 | 22.21 | 0.00 | 96.23 | |
| Degree centrality | The number of links connected to the station, representing the station’s hub status. | 2.56 | 1.34 | 1.00 | 12.00 | ||
| Closeness centrality | The closeness of a station to all other stations. | 0.06 | 0.01 | 0.03 | 0.09 | ||
| Betweenness centrality | The number of shortest paths passing through the station. | 23,523.45 | 9223.37 | 0.00 | 366,479.79 | ||
| Eigenvector centrality | The importance of the station itself and its environment. | 0.08 | 0.10 | 0.01 | 1.00 | ||
| Years of operation | The operational years of the station, with stations opened before 1950 recorded as 1950. | 61.340 | 15.119 | 2.000 | 72.000 | ||
| Number of local resident population (104 person) | The total local resident population in the municipality where the station is located. | 19.84 | 16.40 | 0.48 | 74.81 | ||
| Number of local employees (104 person) | The number of local employees in commercial, manufacturing, and private establishments in the municipality where the station is located. | 15.60 | 24.46 | 0.17 | 128.88 | ||
| Sales of commercial goods (106 million yen) | Annual sales of commercial goods in the municipality where the station is located. | 2.25 | 7.56 | 0.00 9 | 45 | ||
| Core PCA | Primary PCA | Secondary PCA | Outer PCA | |||||
|---|---|---|---|---|---|---|---|---|
| β | SD | β | SD | β | SD | β | SD | |
| Population density | 0.148 | 0.090 | 0.800 *** | 0.092 | 1.210 *** | 0.113 | −0.098 | 0.074 |
| Commercial facility density | −0.0049 *** | 0.001 | −0.001 | 0.001 | 0.017 *** | 0.002 | −0.011 *** | 0.002 |
| Public service facility density | 0.010 *** | 0.002 | 0.000 | 0.003 | −0.205 *** | 0.014 | 0.020 *** | 0.003 |
| Street network density | 0.0329 *** | 0.004 | −0.037 | 0.005 | 0.018 *** | 0.005 | −0.041 *** | 0.005 |
| Crossing density | −0.019 *** | 0.0029 | 0.008 *** | 0.002 | −0.051 *** | 0.008 | 0.007 *** | 0.002 |
| Bus stop density | 0.056 *** | 0.0099 | −0.003 | 0.009 | −0.165 *** | 0.024 | 0.019 ** | 0.009 |
| Functional diversity | −4.989 *** | 0.354 | −4.393 *** | 0.324 | −2.498 *** | 0.330 | −1.830 *** | 0.310 |
| Proportion of non-built-up land | −0.016 *** | 0.005 | −0.009 ** | 0.004 | −0.007 | 0.004 | −0.005 | 0.004 |
| Cons | 2.476 | 0.646 | −0.792 | 0.673 | −3.868 *** | 0.784 | 3.267 *** | 0.556 |
| Log likelihood | −2467.9613 | |||||||
| Core PCA | Primary PCA | Secondary PCA | Outer PCA | |||||
|---|---|---|---|---|---|---|---|---|
| β Std | t | Β Std | t | Β Std | t | β Std | t | |
| Population density | −0.220 *** | −5.591 | −0.244 *** | −6.321 | −0.124 *** | −2.682 | −0.106 ** | −2.447 |
| Commercial facility density | 0.060 | 1.628 | 0.041 | 1.132 | 0.135 *** | 2.863 | −0.140 *** | −3.225 |
| Public service facility density | 0.056 | 1.563 | 0.372 *** | 8.678 | 0.062 ** | 2.023 | 0.134 *** | 2.909 |
| Street network density | 0.287 *** | 6.060 | 0.288 *** | 4.676 | 0.096 | 1.648 | 0.196 *** | 4.317 |
| Crossing density | −0.137 *** | −3.727 | −0.153 *** | −2.649 | 0.056 | 1.570 | −0.040 | −0.933 |
| Bus stop density | 0.237 *** | 7.128 | 0.170 *** | 5.210 | 0.084 ** | 2.404 | 0.088 ** | 2.240 |
| Functional diversity | −0.005 | −0.170 | −0.032 | −1.131 | 0.026 | 0.770 | −0.080 ** | −2.424 |
| Proportion of non-built-up land | −0.045 | −1.473 | 0.021 | 0.698 | −0.001 | −0.015 | −0.022 | −0.602 |
| Distance to CBD (km) | −0.186 *** | −4.102 | −0.174 *** | −4.187 | −0.173 *** | −3.306 | −0.200 *** | −3.919 |
| DC | 0.501 *** | 12.133 | 0.387 *** | 9.647 | 0.588 *** | 13.460 | 0.644 *** | 15.052 |
| CC | −0.127 *** | −3.329 | −0.101 *** | −2.978 | −0.117 *** | −2.881 | −0.101 ** | −2.431 |
| BC | 0.045 | 1.146 | 0.087 ** | 2.320 | 0.058 | 1.332 | 0.001 | 0.025 |
| Years of operation | 0.084 *** | 2.888 | 0.039 | 1.462 | 0.090 *** | 2.878 | 0.126 *** | 4.088 |
| Number of local resident population | 0.023 | 0.705 | 0.063 ** | 2.086 | 0.068 | 1.865 | 0.061 | 1.641 |
| Number of local employees | 0.094 ** | 2.340 | −0.016 | −0.416 | 0.029 | 0.649 | 0.037 | 0.773 |
| Cons | −0.703 | −0.060 | −1.575 | −0.870 | ||||
| R2 | 0.73 | 0.78 | 0.68 | 0.68 | ||||
| Core PCA | Primary PCA | Secondary PCA | Outer PCA | |||||
|---|---|---|---|---|---|---|---|---|
| Mean | IQR | Mean | IQR | Mean | IQR | Mean | IQR | |
| Intercept | −0.0685 | 0.0064 | −0.0362 | 0.0018 | −0.0215 | 0.0009 | −0.0206 | 0.0007 |
| Population density | −0.244 | 0.0128 | −0.2449 | 0.0006 | −0.1326 | 0.0005 | −0.1203 | 0.0006 |
| Commercial facility density | 0.028 | 0.0032 | 0.0204 | 0.0003 | 0.1137 | 0.0014 | −0.1588 | 0.0007 |
| Public service facility density | 0.0332 | 0.0011 | 0.3454 | 0.0014 | 0.0586 | 0.0018 | 0.1424 | 0.0052 |
| Street network density | 0.279 | 0.0013 | 0.2711 | 0.0002 | 0.0886 | 0.0007 | 0.1932 | 0.0002 |
| Crossing density | −0.1459 | 0.0028 | −0.1751 | 0.0004 | 0.054 | 0.0017 | −0.055 | 0.0009 |
| Bus stop density | 0.2626 | 0.0010 | 0.2035 | 0.1239 | 0.0986 | 0.0018 | 0.104 | 0.0006 |
| Functional diversity | 0.0238 | 0.0017 | −0.0111 | 0.0011 | 0.0371 | 0.0016 | −0.066 | 0.0025 |
| Proportion of non-built-up land | −0.0386 | 0.1122 | −0.0063 | 0.0027 | −0.0174 | 0.0034 | −0.04 | 0.0038 |
| Distance to CBD (km) | −0.2886 | 0.0413 | −0.1925 | 0.0020 | −0.1888 | 0.0019 | −0.2128 | 0.0012 |
| DC | 0.5128 | 0.1050 | 0.3933 | 0.0852 | 0.6049 | 0.0979 | 0.6627 | 0.1063 |
| CC | −0.1439 | 0.0016 | −0.1171 | 0.0012 | −0.1369 | 0.0006 | −0.1197 | 0.0015 |
| BC | −0.0001 | 0.0016 | 0.0514 | 0.0009 | 0.0228 | 0.0018 | −0.0388 | 0.0012 |
| Years of operation | 0.0683 | 0.0113 | 0.0302 | 0.0020 | 0.0858 | 0.0022 | 0.1227 | 0.0025 |
| Number of local resident population | 0.0373 | 0.0128 | 0.0903 | 0.0011 | 0.0802 | 0.0028 | 0.0729 | 0.0030 |
| Number of local employees | 0.0582 | 0.0032 | −0.0255 | 0.0027 | 0.0193 | 0.0011 | 0.0229 | 0.0011 |
| R2 | 0.76 | 0.81 | 0.70 | 0.70 | ||||
| AICc | 603.7404 | 524.7108 | 689.195 | 683.5094 | ||||
| R2 (GWR) | 0.76 | 0.77 | 0.67 | 0.67 | ||||
| AICc (GWR) | 628.5064 | 567.0857 | 707.8051 | 706.2423 | ||||
Disclaimer/Publisher’s Note: The statements, opinions and data contained in all publications are solely those of the individual author(s) and contributor(s) and not of MDPI and/or the editor(s). MDPI and/or the editor(s) disclaim responsibility for any injury to people or property resulting from any ideas, methods, instructions or products referred to in the content. |
© 2024 by the authors. Licensee MDPI, Basel, Switzerland. This article is an open access article distributed under the terms and conditions of the Creative Commons Attribution (CC BY) license (https://creativecommons.org/licenses/by/4.0/).
Share and Cite
Gao, Y.; Cui, X.; Sun, X. Land Use Characteristics of Commuter Rail Station Areas and Their Impact on Station Ridership: A Case Study of Japan Railways in the Tokyo Metropolitan Area. Land 2024, 13, 2045. https://doi.org/10.3390/land13122045
Gao Y, Cui X, Sun X. Land Use Characteristics of Commuter Rail Station Areas and Their Impact on Station Ridership: A Case Study of Japan Railways in the Tokyo Metropolitan Area. Land. 2024; 13(12):2045. https://doi.org/10.3390/land13122045
Chicago/Turabian StyleGao, Yanan, Xu Cui, and Xiaozheng Sun. 2024. "Land Use Characteristics of Commuter Rail Station Areas and Their Impact on Station Ridership: A Case Study of Japan Railways in the Tokyo Metropolitan Area" Land 13, no. 12: 2045. https://doi.org/10.3390/land13122045
APA StyleGao, Y., Cui, X., & Sun, X. (2024). Land Use Characteristics of Commuter Rail Station Areas and Their Impact on Station Ridership: A Case Study of Japan Railways in the Tokyo Metropolitan Area. Land, 13(12), 2045. https://doi.org/10.3390/land13122045