Article

Salinity Effects on Soil Structure and Hydraulic Properties: Implications for Pedotransfer Functions in Coastal Areas

by
Xiao Zhang
1,†,
Yutao Zuo
1,†,
Tiejun Wang
1,2,3,* and
Qiong Han
1,2
1
Institute of Surface-Earth System Science, School of Earth System Science, Tianjin University, Tianjin 300072, China
2
Critical Zone Observatory of Bohai Coastal Region, Tianjin University, Tianjin 300072, China
3
Tianjin Key Laboratory of Earth Critical Zone Science and Sustainable Development in Bohai Rim, Tianjin University, Tianjin 300072, China
*
Author to whom correspondence should be addressed.
These authors contributed equally to this work.
Land 2024, 13(12), 2077; https://doi.org/10.3390/land13122077
Submission received: 21 October 2024 / Revised: 27 November 2024 / Accepted: 1 December 2024 / Published: 2 December 2024
(This article belongs to the Section Land, Soil and Water)

Abstract

:
Understanding the effects of salinity on soil structure and hydraulic properties is critical for addressing environmental challenges in coastal saline and sodic areas. In this study, soil samples were collected from a coastal region in eastern China to investigate how salinity affected the soil structure and hydraulic properties based on lab experiments. A comprehensive soil dataset was also compiled from the experimental results to develop a salinity-based pedotransfer function (PTF-S) tailored to the coastal environment. The results showed that salinity significantly altered the soil aggregate size distribution and hydraulic properties. Higher salinity promoted the formation of larger aggregates (0.25–2 mm), particularly in silty clay soil. Salinity positively correlated with the saturated hydraulic conductivity (Ks) in sandy loam soil, regardless of the cation type (Na⁺ or Ca2⁺). By comparison, Na+ increased the Ks of silty clay soil up to a certain threshold, while Ca2+ enhanced the Ks regardless of the soil texture. Increased salinity also reduced the soil water retention of sandy loam soil; however, Na+ increased the soil water retention of silty clay soil and Ca2+ had different effects depending on the suction levels. The newly developed PTF-S model, which included the electrical conductivity (EC) and cation exchange capacity (CEC), showed better predictions for the volumetric water content (R = 0.886 and RMSE = 0.057 cm3/cm3) and log Ks (R = 0.991 and RMSE = 0.073 mm/h) than the traditional model that excludes the salinity variables EC and CEC (PTF-N) (R = 0.839 and RMSE = 0.066 cm3/cm3 for the volumetric water content, and R = 0.966 and RMSE = 0.140 mm/h for the log Ks). This study highlights the importance of developing salinity-based PTFs for addressing soil salinization challenges.

1. Introduction

Understanding the factors influencing soil hydraulic properties (e.g., the saturated hydraulic conductivity—Ks and soil water-retention characteristics) is critical for addressing various research and application problems, such as irrigation scheduling, salinity management, and flood forecasting [1,2,3]. A number of variables can play crucial roles in determining soil hydraulic properties in complex manners, including the soil texture and structure, soil organic matter (SOM), vegetation, and land use [4,5,6,7]. For example, SOM has been shown to either positively or negatively affect the Ks due to its complicated influences on the soil structure and aggregation processes [8,9,10]. As such, it is still challenging to accurately characterize soil hydraulic properties across diverse landscapes [7,11,12], particularly in regions with saline and sodic soils [13,14].
As a global issue that affects about 7% of the world’s land area, or 30% of irrigated lands [14], soil salinization can seriously degrade the soil quality, crop yield, and ecosystem services [15,16], partly due to the fact that high soil salinities can impair root water uptake and bring ion concentrations to toxic levels, especially for glycophytes and cash crops [17,18]. To effectively manage soil salinization, it is imperative to accurately model water movement and solute transport in saline soils [19,20,21], which requires the characterization of soil hydraulic properties that are, in turn, affected by soil salinity [1,22,23].
Salts can affect soil hydraulic properties by altering the soil structure and aggregation processes through different physical and chemical mechanisms [24,25]. For instance, soil aggregates can break down by the swelling and dispersion of clay particles due to the increasing thickness of diffuse double layers with salinity [26]. In contrast, clay flocculation caused by cations, such as Ca2+ and Mg2+, can initiate soil aggregation processes [27]. Moreover, other soil factors (e.g., soil pH and clay mineralogy) may also modulate the impacts of salts on the soil structure and aggregation processes [24]. Due to the complex impacts of salts on the soil structure and aggregation processes, inconsistent findings have been reported on how soil salinity affects soil hydraulic properties [22,28,29]. For instance, early studies showed that an increase in the exchangeable sodium percentage could considerably reduce the Ks [13,22]. This is because sodium ions can cause the swelling of soil aggregates and the dispersion of clay particles, which then clogs soil pores for water passage [26]. However, based on field and lab experiments, Rezaei et al. [29] found that freshwater led to significantly lower Ks as compared to saline water (containing Na+), which was attributed to the combined effect of clay dispersion, calcium carbonate and gypsum dissolution, and changes in the solution compositions. Moreover, Olorunfemi et al. [30] found that higher sodium concentrations tended to increase the soil water-holding capacities (SWHCs), whereas Rezaei et al. [29] showed that sodium concentrations did not affect the SWHCs. Clearly, the inconsistencies in the early findings still warrant further investigation into how salinity alters soil hydraulic properties.
Another challenge to modeling soil water movement and solute transport arises due to the time-consuming and labor-intensive processes of measuring soil hydraulic properties [31,32]. To address this issue, various indirect techniques have been proposed to estimate soil hydraulic parameters, one of which is the use of pedotransfer functions (PTFs) to establish soil hydraulic conductivity and water-retention curves [32,33,34]. The working principle of PTFs is to convert readily available or easily measurable soil properties (e.g., the soil particle size, porosity, and organic matter content) to more difficultly obtainable soil hydraulic properties (e.g., the parameters for describing soil hydraulic conductivity and water-retention functions). Numerous PTFs have been developed with various forms partly depending on regional soil conditions (see the review by Vereecken et al. [33]). More importantly, despite the importance of salinity in controlling soil hydraulic properties, only a few attempts were made in the past several decades to develop PTFs with the inclusion of salinity, mainly owing to the lack of observed data [35,36,37]. Therefore, there is still a great need to develop new PTFs that are more suitable for regions with high soil salinities.
To address the above issues, we hypothesize that salinity significantly influences soil aggregate stability and hydraulic properties across various soil textures, and that incorporating salinity-related parameters into PTFs enhances their predictive accuracy in saline environments. The objectives of this study were to (1) investigate the impacts of salinity on soil aggregates and hydraulic properties with different textures, and (2) develop salinity-based PTFs using a newly compiled dataset. To achieve these objectives, soil samples were collected from the coastal area of Tianjin in eastern China, where soil salinization is a widespread problem for local sustainable developments. Extensive lab experiments were performed on the collected samples to measure a variety of soil properties, which were then used to develop the PTFs. The findings of this study will offer a theoretical foundation and quantitative approach for accurately estimating soil hydraulic parameters, contributing to the scientific management and sustainable development of soil and water in coastal saline regions.

2. Materials and Methods

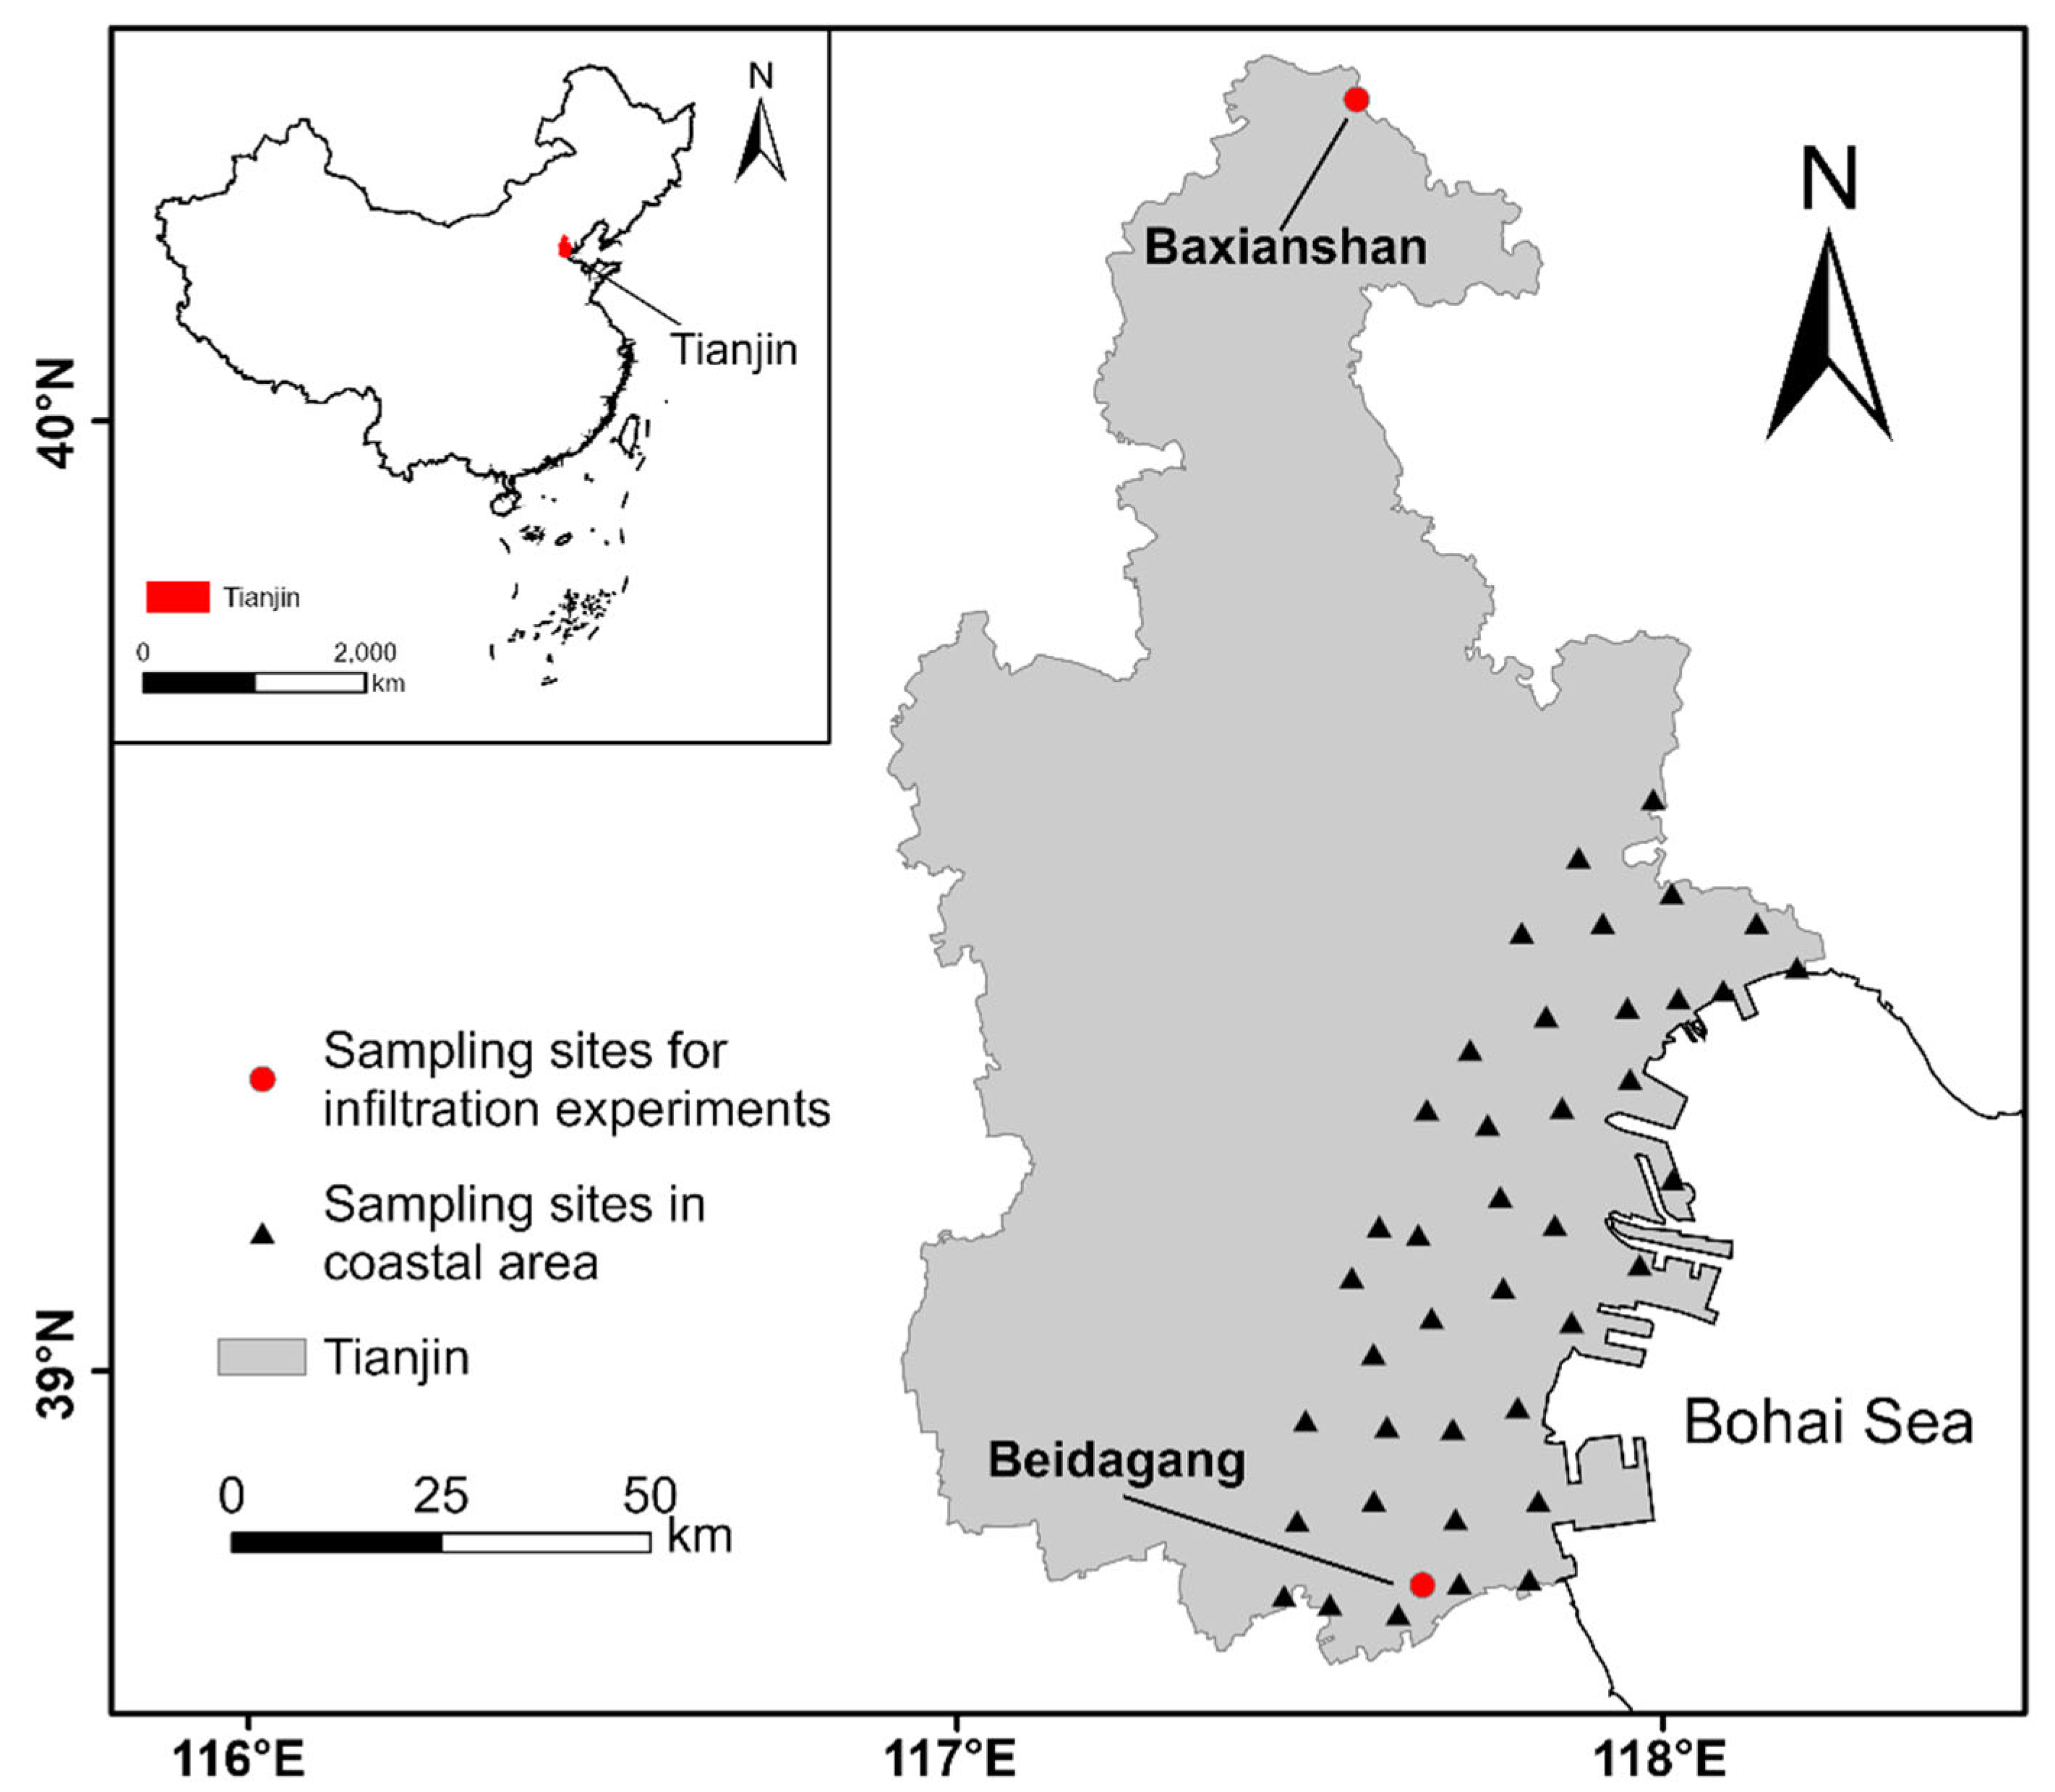
2.1. Study Area and Field Campaign

The study region was located in the metropolitan coastal zone of Tianjin with a population of more than 13 million in eastern China (Figure 1). Due to the geographic proximity to the Bohai Sea, this region with shallow groundwater tables suffers from severe soil salinization problems, which has led to various environmental issues that have hammered sustainable developments in the region, such as declining agricultural productivity and biodiversity [38,39]. It is thus of critical importance to understand how soil salinity affects soil properties for the purpose of sustainable developments in the region.
To explore the impacts of salinity on soil aggregates and hydraulic properties, disturbed soil samples were collected from two locations with different soil textures, including the Baxianshan (BXS) and Beidagang (BDG) sites (Figure 1). After the field campaigns, disturbed samples were immediately taken back to the lab at Tianjin University and stored at 4 °C before the further analysis of particle size distributions and other soil properties. To develop the PTFs, a grid-based sampling strategy was implemented to collect both disturbed and undisturbed soil samples, resulting in a total of 40 sampling points approximately 10 km apart (Figure 1). At each sampling site, a pit was excavated to a depth > 60 cm. Undisturbed soil samples were collected using ring cutters at depths of 30 cm and 60 cm along with disturbed samples, which were also taken back to Tianjin University and stored at 4 °C before further analysis.

2.2. Lab Experiments

2.2.1. Measurements of Soil Properties

For the BXS and BDG sampling points and the grid-distributed coastal samples, the following soil properties were measured according to their respective experimental purposes: texture, bulk density (BD), pH, electrical conductivity (EC), saturated hydraulic conductivity (Ks), and soil water-retention curves (SWRCs) for the samples from the BXS and BDG sampling points; texture, BD, pH, SOM, EC, cation exchange capacity (CEC), Ks, and SWRCs for the grid-distributed samples from the coastal area.
Disturbed soil samples were air-dried at room temperature for at least 72 h, and stones and roots were then removed before the remaining samples were ground with a mortar and sieved through a 2 mm mesh. To determine the soil texture, 15 g of soil samples were sequentially treated with H2O2, 10% HCl, and Na6[(PO3)6], which were then used to determine the particle size distributions with the pipette method [40]. To determine the soil salinity (characterized by the EC) and pH, sieved soil samples were mixed with distilled water at a soil-to-water ratio of 1:5 by weight, and then an Orion Star A215 benchtop pH and conductivity meter was used to measure the EC and pH. The concentration of cations (Na+ and Ca2+) in the soil was measured using an ion chromatograph [41]. The CEC was measured using the cobalt chloride solution–spectrophotometric method, following the China Environmental Protection Standard HJ889-2017 [42]. In this experiment, soil was leached with hexaamminecobalt trichloride solution at (20 ± 2) °C, exchanging soil cations into the solution. The solution’s absorbance at 475 nm, measured by a UV2700 spectrophotometer, was used to calculate the effective CEC based on the absorbance difference before and after leaching. The SOM was determined using the potassium dichromate–spectrophotometric method, as specified in the China Environmental Protection Standard HJ615-2011 [43]. This experiment used concentrated sulfuric acid and potassium dichromate to oxidize and colorize the soil organic matter, with the absorbance measured using a UV2700 spectrophotometer. The soil dataset from the 40 sampling points in Tianjin’s coastal region is available from the corresponding author upon request.
Undisturbed soil samples were used to determine the Ks, BD, and SWRCs. First, undisturbed soil samples were saturated with distilled water and the initial mass of those saturated samples were recorded. Then, the Ks was measured using the non-destructive double annular sword method [44]. After the double annular sword experiment, the soil samples were dried in an oven at 105 °C to obtain the dry weights for calculating the BD. Details on measuring the SWRCs and estimating the soil hydraulic parameters are provided in Section 2.2.3.

2.2.2. Soil Column Infiltration Experiments

To investigate how salinity affects soil aggregates and hydraulic properties, soil column infiltration experiments were conducted using soil samples collected from the BXS (sandy loam soil) and BDG (silt clay soil) sites. The basic physical and chemical properties of the soils used in the infiltration experiments are listed in Table 1. Collected soil samples were first air-dried at room temperature and ground before passing through a 2 mm sieve. Afterwards, polyvinyl tubes of 20 cm in inner diameter and 15 cm in height were filled with the sieved soils at a BD of 1.3 g/cm3. The top of the packed samples was open to the atmosphere and the bottom was set as a free drainage. The concentration gradient of the NaCl leaching treatment was set to concentrations of 2, 4, 6, 8, and 10 g/L (denoted as Na-2, Na-4, Na-6, Na-8, and Na-10, respectively), along with distilled water (Na-DZ) as a control, and were prepared for the infiltration experiments according to the measured salinity range of the soil samples. These NaCl concentration levels were closely aligned with the typical range and extreme values of the soil salinity observed in the region, making them more representative of local conditions. For each NaCl concentration level, two repetitions of infiltration experiments were conducted, leading to a total of 12 soil column infiltration experiments for each soil texture. To compare the effects of different cations on the soil hydraulic properties, another set of soils was set up for parallel experiments with the same concentration gradient (corresponding to Na, represented by Ca-2 to Ca-10 and Ca-DZ) of CaCl2.
At the beginning of the infiltration experiments, prepared solutions were added with a ponding depth of 10 cm above the soil surface, which then freely seeped under gravity. Afterwards, the soils were allowed to evaporate at room temperature until the soil surface was dry based on visual inspections. Then, it completed a full wetting–drying cycle, which lasted approximately three to four weeks. All of the infiltration experiments were repeated for three wetting–drying cycles. After the infiltration experiments, undisturbed soil samples were first taken from the soil columns using a ring cutter to determine the SWRCs, and then disturbed soils were collected to measure the size distribution of the soil aggregates and salinity. The SYS-F100 soil structure analyzer (Saiyasi Ltd., Liaoning, China) was used to measure the size distribution of the soil aggregates based on the Yoder wet sieving method (see [45] and [46] for details). Soil samples were shaken in the SYS-F100 analyzer for 30 min to separate soil aggregates of different sizes, and then dried at 105 °C until a constant weight was achieved. The percentage of each size group by weight was computed by dividing its weight over the total weight of the soil aggregates.

2.2.3. Determination of Soil Water-Retention Curves

Due to logistical reasons, two different approaches were used to determine the SWRCs. For undisturbed samples from the infiltration experiments, a highspeed centrifuge was used at speeds of 800, 1180, 2050, 3540, 4570, 6460, and 7910 r/min with the respective centrifugation times of 100, 150, 190, 220, 240, and 270 min. These centrifugation times were predetermined based on trial tests when the soil moisture content did not change any further with increasing centrifugation times [47,48]. It should be noted that, with increasing rotation speeds, the soil moisture gradually decreased due to the centrifugal force, which also compressed the soil samples. This compression led to smaller volumes of soil samples, and thus a deviation in the central rotational radius used to convert the rotational speeds to the soil suction values (see Figure 2). Therefore, it was necessary to correct the impact of soil shrinkage on the calculation of the soil suctions. Following Corey [49], the calculation formula is given as follows:
P m = P 0 + 1 2 ρ w ω 2 r 1 2 r 0 2
r 0 = r 0 + 1 2 l
where Pm is the soil suction; P0 is the initial pressure (for saturated samples, P0 = 0); ρw is the water density (ρw = 1 g/cm3 at 4 °C); ω is the angular velocity of the centrifuge rotor (r/min); r1 is the radius of rotation of the datum water surface (i.e., the outer plane of the soil); r0 is the initial rotational radius at the center of the soil sample; r0 is the rotational radius at the center of the soil sample after compression; l is the compression distance of the soil sample (experimentally determined); h in Figure 2 is the thickness of the soil sample.
For the undisturbed soil samples used to develop the PTFs, the 1500F2 Tempe cell apparatus (Soil moisture, Santa Barbara, CA, USA) was employed, which is a commonly used device for measuring SWRCs [50,51]. The experimental procedures were as follows: (1) undisturbed soil samples were saturated with distilled water and placed in close contact with the clay plate inside of the Tempe cell; (2) after the airtight sealing of the Tempe cell, the inside pressure was adjusted to a target value using an air pump; (3) once no more water was discharged from the apparatus, it was assumed that the soil moisture reached a steady state (to ensure stable moisture conditions within the soil samples, each suction level was maintained for a duration of 25–30 days), and then the soil moisture content at different suction levels was determined by the weighing method. Here, soil suction levels were set at 0, 330, 1000, 3000, 5000, and 15,000 cm to obtain the SWRCs.
The SWRCs were fitted by the van Genuchten (vG) model [52], as shown by Equation (3), and the RETC program [53,54] was used to optimize hydraulic parameters in Equation (3), as follows:
θ ( h ) = θ = θ r + θ s θ r [ 1 + α ( h ) n ] n 1 n ,     h < 0 θ s   ,     h 0  
where θr and θs (cm3/cm3) denote, respectively, the residual and saturated water contents; α (1/cm) is the inverse of the air-entry value; n (dimensionless) is a pore size distribution index. Parameters fitted by the vG model for soils infiltrated by NaCl (Table S1) and by CaCl2 (Table S2) have been listed in the Supplementary Materials.

2.2.4. Construction of Salinity-Based PTFs

Multiple stepwise regression is a common method used for constructing PTFs, as it uses various combinations of independent variables to select the optimal model for predicting dependent variables (as shown in Equation (S1)) [55]. For example, Schillaci et al. [56] successfully applied this method to improve the accuracy of PTF predictions for Mediterranean agroecosystems. Classical PTFs typically include basic soil parameters such as the sand content (SA), silt content (SI), clay content (CL), BD, SOM, and pH to predict the vG parameters (θr, θs, α, and n) and Ks. However, high salinity in coastal regions can significantly affect the soil structure and hydraulic properties, leading to the reduced accuracy of traditional PTFs in these areas [57].
To address this problem, the EC and CEC, two key indicators of soil salinity, were introduced to develop salinity-based PTFs with the multiple stepwise regression method. Specifically, 75% of the soil samples were randomly selected as the training set, while the remaining 25% was used as the validation set. First, a PTF was constructed without salinity parameters (denoted by PTF-N) using only the variables of SA, SI, CL, BD, SOM, and pH. For comparison, a salinity-based PTF (denoted by PTF-S) was also developed by the inclusion of the EC and CEC (as shown in Equation (S2) to Equation (S6)). The training and validation processes for constructing PTFs using the multiple stepwise regression method was implemented in R. The detailed modeling process (Part 1 of the Supplementary Materials), as well as the verification scheme and evaluation method (Part 2 of the Supplementary Materials), are provided in the Supplemental Materials along with the ten optimal sets of regression coefficients (Tables S3–S7) for the PTF-S models.

3. Results and Discussion

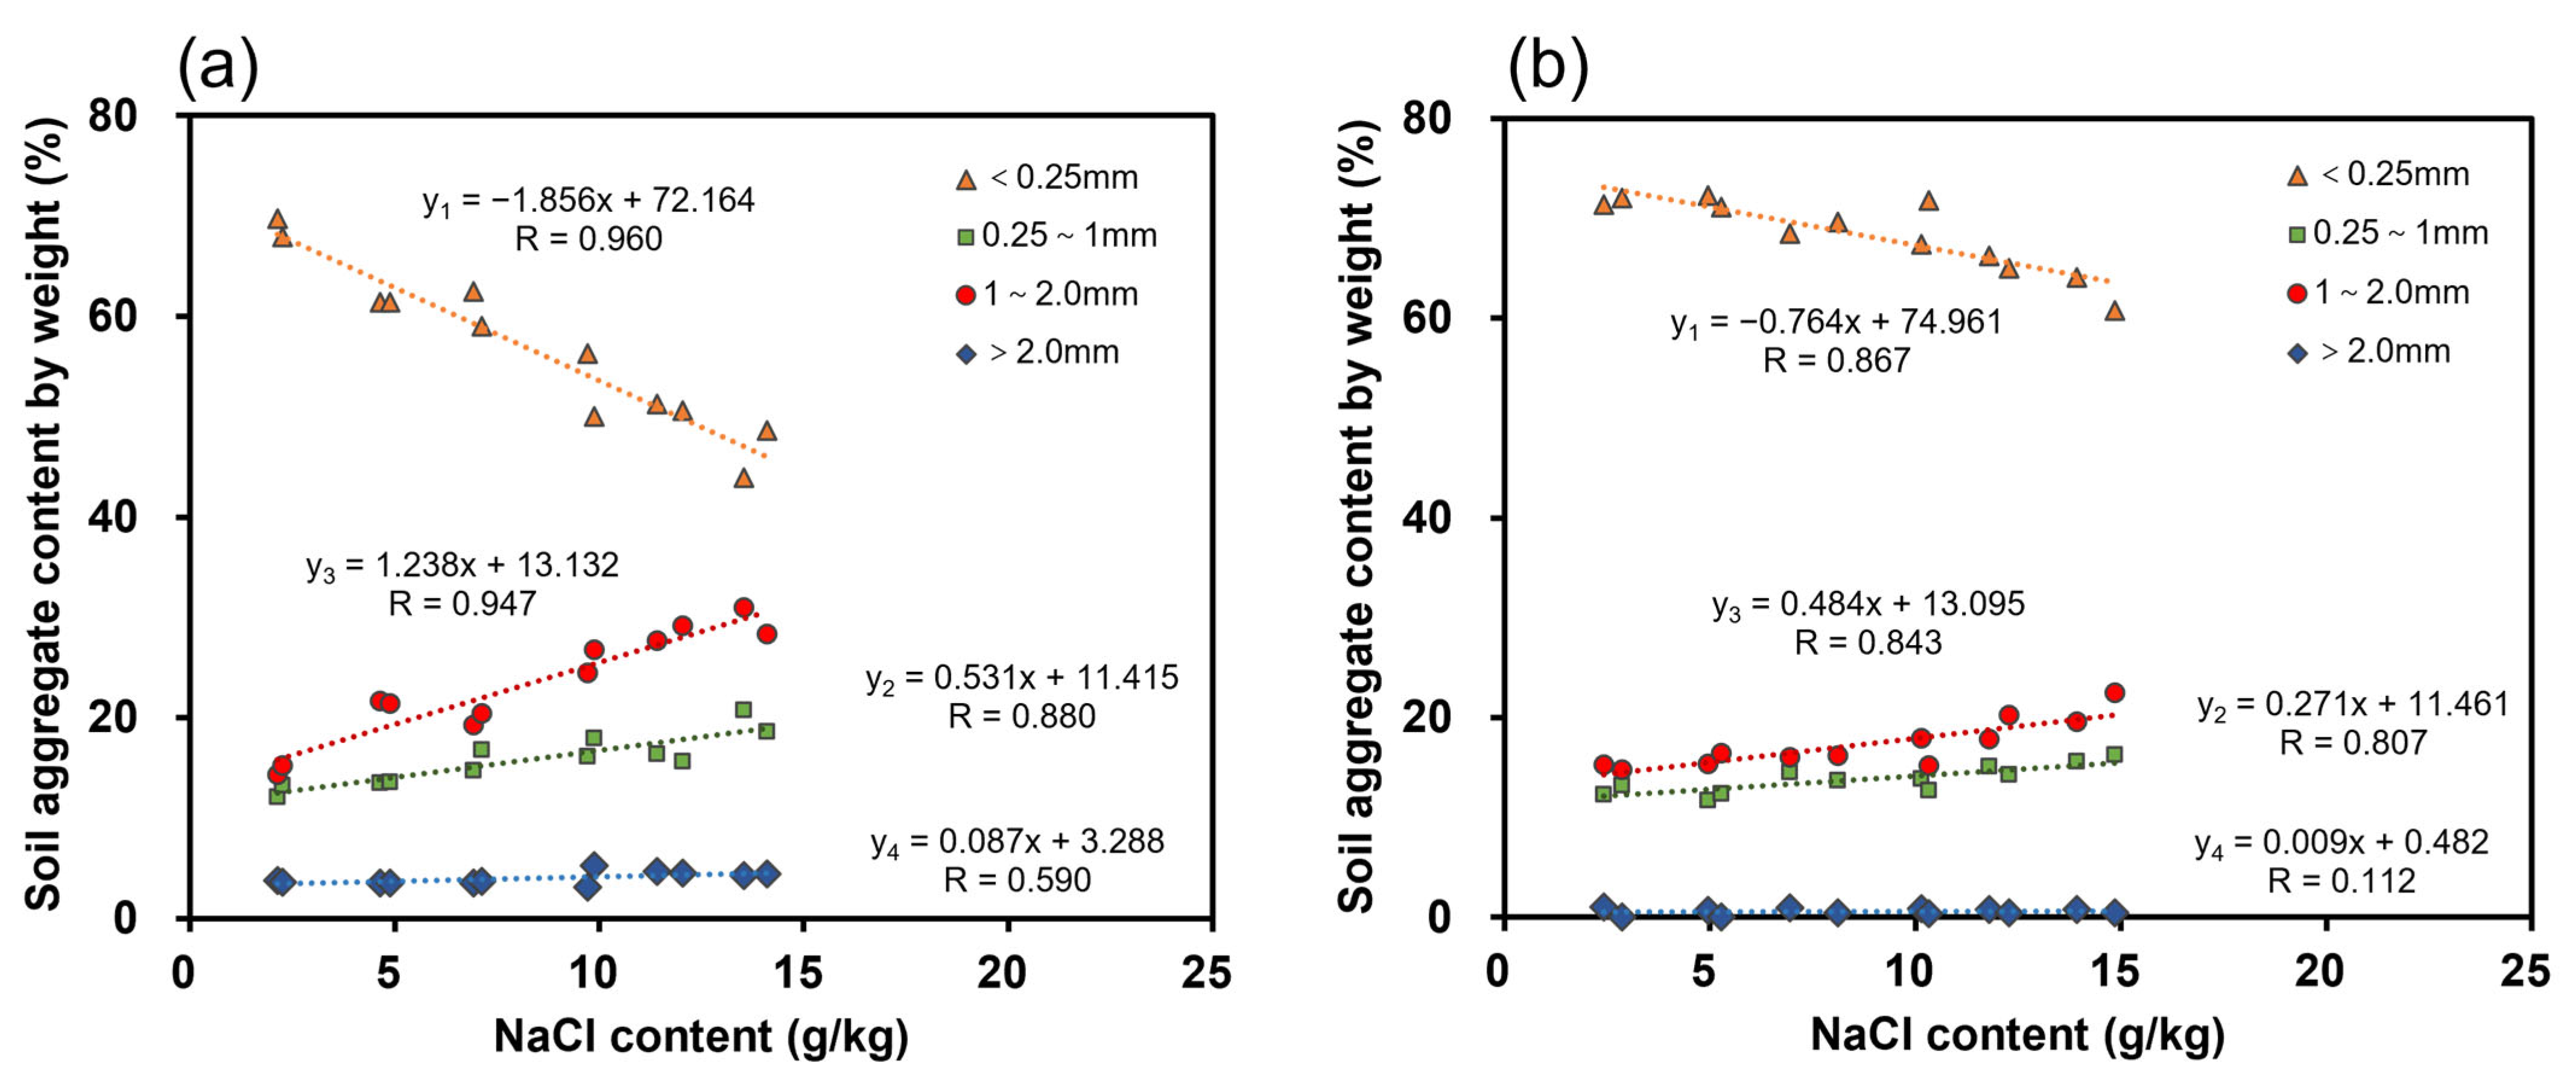
3.1. Impacts of Salinity on Soil Aggregates

According to the USDA soil taxonomy and texture classification, the BXS site features Typic Hapludalfs with sandy loam soil, while the BDG site has Typic Salorthids with silty clay soil (Table 1). Soil particle aggregation commonly occurs during wetting–drying cycles, where flocculation is a prerequisite for the formation of soil aggregates [58]. Soil aggregates are typically classified by the diameter, although no standard classification criteria have been established [59]. Given the absence of a unified standard for soil aggregate classification, this study utilized the approach by Gartzia et al. [60], who also used the dry sieving method, to classify the soil aggregates into the following four groups: ultra-large (>2.0 mm), large (2–1 mm), small (1–0.25 mm), and microaggregates (<0.25 mm). To compare the impact of salinity on the formation of agglomerates for different soil textures, the percentage of each aggregate group for different NaCl content treatments is shown in Figure 3 for silty clay soil and sandy loam soil. Note that the NaCl content in the soil samples after the three cycles of wetting and drying is plotted in Figure 3, which increased from 2.21 g/kg to 14.08 g/kg and from 2.34 g/kg to 14.64 g/kg for silty clay soil and sandy loam soil, respectively, when the NaCl concentrations increased from 0 to 10 g/L for the infiltration experiments.
Although sieved soils with diameters <2 mm were used to pack soil columns in the infiltration experiments, Figure 3 shows that all of the samples after the wetting–drying experiments contained ultra-large aggregates regardless of the NaCl treatments. Specifically, the proportion of ultra-large aggregates for silty clay soil increased slightly from 3.5% for the control experiment with distilled water to 4.5% for the experiment with a concentration of 10 g/L NaCl, suggesting that NaCl promoted the formation of ultra-large aggregates in silty clay soil. In contrast, the percentage of ultra-large aggregates in sandy loam soil was comparatively lower (from 0.8% to 1.2%) and showed no significant change with increasing NaCl contents, indicating that NaCl had much less of an impact on the formation of ultra-large aggregates in sandy loam soil. This was consistent with previous findings, which showed that soils with a high clay content were more likely to form stable large aggregates due to the ability of clay particles to bind OM and other soil particles together [61].
When the NaCl content in silty clay soil increased from 2.1 g/kg to 14.1 g/kg after the wetting–drying experiments, the proportions of large-sized and small-sized aggregates increased significantly from 14.4% to 31.0% and from 12.1% to 20.8%, respectively, with strong positive linear correlations with the NaCl content. Meanwhile, the proportion of microaggregates decreased from 69.8% to 44.0%, with a significant negative linear correlation with the NaCl content (Figure 3a). Similarly, with the NaCl content in sandy loam soil increasing from 2.4 g/kg to 14.9 g/kg, the proportions of large-sized and small-sized aggregates rose from 14.8% to 22.5% and from 11.7% to 16.2%, respectively, which also showed significant positive linear correlations with the NaCl content. As a result, the proportion of microaggregates decreased noticeably from 72.3% to 60.8%, with a significant negative linear correlation with the NaCl content (Figure 3b). The results showed that changes in soil salinity could significantly alter the size distribution of soil aggregates primarily due to the effect of flocculation.
Increases in soil salinity promote the flocculation of fine-grained particles, thereby enhancing the cohesion of smaller particles to form larger-sized aggregates [62]. Deb and Shukla [63] observed that, during soil wetting, the increased Na+ concentration reduced the repulsive forces between negatively charged soil particles, which strengthened the cohesion among colliding soil particles. During drying processes, capillary forces aggregate soil particles, leading to the increased stability of soil aggregates [64]. Although Na+ is typically regarded as a dispersant in soils [65], the net effect of soil salinity inhibits the breakdown of aggregates caused by expansion [47]. Consequently, as soil salinity increases, flocculation results in a significant increase in the proportion of macroaggregates.

3.2. Impacts of Salinity on Soil Hydraulic Properties

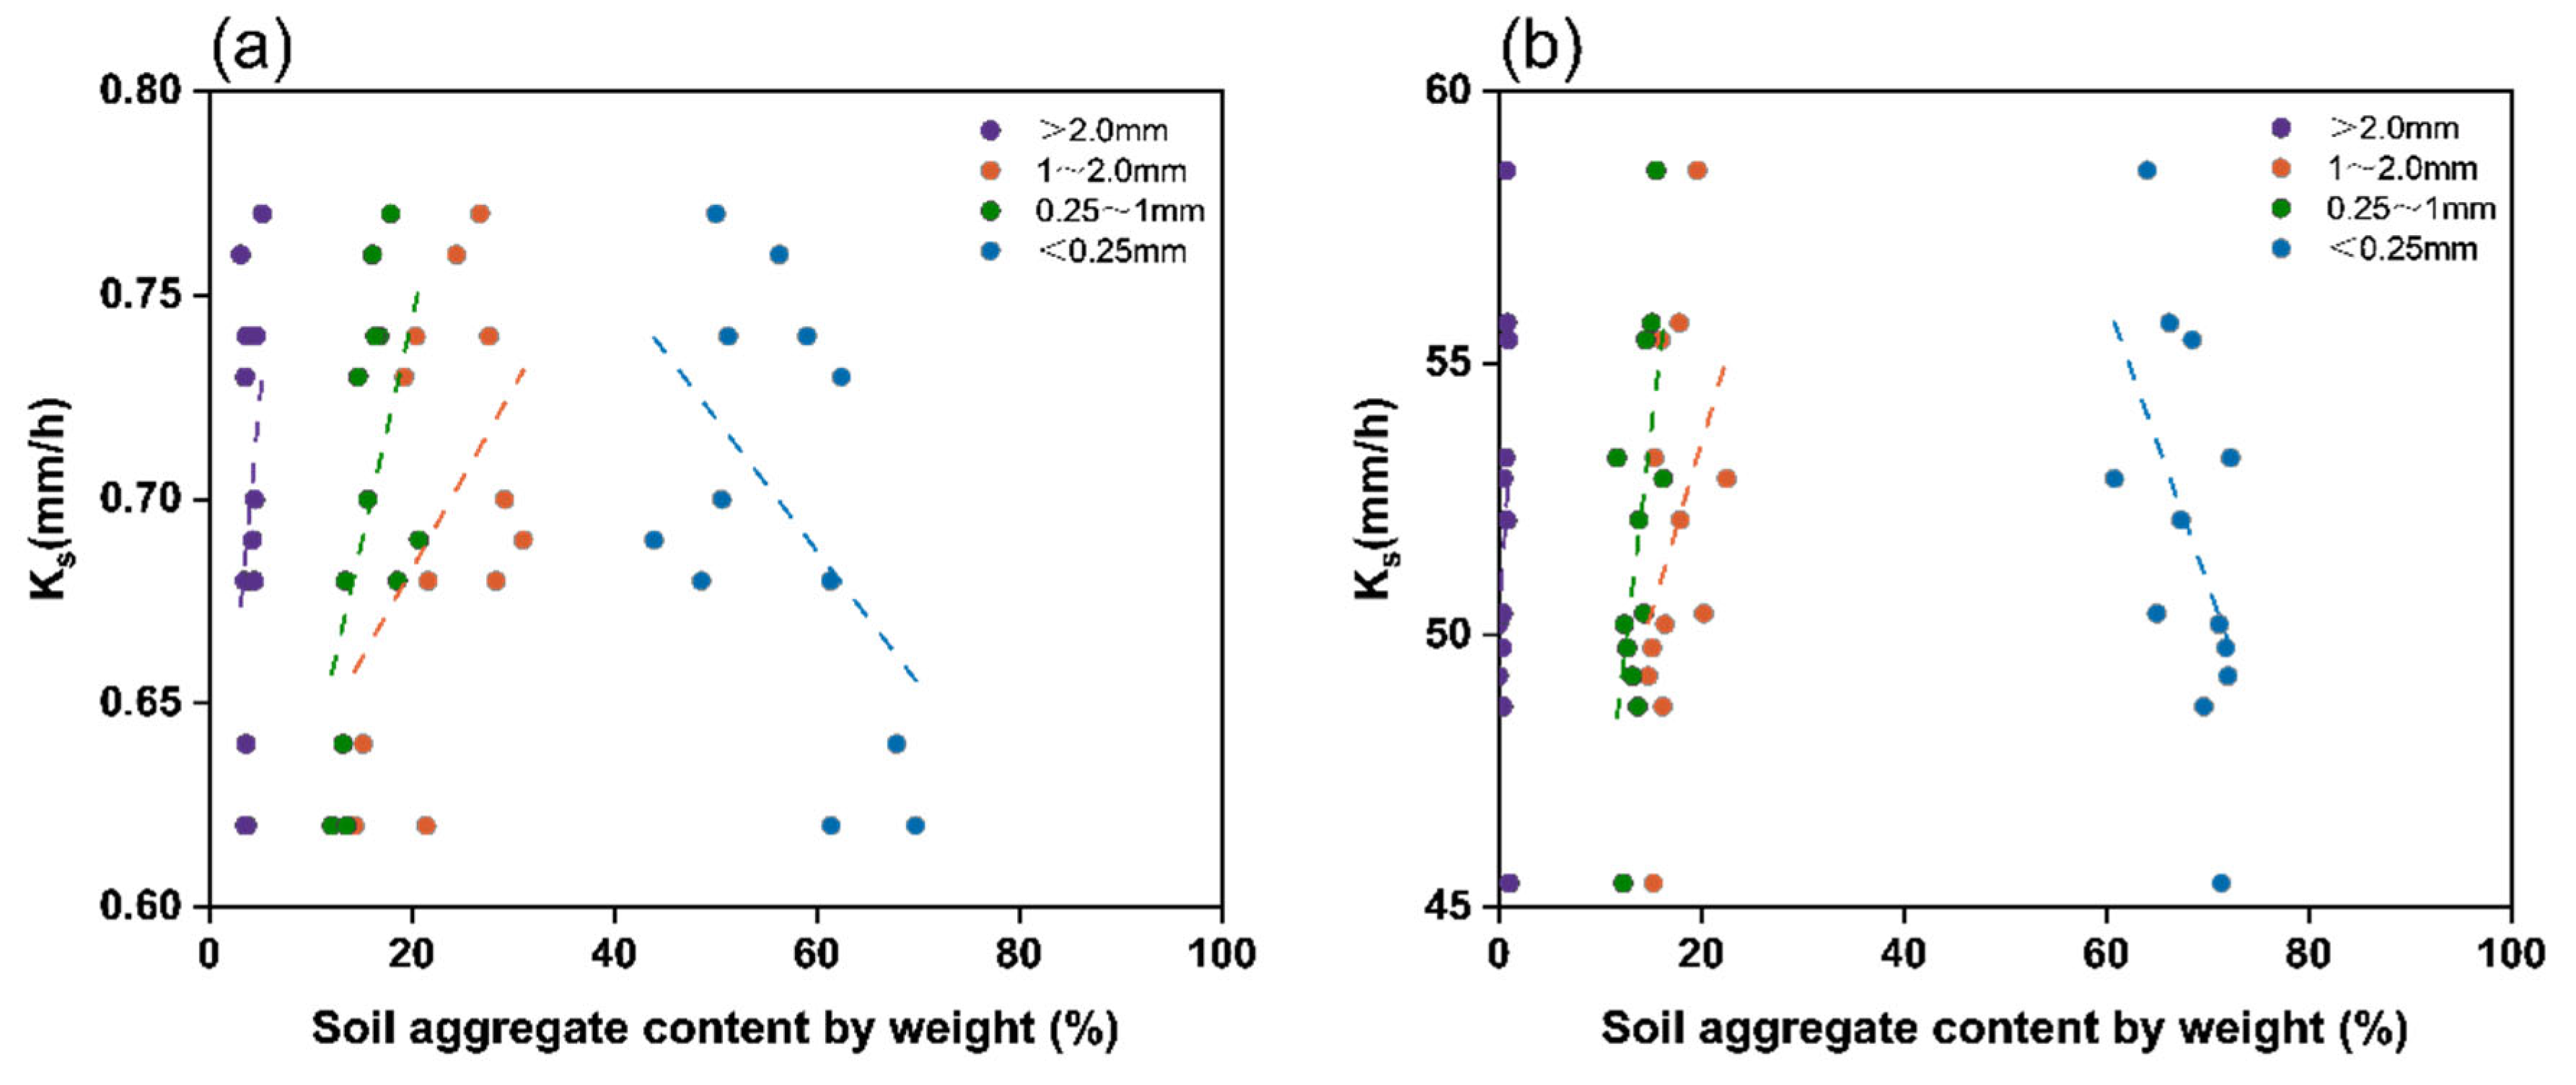
3.2.1. Saturated Hydraulic Conductivity

As a crucial indicator of soil permeability, the Ks is important for predicting water movement and solute transport in saline and sodic soils [66]. However, the Ks tends to exhibit significant spatial variability, which can vary over several orders of magnitude even at small spatial scales [4], as the Ks is influenced by a variety of biotic and abiotic factors in complex manners [63]. In particular, saline and sodic soils usually display a low Ks, since cations in soils reduce the effective pore space by dispersing soil particles [67]. Here, the impacts of salts on the Ks, including the NaCl and CaCl2 that commonly exist in coastal regions, were examined and the results are reported in Table 2.
For silty clay soil, as the NaCl content in the soils increased from 2.2 g/kg to 14.1 g/kg, the Ks initially increased from 0.62 mm/h to 0.77 mm/h, and then dropped to 0.68 mm/h. A quadratic polynomial equation was used to describe the correlation between the NaCl content and Ks (Figure 4a). It suggested the existence of a salinity threshold of roughly 10 g/kg, below which the Ks showed a significant positive correlation with the NaCl content, while, above which, a negative correlation emerged (Figure 4a). For sandy loam soil, instead of a downward parabolic relationship, a weak positive correlation existed between the NaCl content and Ks. When the NaCl content increased from 2.3 g/kg to 14.6 g/kg, the Ks increased from 45.44 mm/h to 58.55 mm/h (Figure 4b). By comparison, under the influence of CaCl2, a positive correlation still existed between the CaCl2 content and Ks for sandy loam soil, while the downward parabolic relationship between the NaCl content and Ks was replaced by a strong positive correlation between the CaCl2 content and Ks for silty clay soil. Specifically, when the CaCl2 content increased from 1.7 g/kg to 14.3 g/kg in sandy clay, the Ks rose from 45.27 mm/h to 78.49 mm/h. Meanwhile, when the CaCl2 content in silty clay soil increased from 2.0 g/kg to 14.1 g/kg, the Ks increased from 0.63 mm/h to 0.97 mm/h. It should be noted that, at similar salinity levels for both NaCl and CaCl2, the Ks of sandy loam soil was approximately one order of magnitude higher than that of silty clay soil due to the coarser texture of sandy loam soil soils. Nevertheless, Figure 4 demonstrates the nontrivial impact of soil salinity on the Ks, which can have important implications for simulating water movement and solute transport in coastal regions [68].
The change in the Ks was positively related to the proportion of macroaggregates that were altered by the salinity, while negatively related with the proportion of microaggregates (Figure 5). For both the NaCl and CaCl2 treatments, the Ks of sandy loam soil always showed a positive correlation with the salt content as newly formed macroaggregates enlarged the soil pore space. Similar results still held for the Ks of silty clay soil, except when the NaCl content was above a certain threshold (e.g., 9.37 g/kg in this study). This was because, beyond this threshold, further increases in the Na+ concentrations caused some aggregates to break and collapse, and the dispersion of clay particles clogged the pore space, leading to a decreased Ks. In contrast, unlike the Na+ that dispersed the clay particles, Ca2+ acted as a flocculant and promoted aggregate formation in silty clay soil. Therefore, opposite effects on soil aggregates resulted from Na+ and Ca2+.

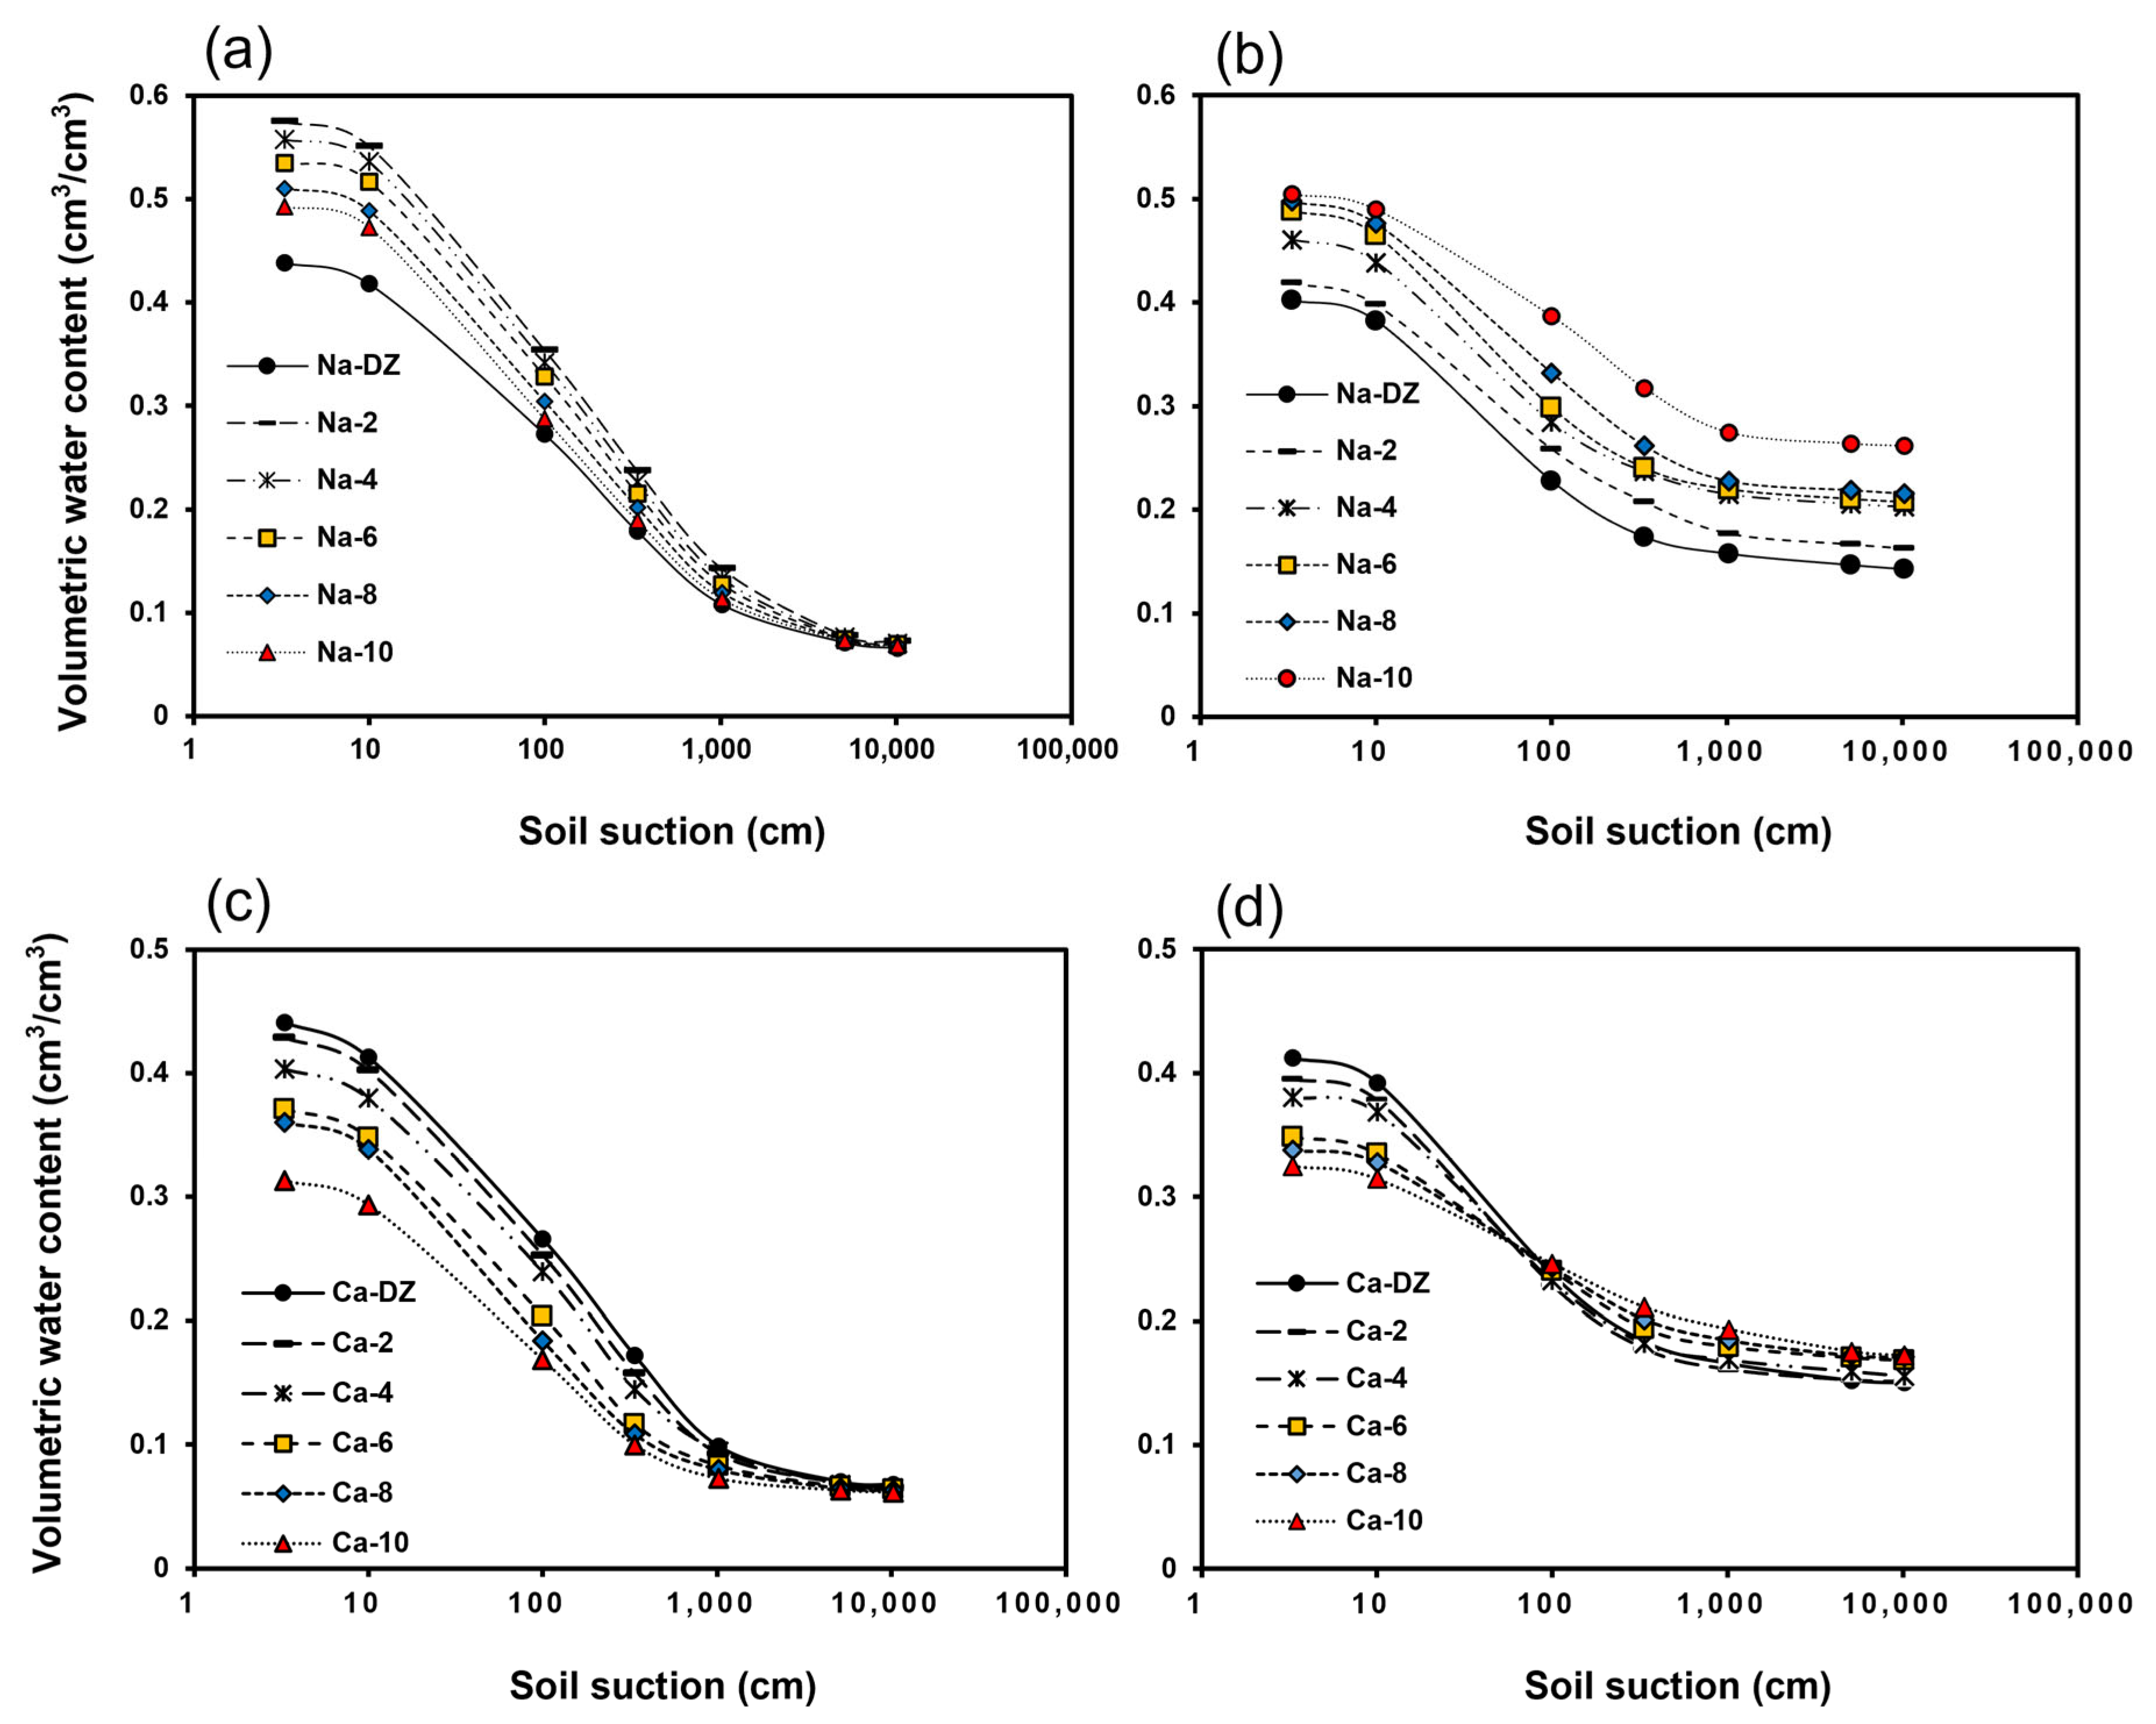
3.2.2. Soil Water-Retention Curves

Figure 6 shows the SWRCs for silty clay soil and sandy loam soil with different NaCl and CaCl2 treatments. For sandy loam soil, the soil moisture content from the Na-2 to Na-10 treatments was higher than that of the Na-DZ treatment at the same suctions, indicating increased SWHCs due to the impact of NaCl (Figure 6a). However, as the Na+ concentrations gradually increased from Na-2 to Na-10, the SWRCs shifted downwards, suggesting reduced SWHCs with increasing Na+ concentrations. The dispersion of clay particles due to slightly elevated Na+ concentrations led to higher specific surface areas and greater charges on the soil particles [69], which, in turn, enhanced the SWHCs [70]; however, further increases in the Na+ concentrations reduced the aggregate stability [25], resulting in reduced SWHCs. Particularly, the SWHCs increased significantly at suctions <1000 cm as compared to that of the Na-DZ treatment, while those SWRCs showed less variations at suctions >1000 cm, indicating that increased Na+ concentrations did not significantly affect the soil water-holding properties at dry conditions. When soils are dry, soil water exists mainly in the form of hygroscopic water that is tightly bound to soil particles [71], resulting in the weak impact of salinity on the SWHCs [13].
For silty clay soil, the soil moisture content from the Na-2 to Na-10 treatments was also higher than that of the Na-DZ treatment at the same suctions; however, the SWHCs showed a clear upward trend with increasing Na+ concentrations at all suction levels (Figure 6b). This was primarily because the response of the soils to sodicity depended on the soil textures. Clay soils dominated by smectitic minerals are more susceptible to sodicity than kaolinitic soils [72]. Na+ causes clay minerals to swell, expanding their interlayer structure and creating more micropores, which enhance the capillary action, especially at high suctions [73]. Under such conditions, clay particles become more dispersed, forming lamellar structures or flocs of clay minerals [74], which further increases the capillary forces and improves the soil water-retention capacities.
By comparison, the soil moisture content in sandy loam soil was lower for the Ca-2 to Ca-10 treatments than for the Ca-DZ treatment at the same suctions. With an increasing Ca2+ content, the SWRCs shifted downwards, indicating continuous reductions in the SWHCs with increasing Ca2+ concentrations (Figure 6c). As such, the SWHCs decreased significantly with increasing Ca2+ contents when the soil suctions were <1000 cm, which was similar to the results of the NaCl treatments. However, the SWRCs leveled off at soil suctions >1000 cm, which still showed noticeable differences among the different CaCl2 treatments. In silty clay soil, when the soil suctions were <100 cm, the soil moisture content from the Ca-2 to Ca-10 treatments was lower than that of the Ca-DZ treatment at the same suctions, and decreased with increasing Ca2+ contents, indicating a negative correlation between the SWHCs and Ca2+ concentration (Figure 6d). When the soil suctions were > 100 cm, the soil moisture content for the Ca-2 to Ca-10 treatments was higher than that of the Ca-DZ treatment at the same suctions, and increased with Ca2+ contents, indicating a positive correlation between the SWHCs and Ca2+ concentration.
Overall, the impact of salinity on the SWHCs varies with the soil texture, cation type, and concentration. In sandy loam soil, Na+ causes clay particles to expand, reducing the effective pore space and thereby enhancing the SWHCs. However, as the salinity increases, the SWHCs gradually decrease. In contrast, Ca2+ promotes soil aggregation, increasing the proportion of large aggregates and consequently reducing the SWHCs [75]. In silty clay soil, at low suctions, Na+ acts as a dispersant, reducing the proportion of large pores and thus enhancing the SWHCs. Conversely, Ca2+ acts as a flocculant, increasing the proportion of large pores and reducing the SWHCs. At high suctions, the high clay content in silty clay soil leads to a contraction effect [76], forming more small pores in the soils. During drying–wetting cycles, crystalline salt particles tend to clog these small pores [77]. Therefore, SWHCs increase with increasing Na+ and Ca2+ contents.

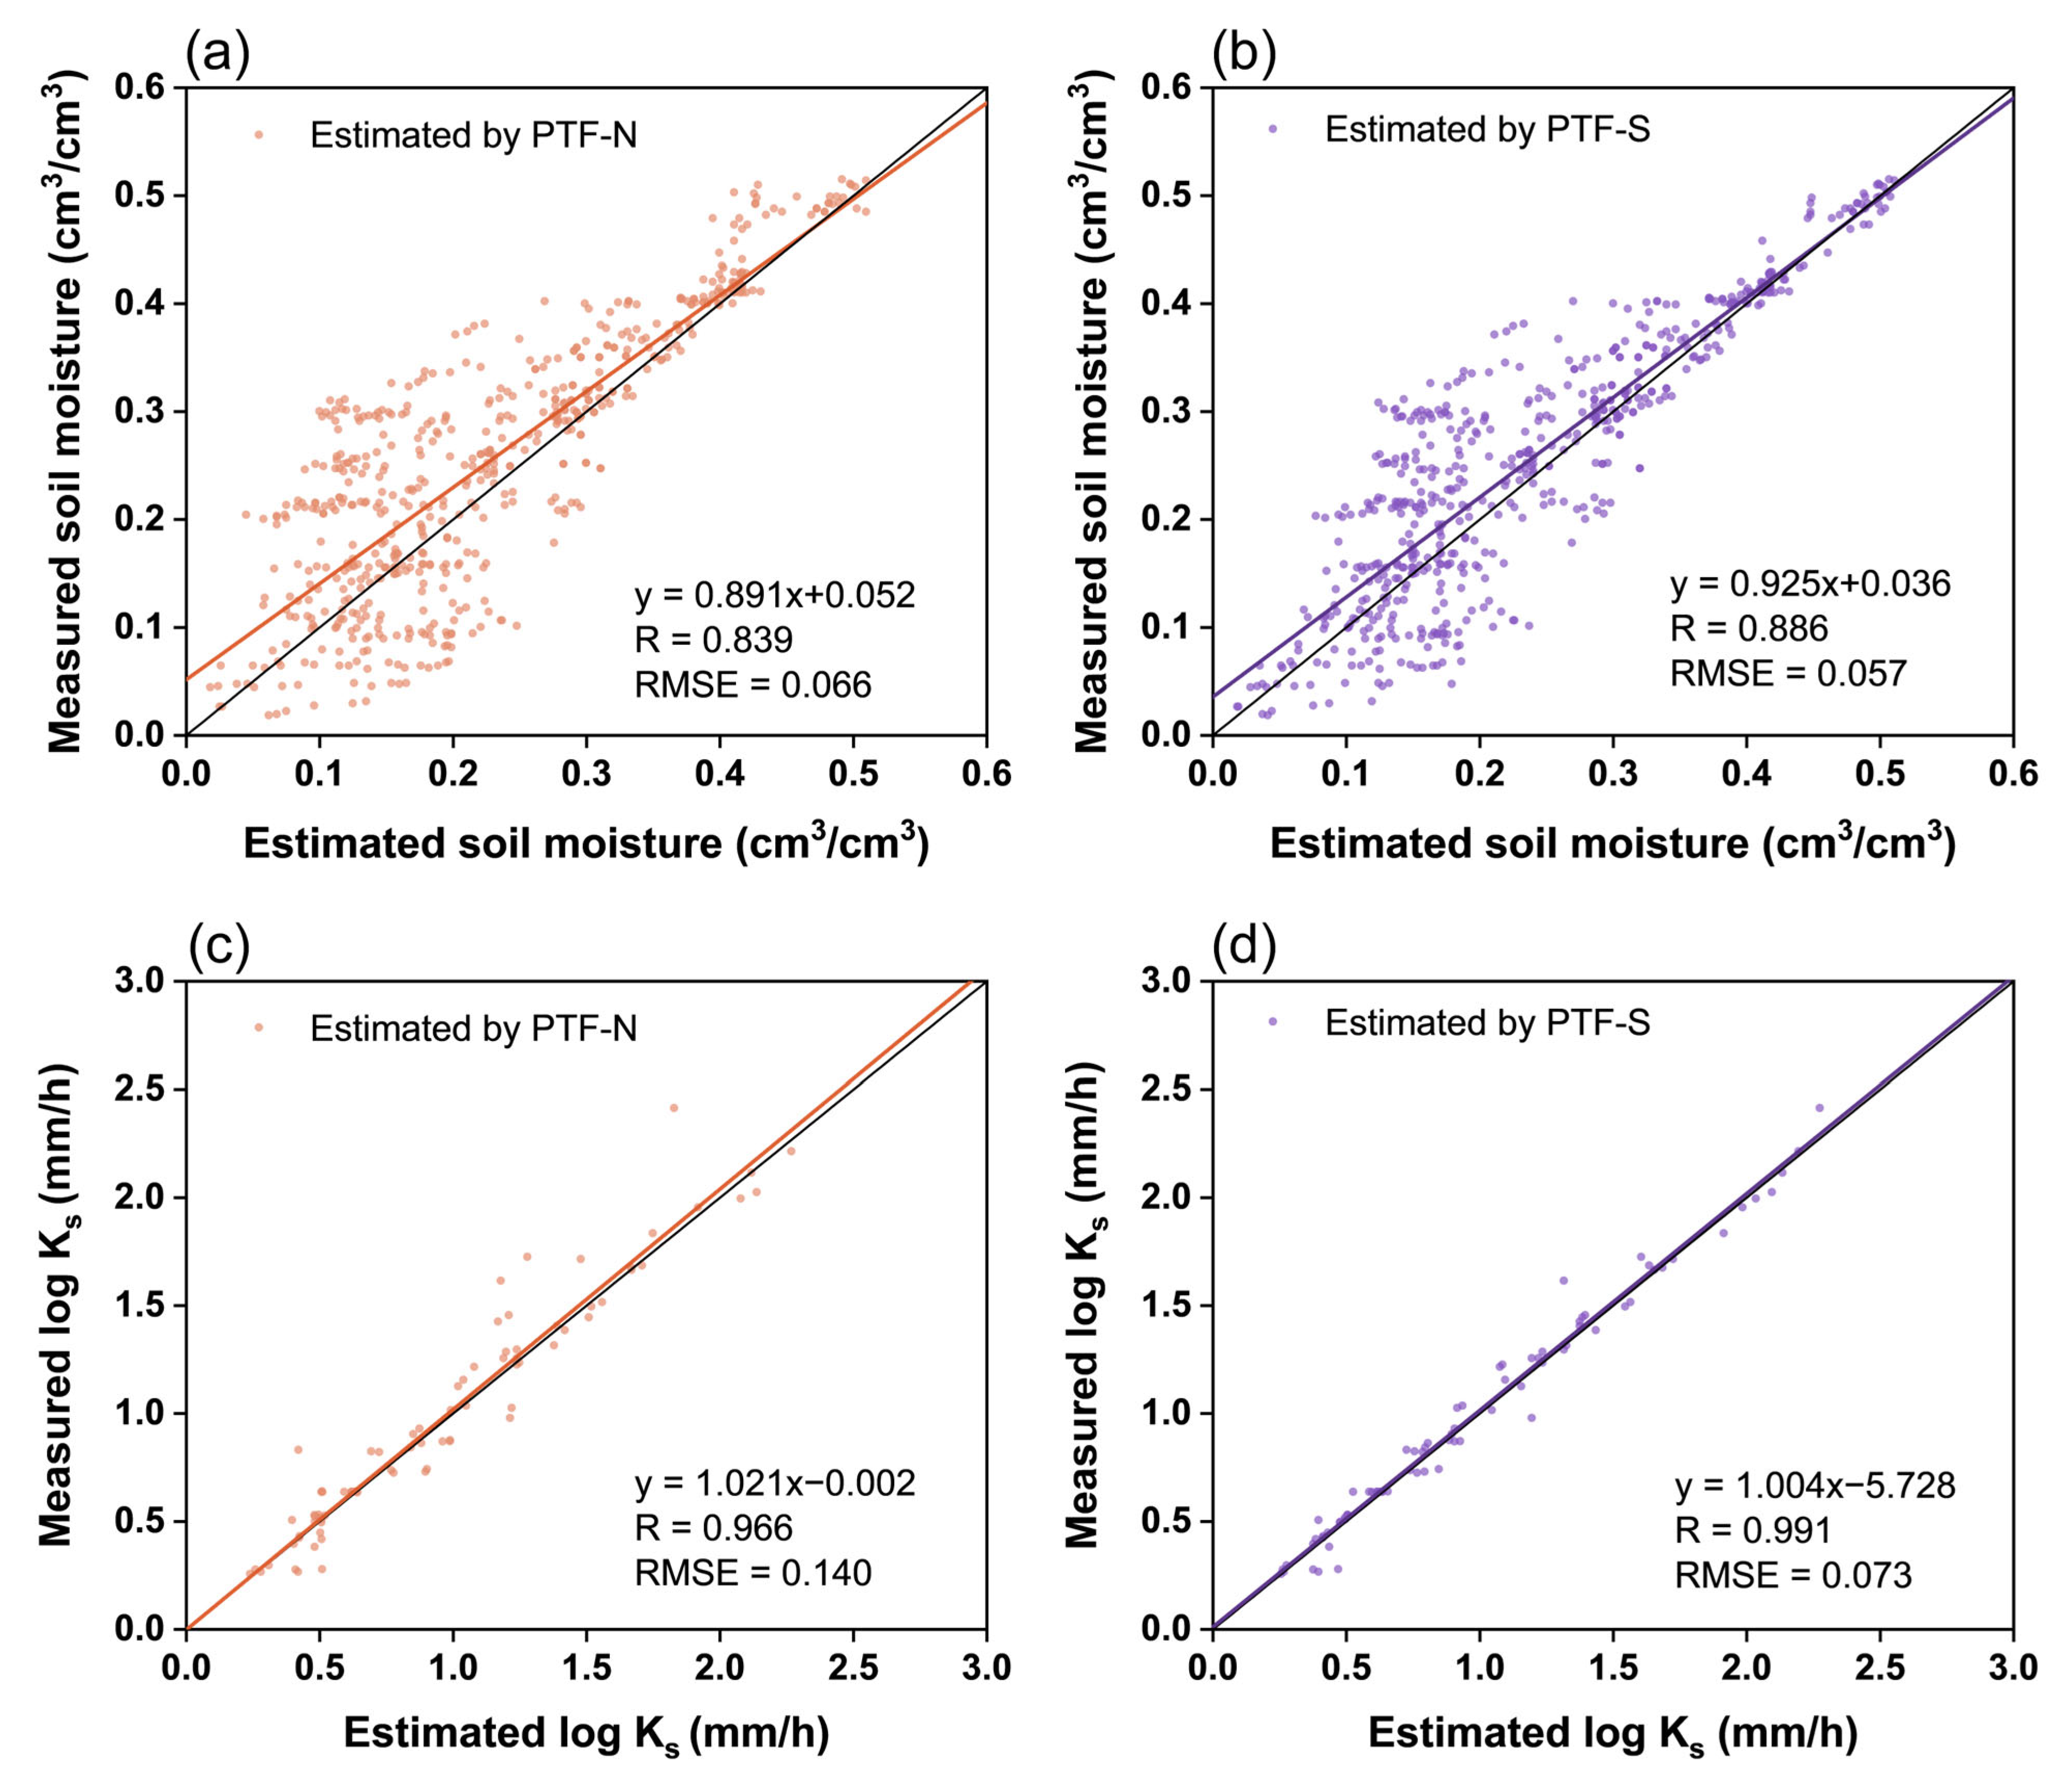
3.3. Peodotransfer Functions for Saline Soils

In this study, a dataset was compiled from the experimental results, including the SA, CI, SI, BD, SOM, pH, EC, and CEC. Using the multiple stepwise regression method, the following two PTFs were developed from this dataset: a traditional model that excludes salinity variables (PTF-N) and one that includes the EC and CEC (PTF-S). To compare the accuracy of the PTF-N and PTF-S models, the Ks and volumetric soil moisture content at six suction levels (0, 330, 1000, 3000, 5000, and 15,000 cm) were computed based on the vG parameters estimated by the PTF-N and PTF-S models, which were then compared to measured values as shown in Figure 7. For the PTF-N model, the Pearson correlation coefficient (R) between the measured and estimated soil moisture content was 0.839 with the root mean square error (RMSE) of 0.066 cm3/cm3, while the R was 0.966 and the RMSE was 0.140 mm/h between the measured and estimated log Ks. By comparison, the results from the PTF-S model showed that the R was 0.886 and the RMSE was 0.057 cm3/cm3 for the soil water content, and the R was 0.991 and the RMSE was 0.073 mm/h for the log Ks. Overall, the PTF-S model outperformed the PTF-N model for predicting the soil moisture content and Ks, demonstrating that the inclusion of the EC and CEC as additional variables could significantly improve the accuracy of the PTFs for predicting the hydraulic properties (e.g., the parameters of the vG model and Ks) of saline soils.
To further validate the salinity-based PTFs, ten PTF-S models with different parameter sets were developed from the newly obtained soil dataset using the multiple stepwise regression method. The estimated vG parameters, along with the coefficients of the ten PTF-S models, are reported in the Supplemental Materials (Tables S3–S7). Based on those PTF-S models, the RMSE values derived from both the training and validation datasets are reported for the soil moisture content in Table 3 and for the Ks in Table 4. The results showed that all of the PTF-S models could reasonably simulate the soil moisture content and Ks for high-salinity soil in the study region. Specifically, the RMSEs for estimating the soil moisture content ranged from 0.055 to 0.066 cm3/cm3 for the training set and from 0.061 to 0.090 cm3/cm3 for the validation set. The RMSEs for simulating the log Ks ranged from 0.147 to 0.161 mm/h for the training set and from 0.142 to 0.185 mm/h for the validation set. As expected, the results of the validations were comparatively lower. Nonetheless, the PTF-S models still produced better validation results than those of the PTF-N models.
Numerous studies have developed new PTFs for coastal areas by integrating diverse soil and geographical parameters. For instance, Obi et al. [78] used a stepwise multiple regression method to include topographic factors (e.g., elevation, slope, and aspect) in classical PTFs for coastal plain soils, but without accounting for the salinity effects. The RMSE values of the soil moisture estimated by the PTFs in their study ranged from 0.01 cm3/cm3 to 2.31 cm3/cm3, with the minimum value being smaller than that of the PTF-S in our study; however, the RMSEs exhibited greater variability and the maximum value was considerably higher than ours. This comparison further suggested that the inclusion of the EC and CEC in the PTFs could offer more consistent and stable predictions compared to those from the PTFs based on topographic variables. We also emphasize that, since the PTF-S model developed in this study was primarily based on soil samples from the Bohai Rim region in Tianjin, its performance in arid and inland saline soils warrants further investigation.

4. Conclusions

This study investigated the impact of salinity on soil structure and hydraulic properties, and developed salinity-based PTFs for coastal soils. The results showed that salinity significantly influenced soil aggregates and hydraulic properties, with larger aggregates (sizes between 0.25 and 2 mm) forming at higher salinity levels, particularly for silty clay soil. The Na+ content was positively correlated with the Ks for sandy loam soil, while it increased the Ks up to a certain threshold for silty clay soil. The Ca2+ consistently enhanced the Ks regardless of the soil texture. Salinity reduced the SWHCs for sandy loam soil regardless of the cation types, whereas, in silty clay soil, the Na+ increased the SWHCs, and Ca2+ had different effects depending on the soil suction levels. The salinity-based PTF-S model, incorporating the EC and CEC, predicted the volumetric water content more accurately than the PTF-N model, which excluded salinity factors.
This study’s limitations lie in the NaCl-dominated salinity and the limited salinity parameters in the PTF-S, which may restrict its applicability to other saline soils. Future research should explore these variables in more diverse contexts.

Supplementary Materials

The following supporting information can be downloaded at: https://www.mdpi.com/article/10.3390/land13122077/s1.

Author Contributions

X.Z. and Y.Z. are the main authors of this study, responsible for the laboratory analysis, data processing, paper-writing, and drawing. T.W. is the main instructor of this study. Q.H. assisted with the data processing methods and paper-writing. All authors have read and agreed to the published version of the manuscript.

Funding

This work was supported by the National Natural Scientific Foundation of China (42171036 and 42293262) and Tianjin Municipal Science and Technology Bureau (24ZYJDJC00340).

Data Availability Statement

The raw data supporting the conclusions of this article will be made available by the authors on request.

Conflicts of Interest

The authors declare no conflicts of interest.

References

  1. Sun, J.; Kang, Y.; Wan, S.; Hu, W.; Jiang, S.; Zhang, T. Soil Salinity Management with Drip Irrigation and Its Effects on Soil Hydraulic Properties in North China Coastal Saline Soils. Agric. Water Manag. 2012, 115, 10–19. [Google Scholar] [CrossRef]
  2. Archer, N.A.L.; Bonell, M.; Coles, N.; MacDonald, A.M.; Auton, C.A.; Stevenson, R. Soil Characteristics and Landcover Relationships on Soil Hydraulic Conductivity at a Hillslope Scale: A View towards Local Flood Management. J. Hydrol. 2013, 497, 208–222. [Google Scholar] [CrossRef]
  3. Feki, M.; Ravazzani, G.; Ceppi, A.; Mancini, M. Influence of Soil Hydraulic Variability on Soil Moisture Simulations and Irrigation Scheduling in a Maize Field. Agric. Water Manag. 2018, 202, 183–194. [Google Scholar] [CrossRef]
  4. Wang, T.; Zlotnik, V.A.; Wedin, D.; Wally, K.D. Spatial Trends in Saturated Hydraulic Conductivity of Vegetated Dunes in the Nebraska Sand Hills: Effects of Depth and Topography. J. Hydrol. 2008, 349, 88–97. [Google Scholar] [CrossRef]
  5. Ben-Hur, M.; Yolcu, G.; Uysal, H.; Lado, M.; Paz, A. Soil Structure Changes: Aggregate Size and Soil Texture Effects on Hydraulic Conductivity under Different Saline and Sodic Conditions. Soil Res. 2009, 47, 688–696. [Google Scholar] [CrossRef]
  6. Lu, J.; Zhang, Q.; Werner, A.D.; Li, Y.; Jiang, S.; Tan, Z. Root-Induced Changes of Soil Hydraulic Properties—A Review. J. Hydrol. 2020, 589, 125203. [Google Scholar] [CrossRef]
  7. Robinson, D.A.; Nemes, A.; Reinsch, S.; Radbourne, A.; Bentley, L.; Keith, A.M. Global Meta-Analysis of Soil Hydraulic Properties on the Same Soils with Differing Land Use. Sci. Total Environ. 2022, 852, 158506. [Google Scholar] [CrossRef]
  8. Wang, T.; Wedin, D.; Zlotnik, V.A. Field Evidence of a Negative Correlation between Saturated Hydraulic Conductivity and Soil Carbon in a Sandy Soil. Water Resour. Res. 2009, 45. [Google Scholar] [CrossRef]
  9. Jarvis, N.; Koestel, J.; Messing, I.; Moeys, J.; Lindahl, A. Influence of Soil, Land Use and Climatic Factors on the Hydraulic Conductivity of Soil. Hydrol. Earth Syst. Sci. 2013, 17, 5185–5195. [Google Scholar] [CrossRef]
  10. Sullivan, P.L.; Billings, S.A.; Hirmas, D.; Li, L.; Zhang, X.; Ziegler, S.; Murenbeeld, K.; Ajami, H.; Guthrie, A.; Singha, K.; et al. Embracing the Dynamic Nature of Soil Structure: A Paradigm Illuminating the Role of Life in Critical Zones of the Anthropocene. Earth-Sci. Rev. 2022, 225, 103873. [Google Scholar] [CrossRef]
  11. Hu, W.; Shao, M.; Wang, Q.; Fan, J.; Horton, R. Temporal Changes of Soil Hydraulic Properties under Different Land Uses. Geoderma 2009, 149, 355–366. [Google Scholar] [CrossRef]
  12. Baranian Kabir, E.; Bashari, H.; Bassiri, M.; Mosaddeghi, M.R. Effects of Land-Use/Cover Change on Soil Hydraulic Properties and Pore Characteristics in a Semi-Arid Region of Central Iran. Soil Tillage Res. 2020, 197, 104478. [Google Scholar] [CrossRef]
  13. Tang, S.; She, D.; Wang, H. Effect of Salinity on Soil Structure and Soil Hydraulic Characteristics. Can. J. Soil. Sci. 2021, 101, 62–73. [Google Scholar] [CrossRef]
  14. Hopmans, J.W.; Qureshi, A.S.; Kisekka, I.; Munns, R.; Grattan, S.R.; Rengasamy, P.; Ben-Gal, A.; Assouline, S.; Javaux, M.; Minhas, P.S.; et al. Chapter One—Critical Knowledge Gaps and Research Priorities in Global Soil Salinity. In Advances in Agronomy; Sparks, D.L., Ed.; Academic Press: Cambridge, MA, USA, 2021; Volume 169, pp. 1–191. [Google Scholar]
  15. Pereira, P.; Bogunovic, I.; Muñoz-Rojas, M.; Brevik, E.C. Soil Ecosystem Services, Sustainability, Valuation and Management. Curr. Opin. Environ. Sci. Health 2018, 5, 7–13. [Google Scholar] [CrossRef]
  16. Cuevas, J.; Daliakopoulos, I.N.; del Moral, F.; Hueso, J.J.; Tsanis, I.K. A Review of Soil-Improving Cropping Systems for Soil Salinization. Agronomy 2019, 9, 295. [Google Scholar] [CrossRef]
  17. Bazihizina, N.; Barrett-Lennard, E.G.; Colmer, T.D. Plant Growth and Physiology under Heterogeneous Salinity. Plant Soil 2012, 354, 1–19. [Google Scholar] [CrossRef]
  18. Cheeseman, J.M. The Evolution of Halophytes, Glycophytes and Crops, and Its Implications for Food Security under Saline Conditions. New Phytol. 2015, 206, 557–570. [Google Scholar] [CrossRef]
  19. Ramos, T.B.; Šimůnek, J.; Gonçalves, M.C.; Martins, J.C.; Prazeres, A.; Castanheira, N.L.; Pereira, L.S. Field Evaluation of a Multicomponent Solute Transport Model in Soils Irrigated with Saline Waters. J. Hydrol. 2011, 407, 129–144. [Google Scholar] [CrossRef]
  20. Lekakis, E.H.; Antonopoulos, V.Z. Modeling the Effects of Different Irrigation Water Salinity on Soil Water Movement, Uptake and Multicomponent Solute Transport. J. Hydrol. 2015, 530, 431–446. [Google Scholar] [CrossRef]
  21. Mao, W.; Zhu, Y.; Wu, J.; Ye, M.; Yang, J. Modelling the Salt Accumulation and Leaching Processes in Arid Agricultural Areas with a New Mass Balance Model. J. Hydrol. 2020, 591, 125329. [Google Scholar] [CrossRef]
  22. Crescimanno, G.; Iovino, M.; Provenzano, G. Influence of Salinity and Sodicity on Soil Structural and Hydraulic Characteristics. Soil Sci. Soc. Am. J. 1995, 59, 1701–1708. [Google Scholar] [CrossRef]
  23. Adeyemo, T.; Kramer, I.; Levy, G.J.; Mau, Y. Salinity and Sodicity Can Cause Hysteresis in Soil Hydraulic Conductivity. Geoderma 2022, 413, 115765. [Google Scholar] [CrossRef]
  24. Odeh, I.O.A.; Onus, A. Spatial Analysis of Soil Salinity and Soil Structural Stability in a Semiarid Region of New South Wales, Australia. Environ. Manag. 2008, 42, 265–278. [Google Scholar] [CrossRef] [PubMed]
  25. Singh, P.; Sharma, S.; Nisar, S.; Choudhary, O.P. Structural Stability and Organic Matter Stabilization in Soils: Differential Impacts of Soil Salinity and Sodicity. J. Soil Sci. Plant Nutr. 2023, 23, 1751–1773. [Google Scholar] [CrossRef]
  26. Abbaslou, H.; Hadifard, H.; Ghanizadeh, A.R. Effect of Cations and Anions on Flocculation of Dispersive Clayey Soils. Heliyon 2020, 6, e03462. [Google Scholar] [CrossRef]
  27. Pihlap, E.; Steffens, M.; Kögel-Knabner, I. Initial Soil Aggregate Formation and Stabilisation in Soils Developed from Calcareous Loess. Geoderma 2021, 385, 114854. [Google Scholar] [CrossRef]
  28. Xing, X.; Kang, D.; Ma, X. Differences in Loam Water Retention and Shrinkage Behavior: Effects of Various Types and Concentrations of Salt Ions. Soil Tillage Res. 2017, 167, 61–72. [Google Scholar] [CrossRef]
  29. Rezaei, M.; Shahbazi, K.; Shahidi, R.; Davatgar, N.; Bazargan, K.; Rezaei, H.; Saadat, S.; Seuntjens, P.; Cornelis, W. How to Relevantly Characterize Hydraulic Properties of Saline and Sodic Soils for Water and Solute Transport Simulations. J. Hydrol. 2021, 598, 125777. [Google Scholar] [CrossRef]
  30. Olorunfemi, I.; Fasinmirin, J.; Ojo, A. Modeling Cation Exchange Capacity and Soil Water Holding Capacity from Basic Soil Properties. EJSS 2016, 5, 266–274. [Google Scholar] [CrossRef]
  31. Nam, S.; Gutierrez, M.; Diplas, P.; Petrie, J.; Wayllace, A.; Lu, N.; Muñoz, J.J. Comparison of Testing Techniques and Models for Establishing the SWCC of Riverbank Soils. Eng. Geol. 2010, 110, 1–10. [Google Scholar] [CrossRef]
  32. Assouline, S. What Can We Learn From the Water Retention Characteristic of a Soil Regarding Its Hydrological and Agricultural Functions? Review and Analysis of Actual Knowledge. Water Resour. Res. 2021, 57, e2021WR031026. [Google Scholar] [CrossRef]
  33. Vereecken, H.; Weynants, M.; Javaux, M.; Pachepsky, Y.; Schaap, M.G.; van Genuchten, M.T. Using Pedotransfer Functions to Estimate the van Genuchten–Mualem Soil Hydraulic Properties: A Review. Vadose Zone J. 2010, 9, 795–820. [Google Scholar] [CrossRef]
  34. Patil, N.G.; Singh, S.K. Pedotransfer Functions for Estimating Soil Hydraulic Properties: A Review. Pedosphere 2016, 26, 417–430. [Google Scholar] [CrossRef]
  35. Ezlit, Y.D.; Bennett, J.M.; Raine, S.R.; Smith, R.J. Modification of the McNeal Clay Swelling Model Improves Prediction of Saturated Hydraulic Conductivity as a Function of Applied Water Quality. Soil Sci. Soc. Am. J. 2013, 77, 2149–2156. [Google Scholar] [CrossRef]
  36. Khataar, M.; Mosaddeghi, M.R.; Amiri Chayjan, R.; Mahboubi, A.A. Prediction of Water Quality Effect on Saturated Hydraulic Conductivity of Soil by Artificial Neural Networks. Paddy Water Env. 2018, 16, 631–641. [Google Scholar] [CrossRef]
  37. Klopp, H.; Arriaga, F.; Daigh, A.; Bleam, W. Analysis of Pedotransfer Functions to Predict the Effects of Salinity and Sodicity on Saturated Hydraulic Conductivity of Soils. Geoderma 2020, 362, 114078. [Google Scholar] [CrossRef]
  38. Zhao, H.; Gu, B.; Chen, D.; Tang, J.; Xu, X.; Qiao, Z.; Wang, J. Physicochemical Properties and Salinization Characteristics of Soils in Coastal Land Reclamation Areas: A Case Study of China-Singapore Tianjin Eco-City. Heliyon 2022, 8, e12629. [Google Scholar] [CrossRef]
  39. Song, Y.; Gao, M.; Xu, Z.; Wang, J.; Bi, M. Temporal and Spatial Characteristics of Soil Salinization and Its Impact on Cultivated Land Productivity in the BOHAI Rim Region. Water 2023, 15, 2368. [Google Scholar] [CrossRef]
  40. Callesen, I.; Palviainen, M.; Armolaitis, K.; Rasmussen, C.; Kjønaas, O.J. Soil Texture Analysis by Laser Diffraction and Sedimentation and Sieving–Method and Instrument Comparison with a Focus on Nordic and Baltic Forest Soils. Front. For. Glob. Change 2023, 6. [Google Scholar] [CrossRef]
  41. Michalski, R. Applications of Ion Chromatography for the Determination of Inorganic Cations. Crit. Rev. Anal. Chem. 2009, 39, 230–250. [Google Scholar] [CrossRef]
  42. HJ8892017; Soil Quality-Determination of Cation Exchange Capacity (CEC)-Hexamminecobalt Trichloride Solution-Spectrophotometric Method. Ministry of Environmental Protection of China: Suzhou, China, 2017.
  43. HJ6152011; Soil–Determination of Organic Carbon–Potassium Dichromate Oxidation Spectrophotometric Method. Ministry of Environmental Protection of China: Beijing, China, 2011.
  44. Jury, W.A.; Horton, R. Soil Physics; John Wiley & Sons: Hoboken, NJ, USA, 2004; ISBN 978-0-471-05965-3. [Google Scholar]
  45. Yoder, R.E. A Direct Method of Aggregate Analysis of Soils and a Study of the Physical Nature of Erosion Losses. Agron. J. 1936, 28, 337–351. [Google Scholar] [CrossRef]
  46. Fu, Y.; Zhang, Y.; Gu, H.; Chen, X.; Zhao, Y.; Wang, H. Influence of Slaking on the Size Distributions of Water-Stable Aggregates. Soil Sci. Soc. Am. J. 2022, 86, 1241–1248. [Google Scholar] [CrossRef]
  47. McNeal, B.L. Prediction of the Effect of Mixed-Salt Solutions on Soil Hydraulic Conductivity. Soil Sci. Soc. Am. J. 1968, 32, 190–193. [Google Scholar] [CrossRef]
  48. Horn, R.; Smucker, A. Structure Formation and Its Consequences for Gas and Water Transport in Unsaturated Arable and Forest Soils. Soil Tillage Res. 2005, 82, 5–14. [Google Scholar] [CrossRef]
  49. Corey, A. Mechanics of Heterogeneous Fluids in Porous Media; Water Resources Publications: Littleton, CO, USA, 1977; ISBN 978-0-918334-17-6. [Google Scholar]
  50. Bittelli, M.; Flury, M. Errors in Water Retention Curves Determined with Pressure Plates. Soil Sci. Soc. Am. J. 2009, 73, 1453–1460. [Google Scholar] [CrossRef]
  51. Ding, S.; Zuo, C.; Liu, D.; Li, L.; Chen, J. Soil-Water Characteristics of Unsaturated Residual Soil and Estimation of Matric Suction. J. Yangtze River Sci. Res. Inst. 2016, 33, 98. [Google Scholar] [CrossRef]
  52. van Genuchten, M.T. A Closed-Form Equation for Predicting the Hydraulic Conductivity of Unsaturated Soils. Soil Sci. Soc. Am. J. 1980, 44, 892–898. [Google Scholar] [CrossRef]
  53. Van Genuchten, M.V.; Leij, F.; Yates, S. The RETC Code for Quantifying the Hydraulic Functions of Unsaturated Soils; U.S. Environmental Protection Agency: Washington, DC, USA, 1991; EPA/600/2-91/065 (NTIS 92-119668); Available online: https://www.pc-progress.com/Documents/programs/retc.pdf (accessed on 30 November 2024).
  54. Schaap, M.G.; Leij, F.J. Improved Prediction of Unsaturated Hydraulic Conductivity with the Mualem-van Genuchten Model. Soil Sci. Soc. Am. J. 2000, 64, 843–851. [Google Scholar] [CrossRef]
  55. Streiner, D.L. Regression in the Service of the Superego: The Do’s and Don’ts of Stepwise Multiple Regression. Can. J. Psychiatry 1994, 39, 191–196. [Google Scholar] [CrossRef]
  56. Schillaci, C.; Perego, A.; Valkama, E.; Märker, M.; Saia, S.; Veronesi, F.; Lipani, A.; Lombardo, L.; Tadiello, T.; Gamper, H.A.; et al. New Pedotransfer Approaches to Predict Soil Bulk Density Using WoSIS Soil Data and Environmental Covariates in Mediterranean Agro-Ecosystems. Sci. Total Environ. 2021, 780, 146609. [Google Scholar] [CrossRef]
  57. Yao, R.-J.; Yang, J.-S.; Wu, D.-H.; Li, F.-R.; Gao, P.; Wang, X.-P. Evaluation of Pedotransfer Functions for Estimating Saturated Hydraulic Conductivity in Coastal Salt-Affected Mud Farmland. J. Soils Sediments 2015, 15, 902–916. [Google Scholar] [CrossRef]
  58. Haile, G.W.; Fetene, M. Assessment of Soil Erosion Hazard in Kilie Catchment, East Shoa, Ethiopia. Land Degrad. Dev. 2012, 23, 293–306. [Google Scholar] [CrossRef]
  59. Six, J.; Bossuyt, H.; Degryze, S.; Denef, K. A History of Research on the Link between (Micro)Aggregates, Soil Biota, and Soil Organic Matter Dynamics. Soil Tillage Res. 2004, 79, 7–31. [Google Scholar] [CrossRef]
  60. Gartzia-Bengoetxea, N.; González-Arias, A.; Merino, A.; Martínez de Arano, I. Soil Organic Matter in Soil Physical Fractions in Adjacent Semi-Natural and Cultivated Stands in Temperate Atlantic Forests. Soil Biol. Biochem. 2009, 41, 1674–1683. [Google Scholar] [CrossRef]
  61. Herath, H.M.S.K.; Camps-Arbestain, M.; Hedley, M. Effect of Biochar on Soil Physical Properties in Two Contrasting Soils: An Alfisol and an Andisol. Geoderma 2013, 209–210, 188–197. [Google Scholar] [CrossRef]
  62. Hillel, D. Introduction to Environmental Soil Physics; Elsevier: Amsterdam, The Netherlands, 2003; ISBN 978-0-08-049577-4. [Google Scholar]
  63. Deb, S.K.; Shukla, M.K. Variability of Hydraulic Conductivity Due to Multiple Factors. Am. J. Environ. Sci. 2012, 8, 489. [Google Scholar] [CrossRef]
  64. Seiphoori, A.; Ma, X.; Arratia, P.E.; Jerolmack, D.J. Formation of Stable Aggregates by Fluid-Assembled Solid Bridges. Proc. Natl. Acad. Sci. USA 2020, 117, 3375–3381. [Google Scholar] [CrossRef]
  65. Bell, F.G.; Maud, R.R. Dispersive Soils: A Review from a South African Perspective. Q. J. Eng. Geol. 1994, 27, 195–210. [Google Scholar] [CrossRef]
  66. Klopp, H.W.; Daigh, A.L.M. Measured Saline and Sodic Solutions Effects on Soil Saturated Hydraulic Conductivity, Electrical Conductivity and Sodium Adsorption Ratio. Arid Land Res. Manag. 2020, 34, 264–286. [Google Scholar] [CrossRef]
  67. Gamie, R.; De Smedt, F. Experimental and Statistical Study of Saturated Hydraulic Conductivity and Relations with Other Soil Properties of a Desert Soil. Eur. J. Soil Sci. 2018, 69, 256–264. [Google Scholar] [CrossRef]
  68. Dai, Y.; Wang, T.; Han, Q.; Kong, Z.; Wang, L.; Li, Y.; Lang, Y. Impacts of Vegetation and Tidal Conditions on Porewater and Salt Transport in Coastal Wetlands: Numerical Simulations and Field Evidence. J. Hydrol. 2024, 636, 131251. [Google Scholar] [CrossRef]
  69. Behbahani, A.; Ryan, R.J.; McKenzie, E.R. Impacts of Salinity on the Dynamics of Fine Particles and Their Associated Metals during Stormwater Management. Sci. Total Environ. 2021, 777, 146135. [Google Scholar] [CrossRef]
  70. Feng, Y.; Yang, J.; Zheng, J. Correlation between Soil Water Retention Capability and Soil Salt Content. Pedosphere 2000, 10, 275–280. [Google Scholar]
  71. Tuli, A.; Kosugi, K.; Hopmans, J.W. Simultaneous Scaling of Soil Water Retention and Unsaturated Hydraulic Conductivity Functions Assuming Lognormal Pore-Size Distribution. Adv. Water Resour. 2001, 24, 677–688. [Google Scholar] [CrossRef]
  72. Anderson, R.L.; Ratcliffe, I.; Greenwell, H.C.; Williams, P.A.; Cliffe, S.; Coveney, P.V. Clay Swelling—A Challenge in the Oilfield. Earth-Sci. Rev. 2010, 98, 201–216. [Google Scholar] [CrossRef]
  73. Tao, L.; Xiao-Feng, T.; Yu, Z.; Tao, G. Swelling of K+, Na+ and Ca2+-Montmorillonites and Hydration of Interlayer Cations: A Molecular Dynamics Simulation. Chin. Phys. B 2010, 19, 109101. [Google Scholar] [CrossRef]
  74. Liu, D.; Edraki, M.; Berry, L. Investigating the Settling Behaviour of Saline Tailing Suspensions Using Kaolinite, Bentonite, and Illite Clay Minerals. Powder Technol. 2018, 326, 228–236. [Google Scholar] [CrossRef]
  75. Li, Y.; Feng, G.; Tewolde, H.; Zhang, F.; Yan, C.; Yang, M. Soil Aggregation and Water Holding Capacity of Soil Amended with Agro-Industrial Byproducts and Poultry Litter. J. Soils Sediments 2021, 21, 1127–1135. [Google Scholar] [CrossRef]
  76. Romero, E.; Gens, A.; Lloret, A. Suction Effects on a Compacted Clay under Non-Isothermal Conditions. Géotechnique 2003, 53, 65–81. [Google Scholar] [CrossRef]
  77. Nie, Y.; Ni, W.; Lü, X.; Tuo, W. Exploring the Mechanical Behavior and Microstructure of Compacted Loess Subjected to Dry-Wet Cycles and Chemical Contamination. J. Rock Mech. Geotech. Eng. 2024, 16, 3673–3695. [Google Scholar] [CrossRef]
  78. Obi, J.C.; Ogban, P.I.; Ituen, U.J.; Udoh, B.T. Development of Pedotransfer Functions for Coastal Plain Soils Using Terrain Attributes. CATENA 2014, 123, 252–262. [Google Scholar] [CrossRef]
Figure 1. The study region with two sampling sites for infiltration experiments (red dots) and sampling sites for developing pedotransfer functions (black triangles).
Land 13 02077 g001
Figure 2. Setup of the centrifuge experiments for determining the soil water-retention curves.
Land 13 02077 g002
Figure 3. Effects of the NaCl content on soil aggregate size distributions for (a) silt clay and (b) sandy loam soil; y1, y2, y3, and y4, respectively, correspond to the fitted equations for the <0.25 mm, 0.25–1 mm, 1–2 mm, and >2 mm aggregate sizes.
Land 13 02077 g003
Figure 4. Effects of the NaCl and CaCl2 contents on the soil saturated hydraulic conductivity (Ks) for (a) silty clay soil and (b) sandy loam soil.
Land 13 02077 g004
Figure 5. Relationships between the agglomerate content and saturated hydraulic conductivity (Ks) for (a) silt clay and (b) sandy loam soil.
Land 13 02077 g005
Figure 6. Effects of the NaCl and CaCl2 contents on the soil water-retention curves (a,c) for sandy loam soil and (b,d) silty clay soil.
Land 13 02077 g006
Figure 7. Comparison of the measured volumetric water content and logarithm of the saturated hydraulic conductivity (log Ks) with the predicted values by the PTF-N and PTF-S models for all 80 samples. (a) and (b) are the soil moisture contents estimated by PTF-N and PTF-S, and (c) and (d) are the Ks estimated by PTF-N and PTF-S.
Land 13 02077 g007
Table 1. Basic physical and chemical properties of the tested soils for the infiltration experiments.
SiteSoil TaxonomySoil TextureEC
(dS/m)
pHBulk Density
(g/cm3)
Ks
(cm/h)
Sand
(%)
Silt
(%)
Clay
(%)
BDGTypic
Salorthids
Silt clay7.68.461.450.383.1756.3040.53
BXSTypic
Hapludalfs
Sandy loam6.97.691.401.2067.4222.1810.40
Table 2. Effect of the salt content on the saturated hydraulic conductivity (Ks) of soil.
TextureNaCl CaCl2
Content
(g/kg)
Ks
(mm/h)
Content
(g/kg)
Ks
(mm/h)
Silt clay2.210.621.980.63
2.370.642.260.61
4.450.684.450.76
4.980.624.980.72
6.440.736.440.83
7.260.747.760.84
9.540.789.850.91
9.840.7310.490.87
11.620.7211.700.97
12.130.7612.230.89
13.440.6613.380.79
14.080.6814.420.86
Sandy loam2.3445.441.7445.27
2.9249.252.5249.64
4.8554.264.7862.37
5.3050.25.2061.4
6.7255.436.6365.43
8.1548.698.2168.69
10.4252.1210.2062.06
11.2649.7711.3672.77
12.0555.7412.2569.72
12.4850.412.6876.98
13.8758.5513.7968.75
14.6452.8814.2578.49
Table 3. Root mean square error (RMSE) of the training set and validation set of 10 effective pedotransfer functions (soil volume moisture content).
Number12345678910
Training set
RMSE
(cm3/cm3)
0.0580.0590.0610.0560.0660.0610.0620.0560.0550.062
Validation set
RMSE
(cm3/cm3)
0.0630.0610.0790.0840.0690.0900.0720.0770.0670.070
Table 4. Root mean square error (RMSE) of the training set and validation set of 10 effective pedotransfer functions (log Ks).
Number12345678910
Training set
RMSE
(mm/h)
0.1530.1520.1480.1590.1540.1610.1550.1550.1470.158
Validation set
RMSE
(mm/h)
0.1670.1780.1850.1530.170.1420.180.1740.1680.172
Disclaimer/Publisher’s Note: The statements, opinions and data contained in all publications are solely those of the individual author(s) and contributor(s) and not of MDPI and/or the editor(s). MDPI and/or the editor(s) disclaim responsibility for any injury to people or property resulting from any ideas, methods, instructions or products referred to in the content.

