Article

Urban Public Space Safety Perception and the Influence of the Built Environment from a Female Perspective: Combining Street View Data and Deep Learning

1
School of Urban Design, Wuhan University, Hubei Habitat Environment Research Centre of Engineering and Technology, Wuhan 430072, China
2
Key Laboratory of Ecology and Energy Saving Study of Dense Habitat (Ministry of Education), Tongji University, Shanghai 200092, China
3
School of Geography and Information Engineering, China University of Geosciences, Wuhan 430079, China
4
College of Architecture and Urban Planning, Tongji University, Shanghai 200092, China
*
Authors to whom correspondence should be addressed.
Land 2024, 13(12), 2108; https://doi.org/10.3390/land13122108
Submission received: 4 November 2024 / Revised: 28 November 2024 / Accepted: 3 December 2024 / Published: 5 December 2024

Abstract

:
Women face disadvantages in urban public spaces due to their physiological characteristics. However, limited attention has been given to assessing safety perceptions from a female perspective and identifying the factors that influence these perceptions. Despite advancements in machine learning (ML) techniques, efficiently and accurately quantifying safety perceptions remains a challenge. This study, using Wuhan as a case study, proposes a method for ranking street safety perceptions for women by combining RankNet with Gist features. Fully Convolutional Network-8s (FCN-8s) was employed to extract built environment features, while Ordinary Least Squares (OLS) regression and Geographically Weighted Regression (GWR) were used to explore the relationship between these features and women’s safety perceptions. The results reveal the following key findings: (1) The safety perception rankings in Wuhan align with its multi-center urban pattern, with significant differences observed in the central area. (2) Built environment features significantly influence women’s safety perceptions, with the Sky View Factor, Green View Index, and Roadway Visibility identified as the most impactful factors. The Sky View Factor has a positive effect on safety perceptions, whereas the other factors exhibit negative effects. (3) The influence of built environment features on safety perceptions varies spatially, allowing the study area to be classified into three types: sky- and road-dominant, building-dominant, and greenery-dominant regions. Finally, this study proposes targeted strategies for creating safer and more female-friendly urban public spaces.

1. Introduction

According to Maslow’s Hierarchy of Needs, safety needs are considered fundamental and urgent, following the fulfillment of physiological needs. Public space often refers to the space that everyone has rights of access to and has the potential to influence their psychological and behavioral responses. Urban streets play a crucial role as components of urban public spaces, serving as vital areas for transportation, relaxation, social interaction, and commercial activities in daily life [1]. In this study, we conceptualize urban streets as integral components of urban public spaces. The way residents utilize these street functions is impacted by their perception of safety. Women, in particular, are more likely to be a target of violent crime due to their physiological characteristics, and previous studies have identified gender as a key significant factor affecting the perception of safety in public spaces [2]. Compared to men, women are generally more cautious about being alone [3], avoiding concealed spaces [4], and steering clear of areas where strangers are loitering [5]. Therefore, it is crucial to evaluate the safety of public spaces based on the perspective of women.
However, urban planning and design frequently neglect women’s needs, despite the fact that women’s lifestyles are often more affected by their surroundings compared to men. A patriarchal and misogynistic social environment, along with the “male gaze”, further undermines women’s sense of safety in public spaces [6]. As a result, unsafe public spaces may restrict women’s access to these areas and exacerbate gender inequality [6,7].
Previous studies have demonstrated that built environment features can significantly influence people’s perception of environmental safety. According to Broken Windows Theory, visual signs of environmental disorder—such as broken windows, litter, graffiti, abandoned cars, etc.—signal neglect and exert a suggestive and inducive effect, which ultimately leads to negative social consequences and an increased crime rate [8]. Given their predominant roles as caregivers, women often have a more intricate relationship with the built environment and are frequently identified as a vulnerable group [9]. The perception of safety in urban spaces is a multifaceted social–psychological phenomenon, wherein psychosocial processes and social experiences intertwine to influence the perceptions of specific environments [10]. For this reason, it is essential to consider both the physical and subjective components of the environment when studying the safety perception of public spaces [2].
With advancements in machine learning (ML) techniques, street view images analyzed through semantic segmentation and deep neural networks trained on extensive human responses have been utilized to quantify the human perception of the built environment [11]. However, local features derived from semantic segmentation, where an image is divided into pixel proportions for each element, may ignore the broader human perception of the environment. Furthermore, variations in the camera’s position during image capture can result in the built environment features acquired through semantic segmentation appearing closer to the camera and thus representing a relatively small volume in the actual scene. These discrepancies between the proportion of each analyzed feature and the perception of the actual scene can introduce errors into the results. Gist features, which extract the global features of images by simulating human vision, reflect the spatial layout of images and are primarily used for scene classification [12]. As feature vectors of machine learning, Gist features can better capture the overall impression of an image and reduce errors in feature recognition compared to semantic segmentation methods.
In general, with the development of image technology and deep learning, the exploration of the non-physical elements of urban environments through street view images is becoming increasingly sophisticated [13]. Nevertheless, there remains a lack of research focused on assessing the safety of the built environment from the perspective of female perception and analyzing the underlying factors. This study took Wuhan as an example, allowing women to browse street view images and provide safety perception evaluation labels via a pairwise comparison scoring method. Based on Gist features and the RankNet algorithm, a safety perception model from the perspective of women was constructed. The FCN-8s algorithm was employed to calculate the built environment features. Finally, this study investigated the spatial heterogeneity of built environment features impacting public space safety perception in Wuhan, with the goal of offering guidance for future urban planning and design to create more female-friendly urban spaces.

2. Literature Review

2.1. Measuring the Subjective Dimension of Safety for Women

Safety encompasses both the objective and subjective dimensions. The objective aspect of safety refers to actual dangers and hazards, while the subjective aspect involves an individual’s perception of phenomena that impact their sense of security [14]. The perception of safety is shaped by the interaction between an individual’s characteristics and their environment [15,16]. However, individuals or social groups lacking professional safety knowledge or awareness of local crime statistics often rely on subjective perceptions of safety. Therefore, incorporating perceived safety into the discussion enriches the understanding of security issues by adding psychological considerations, shifting the focus towards the individual’s experience rather than solely on the institutions responsible for maintaining safety and public order [17,18].
Numerous studies have aimed at understanding built environment features that trigger a sense of unsafety in urban public spaces. These studies also identify areas where potential offenders could conceal themselves or from which escape is difficult, and these areas are thus highly associated with the feeling of unsafety [19,20]. Studies focusing on small areas and neighborhoods have shown that public spaces lacking effective deterrence systems, such as the presence of police or vigilant citizens, are more likely to attract criminal activity [21]. This often creates a vicious cycle: people avoid areas they perceive as unsafe, leaving these spaces increasingly vulnerable to crime. Social Disorganization Theory posits that high concentrations of crime are frequently found in socially and economically disadvantaged neighborhoods, where signs of disorder in the built environment are more prevalent [22]. Similarly, Broken Windows Theory highlights that visible signs of disorder—if left unaddressed—heighten fear among residents, prompting them to withdraw from community engagement [8]. This withdrawal further exacerbates both disorder and crime, as criminals perceive the area as more defenseless and intensify their activities.
Gender is one of the most frequently studied demographic variables influencing the perception of crime in urban public spaces [20]. Previous studies have highlighted significant differences in safety perceptions between women and men [20,23]. The concept of a “woman-friendly city” has emerged as a crucial issue in women’s studies and the design of urban public spaces [24]. This concept emphasizes the necessity for urban designers and planners to create inclusive, accessible, and safe environments for women. Existing studies primarily focus on the following: (1) strategies for enhancing women’s physical and mental health [25,26]; (2) women’s social concerns regarding gender equality and justice [26,27,28]; (3) variations in the needs, roles, norms, and responsibilities of women and men when using urban spaces [29,30]; (4) the issues of women’s safety, security, and accessibility [31,32]; and (5) women’s experiences with poverty, economic inequalities, and economic insecurity in urban areas and societies [33]. Consequently, the primary focus of this research was to quantify the safety perceptions of the built environment from the female perspective, considering the specific needs of women in urban space design.

2.2. Built Environment Features and Extraction

In terms of data sources, due to the complexity of perception, survey and interview methods have been extensively employed in previous studies to detect and quantify heterogeneity. However, these approaches present two main challenges. First, the data collection and analysis processes are often costly and time-consuming. Second, the results can be difficult to generalize if the sample size is not sufficiently large and diverse [2]. Over the past decade, with the rapid development of mapping services, street view images have been increasingly utilized in large-scale online surveys [34,35,36]. Compared to remote sensing images, street view images contain rich information about urban infrastructure, street facade details, and landscape features, offering a pedestrian perspective on city streets and insight into the physical and social structures of urban environments [37]. This makes street view images particularly useful for evaluating urban environments. Regarding the evaluation index system, many studies have utilized the “Transit” 5D theory of high-quality built environments and the integrated urban design quality model to establish a diversified quantitative evaluation system. This system is based on five key dimensions: “Density”, “Diversity”, “Design”, “Destination Accessibility”, and “Distance to Traffic” [38]. For instance, Tang and Long [39] developed an evaluation framework with five dimensions—wall continuity, intersection aspect ratio, green occupancy, sky openness, and enclosure—to assess the spatial vitality of Beijing hutongs. Similarly, Ma et al. [40] evaluated the impact of urban renewal projects on streetscape renovation by considering the spatial heterogeneity of five perceptual factors: greenness, openness, enclosure, walkability, and imageability.
Image segmentation is a crucial step in accurately extracting information from street view images for semantic segmentation using deep learning methods [41]. In recent years, techniques based on deep learning have significantly improved the accuracy of street view information extraction [41]. Originating from the computer vision community, deep convolutional neural networks (CNNs) have been developed to automatically capture hierarchical features [42]. Building on this foundation, the emergence of Fully Convolutional Networks (FCNs) has introduced a universal framework for semantic image segmentation. FCNs have been successfully applied to semantic segmentation tasks, further improving performance through the use of an encoder–decoder architecture [42].

2.3. Safety Perception: Ranking and Analysis

Traditional data collection methods, such as questionnaires and field surveys, are both expensive and time-consuming for measuring subjective perceptions of streetscapes. To address these limitations, street view imagery and crowdsourcing have been introduced as effective alternatives. An illustrative example is the MIT Media Lab’s Place Pulse project, which assessed attributes such as safety, beauty, and affluence in urban public spaces. This approach facilitated the quantification of both objective and subjective perceptions, offering a more efficient and scalable method for analyzing urban environments [43]. Ramirez et al. [2] addressed the challenge of quantifying the psychosocial component of safety by measuring the heterogeneity in individuals’ perceptions of public space safety through the use of street view images and deep learning techniques. Regarding the heterogeneity of urban spaces, previous studies have predominantly concentrated on the impact of the built environment on safety within small-scale contexts. For example, Gu et al. [44] examined the relationship between visual environment characteristics and safety in old residential areas in Guangzhou, while Li et al. [45] explored how elements such as the sky, sidewalks, roads, and trees within university clusters influence the sense of safety. Naik et al. [46] converted pairwise comparisons of perceived safety into ranked scores and employed a regression algorithm, combined with generic image features, to predict these ranked perception scores. Similarly, Yao et al. [47] utilized the Place Pulse 2.0 dataset and implemented a random forest algorithm alongside a segmentation model to develop a binary classification model for six subjective attributes.
Regression analysis is widely used in urban studies to quantify the relationships between visual elements and the human perceptions of urban public spaces [48]. To extract detailed information about visual elements, semantic segmentation models such as PSPNet and SegNet are employed to estimate pixel-level category data (e.g., buildings, fences, sky) from street view images [48]. For instance, Xu et al. [49] utilized random forest regression to reveal the nonlinear effects of street canyon characteristics on human perceptions. Li et al. [50] utilized multiple linear regression to investigate the relationship between vegetable consumption and perceived safety. The Geographically Weighted Regression (GWR) model, proposed by Fotheringham [51], incorporated Geographical location into regression analysis to reveal the spatial heterogeneity of influencing features within the study area. Dziauddin [52] applied GWR to analyze the spatial heterogeneity in changes in surrounding land value following the construction of light rail stations, while Yang et al. [53] discussed the spatial heterogeneity in the distribution of urban green spaces from the perspective of disadvantaged groups using GWR. However, there is currently a gap in research exploring the spatial heterogeneity of the impact of the urban built environment on safety perception from the perspective of women.

3. Materials and Methods

3.1. Research Area

Wuhan, as the largest city in the region, plays a pivotal role as a political, economic, and cultural center in Central China. Its urban layout, characterized by the convergence of two rivers and the presence of three major districts, has naturally led to the formation of a multi-center city, providing a diverse built environment that is conducive to research (Figure 1). The study area includes Wuchang, Jiangan, Hanyang, Hongshan, Qingshan, Qiaokou, and Jianghan districts (Figure 1), as these areas have the highest population density and a variety of building environments in Wuhan. The transportation network connecting these multiple centers in Wuhan divides the city into three distinct spatial structures: the city center area, the urban area, and the suburban area, with the 2nd Ring Road and the 3rd Ring Road serving as boundaries [54]. There has been a proliferation of single-unit housing since the founding of the People’s Republic of China, and land use components have become increasingly complex, particularly in the city center area. The urban area functions as the main expansion zone of the city, and its land use patterns significantly differ from those of the city center area.

3.2. Data Source

In this study, street network data were obtained from the OpenStreetMap (OSM) website (https://www.openstreetmap.org/, accessed on 1 January 2018). After excluding highways, the study area comprised 4824 roads, which constituted the street network for analysis. As aforementioned, they are considered as public spaces for this study. Additionally, these street network data served as a reference for acquiring street view images. Other foundational geographic data included Wuhan’s administrative boundaries and water systems.
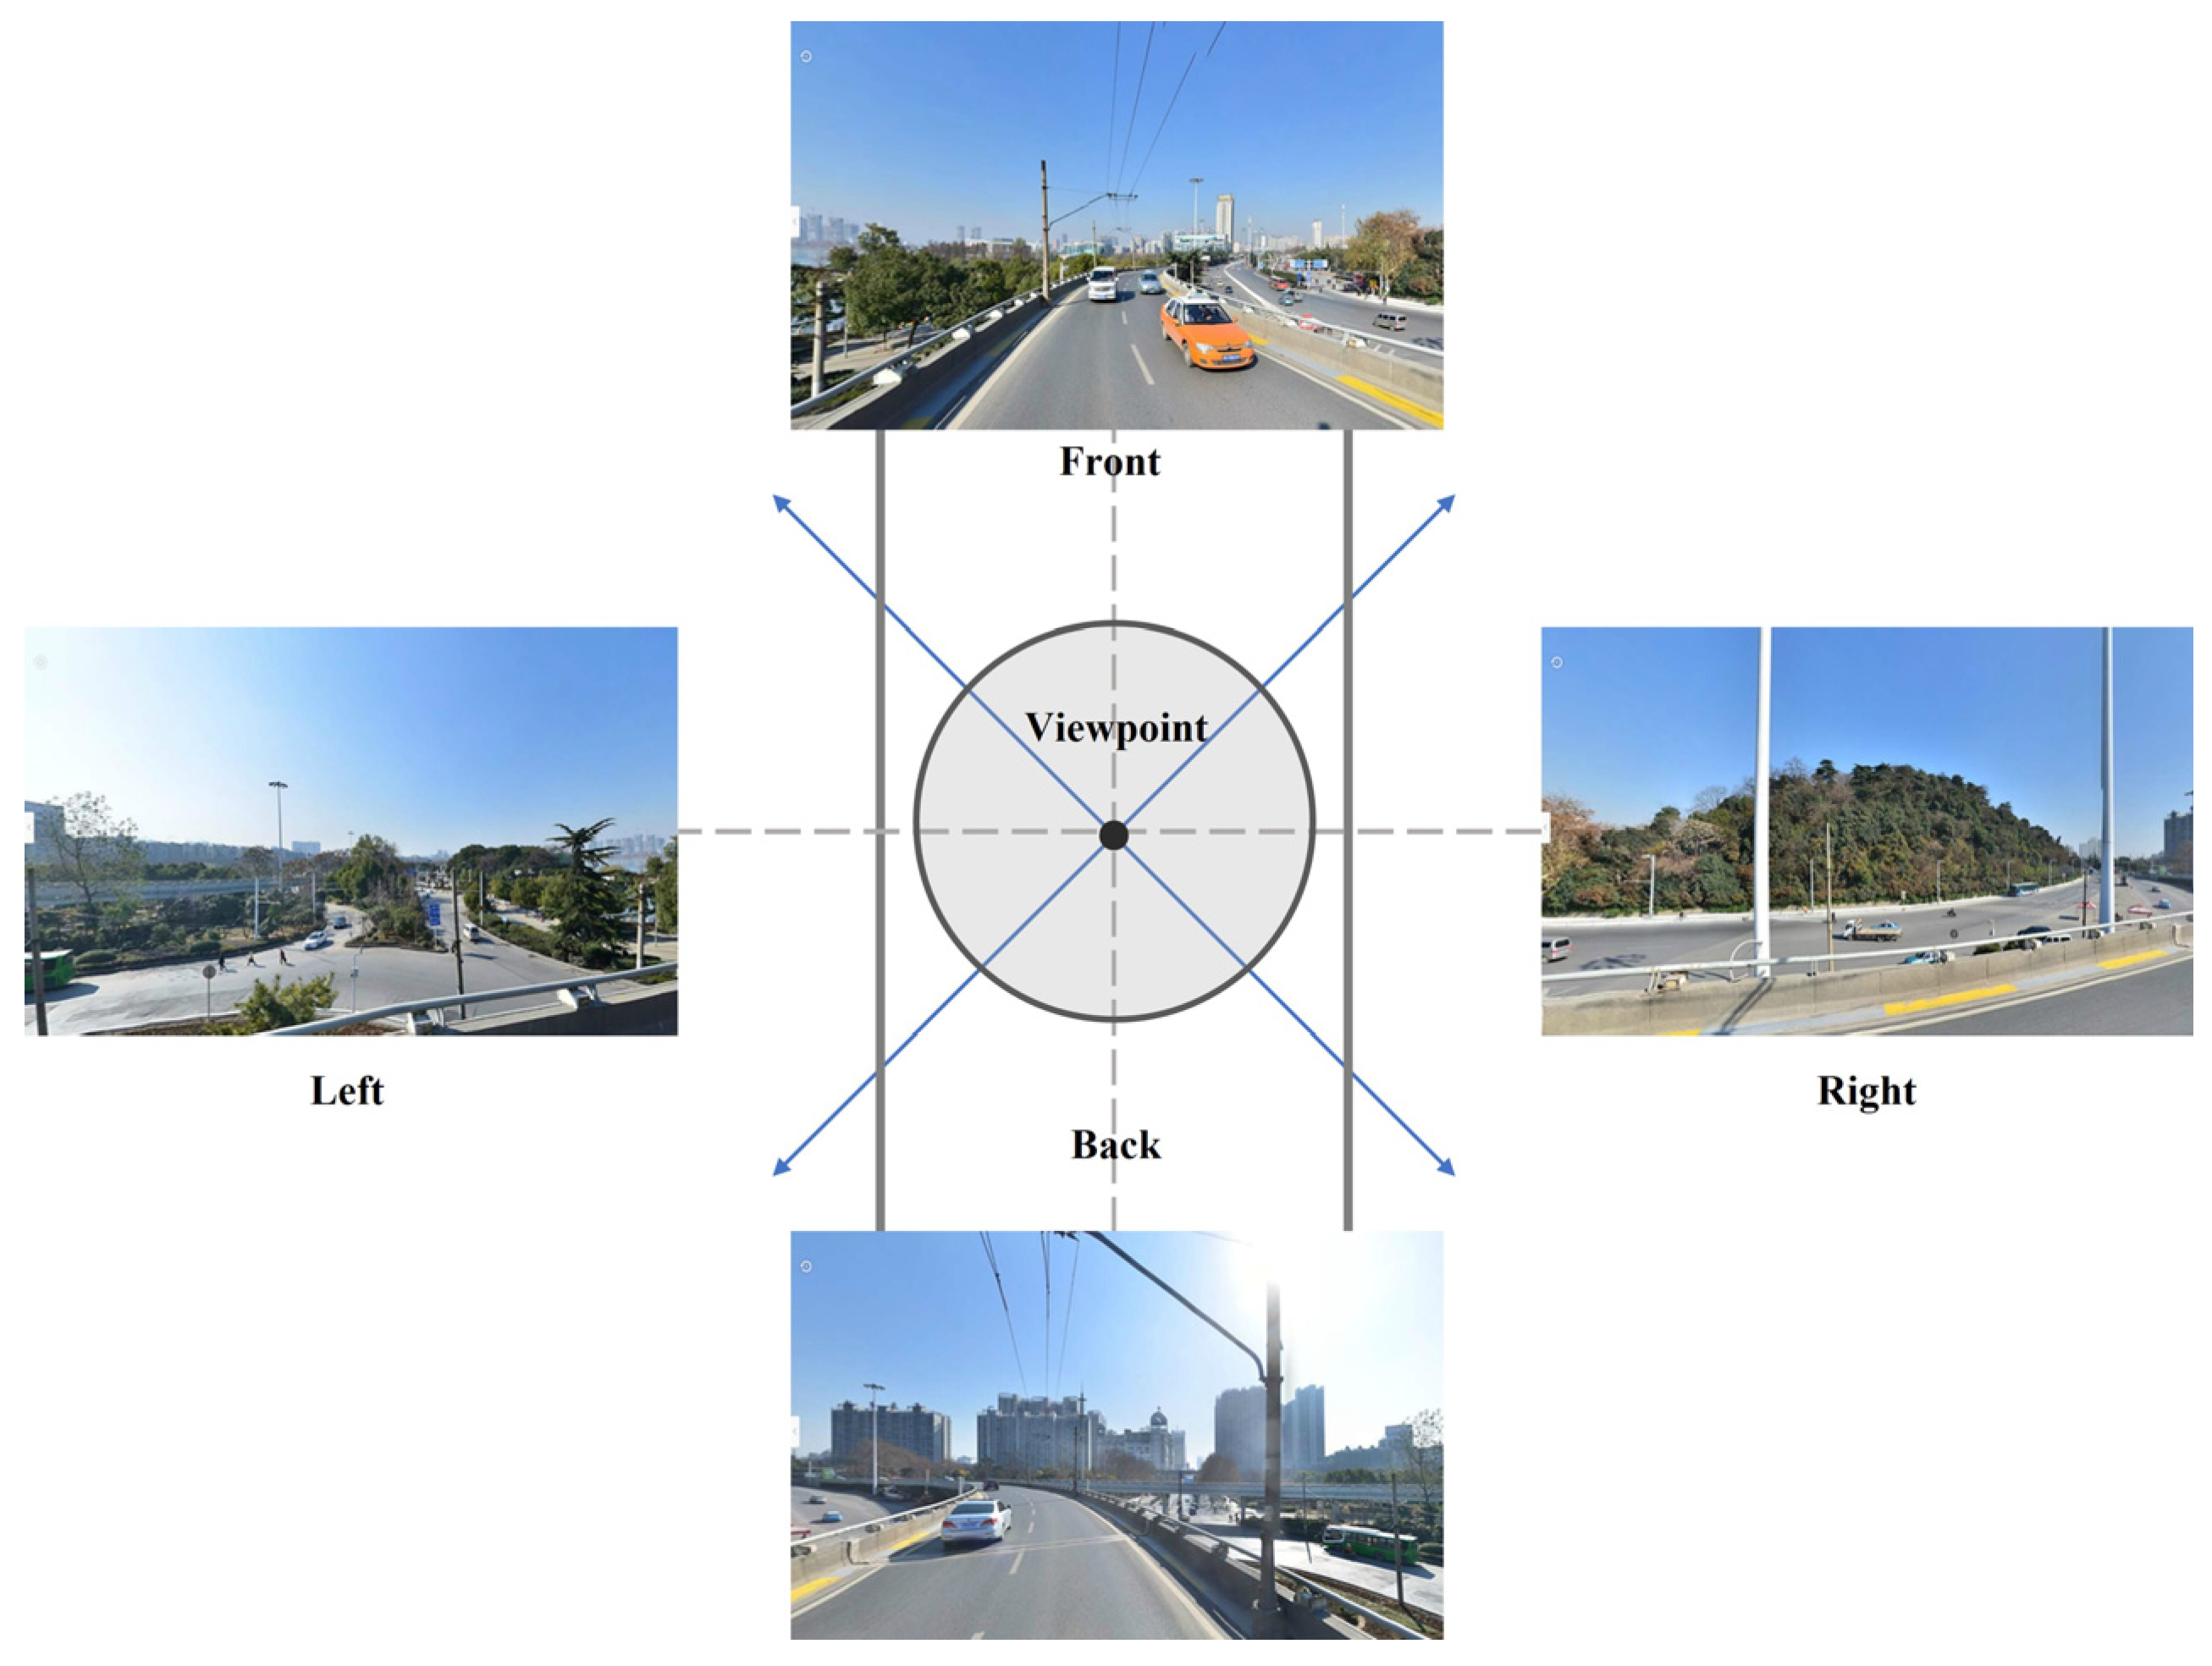
The dataset for this study primarily included Tencent Street View images from 2018, along with basic geographic data. The street view images were scraped using Python3 via HTTP URL calls to the Tencent Street View API (https://lbs.qq.com/webApi/javascriptV2/jsGuide/, accessed on 1 January 2018). By specifying the sampling angle and viewpoint position, we obtained street view images, coordinates, angles, and other relevant information for each sample point. To get closer to the pedestrian perspective, images were selected from four cardinal directions (e.g., heading = 0.90, 180, and 270) at each sample point, maintaining a horizontal viewing angle (pitch = 0). In total, 76,024 Tencent Street View images were captured, with each image having a resolution of 480 × 300 pixels (Figure 2).

3.3. Research Methodology

The technical framework of this study included three procedures (Figure 3): evaluating women’s safety perception, analyzing built environment factors, and addressing the influences of built environment factors on women’s safety perception and regional variations.

3.3.1. Evaluating Women’s Safety Perception in Public Spaces

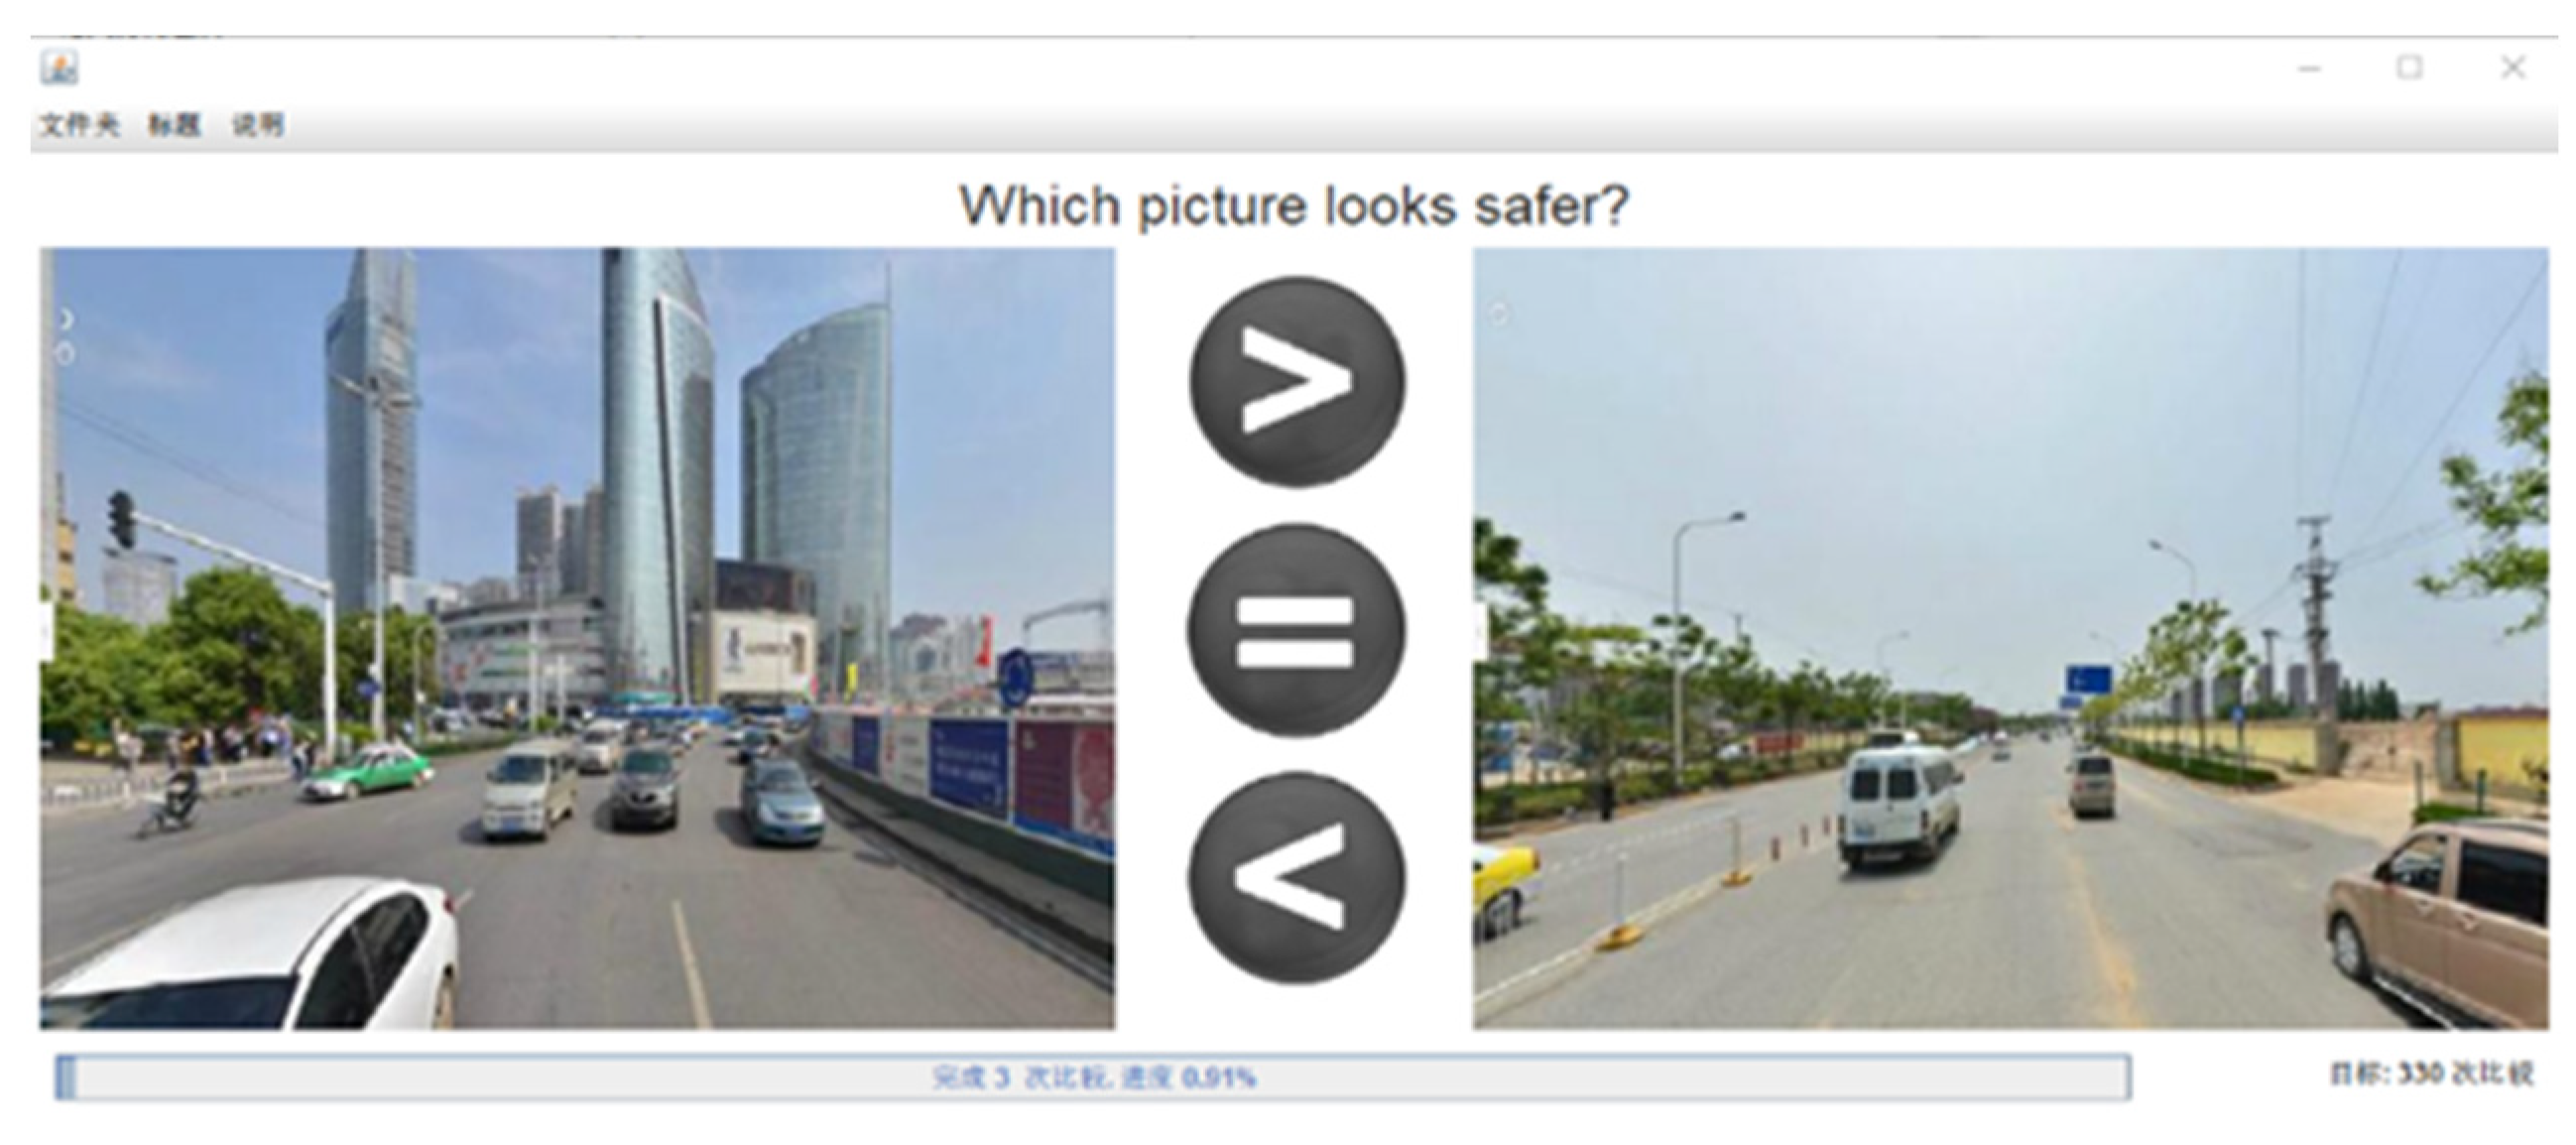
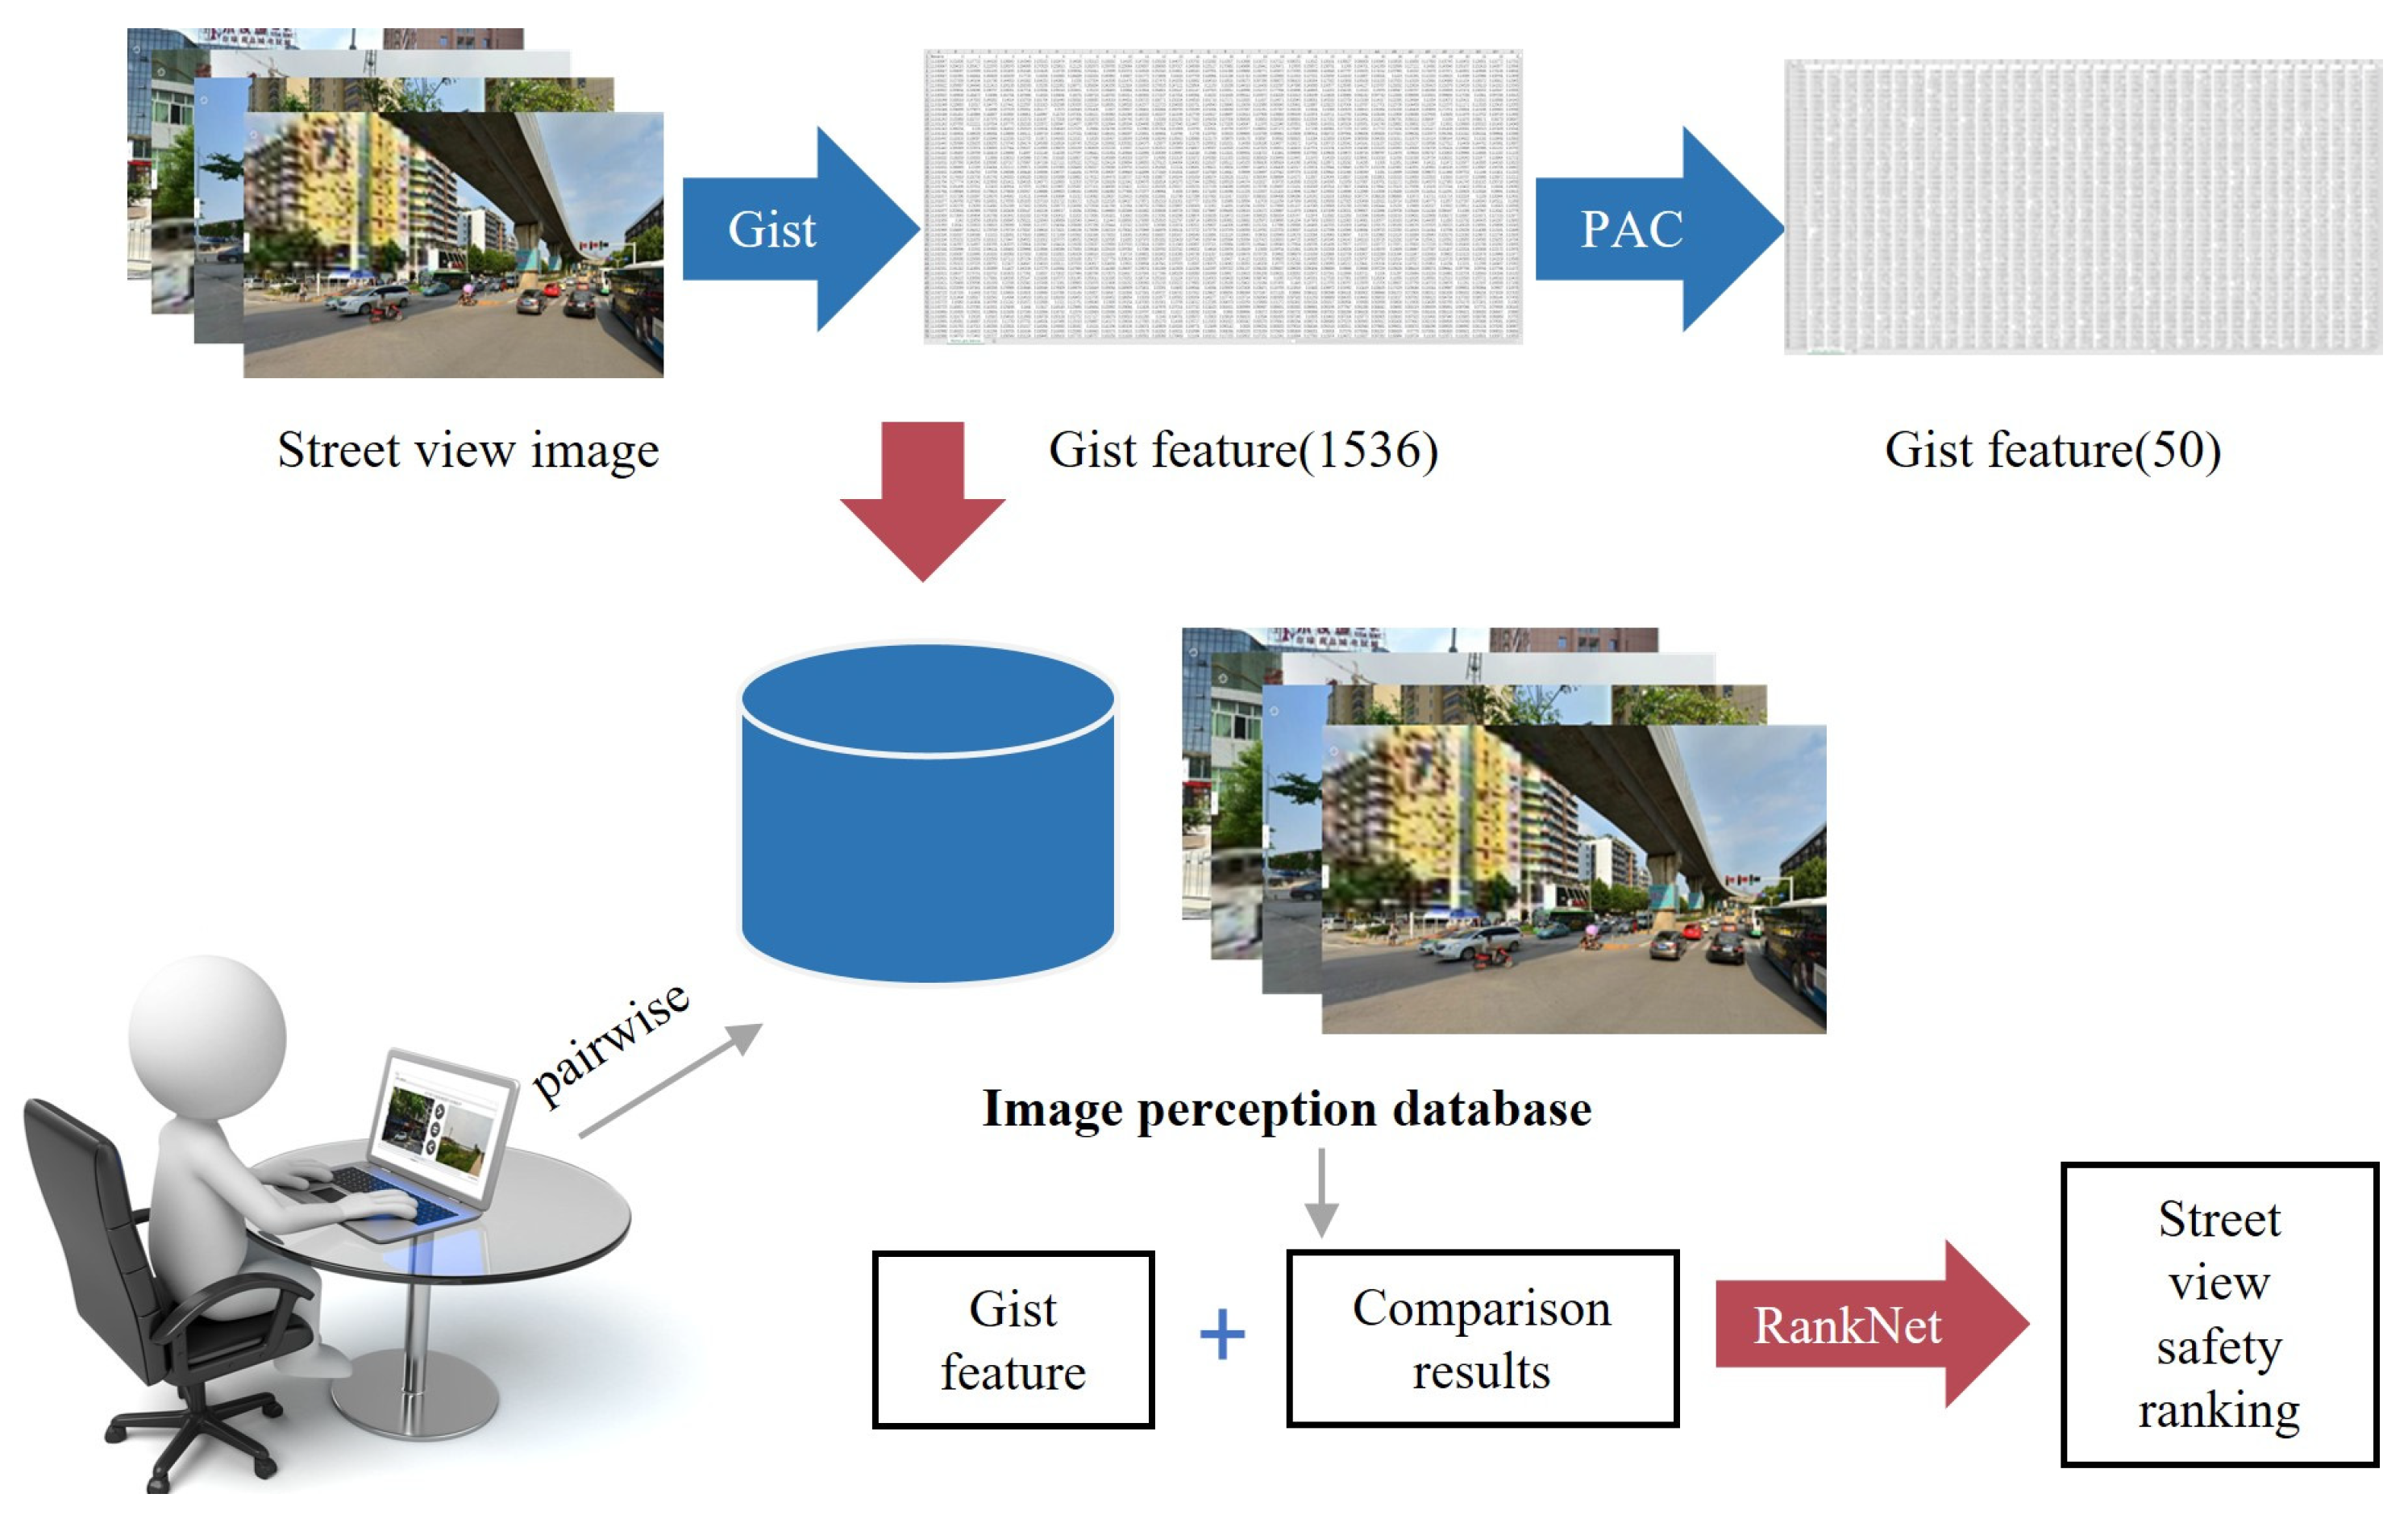
Thirty-one female volunteers participated in this study to perform pairwise comparisons of sample images, helping to obtain safety labels and build a street view image perception database. Volunteers aged 18 to 30 were selected as women within this age range are statistically more likely to be targets of sexual offenses in China. Each participant compared 73 street view images, spending approximately 30 min on the task. During the comparisons, volunteers selected the street view image that they felt offered greater safety and a reduced probability of experiencing violence using the provided software (Figure 4). Safety labels were assigned based on their choices: left = 0; equal = 1; and right = 2. These results were then utilized to train a female safety perception ranking model, which was subsequently applied for large-scale calculations of female safety rankings (Figure 5). This approach facilitated the development of a robust model capable of analyzing and ranking safety perceptions on a broader scale.
(1)
Gist feature extraction
Gist features, also referred to as Global Information Features, are biologically inspired low-dimensional signature vectors that characterize a scene. They extract image information in a manner analogous to human vision, effectively capturing the overall impression of street view images as perceived by women. Gist features served as the basis for the safety ranking of street view images [55]. These features were obtained using a Gabor filter bank. The expression of the Gabor filter bank is given by the following:
G θ l = K e x p x r θ i 2 + y r θ i 2 2 σ 2 l 1 × exp 2 π j u 0 x r θ + v 0 y r θ
x r θ i = x cos θ i + y sin θ i
y r θ i = y cos θ i x sin θ i
where l is the scale of the filter; K is a normalization factor; σ controls the width of the Gaussian function; and θ i = π i 1 / θ l , i = 1,2 , , θ l , where θ l is the orientation angle of the filter at scale l. The filtered image is as follows:
F θ l = G θ l I
Gist features were extracted from the street view images to characterize each image for the safety ranking process. By applying filters in multiple orientations, 1536-dimensional feature vectors were generated. To reduce the dimensionality of these vectors, a Principal Component Analysis (PCA) algorithm was applied, reducing the features to 50 dimensions.
(2)
RankNet for safety perception ranking
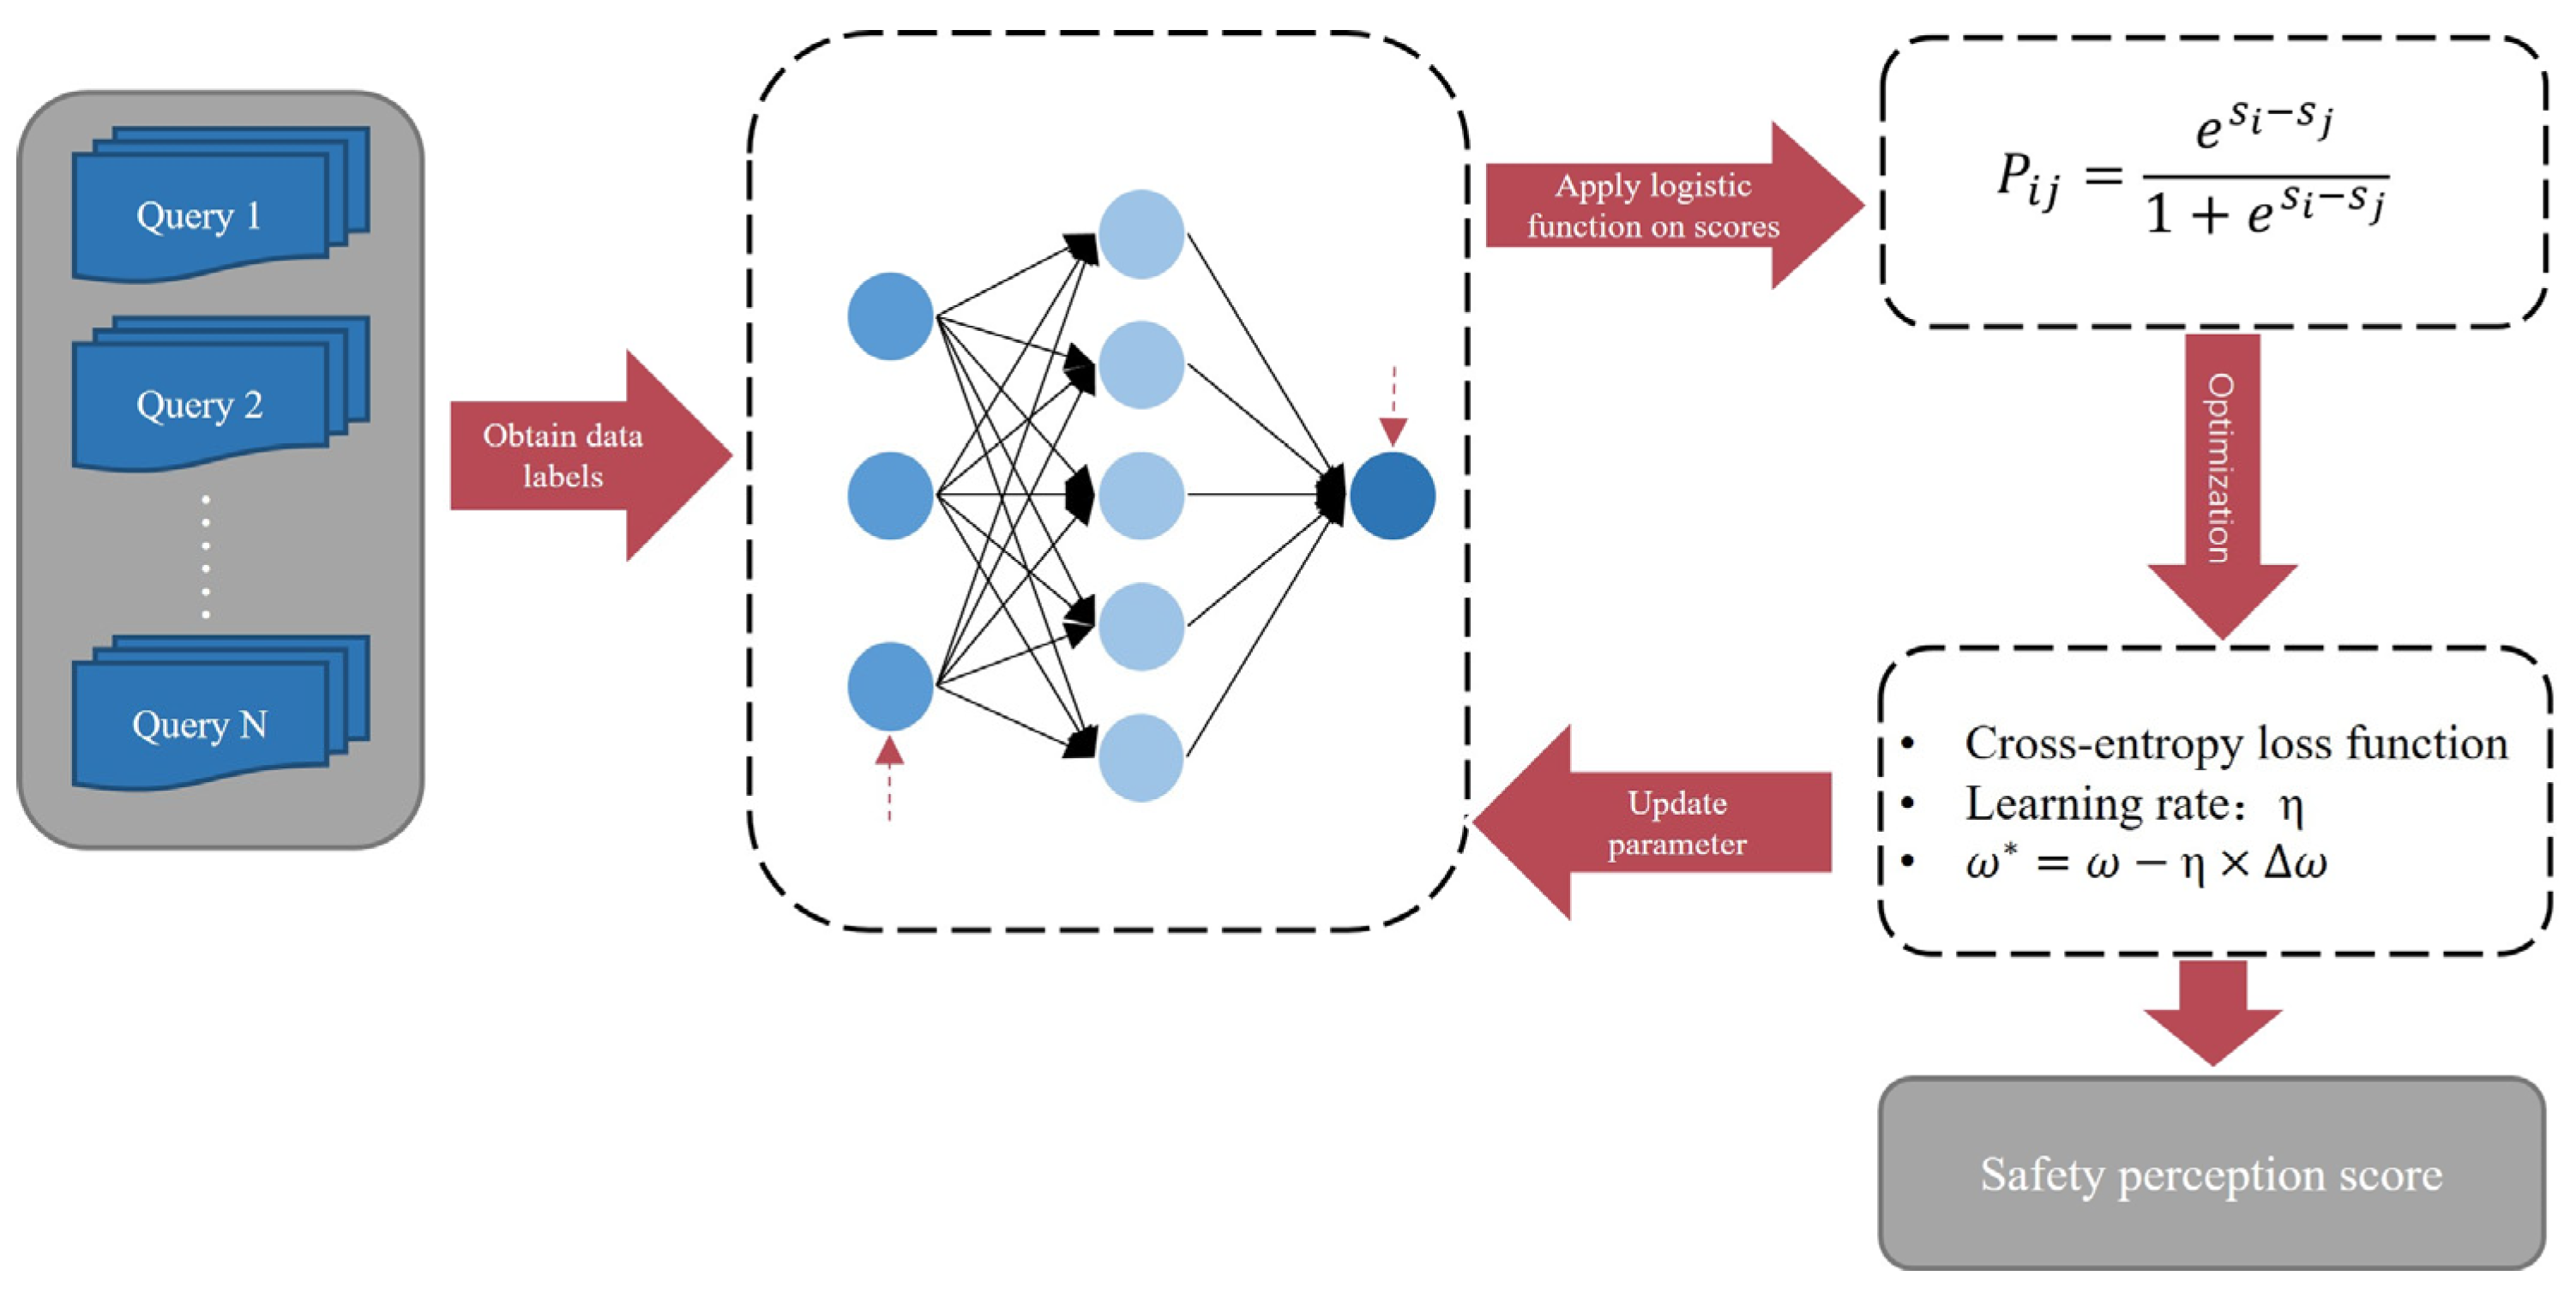
Learning to Rank (LTR) involves sorting search results by integrating multiple ranking features. LTR methods are generally categorized into three main approaches, single-document (Pointwise), document comparison (pairwise), and document list (Listwise), according to the different underlying hypotheses, loss functions, and input and output representations of these algorithms [56,57]. Existing studies often use various classification and comparison methods to label street view images, which may not provide a comprehensive view of the images. However, the pairwise method considers both objective entities and users’ primary impressions. Labeling street view images using the pairwise comparison method is similar to the process of sorting pairs. Since this study focuses solely on street view image ranking within the context of street space security, this can be considered a single-query problem [58]. Therefore, RankNet, a classical algorithm for document pair sorting, was employed in this study to rank the input training data formatted in libsvm. The RankNet algorithm comprises three main components (Figure 6): a neural network model, a cross-entropy loss function, and gradient descent optimization [59].
s i > s j i j
P i j = P i j = e s i s j 1 + e s i s j
C = P ¯ i j × l o g P i j + 1 P ¯ i j × log 1 P i j
ω i * = ω i η × ω i
where s i is the score for project I, P i j is the predicted probability of i j , P ¯ i j is the actual probability of i j , C represents the loss of the function, ω i * and ω i are the updated parameter and the current parameter, ω i is the gradient of ω i , and η is the learning rate.
The scoring tool, developed in Java, records the pairwise comparison results of street view image and subsequently converts these results into a safety ranking for the sample images. The operational principle of this tool is illustrated in Figure 6 [60]. To ensure the objectivity and validity of the results, a total of 3325 street view images were randomly selected using Python for small-scale manual evaluation. Additionally, female volunteers conducted pairwise comparisons of these sample images, yielding 22,555 comparisons and 44,550 labeled data points. The evaluation model was selected through 5-fold cross-validation. The final model achieved an error rate of 12.9% on the training set and a prediction error rate of 13.1% on the test set.
In this study, global spatial autocorrelation and local spatial autocorrelation were analyzed using the Moran’s I index and the LISA index, respectively, to investigate the distribution of women’s safety perception at the street level. The Moran’s I index measures the spatial correlation of attribute values, with possible values ranging between −1 and 1 [61]. The LISA index evaluates the spatial correlation between each geographic unit (e.g., point, region) and its neighboring units, identifying patterns such as LL (low–low concentration), HH (high–high concentration), LH (low–high concentration), and HL (high–low concentration) [62].

3.3.2. Extracting Built Environment Features

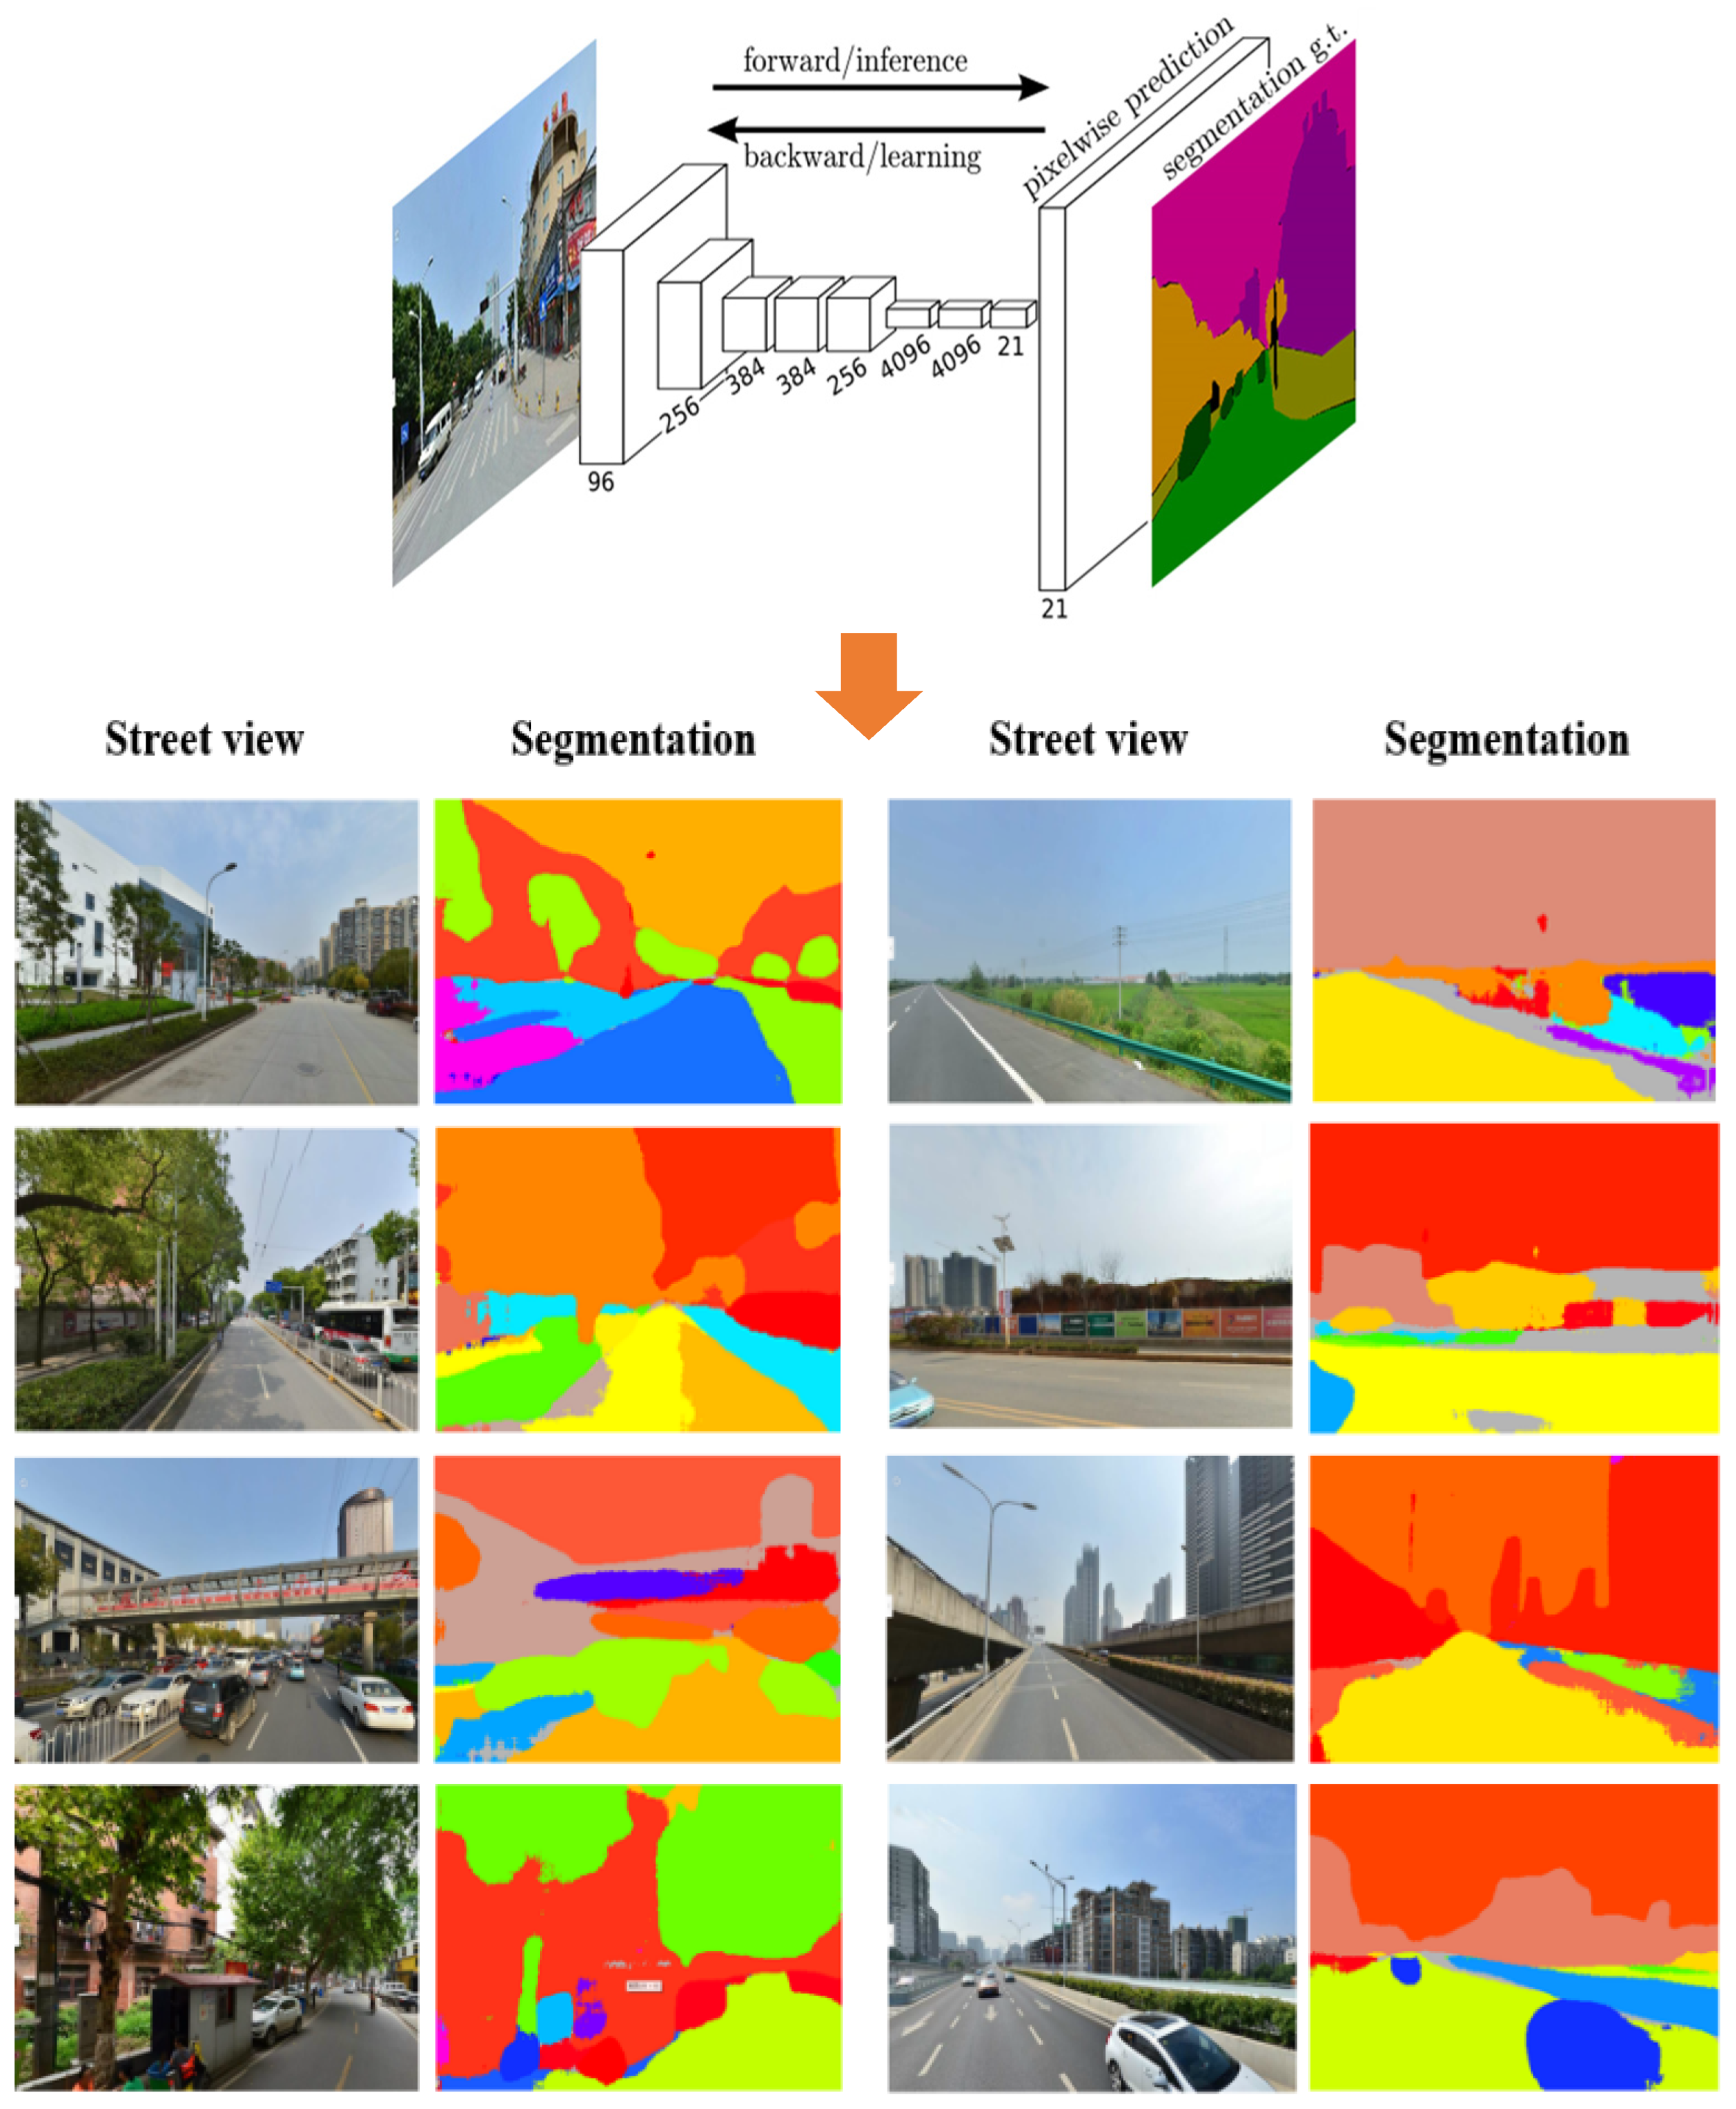
In this study, the Fully Convolutional Network (FCN) framework for image semantic segmentation, as proposed by Jonathan Long [63], was employed to extract built environment features. Notably, the most successful semantic segmentation networks are based on FCNs [64]. Initially, street view image features were acquired using the methodology outlined by Yao [65]. Subsequently, the FCN-8s model was applied to perform semantic segmentation on the street view images, categorizing the various built environment objects present. The trained FCN-8s model is capable of classifying images into 151 natural feature categories (including an “unknown” category), such as vehicles, trees, and buildings. By summarizing the proportion of pixels occupied by each type of ground object, a 151-dimensional vector representing the street view image can be obtained (Figure 7). The trained FCN-8s model demonstrated an error rate of 28.56% on the training dataset and 33.17% on the test set. Following this, based on the index system established by previous research [47], the 151 types of natural features extracted by the FCN-8s model were used to obtain 7 local visual environment indicators, as detailed in Table 1. Finally, street complexity was assessed using methods from the Python OpenCV and PIL libraries.

3.3.3. Analyzing the Factors Influencing Women’s Safety Perception

(1)
OLS and GWR analysis
In this study, OLS analysis, which is the most widely used MLR analysis method and the most fundamental form of regression analysis, which provides a global model of a variable or process [66], was employed to analyze built environment features. OLS analysis was utilized to address multicollinearity and assess the relationships between variables. However, since OLS assumes spatial homogeneity, it is limited in its ability to capture the varying impacts of the dependent variable across different regions [67,68]. To address this limitation, GWR was used. In contrast to traditional linear regression models, GWR incorporates a spatial weighting matrix into linear regression models along with geographic coordinates to extend traditional regression models and account for the spatial heterogeneity of geographic factors [69,70]. Subsequently, the GWR model was used on the significant built environment features identified through OLS analysis to examine the varying impacts of each feature across different regions in Wuhan.
(2)
Clustering analysis
To better understand regional heterogeneity, K-means clustering, which is an unsupervised machine learning algorithm, was employed to group the unlabeled dataset into different clusters. The process began by randomly assigning cluster centroids in the space. Then, the distances between each sample point and the centroids were calculated, and each sample was assigned to the cluster whose centroid was closest, based on the distance D from the sample to the respective cluster center. This process ran iteratively until it found good clusters. The final grouping was determined based on the magnitude of these distances D [70,71].

4. Results

4.1. Spatial Characteristics of Women’s Safety Perception in Public Spaces

Individual street view safety perception ratings were determined by averaging the scores from images captured in four directions. As illustrated in Figure 8, street view images with lower safety ratings are predominantly associated with lower-grade roads.
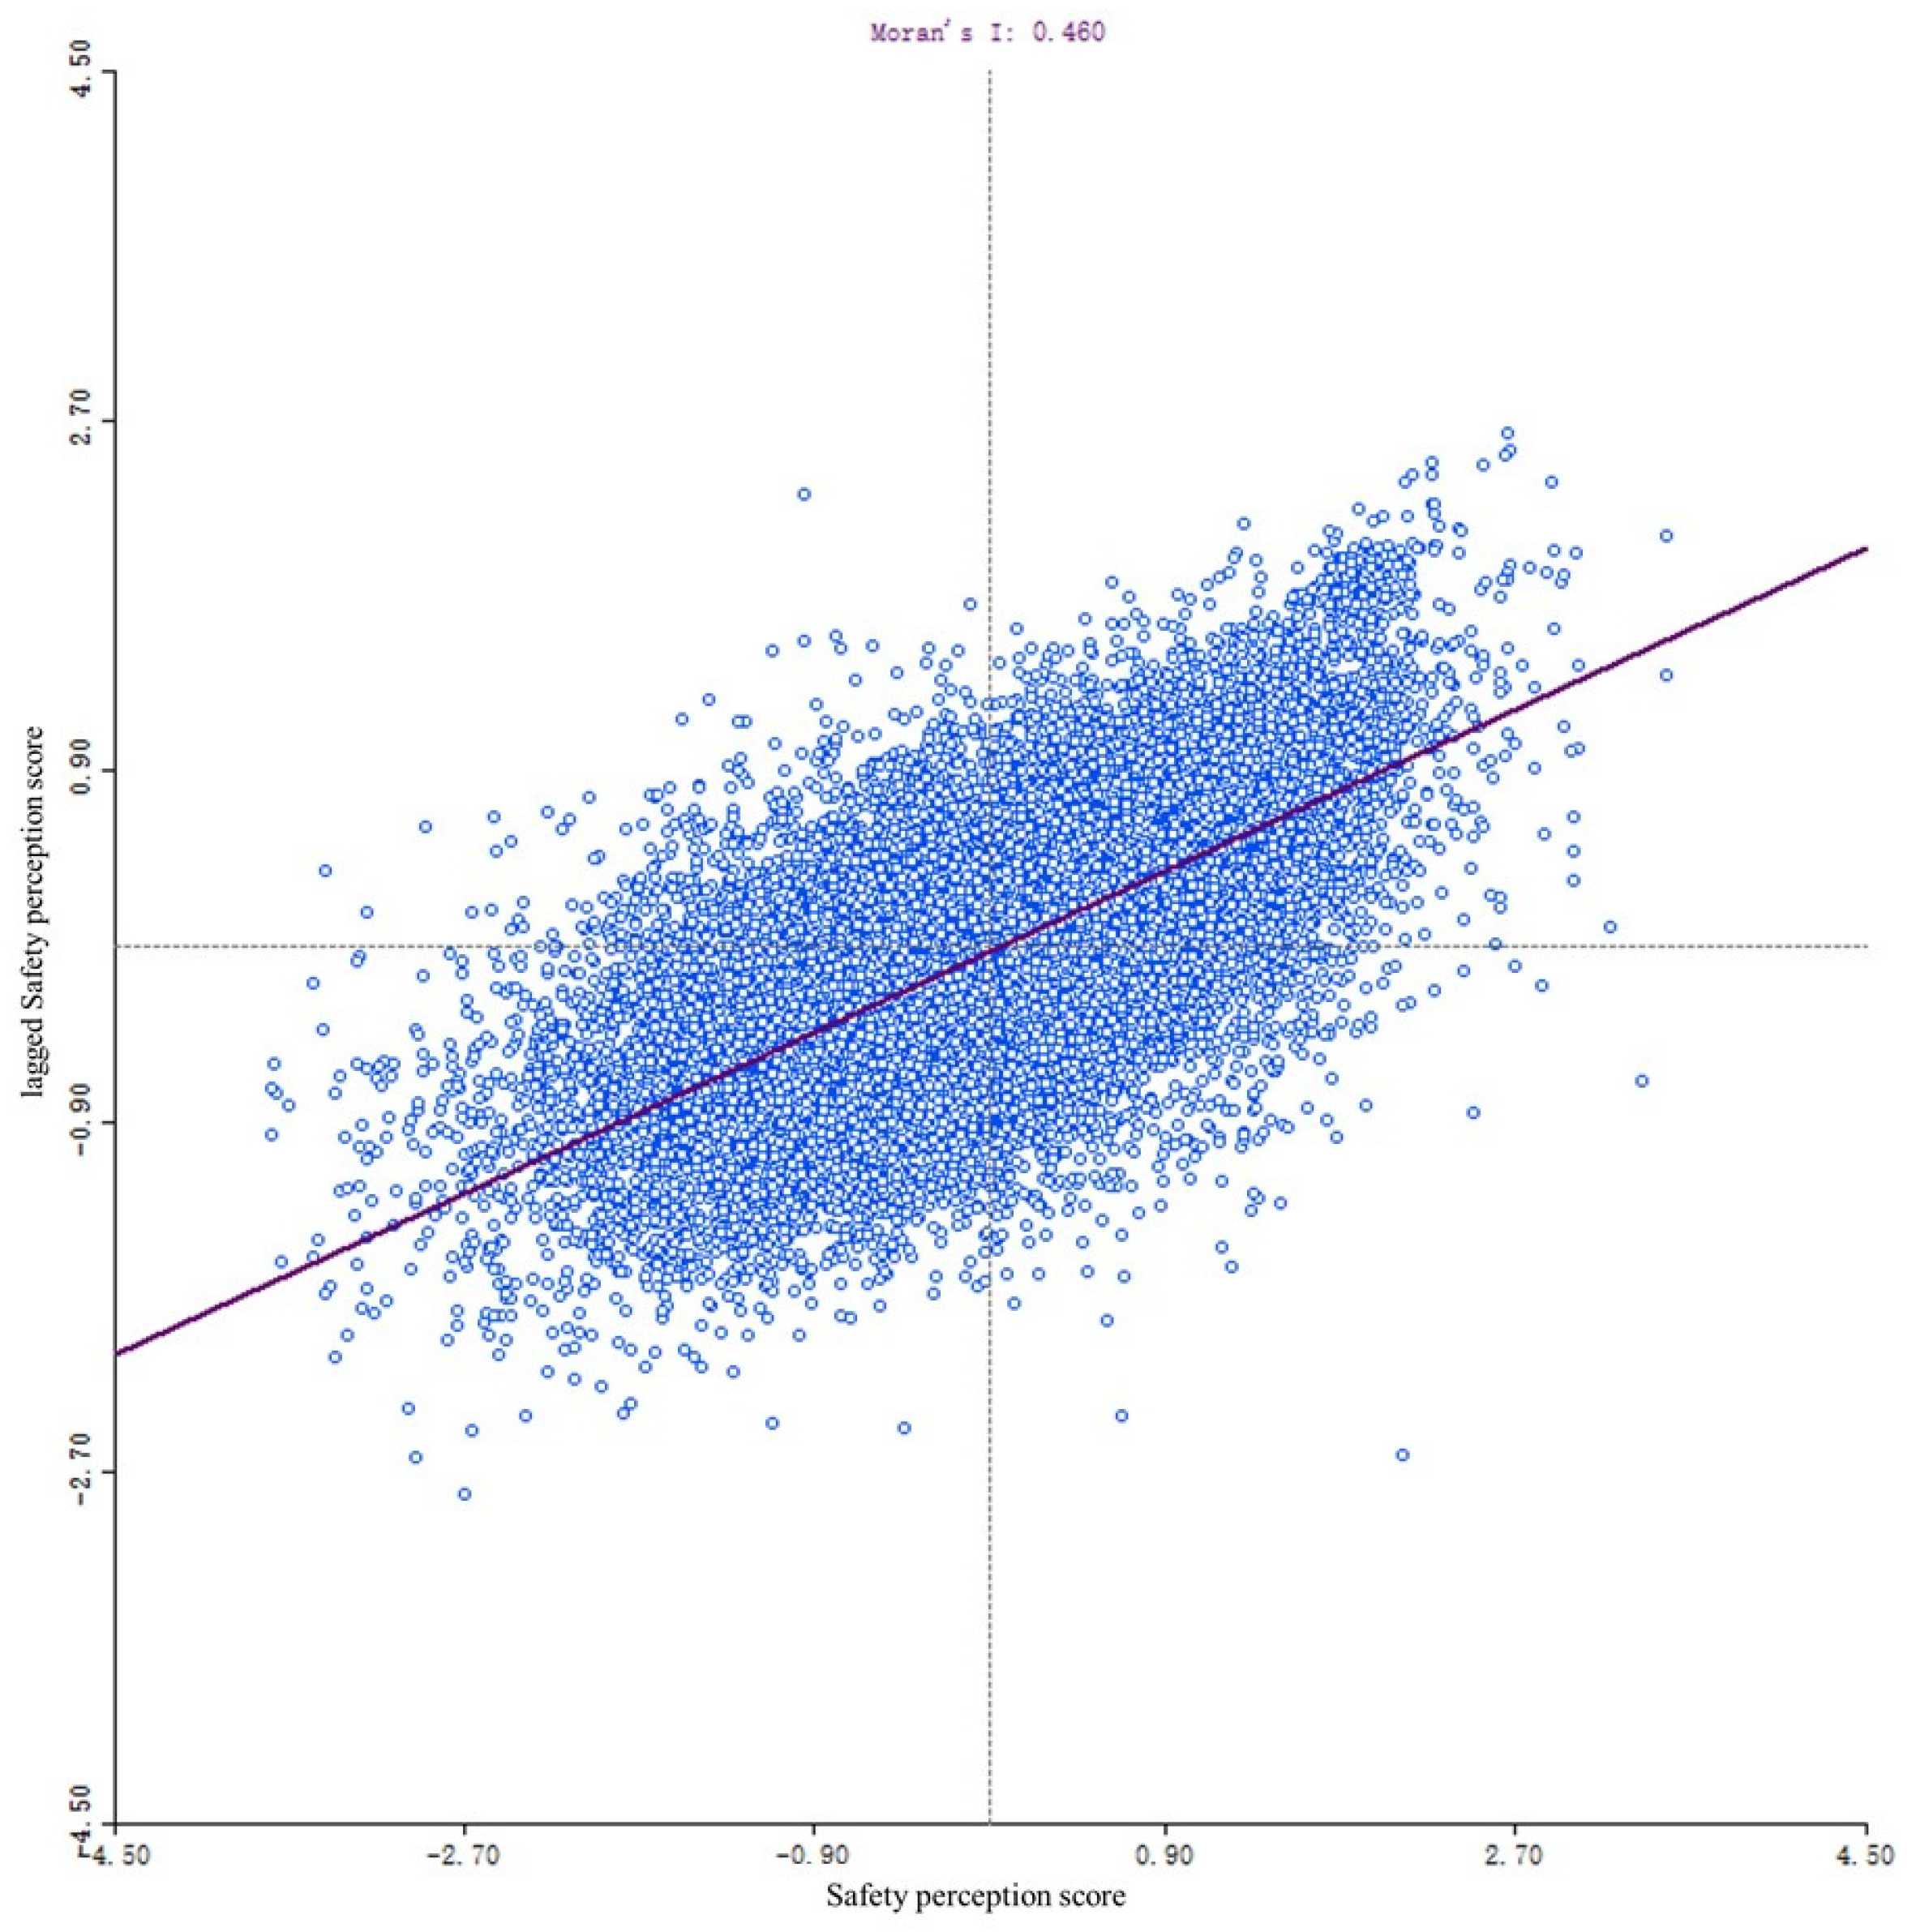
To further analyze the spatial characteristics of women’s safety perception in public spaces, this study conducted Moran’s I analysis using GeoDa 1.16 software, resulting in a Moran’s I index of 0.460. This result indicates a moderate degree of spatial clustering in the sense of security in Wuhan. Furthermore, as illustrated in Figure 9, most points are located in the first and third quadrants, suggesting either a positive or negative correlation between the sense of safety and spatial distribution. Points situated in the second and fourth quadrants indicate variability in safety perception across different areas.
For a more detailed examination of spatial clustering, the Local Indicators of Spatial Association (LISA) model was employed using GeoDa software. The result shows that areas with high–high and low–low clustering show the broadest distribution ranges, while high–low and low–high clustering areas are more sporadically distributed throughout Wuhan. High–high clustering is predominantly observed in the southwest and southeast regions of Wuhan, as well as along expressways. Conversely, low–low clustering is mainly concentrated in the city center area, East Lake, and the northwest part of Wuhan.

4.2. Built Environment Features of Public Spaces in Wuhan

The summarized statistics presented in Table 2 describe the proportions of eight built environment features within the street view image dataset. An examination of the Sky View Factor (SVF) and Building Volume Index (BVI) reveals that the mean and median values are similar, suggesting that the distributions of the SVF and BVI are approximately normal. Additionally, the standard deviation values for both the SVF and BVI indicate considerable fluctuation in these features.
In contrast, the Green View Index (GVI) exhibits a lower mean value and higher standard deviation, suggesting that GVI values are relatively low and show substantial variability across streets in Wuhan. The mean values for Sidewalk visibility (SV) and Roadway visibility (RV) are 3.49% and 18.28%, respectively, with median values of 2.01% and 18.93%. These figures indicate that sidewalks occupy a relatively small proportion of most roads in Wuhan.
The mean and median values for Visual Entropy (VE) are 0.9055 and 0.9183, respectively, with a standard deviation of 0.0382. This suggests that the interfaces of most roads exhibit a considerable degree of diversity. The Motor vehicle occurrence rate (MVR) reflects the likelihood of a street being traversed by vehicles, and the standard deviation of the MVR indicates that the probability of vehicle presence is relatively consistent across most streets in Wuhan. The Facility visibility (FV) value is the lowest among the features, which may be attributed to the relatively small size of street facilities themselves.

4.3. The Impact of Built Environment Features on Women’s Safety Perception in Public Spaces

In this study, OLS analysis was conducted using ArcGIS 10.4, revealing that the eight built environment features measured by FCN-8s significantly impact women’s safety perception. The variance inflation factor (VIF) for all parameters was below 7.5 (Table 3), indicating the absence of multicollinearity issues. As evidenced by an R 2 value of 0.619 (Table 3), the model’s goodness of fit suggests that the eight built environment features measured have a substantial effect on women’s safety perception.
This study further employed the GWR module within MGWR 2.2 software to examine the spatial heterogeneity impact of the eight built environment features. The final correlation coefficients between the safety perception and the built environment features are presented in Table 4. The GWR model achieved an R 2 value of 0.612, indicating that it can account for 61.2% of the total variation in safety perception across Wuhan. This result underscores the significant influence of the eight built environment features, as identified through the OLS analysis.
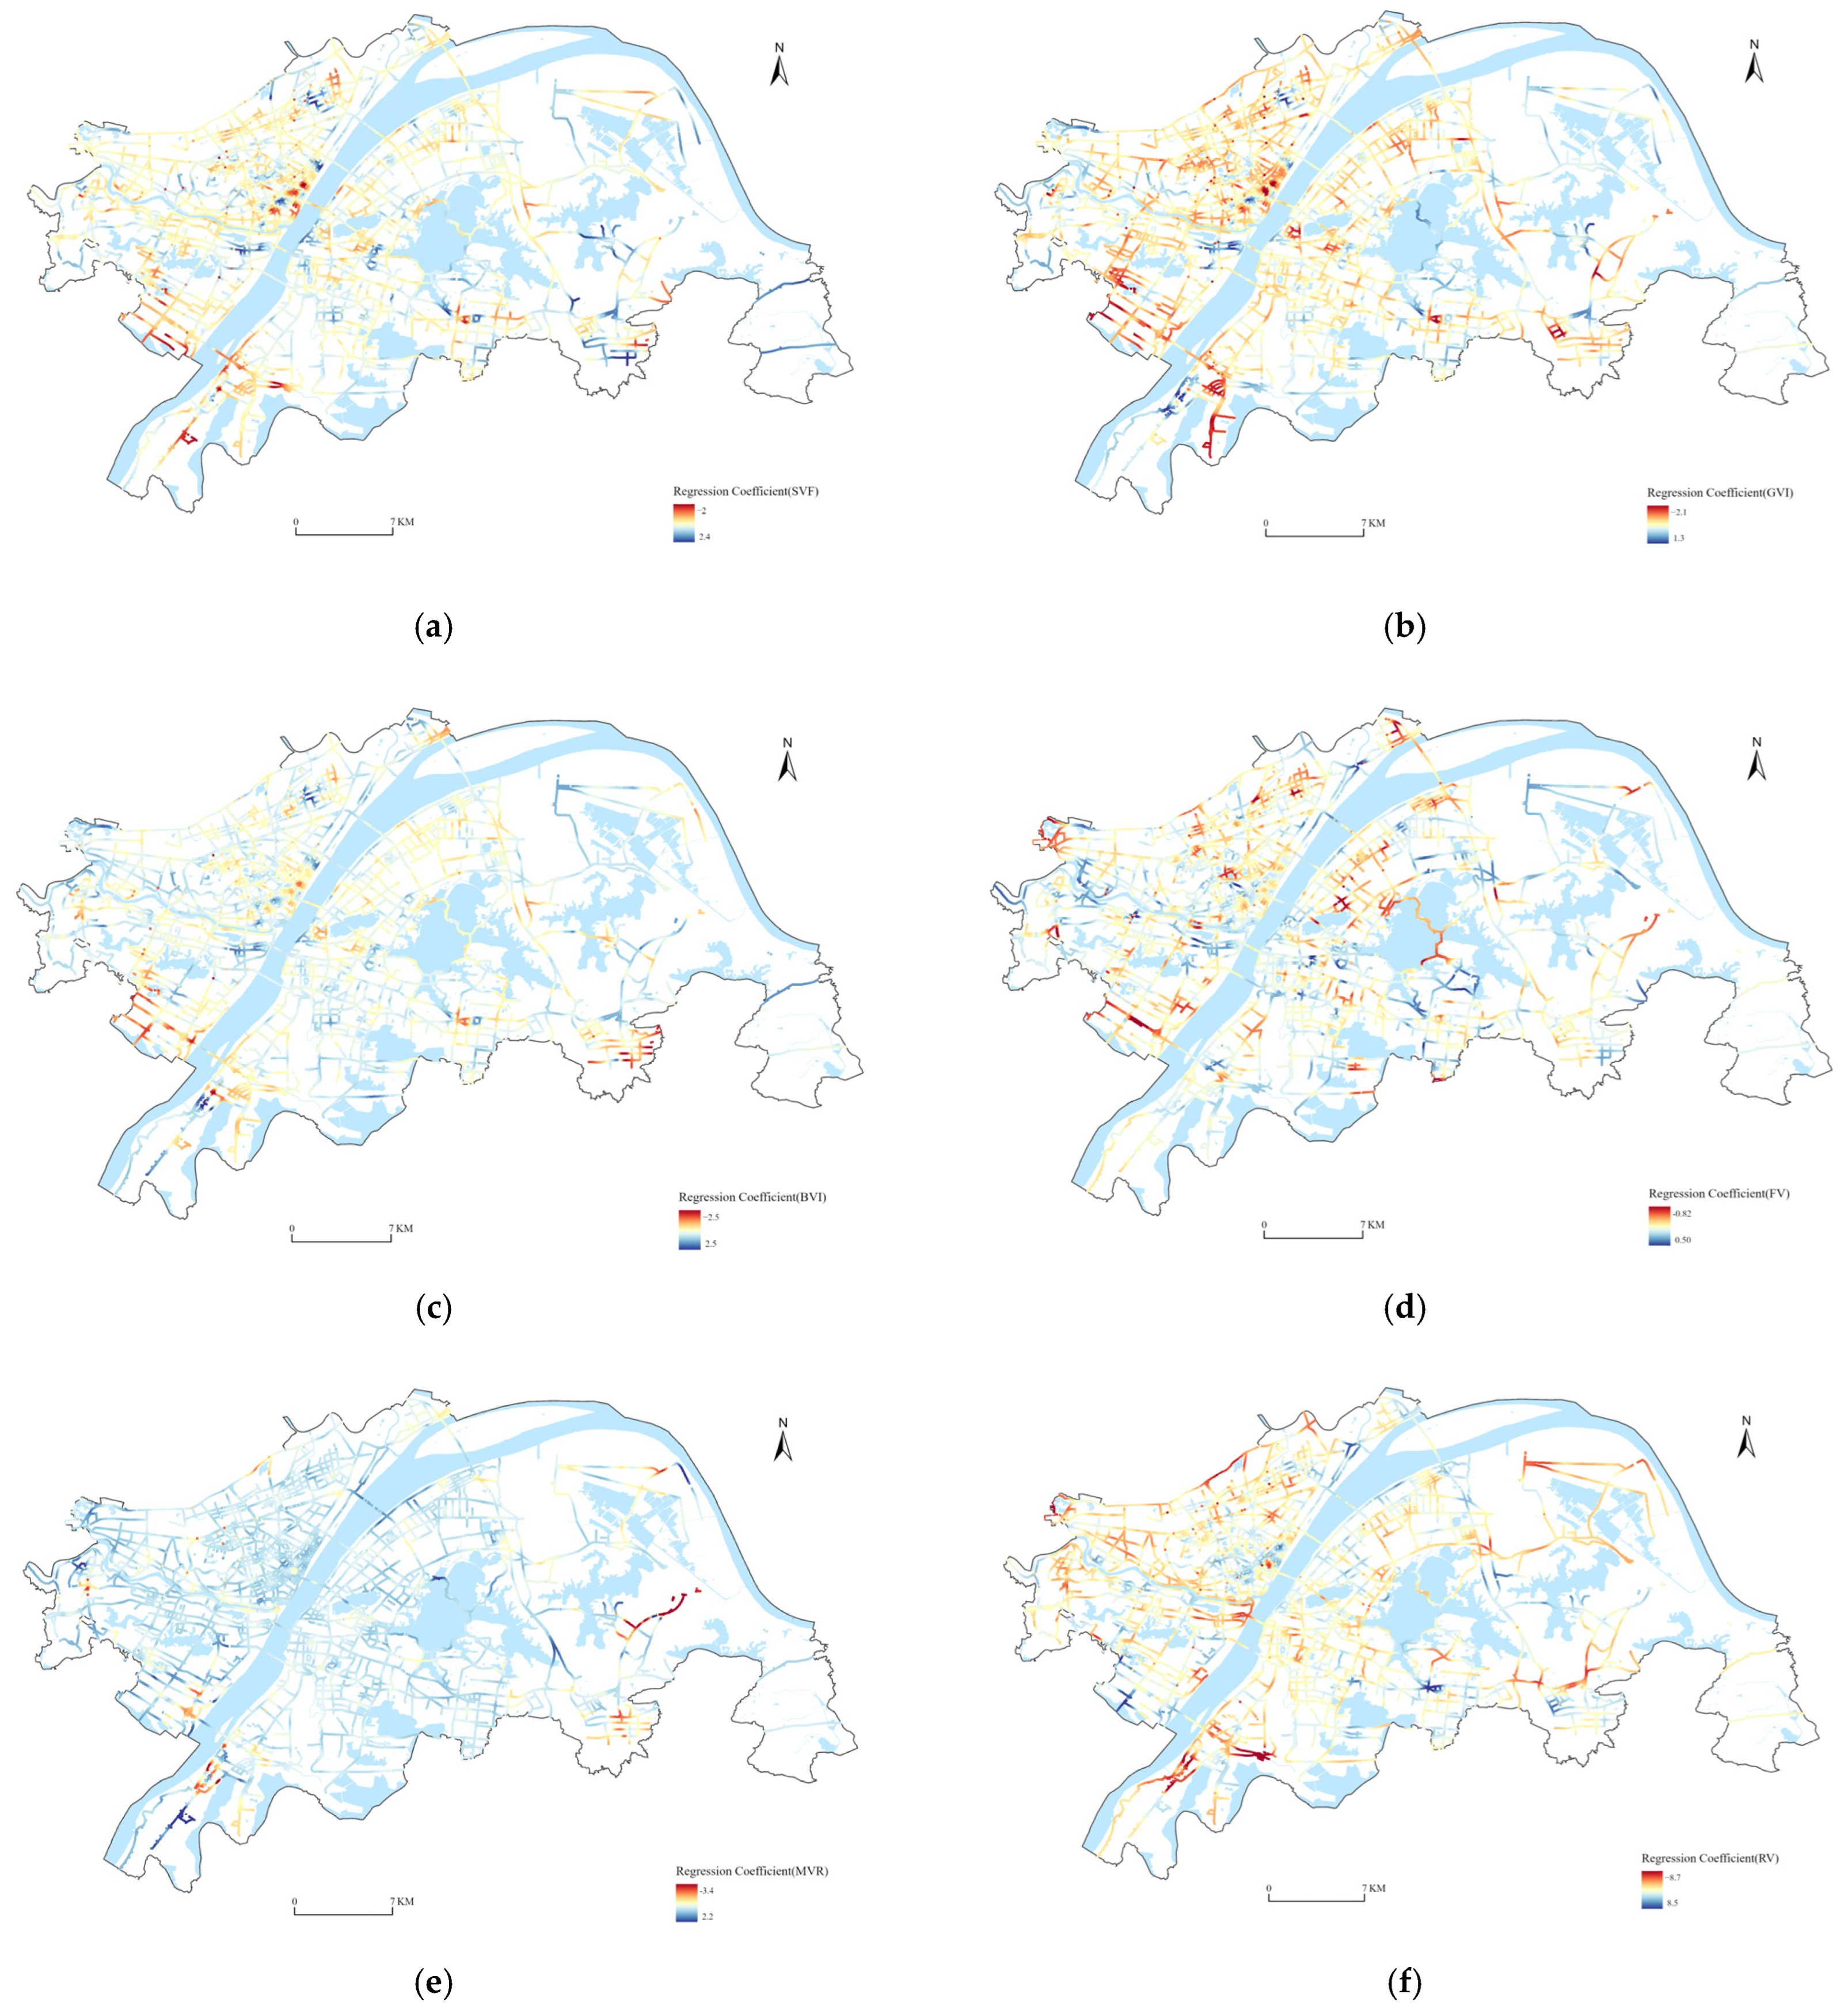
Comparing the t-value from the GWR model, the coefficients of the built environment features are ranked by significance as follows: GVI > SVF > RV > VE > SV > FV > BVI > MVR. Table 5 illustrates that the standard deviations of the eight built environment features are relatively large, indicating significant spatial instability. Particularly, the SVF and VE exhibit the highest standard deviations, suggesting substantial spatial heterogeneity in these two built environment features. For example, the regression coefficient of the SVF ranges from −2.042 to 2.578. This implies that a 1% increase in the proportion of sky in different spatial locations within the study area could result in a safety perception change ranging from a decrease of 204.2% to an increase of 257.8%.
It is worth noting that, with the exception of the SVF, the regression coefficients of all other factors are negative. This indicates that an increase in the complexity of the built environment is associated with a decrease in perceived safety. As shown in Figure 10a, the SVF is positively correlated with safety perception across Wuhan, suggesting that areas with a higher SVF are perceived as safer, which is consistent with existing research [2,47]. Conversely, street view image points in suburban areas, which are primarily located along low-grade roads and forest paths, tend to have a lower SVF and, consequently, lower perceived safety. In contrast, in the city center area, the southwestern part of Wuhan, and certain parts of Optics Valley—areas characterized by dense buildings and commercial activities—there is a negative correlation between the SVF and perceived safety. This indicates that while the SVF is lower in these areas, perceived safety is higher. Nevertheless, such street view image points are relatively rare and concentrated in specific areas.
By analyzing the relationship between the value and regression coefficients of the GVI, as presented in Table 2 and Figure 10b, it was observed that most areas exhibit a pattern where a low GVI is coupled with high safety perception, especially within the city center area. Conversely, areas with a high GVI and low safety perceptions are found in dense forest trails in suburban areas and around Dong Lake. This suggests that, from the female perspective, higher vegetation coverage may be perceived as indicative of potential danger.
Figure 10c illustrates that the impact of the BVI on safety perceptions in Wuhan varies, with correlations alternating between positive and negative. Areas where the BVI does not have a significant impact on safety perceptions are predominantly located in regions with sparse building densities, such as along expressways and the East Lake Greenway.
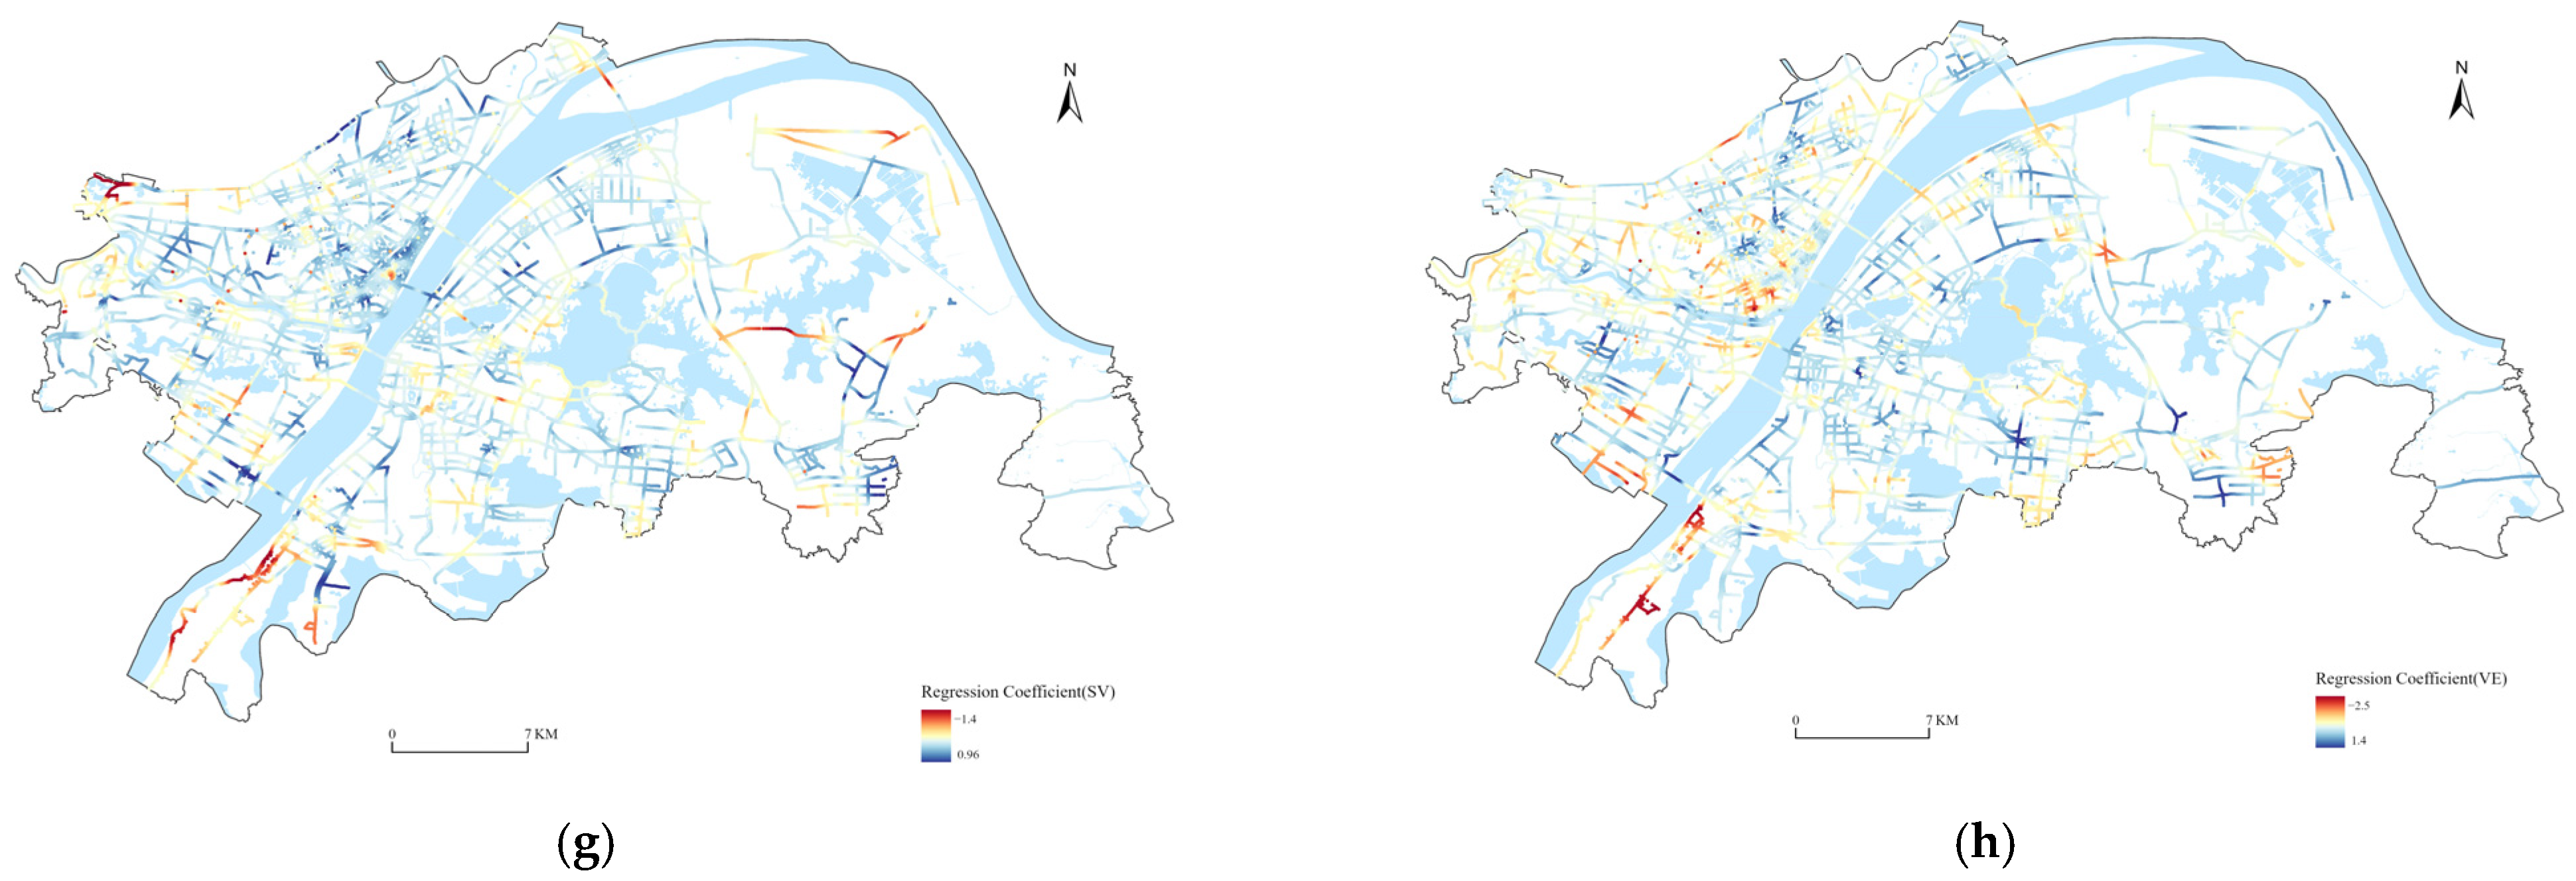
The transportation network in Wuhan comprises numerous overpasses, bridges, and tunnels that primarily serve as traffic thoroughfares, with relatively fewer sidewalks and less street furniture compared to residential roads. Spacious sidewalks allow pedestrians to walk safely and maintain a safe distance from motor vehicles, thereby enhancing their sense of safety on lower-grade roads. Since most street view images show low SV and FV (Table 2) associated with high safety perception, particularly along high-grade roads, this results in a negative correlation between SV and FV in Wuhan.
The results of the GWR analysis indicate a generally negative impact of the Motor Vehicle Ratio (MVR) on safety perceptions in Wuhan (Table 4). However, Figure 10e reveals that areas where the MVR negatively affects safety perceptions are relatively few compared to those where the impact is positive. This discrepancy is reflected in the difference between the median and mean regression coefficients of the MVR, as shown in Table 5, suggesting that the nature of the MVR’s impact on safety perceptions in Wuhan is variable. Regions with strong positive correlations between the MVR and safety perceptions are concentrated in suburban areas and low-grade roads within the urban center. In suburban areas, where pedestrian and vehicular interactions are infrequent, vehicles can alleviate the sense of desolation on roads. In the urban center, the dense road network and prevalence of branch roads, combined with lower speed limits, mitigate the sense of insecurity typically associated with a high vehicle occurrence ratio. Therefore, the impact of vehicles on safety perceptions on low-grade roads is predominantly positive.
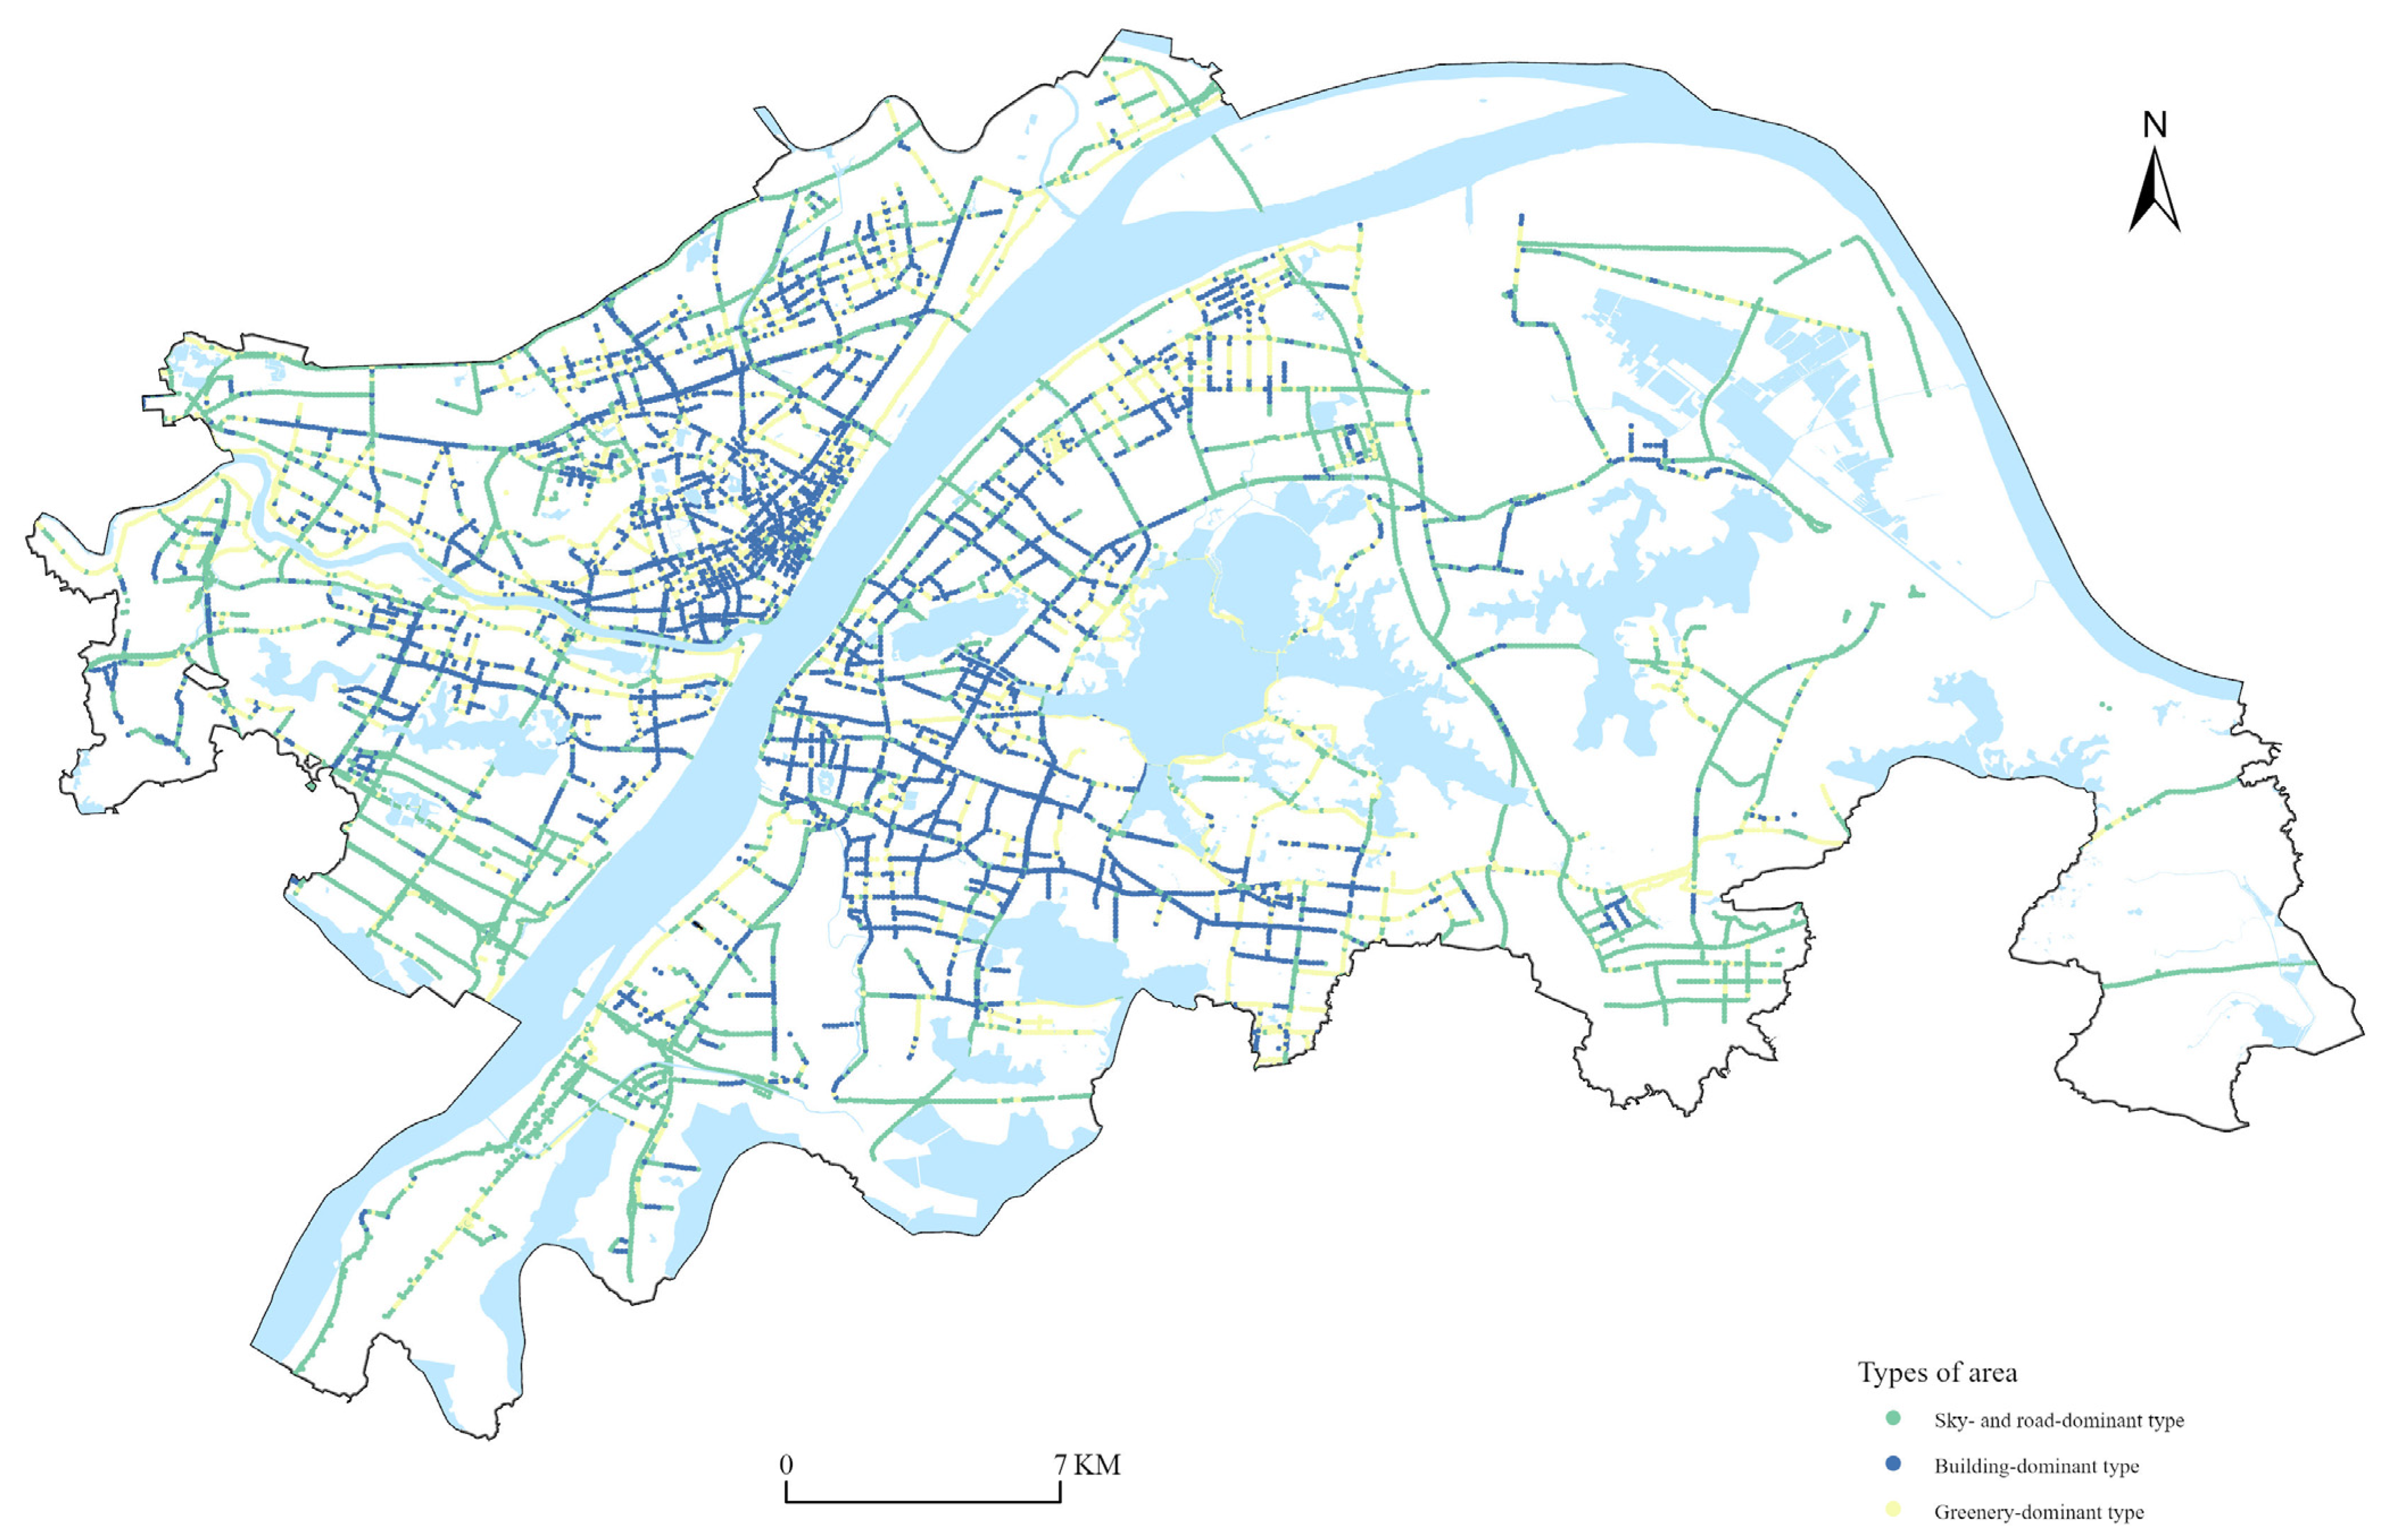
To further analyze the heterogeneous impact of different built environment features on street-level safety perceptions across various regions of Wuhan, this study employed the K-means clustering module via SPSS 25.0 software. This method effectively delineates areas based on their influence on women’s safety perceptions. As a whole, clusters with significant characteristics indicate strong spatial aggregation, and the research area was ultimately classified into three types of regions: Sky- and road-dominant type (Type 1), Building-dominant type (Type 2), and Greenery-dominant type (Type 3) (Table 6 and Figure 11). Type 1 is the main visual domain aggregated in the suburban or industrial area, which tends to be observed along major roads, reflecting a driving visual experience with poor vegetation. The city center area is predominantly classified as Type 2, indicating that earlier built communities contribute to a more inclusive and complex artificial environment. Additionally, safety scores in this area show greater variability. While areas along East Lake, the Han River, and parts of the outer ring are characterized by Type 3, this is likely due not only to their relatively low development density but also to the presence of vegetation that has overgrown these areas. And this area is typically associated with low safety scores.
In addition to local indices, Visual Entropy (VE) negatively affects women’s spatial safety perception. High VE values are primarily concentrated in the urban center and the northern outer rings of Wuhan (Figure 10h). The urban center, characterized by dense construction, typically exhibits higher street complexity compared to the outer city ring. The elevated VE values in the northern outer ring may be attributed to dense vegetation. Both older neighborhoods in the urban center and areas with abundant greenery in the outer ring exhibit high VE values but correspondingly low safety perceptions. Therefore, to enhance women’s safety perception in public spaces, having a broad, unobstructed view is more important than visual diversity.

5. Discussion

This study explored the relationship between women’s safety perception and built environment features, emphasizing the importance of incorporating women’s safety perceptions into urban planning and design. A safety perception map was created by integrating both quantitative and qualitative data. The results reveal significant spatial differences in female safety perception across urban areas [53]. In suburban areas, streets with open vistas tend to have higher safety perception scores, particularly along expressways, whereas minor roads generally receive lower scores. In contrast, safety perceptions in the city center area vary significantly, with some areas perceived as highly secure and others as less secure. This observation aligns with prior research suggesting that low safety scores are often associated with signs of disorder, such as trash, broken pavement, and overgrown vegetation [72]. These indicators are frequently observed in older neighborhoods and along rural roads.
In the second part of this study, we examined the relationship between women’s safety perceptions and the built environment. Previous studies [21,25,29] on human perceptions have primarily focused on specific geographic locations, limiting their ability to provide insights into how residents perceive a continuous geographic area. By utilizing street view images and establishing a regression model, this study links residents’ psychological perceptions with features of the built environment. The results, supported by OLS analysis, reveal a significant correlation between built environment features and safety perceptions. Additionally, the GWR analysis results indicate spatial heterogeneity in the regression coefficients of safety perception across Wuhan, suggesting that different built environment features exert varying levels of influence on the sense of safety. Among local indices, the GVI emerged as having the most substantial negative impact on safety perception. Due to land supply constraints in central urban areas and market forces, green spaces in Chinese cities are often repurposed for alternative land use to maximize profits [68]. As a result, green infrastructure tends to be concentrated in low-cost land areas, which are more common in suburban regions. These green spaces often appear cluttered and contribute to a sense of insecurity. These spaces can evoke feelings of vulnerability in women, resulting in lower safety perceptions [73]. Conversely, the Sky View Factor (SVF) emerged as having the most significant positive influence on the sense of safety. Street view image points located on high-grade roads often correlate positively with a higher SVF, which is associated with a heightened sense of safety. In contrast, low-grade roads, which are more likely to be linked to abandoned or disorderly areas, tend to have lower safety scores. These findings align with prior research [74], which suggests that open views positively enhance women’s safety perceptions. The greater orderliness and openness of high-grade roads contribute to their stronger association with a higher SVF and an improved sense of safety.
In the third part of this study, the research area was segmented into three categories based on the predominant built environment feature affecting safety perception. This segmentation enabled the identification of targeted strategies to enhance women’s safety perceptions in various contexts. In the city center area, characterized by high building densities, streets are primarily configured with a building-dominant layout. The findings align with previous research [75], indicating that the impact of the built environment on public space perceptions in Wuhan is comparable to that in other cities. Consequently, the results of this study offer valuable reference insights for other regions as well. Urban design in these areas typically emphasizes the relationship between street width and the height of surrounding buildings to enhance the sense of safety. However, in suburban areas or along arterial roads like highways, building density has less influence on safety perception, with spatial openness playing a prominent role. Similarly, in greenways and rural roads, the condition and composition of vegetation are the main determinants of safety perception.
Based on these findings, the following recommendations are proposed to create safer and more female-friendly urban public spaces:
(1)
Consideration of vegetation design: In urban public space planning and design, careful attention should be given to the density and height of vegetation. As the modeling shows, the GVI negatively influenced women’s safety perception. That is, excessive vegetation coverage can contribute to the perception of potential danger and diminish safety. Therefore, areas with high vegetation coverage require enhanced management and maintenance.
(2)
Emphasis on spatial openness rather than visual diversity: The spatial openness of public spaces indicated by the SVF has a greater impact on enhancing women’s safety perception compared to the visual diversity of the streetscape. Spacious, well-lit, and orderly streets can effectively improve women’s safety perception.
(3)
Appropriate management of motor vehicles: According to empirical analysis, there are different impacts of the MVR on women’s safety perception in different parts of the city. In the outer urban ring and on branch roads, motor vehicles may not necessarily be perceived as negative factors affecting street safety. Introducing speed reduction measures on branch roads can help to mitigate the sense of insecurity caused by high vehicle speeds.
(4)
Context-specific strategies: Since the landscape composition varies across different urban areas, strategies to enhance female safety perception should be tailored to the specific characteristics of each area.

6. Conclusions

This study, taking into account the female perspective, utilized a street view image dataset and deep learning methods to assess the perception of safety in public spaces. A safety perception map of Wuhan’s public spaces was generated, and FCN-8s was employed to extract objective environmental elements. The GWR model was applied to analyze the differential impacts of these built environment features on safety perceptions, providing valuable insights for planning and designing urban public spaces that better cater to women’s needs.
Firstly, the distribution of women’s safety perception in public spaces of Wuhan generally aligns with the city’s multi-center layout. Significant variations in safety perception are observed in the research areas, with higher-grade roads associated with higher safety perceptions compared to lower-grade roads.
Secondly, built environment features significantly influence women’s perception of safety in public spaces. Notably, higher SVF values are associated with higher safety perception rankings, whereas features such as the GVI and RV have a negative effect.
Thirdly, the influence of different built environment features on women’s safety perceptions exhibits spatial heterogeneity. Wuhan’s primary urban area can be categorized into three types: sky–road-dominant, building-dominant, and greenery-dominant. Each type requires targeted strategies to enhance safety perception across various urban public spaces.
The assessment model for women’s safety perception in urban streets, utilizing deep learning technology and a Tencent Street View image dataset, significantly improved the efficiency of evaluating subjective safety perceptions. This innovative approach offers more detailed and comprehensive insights into urban public safety perceptions, demonstrating the practical value of using advanced technological methods and data to address urban spatial challenges effectively.
Despite the significant contributions of this study, certain limitations remain. Firstly, the female participants were predominantly young women, with samples from other age groups excluded. Women from different age groups may have varying perceptions of safety, which could affect the generalizability of the findings. Secondly, the use of street view images introduces inherent limitations that cannot be avoided. Specifically, the street view images were collected during the daytime, and the Tencent Street View dataset lacks nighttime imagery. This omission excludes the effects of street lighting, a critical factor influencing safety perceptions [76,77], thereby neglecting safety considerations during nighttime. Thirdly, the data collection process relied on sampling vehicles, resulting in a vantage point that differs from the perspective of pedestrians along the street. Consequently, the street view images do not fully represent the pedestrian experience. Incorporating perspectives from pedestrians and cyclists would enhance the model’s generality and applicability. Finally, further analysis is needed to evaluate how changes in the composition or proportion of built environment features within street view images influence safety perceptions in urban public spaces. Addressing these limitations in future studies could provide more comprehensive and nuanced insights.

Author Contributions

Conceptualization, S.L.; Methodology, S.C. and Y.Y.; Validation, S.L. and X.Z.; Formal analysis, S.C. and S.L.; Investigation, S.C.; Data curation, Y.Y.; Writing—original draft, S.C.; Writing—review & editing, S.L., Y.Y. and X.Z.; Supervision, X.Z.; Funding acquisition, S.L. All authors have read and agreed to the published version of the manuscript.

Funding

We would like to acknowledge the funding support from National Natural Science Foundation of China (No. 42471276).

Data Availability Statement

The original contributions presented in this study are included in the article. Further inquiries can be directed to the corresponding authors.

Conflicts of Interest

The authors declare no conflict of interest.

References

  1. Wronkowski, A. Discovering the meaning of contemporary urban squares for its users—A case study of Poznan, Poland. Humanit. Soc. Sci. Commun. 2024, 11, 1000. [Google Scholar] [CrossRef]
  2. Ramírez, T.; Ricardo, H.; Hans, L.; Tomás, R. Measuring heterogeneous perception of urban space with massive data and machine learning: An application to safety. Landsc. Urban Plan. 2021, 208, 104002. [Google Scholar] [CrossRef]
  3. O’Brien, E.A. Publics* and woodlands in England: Well-being, local identity, social learning, conflict and management, Forestry. Int. J. For. Res. 2005, 78, 321–336. [Google Scholar] [CrossRef]
  4. Steinmetz, N.M.; Austin, D.M. Fear of Criminal Victimization on a College Campus: A Visual and Survey Analysis of Location and Demographic Factors. Am. J. Crim. Justice 2014, 39, 511–537. [Google Scholar] [CrossRef]
  5. Madge, C. Public Parks and the Geography of Fear. Tijdschr. Voor Econ. En Soc. Geogr. 1997, 88, 237–250. [Google Scholar] [CrossRef]
  6. Roy, S.; Ajay, B. Safe in the City? Negotiating safety, public space and the male gaze in Kolkata, India. Cities 2021, 117, 103321. [Google Scholar] [CrossRef]
  7. Sadeghi, A.R.; Jangjoo, S. Women’s preferences and urban space: Relationship between built environment and women’s presence in urban public spaces in Iran. Cities 2022, 126, 103694. [Google Scholar] [CrossRef]
  8. Godden, J.O.; Oreopoulos, D.G. Fixing Broken Windows. Hum. Health Care Int. 1997, 13, 5. [Google Scholar]
  9. Seaforth, W. Towards woman-friendly cities. Habitat Debate 2002, 8, 1–3. [Google Scholar]
  10. Grantham, R. Space and Place: The Perspective of Experience. Contemp. Sociol. 1978, 7, 513. [Google Scholar] [CrossRef]
  11. Li, X.; Xu, F.; Gao, H.; Liu, F.; Lyu, X. A Frequency Domain Feature-Guided Network for Semantic Segmentation of Remote Sensing Images. IEEE Signal Process. Lett. 2024, 31, 1369–1373. [Google Scholar] [CrossRef]
  12. Zhao, C.; Liu, C.; Lai, Z. Multi-scale gist feature manifold for building recognition. Neurocomputing 2011, 74, 2929–2940. [Google Scholar] [CrossRef]
  13. Li, K. Research on the Factors Influencing the Spatial Quality of High-Density Urban Streets: A Framework Using Deep Learning, Street Scene Images, and Principal Component Analysis. Land 2024, 13, 1161. [Google Scholar] [CrossRef]
  14. Polko, P.; Kimic, K. Gender as a factor differentiating the perceptions of safety in urban parks. Ain Shams Eng. J. 2021, 13, 101608. [Google Scholar] [CrossRef]
  15. Day, K. Being Feared: Masculinity and Race in Public Space. Environ. Plan. A Econ. Space 2006, 38, 569–586. [Google Scholar] [CrossRef]
  16. Wyant, B.R. Multilevel Impacts of Perceived Incivilities and Perceptions of Crime Risk on Fear of Crime: Isolating Endogenous Impacts. J. Res. Crime Delinq. 2008, 45, 39–64. [Google Scholar] [CrossRef]
  17. Adısönmez, U.C. What is the Human Security Approach and How the Phenomenon Contributed to the International Security Agenda: Canadian and Japanese Paradigms. J. Secur. Strateg. 2016, 12, 1–29. [Google Scholar]
  18. McCormack, G.R.; Rock, M.; Toohey, A.M.; Hignell, D. Characteristics of urban parks associated with park use and physical activity: A review of qualitative research. Health Place 2010, 16, 712–726. [Google Scholar] [CrossRef]
  19. Guedes, I.; Moreira, S.; Cardoso, C.S. The Urban Security Image Database (USID): Development and validation of an image dataset for experimental studies on fear of crime. J. Exp. Criminol. 2023, 19, 465–485. [Google Scholar] [CrossRef]
  20. Sreetheran, M.; Van Den Bosch, C.C.K. A socio-ecological exploration of fear of crime in urban green spaces—A systematic review. Urban For. Urban Green. 2014, 13, 1–18. [Google Scholar] [CrossRef]
  21. De Nadai, M.; Xu, Y.; Letouzé, E.; González, M.C.; Lepri, B. Socio-economic, built environment, and mobility conditions associated with crime: A study of multiple cities. Sci. Rep. 2020, 10, 13871. [Google Scholar] [CrossRef]
  22. Sampson, R.J.; Groves, W.B. Community structure and crime: Testing social-disorganization theory. Am. J. Sociol. 1989, 94, 774–802. [Google Scholar] [CrossRef]
  23. Mak, B.K.L.; Jim, C.Y. Examining fear-evoking factors in urban parks in Hong Kong. Landsc. Urban Plan. 2018, 171, 42–56. [Google Scholar] [CrossRef]
  24. Moghadam, S.N.; Rafieian, M. What did urban studies do for women? A systematic review of 40 years of research. Habitat Int. 2019, 92, 102047. [Google Scholar] [CrossRef]
  25. Sampaio, C.R.A.; Sampaio, S.P.Y.; Yamada, M.; Ogita, M.; Arai, H. Urban-rural differences in physical performance and health status among older Japanese community-dwelling women. J. Clin. Gerontol. Geriatr. 2012, 3, 127–131. [Google Scholar] [CrossRef]
  26. Ogwumike, O.; Kaka, B.; Adegbemigun, O.; Abiona, T. Health-related and socio-demographic correlates of physical activity level amongst urban menopausal women in Nigeria. Maturitas 2012, 73, 349–353. [Google Scholar] [CrossRef]
  27. Hancock, C.; Blanchard, S.; Chapuis, A. Banlieusard, e.s. Claiming a right to the City of Light: Gendered violence and spatial politics in Paris. Cities 2018, 76, 23–28. [Google Scholar] [CrossRef]
  28. Fabula, S.; Judit, T. Violations of the right to the city for women with disabilities in peripheral rural communities in Hungary. Cities 2018, 76, 52–57. [Google Scholar] [CrossRef]
  29. Krenichyn, K. Women and physical activity in an urban park: Enrichment and support through an ethic of care. J. Environ. Psychol. 2004, 24, 117–130. [Google Scholar] [CrossRef]
  30. Young, I.M. On Female Body Experience: “Throwing like a Girl” and Other Essays; Oxford University Press: Oxford, UK, 2005. [Google Scholar]
  31. Moser, C.O.N. Mainstreaming women’s safety in cities into gender-based policy and programmes. Gend. Dev. 2012, 20, 435–452. [Google Scholar] [CrossRef]
  32. Van de Pol, L.; Kuijpers, E. Poor Women’s Migration to the City: The Attraction of Amsterdam Health Care and Social Assistance in Early Modern Times. J. Urban Hist. 2005, 32, 44–60. [Google Scholar] [CrossRef]
  33. Das, D.; Safini, H. Water Insecurity in Urban India: Looking Through a Gendered Lens on Everyday Urban Living. Environ. Urban. ASIA 2018, 9, 178–197. [Google Scholar] [CrossRef]
  34. Salesses, P.; Schechtner, K.; Hidalgo, C.A. The Collaborative Image of The City: Mapping the Inequality of Urban Perception. PLoS ONE 2013, 8, e68400. [Google Scholar] [CrossRef]
  35. Dubey, A.; Nikhil, N.; Devi, P.; Ramesh, R.; Hidalgo, C.A. Deep Learning the City: Quantifying Urban Perception at a Global Scale. In Computer Vision–ECCV 2016: 14th European Conference, Amsterdam, The Netherlands, 11–14 October 2016, Proceedings, Part I 14; Springer International Publishing: Cham, Switzerland, 2016. [Google Scholar]
  36. Wang, C.; Wang, L.; Gu, T.; Hao, E.; Chen, Y.; Zhang, H. Evaluating Smart Community Development in China from the Perspective of Residents’ Sense of Safety: An Analysis Using Criteria Importance through Intercriteria Correlation and Fuzzy Comprehensive Evaluation Approaches. Land 2024, 13, 1434. [Google Scholar] [CrossRef]
  37. Less, E.L.; McKee, P.; Toomey, T.; Nelson, T.; Erickson, D.; Xiong, S.; Jones-Webb, R. Matching study areas using Google Street View: A new application for an emerging technology. Eval. Program Plan. 2015, 53, 72–79. [Google Scholar] [CrossRef]
  38. Ewing, R. Characteristics, Causes, and Effects of Sprawl: A Literature Review. In Urban Ecology; Springer: Boston, MA, USA, 2008. [Google Scholar]
  39. Tang, J.; Long, Y. Measuring visual quality of street space and its temporal variation: Methodology and its application in the Hutong area in Beijing. Landsc. Urban Plan. 2019, 191, 103436. [Google Scholar] [CrossRef]
  40. Ma, X.; Ma, C.; Ma, C.; Xi, Y.; Yang, R.; Peng, N.; Zhang, C.; Ren, F. Measuring human perceptions of streetscapes to better inform urban renewal: A perspective of scene semantic parsing. Cities 2021, 110, 103086. [Google Scholar] [CrossRef]
  41. Li, X.; Cai, B.Y.; Ratti, C. Using Street-level Images and Deep Learning for Urban Landscape studies. Landsc. Archit. Front. 2018, 6, 20–29. (In Chinese) [Google Scholar] [CrossRef]
  42. Li, X.; Xu, F.; Lyu, X.; Gao, H.; Tong, Y.; Cai, S.; Li, S.; Liu, D. Dual attention deep fusion semantic segmentation networks of large-scale satellite remote-sensing images. Int. J. Remote Sens. 2021, 42, 3583–3610. [Google Scholar] [CrossRef]
  43. Salesses, M.P. Place Pulse: Measuring the Collaborative Image of the City. Master’s Thesis, Massachusetts Institute of Technology, Cambridge, MA, USA, 2013. [Google Scholar]
  44. Gu, Y.; Hu, Y.; Shi, H. Research on Perception Evaluation of Street Environment Safety in Old Residential Area Based on Street View Picture. Urban Environ. Des. 2022, 6, 317–323. (In Chinese) [Google Scholar]
  45. Li, X.; Yan, H.; Wang, Z.; Wang, B. Evaluation of Road Environment Safety Perception and Analysis of Influencing Factors Combining Street View Imagery and Machine Learning. J. Geo-Inf. Sci. 2023, 25, 852–865. (In Chinese) [Google Scholar]
  46. Naik, N.; Philipoom, J.; Raskar, R.; Hidalgo, C. Streetscore–Predicting the Perceived Safety of One Million Streetscapes. In Proceedings of the IEEE Conference on Computer Vision and Pattern Recognition Workshops, Columbus, OH, USA; 2014; pp. 793–799. [Google Scholar]
  47. Yao, Y.; Liang, Z.; Yuan, Z.; Liu, P.; Bie, Y.; Zhang, J.; Wang, R.; Wang, J.; Guan, Q. A human-machine adversarial scoring framework for urban perception assessment using street-view images. Int. J. Geogr. Inf. Sci. 2019, 33, 2363–2384. [Google Scholar] [CrossRef]
  48. Ogawa, Y.; Oki, T.; Zhao, C.; Sekimoto, Y.; Shimizu, C. Evaluating the subjective perceptions of streetscapes using street-view images. Landsc. Urban Plan. 2024, 247, 105073. [Google Scholar] [CrossRef]
  49. Xu, J.; Xiong, Q.; Jing, Y.; Xing, L.; An, R.; Tong, Z.; Liu, Y.; Liu, Y. Understanding the nonlinear effects of the street canyon characteristics on human perceptions with street view images. Ecol. Indic. 2023, 154, 110756. [Google Scholar] [CrossRef]
  50. Li, X.; Zhang, C.; Li, W. Does the Visibility of Greenery Increase Perceived Safety in Urban Areas? Evidence from the Place Pulse 1.0 Dataset. ISPRS Int. J. Geo-Inf. 2015, 4, 1166–1183. (In Chinese) [Google Scholar] [CrossRef]
  51. Fotheringham, A.; Brunsdon, C.; Charlton, M. Geographically Weighted Regression: The Analysis of Spatially Varying Relationships; John Wiley & Sons: Hoboken, NJ, USA, 2002; Volume 13. [Google Scholar]
  52. Dziauddin, M.F. Estimating land value uplift around light rail transit stations in Greater Kuala Lumpur: An empirical study based on geographically weighted regression (GWR). Res. Transp. Econ. 2019, 74, 10–20. [Google Scholar] [CrossRef]
  53. Yang, W.; Yang, R.; Zhou, S. The spatial heterogeneity of urban green space inequity from a perspective of the vulnerable: A case study of Guangzhou, China. Cities 2022, 130, 103855. [Google Scholar] [CrossRef]
  54. Lin, S.; Liu, X.; Wang, T.; Li, Z. Revisiting entrepreneurial governance in China’s urban redevelopment: A case from Wuhan. Urban Geogr. 2022, 44, 1520–1540. [Google Scholar] [CrossRef]
  55. Tsochantaridis, I.; Joachims, T.; Hofmann, T.; Altun, Y.; Singer, Y. Large Margin Methods for Structured and Interdependent Output Variables. J. Mach. Learn. Res. 2005, 6, 1453–1484. [Google Scholar]
  56. Li, J.; Zeng, H.; Xiao, C.; Ouyang, C.; Liu, H. Listwise learning to rank method combining approximate NDCG ranking indicator with Conditional Generative Adversarial Networks. Pattern Recognit. 2024, 179, 31–37. [Google Scholar] [CrossRef]
  57. Li, H. A Short Introduction to Learning to Rank. IEICE Trans. Inf. Syst. 2011, 94, 1854–1862. [Google Scholar] [CrossRef]
  58. Burges, C.; Shaked, T.; Renshaw, E.; Lazier, A.; Deeds, M.; Hamilton, N.; Hullender, G. Learning to rank using gradient descent. In Proceedings of the 22nd International Conference on Machine Learning, Bonn, Germany, 7–11 August 2005. [Google Scholar]
  59. Song, Q.; Liu, A.; Yang, S.Y. Stock portfolio selection using learning-to-rank algorithms with news sentiment. Neurocomputing 2017, 264, 20–28. [Google Scholar] [CrossRef]
  60. Ye, Y.; Zhang, Z.; Zhang, X.; Zeng, W. Human-scale Quality on Streets: A Large-scale and Efficient Analytical Approach Based on Street View Images and New Urban Analytical Tools. Urban Plan. Int. 2019, 34, 18–27. [Google Scholar] [CrossRef]
  61. Bivand, R.; Müller, W.G.; Reder, M. Power calculations for global and local Moran’s I. Comput. Stat. Data Anal. 2009, 53, 2859–2872. [Google Scholar] [CrossRef]
  62. Anselin, L. Local Indicators of Spatial Association—LISA. Geogr. Anal. 1995, 27, 93–115. [Google Scholar] [CrossRef]
  63. Long, J.; Shelhamer, E.; Darrell, T. Fully Convolutional Networks for Semantic Segmentation. IEEE Trans. Pattern Anal. Mach. Intell. 2015, 39, 640–651. [Google Scholar]
  64. Chen, J.; Luo, F. A Survey of Image Semantic Segmentation Algorithm Based on Deep Learning. Acad. J. Sci. Technol. 2023, 5, 13–14. [Google Scholar] [CrossRef]
  65. Liu, Y.; Yuan, Y.; Xing, H.; Meng, Y.; Niu, T. The Applicability of Street View Images to Identify Urban Poverty in the Central Urban Region of Guangzhou. Trop. Geogr. 2020, 40, 919–929. (In Chinese) [Google Scholar]
  66. Ma, R.; Huang, A.; Cui, H.; Yu, R.; Peng, X. Spatial heterogeneity analysis on distribution of intra-city public electric vehicle charging points based on multi-scale geographically weighted regression. Travel Behav. Soc. 2023, 35, 100725. [Google Scholar] [CrossRef]
  67. Pang, R.; Teng, F.; Wei, Y. A GWR-Based Study on Dynamic Mechanism of Population Urbanization in Jilin Province. Sci. Geogr. Sin. 2014, 34, 1210–1217. (In Chinese) [Google Scholar]
  68. Gu, H.; Meng, X.; Shen, T.; Cui, N. Spatial variation of the determinants of China’s urban floating population’s settlement intention. Acta Geogr. Sin. 2020, 75, 240–254. (In Chinese) [Google Scholar]
  69. Jia, J.; Zhang, X.; Huang, C.; Luan, H. Multiscale analysis of human social sensing of urban appearance and its effects on house price appreciation in Wuhan, China. Sustain. Cities Soc. 2022, 81, 103844. [Google Scholar] [CrossRef]
  70. Lee, K.H.; Luan, S.; Lee, J.R.; Chun, S.; Heo, J. Geographically varying associations between mentally unhealthy days and social vulnerability in the USA. Public Health 2023, 222, 13–20. [Google Scholar] [CrossRef]
  71. Ikotun, A.M.; Absalom, E.E.; Abualigah, L.; Abuhaija, B.; Jia, H. K-means clustering algorithms: A comprehensive review, variants analysis, and advances in the era of big data. Inf. Sci. 2023, 622, 178–210. [Google Scholar] [CrossRef]
  72. Zhang, F.; Fan, Z.; Kang, Y.; Hu, Y.; Ratti, C. “Perception bias”: Deciphering a mismatch between urban crime and perception of safety. Landsc. Urban Plan. 2021, 207, 104003. [Google Scholar] [CrossRef]
  73. Skår, M. Forest dear and forest fear: Dwellers’ relationships to their neighborhoods forest. Landsc. Urban Plan. 2010, 98, 110–116. [Google Scholar] [CrossRef]
  74. Liang, X.; Zhao, T.; Biljecki, F. Revealing spatio-temporal evolution of urban visual environments with street view imagery. Landsc. Urban Plan. 2023, 237, 104802. [Google Scholar] [CrossRef]
  75. Gargiulo, I.; Garcia, X.; Benages-Albert, M.; Martinez, J.A.; Pfeffer, K.; Vall-Casas, P. Women’s safety perception assessment in an urban stream corridor: Developing a safety map based on qualitative GIS. Landsc. Urban Plan. 2020, 198, 103779. [Google Scholar] [CrossRef]
  76. Burattini, C.; Bisegna, F.; De Santoli, L. Street luminance and night-time walking comfort: A new perspective for the urban lighting design. J. Urban Des. 2024, 1–19. [Google Scholar] [CrossRef]
  77. Davoudian, N.; Raynham, P. What do pedestrians look at night? Light. Res. Technol. 2012, 44, 438–448. [Google Scholar] [CrossRef]
Figure 1. Research area.
Land 13 02108 g001
Figure 2. Viewpoint picture collection from four different directions. The urban landscape in a viewpoint can be broken down into four images: the front image, the back image, the left image, and the right image.
Land 13 02108 g002
Figure 3. The technical framework.
Land 13 02108 g003
Figure 4. Street safety labeling tool.
Land 13 02108 g004
Figure 5. Street view image safety perception scoring process.
Land 13 02108 g005
Figure 6. RankNet algorithm framework.
Land 13 02108 g006
Figure 7. Street View images segmented by FCN-8s.
Land 13 02108 g007
Figure 8. Women’s safety perception in Wuhan.
Land 13 02108 g008
Figure 9. The result of Moran’s I based on women’s safety perception.
Land 13 02108 g009
Figure 10. The spatial pattern of factors influencing women’s safety perception in Wuhan. (a) Spatial differences in SVF regression coefficients. (b) Spatial differences in GVI regression coefficients. (c) Spatial differences in BVI regression coefficients. (d) Spatial differences in FV regression coefficients. (e) Spatial differences in MVR regression coefficients. (f) Spatial differences in RV regression coefficients. (g) Spatial differences in SV regression coefficients. (h) Spatial differences in VE regression coefficients.
Land 13 02108 g010aLand 13 02108 g010b
Figure 11. Classification of areas based on dominant factors.
Land 13 02108 g011
Table 1. Definition and measures of built environment elements.
VariablesExplanationsMeasures
Local indexGreen View Index (GVI)The average proportion of vegetation (including trees, grass, three-dimensional greening, etc.) in the street view image [3]. P = i = 1 4 T i i = 1 4 N i
T i is vegetation/sky/construction/
vehicle/facility/total pavement/roadway pixels;
i represents the i t h map of the street viewpoint; N is the total number of pixels in a street view image.
Sky View Factor (SVF)An index for the openness of streets that reflects the degree of visible sky [4,5].
Building View Index (BVI)The average of the proportion of buildings (buildings, structures, and walls) in the street view images [5].
Motor vehicle occurrence rate (MVR)The average proportion of pixels in the four images of vehicles in the street view image, which reflects the probability of vehicle occurrence [5].
Facility visibility (FV)The proportion of pixels of street furniture, municipal facilities, billboards, and other street facilities in the total pixels of the street view.
Sidewalk visibility (SV)The average proportion of pixels of the sidewalk in the street view image [5].
Roadway visibility (RV)The average of the pixel proportion of the four images in the street view image [5].
Global indexVisual Entropy (VE)Information can be used to reflect the visual complexity of the street landscape [5]. H i = i = 0 255 P i log P i
H i is univariate gray-level entropy;
P i is the probability that a grayscale appears in the image.
Table 2. Statistics of built environment features.
VariableMeanStdMinMedianMax
SVF26.99%0.1467026.02%70.59%
GVI14.51%0.1346010.64%83.52%
SV3.08%0.032802.01%26.80%
BVI21.14%0.1456019.55%82.53%
VE0.90550.06630.06670.9183 0.9815
MVR3.49%0.038202.33%33.76%
FV0.89%0.014400.43%24.30%
RV18.28%0.0772018.93%38.74%
Table 3. Estimation coefficients of OLS model.
VariableCoefficientSt. Errort-StatisticProbabilityVIF
CONSTANT0.4998790.0000519709.4772720-----
SVF0.0015020.00004533.45455204.291136
GVI−0.003523330.000043−72.99593103.350295
SV−0.0013030.000116−11.26593101.424575
BVI−0.0002470.000046−5.58593904.441621
VE−0.0006410.000055−11.69273301.307091
MVR−0.0004670.000094−4.97519801.273709
FV−0.0018750.000236−7.94448101.149447
RV−0.00740.000048−15.39239301.363754
Table 4. Estimation coefficients of GWR model.
VariableEst.SEt (Est/SE)p-Value
Intercept00.00501
SVF0.3130.00933.4550
GVI−0.6040.008−72.9960
SV−0.0610.005−11.2660
BVI−0.0530.01−5.5860
VE−0.060.005−11.6930
MVR−0.0250.005−4.9750
FV−0.0380.005−7.9440
RV−0.0810.005−15.3920
Table 5. Statistical description of GWR model coefficients.
VariableMeanSTDMinMedianMax
Intercept−0.1260.438−4.405−0.1052.266
SVF0.3200.468−2.0420.3032.578
GVI−0.5600.384−2.609−0.5681.645
SV−0.0250.195−1.658−0.0200.951
BVI0.0110.391−2.3790.0202.071
VE−0.2180.416−2.481−0.1871.424
MVR−0.0030.243−3.3460.0052.116
FV−0.0490.152−0.748−0.0410.735
RV−0.0040.207−0.763−0.0010.890
Table 6. Classification of different types based on dominant factors.
VariableType 1Type 2Type 3
SVF0.4152371570.1655895670.185132122
GVI0.0969513970.0803263880.349499414
SV0.0153434750.0378881620.046957979
BVI0.1153350610.3565205320.131956194
MVR0.0231846245260.0480747940160.033233683143
FV0.0086607790.0108330770.006030477
RV0.2071315140.1769466290.148069636
Disclaimer/Publisher’s Note: The statements, opinions and data contained in all publications are solely those of the individual author(s) and contributor(s) and not of MDPI and/or the editor(s). MDPI and/or the editor(s) disclaim responsibility for any injury to people or property resulting from any ideas, methods, instructions or products referred to in the content.