Abstract
The frequent occurrence of Public Health Emergencies of International Concern (PHEIC) has posed significant challenges to urban public health, economic, and social systems, exposing gaps in urban resilience. This study developed a dynamic urban resilience assessment framework against PHEIC based on the system dynamics method, integrating index analysis and the SEIR (susceptible–exposed–infectious–recovered) epidemiological model to investigate the interactions and dynamic evolution of urban subsystems in New York, Hong Kong, and Nanjing during the COVID-19 epidemic. The findings revealed significant differences in the response mechanisms and recovery capacities across subsystems. For example, the stringent lockdowns policy in New York curbed virus spread and heavily impacted economic activities; the “close to Dynamic zero of COVID-19” policy in Hong Kong demonstrated stronger resilience in balancing public health and economic recovery; the dynamic control measures in Nanjing China allowed for the rapid restoration of urban functions with minimal resilience fluctuations. Although strict control measures can effectively suppress disease spread, they can have profound economic and social impacts. More scientific strategies, such as those seen in Hong Kong and Nanjing, offer a more balanced approach to managing both epidemic control and urban function recovery, providing key insights for future PHEIC response strategies.
1. Introduction
With the acceleration of globalization, cities, as central hubs of human activity, have become important platforms for the integration of economy, culture, and technology [1,2,3]. The urbanization process resulted in a high concentration of population and resources, leading to increasingly prosperous economic development and social life in cities. However, it also introduced more complex risks and challenges [4]. In particular, the frequent occurrence of PHEICs in recent years has placed immense pressure on urban infrastructure and service systems, posing serious threats to the safety and well-being of urban residents [5].
The COVID-19 pandemic, which began in 2020 and persisted until 2023, has been one of the most extensive and far-reaching events to impact global urban systems [6]. The pandemic not only led to a widespread disruption of economic activities, severely affecting both the service and manufacturing sectors, but also placed significant strain on urban infrastructure systems, with healthcare and public service systems operating at maximum capacity for extended periods. Additionally, the cholera and MPXV (monkeypox) outbreaks in 2022 similarly had wide-ranging impacts on public health and infrastructure systems around the world, further exposing the vulnerabilities and inadequacies of cities in responding to PHEICs [7].
As complex and networked systems, cities exhibit high levels of interconnectivity and dynamic characteristics, where fluctuations in any given node or edge can trigger chain reactions throughout the entire system [8]. Consequently, when cities face PHEICs, they are often impacted on multiple levels, making it crucial to mitigate disturbances at these nodes and edges [9]. In this context, developing scientifically sound response strategies, enhancing urban resilience, and minimizing the effects of external shocks on urban systems have become urgent challenges [10]. However, due to the inherent complexity of urban systems, the internal interaction mechanisms, nodal connections, and dynamic evolution patterns still require further clarification and exploration.
Against this backdrop, this study aimed to elucidate the interactions among various subsystems within urban systems and identify the mechanisms by which PHEICs impact cities. First, through a systematic literature review, four key urban functional subsystems—urban economy, infrastructure and health, policy governance, and energy and supplies—were identified [11,12]. Based on these subsystems, a resilience indicator framework was established to reflect the functional performance of cities. Next, using system dynamics (SD), causal loop diagrams (CLDs) of the subsystems were developed to illustrate the interactions and feedback mechanisms within urban functions, aiding in the identification of complex interactions during PHEICs. These CLDs were further transformed into stock and flow diagrams (SFDs), and the VENSIM software (Vensim PLE x32) was used to simulate the dynamic changes in the subsystems during PHEICs, providing quantitative analysis and data support.
Subsequently, the SEIR epidemiological model was integrated into the SFD framework to simulate the impact of disease transmission on the various subsystems and to evaluate the effectiveness of different policy interventions. The SEIR model, commonly used in epidemiological studies, divides the population into four categories: susceptible (individuals at risk of contracting the disease), exposed (infected individuals not yet infectious), infectious (actively spreading the disease), and recovered (those who have gained immunity or succumbed to the disease) [13]. This compartmental structure enables the detailed modeling of disease progression and helps assess the impacts of interventions such as lockdowns. By incorporating the SEIR model, our study enhanced the ability to simulate how disease dynamics affect urban systems and provided a robust framework for evaluating policy effectiveness in managing public health crises.
Finally, through the simulations of various policy scenarios, the effects of policies on urban resilience were assessed, helping policymakers formulate optimal strategies to enhance the recovery of urban functions. The methodology offers important decision-making support for local governments to balance urban functionality with public health crisis management when responding to sudden public health events.
2. Literature Review
2.1. Urban Resilience Framework and Indicators
The term “resilience” originally comes from the fields of physics and mechanics, referring to the ability of an object to return to its original state after undergoing elastic deformation. Holling first applied the concept of resilience to the field of ecology, where he defined it as the capacity of an ecosystem to resist and absorb change and recover from a shock [14]. As the concept of resilience further developed across various scientific fields, Walker et al. argued that resilience not only refers to the ability of a system to return to its original state but also encompasses the capacity of complex socio-ecological systems to adapt, transform, and reorganize in response to disturbances [15]. This adaptability and transformative capacity reflect the dynamic and evolutionary nature of resilience, enabling systems to maintain functionality while forging new developmental pathways amidst change. At present, the concept of “resilience” has been widely applied across various research domains, including key areas such as infrastructure [16,17], ecosystem [18], economic [19], and supply chains [20], generally denoting that “the capacity of a system to withstand external shocks and maintain its core structure and function during crises” [21].
Despite these diverse applications of resilience in fields such as infrastructure, ecosystems, economics, and supply chains, there is still no consensus on a unified definition of resilience, largely due to the varying contexts in which it is applied. This definitional ambiguity is particularly evident in the study of urban systems, which are highly complex and multidimensional entities [22]. Cities are not merely collections of physical structures; they encompass multiple layers, including social, economic, environmental, and technological aspects [23]. Thus, defining urban resilience requires a multidimensional framework that can comprehensively account for these various facets—economic, social, environmental, and technological—altogether forming the “urban system”. In this study, we emphasize the definition of urban resilience proposed by Bozza et al. [24], which conceptualizes urban system resilience as a capacity inherent to complex systems. Specifically, such complex systems are composed of heterogeneous components that interact and coexist, enabling them to withstand external pressures and either return to their original equilibrium state or transition to a new equilibrium state (i.e., an improved condition). This definition highlights the flexibility and recovery capability of urban systems in dynamic adaptation and evolution.
As the most severe PHEIC in the past decade, COVID-19 has garnered sustained academic attention. Researchers have explored the response capacity and resilience of urban systems to epidemic disruptions from various dimensions, such as infrastructure and healthcare, energy and material supply, urban economy, and policy governance. To better understand urban resilience, it is critical to examine how these subsystems interact dynamically during a crisis. For instance, during COVID-19, increased demand for healthcare infrastructure (e.g., hospital beds and medical supplies) often diverted resources from other sectors, such as energy and transportation, resulting in cascading effects that disrupted the overall functionality of urban systems [25]. Simultaneously, policy interventions, such as lockdown measures, reduced transportation activities, which, in turn, affected economic production and supply chain operations [26].
In the domain of critical infrastructure and healthcare, the pandemic highlighted the necessity of adaptive urban systems to respond to public health emergencies effectively [27]. Healthcare infrastructure experienced increased pressure due to reallocations of resources, including funding, medical personnel, and hospital bed capacity [28]. Indicators such as ICU occupancy rates have emerged as critical measures for assessing the resilience and recovery capacity of healthcare systems [29]. For instance, the allocation of resources and operational priorities in healthcare services shifted significantly to address pandemic pressures, while information and communication technology (ICT) was widely deployed to support the prevention and control capabilities of healthcare services, thereby enhancing the overall resilience of urban systems [30,31]. Furthermore, the dependency relationships between infrastructure networks shifted significantly during the pandemic. For example, transportation networks adapted to prioritize the movement of essential goods and healthcare supplies, illustrating a redirection in logistical capacity to support healthcare needs [32]. These changes highlight the interconnectedness of urban subsystems, where adjustments in one sector (e.g., transportation) ripple through others, affecting both infrastructure functionality and economic performance [33]. Meanwhile, the dependency relationships within urban infrastructure networks gradually shifted from traditional domains such as energy and water to critical sectors supporting public health, transportation, and essential services, highlighting the profound impact of the pandemic on infrastructure adaptability and interconnectivity [34].
As previously mentioned, lockdown policies and restrictions on infected areas significantly disrupted the transportation of energy and materials during the pandemic. In terms of energy demand, industrial and commercial electricity consumption declined sharply, while household electricity usage increased [35]. These fluctuations highlight the inherent vulnerability of energy systems and emphasize the need for greater flexibility and adaptability in energy supply chains. The substantial decline in regional energy demand further exacerbated supply–demand imbalances, creating significant challenges for socio-economic recovery [36]. Moreover, disruptions in material supply chains caused by mobility restrictions revealed the complexity of maintaining urban functionality under crisis conditions. In particular, the limited adaptability of logistics networks during the pandemic led to cascading impacts across multiple urban sectors, amplifying vulnerabilities in interconnected urban systems [37]. These findings underscore the critical importance of developing resilient energy and material supply systems capable of absorbing and adapting to shocks [38]. By enhancing supply chain flexibility and implementing dynamic response strategies, urban resilience against future PHEICs can be significantly strengthened.
Studies exploring changes in urban economic resilience and response strategies under COVID-19 demonstrated that the pandemic significantly impacted urban economic resilience, with delayed effects leading to a slower recovery of socio-economic systems. The intricate interactions among stakeholders in complex systems further prolonged the recovery process, underscoring the need for targeted policy interventions at different stages of the pandemic [39]. Moreover, research highlighted the critical role of institutional quality at the national level in shaping urban economic resilience, as high-quality institutional arrangements enhance a system’s capacity to adapt and recover during crises [40]. Early studies also evaluated the positive impact of China’s lockdown policies during the initial stages of the COVID-19 outbreak on reducing daily confirmed cases. This finding underscores the importance of early interventions and strict lockdown measures in responding to public health crises, providing valuable insights for other countries and regions [41].
In summary, research across multiple dimensions—healthcare infrastructure, energy and material supply, urban economy, and governance—revealed the multifaceted challenges faced by urban systems during COVID-19 and their corresponding strategies. These studies provide critical theoretical support and practical guidance for strengthening urban resilience and formulating effective policies to address future public health emergencies.
2.2. Methods for Evaluating Urban Resilience
Urban resilience is challenging to measure directly, and most studies rely on the 4R characteristics—robustness, redundancy, rapidity, and resourcefulness—to describe it. Traditional evaluation methods often focus on static indicators, quantifying resilience based on attributes at specific time points [42,43,44]. While these methods provide a foundation for research, they frequently overlook the dynamic and evolving nature of resilience, relying heavily on abstract concepts that fail to accurately reflect urban performance during crises [45]. Given that the normal functioning of cities depends on the effective support of critical functions [46], systematically assessing and quantifying these functions is essential. However, static frameworks often ignore temporal changes and feedback loops within urban systems, limiting their ability to comprehensively capture adaptability and recovery capacities [47]. To address these limitations, researchers increasingly turned to dynamic evaluation frameworks that aim to capture the continuous evolution of urban resilience [48,49]. These frameworks integrate real-time data and simulation techniques to account for temporal changes and the complex interdependencies within systems. Some studies adopted advanced simulation techniques to achieve more precise and dynamic assessments. For example, hypergraph network analysis was used to classify post-disaster resident needs and simulate their dynamic interactions with infrastructure recovery, illuminating the relationships between demands and resources [50]. Complex network theory was also employed to develop a time-independent comprehensive index framework for quantifying resilience, simulating recovery strategies, and evaluating resilience performance across different stages [51]. While these models excel in analyzing transportation, infrastructure, and supply chain resilience, their applicability to economic and policy subsystems remains limited, underscoring the importance of adopting integrated multi-method approaches [52].
Within the dynamic evaluation frameworks, SD modeling demonstrated unique advantages in urban resilience research. Its strengths include dynamic analysis, scenario simulation, feedback mechanism identification, multi-domain integration, and visualization capabilities, making it a powerful tool for understanding and enhancing urban resilience [53,54]. SD models can integrate data from socio-economic, infrastructure, and environmental domains, providing a unified framework for evaluating urban resilience [55,56]. For instance, SD-based studies were applied to assess the long-term resilience of transportation systems, offering valuable insights into the durability of urban transportation under stress [57,58]. Additionally, SD models were employed to explore the interactions among food supply chains, water resource management, and energy systems, further emphasizing the critical role of multi-domain integration in improving urban resilience [59,60].
These applications validate the versatility of SD across different urban systems and disaster contexts while also advancing the understanding of the multidimensional and multi-level characteristics of urban resilience. By integrating dynamic data and multi-domain analyses, SD models provide robust scientific foundations for future urban planning and policy formulation.
2.3. Urban Governance in Public Health Emergencies
In the context of accelerated global urbanization, PHEICs pose significant challenges to the sustainable development of cities. In recent years, urban resilience has increasingly become a key component of urban development strategies worldwide, as well as an innovative concept and emerging trend in global urban planning. Research showed that PHEICs, as prolonged and widespread public health crises, not only expose the vulnerabilities of urban systems but also prompt countries to re-evaluate how to enhance their cities’ adaptive capacities to cope with uncertainties and multiple crises [61].
Effective governance encompasses both swift emergency responses and the establishment of long-term frameworks to enhance urban adaptability and recovery capacities [62]. Key strategies include optimizing governance structures, allocating emergency resources, building robust public health infrastructure, and restoring economic stability. The COVID-19 pandemic, one of the most severe PHEICs, exposed both the strengths and weaknesses in urban crisis governance [63]. It revealed significant deficiencies in coordination, resource allocation, and decision-making mechanisms, underscoring the need for optimized governance structures. For instance, Singapore’s centralized crisis response model ensured the swift deployment of resources and coordination among stakeholders during the pandemic, minimizing disruptions to public health services and infrastructure [64]. Moreover, Hong Kong’s implementation of timely quarantine and strict border control measures helped maintain economic stability while effectively limiting virus spread [65]. However, unclear roles and fragmented coordination among agencies often led to slow crisis responses, highlighting the importance of streamlined and well-coordinated mechanisms [66,67].
The allocation of emergency resources and the enhancement of public health infrastructure are critical to mitigating the impacts of PHEICs. Studies emphasized the importance of sufficient medical facilities, quarantine sites, and emergency supplies, as well as robust infrastructure support systems, in maintaining public safety and bolster urban resilience [68,69]. However, the early stages of COVID-19 revealed gaps in resource availability and distribution, emphasizing the need for improved preparedness and rapid deployment mechanisms [70]. Economic recovery is equally pivotal, reflecting a city’s ability to sustain operations, minimize losses, and support social stability during crises [71]. Cities with diverse economic structures and strong innovation capabilities demonstrate higher adaptability, emphasizing the importance of fostering economic resilience through policy support and innovation-driven growth [72,73].
In conclusion, addressing the complex challenges posed by PHEICs requires an integrated urban governance approach that not only enhances immediate response capacities but also builds long-term resilience across interconnected urban subsystems. By prioritizing effective coordination, resource allocation, infrastructure development, and economic adaptability, cities can better withstand and recover from public health crises, ensuring sustainable development in an increasingly uncertain global environment.
2.4. Summary of Literature Review
The existing literature on urban resilience encompasses diverse dimensions such as infrastructure, ecosystems, economy, and supply chains, highlighting cities’ recovery capacities during PHEICs. However, the definition and quantification of resilience remain inconsistent, especially in interdisciplinary studies. Most current methods rely on static indicators and qualitative analysis, which are insufficient to capture the dynamic evolution and recovery processes of urban systems under external shocks [74]. While some studies have attempted to use dynamic evaluation methods and simulation models, these often focus on specific domains like transportation or infrastructure and fail to address the interactions and feedback mechanisms among urban subsystems comprehensively. Existing research on governance strategies largely examines isolated areas such as emergency resource allocation or public health systems, with limited exploration of integrated multi-subsystem dynamics.
Given the research gaps, this study aimed to construct a dynamic urban resilience assessment framework that systematically evaluates the overall impact of PHEICs on urban systems by integrating the SD method, SEIR model, and a comprehensive set of indicators from the sustainable development framework. This model combined epidemic simulation with a comprehensive indicator system within the sustainable development framework, enabling decision-makers to understand the changes more intuitively in urban resilience under disaster shocks. The main contributions of this study were threefold: (1) measuring a city’s disaster resilience through the functional changes of different subsystems, describing the key operating mechanisms of the entire urban system within the SD model; (2) the proposed comprehensive model overcame the limitations of traditional static indicators in simulating the dynamic changes in urban systems in response to external shocks, providing a new method for disaster resilience assessment; (3) by simulating epidemic scenarios with different characteristics, this study expanded the scope of PHEIC research and offered decision support for policymakers.
3. Methodology and Data Collection
3.1. Overview of Research Methods
In order to analyze the changes in urban resilience in the context of PHEICs, this study constructed a multi-method evaluation framework, aiming to provide a universal analytical tool for different cities, as shown in Figure 1. The framework can be applied to different cities to assess urban resilience, with the following key steps:
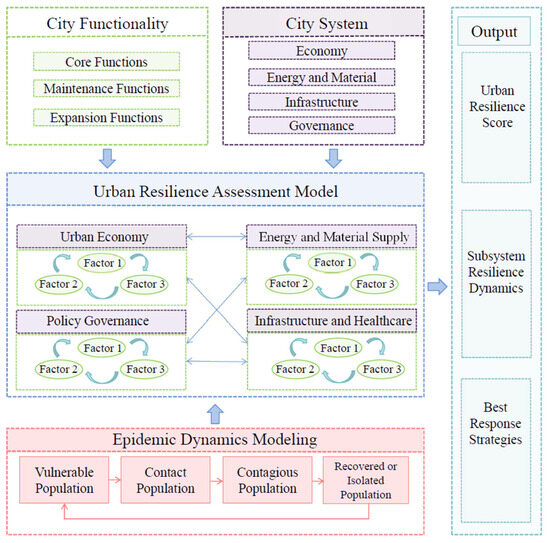
Figure 1.
Conceptual model of an urban resilience assessment framework in the context of the epidemic.
Step 1: Construct Urban Resilience Indicator System
First, a systematic review of existing literature was conducted to identify urban subsystems related to basic human needs and their key functions, including the urban economy, energy and material supply, infrastructure and health systems, and policy governance systems. Based on these subsystems, representative indicators were selected to reflect their functional performance during public health emergencies, forming an urban resilience indicator system. For example, urban economic resilience can be measured by the GDP growth rate, energy system resilience by the electricity supply, and healthcare infrastructure by the number of hospital beds per 1000 people. This indicator system is adaptable to different urban contexts, providing a consistent evaluation standard.
Step 2: Develop CLDs
In the second step, the SD method was used to analyze the mechanisms by which PHEICs impact urban systems. CLDs were created for each urban subsystem to illustrate the interactions and feedback mechanisms between urban functions. These CLDs employed positive and negative arrows to denote causal relationships between variables, such as how economic activity influences energy demand and policy response, or how healthcare infrastructure affects public health outcomes. The CLDs helped identify and understand the complex interactions between urban subsystems in the face of PHEICs.
Step 3: Build Stock and Flow Diagrams (SFDs)
Next, the causal loop diagrams were translated into Stock and Flow Diagrams (SFDs) to numerically represent urban functions. The system dynamics software VENSIM was used to construct this model, simulating the dynamic behavior of different urban subsystems during public health emergencies. Key equations and parameters, such as infection rate, recovery rate, and economic output changes, were incorporated to ensure the accuracy and operationalization of the model. The SFD model allows for the quantitative analysis of the recovery process and resilience performance of each subsystem, providing empirical support for urban management.
Step 4: Integrate the SEIR Epidemiological Model
In the fourth step, the SEIR (susceptible–exposed–infectious–recovered) epidemiological model was integrated into the framework to simulate the transmission pathways of PHEICs and their effects on various urban subsystems. The SEIR model supplied dynamic inputs to the stock and flow diagrams, simulating the complex impacts of epidemic spread on urban resilience, recovery speed, and the effectiveness of policy interventions. This approach helped analyze how urban resilience changes under different intervention strategies in identifying optimal adjustment plans.
Step 5: Simulate Different Policy Scenarios and Resilience Outcomes
The final step linked the integrated model with the resilience assessment model to simulate the response and recovery of urban systems under various policy scenarios. By simulating different types of public health and governance policies (e.g., lockdowns, social distancing strategies), the model evaluated the impact of these policies on urban resilience. In particular, the model calculated resilience indicators for each urban subsystem under different policy scenarios, such as recovery time and adaptive capacity, providing scientific data support for decision-makers to formulate optimal response strategies for large-scale public health emergencies.
3.2. Composition and Functions of Urban Systems
Urban systems are complex and multifaceted, with their resilience hinging on the interplay of diverse subsystems. Assessing urban resilience requires a systematic framework that captures these interactions while addressing the critical functions necessary for maintaining stability and recovery during crises. A comprehensive selection of indicators enables the evaluation of key urban functions and their capacity to adapt to external shocks.
The selection of these indicators was based on their ability to comprehensively reflect the key components and functions of urban systems. Widely utilized in existing literature for assessing urban resilience, these indicators possess a robust theoretical foundation and practical significance. They encompass four dimensions: urban economy, infrastructure and health, policy governance, and energy and material supplies. In the dimension of urban economy, GDP and major industrial output serve as core indicators of economic vitality, reflecting the health of the urban economic system, while tertiary industry consumption highlights the quality of life for residents and the contribution of service industries to economic development. Within infrastructure and health, communication infrastructure and public transportation indicators represent the capacity to support residents’ daily lives and work, while healthcare infrastructure (e.g., hospital beds per 1000 population) evaluates the city’s ability to address public health crises. In the domain of policy governance, government revenue captures the economic support available for policy implementation, and emergency response efficiency serves as a critical measure of a government’s ability to manage crises. This framework also has the potential for further expansion to reveal dynamic changes in more key elements of the urban system from a long-term perspective. Finally, in the energy and material supplies dimension, industrial waste emissions represent the sustainability of urban environmental management, electricity and water supply are fundamental to maintaining essential urban operations, and daily food supply is vital for ensuring social stability.
By synthesizing relevant literature, this study summarized the key urban functions affected by PHEICs and mapped these functions to the different urban subsystems, as shown in Table 1. As this study concentrated on the short-term impact of PHEICs on basic human needs, changes related to environmental and ecological functions were not included.

Table 1.
Urban system components and functions.
From the perspective of urban subsystems, urban resilience and functional performance involve multiple interconnected domains. The interactions between these subsystems form the foundation of overall urban resilience, determining the city’s ability to sustain operations under various stress conditions. Economic development relies on stable energy supplies and efficient infrastructure, while the construction and maintenance of infrastructure and healthcare systems are constrained by economic resources and policy support. Policy governance plays a crucial role by regulating resource allocation and formulating strategic plans, ensuring the coordinated operation of all subsystems and thereby enhancing the overall resilience and response capacity of a city. Therefore, this study outlined the interactions between the four urban subsystems under PHEIC conditions, as illustrated in Figure 2.
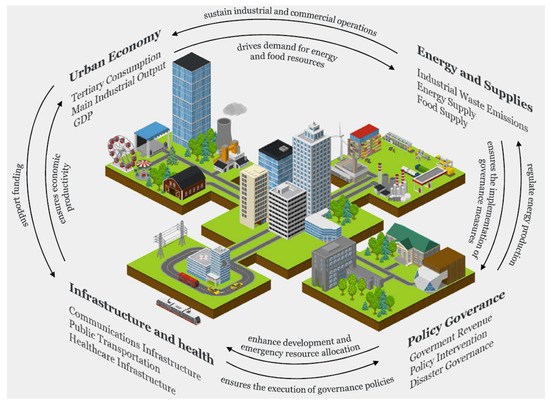
Figure 2.
Mechanisms for the impacts of urban systems under PHEIC.
Figure 2 illustrates the complex interactions and feedback mechanisms among the four major urban subsystems—urban economy, infrastructure and health, policy governance, and energy and supplies—in response to a PHEIC (such as COVID-19). The urban economy subsystem experiences significant disruptions during public health emergencies, leading to declines in GDP, primary industrial output, and consumption in the service sector. These economic contractions affect demand for energy and materials, which, in turn, has far-reaching impacts on energy supply chains and industrial waste emissions. Shortages in the energy and supply subsystem further prompt urgent responses from the policy level while simultaneously exerting additional pressure on the economic system, increasing systemic instability. The infrastructure and health subsystem are strained by surging demand for healthcare services and increased reliance on public transportation and communication infrastructure. Rising resource consumption necessitates adaptation through policy intervention. The policy governance subsystem functions as a regulatory mechanism throughout the entire system, where swift and effective policy interventions influence the operation of the other subsystems, thereby enhancing the overall resilience of a city. These complex interaction pathways reveal the dynamic response mechanisms and resilience performance of cities when confronted with a PHEIC.
3.3. Creation of Causal Loop Diagrams for Urban Systems
In the study of urban systems, using SD models to create CLDs has become an important approach for analyzing urban complexity and enhancing resilience. By applying the SD model, a comprehensive framework is constructed to reflect the interactions among various aspects of urban operations. This framework allows for the simulation of the potential impacts of different decisions and external shocks on the state of urban systems. In this study, representative functions of each urban subsystem are identified to develop CLDs under the context of PHEICs. The symbols used in the diagrams and their meanings are detailed in Table 2.
Table 2.
Indicators in the urban economy subsystem.
3.3.1. Urban Economy System CLD
In the face of PHEICs such as COVID-19, urban social and economic development are severely impacted, with slowed economic activity and diminished human well-being becoming widespread phenomena. This study conducted a comprehensive evaluation of the resilience of urban economic systems, focusing on two key dimensions: economic operations and social activities (relevant indicators are listed in Table 1). Specifically, the economic dynamics of the city are represented by the output of the primary, secondary, and tertiary sectors. Changes in human life activities were observed through the performance of sectors such as entertainment and tourism. The resilience of the urban economy, detailing the interactions between these indicators to further reveal how the urban economic system responds to and adapts to the challenges posed by PHEICs is shown in Figure 3.
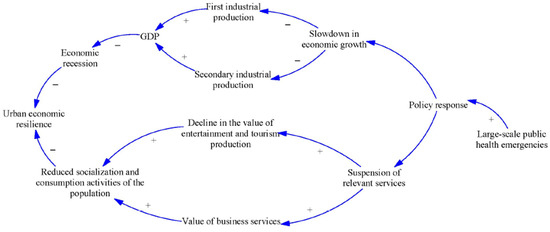
Figure 3.
CLD for urban economic subsystems.
3.3.2. Infrastructure and Health System CLD
By constructing the CLD for the infrastructure and health system, as shown in Figure 4, this study explored the dynamic feedback mechanisms within the system under public health emergencies. This system primarily consists of three key subsystems: communication infrastructure, public transportation, and healthcare infrastructure. As indicated in Table 1, the key indicator for communication infrastructure is mobile network coverage, which reflects the pressure resulting from increased demand for online social media during public health crises. The investment level in communication infrastructure determines its capacity, which, in turn, affects system resilience. For public transportation, the core indicator is daily passenger volume. The reduction in passenger volume due to a public health emergency impacts the operational efficiency of transportation infrastructure. In terms of healthcare infrastructure, the key indicator is the number of hospital beds per 1000 people. A public health emergency leads to an increase in patients, raising demand, and if the supply is insufficient, a gap will emerge, negatively impacting the overall resilience of infrastructure and health systems of the city.

Figure 4.
CLD for infrastructure and health subsystem.
3.3.3. Policy Governance System CLD
With increasing attention to the importance of urban resilience, we developed the CLD for the policy governance system, as shown in Figure 5, based on the local government emergency management framework. This diagram explores the interactions between three key subsystems: government revenue, policy intervention, and disaster governance, as well as their impact on system resilience. Specifically, total tax revenue, policy implementation efficiency, and emergency response time were considered key indicators for assessing the governance capacity of government during public health emergencies, highlighting the crucial role of policy intervention in enhancing overall governance resilience. Policy interventions can mitigate the effects of disaster factors, improving disaster governance outcomes and shortening emergency response times. While an increase in government expenditure on emergency responses may exert short-term fiscal pressure, effective disaster governance can lead to long-term improvements in government revenue, ultimately increasing tax income and strengthening policy governance resilience, creating a positive feedback loop. Moreover, GDP growth, influenced by the value of various industries, not only boosts government fiscal income but also enhances the capacity for disaster governance. Overall, the interactions between disaster governance, policy intervention, economic growth, and government revenue form multiple feedback mechanisms, underscoring that effective disaster governance depends on timely policy responses and economic development.
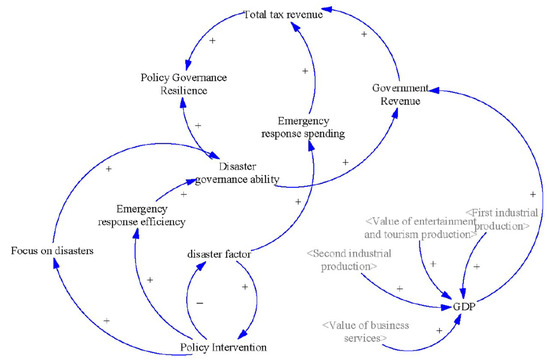
Figure 5.
CLD for policy governance subsystem.
3.3.4. Energy and Supply System CLD
The energy and supply subsystem consists of several key functions and their corresponding indicators, covering three main aspects, as shown in Table 1: waste emissions, energy supply, and food supply. To further explore the relationships among these key functions in the context of a public health crisis, the CLD for the energy and supply system was constructed, as illustrated in Figure 6. This diagram reveals the dynamic feedback mechanisms within the system. During public health emergencies, the operational resilience of these subsystems was directly affected, leading to a surge in demand for energy and water resources, which further strains the power and water supply systems and widens the supply-demand gap. At the same time, changes in waste management efficiency imposed additional pressure on the supply of energy and water resources, thereby affecting the resilience of the entire system. As urban populations continue to grow, the demand for water and electricity keeps increasing, exacerbating the strain on the city’s energy and resource supply systems. This creates a highly complex interaction network, highlighting the intricate dependencies and feedback loops that shape the resilience of the energy and supply system during crises.
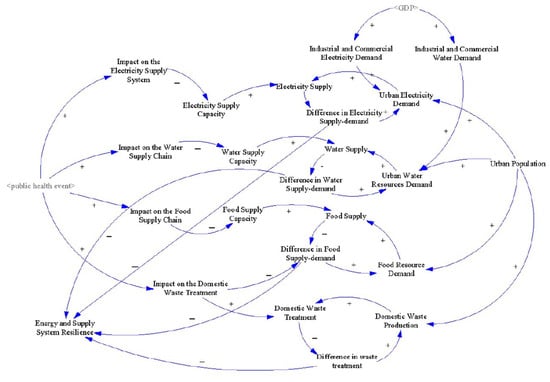
Figure 6.
CLD for energy and supply subsystems.
3.4. Causal Loop Diagram for PHEIC Spread Simulation
This study used the COVID-19 pandemic as a case to examine the impact of this PHEIC on the urban resilience system and its underlying mechanisms. To accurately capture the dynamic changes in pandemic transmission, the SEIR model (susceptible–exposed–infectious–recovered) was employed. As a classic epidemiological model, SEIR allowed us to theoretically simulate the development trends and transmission processes of the pandemic. Based on the SEIR model, this study further developed and presented a CLD for COVID-19, as shown in Figure 7. This CLD provided a detailed analysis of the interactions and feedback between COVID-19 and the urban resilience assessment system, considering the diverse adjustments in pandemic response policies and measures. Through this diagram, this study revealed how the pandemic affects urban systems on multiple levels and dimensions, shedding light on the complex ways in which COVID-19 influences urban resilience.
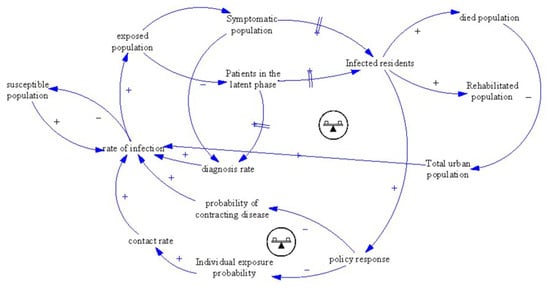
Figure 7.
CLD for PHEIC propagation simulation.
3.5. Urban System Resilience Evaluation and Recovery
In the previous sections, we systematically explored the impact pathways and underlying mechanisms of PHEICs, particularly in the context of the global COVID-19 pandemic, on the functioning of various dimensions of urban systems. Therefore, it is essential to construct a more comprehensive and realistic evaluation framework to better capture the complexities of real-world scenarios, enabling more accurate assessment and quantification of the specific impact of PHEICs on urban system resilience. Meerow et al. define urban resilience dynamically as follows: “The ability of urban systems to maintain or rapidly return to desired functions in the face of a disturbance, to adapt to change, and to quickly transform systems that limit current or future adaptive capacity” [93]. Under appropriate policy interventions, the functionality of urban subsystems can be restored over time, as illustrated in Figure 8. Moreover, the evaluation of urban resilience not only focuses on short-term recovery capacity but also considers long-term adaptation and evolution processes, ensuring that cities can better cope with future disturbances and maintain sustainable development.

Figure 8.
CLD for large-scale public emergency communication simulation.
Assessing urban resilience requires considering the magnitude of changes within a specific time period. Therefore, the resilience of each subsystem can be expressed as the integral of its rate of change [56,94], as detailed in Equation (1):
where S(t)s represents the cumulative resilience of the subsystem over the specified period. t0 and t2 present the initial and final time points of the evaluation period, respectively, and Rvr denotes the resilience variation rate, representing the temporal rate of change in the subsystem’s resilience. This equation captures the dynamic adaptation and recovery capacity of urban subsystems during public health emergencies.
The total resilience of the urban system can be calculated by integrating the resilience of each subsystem over the period from the onset of the pandemic to the point when the city system returns to equilibrium. Urban resilience can be broken down into the contributions of four subsystems: governance resilience, socio-economic resilience, infrastructure resilience, and energy and material flow resilience. Over the time interval from the initial point of the pandemic at t1 to the recovery of the city system, the total resilience is expressed as shown in Equation (2):
where UR denotes the overall resilience of the urban system. U represents the resilience of the urban economy subsystem, E reflects the resilience of energy and supply subsystem, I indicates the resilience of infrastructure and healthcare subsystems, and P denotes the resilience of policy governance subsystems.
Between the time points marking the onset of the pandemic and the system’s return to equilibrium, the resilience performance of each subsystem is calculated using integration. This approach allows for determining the overall resilience level of the urban system. To assess the changing trends in urban system resilience during the COVID-19 pandemic, this study combined the CLDs of each subsystem with the SEIR simulation model, revealing the interactions between the various subsystem variables. Figure 9 illustrates these key relationships within the urban system, highlighting how the interconnected dynamics of each subsystem contribute to the overall resilience of the system.
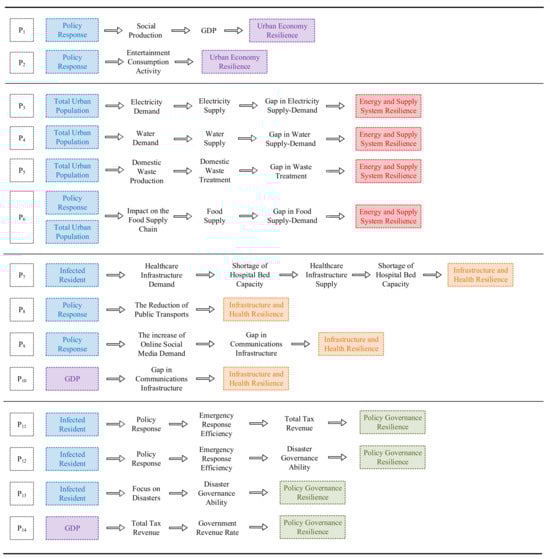
Figure 9.
Causal path map of urban subsystems.
Based on the comprehensive calculation formula for urban systems presented earlier, this study developed a SFD for analyzing urban systems, as shown in Figure 10. The diagram visually illustrates the structure of the urban resilience evaluation framework in the context of COVID-19 and uses four distinct colors to differentiate between subsystems. To deepen the analysis, the SD model examines the dynamic interactions among various interconnected subsystems, providing a comprehensive framework for understanding the evolution of urban resilience during public health emergencies. Among these, the blue section represents the SEIR epidemic model. This subsystem directly affects medical demand, recovery rate, and mortality rate and also affects other subsystems. The orange represents the infrastructure and sanitation subsystem, which is closely linked to the SEIR model, because an increase in the infection rate will increase the demand for medical resources, resulting in a shortage of hospital beds. At the same time, epidemic prevention and control measures may restrict the normal operation of the communication and transportation systems, further exacerbating the pressure on the city’s operations. For example, during a crisis, a decline in public transport capacity can restrict the mobility of workers and affect the activities of the industrial production and service sectors, thereby exacerbating economic disruption. The purple color represents the urban economy subsystem, which reflects the broader economic impacts such as fluctuations in GDP, reduced industrial output, and reduced government revenue. These economic shocks feed back into the green node, representing the policy and governance subsystem, where reduced fiscal capacity can affect the efficiency of disaster governance, resource allocation, and emergency response. For example, reduced tax revenue may limit the government’s ability to invest in critical infrastructure upgrades or emergency supplies. The red represents the energy and supply subsystem, which is closely linked to the infrastructure and economy subsystems. Disruptions to the electricity, water and food supply chains can directly affect healthcare operations and urban economic activity. For example, disruptions to energy supply can weaken hospital functions and exacerbate public health crises. Together, these subsystems form the urban resilience system, in which feedback loops highlight the interdependencies between epidemiological dynamics, resource management, infrastructure, and governance. For example, effective governance mechanisms can allocate resources to stabilize healthcare and supply systems, thereby helping to mitigate the economic impact. By capturing these interconnected pathways, the model provided insights into how urban systems can adapt and recover under the stress of a public health emergency, thereby guiding policymakers in developing comprehensive strategies to improve resilience. The figure explains how differences in urban functions lead to variations in the resilience of each subsystem, while the integral of the rate of change over time (t) reflects the resilience level of each subsystem. In the quantitative analysis of urban resilience during the COVID-19 pandemic, this calculation method was applied. The rate of resilience change in each subsystem directly influences the overall resilience of the urban system, thereby adjusting the stock variable “Urban System Resilience (t)” throughout the pandemic period.
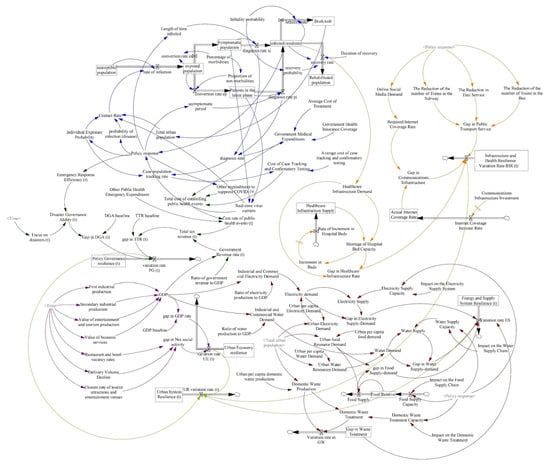
Figure 10.
Urban system SFD.
3.6. Data Collection and Processing
3.6.1. Principles
In assessing urban resilience, each urban subsystem (such as urban economy, energy and material supply, infrastructure and healthcare, and policy governance) is assigned equal weight. This assumption ensures that changes in the functionality of each subsystem have a comprehensive impact on the overall operation of the city within the system model. When evaluating the impact of PHEICs on urban systems, COVID-19 data were selected as the basis for the model, as COVID-19 is the most representative PHEIC to date, with the most detailed data available. In this study, COVID-19 data were used not only to illustrate the dynamic changes in pandemic transmission but also for feasibility analysis and simulation of the model.
3.6.2. SEIR Model Formulas and Modeling Approach
To ensure that the SEIR model accurately reflects the dynamic progression of the pandemic, daily COVID-19 data—including infection rates, recovery rates, mortality rates, and other epidemiological parameters—were used in the model. These data were primarily sourced from local health authorities and the Centers for Disease Control and Prevention (CDC). The specific data and formulas are presented in Table 3, detailing the parameters and equations used to simulate the spread and impact of COVID-19.
Table 3.
PHEIC propagation simulation equation.
3.6.3. Data Sources and Processing
The data for this study primarily came from various official sources, including the U.S. Bureau of Economic Analysis, New York City Department of City Planning, Department of Health and Mental Hygiene, Metropolitan Transportation Authority, and the NYC Office of the Mayor. Taking New York as an example, the initial setup, data sources, and processing methods are detailed in Appendix A.1. First, data for the urban economy subsystem was obtained from official fiscal reports and statistical yearbooks. GDP data from 2010 to 2019 were processed using exponential smoothing to derive the GDP baseline in the absence of pandemic effects. Data for the energy and material supply subsystem was sourced from government reports on resident population statistics. Daily water and electricity demand, as well as waste management capacity, were calculated based on the city’s resident population and daily GDP and were adjusted according to policy assumptions issued during the pandemic. Data for the infrastructure and healthcare subsystem were obtained from government-released healthcare resource reports and local news, ensuring the accurate tracking of changes in healthcare system demand during the pandemic.
After data collection, the data were dynamically processed and quantified using the SFD, enabling simulations to capture daily changes and interactions between subsystems. For example, in the urban economy subsystem, monthly and quarterly economic data, such as GDP and industrial output, were disaggregated into daily values using table functions. These values were then embedded into the SFD, and baseline GDP without pandemic impact was forecasted using exponential smoothing, dynamically reflecting economic fluctuations. For the energy and material supply subsystem, the model estimated production and residential water and electricity demand, as well as waste management capacity, based on the daily GDP and resident population of the city. It also simulated fluctuations in resource supply and demand under various policy scenarios, such as lockdowns or reduced industrial operations. In the infrastructure and healthcare subsystem, if-then-else logic functions were employed to simulate the impact of policies such as lockdowns or Dynamic Zero-COVID policies. These policies influenced healthcare facility demands indirectly by reducing the availability and use of public transportation services (e.g., subway, bus, and taxi), which created gaps in public transport and increased reliance on alternative communication and infrastructure systems. Finally, the policy governance module quantified COVID-19-related public health expenditures by calculating variables such as “government revenue rate” and “public health event cost rate.” These values were used to assess the cascading impact of policy decisions on urban governance and public spending, providing a dynamic view of governance efficiency. Detailed mathematical expressions for these variables and the urban resilience subsystem can be found in Appendix A.2, where we provide examples such as the specific table function for GDP disaggregation and the if-then-else logic applied to infrastructure demand calculations.
4. Case Study
Considering data availability, city size, form, and economic structure, this study selected New York, Hong Kong, and Nanjing as case studies to validate the robustness of the urban resilience assessment model. These cities represent diverse characteristics and offer a comparative perspective on urban resilience. The selection of New York, Hong Kong, and Nanjing was based on their diverse social, economic, and geographical attributes, as well as their varied experiences with COVID-19 outbreaks and the control policies they implemented. These differences provide a solid basis for analyzing and comparing the resilience performance of cities in response to PHEICs, offering valuable insights for enhancing resilience strategies in similar urban settings. New York, with a population of approximately 8.8 million, is characterized by a service-oriented economy dominated by finance and real estate industries, a highly interconnected infrastructure, and extensive external transportation networks, including airports and seaports. Hong Kong, a densely populated city of 7.5 million, serves as a global financial hub with a high dependence on international trade and an advanced public transit system but faces land constraints that challenge urban development. Nanjing, with a population of 9.4 million, represents a regional economic center in China, blending industrial and service sectors with significant historical and cultural heritage, supported by well-developed rail and highway networks.
New York experienced one of the earliest and most severe outbreaks of COVID-19. At that time, the government and society lacked experience in managing such a pandemic. In this context, policymakers implemented stringent lockdown measures to curb further deterioration, which was a necessary response. Hong Kong adopted a more balanced approach, implementing targeted measures while maintaining critical economic functions. Nanjing, under a “Dynamic Zero” strategy, showcased rapid containment efforts through centralized governance and community mobilization. These differences in outbreak scales, timing, and policy responses make these cities representative cases for studying the impact of COVID-19 on urban resilience and the effectiveness of corresponding strategies. Our study did not aim to assess the merits or drawbacks of different political systems but rather focused on the efficiency of policy implementation and its impact on urban resilience.
4.1. Epidemic Simulation Results
This study employed a dynamic simulation of the COVID-19 transmission process in New York, Hong Kong, and Nanjing, with a one-day time step for iterative calculations. The parameters of the SEIR (susceptible–exposed–infectious–recovered) model were calibrated and optimized using actual epidemic data from these three cities to ensure accuracy and relevance. Following calibration, the model simulated the cumulative number of confirmed cases, and the results were compared with the actual reported data for each city. Figure 11 illustrates the following simulation results: (a) presents the simulation outcomes for New York, while (b) and (c) display the results for Hong Kong and Nanjing, respectively. The alignment between the SEIR model’s predictions and the observed trends of COVID-19 in these cities indicates the model’s strong applicability and effectiveness in capturing the dynamics of the epidemic.
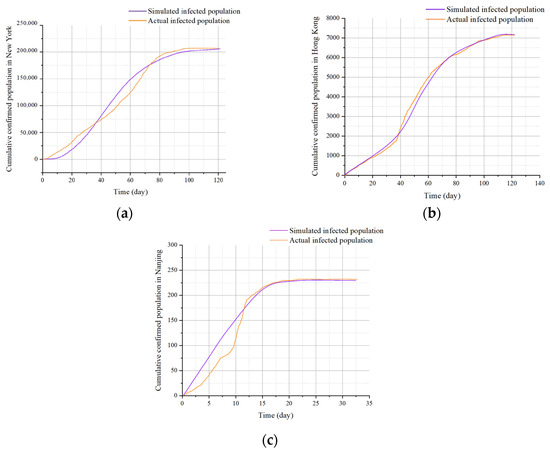
Figure 11.
Simulation results of COVID-19 infection in New York (a), Hong Kong (b), and Nanjing (c).
Due to differences in medical infrastructure and government responses to COVID-19 in New York, Hong Kong, and Nanjing, the pandemic’s development trends also exhibited significant variation. Table 4 lists the relevant parameters and simulation results from the SEIR model. During the initial outbreak from March to June 2020, New York experienced a higher case fatality rate, primarily due to the lack of timely and accurate information at the onset and the implementation of strict lockdown policies [95]. Additionally, the healthcare system in New York was under immense pressure. In contrast, Hong Kong and Nanjing had relatively lower case fatality rates. This difference can be partly attributed to the more robust healthcare systems, widespread testing measures, and more effective government policies in place in these cities. For example, the Nanjing government implemented a “Dynamic Zero-COVID” policy, which had minimal impact on the city’s operational systems while effectively controlling the spread of the virus [96].
Table 4.
Comparison and simulation of COVID-19 epidemic parameters in New York, Hong Kong, and Nanjing.
4.2. Urban Resilience Simulation Results
The impact and recovery speed of different urban resilience subsystems during the COVID-19 pandemic varied significantly across cities. The dynamic trends of the four key subsystems—urban economy (UE), policy governance (PG), infrastructure and health (IH), and energy and supplies (ES)—revealing the degree of decline and recovery in urban functionality, as shown in Figure 12a. In New York, the COVID-19 pandemic began on 1 March 2020 and lasted until 26 August 2020, with 207,472 infections and 17,561 deaths. The lockdown policy, “NY on PAUSE”, was implemented on 22 March 2020 and lasted for 78 days. This study simulated the impact of the lockdown starting on day 22 of the pandemic and extended the simulation to 365 days.
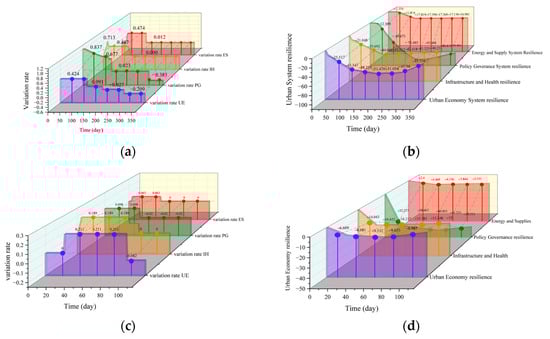

Figure 12.
Variation rate and resilience of subsystem in New York (a,b), Hong Kong (c,d), and Nanjing (e,f).
During the early phase of the pandemic (days 0 to 50), all subsystems experienced significant fluctuations. The policy governance subsystem declined by 83.7% in the early days of the pandemic, indicating insufficient emergency management capacity. Although it showed some recovery later, it remained unstable [23]. The infrastructure and health subsystem experienced significant volatility between days 22 and 50 due to shortages in medical resources, with a gap of 71.3%. However, as the government increased investment, this subsystem recovered relatively quickly. The urban economy subsystem saw a slower decline but also a slower recovery. Even after the lockdown was lifted, economic rebound remained sluggish, with recovery above the baseline only achieved in the last three months of 2020. The energy and supply subsystem showed short-term fluctuations, primarily due to disruptions in the food supply chain, though the energy supply–demand imbalance did not significantly worsen. These fluctuations were compounded by regional supply chain interruptions, which disrupted the transportation of essential goods such as food, medical supplies, and industrial raw materials, further aggravating urban system vulnerabilities.
Figure 12b illustrates the dynamic changes in the resilience of urban subsystems during the COVID-19 pandemic. In the early phase of the pandemic, the policy governance subsystem experienced the most significant decline, reflecting the governance pressures and coordination challenges faced by governments in responding to public health emergencies. This was largely due to delayed policy formulation and insufficient preparedness for the pandemic. Additionally, the strain on governance systems was exacerbated by disruptions in inter-regional supply chains, which necessitated the rapid allocation of emergency resources and recalibration of policies to address cascading failures. In contrast, while the urban economy subsystem was affected, it gradually recovered in the later stages, driven by economic recovery, business reopening, and the restoration of consumer confidence. However, the energy and supply and infrastructure and health subsystems recovered more slowly, showing no significant rebound even a year after the outbreak. These subsystems were heavily affected by interdependencies, with healthcare infrastructure requiring stable energy supplies and efficient logistics systems to fully recover. Delays in supply chain restoration further hindered their stabilization. In particular, the healthcare system and public infrastructure required more time and investment for full recovery. This highlights that while policy adjustments can facilitate quicker recovery in economic and governance systems, the stability of infrastructure rebuilding and energy supply restoration presents greater challenges, underscoring the necessity of enhancing urban resilience.
The trends in urban resilience and urban resilience variation rate (UR variation rate) in New York during the COVID-19 pandemic are shown in Figure 13a. During the lockdown period (1 March 2020 to 8 June 2020), the urban resilience index dropped by approximately 45%. The average rate of change across the four subsystems reveals a significant decline in urban functions, leading to an overall reduction in resilience until the pandemic’s end, are shown as Figure 13b. Although containment measures contributed to the partial recovery of urban functions, the negative impacts of the pandemic were not fully eliminated, and the complete restoration of the urban system will require a longer time. Therefore, in addition to pandemic control measures, formulating strategies to promote recovery is crucial for enhancing urban resilience.
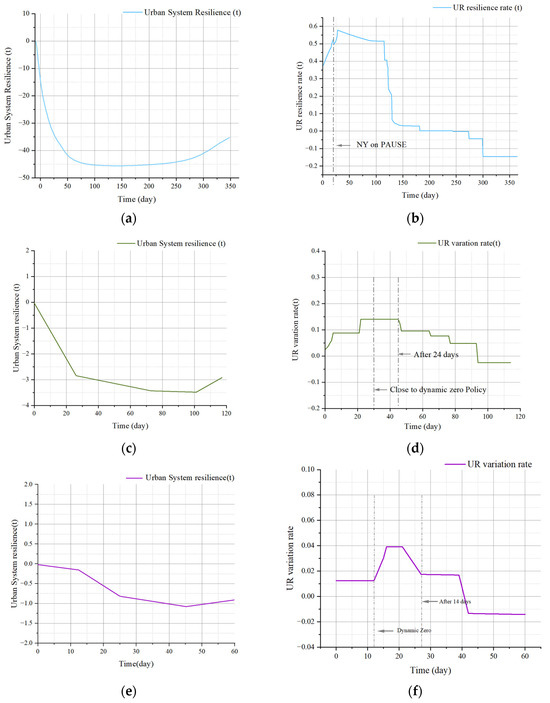
Figure 13.
Urban resilience and UR variation rate in New York (a,b), Hong Kong (c,d), and Nanjing (e,f).
Hong Kong’s fourth wave of the COVID-19 pandemic began on 10 November 2020, and ended on 5 February 2021, with a total of 7006 reported cases. During this period, the Hong Kong government implemented strict control measures, such as closing some commercial venues and limiting gatherings. Although the duration of the pandemic was similar to that of New York, Hong Kong successfully kept the number of infections low due to more targeted public health policies, as shown in Figure 12c. The resilience variation rate of each subsystem, where the urban economy experienced the most fluctuation, indicating that lockdown measures had a significant impact on the economy, especially the service sector and commercial activities. In contrast, the infrastructure and health subsystem saw smaller changes, supported by a well-developed healthcare system and effective testing mechanisms, which limited the strain on medical resources during the pandemic. Moreover, Hong Kong did not implement a full-scale lockdown, so the material supply chain was less affected, allowing the energy and supply subsystem to recover quickly within two months. Compared to New York, Hong Kong reported fewer confirmed cases and faced less fiscal pressure, resulting in minimal impact on the policy governance subsystem. Overall, through scientific control policies and a robust healthcare system, Hong Kong demonstrated stronger urban resilience than New York during the pandemic.
As shown in Figure 12d, the resilience of the infrastructure and health subsystem decreased by only about 10 units during the COVID-19 pandemic. Despite facing a public health crisis, Hong Kong quickly mobilized resources, increased the supply of medical materials, and expanded healthcare services, preventing a systemic collapse. Additionally, Hong Kong demonstrated high efficiency in rapid testing, isolation policies, and contact tracing, which helped maintain relative stability in the early stages of the pandemic, with no significant functional disruptions. At the same time, the energy and supply subsystem exhibited a resilience decline of only about five units, reflecting its strong stability. This was due to Hong Kong’s efficient logistics system, ample energy reserves, and the government’s effective measures in supply and resource management. Despite the implementation of lockdowns and transportation restrictions, the supply of energy and essential goods was not severely affected, highlighting Hong Kong’s robust emergency response and supply chain resilience, which mitigated the impact of the pandemic on daily life and industrial production.
The urban system’s resilience declined significantly within approximately 20 days after the outbreak, as shown in Figure 13c. Restrictions on socio-economic activities and the increased burden on the public health system led to a sharp drop in overall urban resilience. Over time, resilience gradually recovered but remained at a lower level, indicating a relatively slow recovery of the urban system. Figure 13d illustrates that with the strengthening of control policies, the rate of change in urban functionality rapidly increased after day 24, peaking as a result of the significant impact of the pandemic control measures on various subsystems. Subsequently, the rate of change fluctuated, indicating that despite the progressive implementation of preventive measures, urban functions were still adapting to the dynamic changes in the pandemic and the control policies, with high instability during this period.
On 20 July 2021, Nanjing reported its first case of COVID-19 in the outbreak originating from Lukou Airport. By 19 August, the outbreak was effectively controlled, with a total of 235 cases reported. Figure 12e shows the resilience trends of subsystems. The decline in urban functionality resilience was primarily due to the disruption of socio-economic activities and increased pressure on infrastructure. The urban economy subsystem declined as economic activities stalled, and infrastructure was impacted by shortages in medical resources. However, the recovery of the socio-economic sector was slower, indicating that the pandemic’s indirect impact on the economy was greater than its direct effect on the healthcare system. Given the relatively low number of confirmed cases, the fiscal burden and the impact on the policy governance subsystem were minimal. Additionally, the dynamic control strategy prevented large-scale lockdowns, avoiding supply chain disruptions and ensuring stable energy and material supplies. Figure 12f shows that during the pandemic, the policy governance and energy and supply subsystems remained relatively stable, while socio-economic resilience, after an initial decline, gradually recovered. Although infrastructure resilience also improved, further strengthening is needed due to the ongoing uncertainty and increasing demand for medical resources.
As shown in Figure 13e,f, local governments and relevant departments swiftly activated emergency response mechanisms after the outbreak, successfully curbing the further spread of the virus through efficient contact tracing and the implementation of targeted closures. These measures ensured that the pandemic was controlled within a short period, significantly mitigating potential long-term socio-economic impacts. Compared to New York and Hong Kong, Nanjing’s outbreak lasted for a shorter duration and involved fewer infections, resulting in a relatively lighter overall impact on the urban system. This reflects the effectiveness of Nanjing’s pandemic response and management.
4.3. Comparison of Urban Resilience Under Different Epidemic Scenarios
New York, Hong Kong, and Nanjing each demonstrated unique characteristics of urban resilience. In the urban economy subsystem, New York’s “NY on PAUSE” lockdown policy severely impacted the service and retail sectors. Despite economic stimulus plans aiding recovery, issues such as income inequality and job instability worsened. Hong Kong, heavily reliant on foreign investment and tourism, faced significant economic challenges but managed a swift rebound through timely economic support measures. Nanjing, by implementing a Dynamic Zero-COVID policy, quickly resumed industrial production and consumption activities after controlling the pandemic, resulting in the least economic disruption among the three cities. In the energy and material supply subsystem, New York did not face significant supply shortages but struggled with unequal distribution of resources. Hong Kong, through close cooperation between the government and businesses, maintained relatively stable material supplies. Nanjing, with efficient resource allocation and strong community management, ensured ample supplies of essential and protective goods, demonstrating robust resilience. In the infrastructure and health subsystem, New York’s healthcare system faced immense pressure in the early stages of the pandemic, with insufficient emergency management capacity. While Hong Kong’s public health system was well-established, it experienced strain from limited human resources and rapid depletion of supplies. Nanjing, through swift testing and resource allocation, effectively controlled the outbreak, minimizing pressure on its healthcare system and showcasing high resilience. In terms of policy governance, New York struggled with the execution of control strategies due to a lack of national coordination, leading to poor outcomes. Hong Kong demonstrated strong responsiveness with strict border controls and the use of contact-tracing apps. Nanjing excelled in policy governance resilience, effectively curbing community transmission through efficient administrative management and social mobilization capabilities.
5. Discussion
This study presented a dynamic urban resilience assessment model designed to quantify the impact of PHEICs on urban functions. The results indicated that changes in urban resilience vary significantly depending on the type of PHEIC and the response measures adopted by local governments. However, whether it is necessary to sacrifice certain urban functions to contain the spread of PHEIC. Therefore, this section further explored the dynamic changes in urban resilience under different policy responses, providing scientific evidence to inform the development of more effective strategies.
Based on the characteristics of COVID-19 transmission, the virus may mutate over time, leading to new waves of infections. This requires local governments to adopt more scientific responses, dynamically adjusting policies according to the transmission characteristics of different variants. To provide a more comprehensive comparison of urban resilience changes under different policy responses, the simulation period for Hong Kong and Nanjing was extended to 365 days, and the results were compared with the resilience trends in New York. Additionally, to explore how urban resilience evolves without policy interventions, a scenario analysis based on New York’s data was conducted with no policy response. The simulation results revealed the resilience differences among the three cities under various scenarios, as illustrated in Figure 14.
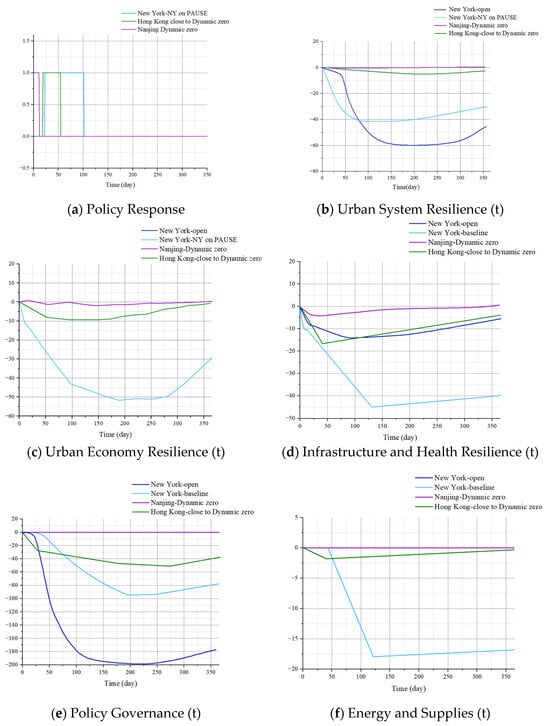
Figure 14.
Resilience evolution of urban system and its subsystems under different policy response scenarios.
Figure 14a illustrates the changes in urban resilience under different policy scenarios during the COVID-19 pandemic. The “NY on PAUSE” scenario represents the implementation of strict lockdown measures, whereas the “New York-open” scenario reflects the absence of response policies, apart from enhanced medical support. Figure 14b depicts the resilience trends of urban systems under varying policy responses. In the absence of policy intervention, urban resilience declines rapidly within a short timeframe, potentially leading to the collapse of urban functionality. However, regardless of whether governments implemented strict lockdowns or more scientific response strategies, these interventions significantly alleviated the adverse impacts of COVID-19 on urban systems. Notably, under the “Dynamic Zero” policy, the resilience of urban systems showed only a slight decline, highlighting the effectiveness of this policy in maintaining urban functionality. Figure 14c highlights changes in economic resilience across different policy responses. Open policies failed to contain the spread of the pandemic effectively, leading to reduced labor force participation, weakened consumer and investor confidence, and severe disruptions to economic activities. Conversely, strict lockdown policies, while successful in controlling the pandemic, imposed comprehensive restrictions on business operations, production supply chains, and consumer demand, also creating substantial economic pressures. In comparison, more scientific response strategies minimized the duration of economic disruption, maintained system stability, and effectively mitigated economic shocks. As shown in Figure 14d, different policies have a significant impact on urban infrastructure resilience. Under the fully open policy, although the spread of the pandemic imposed certain pressures on key infrastructure such as healthcare systems, other infrastructures (e.g., transportation, electricity, and water resources) were able to maintain normal operations. This prevented the usage restrictions on infrastructure seen under full lockdown policies, resulting in a relatively balanced load distribution. However, full lockdown policies may trigger panic-driven hoarding behavior among residents, further exacerbating pressure on supply chains and critical infrastructure, thereby reducing system resilience. In contrast, the “Dynamic Zero” policy and “close to Dynamic zero” policies, through refined management strategies (e.g., zoned lockdowns and differentiated measures), effectively ensured the continuous operation of critical infrastructure (e.g., transportation, electricity, and logistics) in non-affected areas, avoiding the systemic disruptions that could arise under full lockdowns. Moreover, these policies significantly shortened the duration of the pandemic’s impact on urban operations, enabling cities to quickly resume normal social and economic activities. This reduced the potential risks to infrastructure systems associated with prolonged high loads or maintenance disruptions. Such refined governance strategies effectively enhance the stability and adaptability of urban infrastructure resilience. As shown in Figure 14e, under open policies, the lack of effective control measures allowed the virus to spread rapidly, leading to a surge in infections, exhaustion of medical resources, and overburdened public service systems, significantly weakening urban governance resilience. Additionally, the government’s passive response could be perceived as incompetence, undermining public trust and reducing policy implementation efficiency. Under lockdown policies, strict containment measures caused economic activities to halt, businesses to shut down, and urban economic functions to suffer severe disruptions, with prolonged lockdowns potentially leading to economic recession. Meanwhile, restricted social activities increased demand on critical infrastructure such as healthcare systems and communication networks, potentially causing system overload and further reducing governance resilience. Nevertheless, compared to open policies, lockdown measures remain an effective means of mitigating the decline in governance resilience during the early stages of a pandemic outbreak. Figure 14f illustrates the impact of various policies on energy and material supply resilience. Open policies resulted in severe supply chain disruptions, leading to a sharp decline in supply resilience. In contrast, policies emphasizing efficient resource allocation effectively maintained stable supply chains, demonstrating higher resilience levels. Meanwhile, lockdown policies did not significantly affect energy and material supply resilience.
In the early stages of managing highly transmissible PHEICs, governments and societies often lack experience in pandemic management, with limited vaccine availability, insufficient response mechanisms and resources, and minimal understanding of the fundamental mechanisms of viral transmission. Under such circumstances, strict lockdown policies are crucial for curbing the further spread of PHEICs. However, from the perspective of long-term urban resilience recovery, lockdown policies may not represent the optimal strategy for addressing PHEICs. Prolonged lockdown measures can exert severe negative impacts on urban economies and governance systems. Moreover, considering that viruses like COVID-19 may evolve over time, exhibiting increased transmissibility but decreased lethality, more scientific policy responses (e.g., Dynamic Zero or close to Dynamic zero policies) may be better suited to balancing pandemic control with urban development. Therefore, governments should make precise and rapid decisions based on the trajectory of viral evolution, adopting proactive and scientific measures to minimize the loss of urban resilience.
6. Conclusions
This study developed an integrated framework based on SD to quantitatively assess and simulate the dynamic changes in urban resilience, with a particular focus on the resilience performance of New York, Hong Kong, and Nanjing in the context of PHEICs. By integrating an epidemic transmission model with a multidimensional evaluation indicator system, the framework dynamically captured the complex interactions and feedback mechanisms among key urban functions. This approach offered a novel quantitative method for evaluating the effectiveness of various pandemic control strategies.
The main advantage of the SD model lies in its ability to simulate the nonlinear interactions between urban subsystems and their evolution over time, revealing the complex causal relationships between policy measures and urban resilience. The study results indicated that, while strict control measures can effectively curb virus transmission in the short term, they also have profound impacts on urban governance structures, economic activities, and social stability. Furthermore, the recovery process from these impacts demonstrated a high degree of complexity and regional variation.
The case analysis further validated the differing resilience performances of cities during the COVID-19 pandemic and the underlying reasons. New York’s “NY on PAUSE” lockdown policy effectively curbed the spread of the virus but severely disrupted economic activities, leading to a slow and painful recovery in urban resilience. In contrast, Hong Kong adopted a more scientific “close to Dynamic zero” strategy, which, through strict border control and social distancing measures, successfully controlled the pandemic while minimizing disruptions to economic and social activities, demonstrating higher system recovery capacity. Nanjing, with its “Dynamic Zero” policy, showcased efficient administrative management and social mobilization, swiftly controlling the virus’s spread, enabling a rapid recovery of social and economic activities, and resulting in minimal fluctuations in urban resilience.
Although the SD framework developed in this study demonstrated strong applicability and inclusiveness in simulating the dynamic changes in urban resilience during a pandemic, there are still some limitations. First, the quantification of urban socio-economic resilience heavily relied on the availability of real-time, high-frequency data. However, data lag may limit the accuracy and practicality of the model. Second, the study primarily focused on the internal dynamics of urban resilience, without fully accounting for external factors such as regional virus transmission, vaccination efforts, and pharmaceutical treatments. Future research should expand the range of variables and data collection to include more characteristics of urban systems and a broader set of pandemic scenarios. This would allow for a more comprehensive and accurate simulation of the dynamic evolution of urban resilience in the context of prolonged pandemics. Additionally, the model should incorporate a wider range of social, economic, and policy intervention factors to provide policymakers with scientific support, enabling them to develop more scientific and effective public health response strategies.
Author Contributions
Software, Writing—Original Draft, Formal Analysis, Investigation, R.Q.; Conceptualization, Methodology, Resources, Funding Acquisition, P.C.; Data Curation, Validation, S.Z.; Writing—Review and Editing, F.Z. All authors have read and agreed to the published version of the manuscript.
Funding
This research is sponsored by the National Natural Science Foundation of China (Grant Nos. 72204113), Humanities and Social Sciences Fund of the Ministry of education (Grant Nos. 21YJC630017), and Jiangsu Social Science Fund (Grant Nos. 21GLC001).
Data Availability Statement
The data presented in this study are available upon request from the corresponding author. The data are not publicly available due to privacy.
Conflicts of Interest
The authors declare that they have no conflicts of interest.
Appendix A
Appendix A.1. Initial Setup, Data Sources, and Processing Methods (New York as an Example)
| Sub-System | Variability | Initial Value | Unit | Data Processing Method | Data Source |
| Urban Economy System | First industrial production; Secondary industrial production; Value of entertainment production; Value of tourism production | \ | \ | Calculate the daily average of the monthly data and use a table function to reflect the changing trend. | U.S. Bureau of Economic Analysis |
| GDP baseline | 4939.72 | ∗106 $/day | Calculate the expected annual GDP without COVID using the exponential smoothing method and determine the daily mean value. | Statista | |
| Restaurant and hotel vacancy rates | \ | \ | Calculate the daily average of the monthly data and use a table function to reflect the changing trend. | New York City Department of City Planning Central office | |
| Closure rate of tourist attractions and entertainment venues | \ | \ | Calculate the daily average of the monthly data and use a table function to reflect the changing trend. | New York City Department of City Planning Central office | |
| Delivery Volume Decline | \ | \ | Calculate the daily average of the monthly data and use a table function to reflect the changing trend. | New York City Department of City Planning Central office | |
| Energy and Supplies System | Ratio of electricity production to GDP | 16,759.78 | kWh/million dollars | Average electricity consumption per unit of GDP over the past 10 years | U.S. Bureau of Economic Analysis |
| Urban per capita electricity demand | 9.34 | kWh/day∗people | Average electricity consumption per capita a day over the past 10 years | U.S. Bureau of Economic Analysis | |
| Ratio of water production to GDP | 1.385 | 10,000 tons/million dollars | Average electricity consumption per unit of GDP over the past 10 years | U.S. Bureau of Economic Analysis | |
| Urban per capita water demand | 7.717 × 10⁻⁴ | 10,000 tons/day∗people | Average water consumption per capita a day over the past 10 years | U.S. Bureau of Economic Analysis | |
| Urban per capita food demand | 2.75 × 10⁻³ | tons/people∗day | Average daily per capita food consumption | United States Department of Agriculture | |
| Urban per capita domestic waste production | 0.199 | tons/people∗day | Average daily per capita domestic waste production | New York City Department of Sanitation | |
| Electricity Supply Capacity | 1.452 × 10⁹ | kWh/day | Daily average of total electricity consumption | New York State Public Service Commission | |
| Water Supply Capacity | 366.986 | 10,000 tons/day | Daily average of total water consumption | NYC Department of Environmental Protection | |
| Food supply capacity | 21,708.961 | tons | Daily average of total food consumption | United States Department of Agriculture | |
| Domestic Waste Treatment Capacity | 1,753,424.7 | tons/day | Daily average of Domestic Waste Treatment | New York City Department of Sanitation | |
| Infrastructure and Health System | Healthcare Infrastructure supply | 22,573 | \ | Number of hospital beds in New York City before the COVID-19 outbreak | New York City Department of Health and Mental Hygiene |
| increment in beds | 20,000 | \ | \ | New York City Department of Health and Mental Hygiene | |
| Actual Internet coverage rate | 0.897 | \ | Number of Internet users/permanent residential population | NYC Office of the Mayor | |
| The reduction of the number of trains in the subway | 0.056 | Number of suspended metro lines/total number of metro lines | Metropolitan Transportation Authority | ||
| The reduction of the number of trains in the bus | 0.187 | \ | Number of suspended bus lines/total number of bus lines | Metropolitan Transportation Authority | |
| The reduction in taxi service | 0.824 | \ | Number of suspended taxis/total number of taxis | Taxi and Limousine Commission | |
| Policy Governance System | Total tax revenue baseline | 254.795 | ∗106 $/day | The smoothed index method is used to calculate the expected annual government revenue in the absence of the epidemic and convert it into the daily average | New York City Comptroller Brad Lander |
| Disaster governance ability baseline | 1 | \ | \ | \ | |
| Emergency response efficiency | 1 | \ | \ | \ | |
| Focus on disasters | 0 | \ | The focus on COVID-19 is set to 0 before its outbreak and changes to 1 after it occurs. | \ | |
| The ratio of government revenue to GDP | 0.3466 | \ | Calculate the average ratio of government revenue to GDP over the past 10 years | New York City Comptroller Brad Lander | |
| Other public health emergency expenditures | 27.368 | ∗106 $/day | Average daily other public health emergency expenditures | Project-level expenditure data in international development agency online databases and annual financial statements and reports |
Appendix A.2. Urban Resilience Subsystem Variables and Mathematical Expressions
| Sub-System | Variability | Mathematical Equation |
| Urban Economy System | First industrial production | =WITH LOOKUP (Time, ([(0, 0)–(365, 1000)], (1, 55.1765), (90, 55.1765), (91, 80.498), (181, 80.498), (182, 95.689), (273, 95.689), (274, 81.413), (365, 67.674))) |
| Secondary industrial production | =WITH LOOKUP (Time, ([(0, 0)–(365, 2000)], (1, 679.458), (90, 731.225), (91, 952.870), (181, 952.870), (182, 1143.096), (273, 1100.547), (274, 1081.305), (365, 1081.305))) | |
| Value of entertainment and tourism production | =WITH LOOKUP (Time, ([(0, 0)–(365, 5000)], (1, 1350.275), (90, 1350.275), (91, 1785.432), (181, 1785.432), (182, 1965.871), (273, 1965.871), (274, 1920.568), (365, 2018.864))) | |
| Value of business services | =WITH LOOKUP (Time, ([(0, 0)–(365, 3000)], (1, 1203.456), (90, 1289.789), (91, 1432.567), (181, 1520.345), (182, 1625.678), (273, 1690.432), (274, 1745.123), (365, 1771.878))) | |
| GDP | =First industrial production + Secondary industrial production + Value of entertainment and tourism production + Value of business services | |
| GDP baseline | =Annual GDP projections under a COVID-19 free scenario/365 | |
| The gap in Net social activity | =(GDP baseline − GDP)/GDP baseline | |
| Restaurant and hotel vacancy rates | =WITH LOOKUP (Time, ([(0, 0)–(365, 365)], (1, 0), (13, 0), (14, 0.00678), (31, 0.01224), (90, 0.1224), (91, 0.07553), (181, 0.07553), (182, 0.03471), (273, 0.03471), (274, 0.03652), (365, 0.03652))) | |
| Closure rate of tourist attractions and entertainment venues | =WITH LOOKUP (Time, ([(0, 0)–(365, 365)], (1, 0), (13, 0), (14, 0.0293), (31, 0.0293), (32, 0.01579), (59, 0.01579), (60, −0.001677), (90, −0.001677), (120, −0.001677), (121, −0.013), (151, −0.013), (152, −0.0215), (181, −0.0215), (182, −0.002376), (212, −0.002376), (213, 0), (243, 0), (244, −0.002491), (273, −0.002491), (274, −0.000973), (304, −0.000973), (305, −0.0046), (334, −0.0046), (335, −0.00548), (365, −0.00548))) | |
| Delivery Volume Decline | =WITH LOOKUP (Time, ([(0, 0)–(365, 365)], (1, 0), (13, 0), (14, 0.0198), (31, 0.0198), (32, 0.0146), (59, 0.00146), (60, 0.0026), (90, 0.0026), (91, −0.001158), (120, −0.001158), (121, −0.00061), (151, −0.00061), (152, −0.00122), (181, −0.00122), (182, −0.000523), (212, −0.000523), (213, −0.00093 (243, −0.00093), (244, −0.0015), (273, −0.0015), (274, −0.00162), (304, −0.00162), (305, −0.00114), (334, −0.00114), (335, −0.000325), (365, −0.0003259))) | |
| Energy and Supplies System | Industrial and Commercial Electricity Demand | =GDP ∗ Ratio of electricity production to GDP |
| Urban Electricity Demand | =Urban per capita electricity demand ∗ Total urban population | |
| electricity demand | =Urban Electricity Demand + Industrial and Commercial Electricity Demand | |
| Electricity Supply | =IF THEN ELSE (electricity demand >= Electricity Supply Capacity, Electricity Supply Capacity, electricity demand) | |
| Electricity Supply Capacity | =IF THEN ELSE (Policy response = 1, 8,804,190 ∗ Impact on the Electricity Supply System, 8,804,190) | |
| gap in Electricity Supply-demand | =IF THEN ELSE (electricity demand >= Electricity Supply, (electricity demand-Electricity Supply)/electricity demand, 0) | |
| Industrial and Commercial Water Demand | =Ratio of water production to GDP ∗ GDP | |
| Urban Water Resources Demand | =Total urban population ∗ Urban per capita water demand | |
| water demand | =Industrial and Commercial Water Demand + Urban Water Resources Demand | |
| Water Supply | =IF THEN ELSE (water demand >= Water Supply Capacity, Water Supply Capacity, water demand) | |
| gap in Water Supply-demand | =IF THEN ELSE (water demand >= Water Supply, (water demand-Water Supply)/water demand, 0) | |
| Water Supply Capacity | =IF THEN ELSE (Policy response = 1, Impact on the Water Supply Chain ∗ 366.986, 366.986) | |
| Urban food Resource Demand | =Urban per capita food demand ∗ Urban per capita food demand | |
| Food supply capacity | =IF THEN ELSE (Policy response = 1, DELAY1 (21,709 ∗ Impact on the Food Supply Chain, 3), 21,709) | |
| Food reserve | =INTEG (Food supply capacity-Food supply, 145,894) | |
| Food supply | =IF THEN ELSE (Urban food Resource Demand >= Food reserve, Food reserve, Urban food Resource Demand) | |
| gap in Food Supply-demand | =IF THEN ELSE (Urban food Resource Demand <= Food supply, 0, (Urban food Resource Demand-Food supply)/Urban food Resource Demand) | |
| Domestic Waste Production | =Total urban population ∗ Urban per capita domestic waste production | |
| Domestic Waste Treatment | =IF THEN ELSE (Domestic Waste Production >= Domestic Waste Treatment Capacity, Domestic Waste Treatment Capacity, Domestic Waste Production) | |
| Domestic Waste Treatment Capacity | =IF THEN ELSE (Policy response = 1, Impact on the Domestic Waste Treatment ∗ 1,753,424.66, 1,753,424.66) | |
| gap in waste treatment | =INTEG (variation rate in GW, 0) | |
| variation rate ES | =(“gap in Electricity Supply-demand” + “gap in Food Supply-demand” + gap in waste treatment “gap in Water Supply-demand”)/4 | |
| Energy and Supply System Resilience (t) | =INTEG (−variation rate ES, 0) | |
| Infrastructure and Health System | Healthcare Infrastructure supply | =INTEG (Rate of increase in hospital beds, 22,573) |
| gap in Healthcare Infrastructure rate | =Shortage of hospital bed capacity/Healthcare Infrastructure demand | |
| Online social media demand | =IF THEN ELSE (Policy response = 1, 1, 0) | |
| variation rate IHR (t) | =(gap in Communications Infrastructure + gap in Healthcare Infrastructure rate + gap in public transport service)/3 | |
| Shortage of hospital bed capacity | =IF THEN ELSE (Healthcare Infrastructure demand-Healthcare Infrastructure supply > 0, Healthcare Infrastructure demand-Healthcare Infrastructure supply, 0) | |
| Rate of increment in hospital beds | =DELAY1(increment in beds, 12) | |
| increment in beds | =IF THEN ELSE (Shortage of hospital bed capacity <= 20,000, Shortage of hospital bed capacity, 20,000) | |
| required Internet coverage rate | =IF THEN ELSE (Online social media demand = 1, 1, 0.897) | |
| Actual Internet coverage rate | =INTEG (Internet coverage increase rate, 0.897) | |
| gap in Communications Infrastructure | =required Internet coverage rate-Actual Internet coverage rate | |
| The reduction of the number of trains in the subway | =IF THEN ELSE (Policy response = 1, 0.056, 0) | |
| The reduction in taxi service | =IF THEN ELSE (Policy response = 1, 0.824, 0) | |
| The reduction of the number of trains in the bus | =IF THEN ELSE (Policy response = 1, 0.187, 0) | |
| gap in public transport service | =(The reduction in taxi service + The reduction of the number of trains in the bus + The reduction of the number of trains in the subway)/3 | |
| Infrastructure and Health resilience | =INTEG (−variation rate IHR (t), 0) | |
| Policy Governance System | Government Revenue rate (t) | =GDP ∗ Ratio of government revenue to GDP |
| Cost rate of public health events (t) | =Total cost of controlling public health events + Other public health emergency expenditures | |
| Total cost of controlling public health events | =Cost of case tracking and confirmatory testing + Government medical expenditures + Other expenditures to suppress COVID-19 | |
| Total tax revenue (t) | =Government Revenue rate (t) − Cost rate of public health events (t) | |
| gap in DGA (t) | =(DGA baseline − Disaster governance ability (t))/DGA baseline | |
| Disaster governance ability (t) | =(Emergency response efficiency (t) + Focus on disasters (t))/2 | |
| gap in DGA (t) | =(DGA baseline − Disaster governance ability (t))/DGA baseline | |
| variation rate PG (t) | =(gap in TTR (t) + gap in DGA (t))/2 | |
| Policy Governance resilience (t) | =INTEG (−variation rate PG (t), 0) |
References
- McClymont, K.; Bedinger, M.; Beevers, L.; Visser-Quinn, A.; Walker, G.H. Understanding urban resilience with the urban systems abstraction hierarchy (USAH). Sustain. Cities Soc. 2022, 80, 103729. [Google Scholar] [CrossRef]
- Huang, G.; Li, D.; Zhu, X.; Zhu, J. Influencing factors and their influencing mechanisms on urban resilience in China. Sustain. Cities Soc. 2021, 74, 103210. [Google Scholar] [CrossRef]
- Ribeiro, P.J.G.; Pena Jardim Gonçalves, L.A. Urban resilience: A conceptual framework. Sustain. Cities Soc. 2019, 50, 101625. [Google Scholar] [CrossRef]
- Botequilha-Leitão, A.; Díaz-Varela, E.R. Performance Based Planning of complex urban social-ecological systems: The quest for sustainability through the promotion of resilience. Sustain. Cities Soc. 2020, 56, 102089. [Google Scholar] [CrossRef]
- Ryan, B.J.; Kako, M.; Garner, S.; Fink, R.; Tayfur, I.; Abrahams, J. Prioritizing strategies for building the resilience of public health systems to disasters across multiple communities and countries. Int. J. Disaster Risk Sci. 2024, 15, 1–17. [Google Scholar] [CrossRef]
- Murray, V.; Aitsi-Selmi, A.; Blanchard, K. The role of public health within the United Nations post—2015 framework for disaster risk reduction. Int. J. Disaster Risk Sci. 2015, 6, 28–37. [Google Scholar] [CrossRef]
- Dewa, O.; Makoka, D.; Ayo-Yusuf, O. Assessing Capacity and Implementation Status of the Disaster Risk Management Strategy for Health and Community Disaster Resilience in Malawi. Int. J. Disaster Risk Sci. 2021, 12, 673–688. [Google Scholar] [CrossRef]
- Barthelemy, M. The statistical physics of cities. Nat. Rev. Phys. 2019, 1, 406–415. [Google Scholar] [CrossRef]
- Lara, D.V.R.; Pfaffenbichler, P.; Rodrigues da Silva, A.N. Modeling the resilience of urban mobility when exposed to the COVID-19 pandemic: A qualitative system dynamics approach. Sustain. Cities Soc. 2023, 91, 104411. [Google Scholar] [CrossRef] [PubMed]
- Borsekova, K.; Nijkamp, P.; Guevara, P. Urban resilience patterns after an external shock: An exploratory study. Int. J. Disaster Risk Reduct. 2018, 31, 381–392. [Google Scholar] [CrossRef]
- Zhang, F.; Chan, A.P.C.; Chen, L.; Li, D.; Cui, P. Exploring and measuring the health resilience of urban buildings against the pandemic: A case study of Hong Kong public housing during COVID-19. Int. J. Disaster Risk Reduct. 2024, 103, 104343. [Google Scholar] [CrossRef]
- Xiao, Y.; Yang, H.; Chen, L.; Huang, H.; Chang, M. Urban resilience assessment and multi-scenario simulation: A case study of three major urban agglomerations in China. Environ. Impact Assess. Rev. 2025, 111, 107734. [Google Scholar] [CrossRef]
- Dui, H.; Liu, K.; Wu, S. Cascading failures and resilience optimization of hospital infrastructure systems against the COVID-19. Comput. Ind. Eng. 2023, 179, 109158. [Google Scholar] [CrossRef] [PubMed]
- Holling, C.S. Resilience and Stability of Ecological Systems. Annu. Rev. Ecol. Evol. Syst. 1973, 4, 1–23. [Google Scholar] [CrossRef]
- Walker, B.; Holling, C.S.; Carpenter, S.R.; Kinzig, A. Resilience, Adaptability and Transformability in Social–Ecological Systems. Ecol. Soc. 2004, 9, 5. [Google Scholar] [CrossRef]
- Abbasnejadfard, M.; Bastami, M.; Abbasnejadfard, M.; Borzoo, S. Novel deterministic and probabilistic resilience assessment measures for engineering and infrastructure systems based on the economic impacts. Int. J. Disaster Risk Reduct. 2022, 75, 102956. [Google Scholar] [CrossRef]
- Wang, N.; Wu, M.; Yuen, K.F. Assessment of port resilience using Bayesian network: A study of strategies to enhance readiness and response capacities. Reliab. Eng. Syst. Saf. 2023, 237, 109394. [Google Scholar] [CrossRef]
- Meng, Z.; He, M.; Li, X.; Li, H.; Tan, Y.; Li, Z.; Wei, Y. Spatio-temporal analysis and driving forces of urban ecosystem resilience based on land use: A case study in the Great Bay Area. Ecol. Indic. 2024, 159, 111769. [Google Scholar] [CrossRef]
- Cheng, T.; Zhao, Y.; Zhao, C. Exploring the spatio-temporal evolution of economic resilience in Chinese cities during the COVID-19 crisis. Sustain. Cities Soc. 2022, 84, 103997. [Google Scholar] [CrossRef]
- Ahmadi, H.; Samany, N.N.; Ghanbari, A.; Argany, M. Designing a bi-level emergency medical centers’ chain to increase the resilience of EMS’s supply-chain using ACO-QAP: A case study of Tabriz. Int. J. Disaster Risk Reduct. 2022, 82, 103259. [Google Scholar] [CrossRef]
- Nan, C.; Sansavini, G. A quantitative method for assessing resilience of interdependent infrastructures. Reliab. Eng. Syst. Saf. 2017, 157, 35–53. [Google Scholar] [CrossRef]
- Wu, W.; Wang, Z.; Wu, K.; Chen, Y.; Wang, S.; Niu, X. Urban resilience framework: A network-based model to assess the physical system reaction and disaster prevention. Environ. Impact Assess. Rev. 2024, 109, 107619. [Google Scholar] [CrossRef]
- Zhang, J.; Wang, T. Urban resilience under the COVID-19 pandemic: A quantitative assessment framework based on system dynamics. Cities 2023, 136, 104265. [Google Scholar] [CrossRef]
- Bozza, A.; Asprone, D.; Parisi, F.; Manfredi, G. Alternative resilience indices for city ecosystems subjected to natural hazards. Comput.-Aided Civ. Infrastruct. Eng. 2017, 32, 527–545. [Google Scholar] [CrossRef]
- Jovanović, A.; Klimek, P.; Renn, O.; Schneider, R.; Øien, K.; Brown, J.; DiGennaro, M.; Liu, Y.; Pfau, V.; Jelić, M.; et al. Assessing resilience of healthcare infrastructure exposed to COVID-19: Emerging risks, resilience indicators, interdependencies and international standards. Environ. Syst. Decis. 2020, 40, 252–286. [Google Scholar] [CrossRef] [PubMed]
- Inoue, H.; Murase, Y.; Todo, Y. Do economic effects of the anti-COVID-19 lockdowns in different regions interact through supply chains? PLoS ONE 2021, 16, e0255031. [Google Scholar] [CrossRef] [PubMed]
- Vicino, T.J.; Voigt, R.H.; Kabir, M.; Michanie, J. Urban crises and the Covid-19 pandemic: An analytical framework for metropolitan resiliency. Urban Plan. 2022, 7, 4–14. [Google Scholar] [CrossRef]
- Bigoni, A.; Malik, A.M.; Tasca, R.; Carrera, M.B.M.; Schiesari, L.M.C.; Gambardella, D.D.; Massuda, A. Brazil’s health system functionality amidst of the COVID-19 pandemic: An analysis of resilience. Lancet Reg. Health Am. 2022, 10, 100222. [Google Scholar] [CrossRef]
- Forcellini, D. A resilience-based (RB) methodology to assess resilience of health system infrastructures to epidemic crises. Appl. Sci. 2022, 12, 3032. [Google Scholar] [CrossRef]
- Cao, J.; Zhang, G.; Liu, D. The impact of using mHealth apps on improving public health satisfaction during the COVID-19 pandemic: A digital content value chain perspective. Healthcare 2022, 10, 479. [Google Scholar] [CrossRef]
- Guo, J.; Liu, N.; Wu, Y.; Zhang, C. Why do citizens participate on government social media accounts during crises? A civic voluntarism perspective. Inf. Manag. 2021, 58, 103286. [Google Scholar] [CrossRef]
- Liu, A.; Li, Z.; Shang, W.-L.; Ochieng, W. Performance evaluation model of transportation infrastructure: Perspective of COVID-19. Transp. Res. Part A Policy Pract. 2023, 170, 103605. [Google Scholar] [CrossRef]
- Papadopoulou, P.; Lytras, M.D. Empowering the One Health approach and health resilience with digital technologies across OECD countries: The case of COVID-19 pandemic. In Next Gen Tech Driven Personalized Med & Smart Healthcare; Lytras, M.D., Sarirete, A., Visvizi, A., Chui, K.T., Eds.; Academic Press: New York, NY, USA, 2021; pp. 225–241. [Google Scholar]
- Scholz, C.; Schauer, S.; Latzenhofer, M. The emergence of new critical infrastructures. Is the COVID-19 pandemic shifting our perspective on what critical infrastructures are? Int. J. Disaster Risk Reduct. 2022, 83, 103419. [Google Scholar] [CrossRef]
- Malatesta, T.; Syed, M.; Breadsell, J.K. COVID-19 lockdown energy use changes in Australian apartments. Energy Build. 2023, 300, 113679. [Google Scholar] [CrossRef]
- Lindström Månefjord, J.; Johansson, J. Critical flows throughout the COVID-19 pandemic—A longitudinal study on interdependencies and resilience in a Swedish context. Int. J. Disaster Risk Reduct. 2024, 103, 104295. [Google Scholar] [CrossRef]
- Orji, I.J.; U-Dominic, C.M. Adaptable solutions for retail supply chain resilience in the post-COVID-19 era. Socio-Econ. Plan. 2024, 96, 102090. [Google Scholar] [CrossRef]
- Ching-Pong Poo, M.; Wang, T.; Yang, Z. Global food supply chain resilience assessment: A case in the United Kingdom. Transp. Res. Part A Policy Pract. 2024, 181, 104018. [Google Scholar] [CrossRef]
- Yuan, M.; Xiao, Y.; Yang, Y.; Liu, C. Coupling coordination analysis of the economy-ecology-society complex systems in China’s Wenchuan earthquake disaster area. Ecol. Indic. 2023, 156, 111145. [Google Scholar] [CrossRef]
- Nguyen, H.; Pham, A.V.; Pham, M.D.M.; Pham, M.H. Business resilience: Lessons from government responses to the global COVID-19 crisis. Int. Bus. Rev. 2023, 32, 102166. [Google Scholar] [CrossRef]
- Li, J.; Zhuang, C.; Zou, W. A tale of lockdown policies on the transmission of COVID-19 within and between Chinese cities: A study based on heterogeneous treatment effect. Econ. Hum. Biol. 2024, 53, 101365. [Google Scholar] [CrossRef]
- Amegavi, G.B.; Nursey-Bray, M.; Suh, J. Exploring the realities of urban resilience: Practitioners’ perspectives. Int. J. Disaster Risk Reduct. 2024, 103, 104313. [Google Scholar] [CrossRef]
- Zhang, F. The community resilience measurement throughout the COVID-19 pandemic and beyond—An empirical study based on data from Shanghai, Wuhan and Chengdu. Int. J. Disaster Risk Reduct. 2022, 67, 102664. [Google Scholar]
- Liu, Y.; Gu, T.; Li, L.; Cui, P.; Liu, Y. Measuring the Urban Resilience Based on Geographically Weighted Regression (GWR) Model in the Post-Pandemic Era: A Case Study of Jiangsu Province, China. Land 2023, 12, 7. [Google Scholar]
- Wang, X.; Xu, S.; Wang, D. Analysis of regional resilience network from the perspective of relational and dynamic equilibrium. J. Clean. Prod. 2023, 425, 138859. [Google Scholar] [CrossRef]
- Xun, X.; Yuan, Y. Research on the urban resilience evaluation with hybrid multiple attribute TOPSIS method: An example in China. Nat. Hazards 2020, 103, 557–577. [Google Scholar] [CrossRef] [PubMed]
- Copeland, S.; Comes, T.; Bach, S.; Nagenborg, M.; Schulte, Y.; Doorn, N. Measuring social resilience: Trade-offs, challenges, and opportunities for indicator models in transforming societies. Int. J. Disaster Risk Reduct. 2020, 51, 101799. [Google Scholar] [CrossRef]
- Zhang, J.; Wang, T.; Goh, Y.M.; He, P.; Hua, L. The effects of long-term policies on urban resilience: A dynamic assessment framework. Cities 2024, 153, 105294. [Google Scholar] [CrossRef]
- Liu, H.; Tan, Y.; Zuo, J.; Xu, X.; Xiong, L.; Mao, P. Assessing risk of metro microenvironmental health vulnerability from the coupling perspective: A case of Nanjing, China. J. Clean. Prod. 2024, 466, 142861. [Google Scholar] [CrossRef]
- Zhao, Z.; Zhou, X.; Zheng, Y.; Meng, T.; Fang, D. Enhancing infrastructural dynamic responses to critical residents’ needs for urban resilience through machine learning and hypernetwork analysis. Sustain. Cities Soc. 2024, 106, 105366. [Google Scholar] [CrossRef]
- Meng, W.; Xu, J. Assessing road network resilience in disaster areas from a complex network perspective: A real-life case study from China. Int. J. Disaster Risk Reduct. 2024, 100, 104167. [Google Scholar]
- Ganin, A.A.; Mersky, A.C.; Jin, A.S.; Kitsak, M.; Keisler, J.M.; Linkov, I. Resilience in intelligent transportation systems (ITS). Transp. Res. Part C Emerg. Technol. 2019, 100, 318–329. [Google Scholar] [CrossRef]
- Salimi, N.; Feizi, A.; Rasinezami, S.; Kanooni, A. Management and planning of water resources allocation at the scenario analysis using system dynamics model: A case study on Yamchi dam basin, Iran. J. Appl. Res. Water Wastewater 2021, 8, 14–20. [Google Scholar]
- Kotir, J.H.; Smith, C.; Brown, G.; Marshall, N.; Johnstone, R. A system dynamics simulation model for sustainable water resources management and agricultural development in the Volta River Basin, Ghana. Sci. Total Environ. 2016, 573, 444–457. [Google Scholar] [CrossRef] [PubMed]
- Ding, S.; Ward, H.; Cucurachi, S.; Tukker, A. Revealing the hidden potentials of Internet of Things (IoT): An integrated approach using agent-based modelling and system dynamics to assess sustainable supply chain performance. J. Clean. Prod. 2023, 421, 138558. [Google Scholar] [CrossRef]
- Sutley, E.J.; Hamideh, S. An interdisciplinary system dynamics model for post-disaster housing recovery. Sustain. Resil. Infrastruct. 2017, 3, 109–127. [Google Scholar] [CrossRef]
- Wang, N.; Wu, M.; Yuen, K.F. Modelling and assessing long-term urban transportation system resilience based on system dynamics. Sustain. Cities Soc. 2024, 109, 105548. [Google Scholar] [CrossRef]
- Xiao, W.; Wei, Y.D.; Wu, Y. Neighborhood, built environment and resilience in transportation during the COVID-19 pandemic. Transp. Res. Part D Transp. Environ. 2022, 110, 103428. [Google Scholar] [CrossRef]
- Tye, M.R.; Wilhelmi, O.; Boehnert, J.; Faye, E.; Milestad, R.; Pierce, A.L.; Laborgne, P. Examining urban resilience through a food-water-energy nexus lens to understand the effects of climate change. iScience 2024, 27, 110311. [Google Scholar] [CrossRef] [PubMed]
- Chen, L.; Chang, M.; Yang, H.; Xiao, Y.; Huang, H.; Wang, X. Comprehensive evaluation and optimal management of extreme disaster risk in Chinese urban agglomerations by integrating resilience risk elements and set pair analysis. Int. J. Disaster Risk Reduct. 2024, 111, 104671. [Google Scholar] [CrossRef]
- Zhang, Y.; Liu, Q.; Li, X.; Zhang, X.; Qiu, Z. Spatial-temporal evolution characteristics and critical factors identification of urban resilience under public health emergencies. Sustain. Cities Soc. 2024, 102, 105221. [Google Scholar] [CrossRef]
- Liu, J.; Lin, Z.; Chau, K.W.; Shi, Y.; Yang, L. Urban resilience in face of the pandemic: Tracing changes in public events before, amid and after the fifth wave of COVID-19 in Hong Kong. Cities 2024, 147, 104827. [Google Scholar] [CrossRef]
- Shan, S.; Zhang, Z.; Ji, W.; Wang, H. Analysis of collaborative urban public crisis governance in complex system: A multi-agent stochastic evolutionary game approach. Sustain. Cities Soc. 2023, 91, 104418. [Google Scholar] [CrossRef]
- Kuguyo, O.; Kengne, A.P.; Dandara, C. Singapore COVID-19 Pandemic Response as a Successful Model Framework for Low-Resource Health Care Settings in Africa? OMICS A J. Integr. Biol. 2020, 24, 470–478. [Google Scholar] [CrossRef] [PubMed]
- Zhu, P.; Tan, X. Evaluating the effectiveness of Hong Kong’s border restriction policy in reducing COVID-19 infections. BMC Public Health 2022, 22, 1–19. [Google Scholar] [CrossRef] [PubMed]
- Gooding, K.; Bertone, M.P.; Loffreda, G.; Witter, S. How can we strengthen partnership and coordination for health system emergency preparedness and response? Findings from a synthesis of experience across countries facing shocks. BMC Health Serv. Res. 2022, 22, 1441. [Google Scholar] [CrossRef] [PubMed]
- Schneider, S.K. Governmental response to disasters: Key attributes, expectations, and implications. In Handbook of Disaster Research; Rodríguez, H., Donner, W., Trainor, J.E., Eds.; Springer International Publishing: Cham, Switzerland, 2018; pp. 551–568. [Google Scholar]
- Kapucu, N.; Hu, Q.; Sadiq, A.-A.; Hasan, S. Building urban infrastructure resilience through network governance. Urban Gov. 2023, 3, 5–13. [Google Scholar] [CrossRef]
- Haldane, V.; Morales-Vazquez, M.; Jamieson, M.; Veillard, J.; Marchildon, G.P.; Allin, S. Learning from the first wave of the COVID-19 pandemic: Comparing policy responses in Uruguay with 10 other Latin American and Caribbean countries. Health Policy Open 2022, 3, 100081. [Google Scholar] [CrossRef] [PubMed]
- Mahmoud, H.; Kirsch, T.; O’Neil, D.; Anderson, S. The resilience of health care systems following major disruptive events: Current practice and a path forward. Reliab. Eng. Syst. Saf. 2023, 235, 109264. [Google Scholar] [CrossRef]
- Quiroz-Fabra, J.; Londoño-Celis, W.; Valencia-Arias, A.; Cifuentes-Correa, L. Impact of the COVID-19 pandemic on the tourism sector: A bibliometric analysis. In COVID-19, Tourist Destinations and Prospects for Recovery: Volume One: A Global Perspective; Dube, K., Nhamo, G., Swart, M., Eds.; Springer International Publishing: Cham, Switzerland, 2023; pp. 43–60. [Google Scholar]
- Khan, A.; Bibi, S.; Lyu, J.; Latif, A.; Lorenzo, A. COVID-19 and sectoral employment trends: Assessing resilience in the US leisure and hospitality industry. Curr. Issues Tour. 2021, 24, 952–969. [Google Scholar] [CrossRef]
- He, C.; Sheng, H. Governance capacity, related variety, and regional economic resilience under the COVID-19 epidemic: Evidence from China. Ann. Reg. Sci. 2024, 73, 291–321. [Google Scholar] [CrossRef]
- Datola, G. Implementing urban resilience in urban planning: A comprehensive framework for urban resilience evaluation. Sustain. Cities Soc. 2023, 98, 104821. [Google Scholar] [CrossRef]
- Liu, L.; Lei, Y.; Zhuang, M.; Ding, S. The impact of climate change on urban resilience in the Beijing-Tianjin-Hebei region. Sci. Total Environ. 2022, 827, 154157. [Google Scholar] [CrossRef]
- Zhao, R.; Fang, C.; Liu, J.; Zhang, L. The evaluation and obstacle analysis of urban resilience from the multidimensional perspective in Chinese cities. Sustain. Cities Soc. 2022, 86, 104160. [Google Scholar] [CrossRef]
- Shi, Y.; Zhai, G.; Xu, L.; Zhou, S.; Lu, Y.; Liu, H.; Huang, W. Assessment methods of urban system resilience: From the perspective of complex adaptive system theory. Cities 2021, 112, 103141. [Google Scholar] [CrossRef]
- Mou, Y.; Luo, Y.; Su, Z.; Wang, J.; Liu, T. Evaluating the dynamic sustainability and resilience of a hybrid urban system: Case of Chengdu, China. J. Clean. Prod. 2021, 291, 125719. [Google Scholar] [CrossRef]
- Li, G.; Kou, C.; Wen, F. The dynamic development process of urban resilience: From the perspective of interaction and feedback. Cities 2021, 114, 103206. [Google Scholar] [CrossRef]
- Ding, C.; Gao, X.; Xie, Z. Analysing the differential impact of the COVID-19 pandemic on the resilience of the tourism economy: A case study of the Chengdu-Chongqing urban agglomeration in China. Int. J. Disaster Risk Reduct. 2024, 102, 104255. [Google Scholar] [CrossRef]
- Marques, A.L.; Alvim, A.T.B. Metropolitan fringes as strategic areas for urban resilience and sustainable transitions: Insights from Barcelona Metropolitan Area. Cities 2024, 150, 105018. [Google Scholar] [CrossRef]
- Mitoulis, S.-A.; Argyroudis, S.; Panteli, M.; Fuggini, C.; Valkaniotis, S.; Hynes, W.; Linkov, I. Conflict-resilience framework for critical infrastructure peacebuilding. Sustain. Cities Soc. 2023, 91, 104405. [Google Scholar] [CrossRef]
- Moradpour, N.; Pourahmad, A.; Ziari, K.; Hataminejad, H.; Sharifi, A. Downscaling urban resilience assessment: A spatiotemporal analysis of urban blocks using the fuzzy Delphi method and K-means clustering. Build. Environ. 2024, 263, 111898. [Google Scholar] [CrossRef]
- Li, J.; Nie, W.; Zhang, M.; Wang, L.; Dong, H.; Xu, B. Assessment and optimization of urban ecological network resilience based on disturbance scenario simulations: A case study of Nanjing city. J. Clean. Prod. 2024, 438, 140812. [Google Scholar] [CrossRef]
- Guo, L.; Qu, Y.; Wu, C.; Wang, X. Identifying a pathway towards green growth of Chinese industrial regions based on a system dynamics approach. Resour. Conserv. Recycl. 2018, 128, 143–154. [Google Scholar] [CrossRef]
- Jiang, N.; Jiang, W. How does regional integration policy affect urban resilience? Evidence from urban agglomeration in China. Environ. Impact Assess. Rev. 2024, 104, 107298. [Google Scholar] [CrossRef]
- McKibbin, W.; Fernando, R. The global economic impacts of the COVID-19 pandemic. Econ. Model. 2023, 129, 106551. [Google Scholar] [CrossRef]
- Tang, X.; Chen, N. A multi-scenario urban resilience simulation study based on the system dynamics model. Phys. Chem. Earth Parts A/B/C 2023, 132, 103467. [Google Scholar] [CrossRef]
- Wang, Z.; Deng, X.; Wong, C.; Li, Z.; Chen, J. Learning urban resilience from a social-economic-ecological system perspective: A case study of Beijing from 1978 to 2015. J. Clean. Prod. 2018, 183, 343–357. [Google Scholar] [CrossRef]
- Qiao, D.; Shen, S.; Chen, J.; Lu, W.; Xu, C.; Su, M. Urban resilience assessment from the perspective of cross-media carbon metabolism. J. Clean. Prod. 2024, 445, 141383. [Google Scholar] [CrossRef]
- Ding, Y.; Chen, S.; Zheng, Y.; Chai, S.; Nie, R. Resilience assessment of China’s natural gas system under supply shortages: A system dynamics approach. Energy 2022, 247, 123518. [Google Scholar] [CrossRef]
- Gupta, N.; Vemireddy, V.; Shaw, A. Food supply chains and resilience to shocks: Evidence from India’s COVID-19 lockdown. Appl. Econ. Perspect. Policy 2023, 45, 1801–1834. [Google Scholar] [CrossRef]
- Meerow, S.; Newell, J.P.; Stults, M. Defining urban resilience: A review. Landsc. Urban Plan. 2016, 147, 38–49. [Google Scholar] [CrossRef]
- Hong, B.; Bonczak, B.J.; Gupta, A.; Kontokosta, C.E. Measuring inequality in community resilience to natural disasters using large-scale mobility data. Nat. Commun. 2021, 12, 1870. [Google Scholar] [CrossRef]
- Thompson, C.N.; Baumgartner, J.; Pichardo, C.; Toro, B.; Li, L.; Arciuolo, R.; Chan, P.Y.; Chen, J.; Culp, G.; Davidson, A.; et al. COVID-19 Outbreak—New York City, February 29–June 1, 2020. MMWR Morb. Mortal. Wkly. Rep. 2020, 69, 1725–1729. [Google Scholar] [CrossRef] [PubMed]
- Cheng, Y.; Liu, J. Evaluation of urban resilience in the post-COVID-19 period: A case study of the Yangtze delta city group in China. Int. J. Disaster Risk Reduct. 2023, 97, 104028. [Google Scholar] [CrossRef]
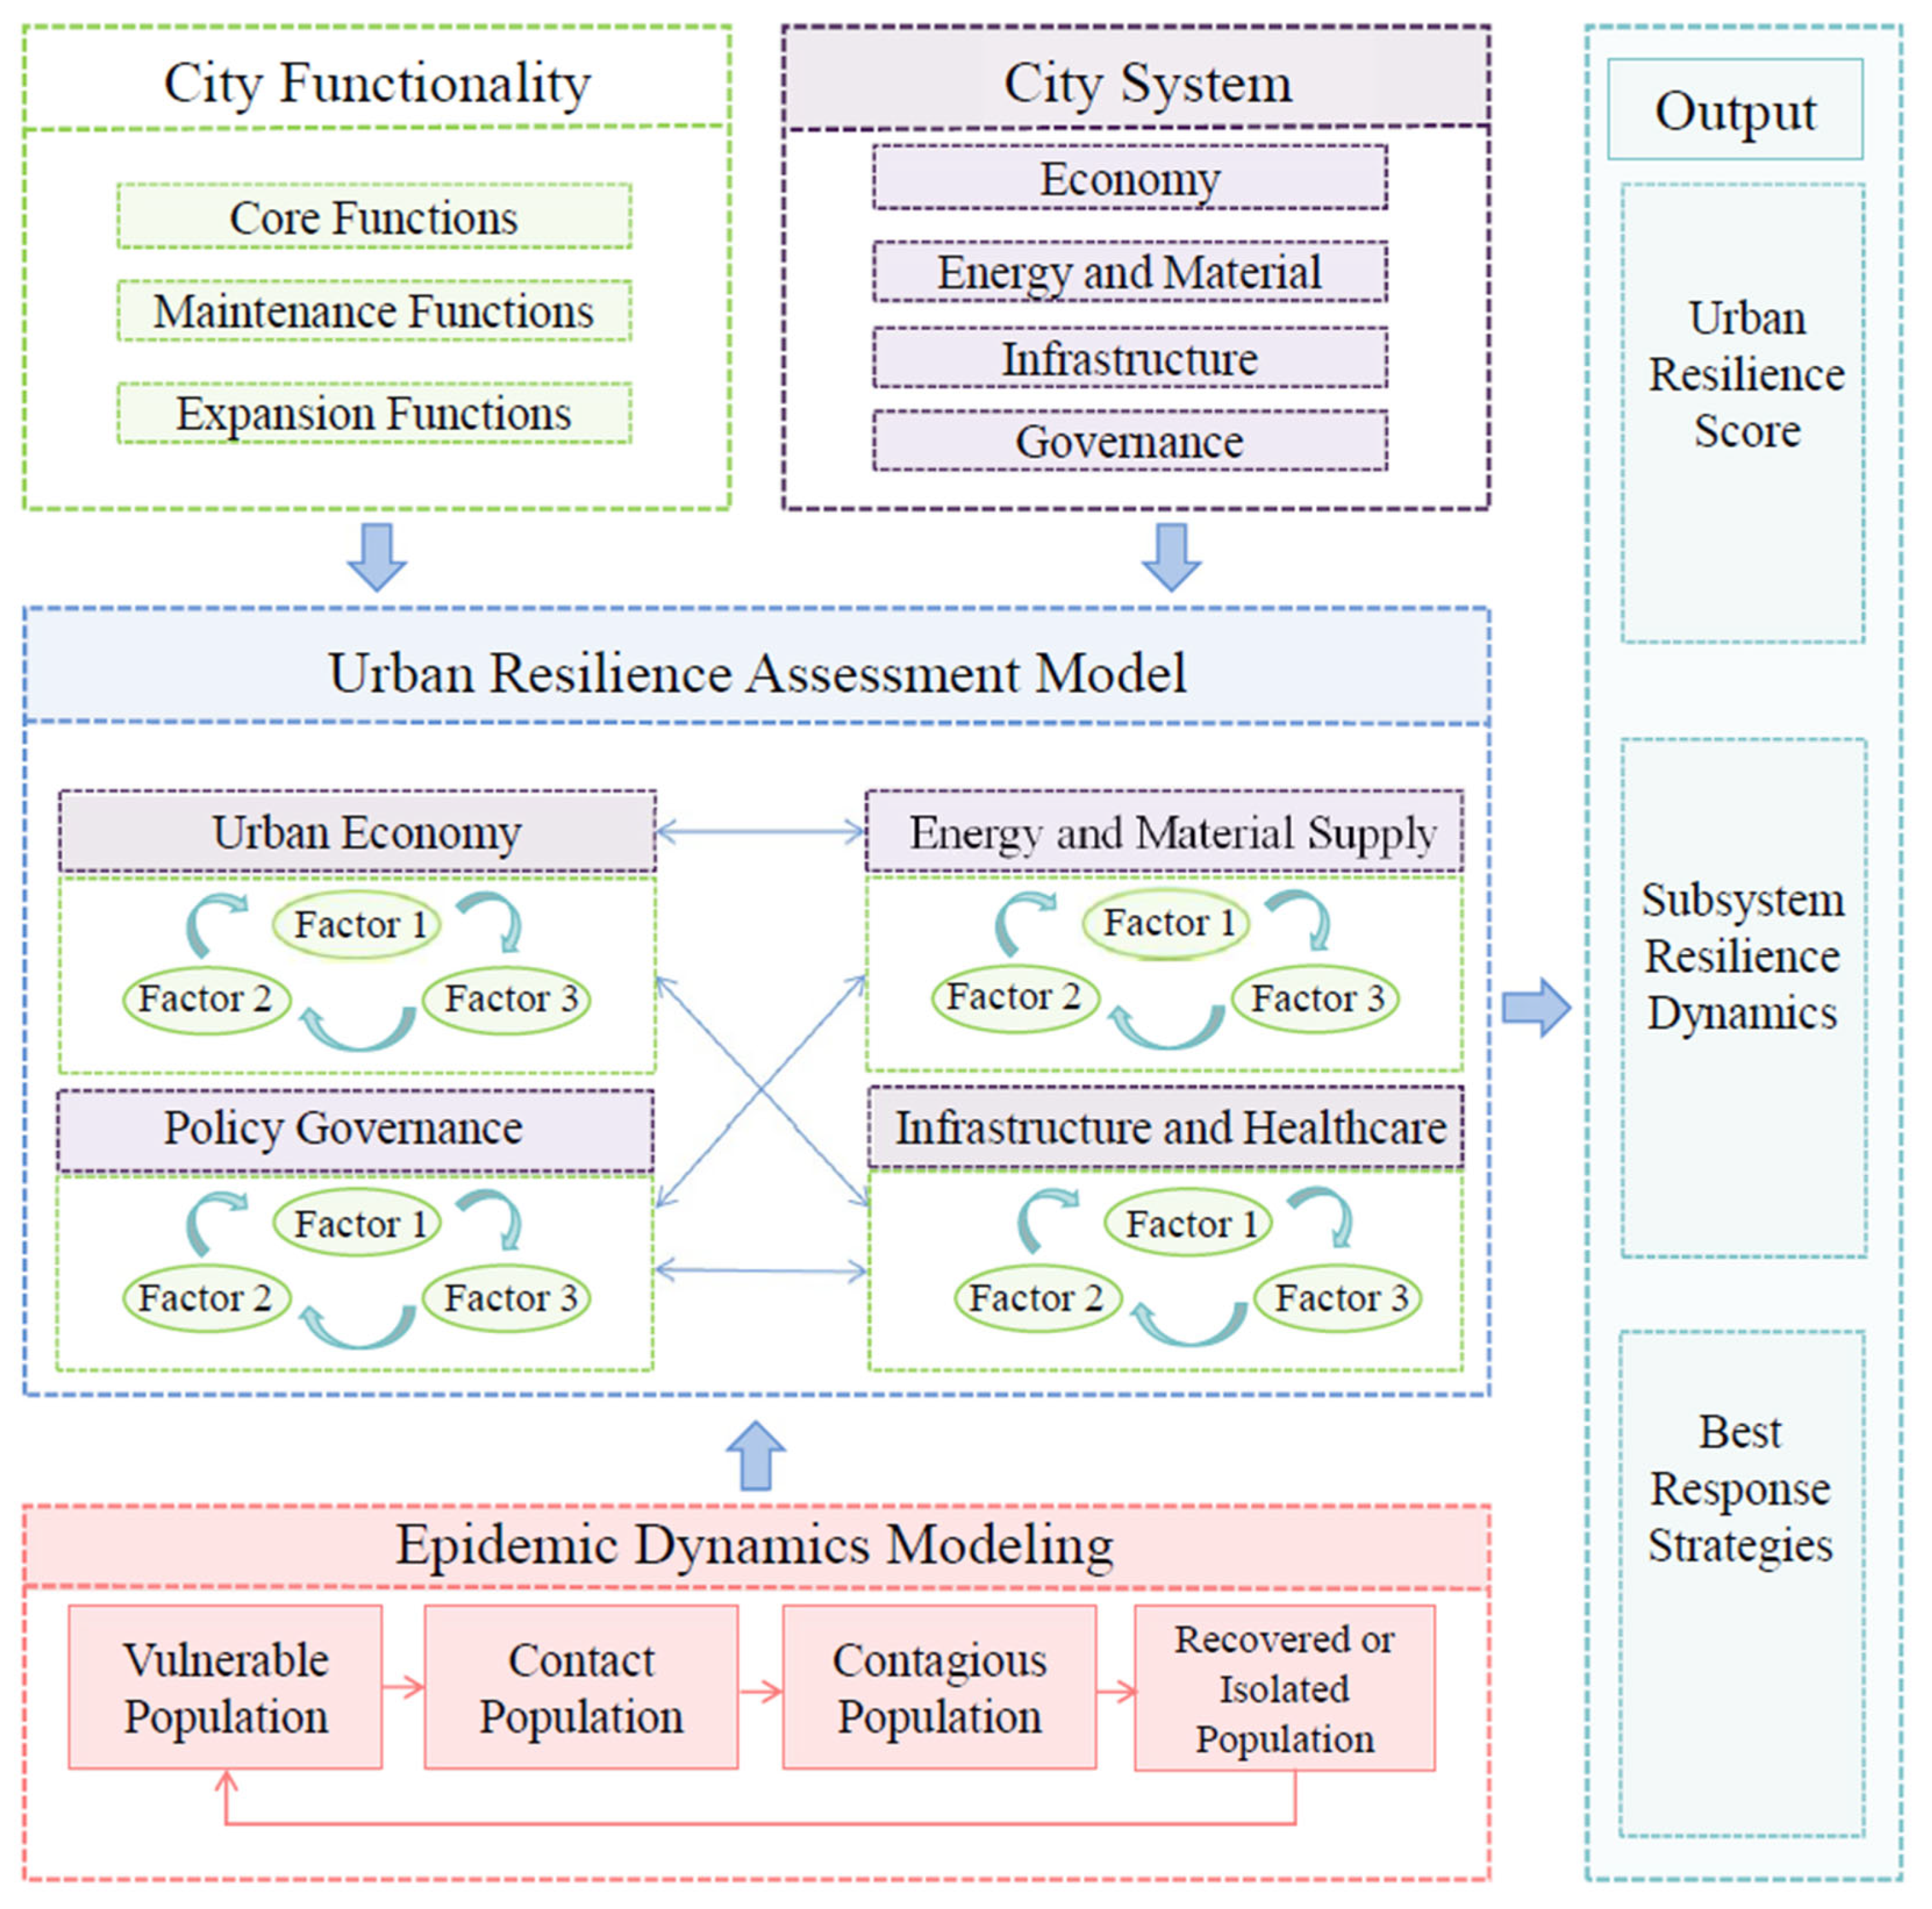

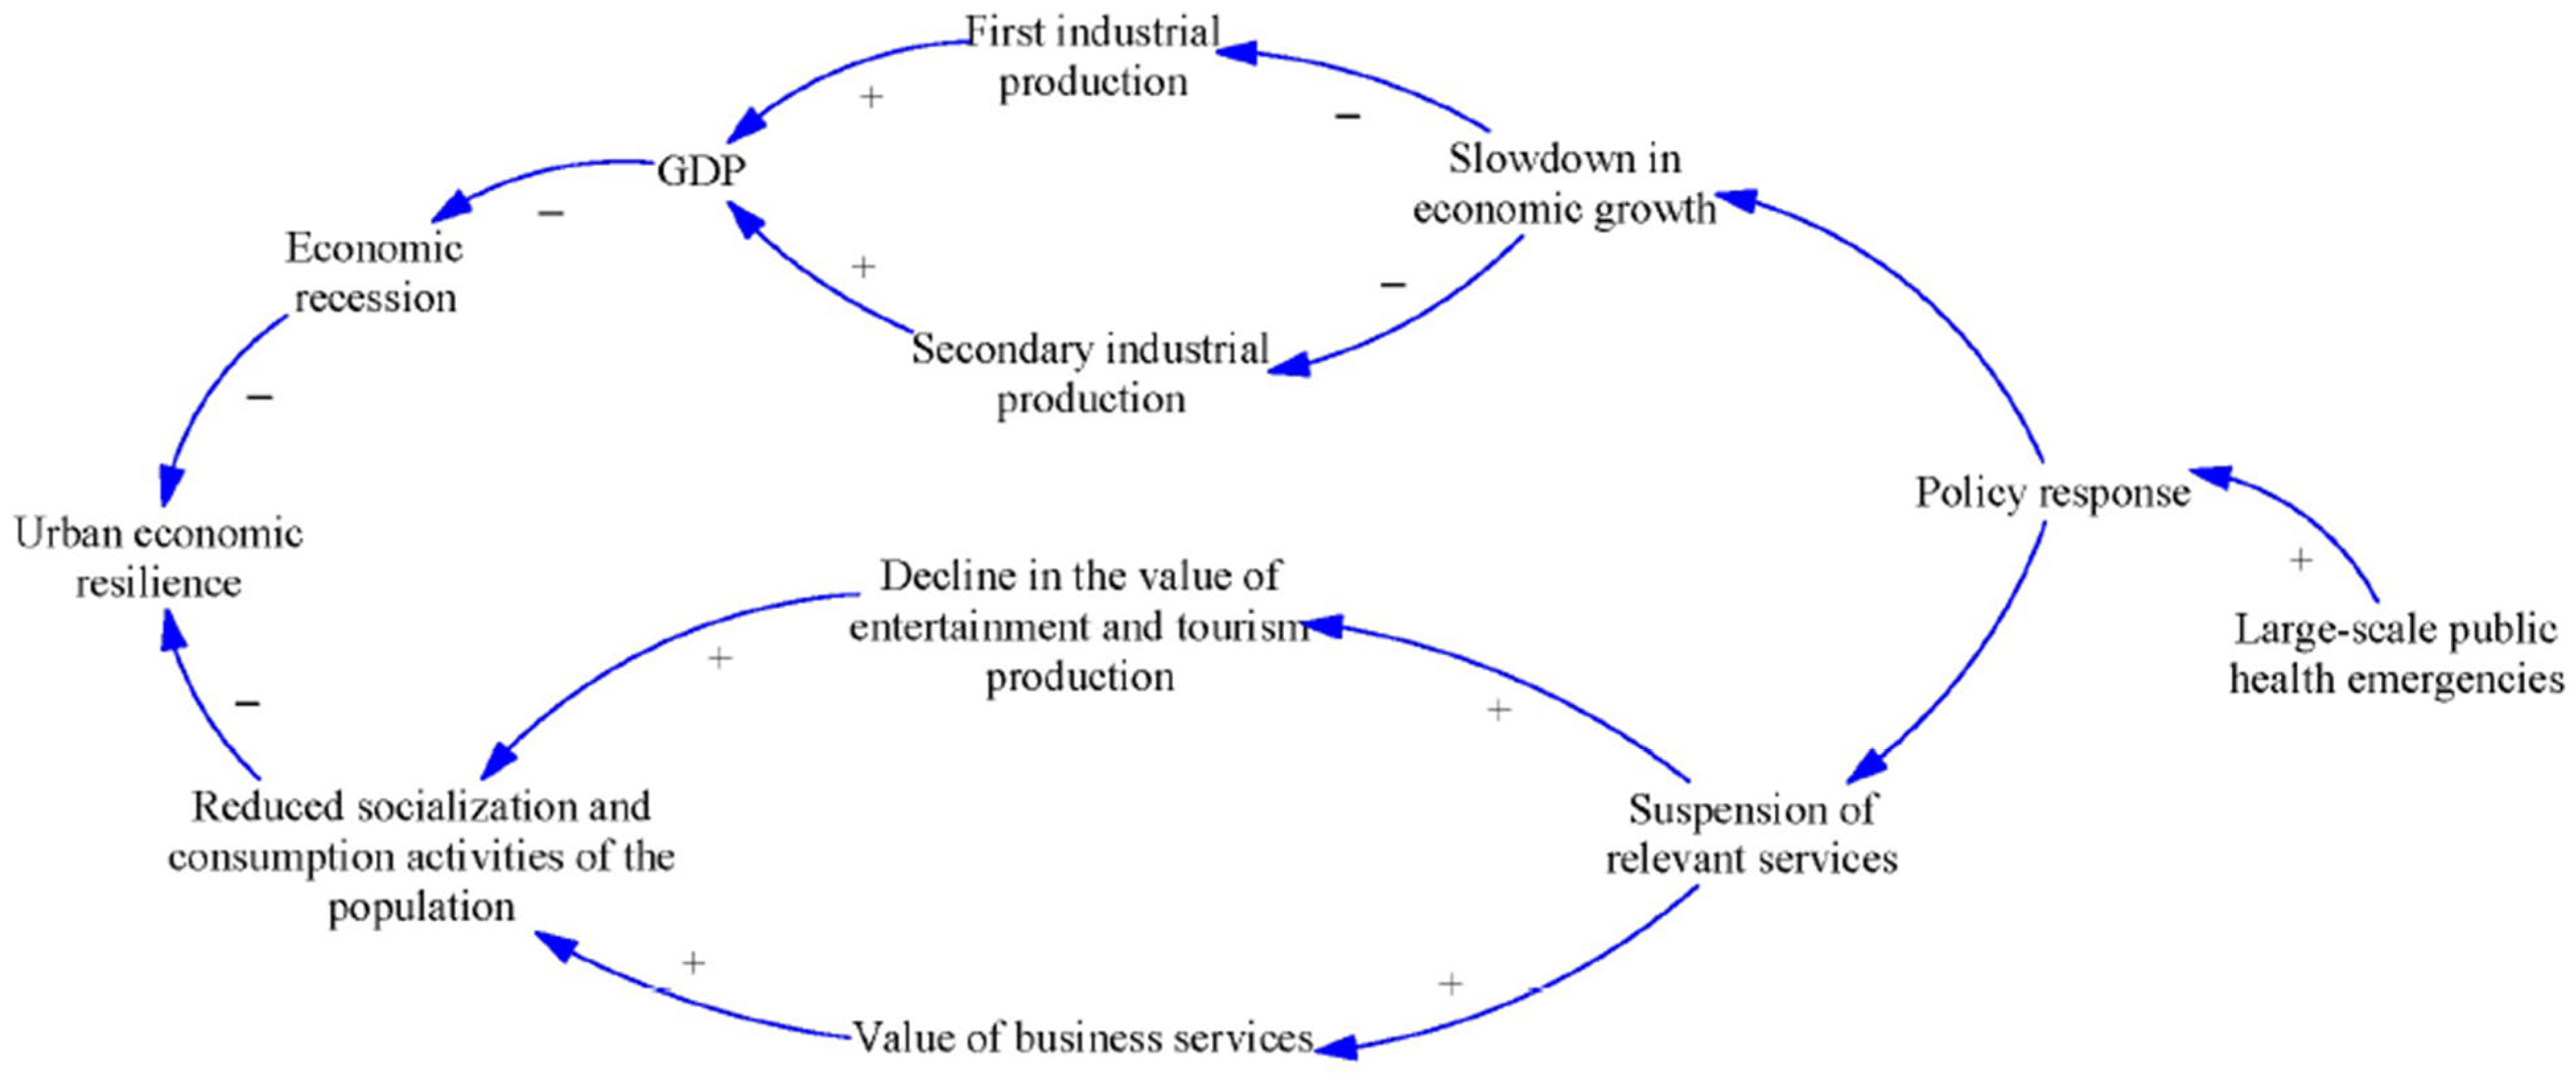
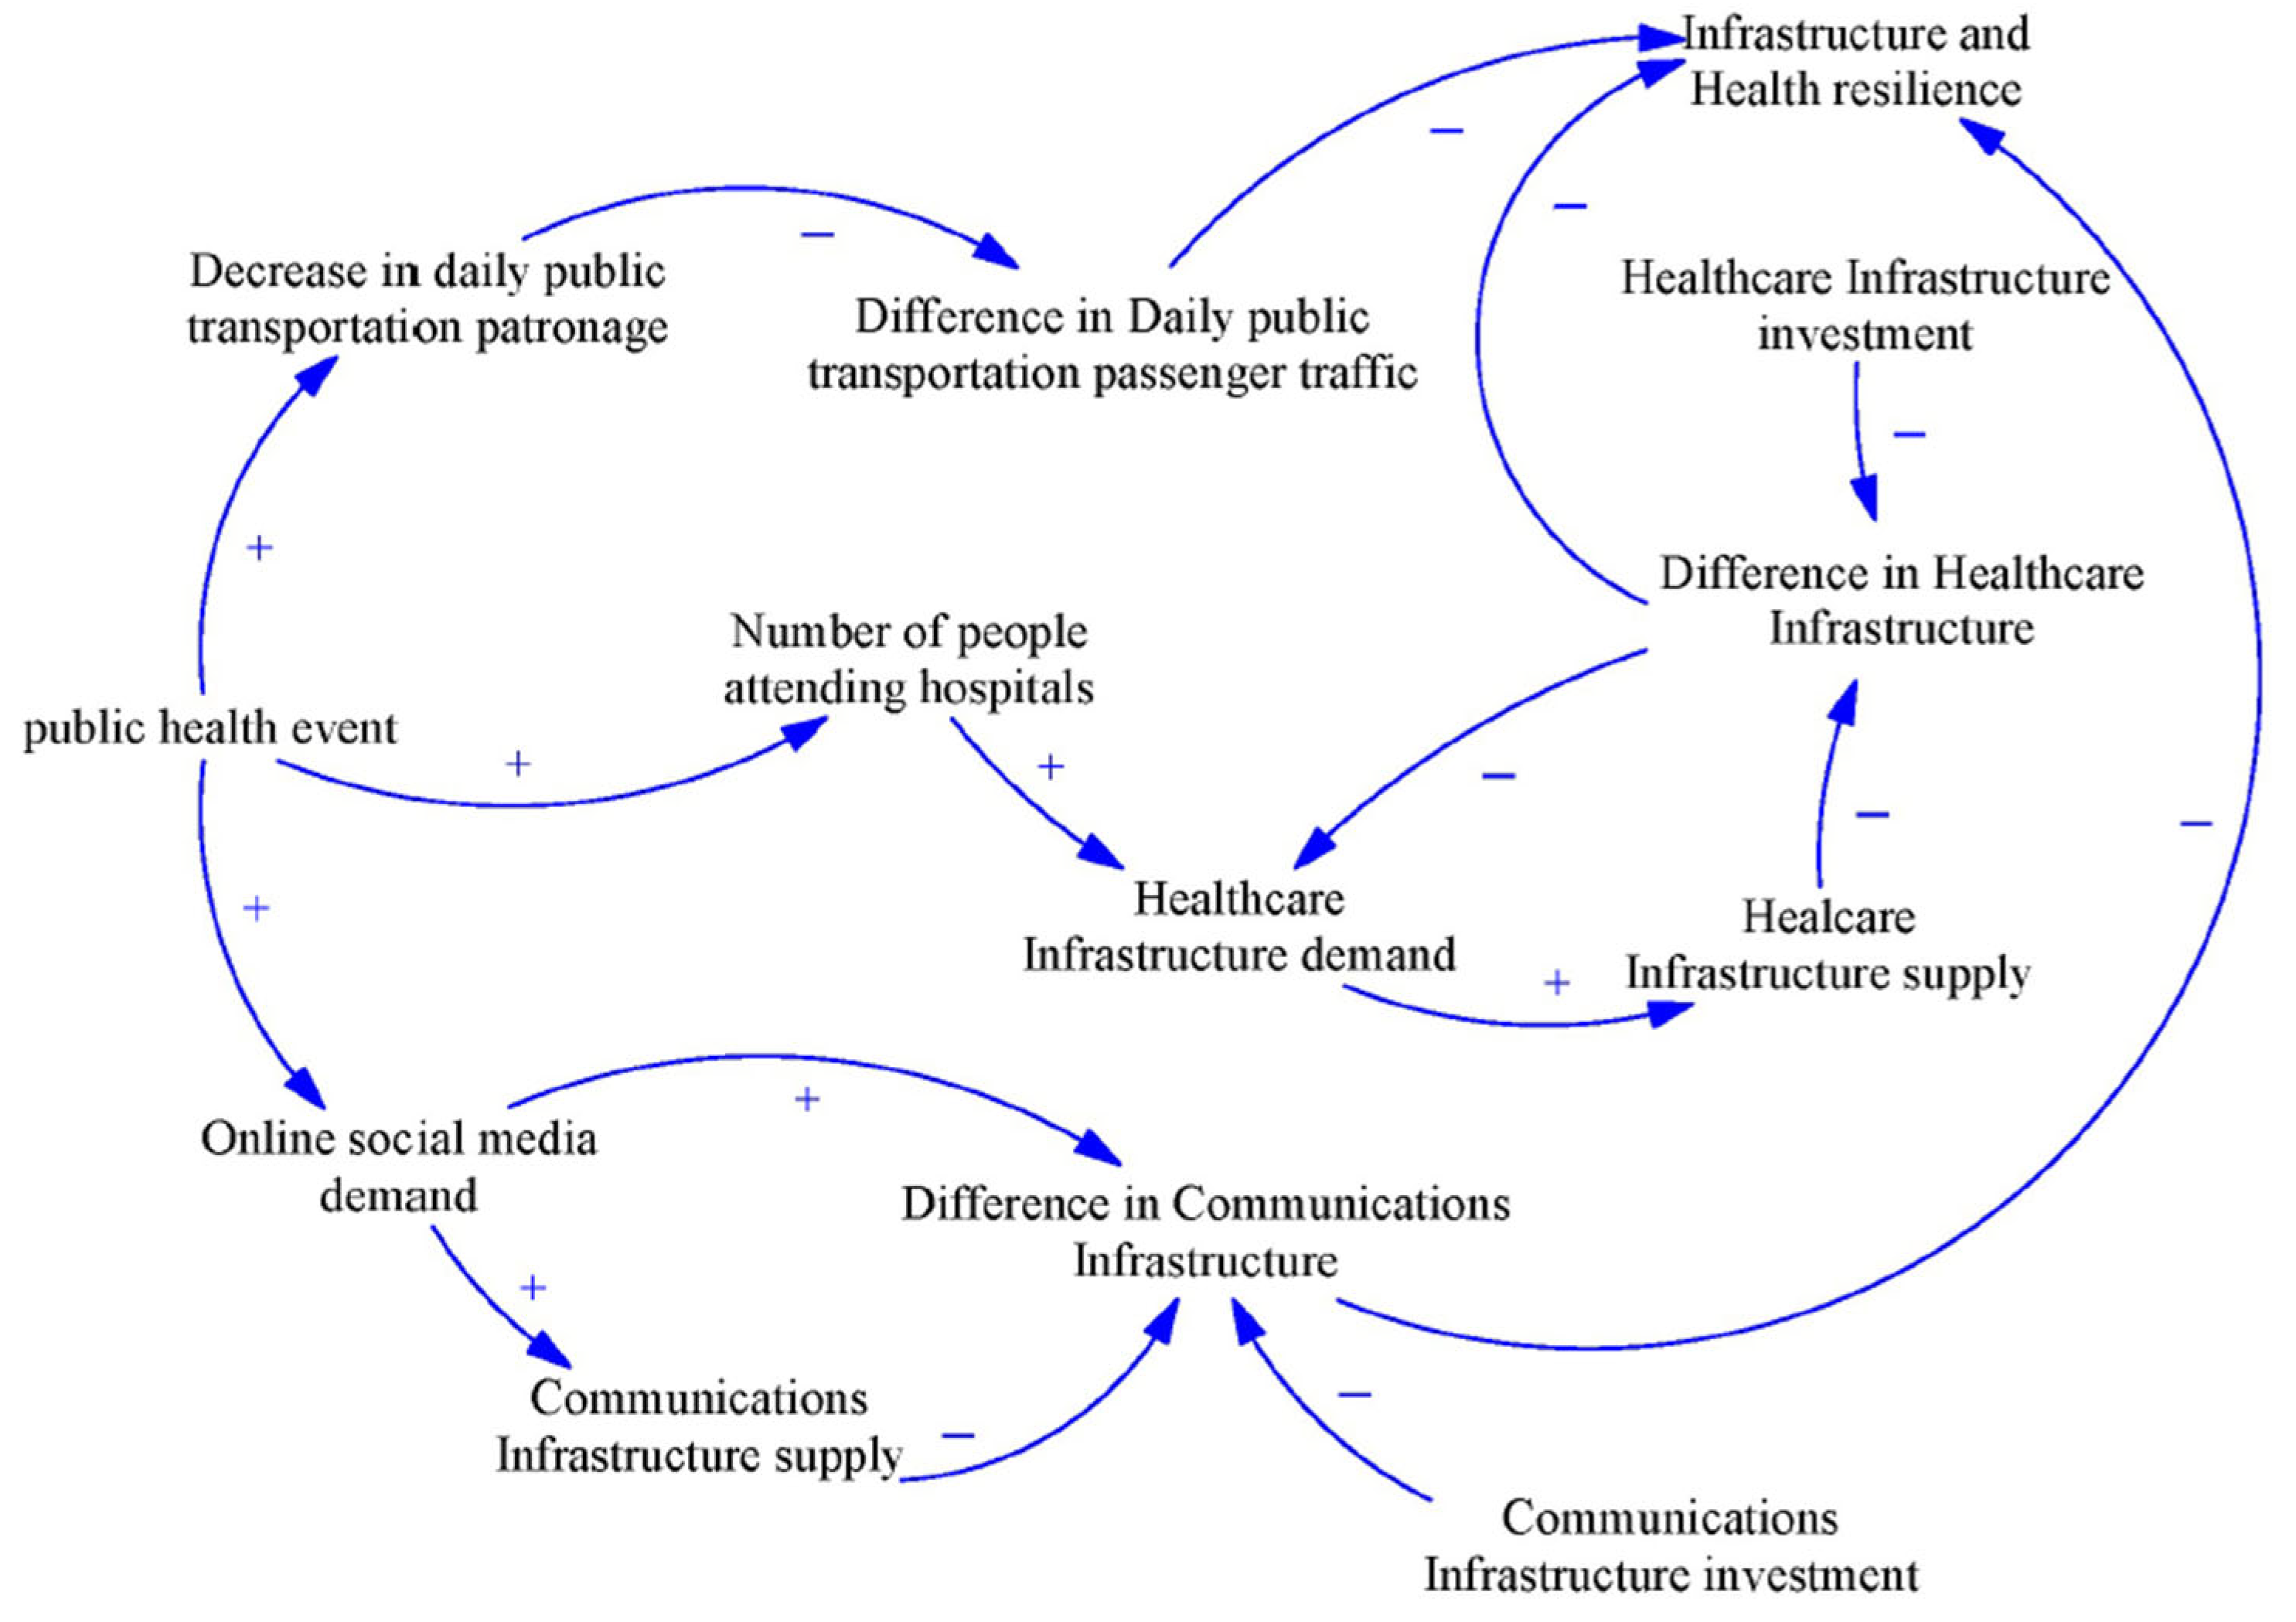
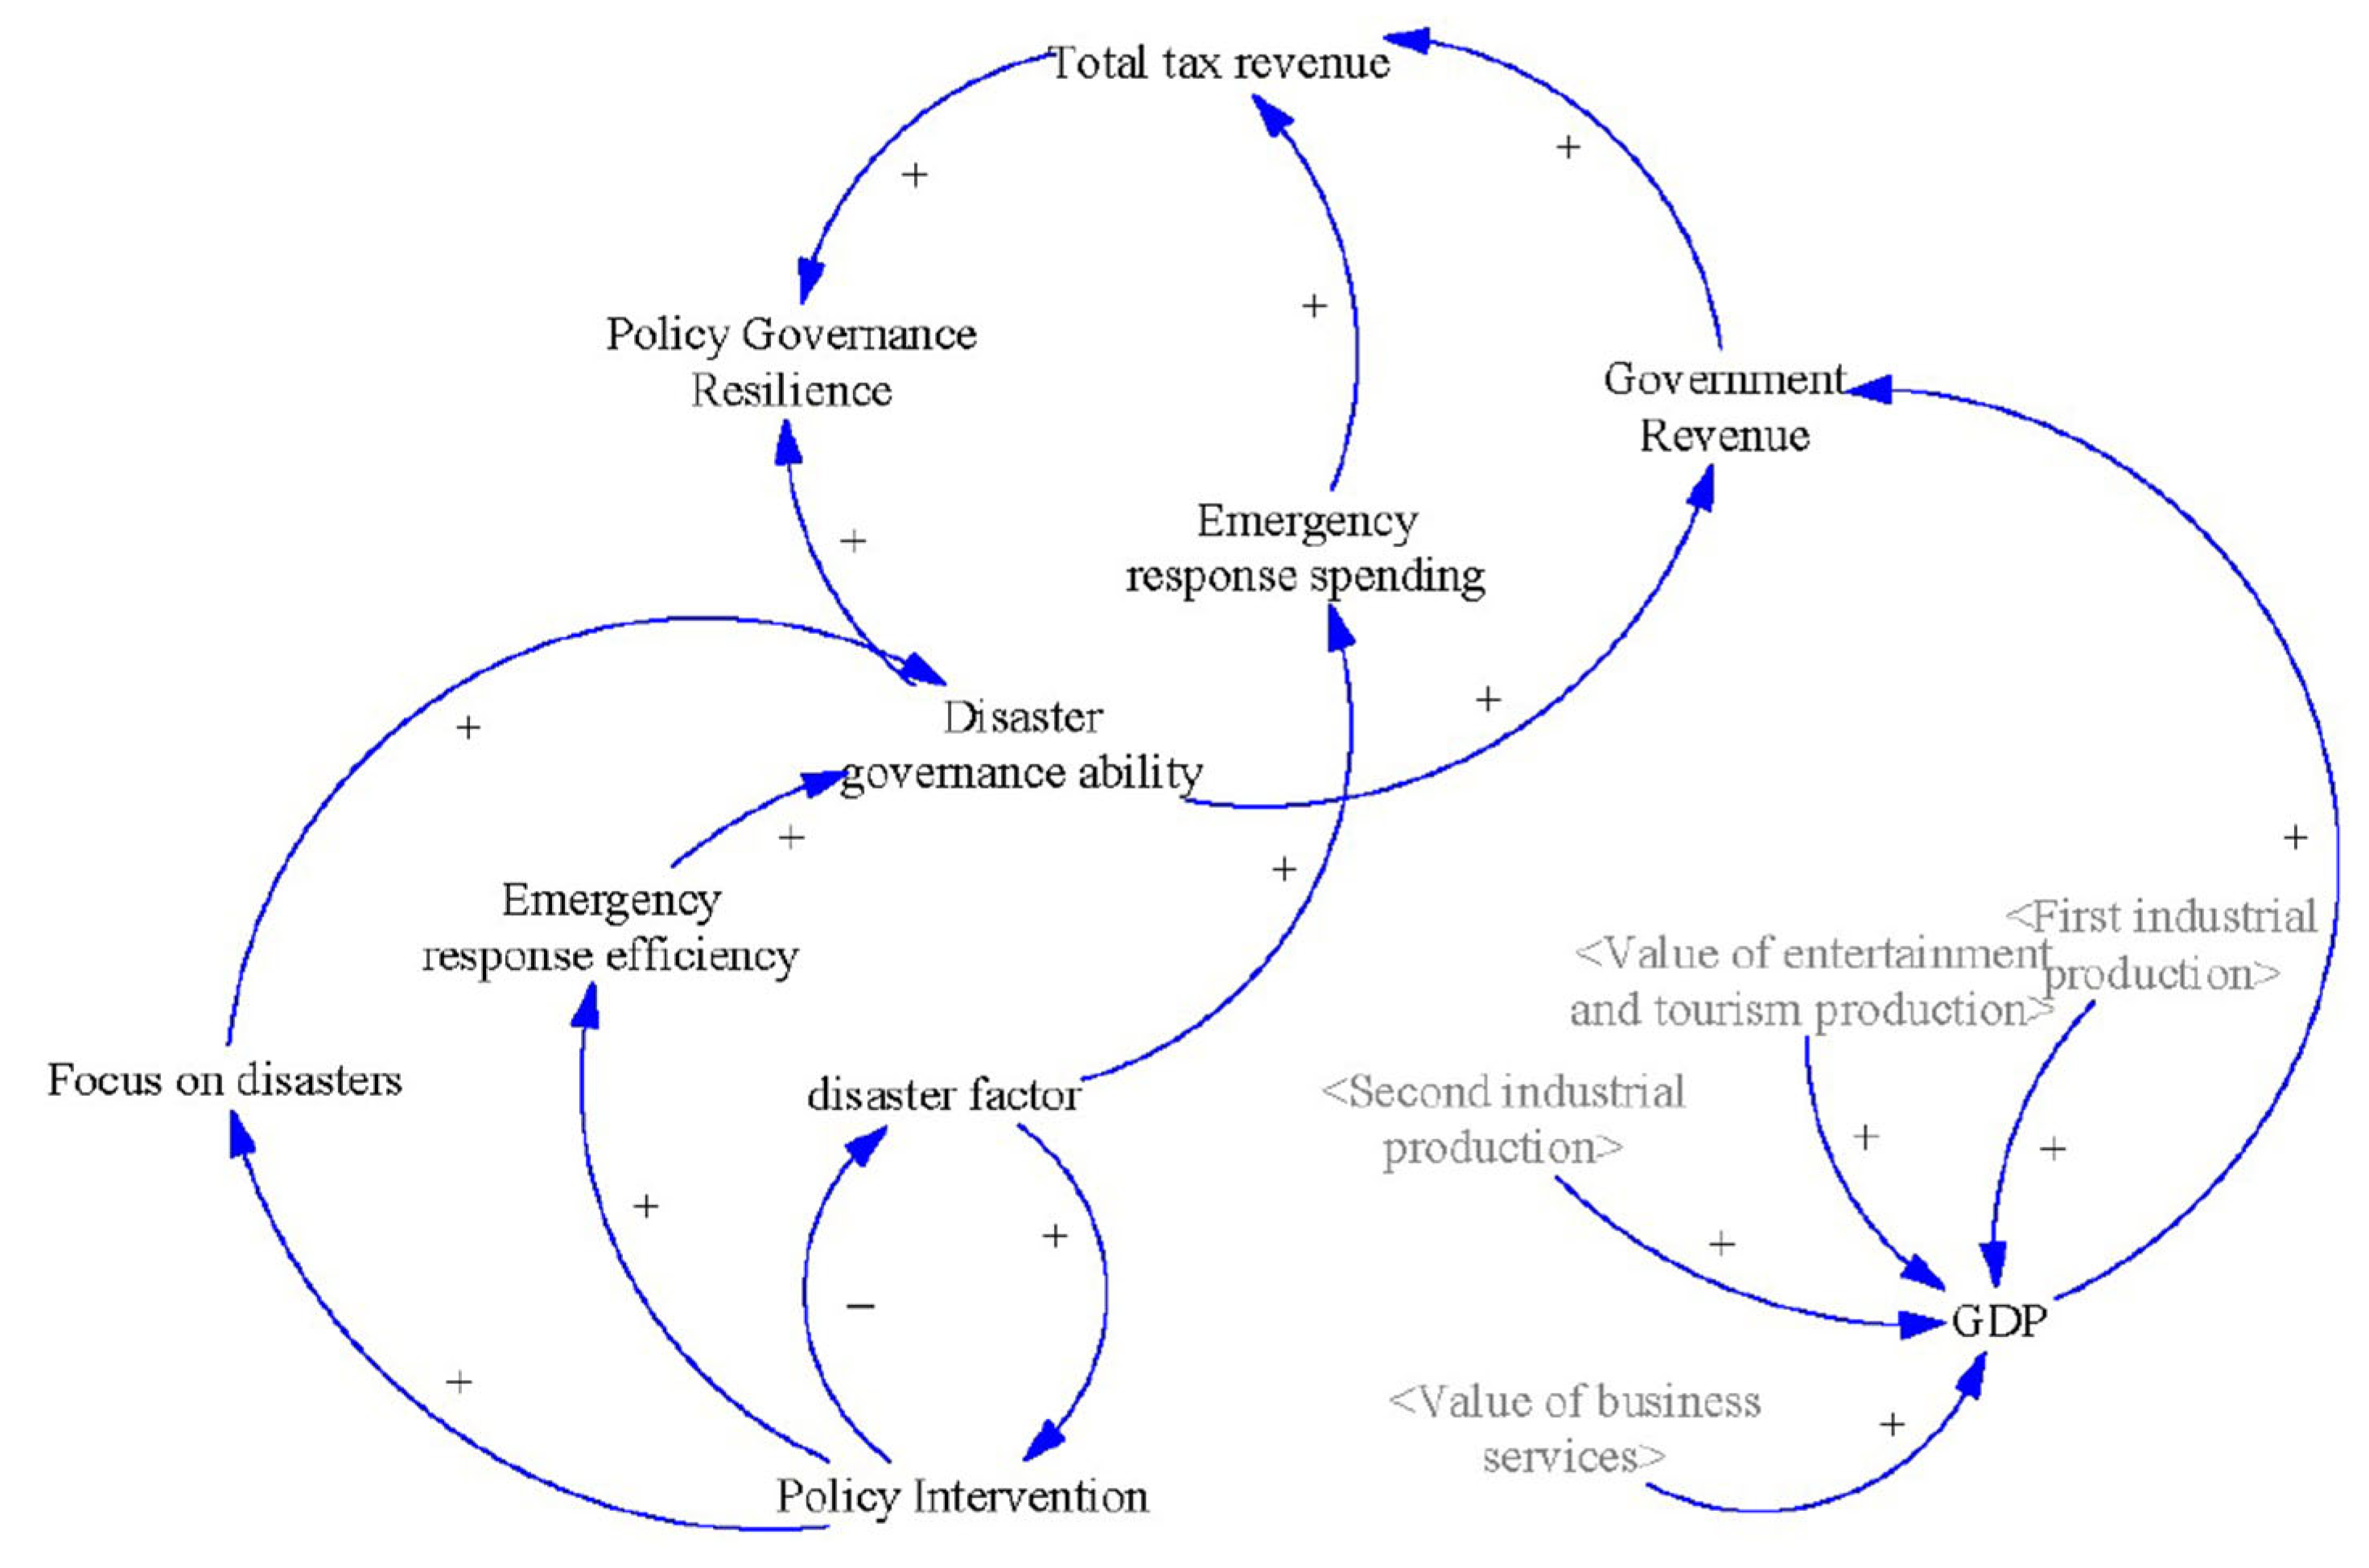
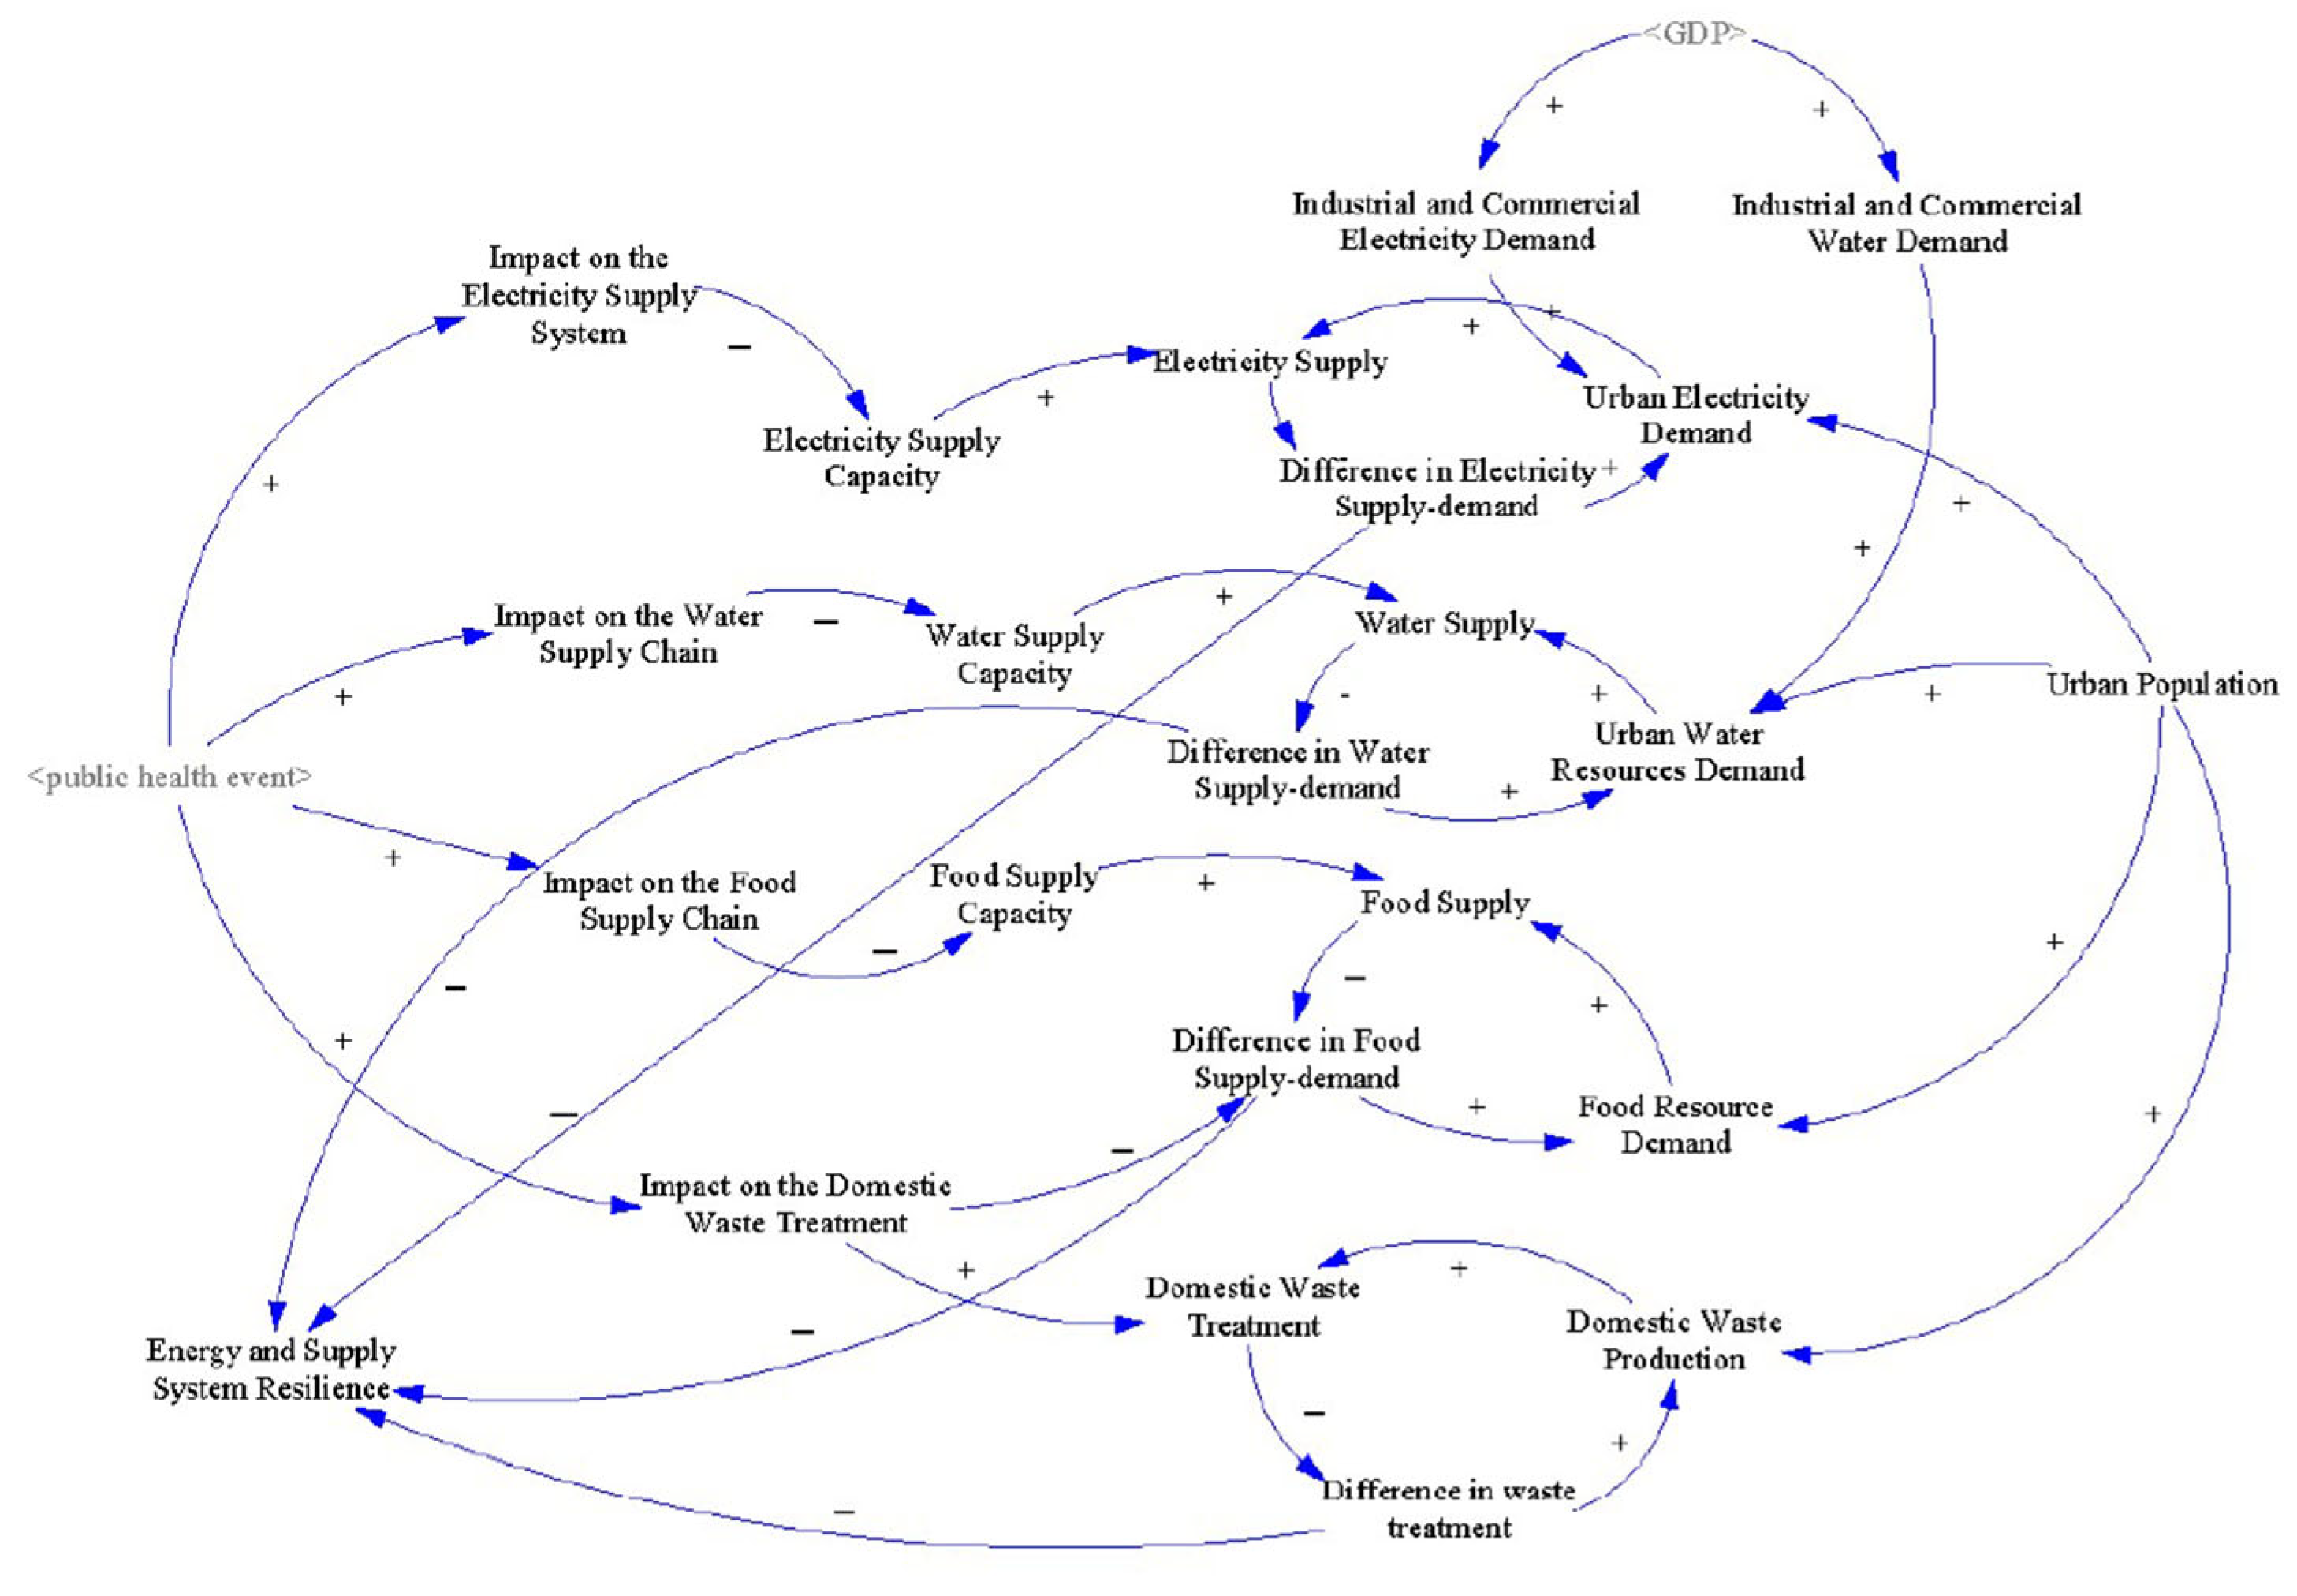
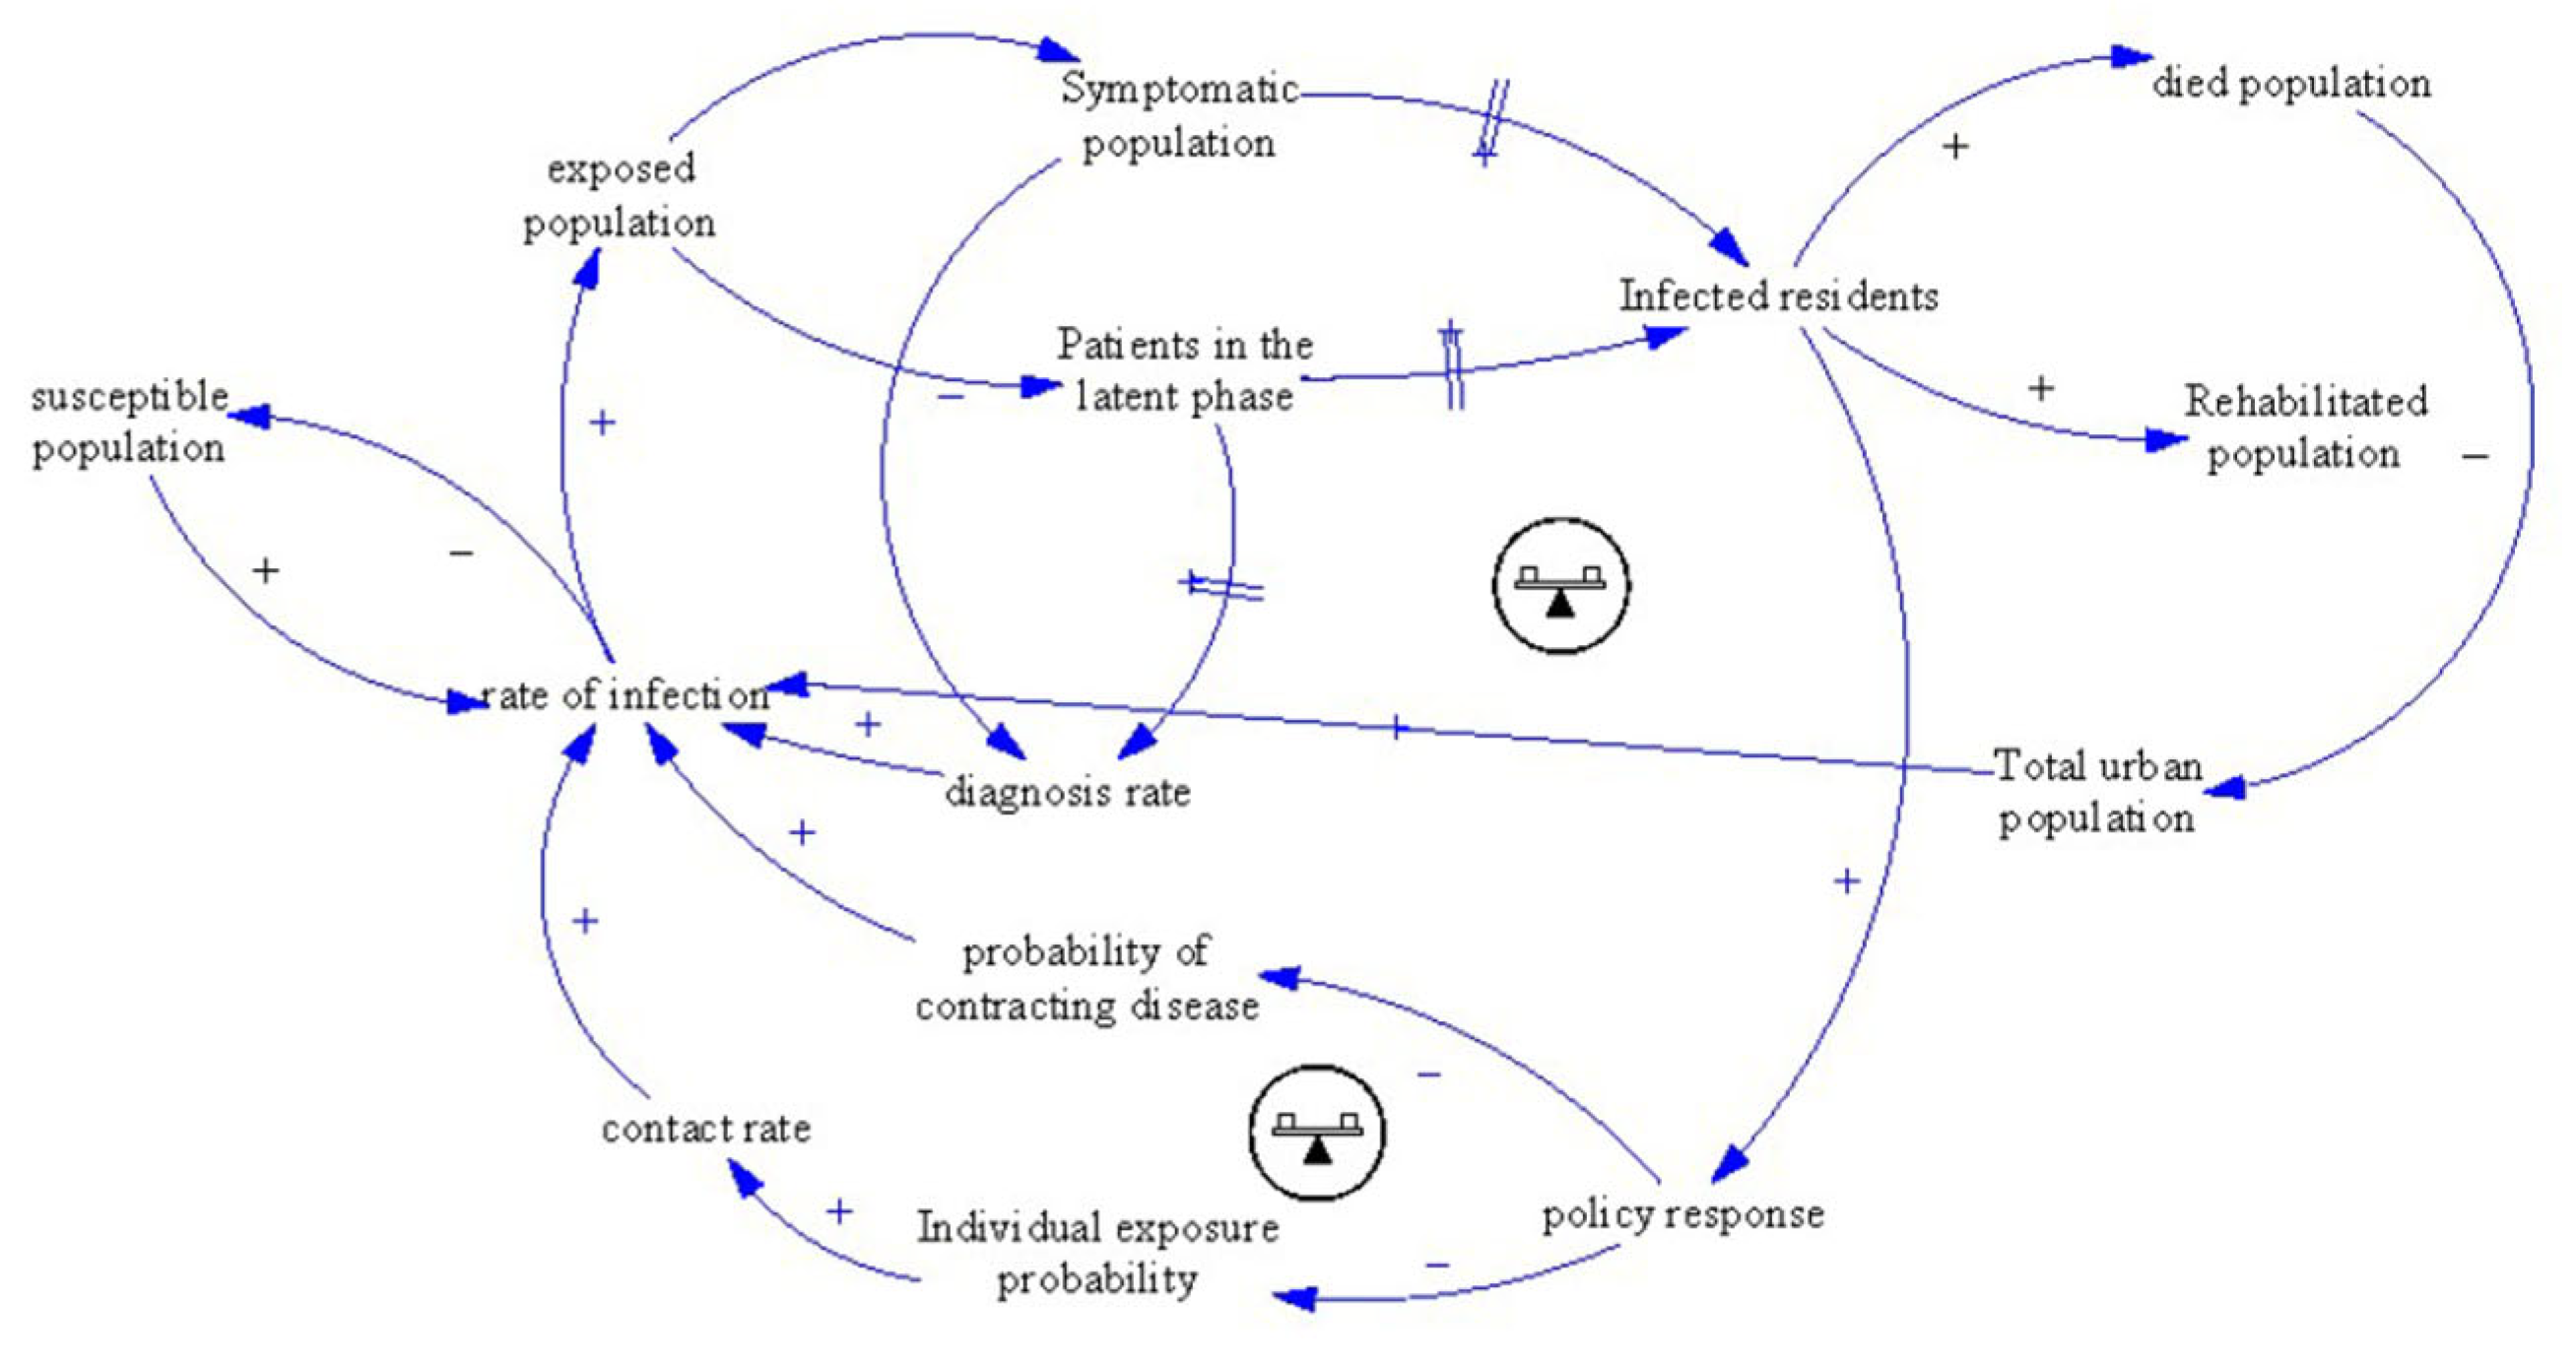
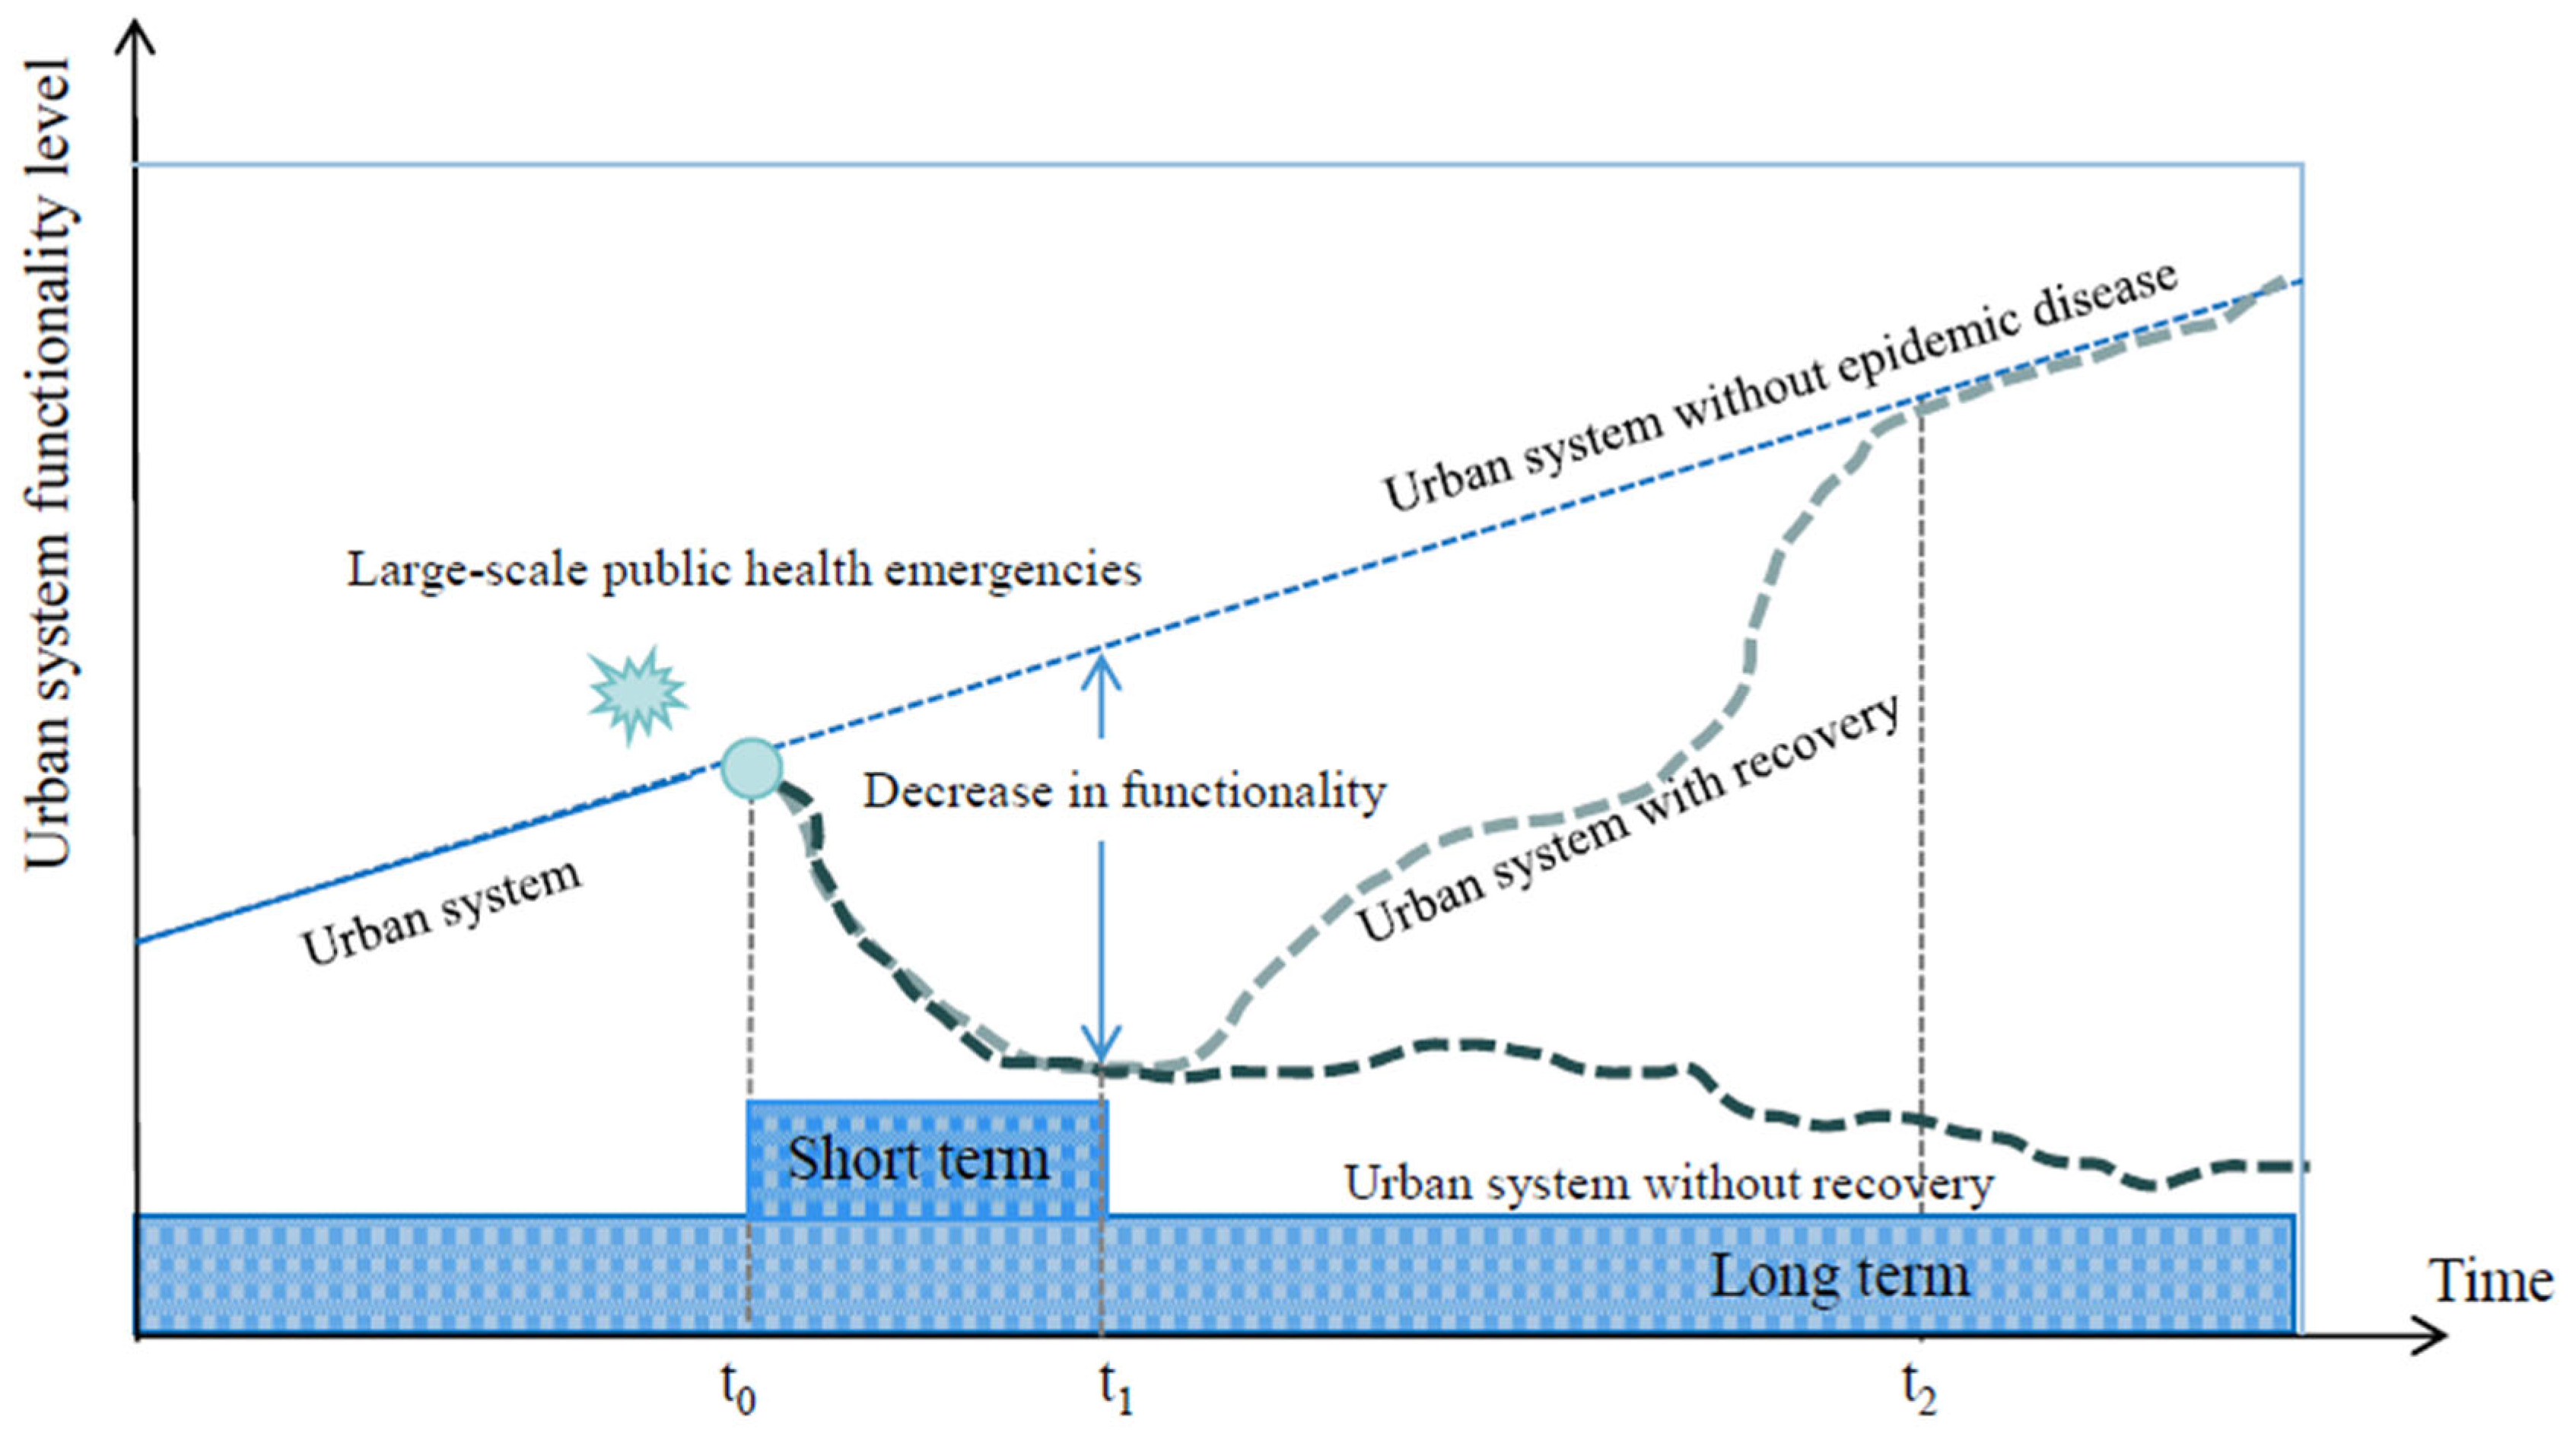
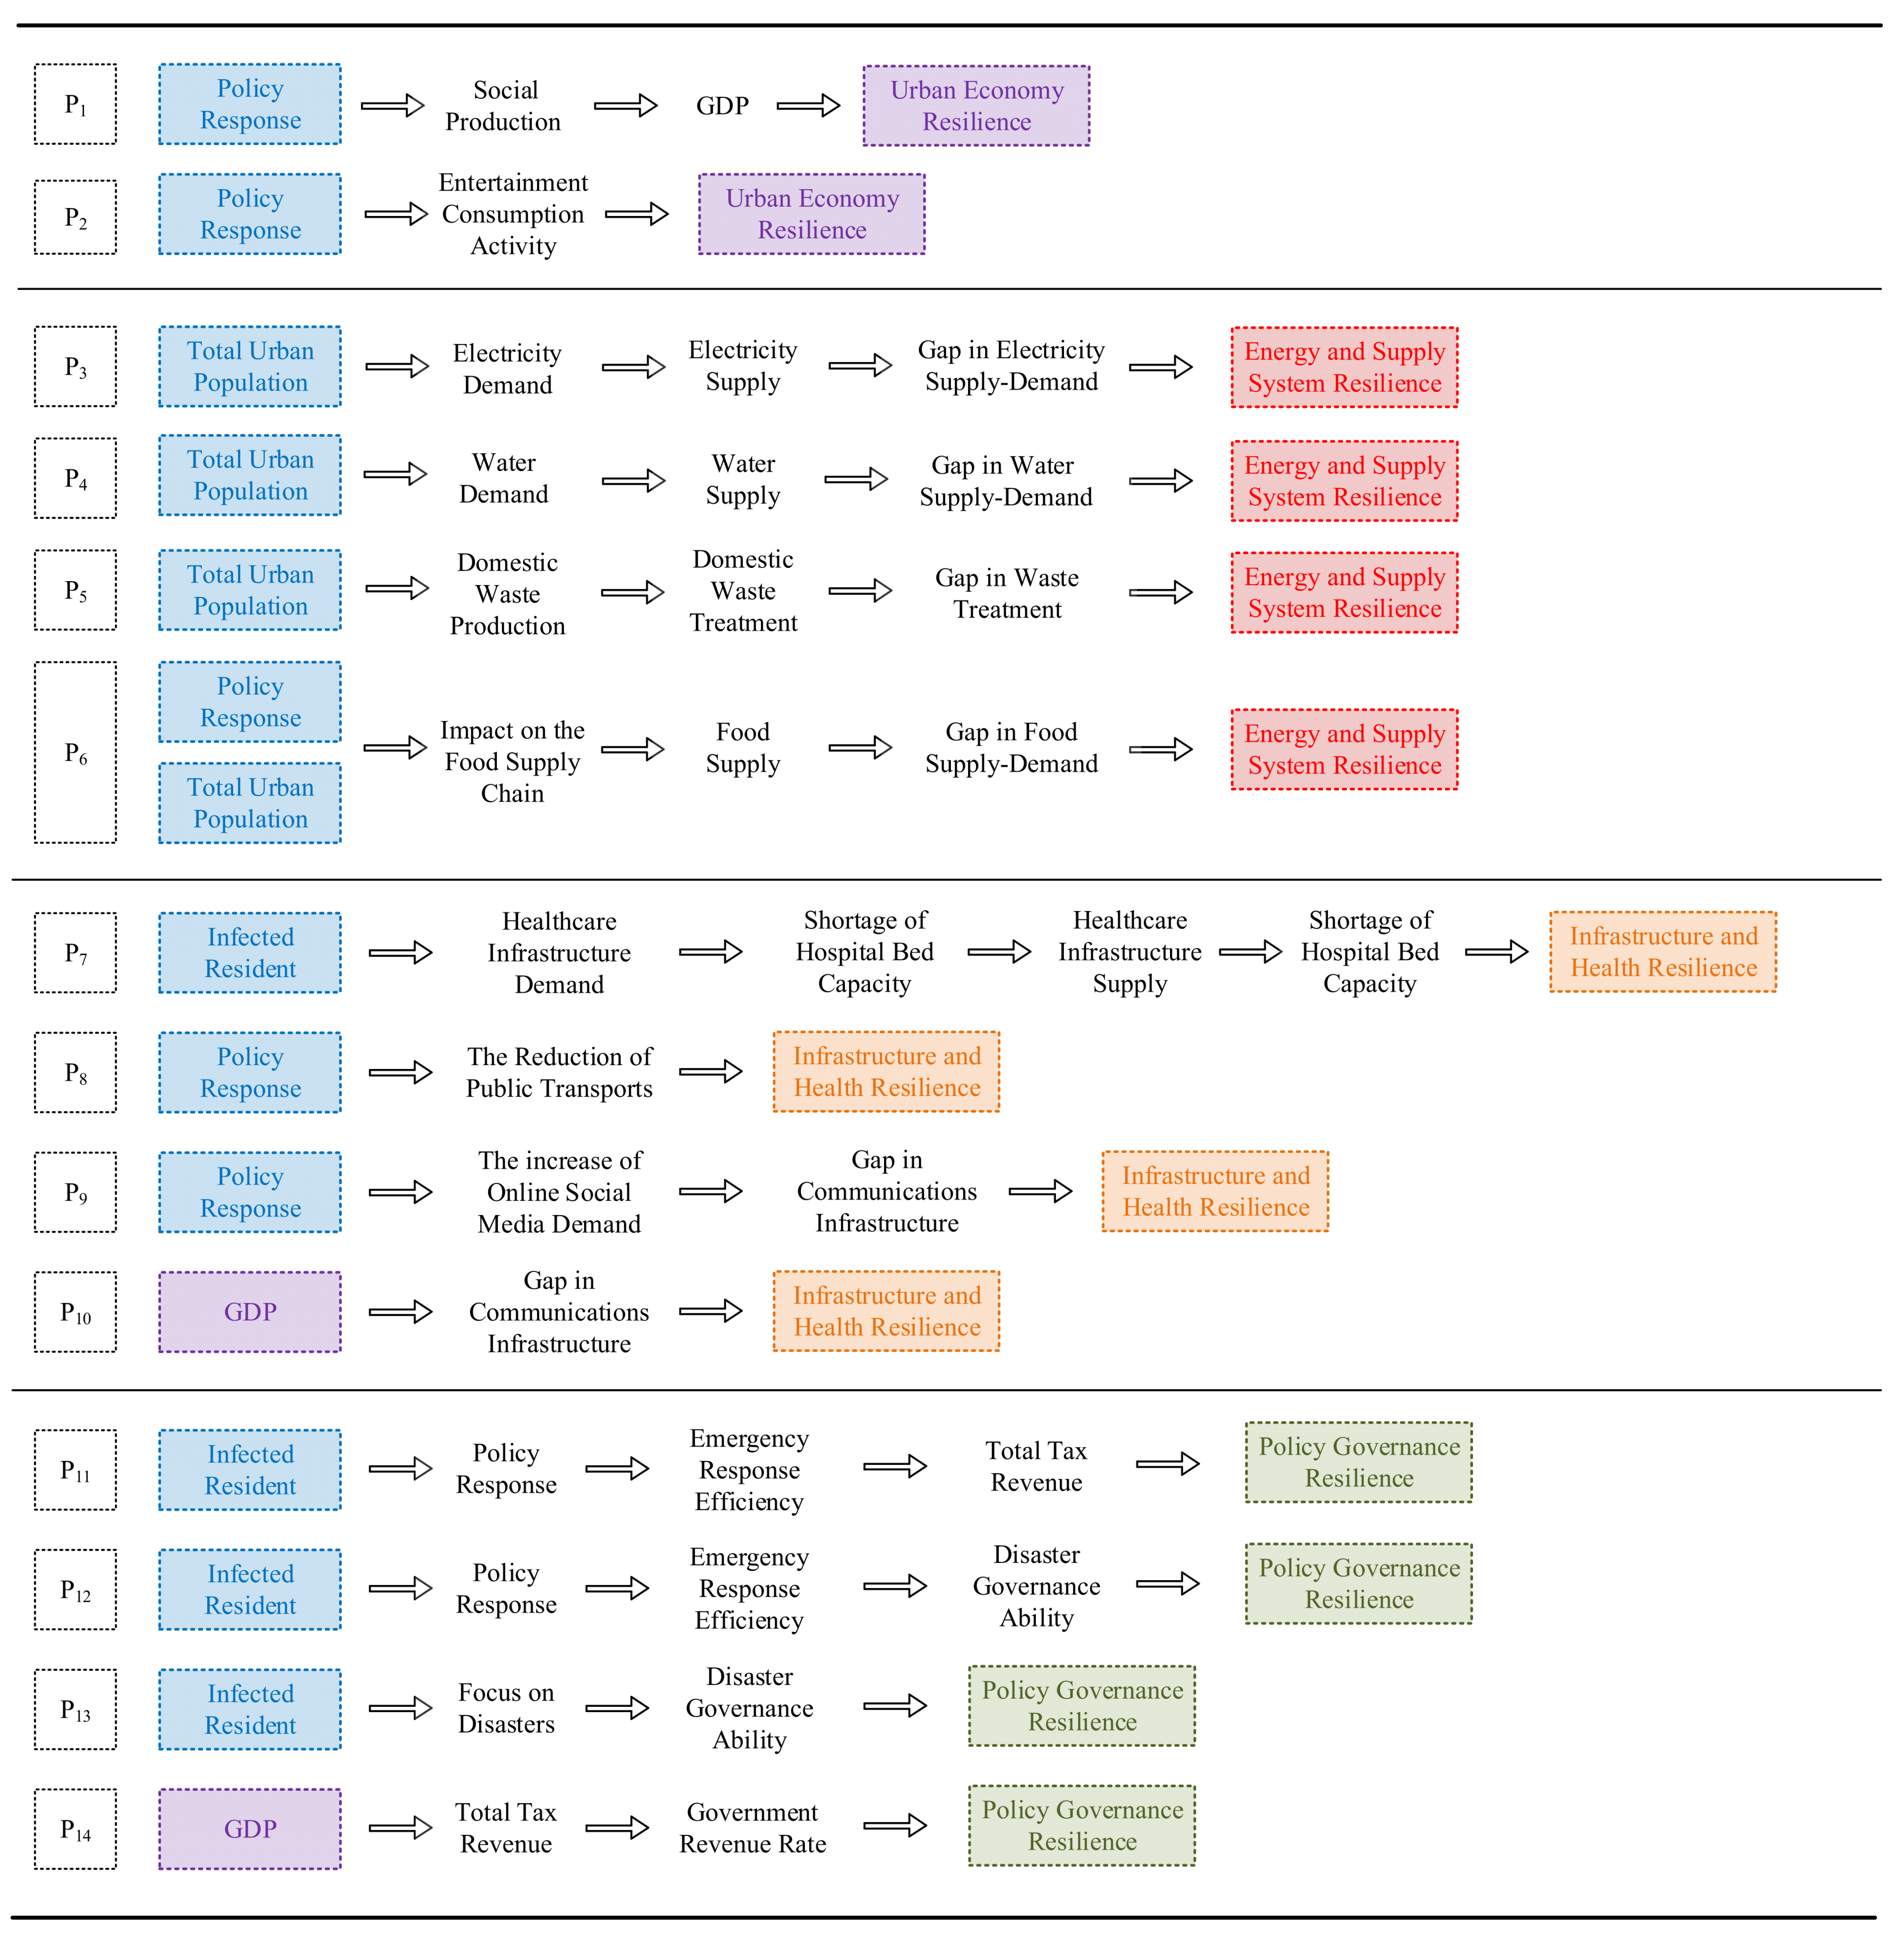
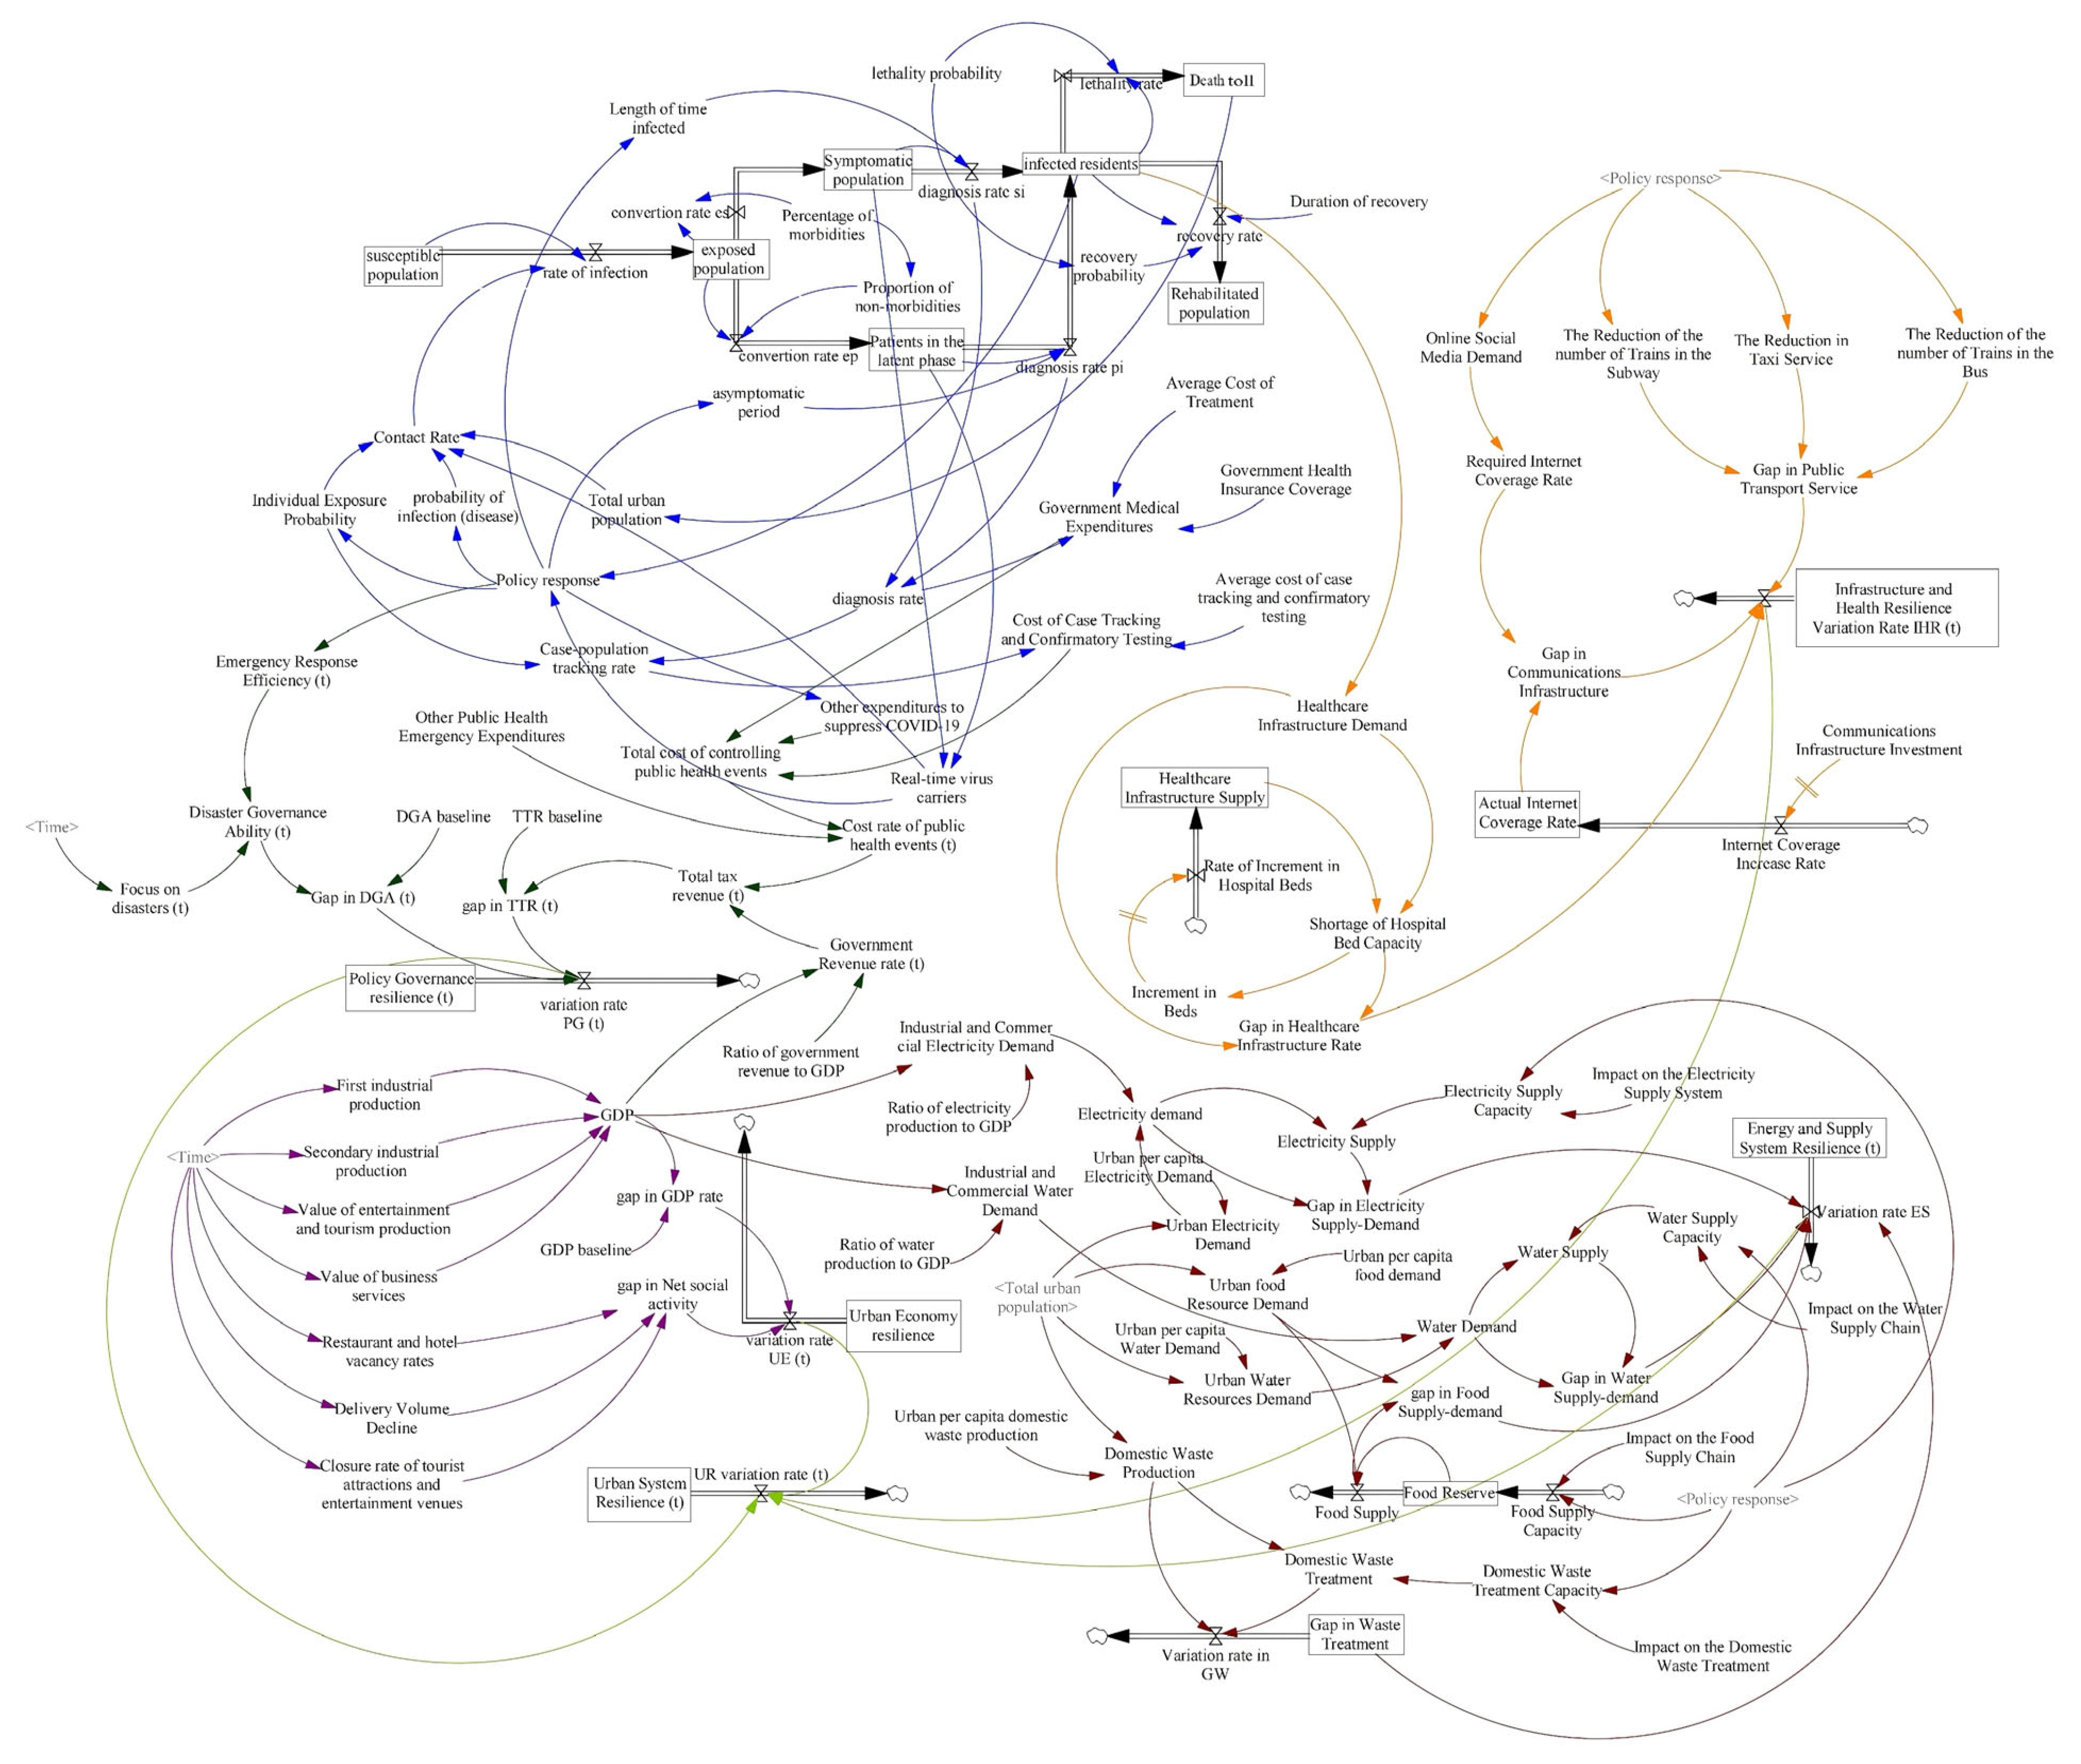
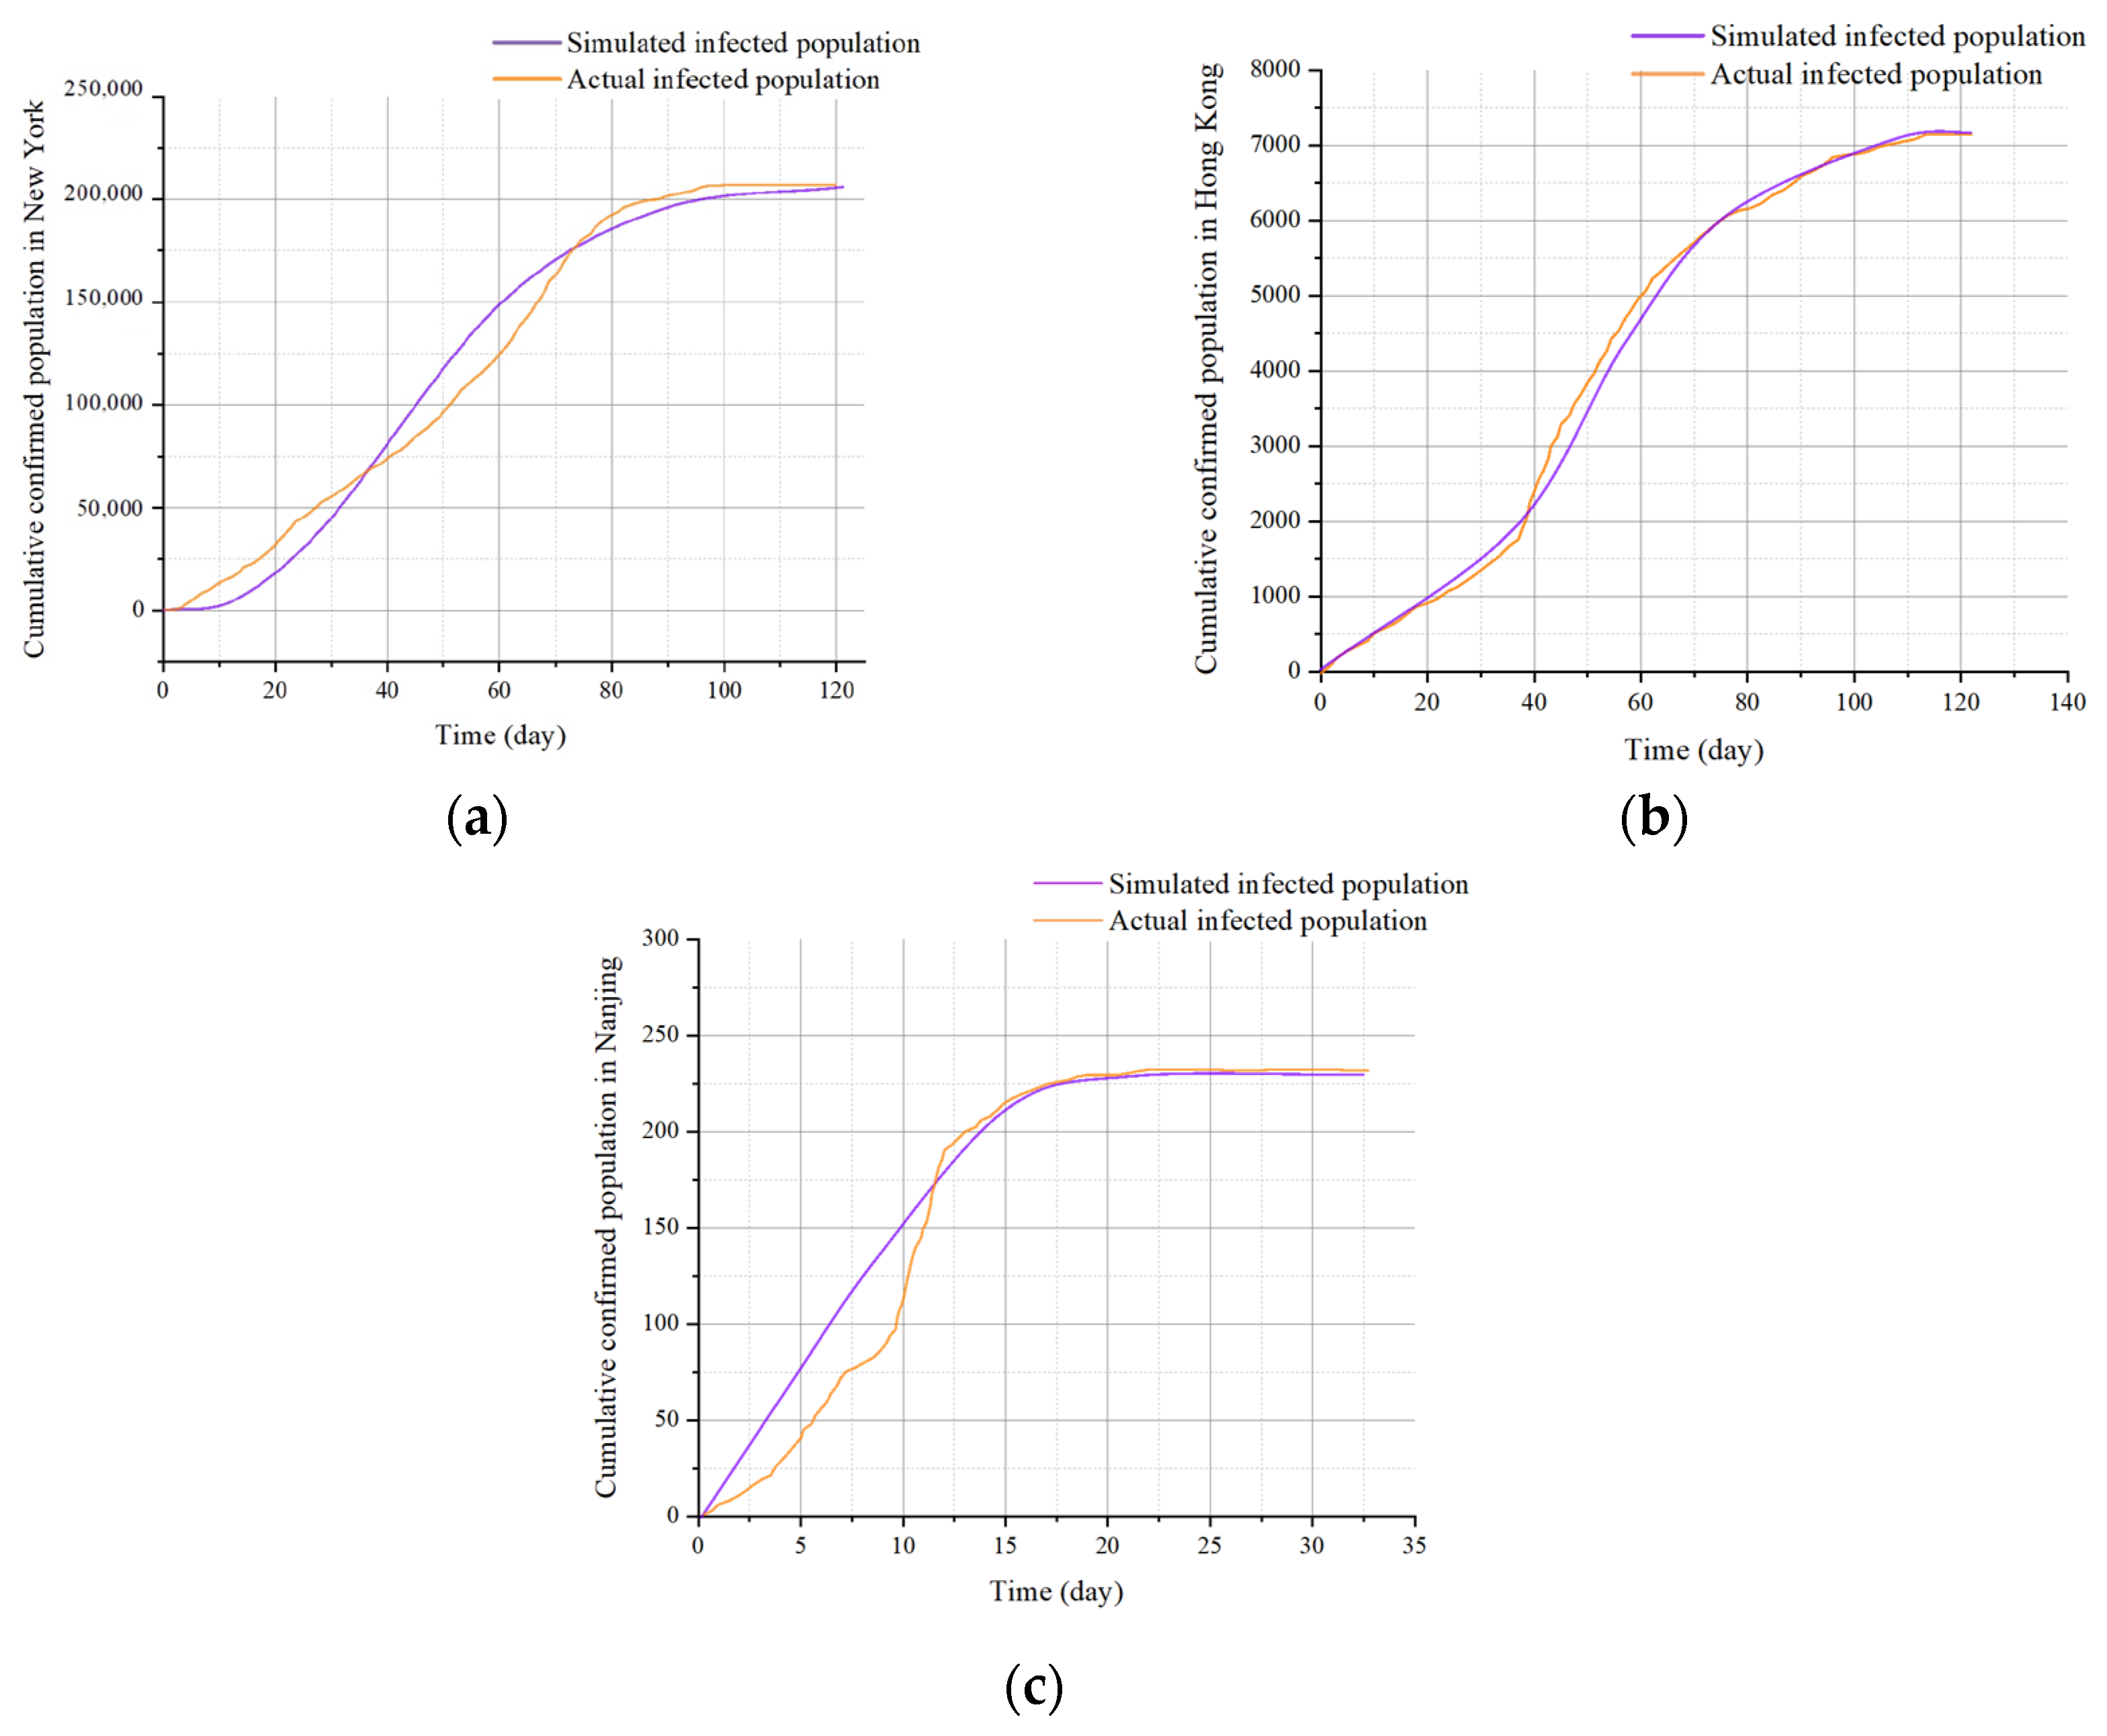
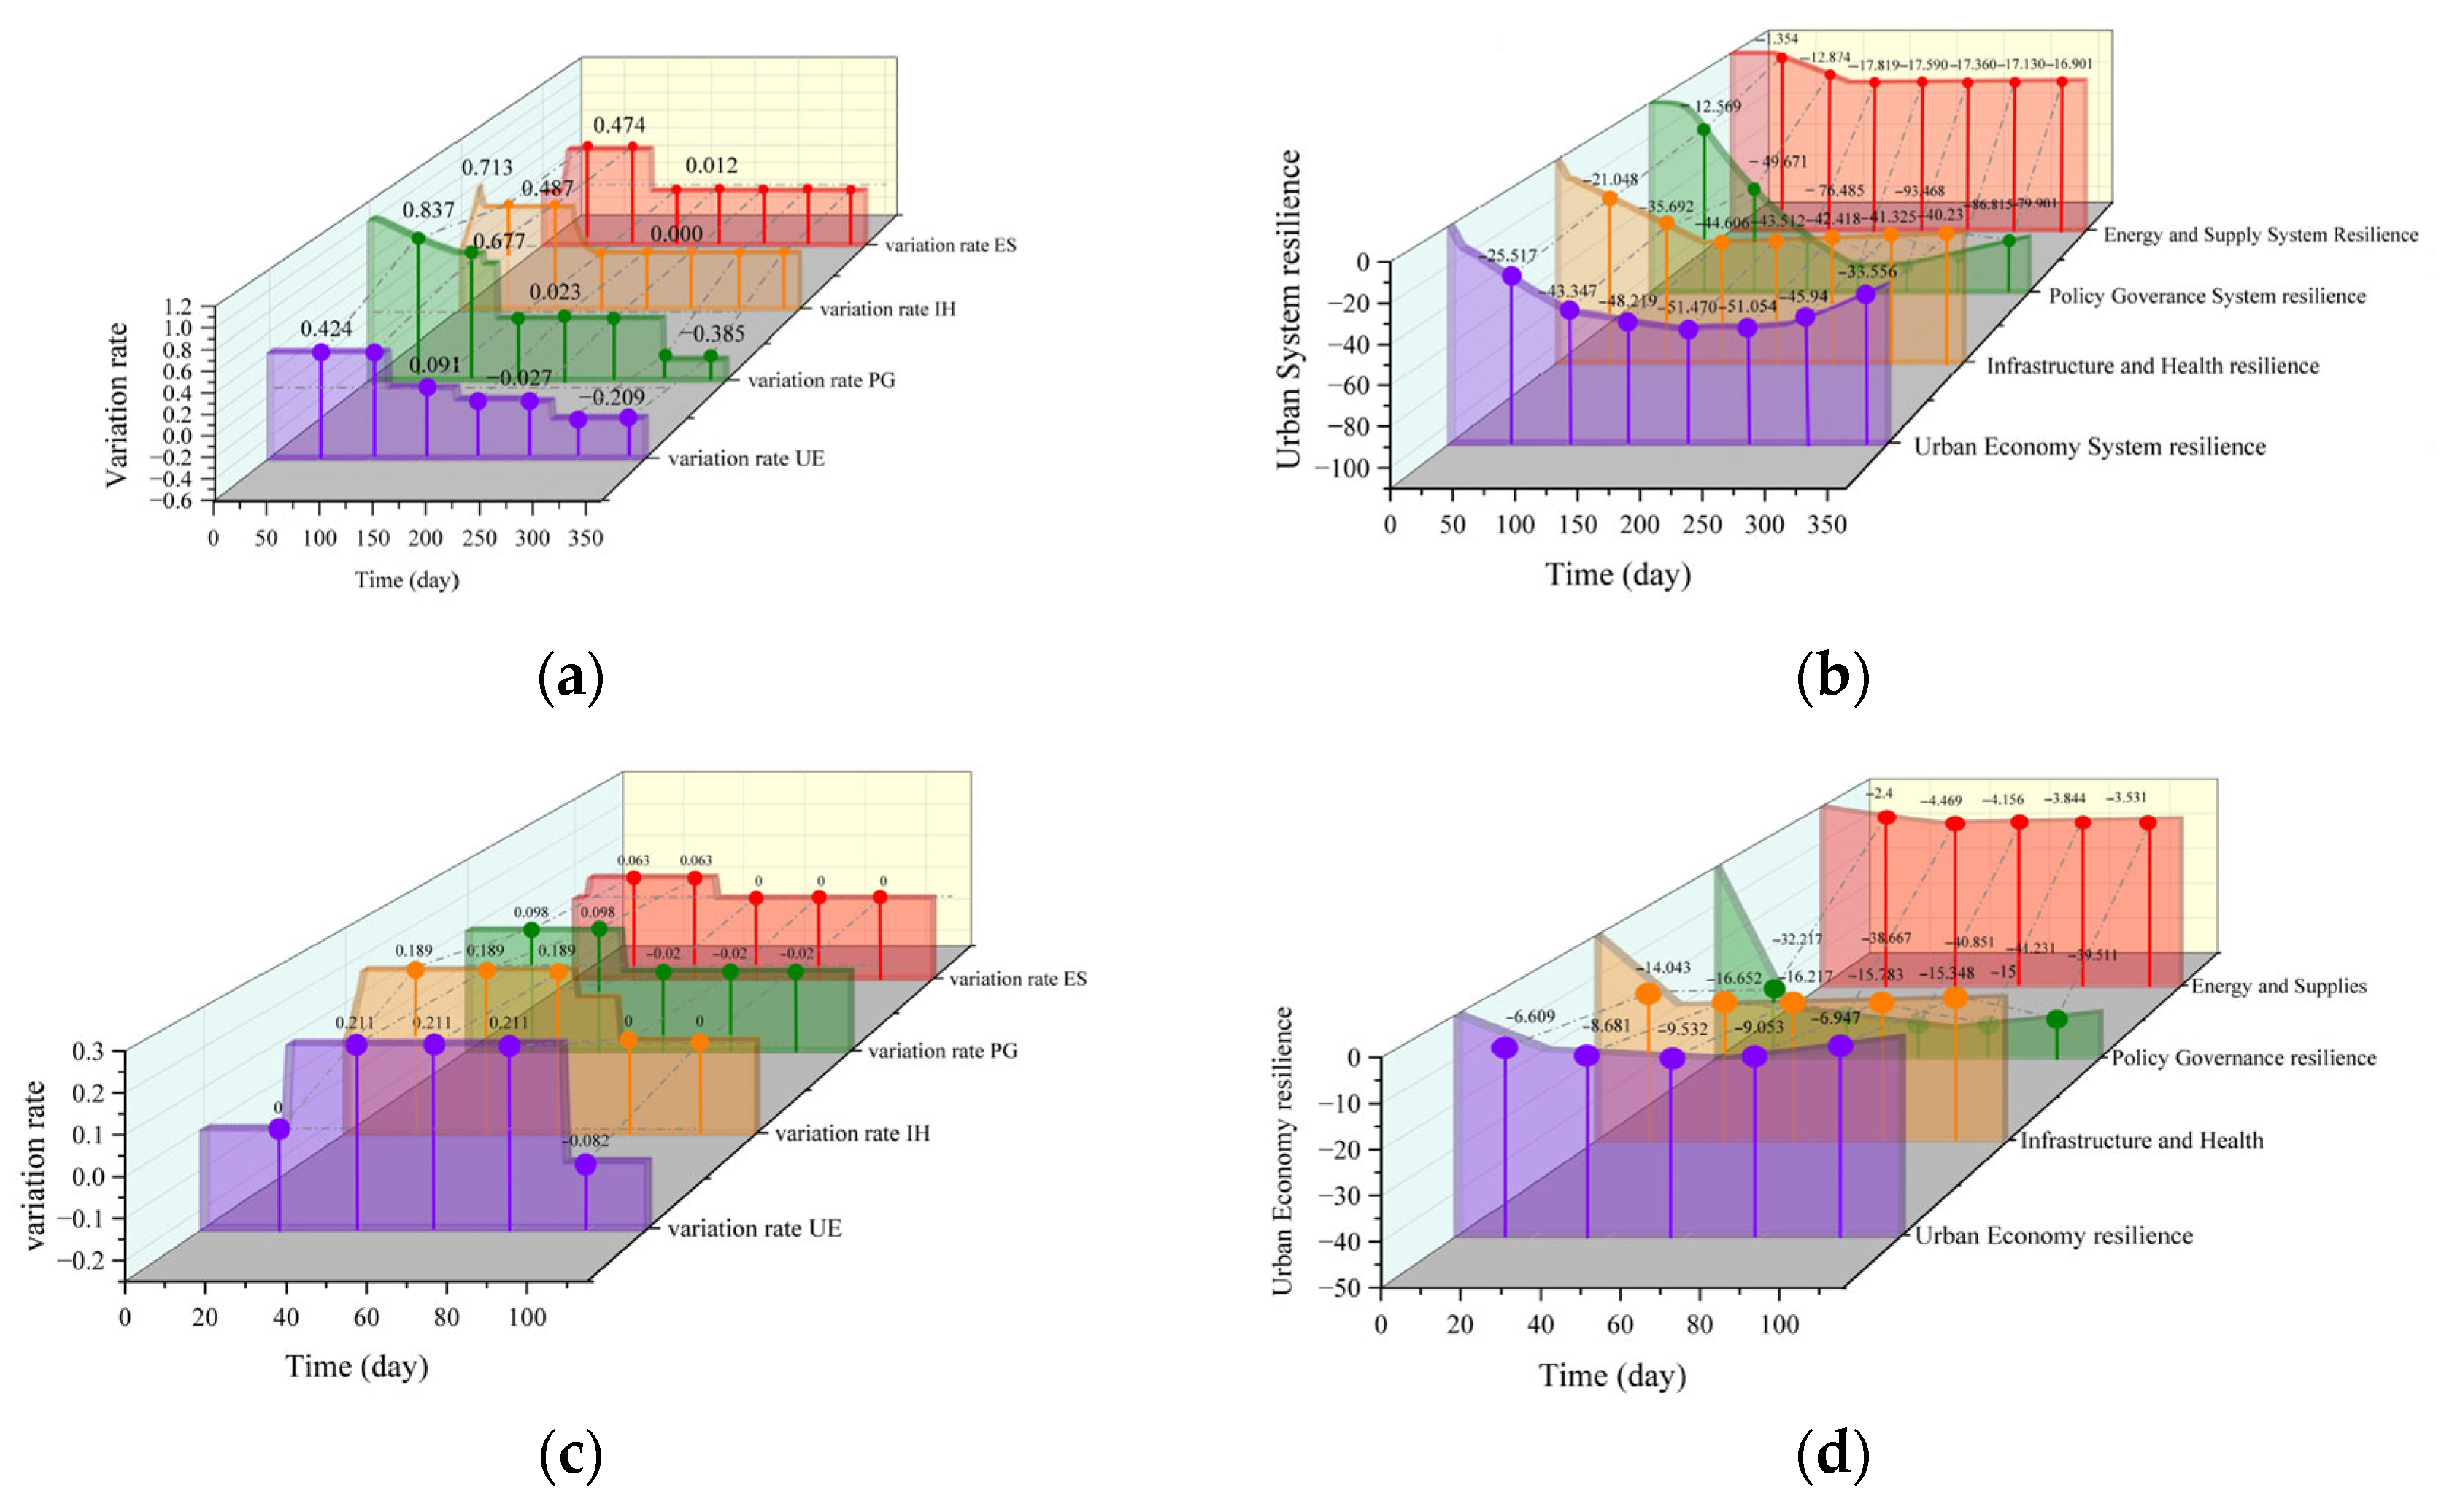
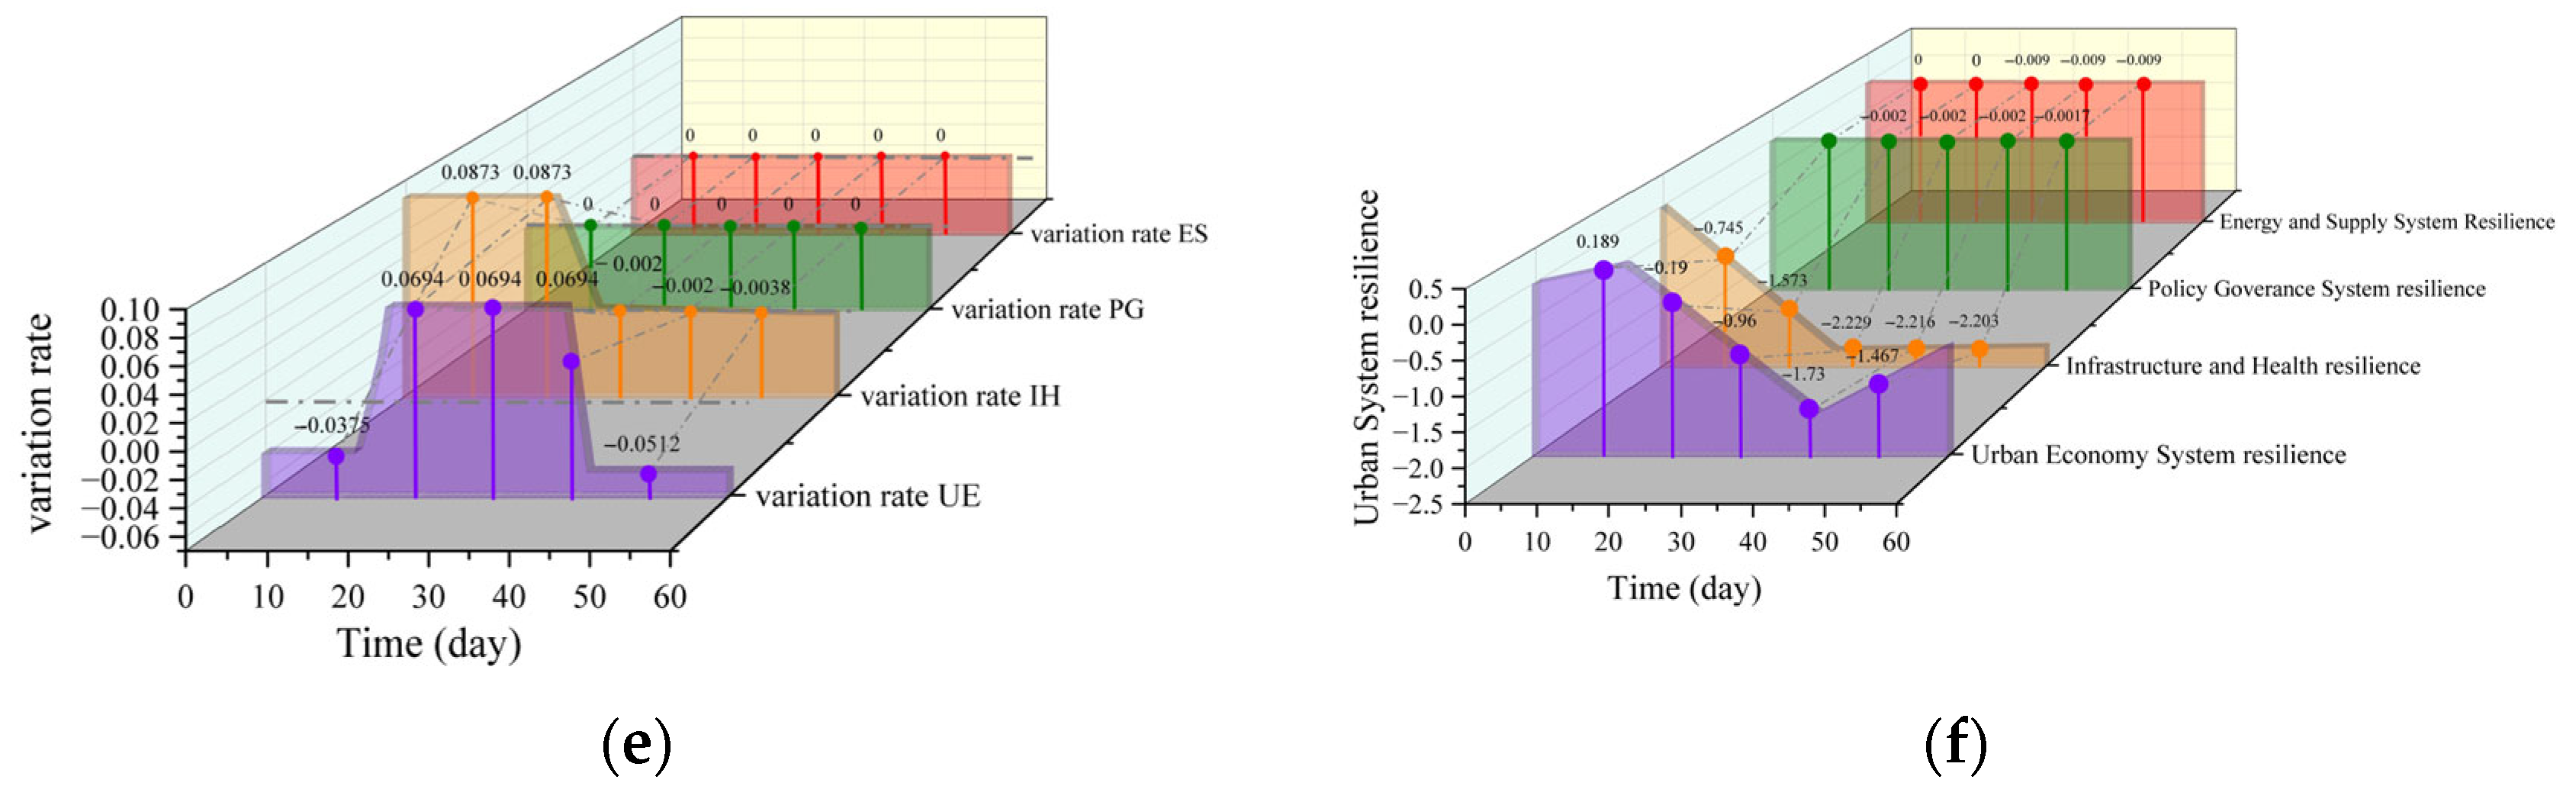
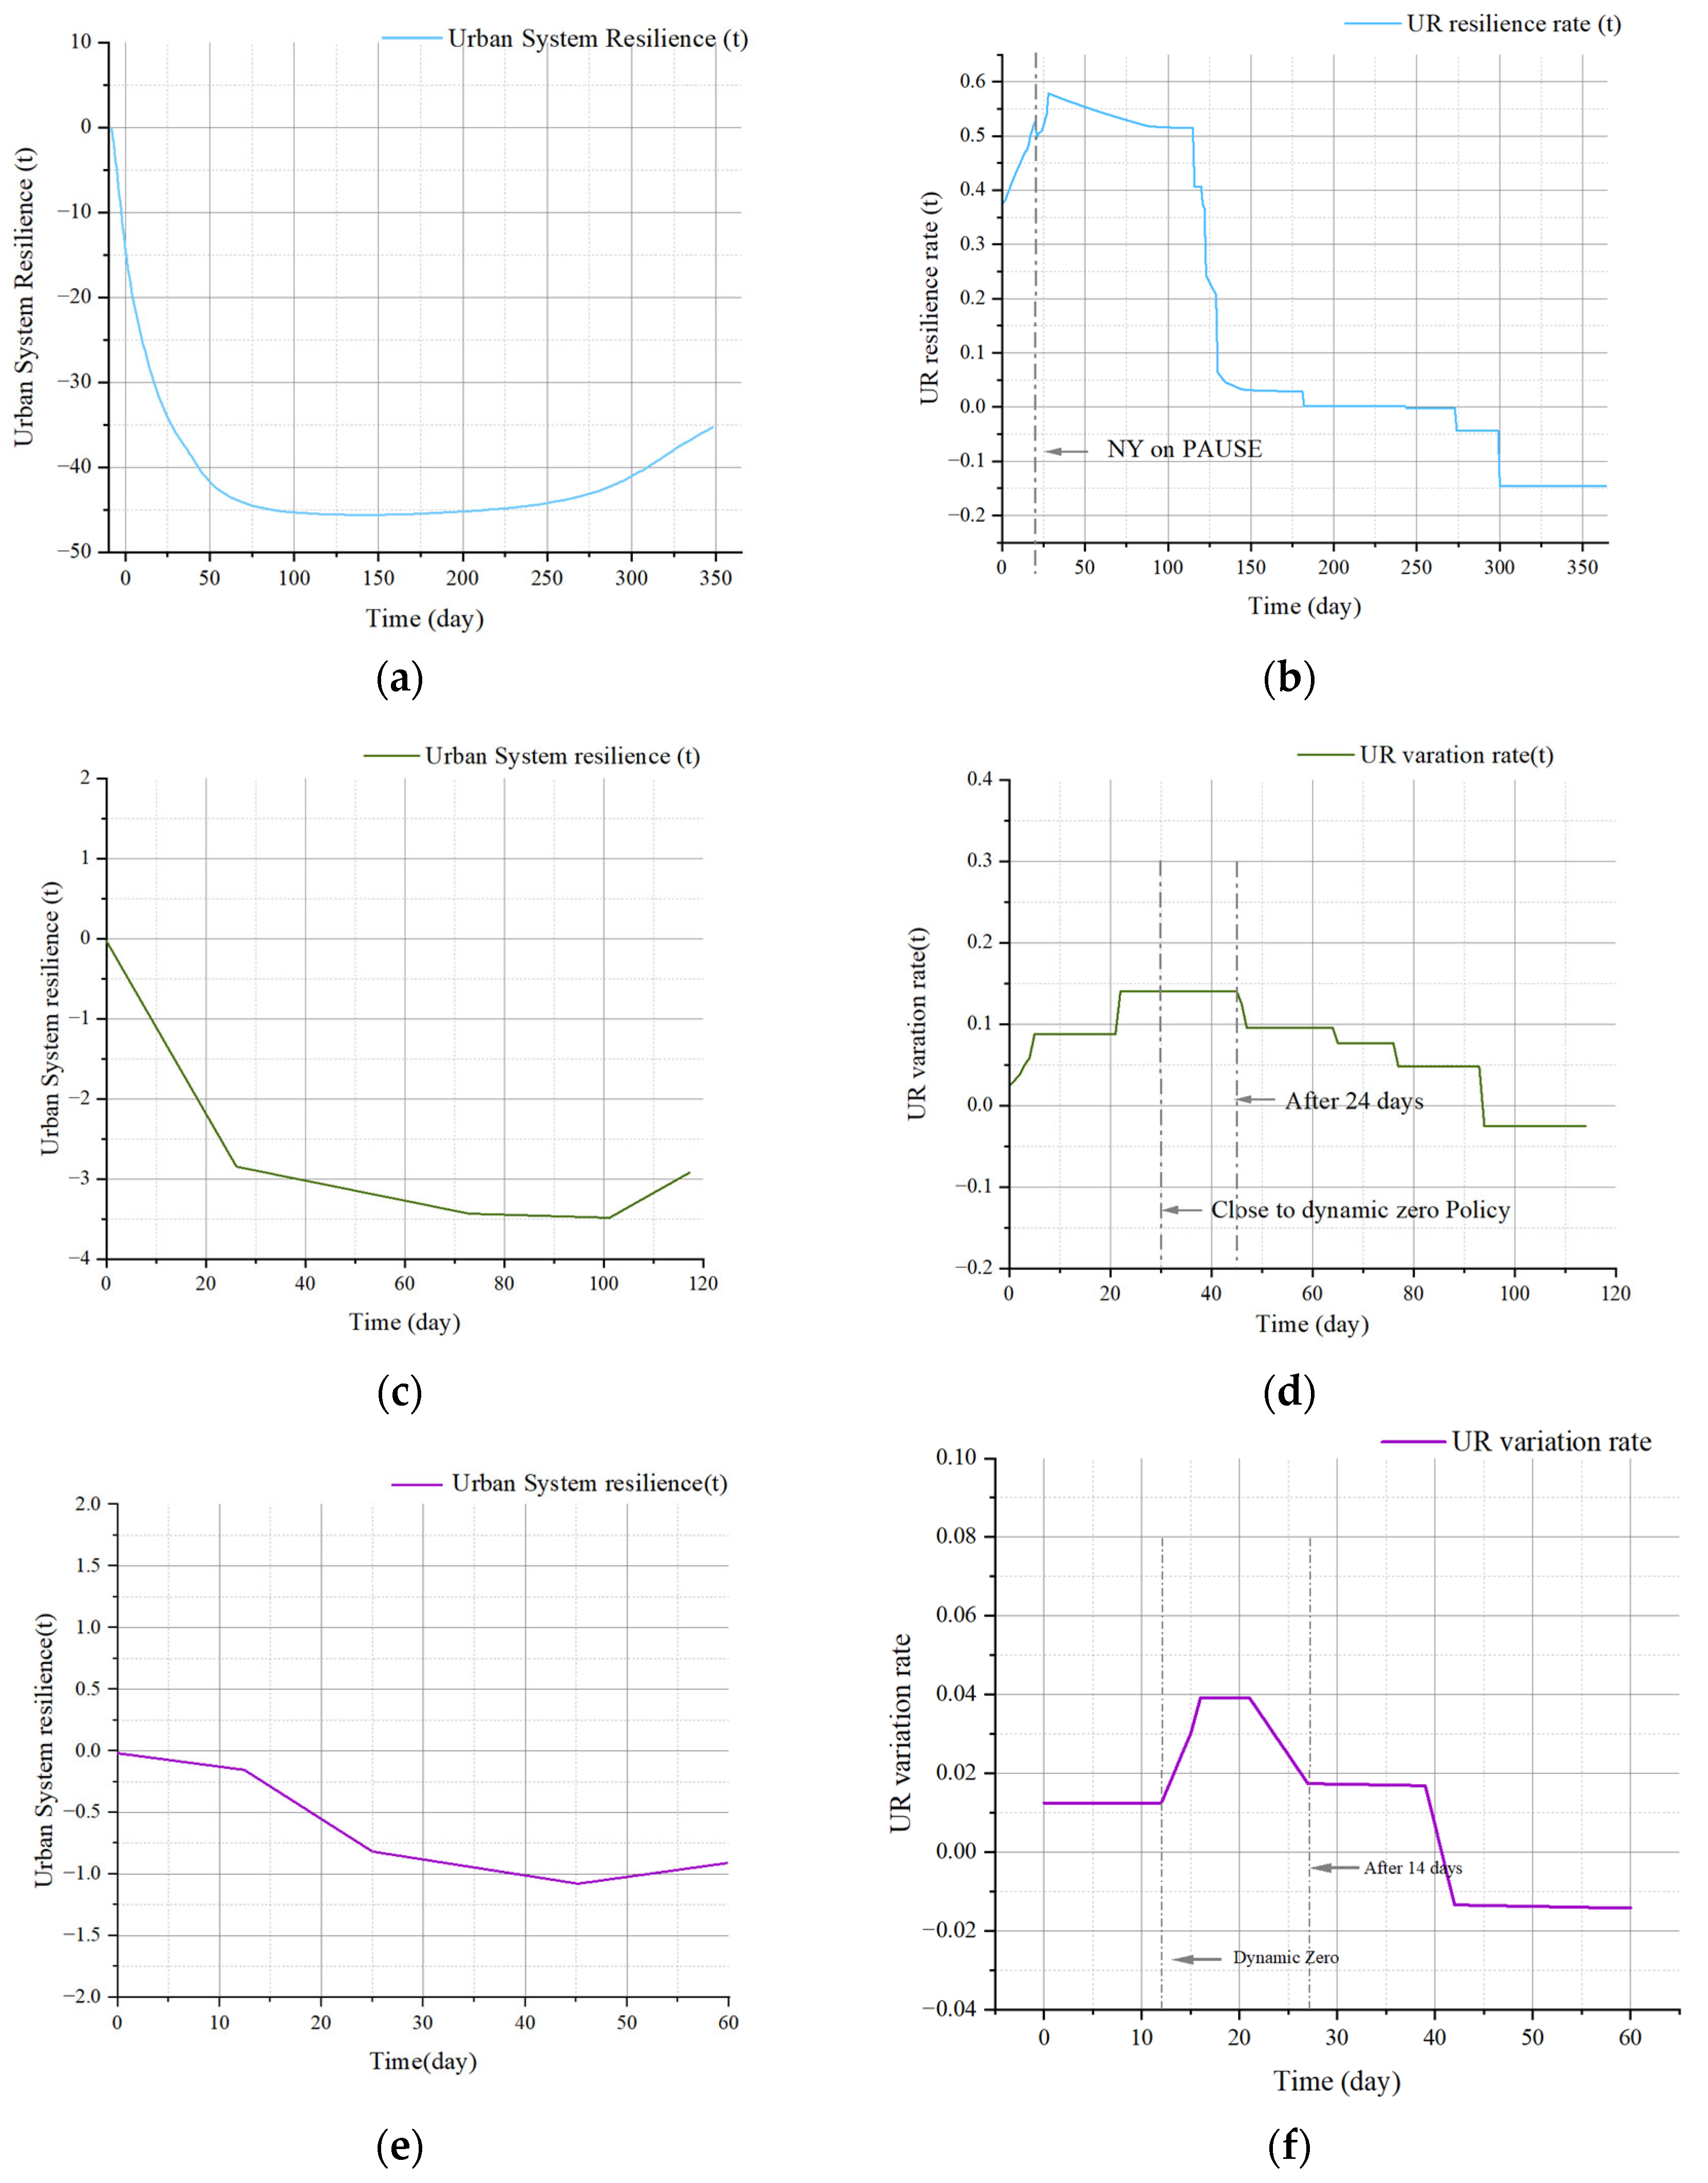
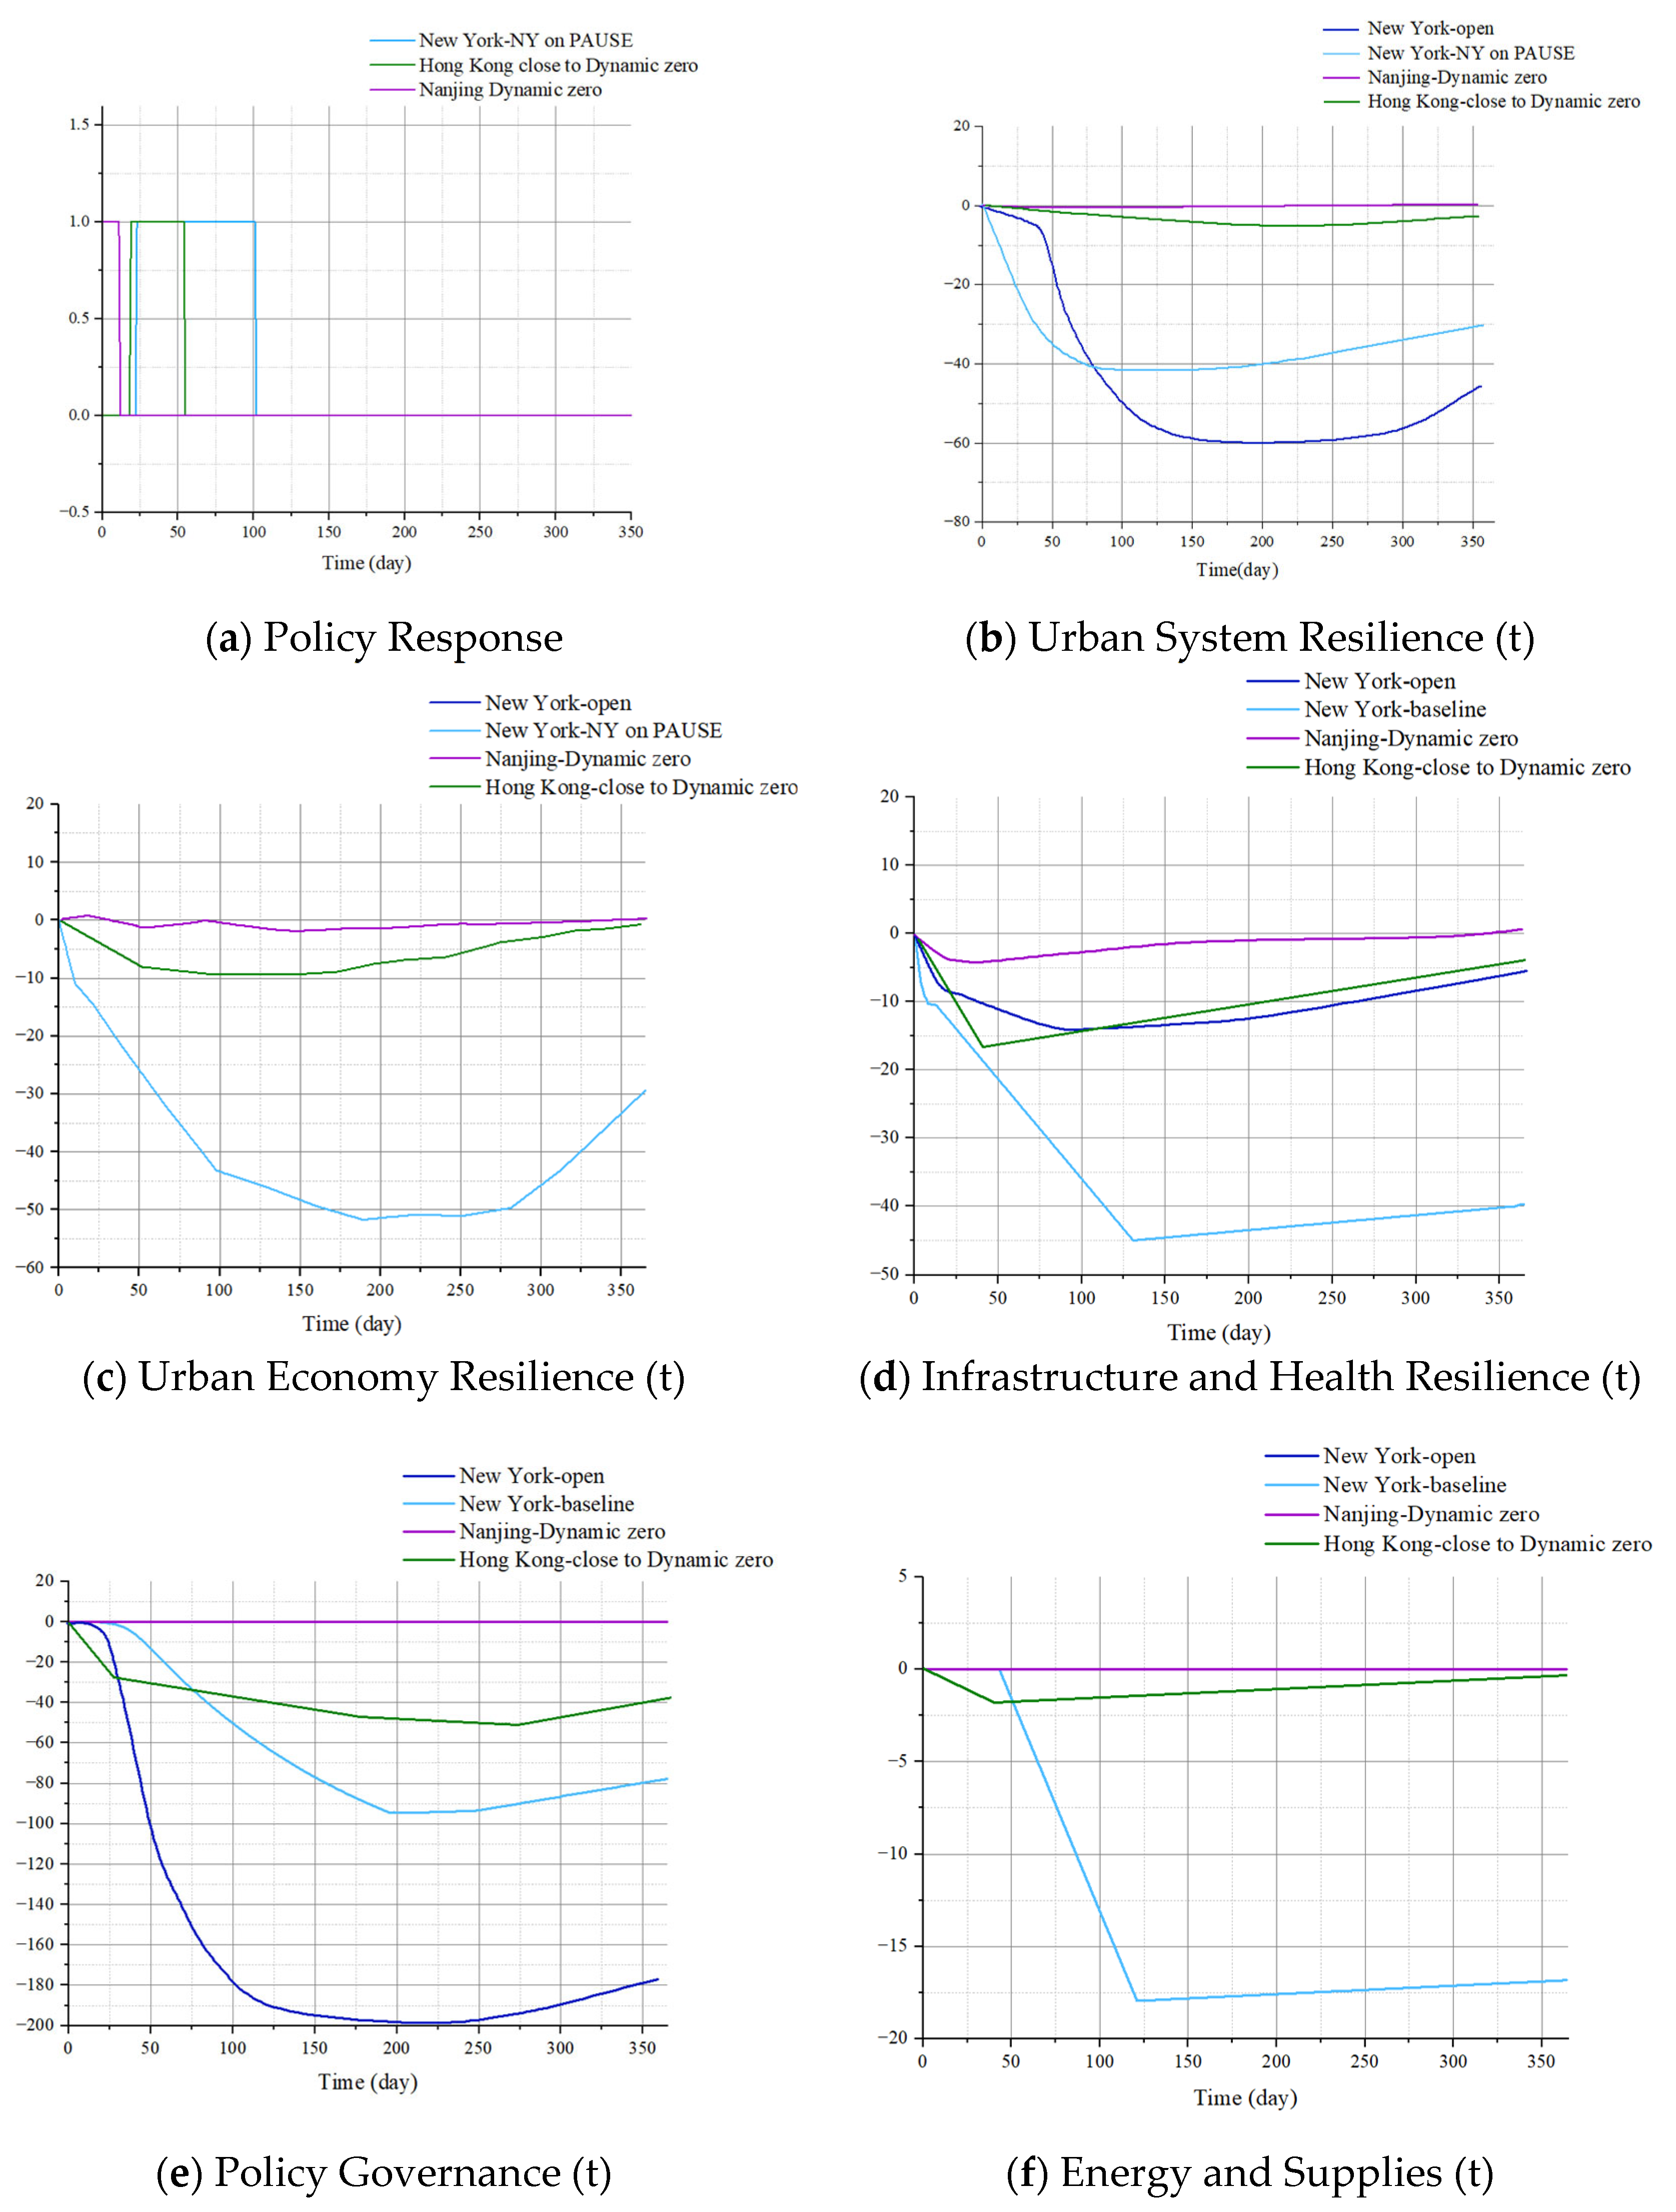


Disclaimer/Publisher’s Note: The statements, opinions and data contained in all publications are solely those of the individual author(s) and contributor(s) and not of MDPI and/or the editor(s). MDPI and/or the editor(s) disclaim responsibility for any injury to people or property resulting from any ideas, methods, instructions or products referred to in the content. |
© 2024 by the authors. Licensee MDPI, Basel, Switzerland. This article is an open access article distributed under the terms and conditions of the Creative Commons Attribution (CC BY) license (https://creativecommons.org/licenses/by/4.0/).