Abstract
The studies of urban heat islands or urban thermal environments have attracted extensive attention, although there is still a lack of research focused on the analysis of long-term urban thermal environment change with fine spatial resolution and actual exposure of urban residents. Taking the rapidly urbanizing city of Nanjing, China as an example, this study utilizes the Landsat-derived daytime time-series land surface temperature data to comprehensively assess the city’s long-term (30-year) urban thermal environment change. The results showed that: (1) The overall surface urban heat island intensity showed a noticeable trend of first increasing and then decreasing from 1990 to 2020. (2) It exhibited the detailed spatial distribution of urban heat/cold islands within the urban center boundary. The percentage of surface urban heat islands was 77.01% in 1990, and it increased to 85.79% in 2010 and then decreased to 80.53% in 2020. (3) More than 65% of the urban residents have lived in areas with a surface urban heat island intensity greater than 3.0 °C, which also showed a trend of first increasing and then decreasing from 1990 to 2020. The methods and findings of this study can provide a reference for other studies on urban thermal environment changes and urban sustainable development.
1. Introduction
The world experienced rapid urbanization in the past few decades, especially in less developed regions. The percentage of the urban population worldwide increased from 29.6% in 1950 to 55.3% in 2018 and is projected to be 68.4% in 2050. In less developed regions, the percentage of the urban population increased from 17.7% to 50.6% between 1950 and 2018 and is anticipated to reach 65.6% in 2050 [1]. Along with the expansion of urban land, urbanization transformed the natural ecosystem into a system coupled between humans and nature [2], which can cause a series of environmental and ecological problems [3], such as urban thermal environment change [4], air pollution [5], biodiversity loss [6], etc. A well-known consequence of urban thermal environment changes caused by urbanization is the urban heat island (UHI) effect, which refers to the phenomenon of higher urban temperatures compared to those in the rural surroundings [2]. The increased temperature due to the UHI effects can exacerbate heat-related negative health impacts, especially during heatwaves [7], and increase cooling energy consumption in the summer [8]. Therefore, studies of UHIs or urban thermal environments have attracted extensive attention.
Based on the ways in which UHIs are formed, UHI studies can be divided into an air UHI and a surface UHI [9]. The air UHI is usually quantified with air temperature data observed by meteorological stations or traverses of vehicles [9], while the surface UHI is generally quantified with satellite thermal remote sensing data [10]. Unlike the sparsely distributed air temperature monitoring data, thermal remote sensing data have full coverage of land surfaces and usually a global scale coverage. Hence, remotely sensed land surface temperature data have been used widely to map surface UHIs and urban thermal environment change worldwide at varied scales [11,12,13,14,15,16,17,18].
The Moderate Resolution Imaging Spectroradiometer (MODIS), Landsat, and Advanced Spaceborne Thermal Emission and Reflection Radiometer (ASTER) thermal remote sensing data are the most frequently used data for surface UHIs and urban thermal environment studies [9]. The MODIS instrument aboard the Terra and Aqua satellites can acquire land surface temperature data four times per day with a spatial resolution of 1 km [19]. Plenty of studies have investigated the urban thermal environment and surface UHI effects with MODIS data for their high temporal resolution [11,15,17,20,21,22,23,24]. For example, MODIS land surface temperature data were used to assess diurnal and seasonal variations in surface UHI intensity in 419 global big cities, and it was found that the annual average daytime/nighttime surface UHI intensity was 1.5/1.1 °C [15]. Landsat and ASTER thermal remote sensing data have a higher spatial resolution (60–120m) than the MODIS thermal remote sensing data and have also been used largely in urban thermal environment studies, especially at city scales [25,26,27,28,29,30,31,32,33,34]. Although surface UHI and urban thermal environment change have been studied extensively, several aspects are still less considered. Firstly, most studies of the urban thermal environment change have a relatively shorter study period [4,35]. This is mainly due to the extensive use of MODIS land surface temperature data, which highly determined the study periods. Most of the studies started around 2000 and thus had a study period that was shorter than 25 years [36]. Long-term research will help provide a more complete evolution path of urban thermal environments, which will be more conducive to the formulation of related management measures such as thermal mitigation. Therefore, this emphasizes the need for longer-term research on urban thermal environment changes. Secondly, the use of MODIS data is limited in delineating spatial details of heat and cold islands within the city due to the coarse spatial resolution of MODIS data (i.e., 1 km) [20]. The 1 km2 pixel of MODIS data is usually mixed with multiple land cover types (e.g., impervious surface, green space, blue space, etc.) due to the high heterogeneity of the urban landscape [37]. Thus, using finer resolution remote sensing data (e.g., Landsat thermal data) to map the spatial details of heat and cold islands would be better. Lastly, many studies focus on the overall UHI intensity [15,38,39,40], with little emphasis on the heterogeneity within the city and the cold island effect in blue and green spaces. In addition, little attention has been paid to urban population distribution and its actual exposure differences.
Taking Nanjing, China, a city experiencing rapid urbanization as an example, this study aims to assess long-term (i.e., 1990–2020) urban thermal environment change with the fine resolution Landsat thermal remote sensing data. The specific objectives are (1) to assess the change in the mean land surface temperature within the urban center boundary and the change in surface UHI intensity from 1990 to 2020; (2) to delineate spatial distribution of surface urban heat/cold islands within the urban center boundary; (3) to analyze the total and percentage of urban residents exposed to varied surface UHI intensity.
2. Materials and Methods
2.1. Study Area
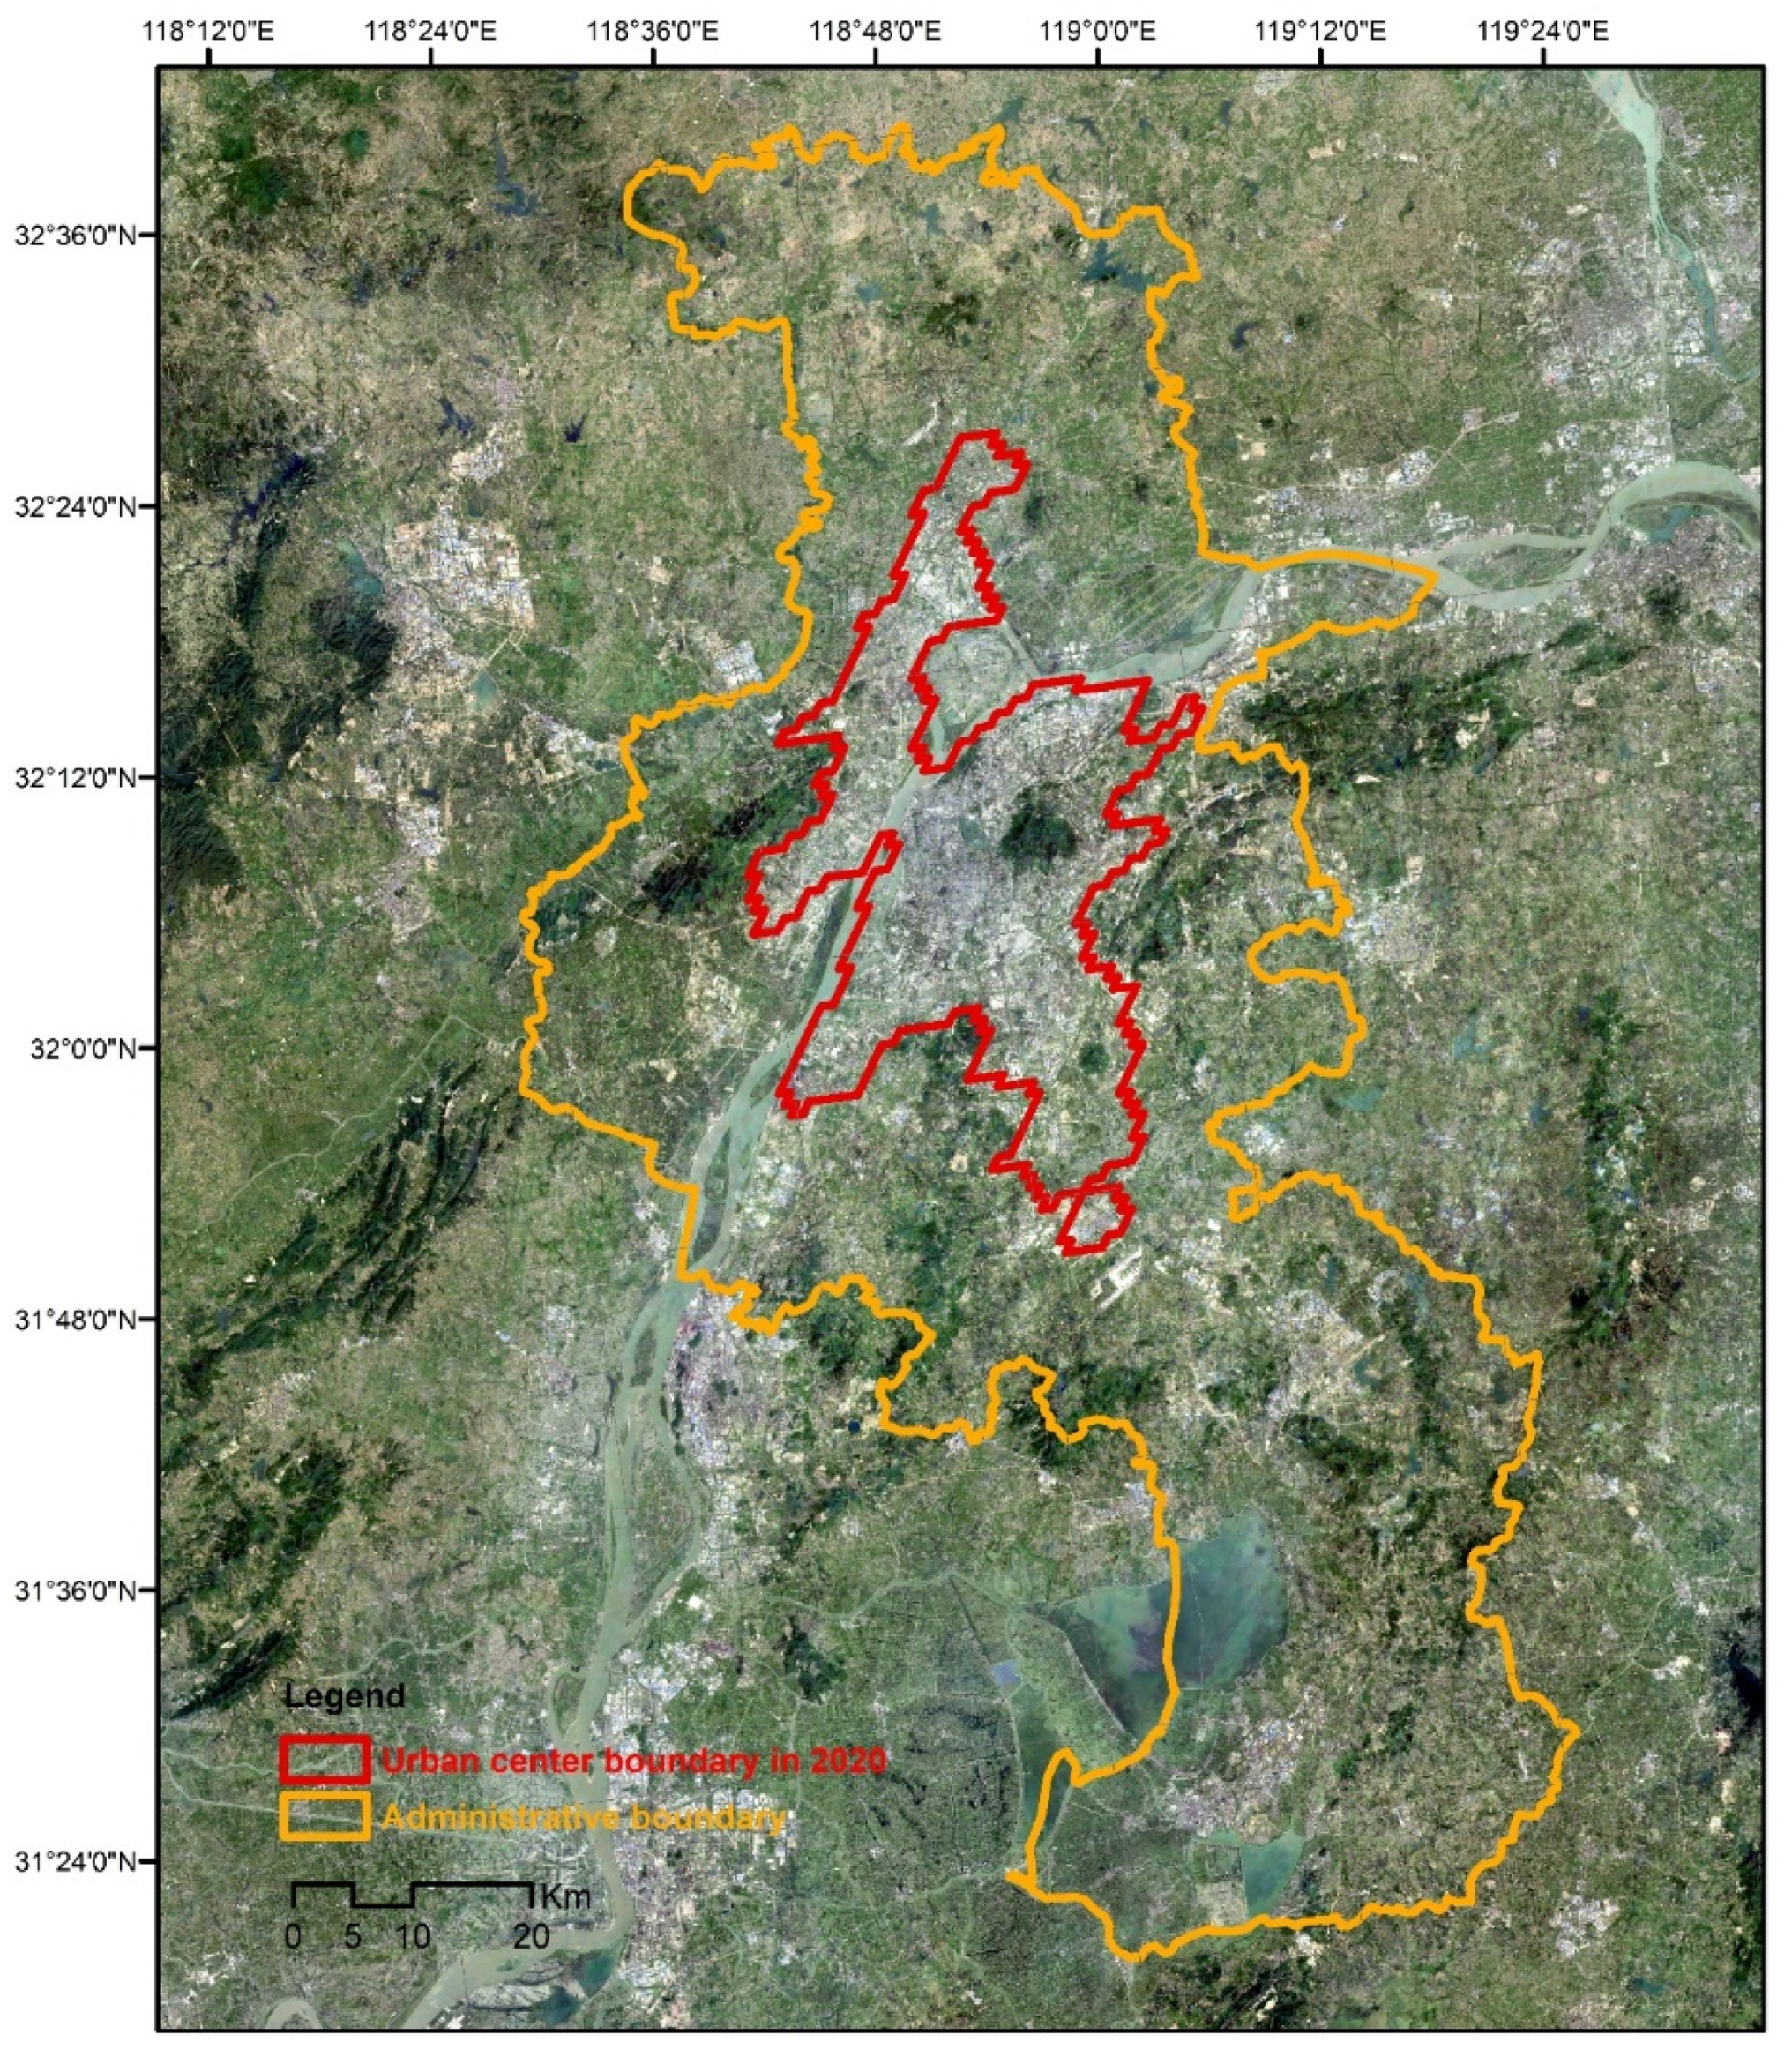
Nanjing City, China, is located with a longitude ranging from 118.35° E to 119.24° E and a latitude ranging from 31.23° N to 32.62° N (Figure 1). It is located in the center of the Yangtze River Delta urban agglomeration, which is one of the largest urban agglomerations in China. Nanjing is a typical city that has experienced rapid urbanization in the past few decades. The urban population in Nanjing increased from 2,362,200 in 1990 to 8,090,000 in 2020, and the percentage of the urban population increased from 47.07% to 86.80% between 1990 and 2020 [41]. Nanjing has a humid northern subtropical climate, with an average annual temperature of 15.6 °C and an average daily maximum temperature of 32 °C in July (the hottest month). Nanjing has scorching summers and is known as one of the hottest cities in China during the summer. Therefore, it is necessary to study urban thermal environment change in Nanjing, especially on summer or hot days.

Figure 1.
Location of study area. The yellow outline indicates the administrative boundary of Nanjing, and the red polygon indicates the urban center boundary of Nanjing in 2020. Urban center boundary data was obtained from the Global Human Settlement Layer database (GHSL, https://ghsl.jrc.ec.europa.eu/download.php?ds=builtC, accessed on 12 October 2023) [42].
2.2. Land Surface Temperature Calculation
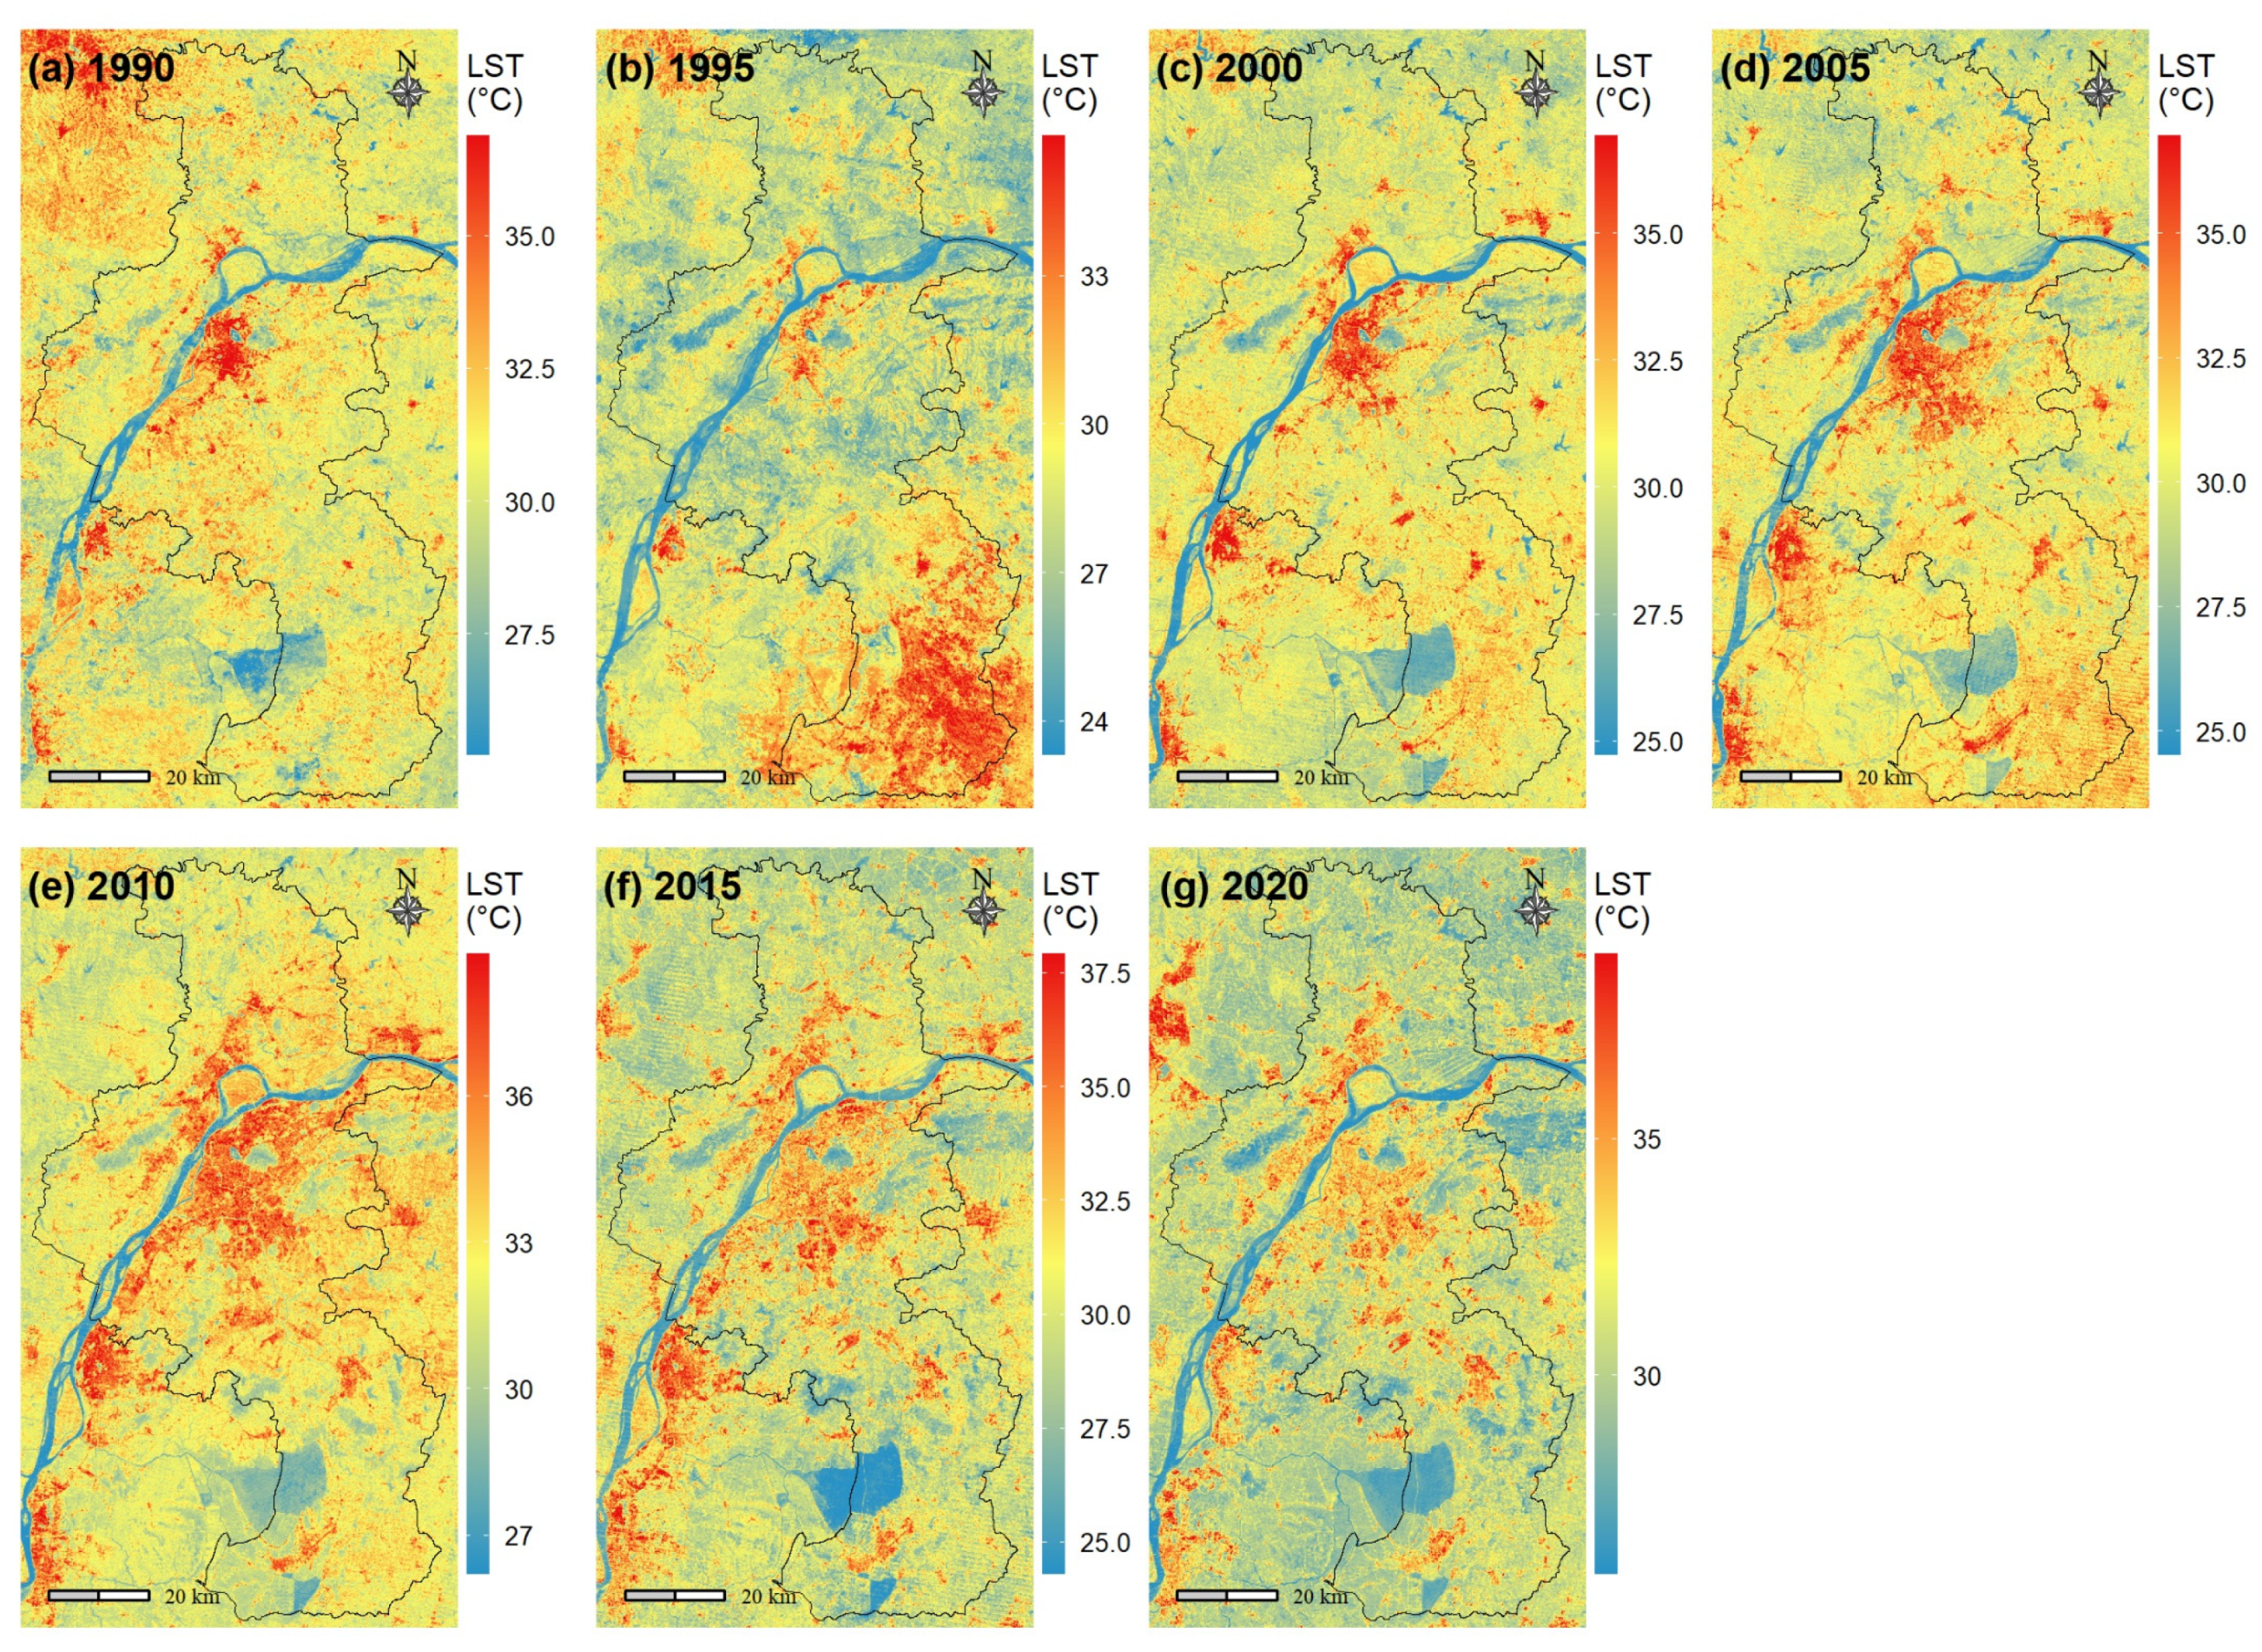
We retrieved fine-resolution day-time land surface temperature data from the Landsat thermal bands satellite images. The local time when Landsat is passing over Nanjing is usually between 10:00 a.m. and 10:30 a.m. We performed the Landsat land surface temperature calculation on the Google Earth Engine (GEE) platform [43] by referencing the open-source code developed by Ermida et al. [44] (https://code.earthengine.google.com/?accept_repo=users/sofiaermida/landsat_smw_lst, accessed on 12 October 2023). The GEE code can be used conveniently to compute land surface temperature from Landsat 4, 5, 7, 8, and 9 within GEE. The Landsat land surface temperature was computed with the statistical mono-window algorithm (SMW) developed by the Climate Monitoring Satellite Application Facility in Ermida’s code [44]. The SMW algorithm is relatively simple and easy to calibrate and implement [44]. Besides the Landsat data, the algorithm also needs the water vapor content from NCEP/NCAR reanalysis data and emissivity from the ASTER GED dataset with an NDVI-based correction for vegetation dynamics which are available on the GEE platform. To increase the number of valid observations, we used all available Landsat images for each target year (i.e., 1990, 1995, 2000, 2005, 2010, 2015, and 2020) and the year before and after the target year (e.g., the year 1989 and 1991 for the target year 1990) to calculate land surface temperature. Clouds and cloud shadows were masked when calculating the Landsat land surface temperature. In addition, we only consider images from May to September because the weather is hot during this period, and urban residents are more susceptible to the negative impact of the heat island effect. After calculating land surface temperature of each Landsat images covering the study area, we averaged the land surface temperature of each target year and the years before and after the specific target year (Figure 2).

Figure 2.
Landsat land surface temperature (LST) maps of the year circa 1990 (a), 1995 (b), 2000 (c), 2005 (d), 2010 (e), 2015 (f), and 2020 (g).
2.3. Analyzing Urban Thermal Environment Change between 1990 and 2020
2.3.1. Land Surface Temperature Change Analysis
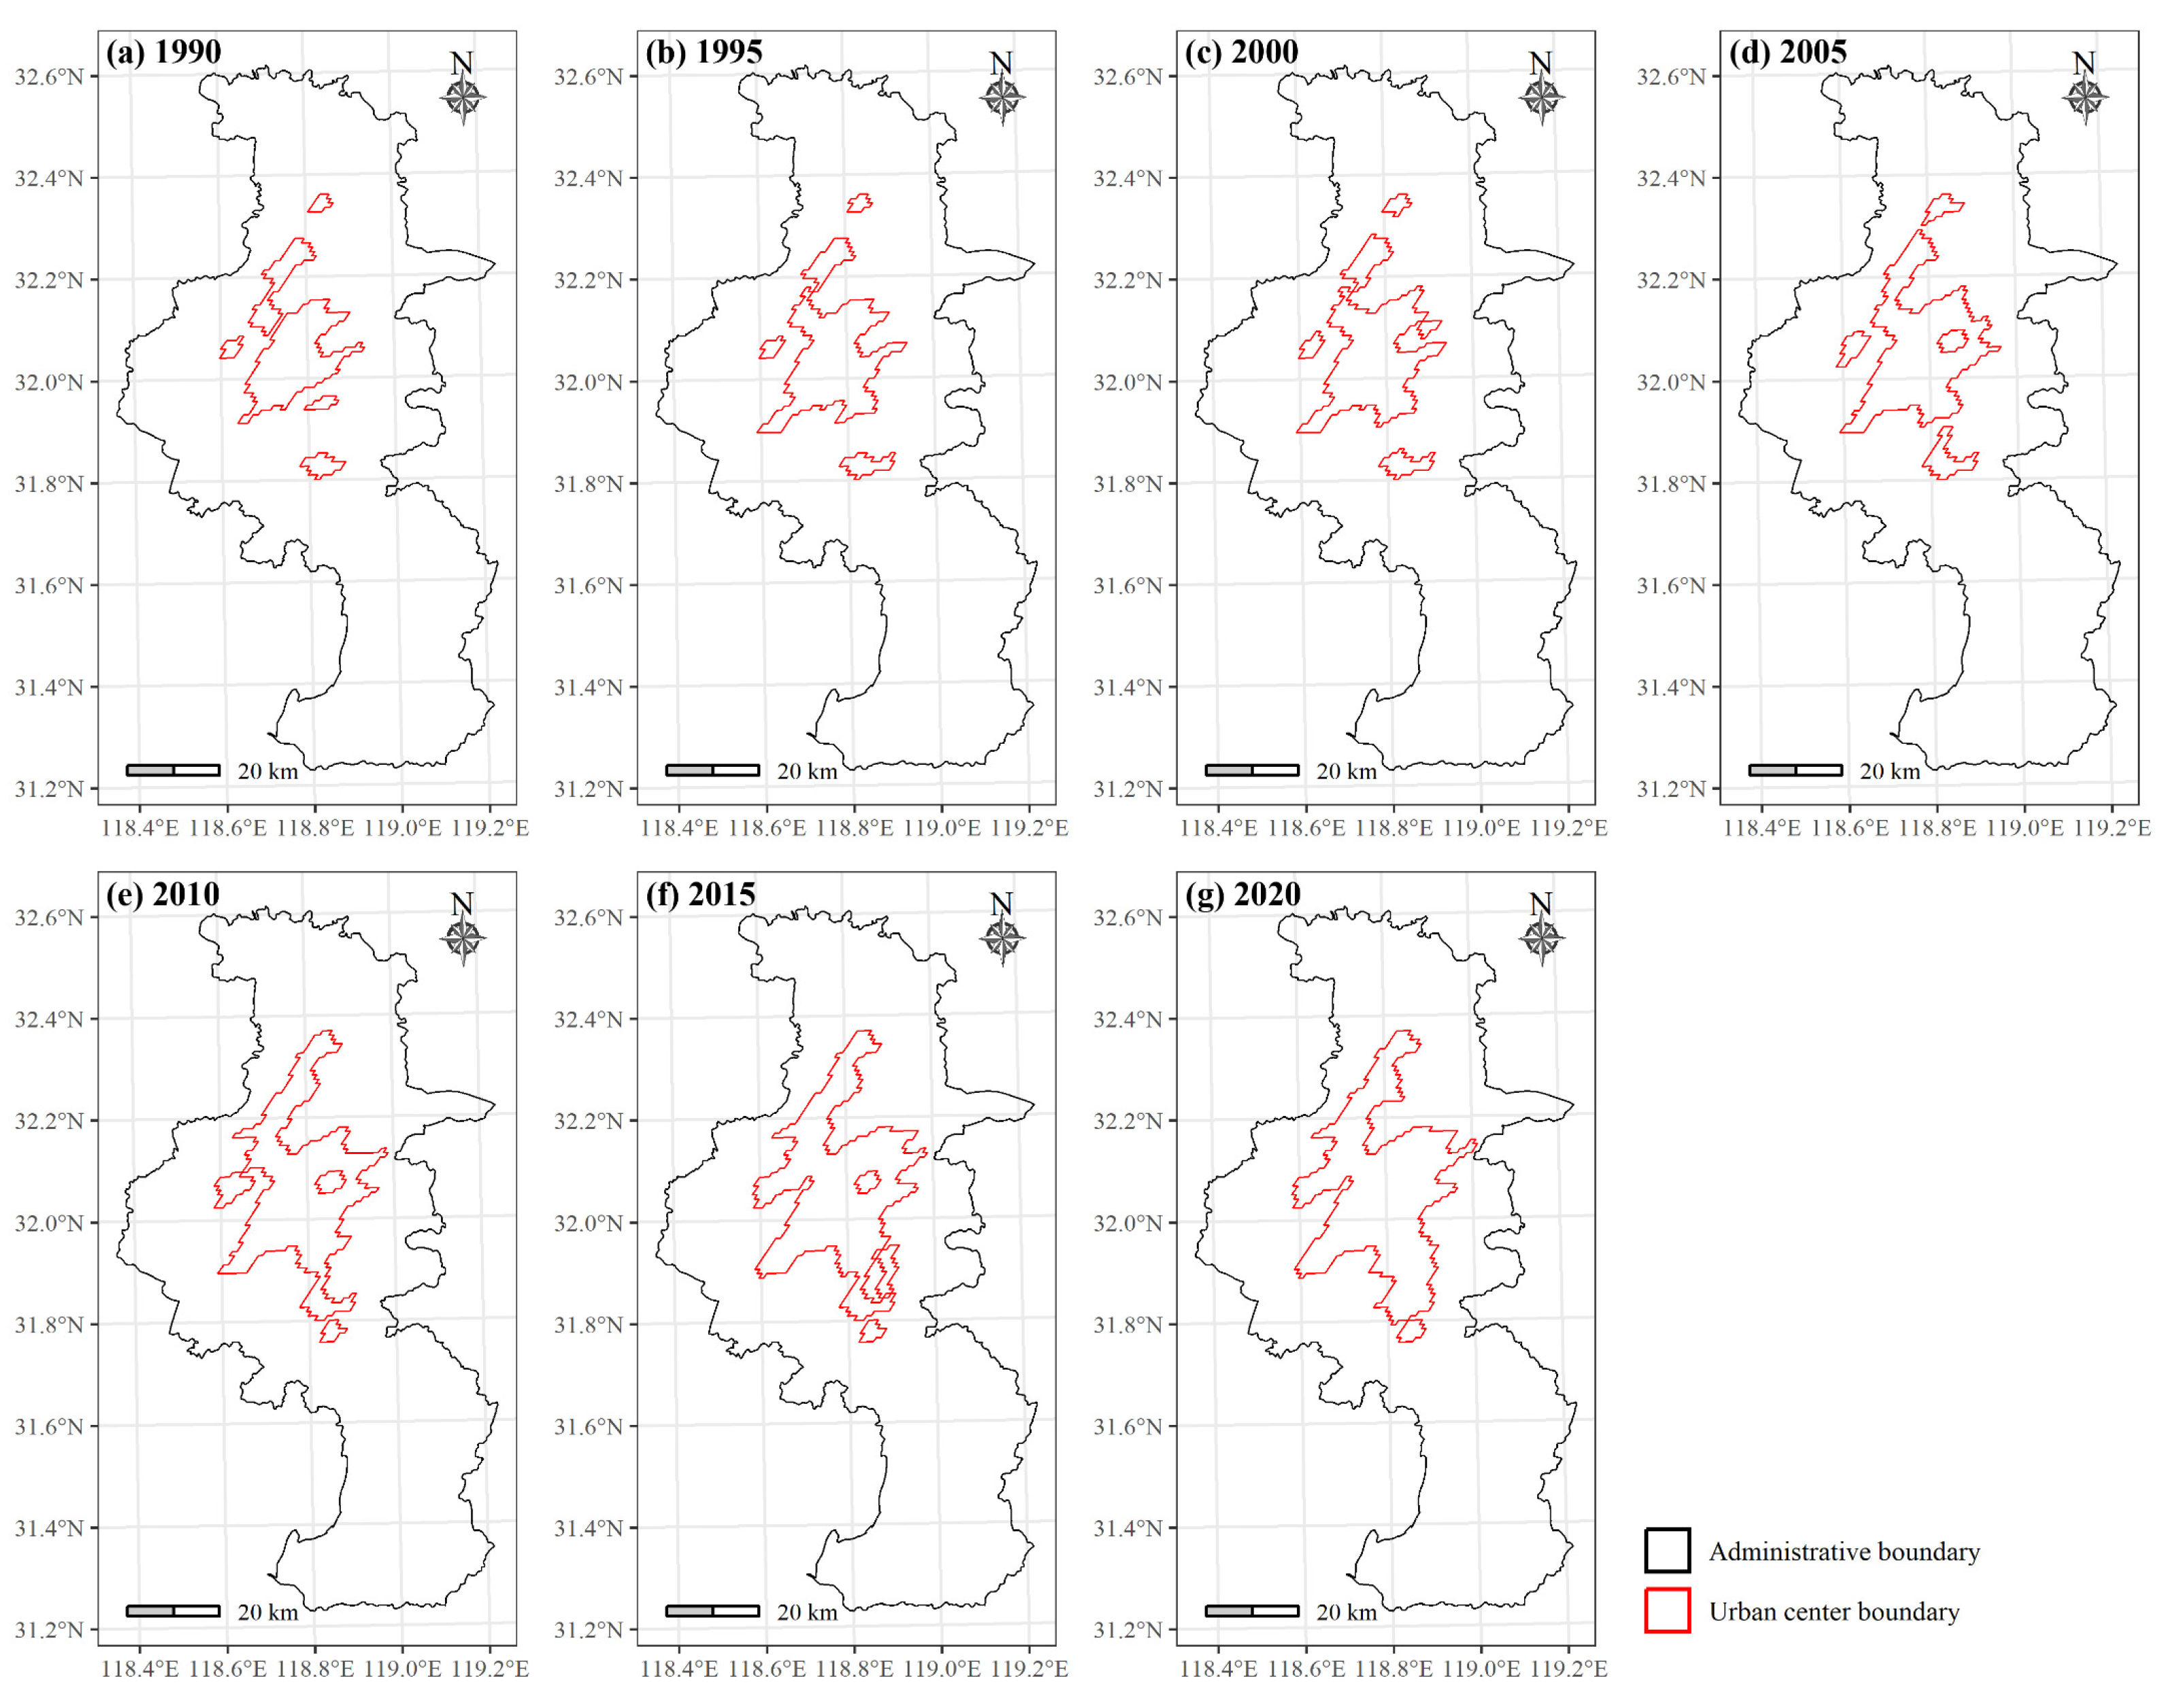
We calculated the mean land surface temperature in each target year (i.e., circa 1990, 1995, 2000, 2005, 2010, 2015, 2020) within the urban center boundary (i.e., urban core areas or urban built-up boundary) of the target year, year 1990, and year 2020. The urban center boundaries (Figure 3) were derived from the Global Human Settlement Layer- Settlement Model layers (GHSL-SMOD) dataset [42]. The GHSL-SMOD dataset was generated by combining the 1 km2 population spatial raster dataset and the 1 km2 built-up surface dataset. It classifies each 1km2 grid cell as ‘Urban Center’, ‘Urban Cluster’, and ‘Rural Grid Cells’. An urban center includes contiguous grid cells (4 connectivity clusters) with a density of at least 1500 inhabitants per km2 and at least 50,000 inhabitants in the cluster with smooth boundaries and <15 km2 of holes have been filled [45].

Figure 3.
Urban center boundaries of Nanjing City in the year 1990 (a), 1995 (b), 2000 (c), 2005 (d), 2010 (e), 2015 (f), and 2020 (g).
2.3.2. Surface Urban Heat Island Intensity Change Analysis
The overall surface UHI intensity (Equation (1)) was calculated as the land surface temperature difference between the urban area and a 10 km buffer region in the surrounding rural area [14]. The urban area was determined with the urban center boundaries derived from the GHSL-SMOD dataset (Figure 3), and then a 10 km buffer area was generated based on the urban center boundary dataset.
where is the overall surface UHI intensity, is the mean land surface temperature in the urban center boundary, is the mean land surface temperature in the surrounding rural area of the urban center.
In addition to calculating the overall surface heat island intensity, we also quantified the spatial distribution of heat/cold islands within the city at a pixel level. We subtracted the mean value of land surface temperature in the surrounding rural areas of the urban center from the land surface temperature value of each pixel within the urban center boundaries for each target year (i.e., 1990, 1995, 2000, 2005, 2010, 2015, 2020). The pixel within the urban center boundary is defined as a heat island pixel when its land surface temperature value is larger than the mean value of the land surface temperature in the surrounding rural area of the urban center; otherwise, it is defined as a cold island pixel. After determining the heat/cold island and its intensity in each pixel within the urban center boundary, we mapped the spatial distribution of urban heat/cold islands for each target year. We also calculated the percentage of surface urban heat/cool islands within the urban center boundary and analyzed its long-term change between 1990 and 2020.
2.3.3. Urban Heat Island Exposure Change Analysis
Based on population spatial data and the spatial distribution of heat/cold islands data, we assessed the change in urban population exposure to heat islands between 1990 and 2020. The population spatial data, i.e., GHSL population data (GHSL-POP), were obtained from the GHSL project [46]. The GHSL-POP data have a spatial resolution of 100 m. The spatial distribution of heat/cold islands has been generated in Section 2.3.2. We divided the surface UHIs intensity (°C) into cold islands (≤0), small to medium heat islands (between 0 and 5) and strong heat islands (>5). The small to medium heat islands were divided into 1 °C equal intervals for better visualization, i.e., (0,1], (1,2], (2,3], (3,4], and (4,5]. We then calculated the percentage of urban residents exposed to varied surface UHI intensity and analyzed its change from circa 1990 to circa 2020.
2.4. Analyzing Potential Driving Factors of Urban Thermal Environment Change
We analyzed the impacts of natural or socio-economic factors on urban thermal environment change. Specifically, we chose the area of the urban center, population density, per capita GDP, percentage of green and blue space, and mean air temperature to represent climate, surface characteristics, and human activities. The area of the urban center was calculated based on the urban center boundary data. The population density was calculated based on the total population within the urban center boundary divided by the area of the urban center boundary. Per capita GDP was collected from yearbooks [41]. The percentage of green and blue space was calculated based on the total area of green and blue space divided by the total area of the urban center. The green space data were generated with the Landsat NDVI data and a threshold of 0.3 [47]. The blue space (i.e., water area) data was obtained from the global surface water database [48]. The 2 m air temperature data that was from the same time period (i.e., from May to September) as the Landsat images were obtained from the ERA5 global reanalysis database [49], and we then computed mean air temperature for each target year from 1990 to 2020. Then, we performed a linear correlation analysis between the surface UHI intensity and the natural or socio-economic indicators.
3. Results
3.1. Results of Land Surface Temperature Change from 1990 to 2020
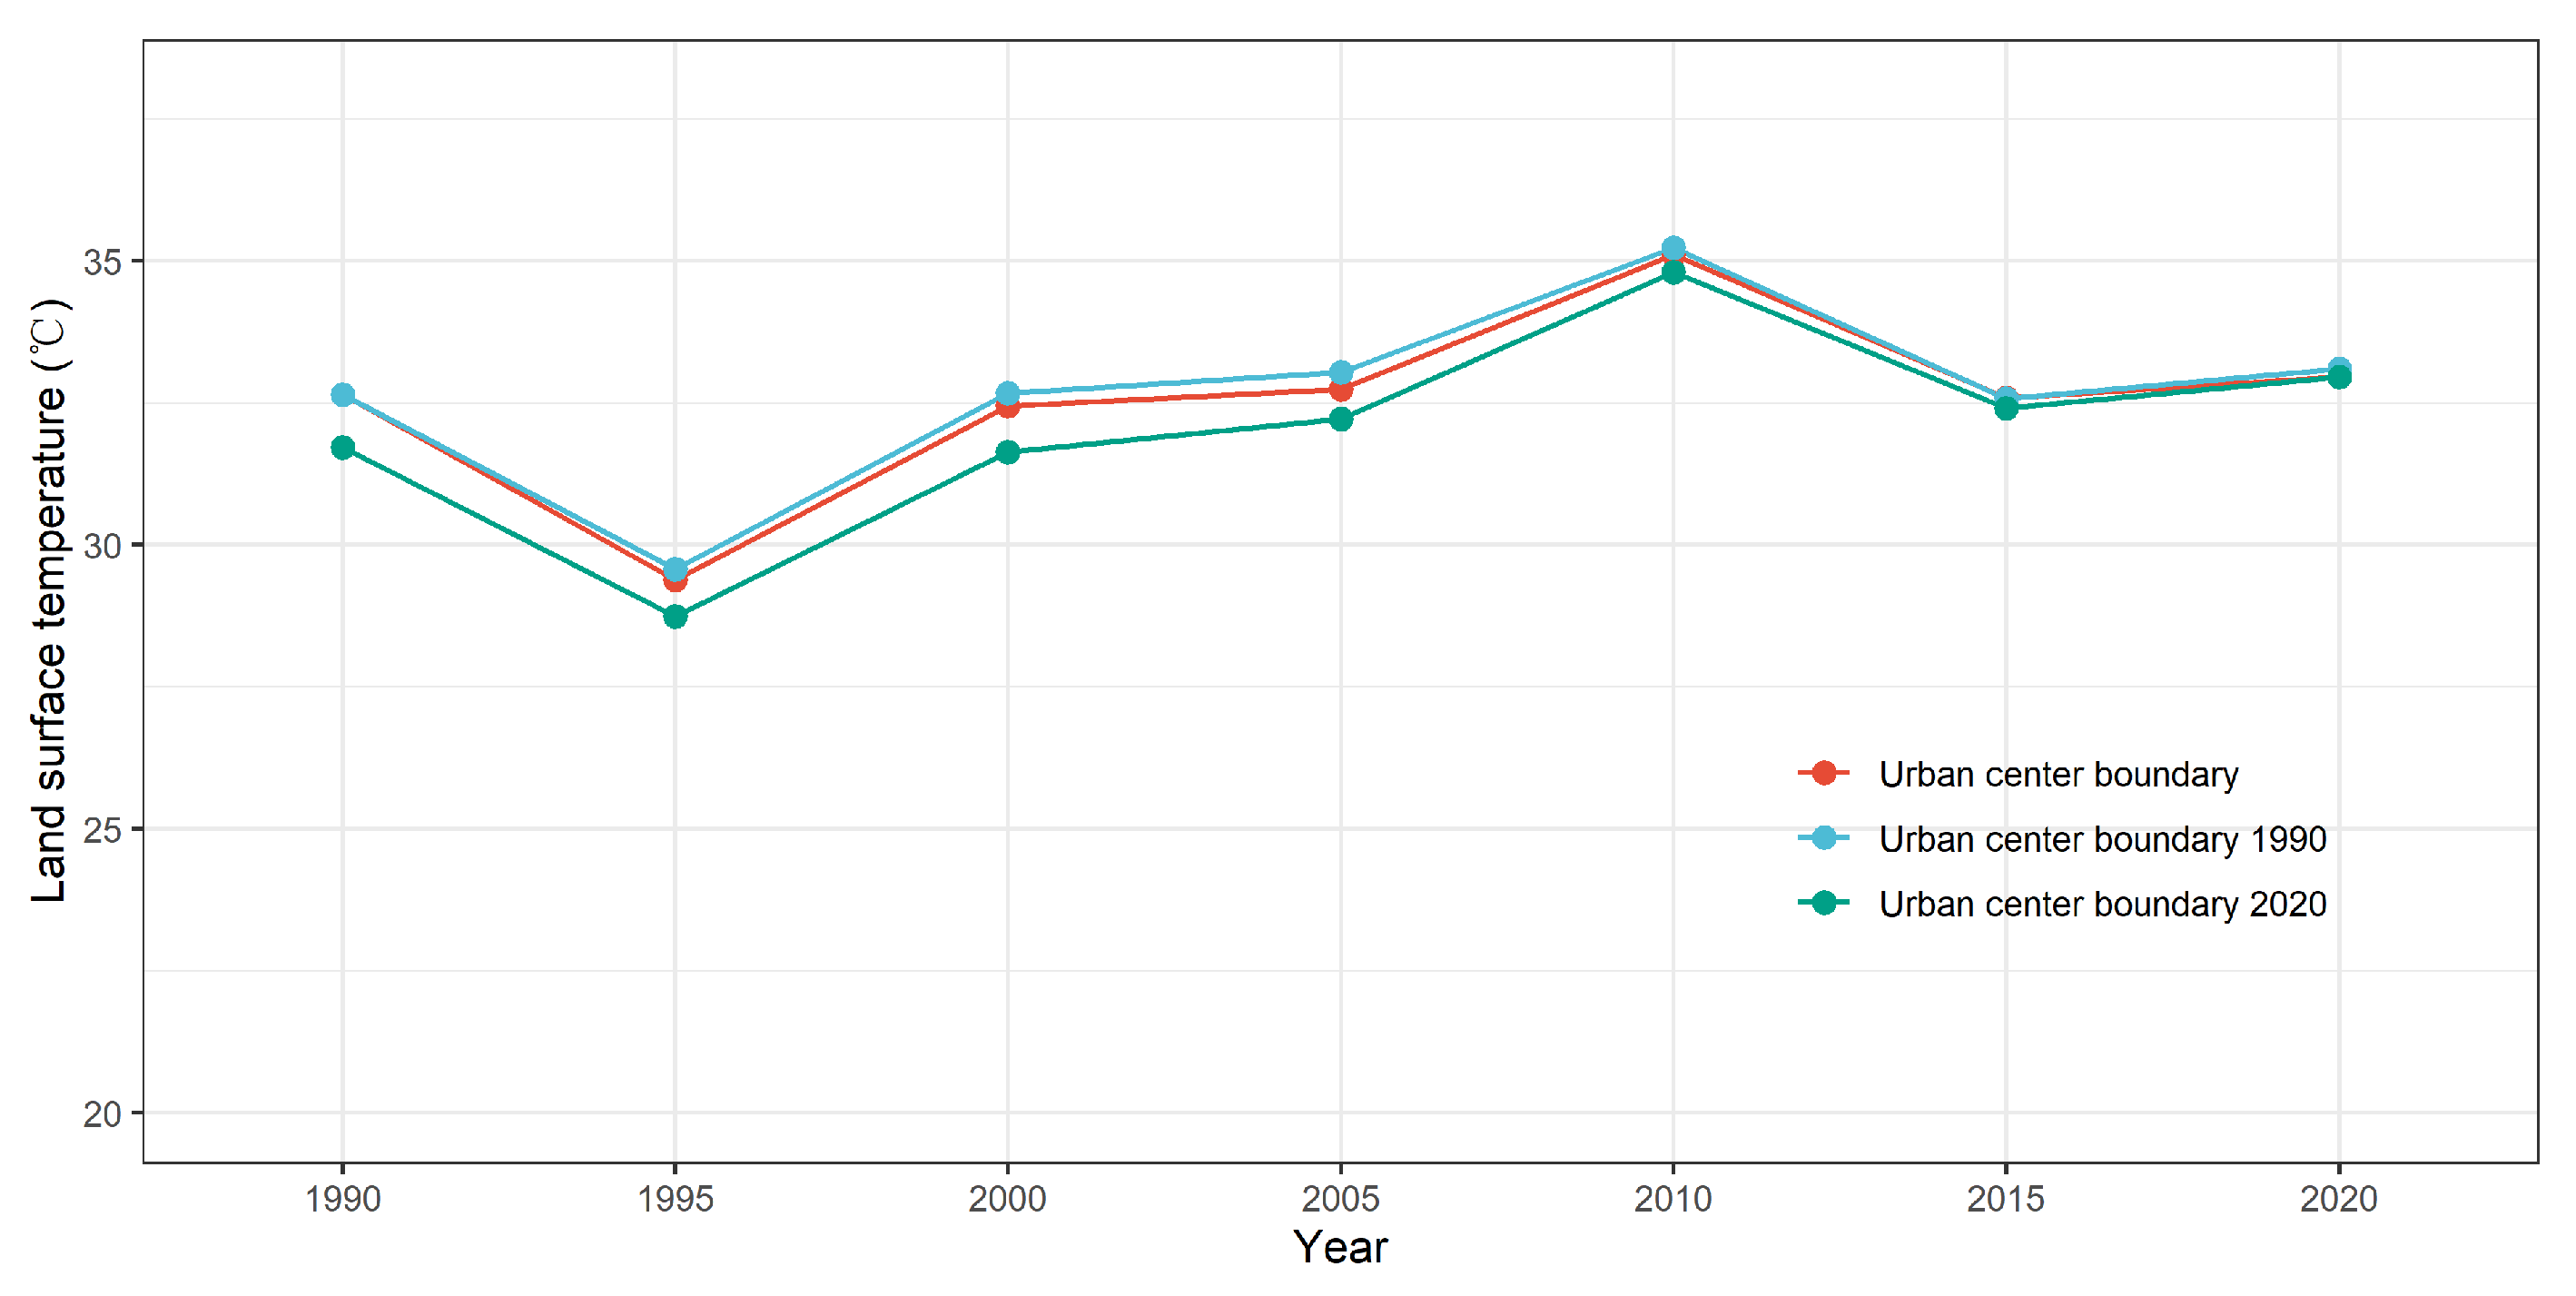
Figure 4 shows the mean land surface temperature variation from 1990 to 2020 in the urban center boundary of each year, year 1990, and year 2020. The mean land surface temperature in the urban center boundary from 1990 to 2020 was 32.65, 29.38, 32.45, 32.75, 35.11, 32.59, and 32.95 °C, respectively. The mean land surface temperature in the urban center boundary of each specific year (e.g., 32.75 °C in 2005) was slightly lower than that in the urban center boundary of the year 1990 (e.g., 33.03 °C in 2005). It was slightly higher than that in the urban center boundary of the year 2020 (e.g., 32.21 °C in 2005).

Figure 4.
Variation of the mean land surface temperature from circa 1990 to circa 2020 in the urban center boundary of each specific year, the year 1990, and the year 2020.
3.2. Results of Surface Heat Island Intensity Change from 1990 to 2020
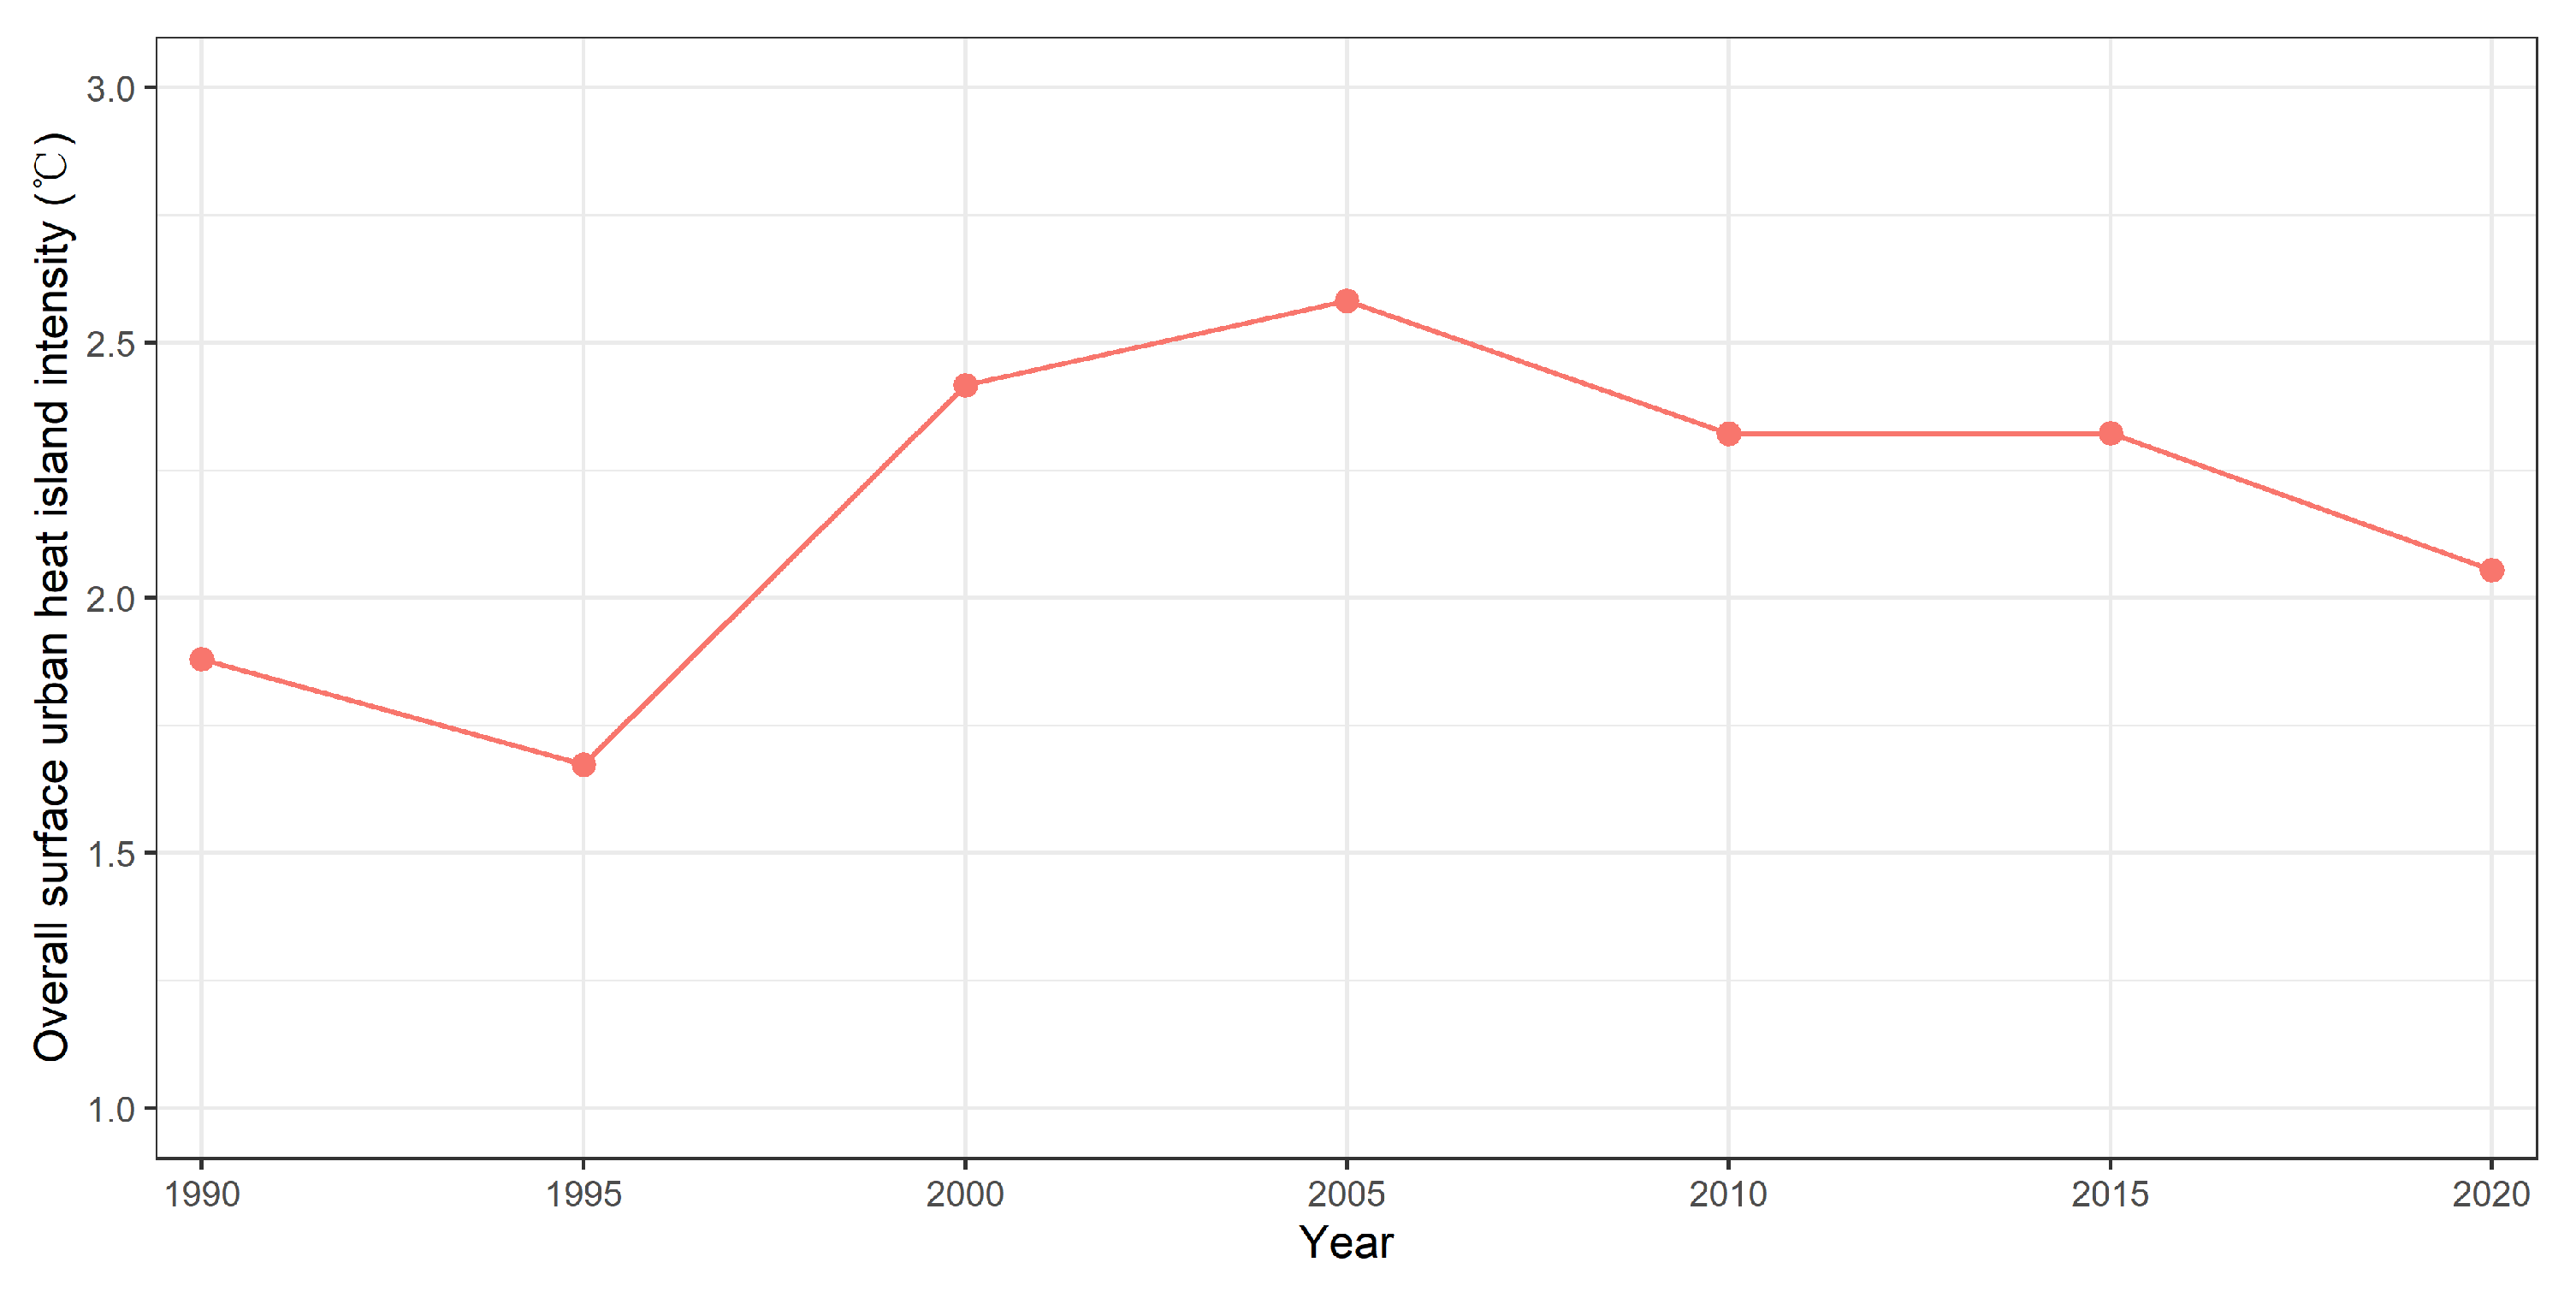
Figure 5 shows the overall surface UHI intensity change from 1990 to 2020 in Nanjing City. The mean overall surface UHI intensity in summer during 1990–2020 was 2.18 °C, ranging from 1.67 °C to 2.58 °C. The overall surface UHI intensity showed a noticeable increasing trend between 1990 and 2005 and a decreasing trend between 2005 and 2020. It increased from 1.88 °C in 1990 to 2.58 °C in 2005, then decreased to 2.05 °C in 2020.

Figure 5.
Change in the overall surface urban heat island intensity from circa 1990 to circa 2020.
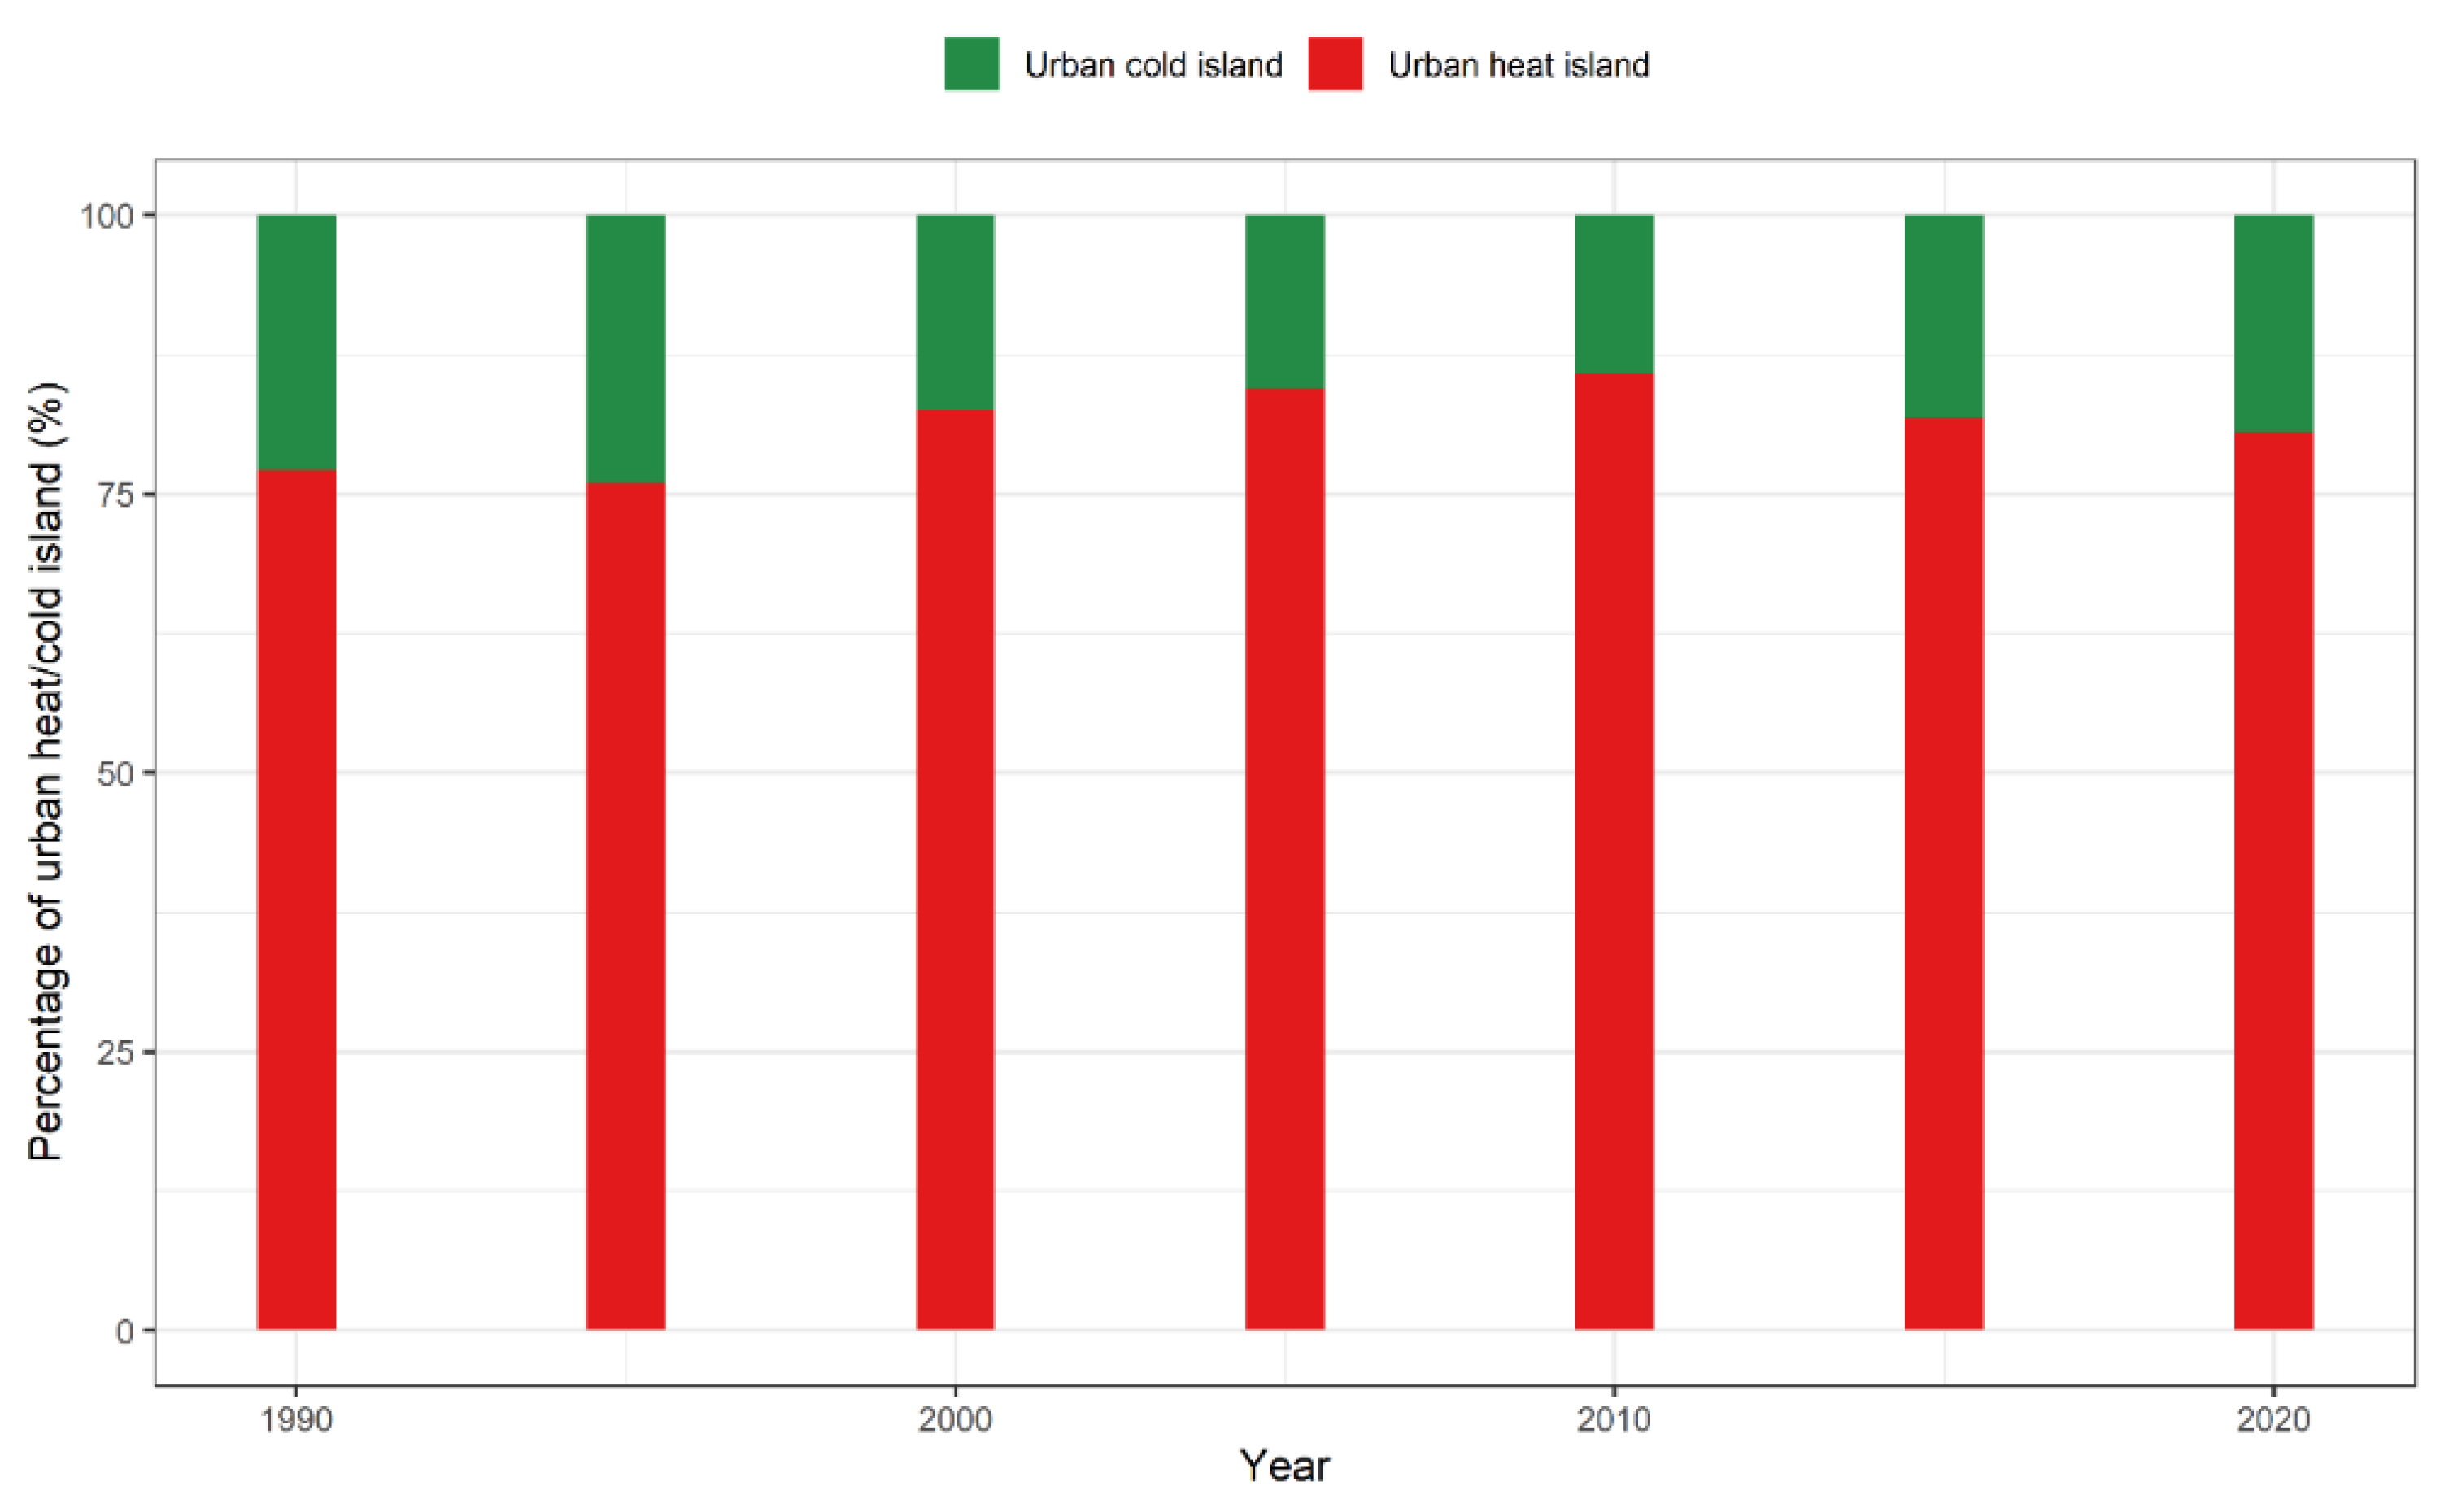
Figure 6 exhibits the spatial distribution of surface urban heat/cold islands within the urban center boundary. Most areas within the urban center boundary behaved as heat islands, while a few areas behaved as cold islands, mainly found in water surfaces and green spaces. On average, 81% of areas within the urban center boundary were heat islands, and the other 19% of areas were cold islands. The percentage of surface UHIs within the urban center boundary showed a trend of first increasing and then decreasing from 1990 to 2020 (Figure 7). The percentage of surface UHIs was 77.01% in 1990, and it increased to 85.79% in 2010 and then decreased to 80.53% in 2020.
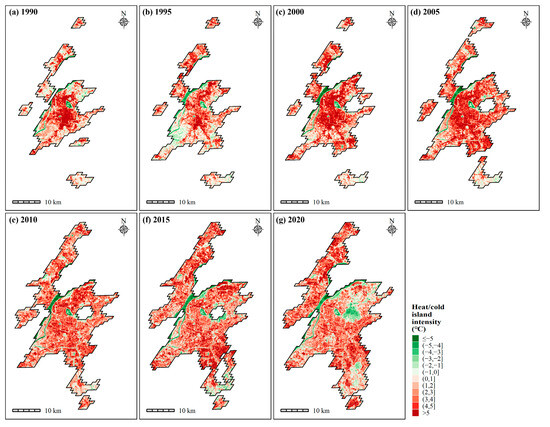
Figure 6.
Spatial pattern of surface urban heat/cold island intensity within the urban center boundary in years circa 1990 (a), 1995 (b), 2000 (c), 2005 (d), 2010 (e), 2015 (f), and 2020 (g). Negative values (green color) indicate cold island intensity, the lower the negative values, the stronger the cold island intensity. Positive values (red color) indicate heat island intensity, the higher the positive values, the stronger the heat island intensity.
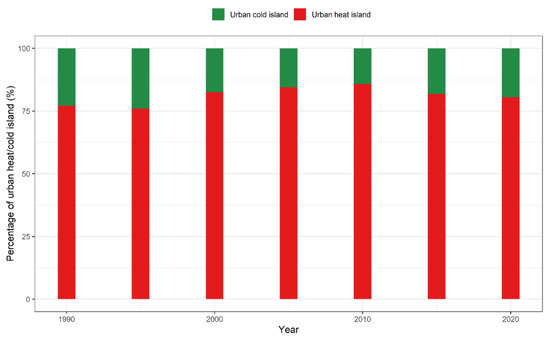
Figure 7.
Change in the percentage of surface urban heat/cold island within the urban center boundary from circa 1990 to circa 2020.
3.3. Results of Urban Heat Island Exposure Change from 1990 to 2020
To quantify the differences in urban population exposure to UHIs, we divided the urban heat/cold island intensity into cold islands (≤0 °C), strong heat islands (>5 °C), and weak to medium heat island intensities divided into 1 °C equal intervals between 0 °C and 5 °C (Figure 6), and we then summarized the total population and the percentage of urban residents (%) exposed to varied urban heat/cold island intensities for each target year (Table 1 and Table 2). The total urban population that was not affected by the UHI effect (i.e., in the cold island areas) varied between 26,852 and 165,002 between 1990 and 2020. The total urban population exposed to surface UHI intensity greater than 5.0 °C varied between 681,541 and 1,719,918 between 1990 and 2020 (Table 1). Only a tiny proportion of the population was not affected by the UHI effect or was only slightly affected (Table 2). The mean percentage of urban residents located in the cold island areas or in areas of surface UHI intensity of less than 1.0 °C was 1.71% and 4.42%, respectively. More than 65% of the urban residents have lived in areas with a surface UHI intensity larger than 3.0 °C, and even 23.6% of the urban residents have lived in areas with a surface UHI intensity larger than 5.0 °C. The percentage of urban residents located in the cold island areas or in areas with a surface UHI intensity of less than 1.0 °C showed a decreasing trend between 1990 and 2005 and an increasing trend between 2005 and 2020. On the contrary, the percentage of urban residents that have lived in areas with a surface UHI intensity larger than 3.0 °C showed an increasing trend between 1990 and 2005 and a decreasing trend between 2005 and 2020 (Table 1).

Table 1.
Total urban residents exposed to varied surface urban heat island intensities from circa 1990 to circa 2020.
Table 2.
Percentage of urban residents (%) exposed to varied surface urban heat island intensities from circa 1990 to circa 2020.
3.4. Relationships between the Overall Surface Urban Heat Island Intensity and Potential Drivers
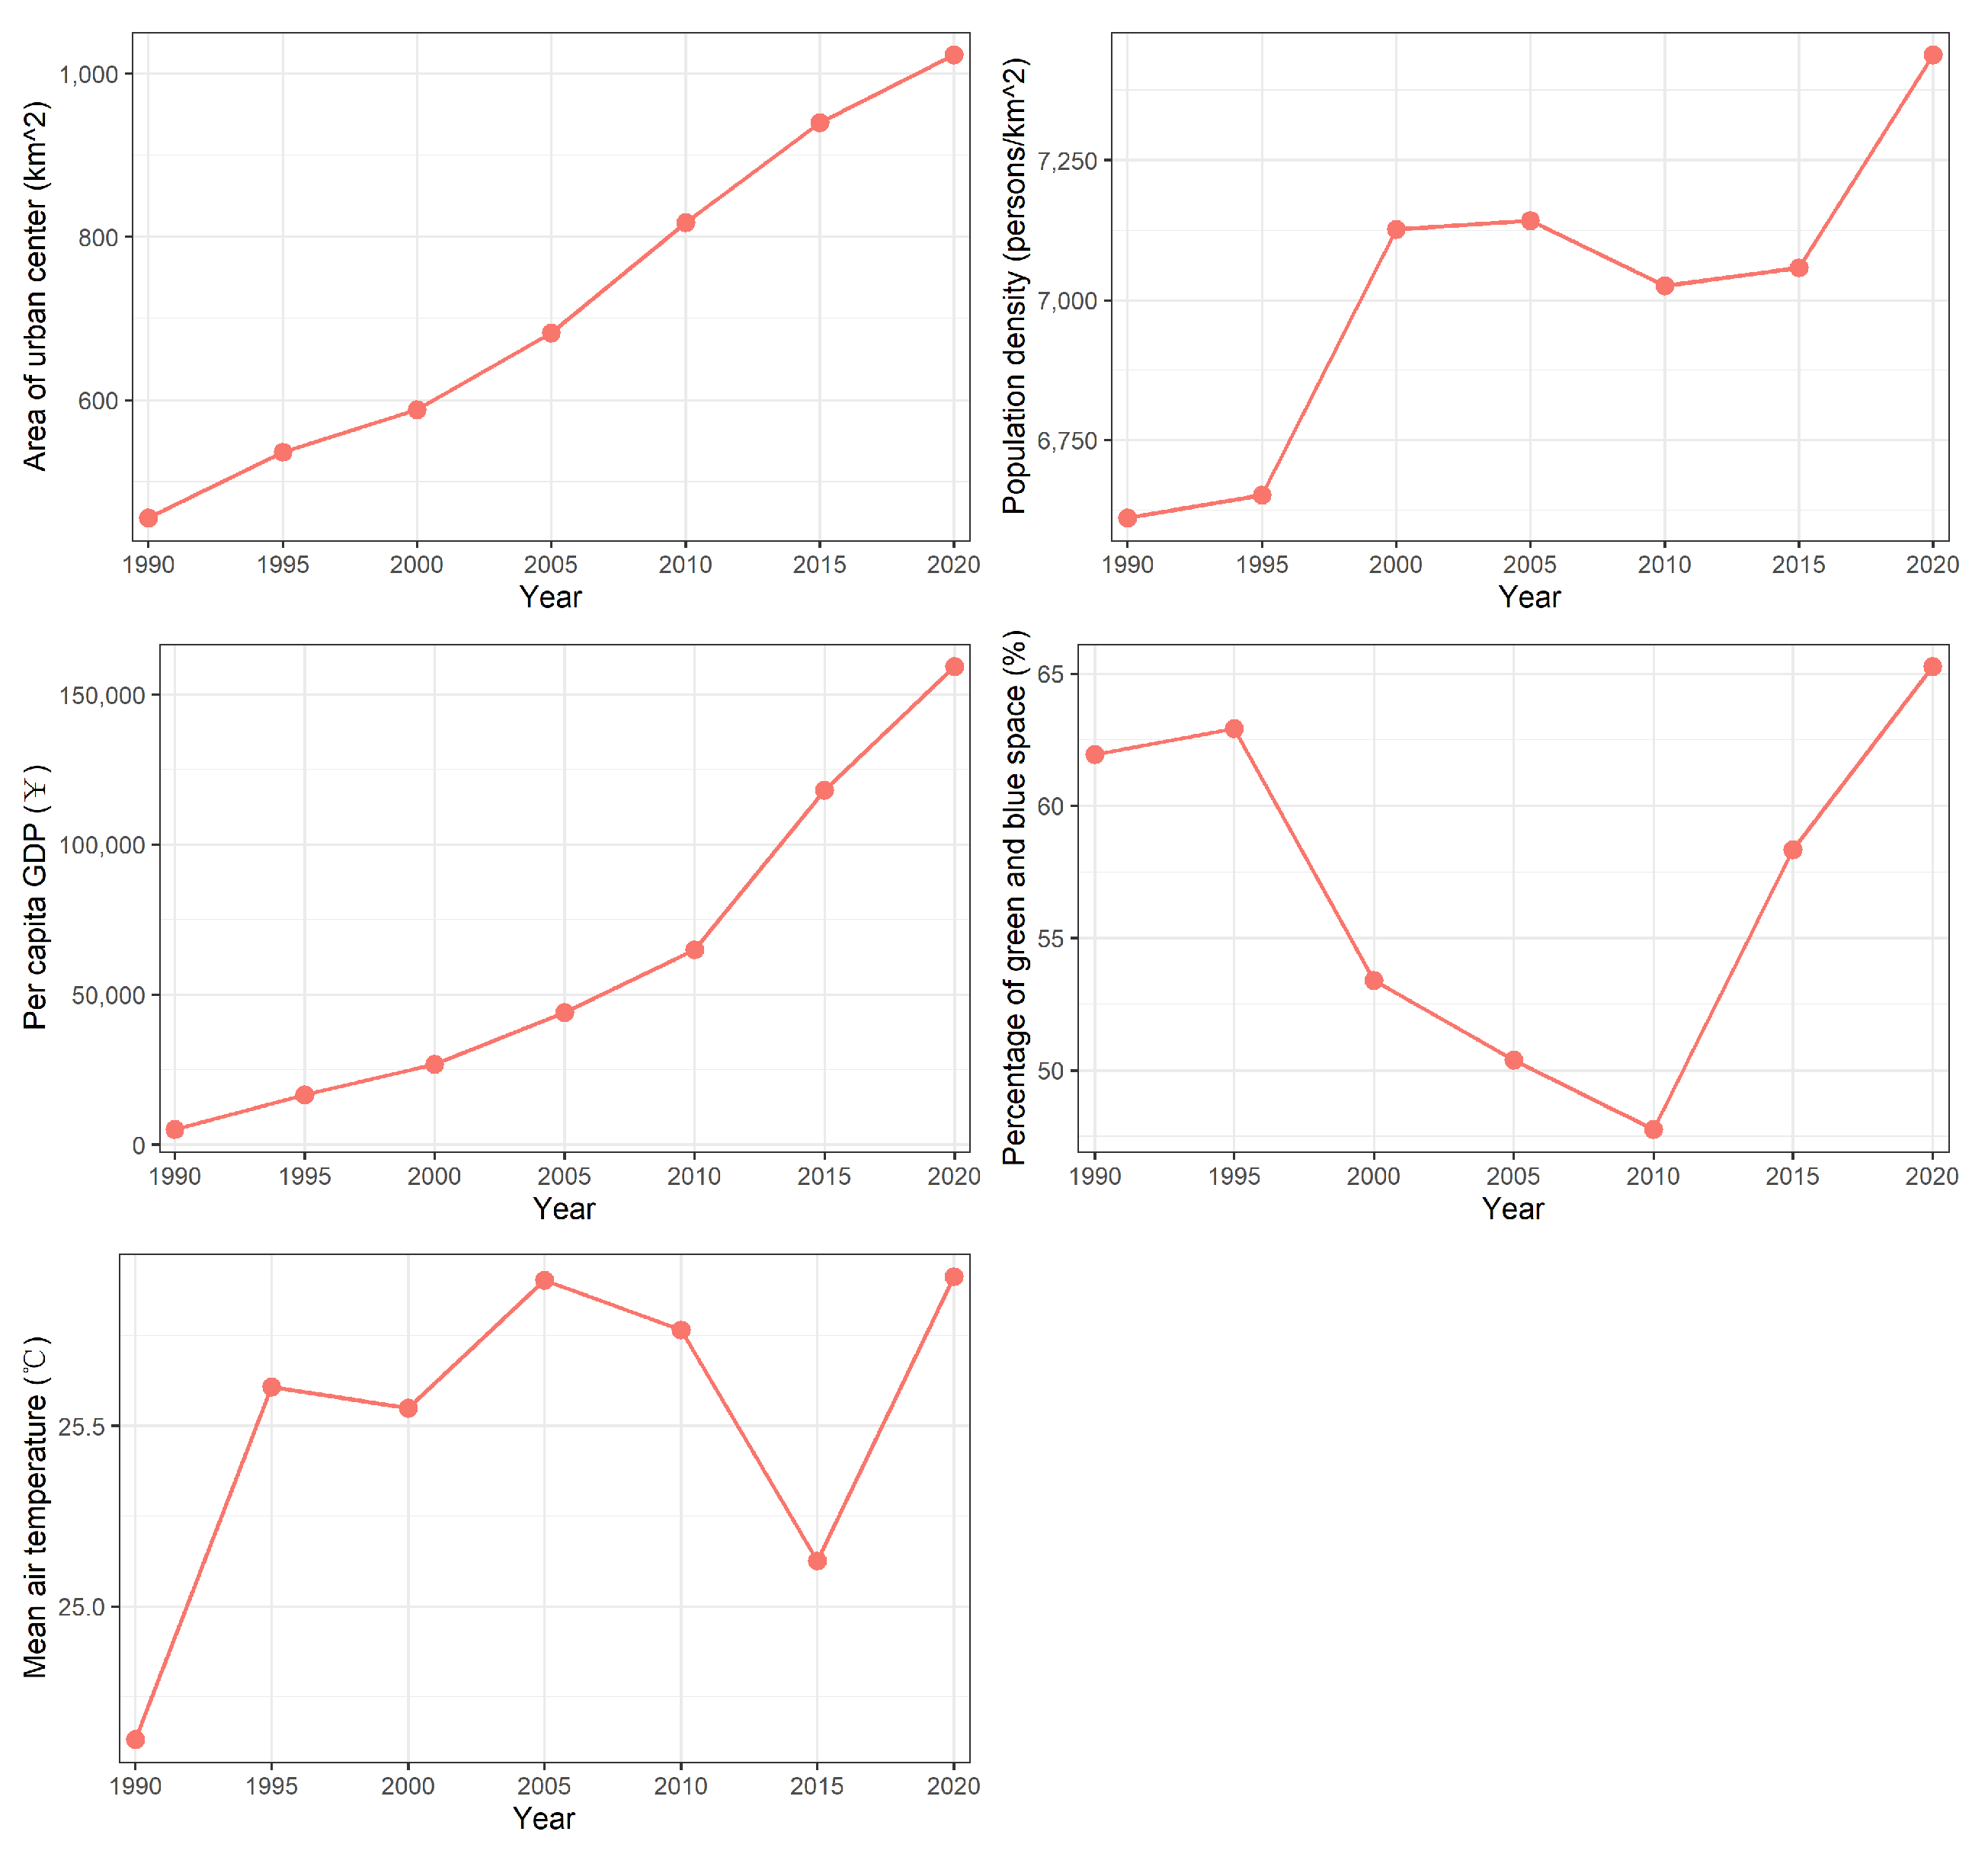
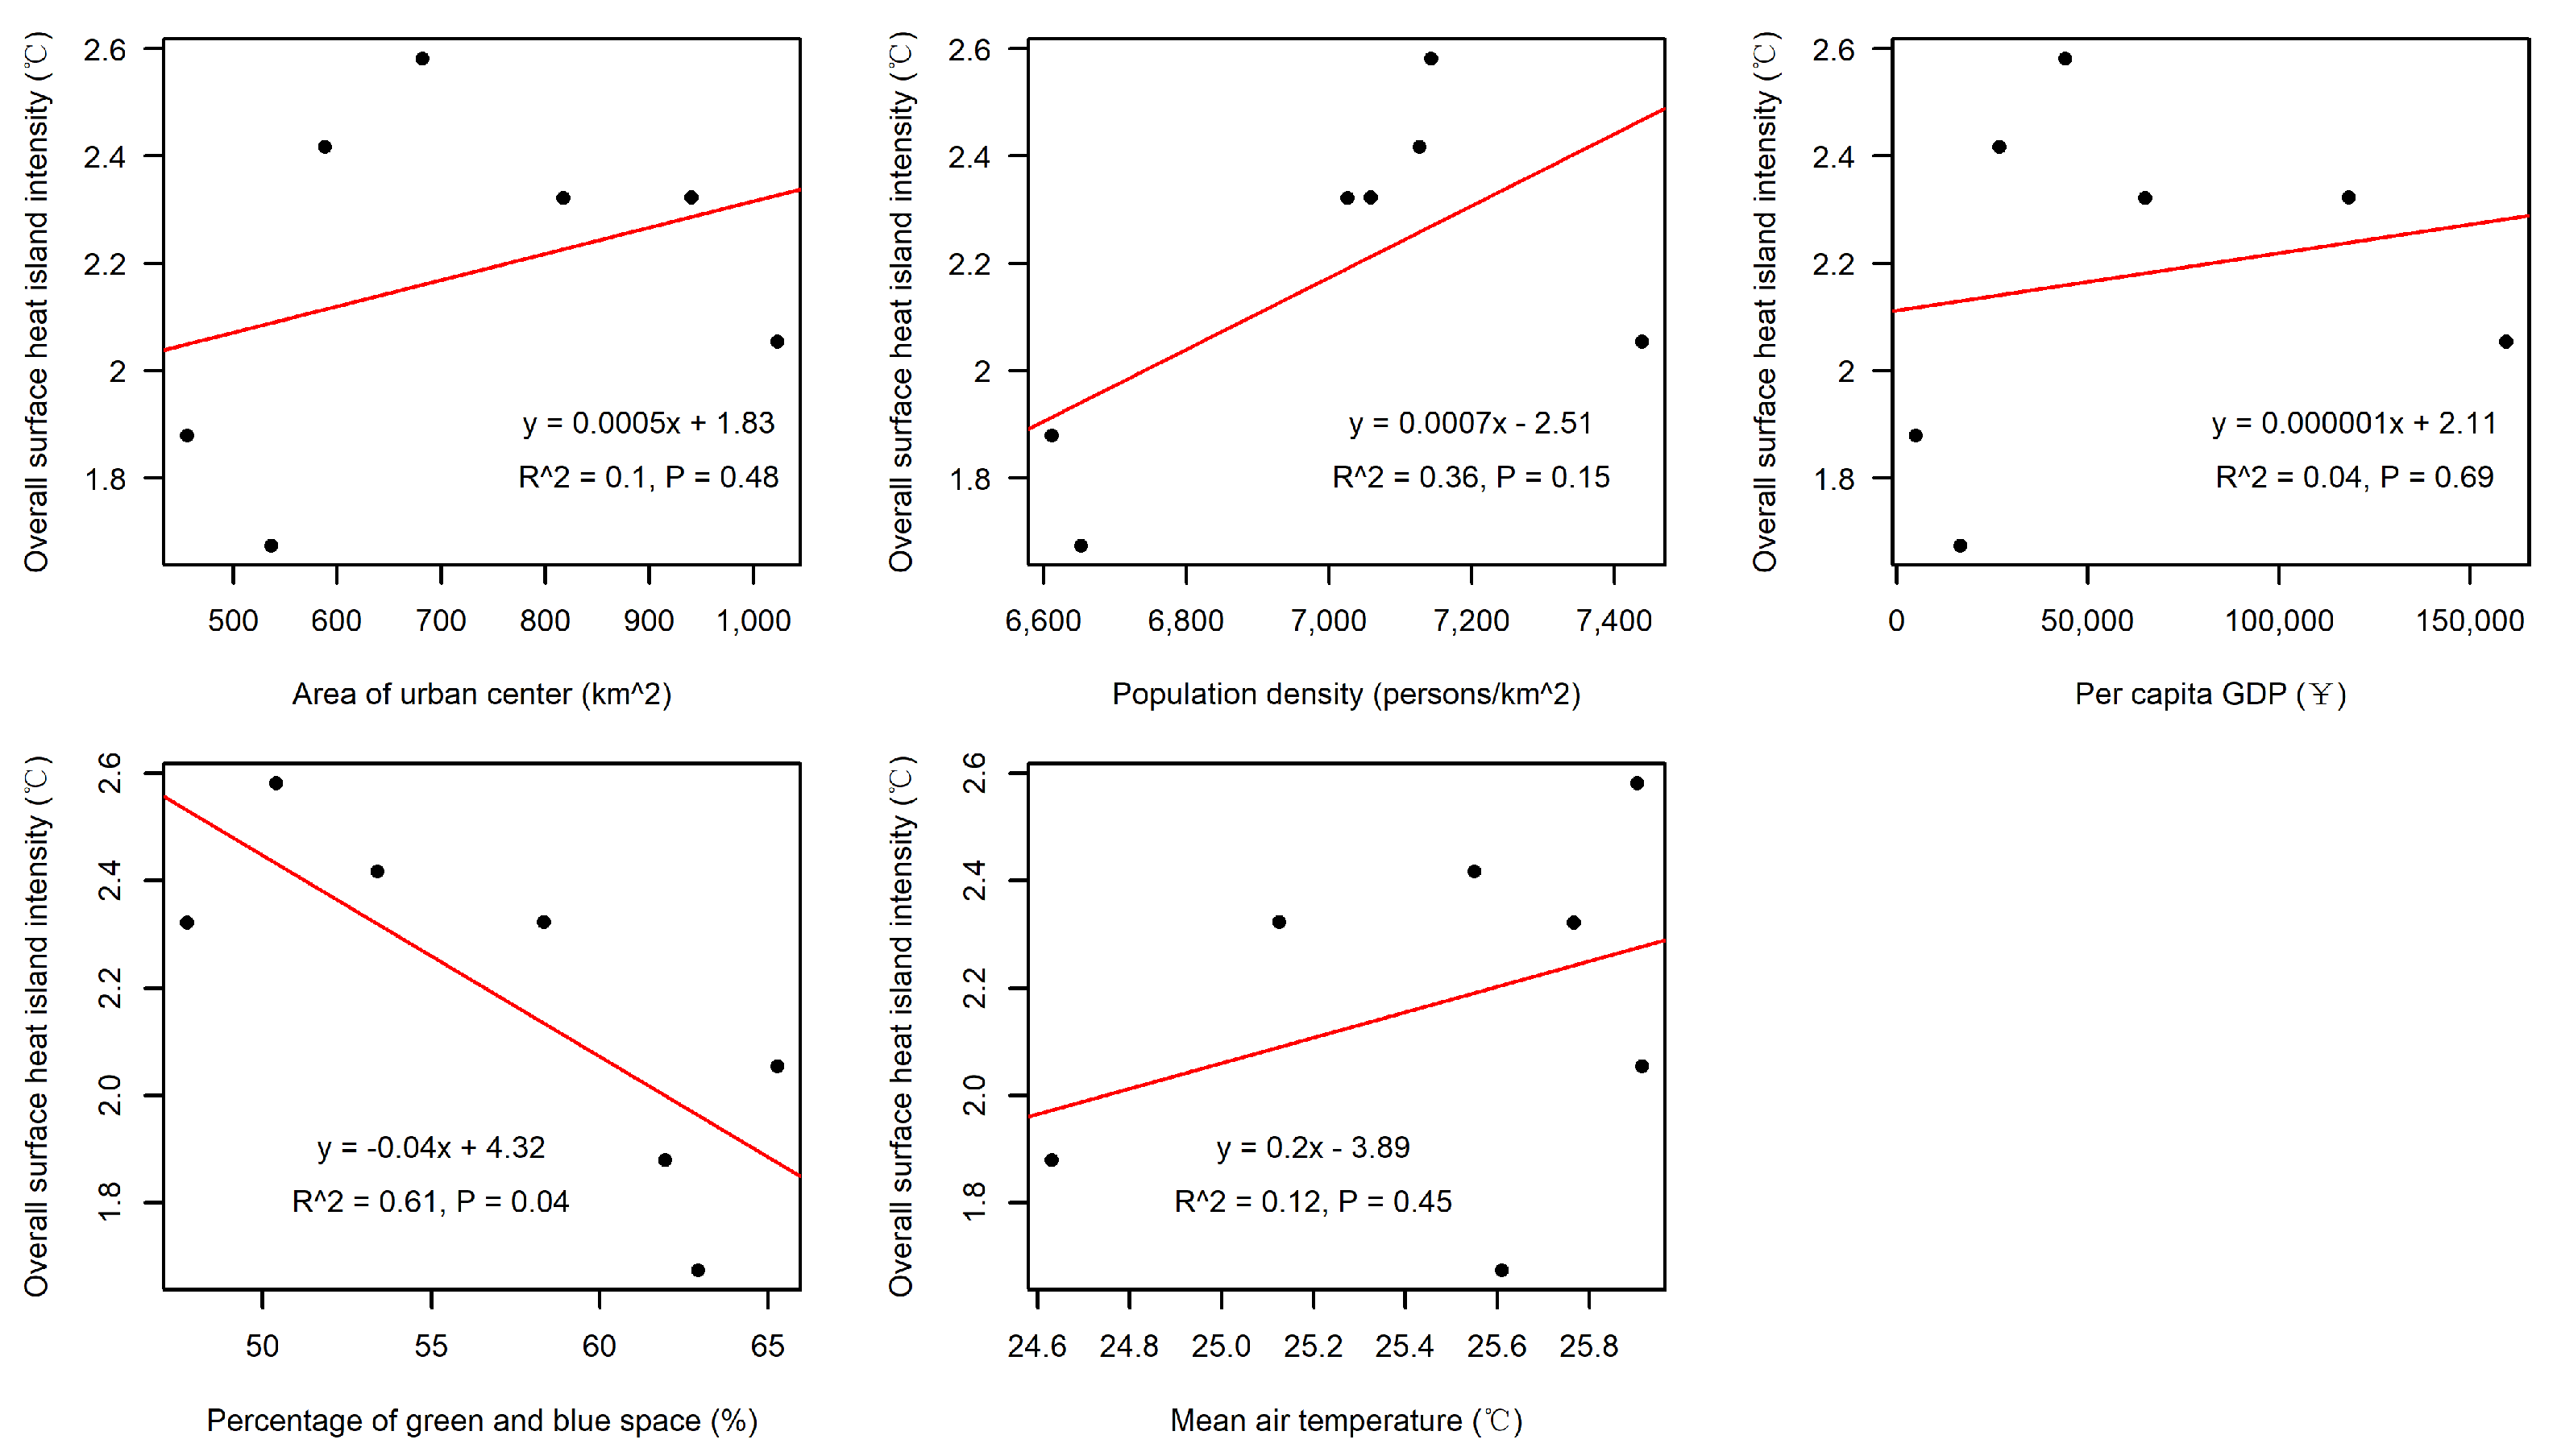
We exhibited the trend of several natural or socio-economic indicators to explore potential factors affecting urban thermal environment change (Figure 8). The area of the urban center, population density, and per capita GDP show an increasing trend from 1990 to 2020. The percentage of green and blue space shows a trend of first decreasing and then increasing. The mean air temperature between May and September first shows an increasing and then a decreasing trend. We then examined the relationships between these factors and the overall surface UHI intensity (Figure 9). It showed that the overall surface UHI intensity was positively correlated with the area of the urban center, population density, per capita GDP, and the mean air temperature. The percentage of green and blue space showed a negative linear relationship with the overall surface UHI intensity (Figure 9).
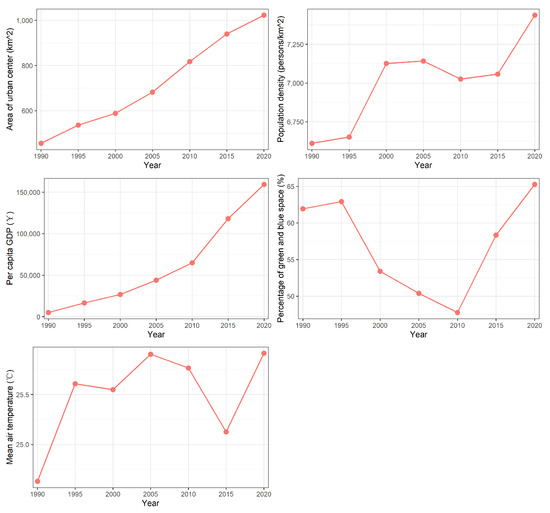
Figure 8.
Changes in the area of the urban center, population density, per capita GDP, percentage of green and blue space, and annual mean temperature from 1990 to 2020.
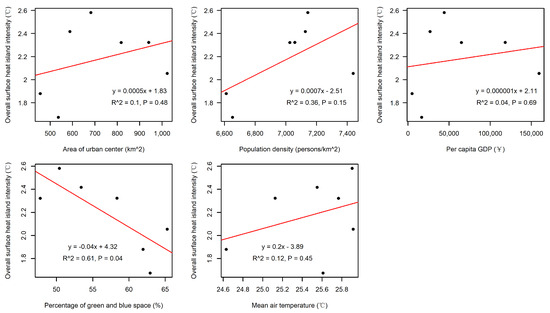
Figure 9.
Relationships between the overall surface urban heat island intensity and the area of the urban center, population density, per capita GDP, percentage of green and blue space, and annual mean temperature.
4. Discussion
4.1. Assessing Urban Thermal Environment Change with Landsat Time-Series Data
Due to the advantage of a long-term series of Landsat data, we can assess long-term changes in the urban surface thermal environment. In this study, we assessed long-term (i.e., 1990–2020) changes in the urban thermal environment in three steps by taking Nanjing, China, as an example, with the support of Landsat-derived long-term series land surface temperature data. In the first step, we assessed the long-term change in the overall surface UHI intensity at a city level. We performed a much longer time scale urban thermal environment analysis than many existing studies, which would be more helpful in discovering more details of temporal changes. We found a trend of first increasing and then decreasing in the overall surface UHI intensity in Nanjing from 1990 to 2020. The surface UHI intensity reveals the overall thermal conditions of urban center areas compared with its surrounding rural areas, and it has been quantified extensively at multiple scales [11,14,18,20]. Both the Landsat and MODIS remote sensing data have been used to quantify surface UHI intensity. The MODIS thermal remote sensing data have the advantage of very high temporal resolution, which can be useful for monitoring urban thermal environment change with shorter time intervals. However, those studies using MODIS data for surface UHI intensity change analysis have a relatively shorter study period, as MODIS land surface temperature products began in 2000 [36]. Landsat thermal remote sensing data provide broader coverage of historical data, thus having an advantage for longer periods (e.g., 30 years or more) for the change analysis of surface UHI intensity.
The overall surface UHI intensity is helpful in delineating the surface thermal condition of a city. Nevertheless, it does not provide a spatially explicit surface urban heat/cold island distribution pattern. Therefore, we performed a further step analysis. In the second step, we mapped the spatial distribution of surface urban heat/cold islands within the urban center boundary at a pixel or grid level. With this step, we can map the spatial pattern of urban heat/cold islands with more spatial details and high accuracy. Both Landsat and MODIS thermal remote sensing data have proven effective in mapping the overall surface UHI intensity [14,15,30], while there is a difference in the two kinds of data in the ability to characterize the spatially explicit pattern of surface urban heat/cold island distribution. The Landsat-derived land surface temperature data have a fine spatial resolution, which can effectively characterize the spatial patterns of surface urban heat/cold islands. In comparison, it is hard to map surface urban heat/cold island distribution with the MODIS land surface temperature data that have a coarse spatial resolution (1 km). With the support of long-term Landsat-derived land surface temperature data, we were able to map long-term changes in surface urban heat/cold island distribution at the 30 m pixel level.
In the last step, we analyzed the intensity at which urban residents are exposed to surface urban heat/cold islands. Many studies have mapped the urban thermal environment [11,12,13,14,15,16,17,18], few of them, however, have considered urban residents’ actual exposure to UHIs. With the population grid data, we were able to analyze the change in the exposure level of urban residents to surface UHIs. We presented the percentage of urban residents exposed to varied surface UHI intensity (Table 2) and found a mismatch between the supply and demand of urban cold islands. Nearly 20% of urban lands appear as cold islands (Figure 7), while only an average of 1.71% of urban residents are located in the cold island areas (Table 2).
4.2. The Potential Factors Affecting Urban Thermal Environment Change
Urban thermal environments might be affected by climate, surface characteristics, human activities, etc. [14,50,51]. In this study, we exhibited the trend of several natural or socio-economic indicators to explore potential factors affecting urban thermal environment change (Figure 8). We found that the overall surface UHI intensity has a linear positive relationship with the area of the urban center, population density, per capita GDP, and the mean air temperature. Our analysis also revealed that the percentage of green and blue space shows a significant linear negative correlation with the overall surface UHI intensity. These relationships could partially explain the changing trend of surface UHI intensity (i.e., an increasing trend from 1990 to 2005 and a decreasing trend from 2005 to 2020). The increasing trend in the urban built-up area, population density and mean air temperature, and the decreasing trend in the percentage of green and blue space might be the main drivers of the increased surface UHI intensity from 1990 to 2005. Yet, the decreasing trend of surface UHI intensity from 2005 to 2020 might be mainly caused by the increasing trend in the percentage of green and blue space and the decreasing trend in mean air temperature (Figure 8).
Our finding suggests that urban green and blue spaces play an important role in mitigating the overall surface UHI intensity, which agrees well with previous studies [52,53,54]. The near-infrared and red bands of Landsat images are highly correlated with the thermal band [55]. So, the NDVI (calculated with the near-infrared and red bands) was also highly correlated with land surface temperature (calculated with the thermal band), which explains the close relationship between urban vegetation and the surface UHI intensity. This confirms the effectiveness of green and blue spaces in mitigating surface UHI effects and the need to take relevant mitigation measures (e.g., to plan new green and blue spaces and increase the proportion of green and blue space in urban built-up areas). In addition to the quantity of urban green and blue spaces, the configuration of urban green and blue spaces is also important. On the one hand, optimizing the configuration of green and blue spaces can improve the overall UHI mitigation effect. For example, a study performed in Phoenix, Arizona, USA, has proven that significant cooling potentials can be achieved as a result of optimal green space placement [54]. On the other hand, optimizing the configuration of green and blue spaces can improve the mismatch between the supply and demand of urban cold islands found in this study. Therefore, our findings suggest that attention should be paid to the increase and optimal configuration of urban green and blue spaces in urban planning and management in terms of urban heat island effect mitigation to ensure sustainable urban development.
4.3. Limitations of This Study
Several limitations of this study should be noted. First, we used Landsat time-series data to assess urban thermal environment change because of the advantages of the long-term coverage and high spatial resolution of the Landsat data. Yet, the temporal resolution of Landsat-derived land surface temperature data is relatively lower than that of MODIS land surface temperature data. The lower temporal resolution of Landsat images might cause uncertainties in averaging Landsat land surface temperature in different years. We averaged Landsat-derived land surface temperature for three consecutive years to reduce the uncertainties. Nonetheless, there may still be insufficient valid observations in the peak growing season in some years (e.g., circa 1995 in this study), thereby increasing the uncertainty of the analysis. Future studies for years after 2000 may consider combining or fusing the Landsat and MODIS land surface temperature data to better characterize the urban thermal environment change at higher spatial and temporal resolutions. Second, we used the 100 m GHSL spatial population grid data to represent the spatial distribution of urban residents in Nanjing City, China, and this might introduce uncertainties in the urban heat/cold island exposure analysis. Future studies may consider finer resolution and more accurate modeling of urban population distribution to obtain more accurate urban heat/cold island exposure estimation. Third, there are multiple approaches to define suburban/rural areas in UHI intensity studies [14,24]. We defined the rural area as the 10 km buffer zones of urban built-up areas. Although this approach was widely used, a rural area defined in this simplified way may include satellite towns, which may cause deviations of the reference temperature. Future studies may consider exploring more details in the definition of rural areas in UHI intensity studies. Last, we only focused on Nanjing City as an example to assess long-term urban thermal environment change. The three steps used in this study can also be adapted for research in other cities. Future studies may investigate long-term thermal environment change in more cities to compare differences in the evolution of urban thermal environments between cities.
5. Conclusions
In this study, we assessed long-term (30 years) urban thermal environment change with the Landsat-derived time-series land surface temperature data by taking Nanjing, China, a rapidly urbanizing city, as an example. Specifically, we assessed the mean land surface temperature change within the urban center boundary and the overall surface UHI intensity from 1990 to 2020. We also delineated the spatial distribution of surface urban heat/cold islands within the urban center boundary and analyzed the urban residents exposed to surface UHI intensity. Our findings indicate that the overall surface UHI intensity in Nanjing showed a trend of first increasing and then decreasing from 1990 to 2020. This trend could be partially explained by the relationship between the surface UHI intensity and natural or socio-economic factors, especially the percentage of green and blue spaces. We delineated a detailed spatial distribution of urban heat/cold islands within the urban center boundary. It was observed that more than 65% of the urban residents have lived in areas with surface UHI intensity larger than 3.0 °C, and that the percentage of urban residents that have lived in areas with surface UHI intensity larger than 3.0 °C also followed a trend of first increasing and then decreasing from 1990 to 2020. The findings of this study can provide a reference for other studies on urban thermal environment changes and support urban thermal environment management and the formulation of thermal mitigation measures (e.g., how to properly distribute green and blue spaces for UHI mitigation during urban planning) to ensure sustainable urban development.
Author Contributions
Conceptualization, C.H. and W.O.; methodology, C.H.; software, C.H.; formal analysis, C.H. and Y.T. (Yan Tang); investigation, C.H.; resources, C.H.; data curation, C.H.; writing—original draft preparation, C.H.; writing—review and editing, Y.T. (Yan Tang), Y.W., Y.T. (Yu Tao), M.X., N.X., M.L., X.L., H.X. and W.O.; supervision, W.O.; funding acquisition, C.H. and W.O. All authors have read and agreed to the published version of the manuscript.
Funding
This research was funded by the Basic Research Program of Jiangsu Province (BK20231006), the China Postdoctoral Science Foundation (2023M731714), the National Natural Science Foundation of China (41971230, 42271106), and the Startup Foundation for Introducing Talent of Nanjing Agricultural University (040/804114).
Data Availability Statement
The raw data supporting the conclusions of this article will be made available by the authors on request.
Conflicts of Interest
The authors declare no conflicts of interest.
References
- United Nations Economic & Social Affairs. World Urbanization Prospect: The 2018 Revision; United Nations Economic & Social Affairs: New York, NY, USA, 2019. [Google Scholar]
- Peng, J.; Xie, P.; Liu, Y.; Ma, J. Urban Thermal Environment Dynamics and Associated Landscape Pattern Factors: A Case Study in the Beijing Metropolitan Region. Remote Sens. Environ. 2016, 173, 145–155. [Google Scholar] [CrossRef]
- Huang, C.; Xu, N. Quantifying Urban Expansion from 1985 to 2018 in Large Cities Worldwide. Geocarto Int. 2022, 37, 18356–18371. [Google Scholar] [CrossRef]
- Gao, Z.; Hou, Y.; Chen, W. Enhanced Sensitivity of the Urban Heat Island Effect to Summer Temperatures Induced by Urban Expansion. Environ. Res. Lett. 2019, 14, 094005. [Google Scholar] [CrossRef]
- Liu, H.; Cui, W.; Zhang, M. Exploring the Causal Relationship between Urbanization and Air Pollution: Evidence from China. Sustain. Cities Soc. 2022, 80, 103783. [Google Scholar] [CrossRef]
- McDonald, R.I.; Mansur, A.V.; Ascensão, F.; Colbert, M.; Crossman, K.; Elmqvist, T.; Gonzalez, A.; Güneralp, B.; Haase, D.; Hamann, M.; et al. Research Gaps in Knowledge of the Impact of Urban Growth on Biodiversity. Nat. Sustain. 2020, 3, 16–24. [Google Scholar] [CrossRef]
- Heaviside, C.; Vardoulakis, S.; Cai, X.-M. Attribution of Mortality to the Urban Heat Island during Heatwaves in the West Midlands, UK. Environ. Health 2016, 15, S27. [Google Scholar] [CrossRef]
- Li, X.; Zhou, Y.; Yu, S.; Jia, G.; Li, H.; Li, W. Urban Heat Island Impacts on Building Energy Consumption: A Review of Approaches and Findings. Energy 2019, 174, 407–419. [Google Scholar] [CrossRef]
- Zhou, D.; Xiao, J.; Bonafoni, S.; Berger, C.; Deilami, K.; Zhou, Y.; Frolking, S.; Yao, R.; Qiao, Z.; Sobrino, J.A. Satellite Remote Sensing of Surface Urban Heat Islands: Progress, Challenges, and Perspectives. Remote Sens. 2019, 11, 48. [Google Scholar] [CrossRef]
- Voogt, J.A.; Oke, T.R. Thermal Remote Sensing of Urban Climates. Remote Sens. Environ. 2003, 86, 370–384. [Google Scholar] [CrossRef]
- Clinton, N.; Gong, P. MODIS Detected Surface Urban Heat Islands and Sinks: Global Locations and Controls. Remote Sens. Environ. 2013, 134, 294–304. [Google Scholar] [CrossRef]
- Garuma, G.F. Tropical Surface Urban Heat Islands in East Africa. Sci. Rep. 2023, 13, 4509. [Google Scholar] [CrossRef] [PubMed]
- Li, H.; Zhou, Y.; Li, X.; Meng, L.; Wang, X.; Wu, S.; Sodoudi, S. A New Method to Quantify Surface Urban Heat Island Intensity. Sci. Total Environ. 2018, 624, 262–272. [Google Scholar] [CrossRef] [PubMed]
- Manoli, G.; Fatichi, S.; Schläpfer, M.; Yu, K.; Crowther, T.W.; Meili, N.; Burlando, P.; Katul, G.G.; Bou-Zeid, E. Magnitude of Urban Heat Islands Largely Explained by Climate and Population. Nature 2019, 573, 55–60. [Google Scholar] [CrossRef] [PubMed]
- Peng, S.; Piao, S.; Ciais, P.; Friedlingstein, P.; Ottle, C.; Bréon, F.-M.; Nan, H.; Zhou, L.; Myneni, R.B. Surface Urban Heat Island Across 419 Global Big Cities. Environ. Sci. Technol. 2012, 46, 696–703. [Google Scholar] [CrossRef] [PubMed]
- Schwaab, J.; Meier, R.; Mussetti, G.; Seneviratne, S.; Bürgi, C.; Davin, E.L. The Role of Urban Trees in Reducing Land Surface Temperatures in European Cities. Nat. Commun. 2021, 12, 6763. [Google Scholar] [CrossRef]
- Zhou, D.; Zhao, S.; Liu, S.; Zhang, L.; Zhu, C. Surface Urban Heat Island in China’s 32 Major Cities: Spatial Patterns and Drivers. Remote Sens. Environ. 2014, 152, 51–61. [Google Scholar] [CrossRef]
- Zhou, W.; Qian, Y.; Li, X.; Li, W.; Han, L. Relationships between Land Cover and the Surface Urban Heat Island: Seasonal Variability and Effects of Spatial and Thematic Resolution of Land Cover Data on Predicting Land Surface Temperatures. Landsc. Ecol. 2014, 29, 153–167. [Google Scholar] [CrossRef]
- Meyer, H.; Katurji, M.; Appelhans, T.; Müller, M.U.; Nauss, T.; Roudier, P.; Zawar-Reza, P. Mapping Daily Air Temperature for Antarctica Based on MODIS LST. Remote Sens. 2016, 8, 732. [Google Scholar] [CrossRef]
- Dewan, A.; Kiselev, G.; Botje, D.; Mahmud, G.I.; Bhuian, M.H.; Hassan, Q.K. Surface Urban Heat Island Intensity in Five Major Cities of Bangladesh: Patterns, Drivers and Trends. Sustain. Cities Soc. 2021, 71, 102926. [Google Scholar] [CrossRef]
- Morabito, M.; Crisci, A.; Guerri, G.; Messeri, A.; Congedo, L.; Munafò, M. Surface Urban Heat Islands in Italian Metropolitan Cities: Tree Cover and Impervious Surface Influences. Sci. Total Environ. 2021, 751, 142334. [Google Scholar] [CrossRef]
- Peng, X.; Zhou, Y.; Fu, X.; Xu, J. Study on the Spatial-Temporal Pattern and Evolution of Surface Urban Heat Island in 180 Shrinking Cities in China. Sustain. Cities Soc. 2022, 84, 104018. [Google Scholar] [CrossRef]
- Wang, Z.; Meng, Q.; Allam, M.; Hu, D.; Zhang, L.; Menenti, M. Environmental and Anthropogenic Drivers of Surface Urban Heat Island Intensity: A Case-Study in the Yangtze River Delta, China. Ecol. Indic. 2021, 128, 107845. [Google Scholar] [CrossRef]
- Liu, H.; He, B.; Gao, S.; Zhan, Q.; Yang, C. Influence of Non-Urban Reference Delineation on Trend Estimate of Surface Urban Heat Island Intensity: A Comparison of Seven Methods. Remote Sens. Environ. 2023, 296, 113735. [Google Scholar] [CrossRef]
- Ali, J.M.; Marsh, S.H.; Smith, M.J. A Comparison between London and Baghdad Surface Urban Heat Islands and Possible Engineering Mitigation Solutions. Sustain. Cities Soc. 2017, 29, 159–168. [Google Scholar] [CrossRef]
- Bhang, K.J.; Park, S.-S. Evaluation of the Surface Temperature Variation With Surface Settings on the Urban Heat Island in Seoul, Korea, Using Landsat-7 ETM+ and SPOT. IEEE Geosci. Remote Sens. Lett. 2009, 6, 708–712. [Google Scholar] [CrossRef]
- Cao, X.; Onishi, A.; Chen, J.; Imura, H. Quantifying the Cool Island Intensity of Urban Parks Using ASTER and IKONOS Data. Landsc. Urban Plan. 2010, 96, 224–231. [Google Scholar] [CrossRef]
- Connors, J.P.; Galletti, C.S.; Chow, W.T.L. Landscape Configuration and Urban Heat Island Effects: Assessing the Relationship between Landscape Characteristics and Land Surface Temperature in Phoenix, Arizona. Landsc. Ecol. 2013, 28, 271–283. [Google Scholar] [CrossRef]
- Hou, H.; Estoque, R.C. Detecting Cooling Effect of Landscape from Composition and Configuration: An Urban Heat Island Study on Hangzhou. Urban For. Urban Green. 2020, 53, 126719. [Google Scholar] [CrossRef]
- Sultana, S.; Satyanarayana, A.N.V. Assessment of Urbanisation and Urban Heat Island Intensities Using Landsat Imageries during 2000–2018 over a Sub-Tropical Indian City. Sustain. Cities Soc. 2020, 52, 101846. [Google Scholar] [CrossRef]
- Weng, Q.; Lu, D.; Schubring, J. Estimation of Land Surface Temperature–Vegetation Abundance Relationship for Urban Heat Island Studies. Remote Sens. Environ. 2004, 89, 467–483. [Google Scholar] [CrossRef]
- Yu, Z.; Yao, Y.; Yang, G.; Wang, X.; Vejre, H. Spatiotemporal Patterns and Characteristics of Remotely Sensed Region Heat Islands during the Rapid Urbanization (1995–2015) of Southern China. Sci. Total Environ. 2019, 674, 242–254. [Google Scholar] [CrossRef]
- Yuan, F.; Bauer, M.E. Comparison of Impervious Surface Area and Normalized Difference Vegetation Index as Indicators of Surface Urban Heat Island Effects in Landsat Imagery. Remote Sens. Environ. 2007, 106, 375–386. [Google Scholar] [CrossRef]
- Zhao, Z.; Sharifi, A.; Dong, X.; Shen, L.; He, B.-J. Spatial Variability and Temporal Heterogeneity of Surface Urban Heat Island Patterns and the Suitability of Local Climate Zones for Land Surface Temperature Characterization. Remote Sens. 2021, 13, 4338. [Google Scholar] [CrossRef]
- Zhang, M.; Dong, S.; Cheng, H.; Li, F. Spatio-Temporal Evolution of Urban Thermal Environment and Its Driving Factors: Case Study of Nanjing, China. PLoS ONE 2021, 16, e0246011. [Google Scholar] [CrossRef] [PubMed]
- Reiners, P.; Sobrino, J.; Kuenzer, C. Satellite-Derived Land Surface Temperature Dynamics in the Context of Global Change—A Review. Remote Sens. 2023, 15, 1857. [Google Scholar] [CrossRef]
- Huang, C.; Yang, J.; Clinton, N.; Yu, L.; Huang, H.; Dronova, I.; Jin, J. Mapping the Maximum Extents of Urban Green Spaces in 1039 Cities Using Dense Satellite Images. Environ. Res. Lett. 2021, 16, 064072. [Google Scholar] [CrossRef]
- Hou, H.; Su, H.; Liu, K.; Li, X.; Chen, S.; Wang, W.; Lin, J. Driving Forces of UHI Changes in China’s Major Cities from the Perspective of Land Surface Energy Balance. Sci. Total Environ. 2022, 829, 154710. [Google Scholar] [CrossRef]
- Hu, J.; Yang, Y.; Zhou, Y.; Zhang, T.; Ma, Z.; Meng, X. Spatial Patterns and Temporal Variations of Footprint and Intensity of Surface Urban Heat Island in 141 China Cities. Sustain. Cities Soc. 2022, 77, 103585. [Google Scholar] [CrossRef]
- Yao, R.; Wang, L.; Huang, X.; Niu, Z.; Liu, F.; Wang, Q. Temporal Trends of Surface Urban Heat Islands and Associated Determinants in Major Chinese Cities. Sci. Total Environ. 2017, 609, 742–754. [Google Scholar] [CrossRef]
- National Bureau of Statistics of China. China City Statistical Yearbook; China Statistics Press: Beijing, China, 2021.
- Schiavina, M.; Melchiorri, M.; Pesaresi, M. GHS-SMOD R2023A—GHS Settlement Layers, Application of the Degree of Urbanisation Methodology (Stage I) to GHS-POP R2023A and GHS-BUILT-S R2023A, Multitemporal (1975–2030). Eur. Comm. Jt. Res. Cent. 2023. [Google Scholar] [CrossRef]
- Gorelick, N.; Hancher, M.; Dixon, M.; Ilyushchenko, S.; Thau, D.; Moore, R. Google Earth Engine: Planetary-Scale Geospatial Analysis for Everyone. Remote Sens. Environ. 2017, 202, 18–27. [Google Scholar] [CrossRef]
- Ermida, S.L.; Soares, P.; Mantas, V.; Göttsche, F.-M.; Trigo, I.F. Google Earth Engine Open-Source Code for Land Surface Temperature Estimation from the Landsat Series. Remote Sens. 2020, 12, 1471. [Google Scholar] [CrossRef]
- European Commission. GHSL Data Package. 2023. Available online: https://ghsl.jrc.ec.europa.eu/documents/GHSL_Data_Package_2023.pdf?t=1683540422 (accessed on 12 October 2023).
- Schiavina, M.; Freire, S.; Carioli, A.; MacManus, K. GHS-POP R2023A—GHS Population Grid Multitemporal (1975–2030). Eur. Comm. Jt. Res. Cent. 2023. [Google Scholar] [CrossRef]
- Clinton, N.; Stuhlmacher, M.; Miles, A.; Uludere Aragon, N.; Wagner, M.; Georgescu, M.; Herwig, C.; Gong, P. A Global Geospatial Ecosystem Services Estimate of Urban Agriculture. Earth’s Future 2018, 6, 40–60. [Google Scholar] [CrossRef]
- Pekel, J.-F.; Cottam, A.; Gorelick, N.; Belward, A.S. High-Resolution Mapping of Global Surface Water and Its Long-Term Changes. Nature 2016, 540, 418–422. [Google Scholar] [CrossRef] [PubMed]
- Hersbach, H.; Bell, B.; Berrisford, P.; Hirahara, S.; Horányi, A.; Muñoz-Sabater, J.; Nicolas, J.; Peubey, C.; Radu, R.; Schepers, D.; et al. The ERA5 Global Reanalysis. Q. J. R. Meteorol. Soc. 2020, 146, 1999–2049. [Google Scholar] [CrossRef]
- Li, X.; Zhou, W. Spatial Patterns and Driving Factors of Surface Urban Heat Island Intensity: A Comparative Study for Two Agriculture-Dominated Regions in China and the USA. Sustain. Cities Soc. 2019, 48, 101518. [Google Scholar] [CrossRef]
- Si, M.; Li, Z.-L.; Tang, B.-H.; Liu, X.; Nerry, F. Spatial Heterogeneity of Driving Factors-Induced Impacts for Global Long-Term Surface Urban Heat Island. Int. J. Remote Sens. 2023, 1–21. [Google Scholar] [CrossRef]
- Gunawardena, K.R.; Wells, M.J.; Kershaw, T. Utilising Green and Bluespace to Mitigate Urban Heat Island Intensity. Sci. Total Environ. 2017, 584, 1040–1055. [Google Scholar] [CrossRef]
- Peng, J.; Liu, Q.; Xu, Z.; Lyu, D.; Du, Y.; Qiao, R.; Wu, J. How to Effectively Mitigate Urban Heat Island Effect? A Perspective of Waterbody Patch Size Threshold. Landsc. Urban Plan. 2020, 202, 103873. [Google Scholar] [CrossRef]
- Zhang, Y.; Murray, A.T.; Turner, B.L. Optimizing Green Space Locations to Reduce Daytime and Nighttime Urban Heat Island Effects in Phoenix, Arizona. Landsc. Urban Plan. 2017, 165, 162–171. [Google Scholar] [CrossRef]
- Southworth, J. An Assessment of Landsat TM Band 6 Thermal Data for Analysing Land Cover in Tropical Dry Forest Regions. Int. J. Remote Sens. 2004, 25, 689–706. [Google Scholar] [CrossRef]

Disclaimer/Publisher’s Note: The statements, opinions and data contained in all publications are solely those of the individual author(s) and contributor(s) and not of MDPI and/or the editor(s). MDPI and/or the editor(s) disclaim responsibility for any injury to people or property resulting from any ideas, methods, instructions or products referred to in the content. |
© 2024 by the authors. Licensee MDPI, Basel, Switzerland. This article is an open access article distributed under the terms and conditions of the Creative Commons Attribution (CC BY) license (https://creativecommons.org/licenses/by/4.0/).