Author Contributions
Conceptualization, M.G. and J.B.; methodology, M.G.; software, M.G. and J.B.; formal analysis, M.G.; writing—original draft preparation, M.G.; writing—review and editing, M.G. and J.B.; visualization, M.G. All authors have read and agreed to the published version of the manuscript.
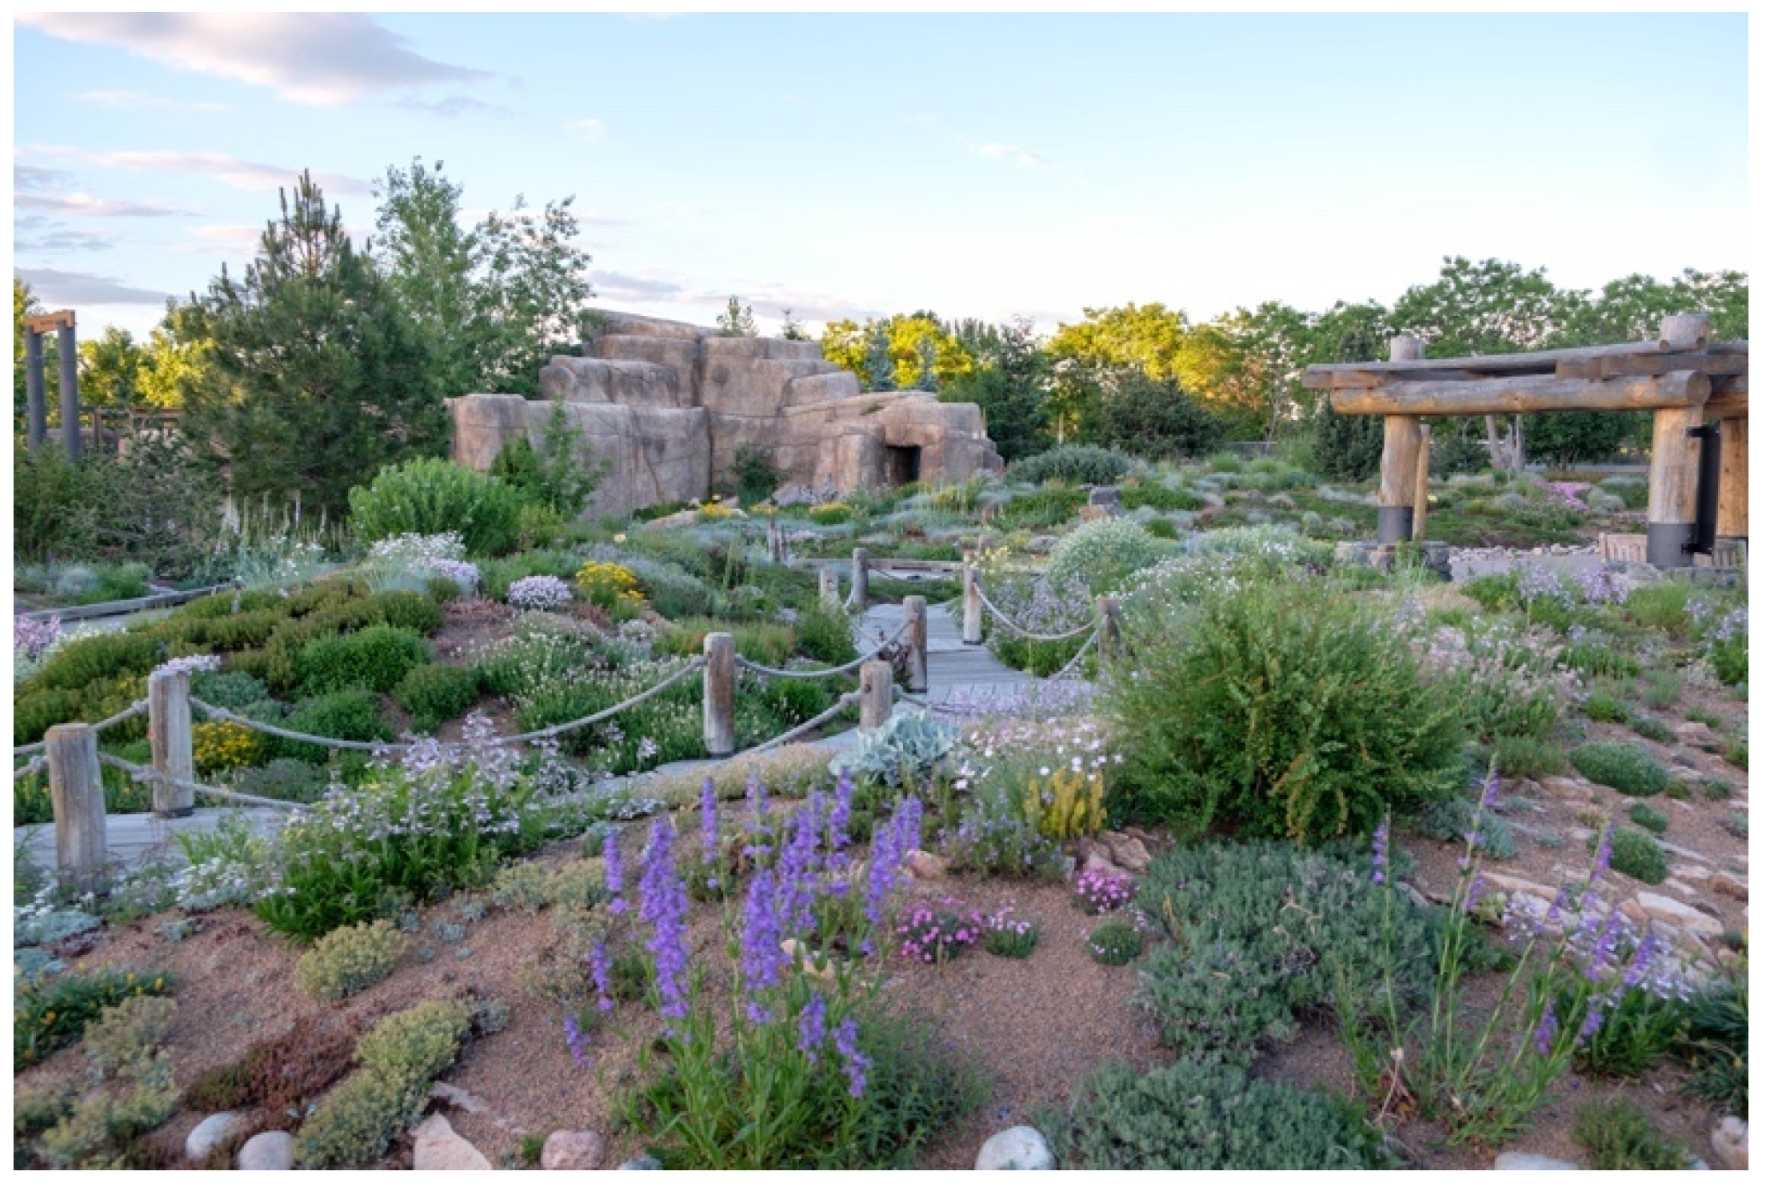
Figure 1.
The mixed intensive green roof site at Denver Botanic Gardens.
Figure 1.
The mixed intensive green roof site at Denver Botanic Gardens.
Figure 2.
The extensive green roof site at Denver Botanic Gardens.
Figure 2.
The extensive green roof site at Denver Botanic Gardens.
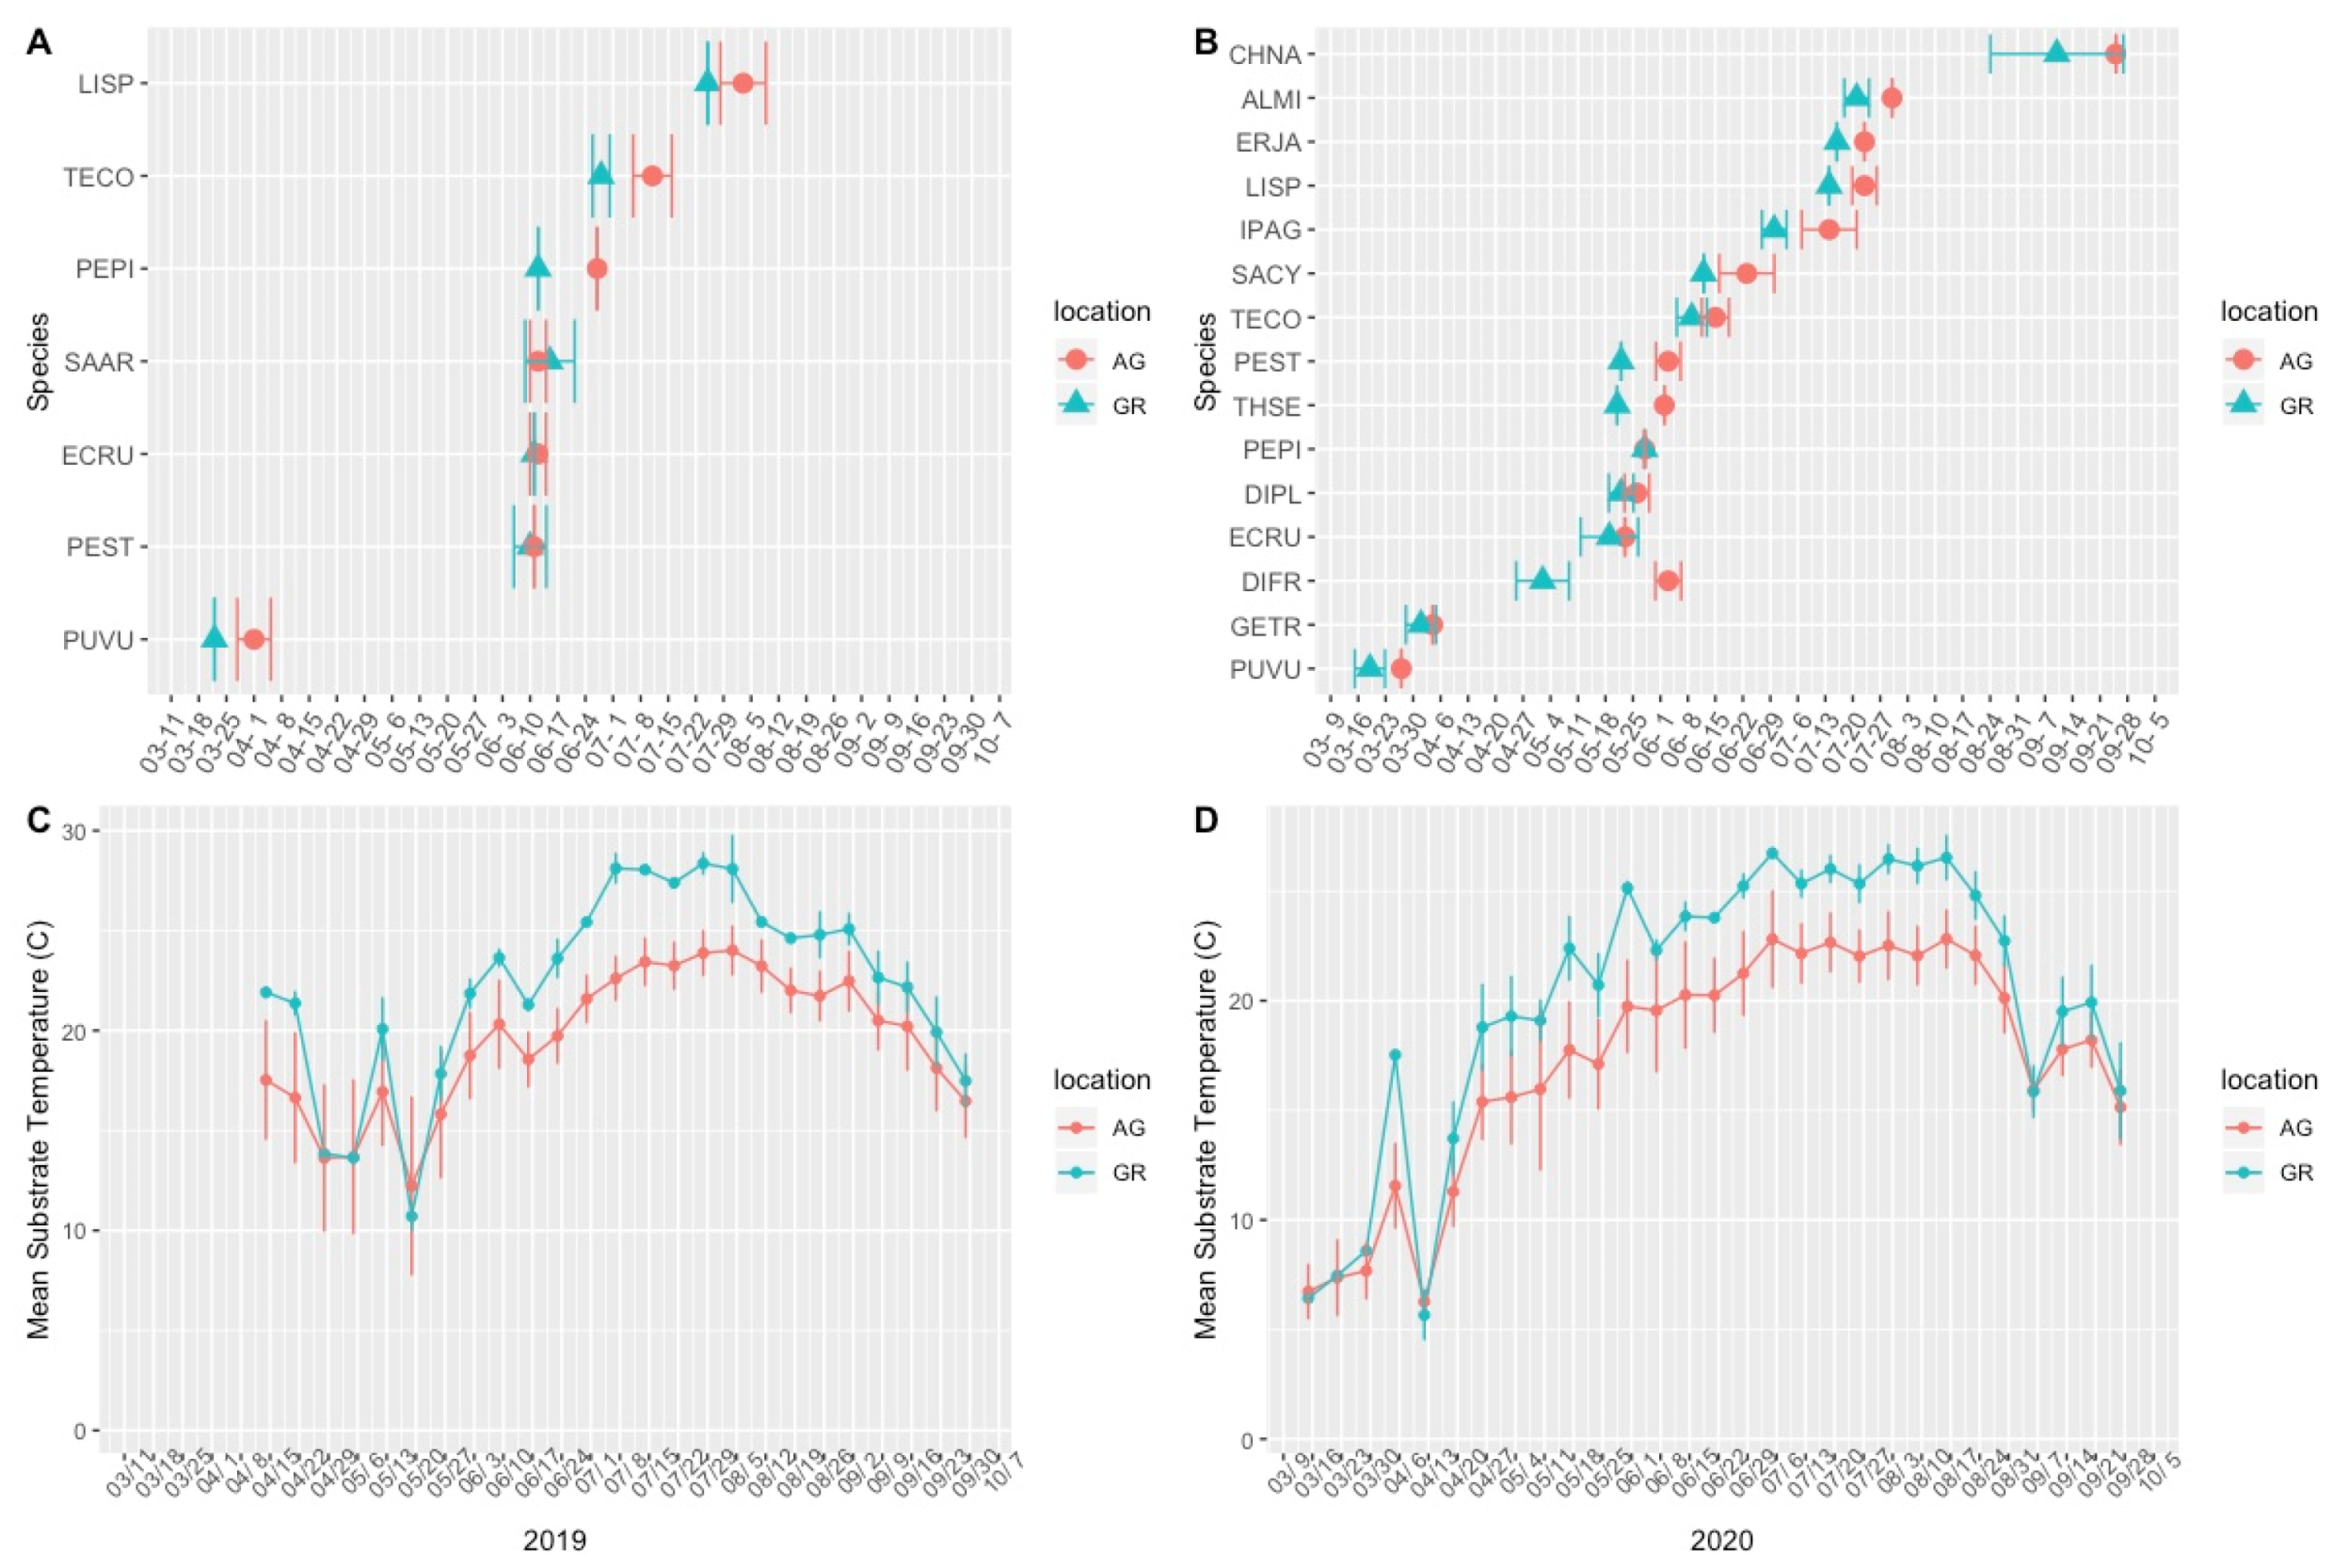
Figure 3.
Mean first flowering date in the 2019 (A) and 2020 (B) growing seasons and mean substrate temperature during the 2019 (C) and 2020 (D) growing seasons. Error bars represent the standard deviations (+/−) of the means. AG = ground level, GR = green roof.
Figure 3.
Mean first flowering date in the 2019 (A) and 2020 (B) growing seasons and mean substrate temperature during the 2019 (C) and 2020 (D) growing seasons. Error bars represent the standard deviations (+/−) of the means. AG = ground level, GR = green roof.
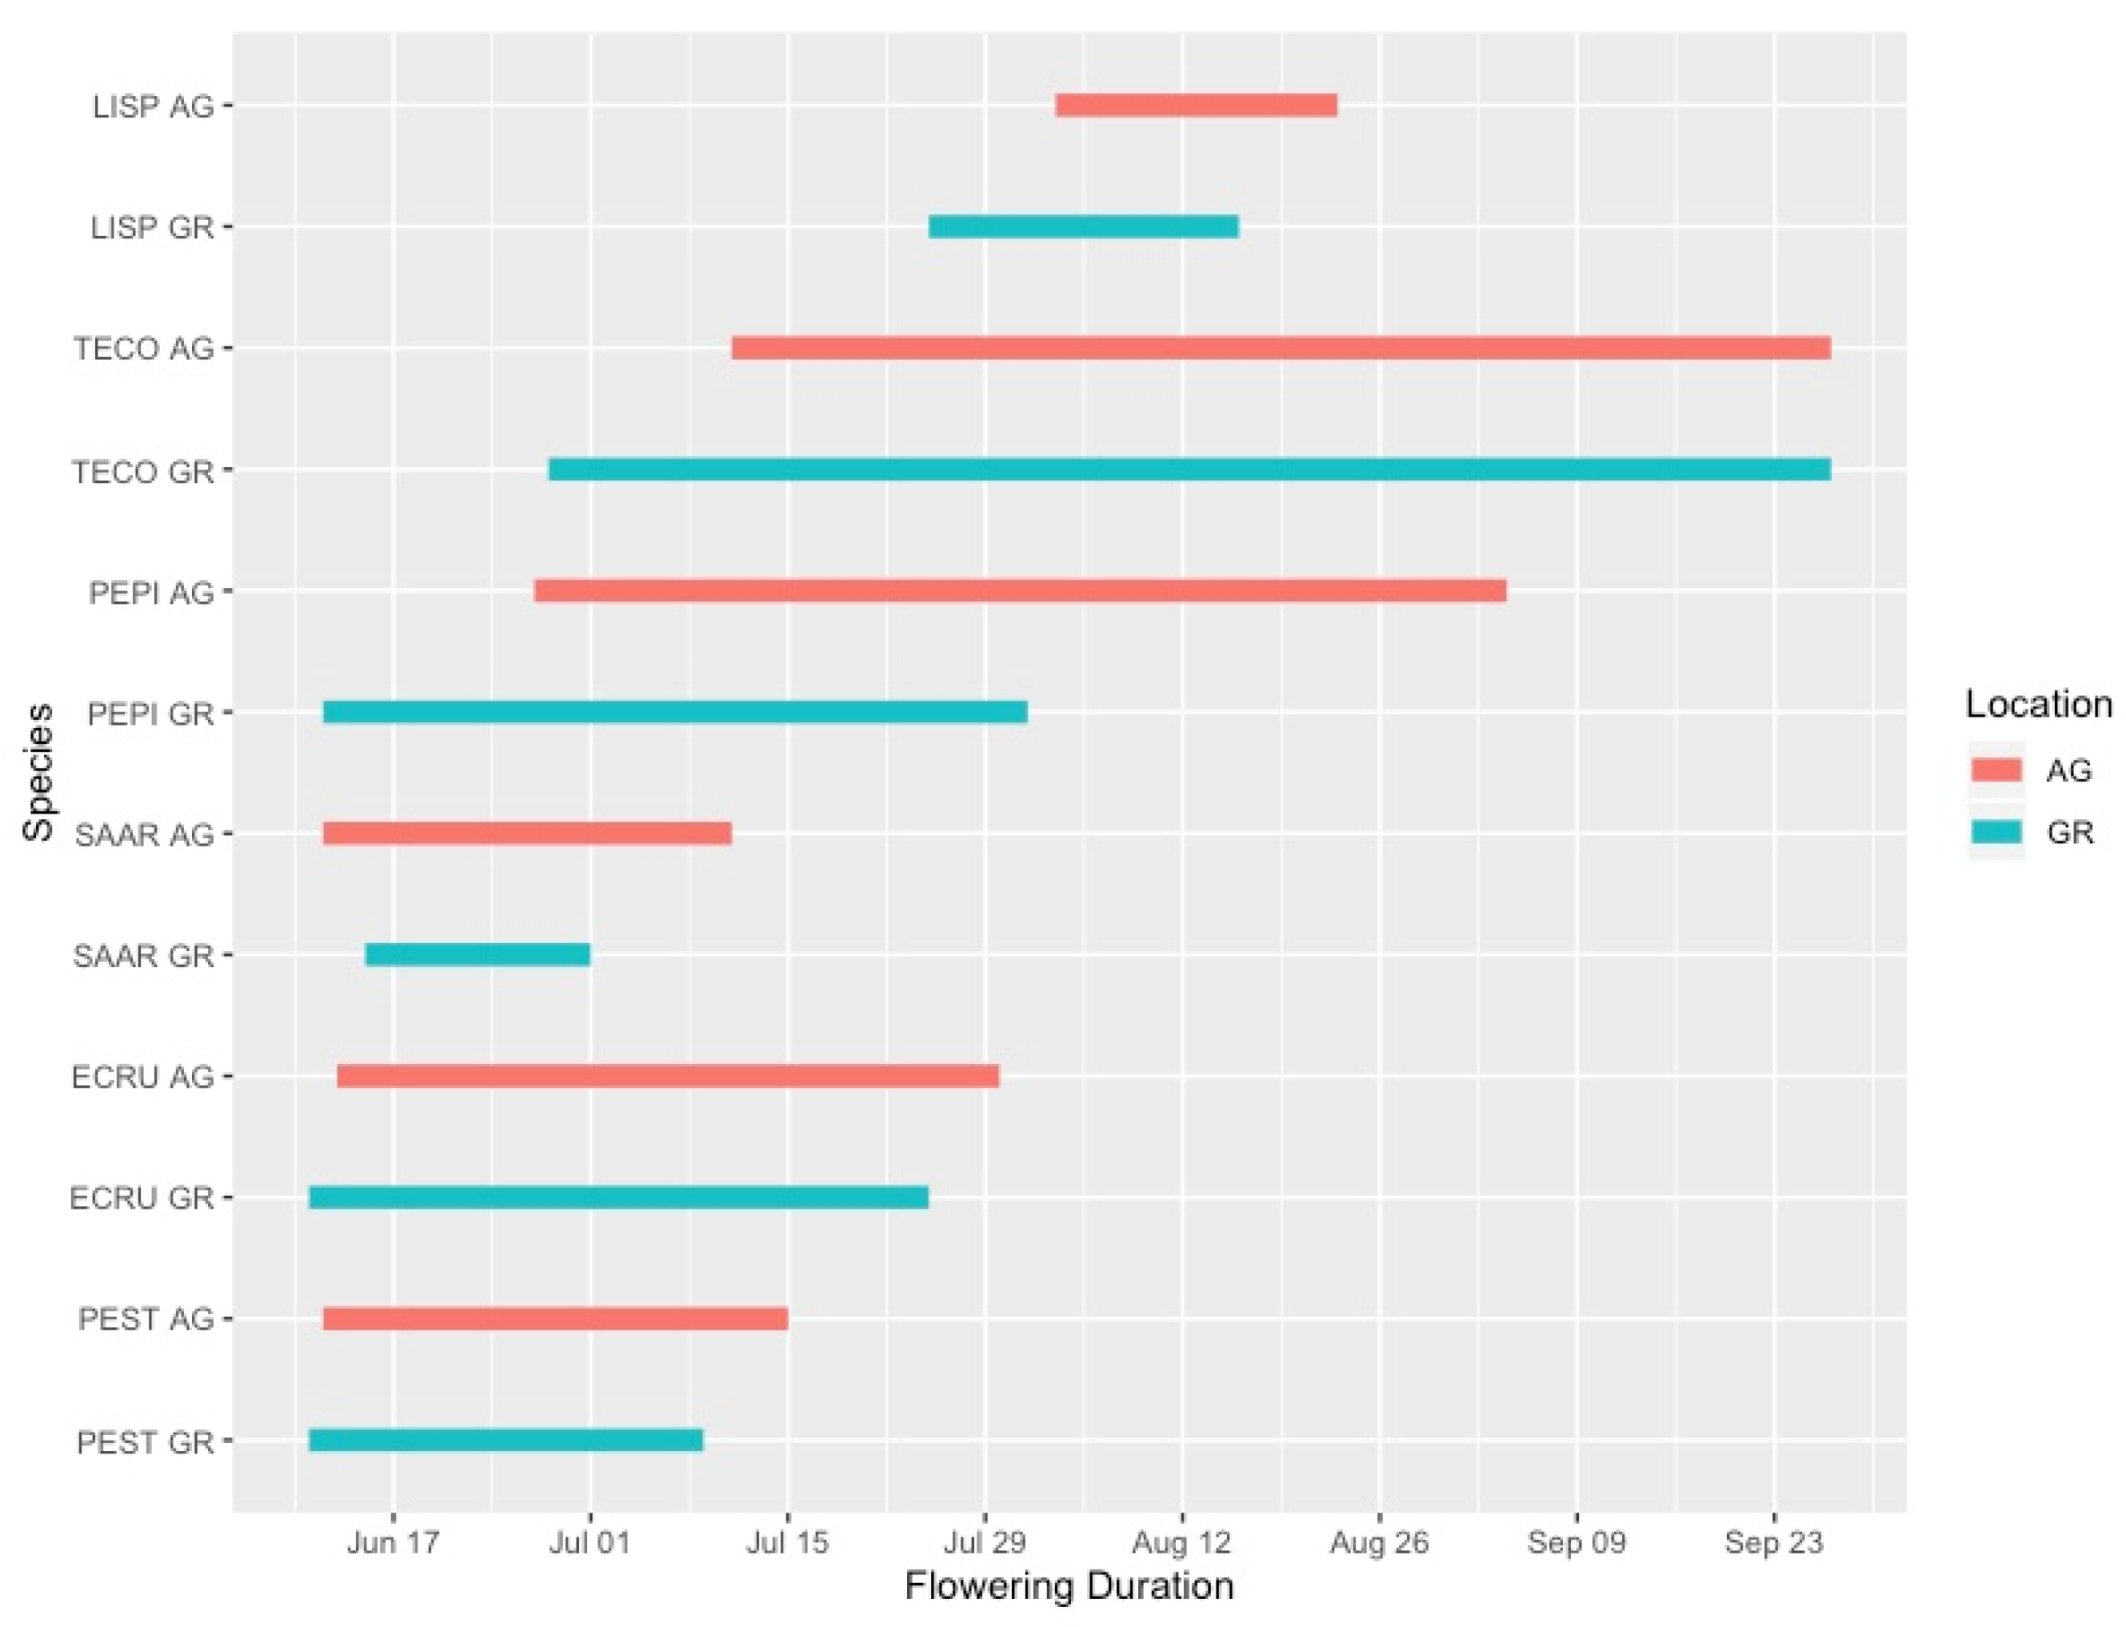
Figure 4.
Flowering phenology of observed plant taxa during the 2019 growing season. AG = ground level, GR = green roof.
Figure 4.
Flowering phenology of observed plant taxa during the 2019 growing season. AG = ground level, GR = green roof.
Figure 5.
Flowering phenology of observed plant taxa during the 2020 growing season. AG = ground level, GR = green roof.
Figure 5.
Flowering phenology of observed plant taxa during the 2020 growing season. AG = ground level, GR = green roof.
Figure 6.
Total number of observed flowers (normalized by plant size) during the 2019 (A) and 2020 (B) growing seasons on the green roofs compared to ground level. AG = ground level, GR = green roof.
Figure 6.
Total number of observed flowers (normalized by plant size) during the 2019 (A) and 2020 (B) growing seasons on the green roofs compared to ground level. AG = ground level, GR = green roof.
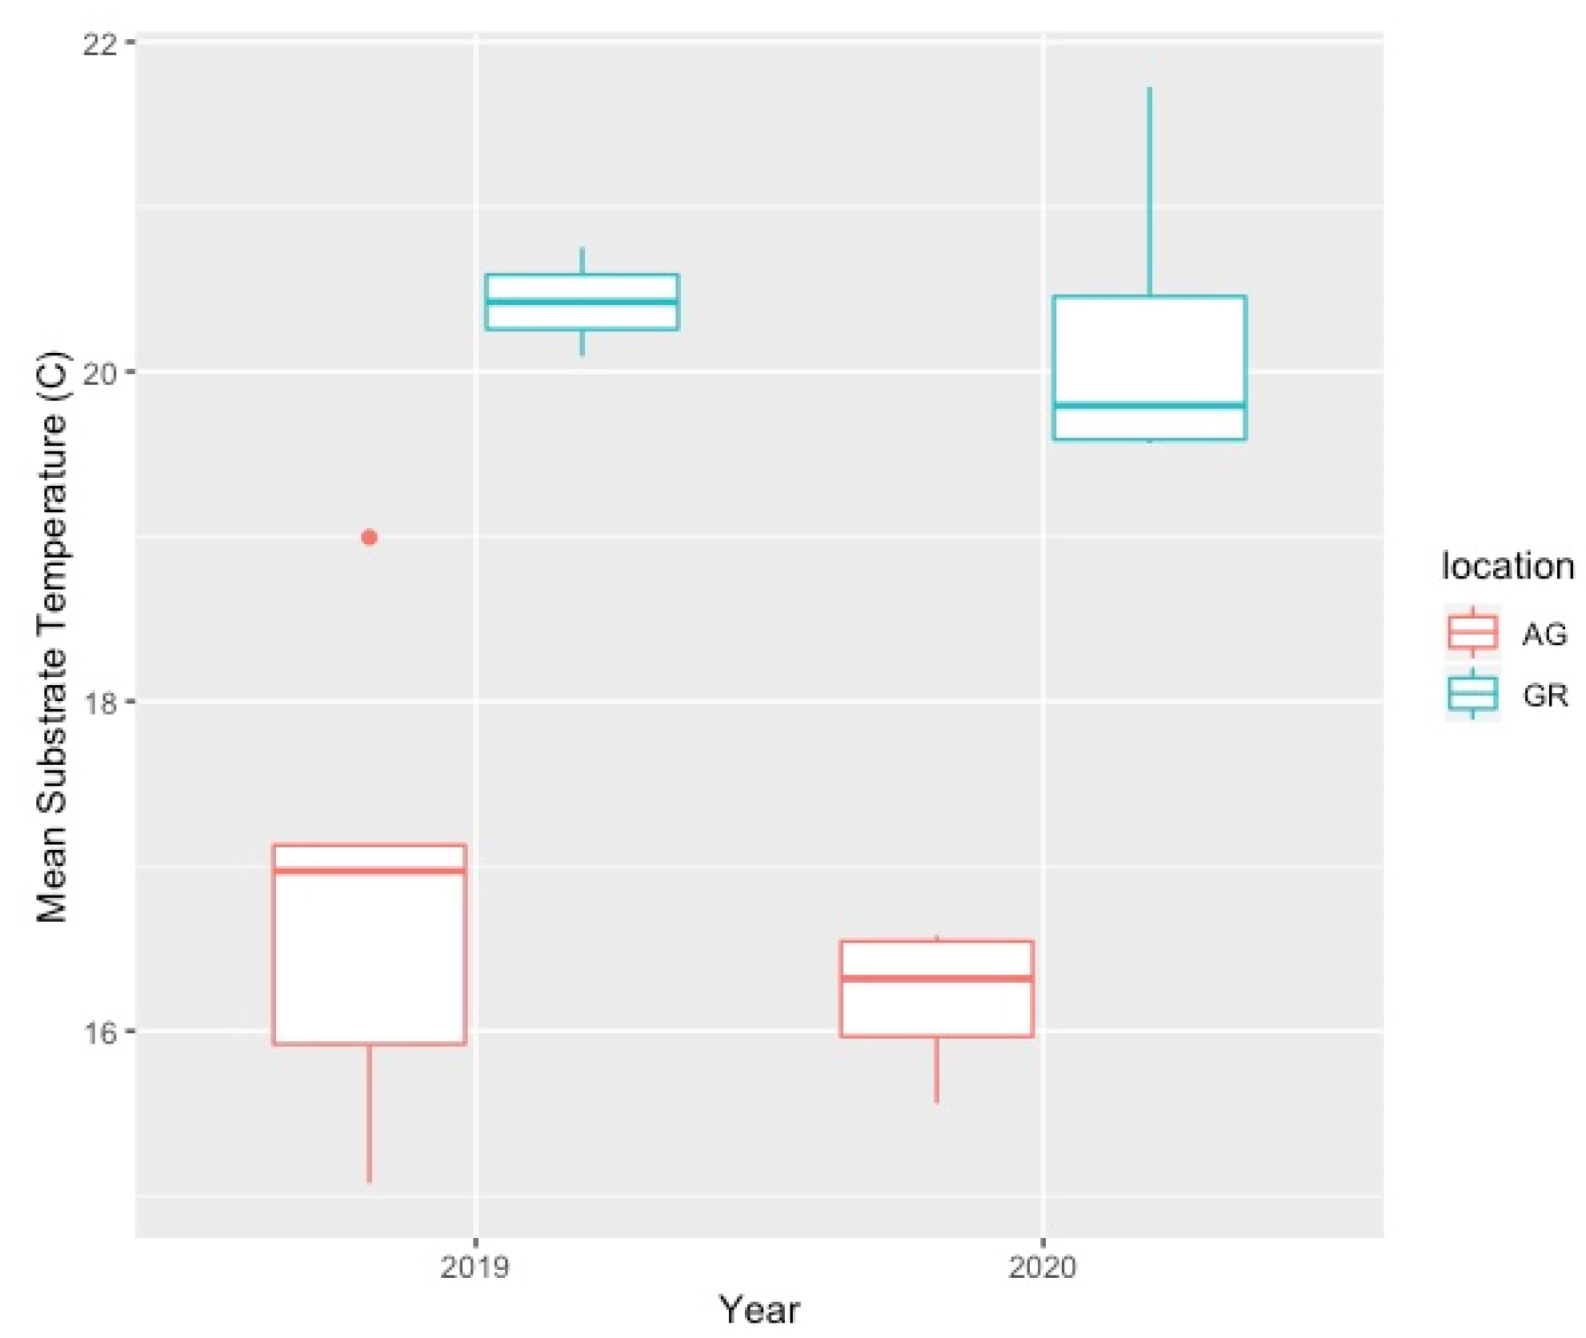
Figure 7.
Comparison of green roof and ground-level mean substrate temperature (°C) during the growing season (Apr–Oct). AG = ground level, GR = green roof.
Figure 7.
Comparison of green roof and ground-level mean substrate temperature (°C) during the growing season (Apr–Oct). AG = ground level, GR = green roof.
Figure 8.
Substrate temperature on the intensive green roof compared to ground level during the 2020 growing season. AG = ground level, GR = green roof.
Figure 8.
Substrate temperature on the intensive green roof compared to ground level during the 2020 growing season. AG = ground level, GR = green roof.
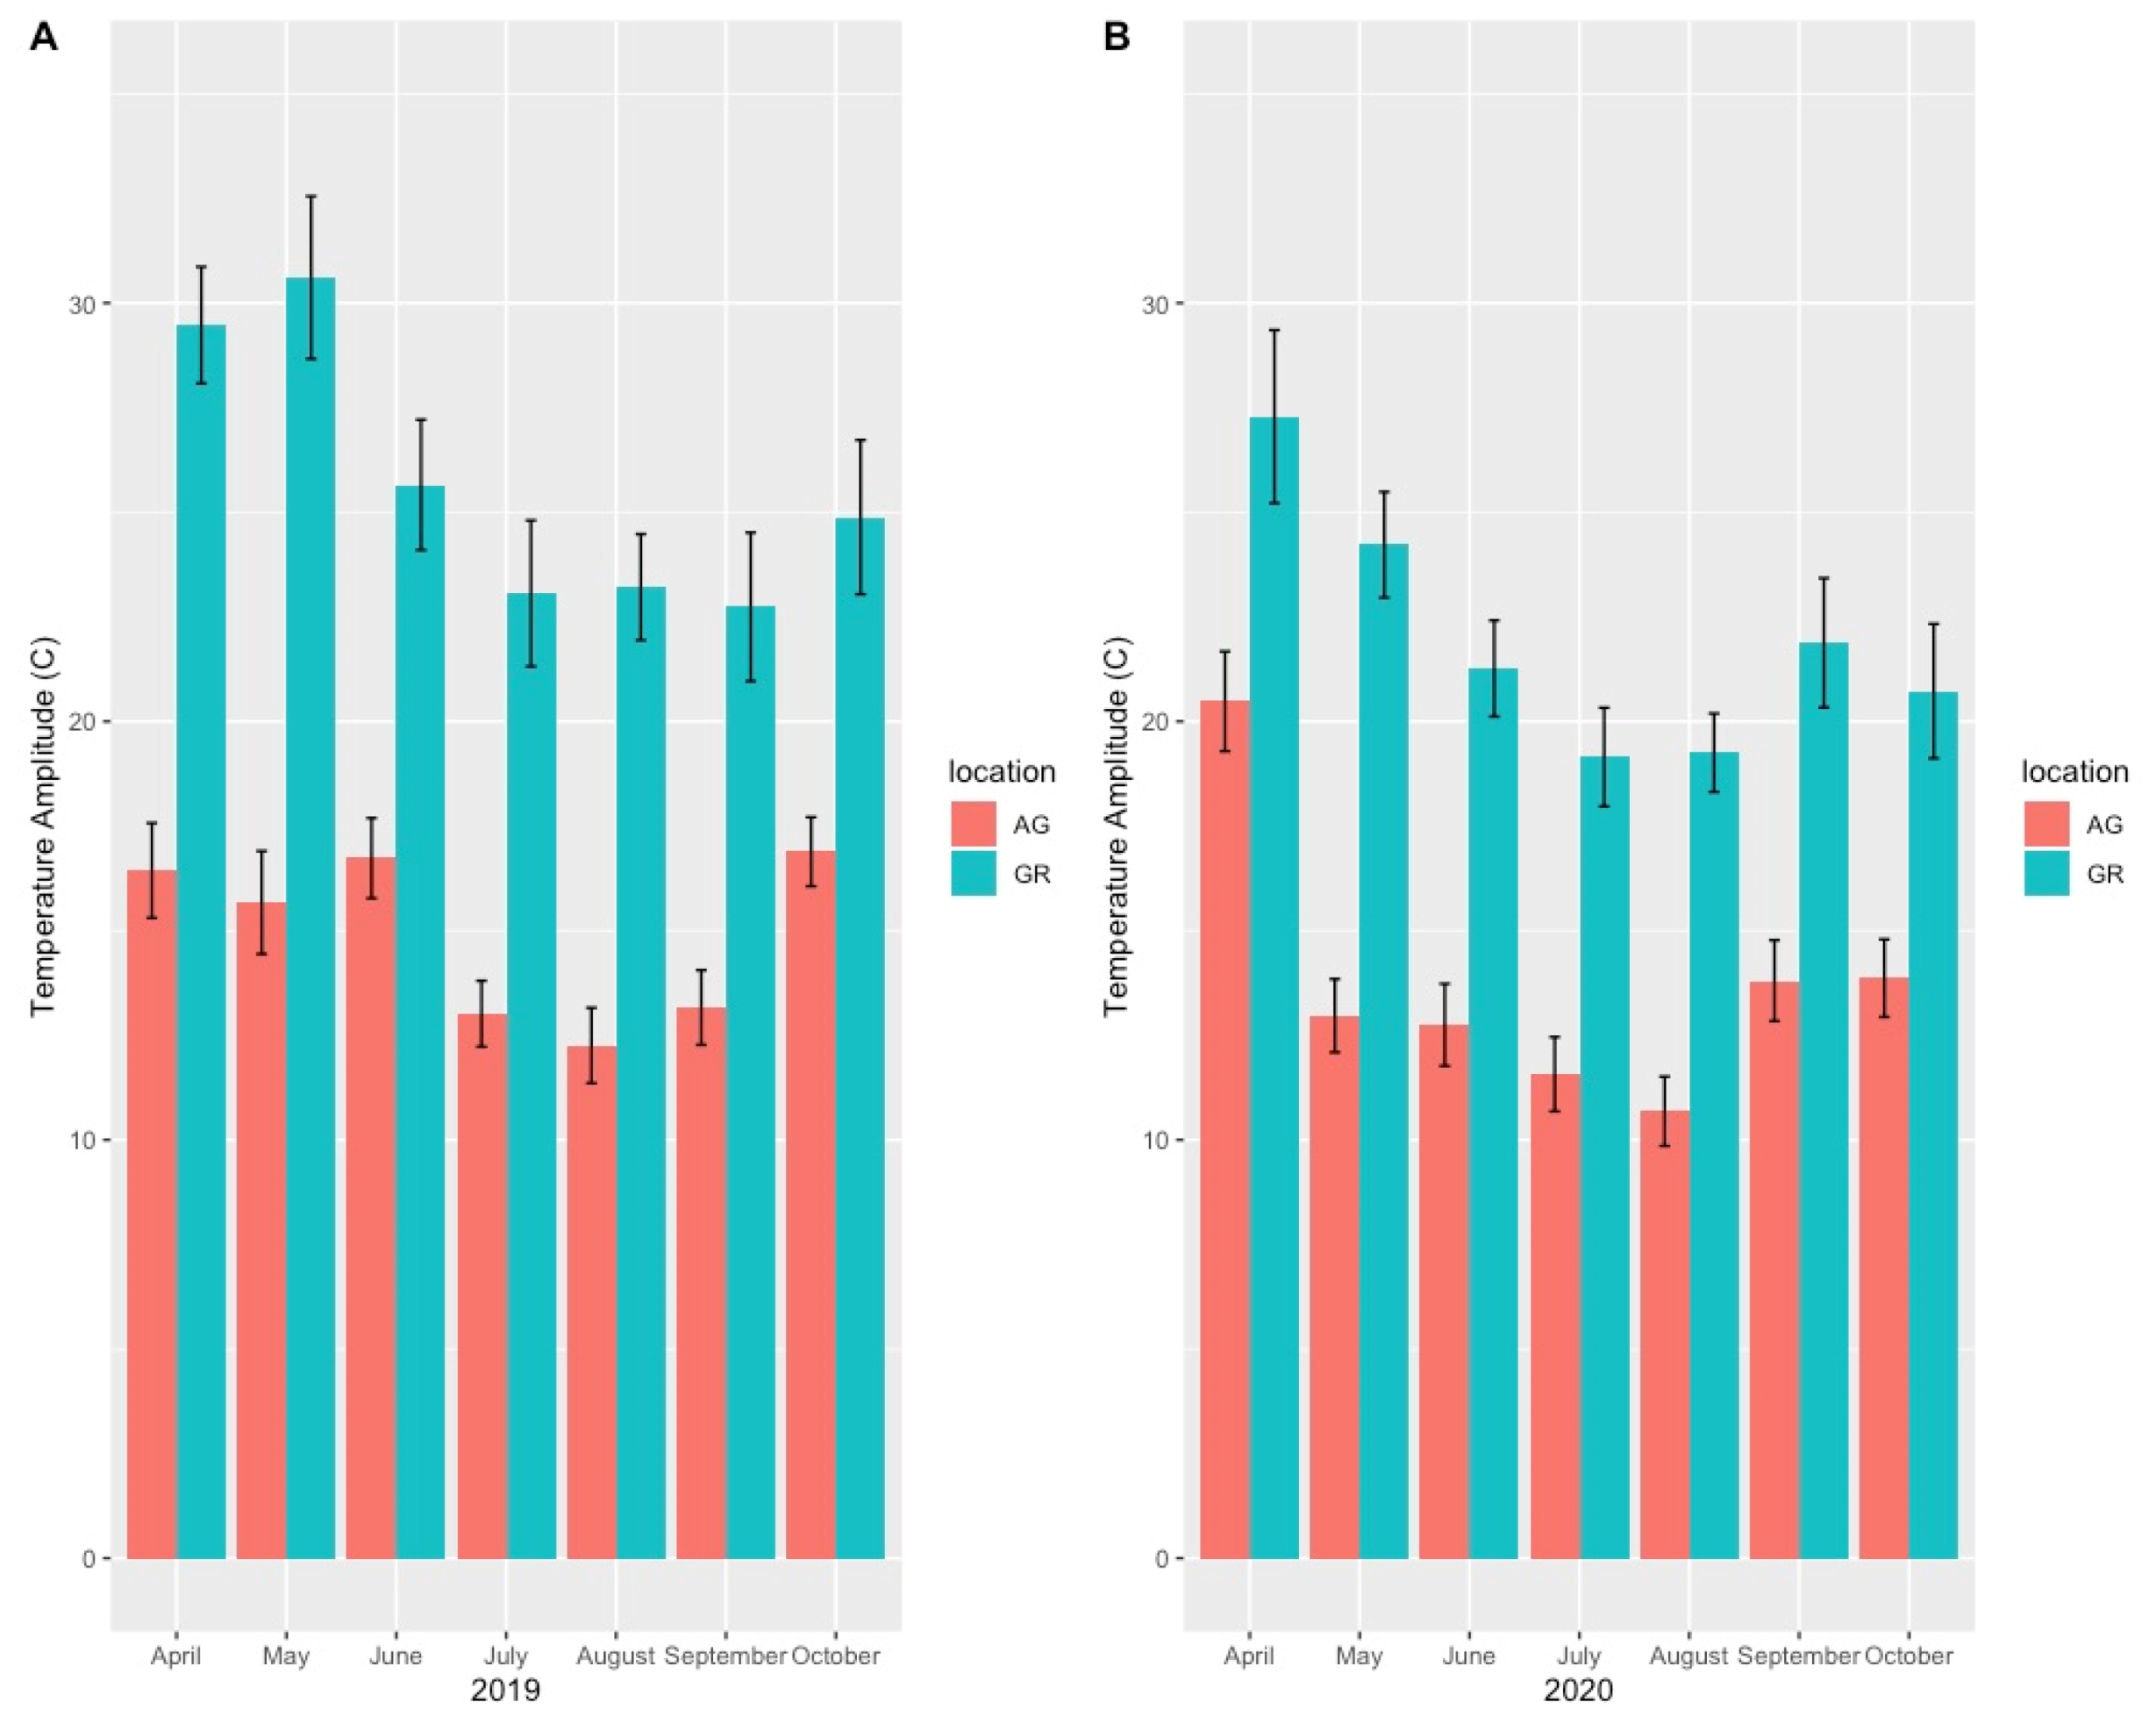
Figure 9.
Monthly mean substrate temperature amplitude (high–low daily temperatures) on the green roofs compared to ground-level sites during the 2019 (A) and 2020 (B) growing seasons. AG = ground level, GR = green roof.
Figure 9.
Monthly mean substrate temperature amplitude (high–low daily temperatures) on the green roofs compared to ground-level sites during the 2019 (A) and 2020 (B) growing seasons. AG = ground level, GR = green roof.
Figure 10.
Monthly maximum and minimum substrate temperatures during the 2019 (A) and 2020 (B) growing seasons. AG = ground level, GR = green roof.
Figure 10.
Monthly maximum and minimum substrate temperatures during the 2019 (A) and 2020 (B) growing seasons. AG = ground level, GR = green roof.
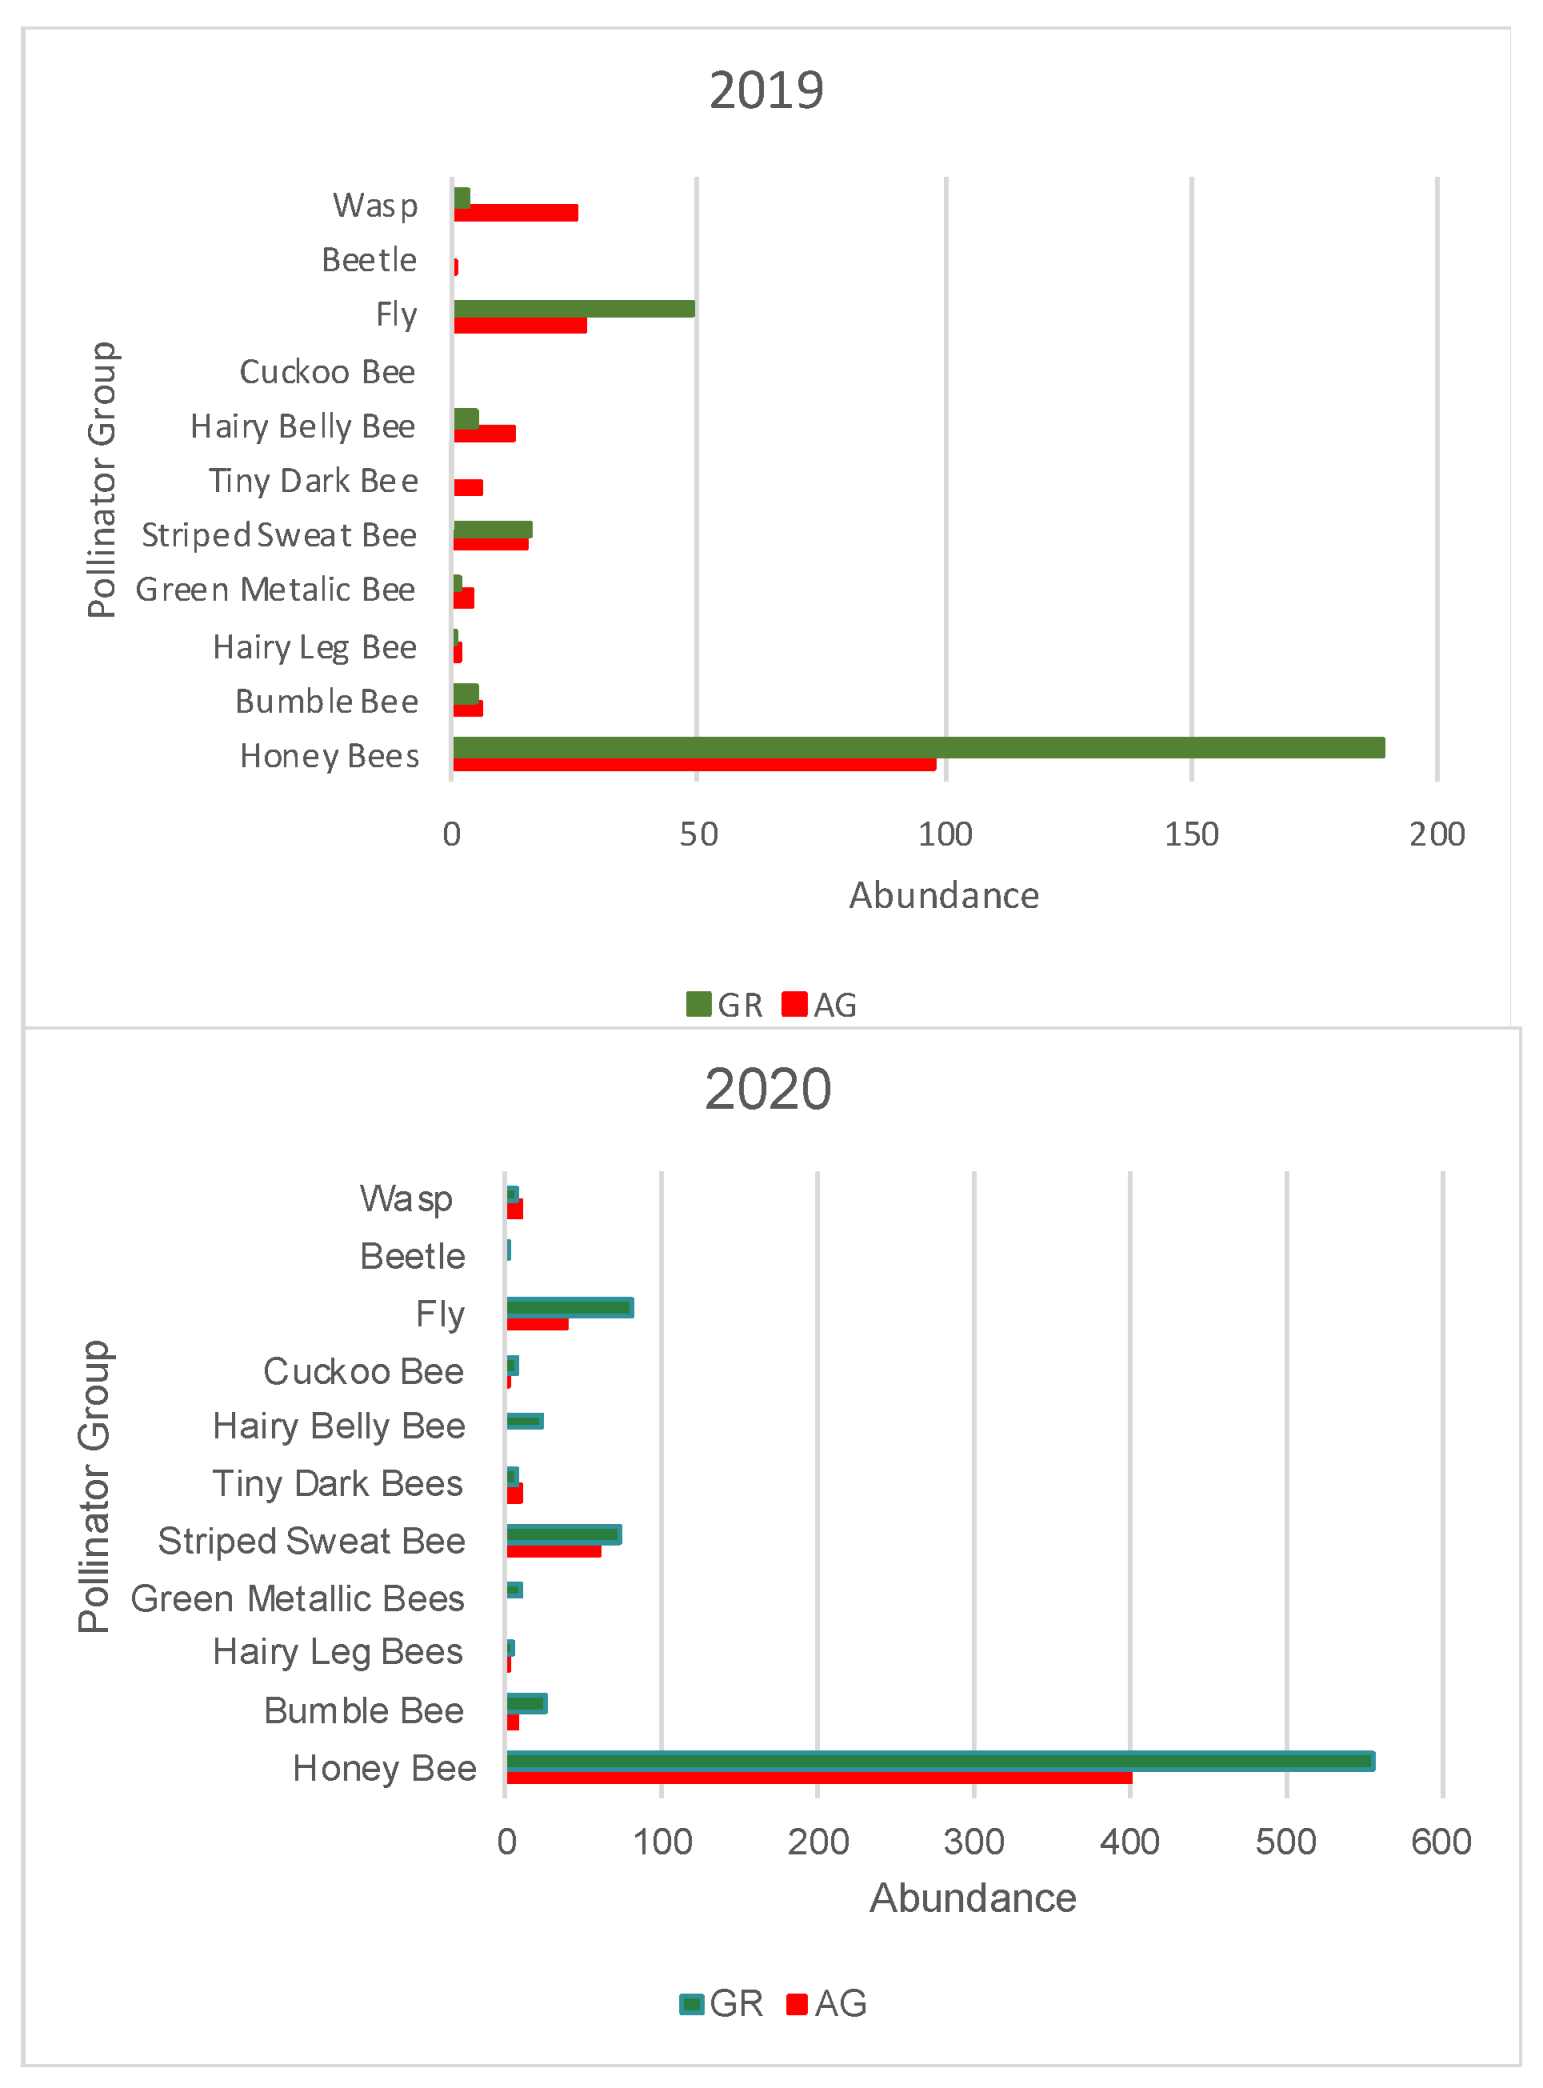
Figure 11.
Total abundance of pollinator groups recorded in 2019 (top) and 2020 (bottom) at each location (GR or AG). AG = ground level, GR = green roof.
Figure 11.
Total abundance of pollinator groups recorded in 2019 (top) and 2020 (bottom) at each location (GR or AG). AG = ground level, GR = green roof.
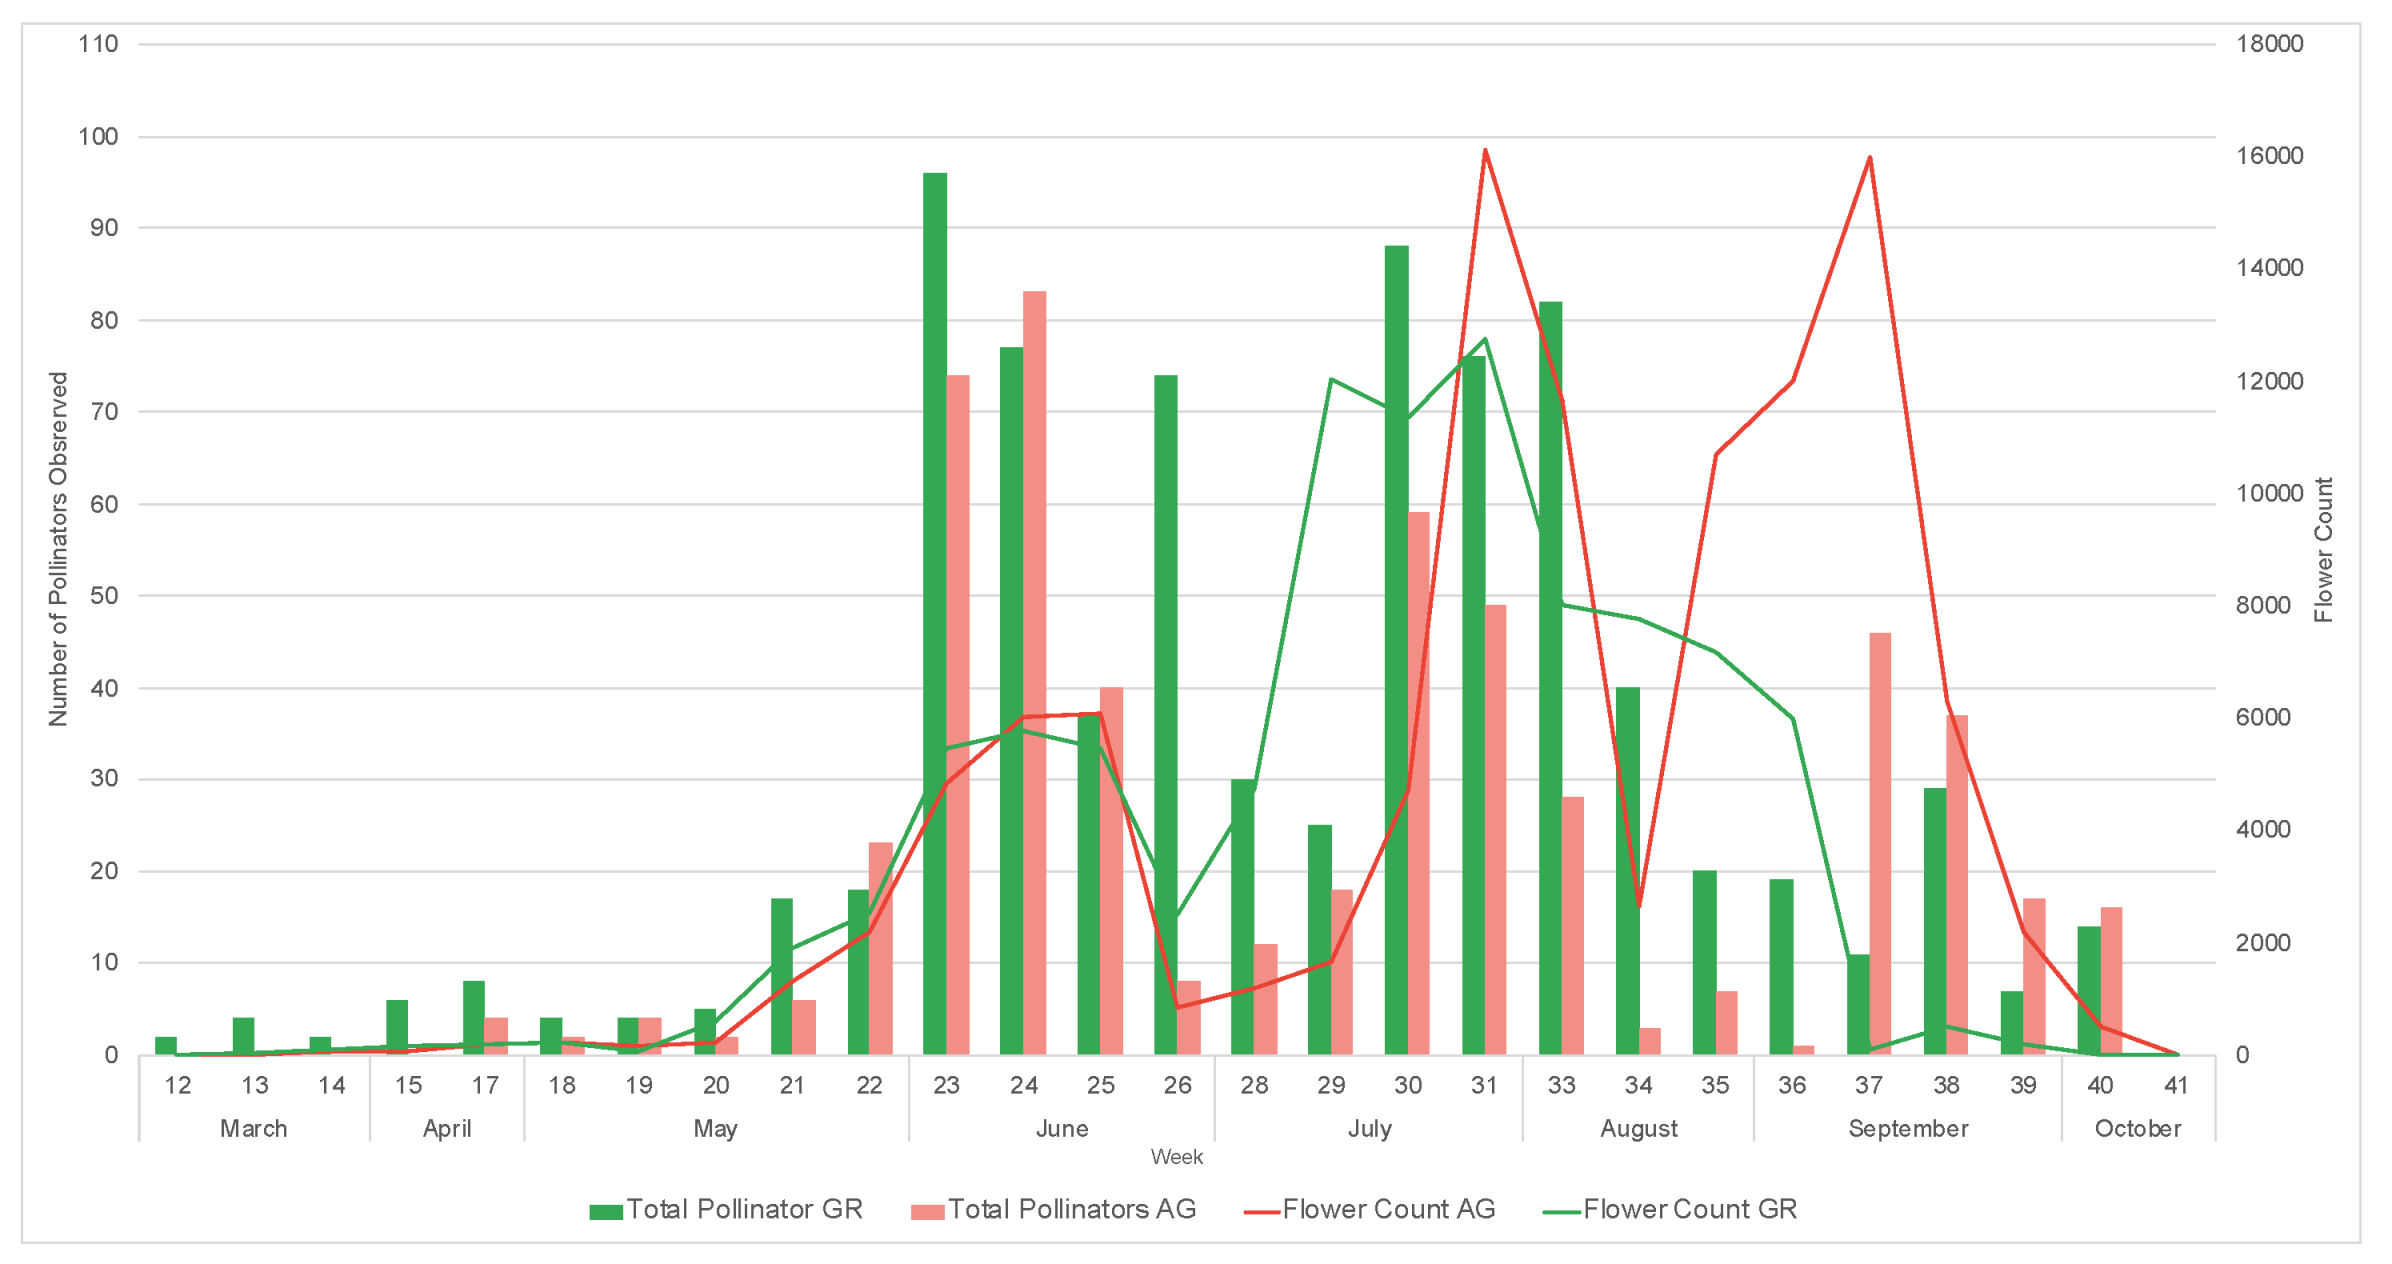
Figure 12.
Weekly pollinator visitation and flower counts for study plants on the green roof (GR) and ground level (AG) during the 2019 growing season.
Figure 12.
Weekly pollinator visitation and flower counts for study plants on the green roof (GR) and ground level (AG) during the 2019 growing season.
Figure 13.
Weekly pollinator visitation and flower counts for study plants on the green roof (GR) and ground level (AG) during the 2020 growing season.
Figure 13.
Weekly pollinator visitation and flower counts for study plants on the green roof (GR) and ground level (AG) during the 2020 growing season.
Table 1.
Plant species evaluated in the study. Bloom times are subdivided as follows: early (April–May), mid (June–July), and late (August–October).
Table 1.
Plant species evaluated in the study. Bloom times are subdivided as follows: early (April–May), mid (June–July), and late (August–October).
| Scientific Name | Species Code | Common Name | Growth Form | Family | Provenance | Bloom Time |
|---|
| Allium ‘Millenium’ | ALMI | Ornamental Onion | Forb | Liliaceae | Eurasia | Mid |
| Chrysothamnus nauseosus ssp. nauseosus | CHNA | Baby Blue Rabbitbrush | Shrub | Asteraceae | US (CO) | Late |
| Dianthus plumarius | DIPL | Feather Pinks | Forb | Caryophyllaceae | Europe | Early/Mid |
| Echium russicum/amoenum | ECRU | Red Feathers | Forb | Boraginaceae | Eurasia | Early/Mid |
| Eriogonum jamesii | ERJA | James’ Buckwheat | Forb | Polygonaceae | US (CO) | Mid |
| Geum triflorum | GETR | Prairie Smoke | Forb | Rosaceae | US (CO) | Early |
| Ipomopsis aggregata | IPAG | Scarlet Gilia | Forb (biennial) | Polemoniaceae | US (SW) | Mid/Late |
| Liatris spictata | LISP | Blazing Star | Forb | Asteraceae | US | Mid |
| Penstemon pinifolius | PEPI | Pineleaf penstemon | Subshrub | Plantaginaceae | US (SW) | Mid |
| Penstemon strictus | PEST | Rocky Mountain Penstemon | Forb | Plantaginaceae | US (CO) | Mid |
| Dasiphora fruticosa | DIFR | Shrubby cinquefoil | Shrub | Rosaceae | US (CO) | Early/Mid |
| Pulsatilla vulgaris | PUVU | Pasqueflower | Forb | Ranunculaceae | Eurasia | Early |
| Salvia cyanescens | SACY | Turkish Sage | Forb | Lamiaceae | Eurasia | Mid |
| Teucrium cossonii | TECO | Fruity germander | Subshrub | Lamiaceae | Eurasia | Late |
| Thymus serphyllum ‘Pink Chintz’ | THSE | Ornamental Thyme | Creeping Forb | Lamiaceae | Eurasia | Early/Mid |
Table 2.
Edaphic characteristics of green roof and ground-level garden soil and soilless media (AG = At grade, GR = green roof).
Table 2.
Edaphic characteristics of green roof and ground-level garden soil and soilless media (AG = At grade, GR = green roof).
| Location | pH | EC (mmhos/cm) | NO3 (ppm) | P (ppm) | K (ppm) | % OM | % Sand | % Silt | % Clay | Texture Class |
|---|
| AG1 | 7.4 | 0.9 | 15.3 | 22 | 95 | 3.4 | 82 | 3 | 15 | Sandy Loam |
| AG2 | 7.5 | 0.9 | 3.4 | 38 | 234 | 4.9 | 62 | 20 | 18 | Sandy Loam |
| AG3 | 7.5 | 0.9 | 41.1 | 62 | 331 | 8.0 | 69 | 13 | 18 | Sandy Loam |
| AG4 | 7.7 | 0.9 | 22.6 | 83 | 556 | 8.4 | 67 | 15 | 18 | Sandy Loam |
| AG5 | 7.6 | 0.9 | 5.7 | 59 | 352 | 6.0 | 67 | 10 | 23 | Sandy Loam |
| AG6/7 | 7.5 | 0.8 | 22.4 | 48 | 147 | 4.0 | 72 | 10 | 18 | Sandy Loam |
| GR1 | 7.8 | 1.0 | 12.9 | 64 | 125 | 5.1 | 70 | 13 | 18 | Sandy Loam |
| GR2 | 7.9 | 0.8 | 5.0 | 38 | 119 | 8.6 | N/A | N/A | N/A | N/A |
Table 3.
Initiation date of flowering, difference in flowering time (GR-AG), maximum number of flowers, total number of flowers, and duration of flowering among our study species. Plant species are abbreviated with the first two letters of the genus and species (i.e., Echium russicum = ECRU). * CHNA flowering duration was not calculated due to a sudden freeze event which prematurely terminated flowering.
| Species | Year | First Flowering Date (GR) | First Flowering Date (AG) | Mean Flowering Advance (AG-GR, Days) | Max Flower Number (GR) | Max Flower Number (AG) | Flowering Duration GR (Days) | Flowering Duration AG (Days) |
|---|
|
ECRU
| 2019 | 11-Jun | 12-Jun | 1.8 | 70.6 | 73.6 | 17.6 | 27.8 |
|
LISP
| 2019 | 25-Jul | 3-Aug | 9.2 | 725.8 | 715.8 | 10.0 | 12.8 |
|
PEPI
| 2019 | 12-Jun | 27-Jun | 15 | 78.6 | 151.4 | 50.0 | 54.0 |
|
PEST
| 2019 | 10-Jun | 11-Jun | 1 | 82.4 | 158.6 | 23.6 | 32.8 |
|
SAAR
| 2019 | 15-Jun | 12-Jun | −2.4 | 216.2 | 133.8 | 12.2 | 20.2 |
|
TECO
| 2019 | 28-Jun | 11-Jul | 12.8 | 295.4 | 493.6 | 90.8 | 78.0 |
|
ALMI
| 2020 | 21-Jul | 30-Jul | 9.4 | 145.4 | 55.0 | 29.0 | 22.4 |
|
CHNA
| 2020 | 10-Sep | 25-Sep | 14.4 | 2063.3 | 2223.9 | * | * |
|
DIFR
| 2020 | 2-May | 3-Jun | 32.7 | 8.9 | 12.3 | 107.3 | 19.8 |
|
DIPL
| 2020 | 22-May | 26-May | 4.2 | 12.9 | 49.7 | 30.4 | 99.4 |
|
ECRU
| 2020 | 19-May | 23-May | 3 | 21.3 | 38.3 | 19.6 | 24.8 |
|
ERJA
| 2020 | 16-Jul | 23-Jul | 7 | 624.0 | 1075.1 | 121.4 | 73.6 |
|
GETR
| 2020 | 1-Apr | 4-Apr | 4.2 | 11.0 | 12.0 | 33.2 | 24.8 |
|
IPAG
| 2020 | 30-Jun | 14-Jul | 12.6 | 19.7 | 33.1 | 22.0 | 111.0 |
|
LISP
| 2020 | 14-Jul | 23-Jul | 8.4 | 749.9 | 134.5 | 26.2 | 35.0 |
|
PEPI
| 2020 | 28-May | 28-May | 0 | 55.5 | 115.4 | 43.0 | 45.8 |
|
PEST
| 2020 | 22-May | 3-Jun | 16.4 | 18.2 | 10.6 | 23.0 | 32.0 |
|
PUVU
| 2020 | 19-Mar | 27-Mar | 11.2 | 9.9 | 3.5 | 47.2 | 72.2 |
|
SACY
| 2020 | 12-Jun | 23-Jun | 13 | 44.6 | 12.4 | 35.0 | 74.8 |
|
TECO
| 2020 | 9-Jun | 15-Jun | 5.8 | 160.1 | 121.3 | 112.6 | 53.0 |
|
THSE
| 2020 | 21-May | 2-Jun | 15 | 213.9 | 400.0 | 64.0 | 36.0 |
Table 4.
Summary of substrate monthly mean temperature (°C), annual mean temperature (°C), maximum annual temperature (°C), and minimum annual temperature (°C) for the green roof and ground-level plant locations during the growing season (Apr–Oct) in 2019 and 2020.
Table 4.
Summary of substrate monthly mean temperature (°C), annual mean temperature (°C), maximum annual temperature (°C), and minimum annual temperature (°C) for the green roof and ground-level plant locations during the growing season (Apr–Oct) in 2019 and 2020.
| | Year | Apr | May | Jun | Jul | Aug | Sep | Oct | Avg Temp | Max Temp | Min Temp |
|---|
| AG | 2019 | 15.65 | 14.67 | 19.51 | 22.78 | 22.63 | 19.85 | 10.26 | 16.82 | 30.03 | 3.65 |
| GR | 2019 | 19.39 | 15.22 | 22.65 | 27.47 | 25.93 | 22.36 | 9.93 | 20.42 | 40.99 | 0.19 |
| AG | 2020 | 10.69 | 16.15 | 19.15 | 21.80 | 21.96 | 17.65 | 11.35 | 16.97 | 27.84 | 2.86 |
| GR | 2020 | 14.87 | 20.91 | 23.55 | 25.25 | 24.99 | 18.17 | 11.04 | 20.23 | 36.91 | 1.12 |
Table 5.
The aggregated in situ observations following the protocol developed by Mason et al. (2018) [
34] the green roof sites (GR) and the sites at grade (AG) during the 2019 growing season. Other pollinator observations include flies (Diptera), beetles (Coleoptera), and wasps (family Vespidae).
Table 5.
The aggregated in situ observations following the protocol developed by Mason et al. (2018) [
34] the green roof sites (GR) and the sites at grade (AG) during the 2019 growing season. Other pollinator observations include flies (Diptera), beetles (Coleoptera), and wasps (family Vespidae).
| Honey Bee | Bumble Bee | Hairy Leg Bee | Green Metallic Bee | Striped Sweat Bee | Tiny Dark Bee | Hairy Belly Bee | Cuckoo Bee | Fly | Beetle | Wasp | Total Pollinator | Native Bees | Other Pollinators |
|---|
| AG | GR | AG | GR | AG | GR | AG | GR | AG | GR | AG | GR | AG | GR | AG | GR | AG | GR | AG | GR | AG | GR | AG | GR | AG | GR | AG | GR |
| 98 | 189 | 6 | 5 | 2 | 1 | 4 | 2 | 15 | 16 | 6 | 0 | 13 | 5 | 0 | 0 | 27 | 49 | 1 | 0 | 25 | 3 | 197 | 270 | 46 | 29 | 53 | 52 |
Table 6.
The aggregated in situ observations following the protocol developed by Mason et al. (2018) [
34] the green roof sites (GR) and the sites at grade (AG) during the 2020 growing season. Other pollinator observations include flies (Diptera), beetles (Coleoptera), and wasps (family Vespidae).
Table 6.
The aggregated in situ observations following the protocol developed by Mason et al. (2018) [
34] the green roof sites (GR) and the sites at grade (AG) during the 2020 growing season. Other pollinator observations include flies (Diptera), beetles (Coleoptera), and wasps (family Vespidae).
| Honey Bee | Bumble Bee | Hairy Leg Bee | Green Metallic Bee | Striped Sweat Bee | Tiny Dark Bee | Hairy Belly Bee | Cuckoo Bee | Fly | Beetle | Wasp | Total Pollinator | Native Bees | Other Pollinator |
|---|
| AG | GR | AG | GR | AG | GR | AG | GR | AG | GR | AG | GR | AG | GR | AG | GR | AG | GR | AG | GR | AG | GR | AG | GR | AG | GR | AG | GR |
| 400 | 556 | 8 | 25 | 3 | 4 | 0 | 10 | 61 | 72 | 9 | 8 | 0 | 22 | 3 | 7 | 39 | 82 | 0 | 1 | 10 | 8 | 533 | 795 | 84 | 148 | 49 | 91 |


