Abstract
The extraction of real geological environment information is a key factor in accurately evaluating the vulnerability to geological hazards. Yanghe Township is located in the mountainous area of western Sichuan and lacks geological survey data. Therefore, it is important predict the spatial and temporal development law of landslide debris flow in this area and improve the effectiveness and accuracy of monitoring changes in landslide debris flow, this article proposes a method for extracting information on the changes in landslide debris flows combined with NDVI variation, which is based on short baseline interferometry (SBAS-InSAR) and optical remote sensing interpretation. In this article, we present relevant maps based on six main factors: vegetation index, slope, slope orientation, elevation, topographic relief, and formation lithology. At the same time, different remote sensing images were compared to improve the accuracy of landslide debris flow sensitivity assessments. The research showed that the highest altitude of the region extracted by multi-source remote sensing technology is 2877 m, and the lowest is 630 m, which can truly reflect the topographic relief characteristics of the region. The pixel binary model’s lack of regional restrictions enables a more accurate estimation of the Normalized Difference Vegetation Index (NDVI), bringing it closer to the actual vegetation situation. The study uncovered a bidirectional relationship between vegetation coverage changes and landslide deformation in the study area, revealing spatial–temporal evolution patterns. By employing multi-source remote sensing technology, the research effectively utilized changes in multi-period imagery and feature extraction methods to accurately depict the development process and distribution characteristics of landslide debris flow. This approach not only offers technical support but also provides guidance for evaluating the vulnerability of landslide debris flow in the region.
1. Introduction
Landslide debris flow is a geological disaster that usually occurs in mountainous or hilly areas with steep terrain and steep slopes. The flow speed of this type of debris flow is usually very fast, reaching tens of kilometers per hour or even higher. At the same time, it usually propagates swiftly along river channels and valleys, posing threats to surrounding areas over long distances. Debris flow is a fluid mixed with water, soil, rocks, trees, and other impurities. Most landslide debris flows occur in the rainy season or heavy rain weather. Therefore, heavy rainfall and long duration of rain are also the main reasons for the occurrence of landslide debris flows.
As the demand for higher accuracy in predicting geological disasters continues to rise, remote sensing technology has been widely applied by numerous scholars in various aspects [1,2,3], including high-resolution image acquisition, temporal analysis, construction of digital elevation models (DEM) and 3D terrain analysis, thermal infrared remote sensing, and spatial analysis. Remote sensing technology enables more precise and efficient monitoring, early warning, and post-disaster assessment of geological hazards. The current remote sensing has formed a multi-level, multi-perspective, and multi-domain observation system that extends from the ground to the air and even to space. It encompasses information data collection, processing, interpretation, analysis, and application, enabling global detection and monitoring. Remote sensing has become an important means of obtaining information about Earth’s resources and environment.
In the case of landslide-type debris flow, NDVI serves as an indicator of vegetation health and coverage changes, allowing monitoring of NDVI alterations. Typically, healthy vegetation exhibits higher NDVI values due to its strong reflection in the near-infrared band. Conversely, landslide debris flow often results in vegetation loss and land cover alteration. Large-scale vegetation decay or disappearance induced by debris flow can significantly decrease NDVI values in affected areas, indicating vegetation absence. This article focuses on Yanghe Township as the research area, considering its unique terrain and complex ecological environment. Utilizing multi-source remote sensing technology, a method is proposed to study the dynamic changes in the development of landslide-type debris flows, focusing on aspects such as vegetation coverage area and vegetation growth variation. This method addresses the limitations of lacking geological data and the single direction of landslide research.
2. Materials and Methods
2.1. Study Area
Yanghe Township, situated within Leshan City, Sichuan Province (Figure 1), spans 123.8 square kilometers. The area’s river system has been shaped by regional geological structures and the course alterations of rivers like the Dadu River. Additionally, the region experiences abundant annual precipitation, leading to frequent summer floods. The study area exhibits significant topographic contrasts due to multi-stage tectonic movements, with a noticeable transition between the basin and the marginal mountain area (Figure 2). The mountainous structure in this region has been greatly influenced by numerous strong earthquakes [4,5,6,7], providing ample evidence for earthquake-induced landslide debris flows. Based on the available data provided by the Copernicus Data Space Ecosystem and according to incomplete statistics provided by the China Natural Disaster Database, from 2016 to 2023, there were 26 landslides and 3 debris flows in this area.
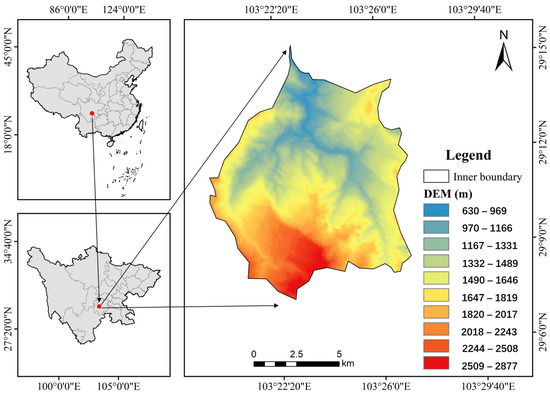
Figure 1.
Digital elevation model of the study area.
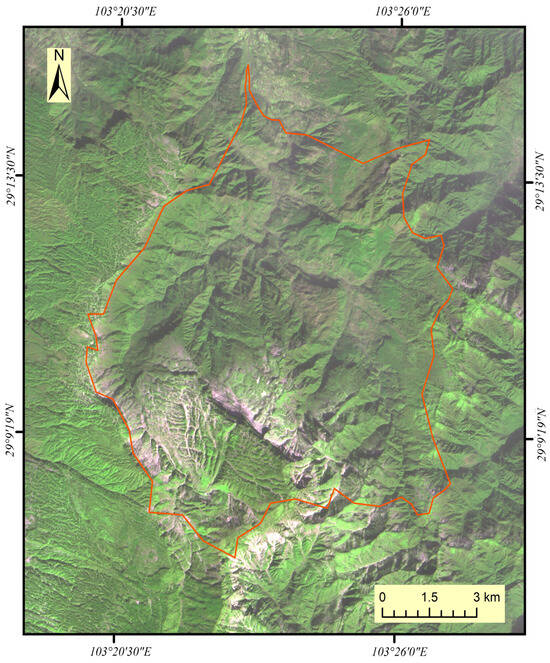
Figure 2.
Satellite map of the study area.
The ongoing urbanization process has led to the proliferation of artificial surfaces, contributing to heightened stormwater runoff. Various agricultural practices may further exacerbate soil erosion by expanding the arable land area. Additionally, inappropriate land use can also exacerbate soil erosion, thereby increasing the risk of landslide debris flows. Hence, this paper devised distinct remote sensing interpretation criteria for diverse surface objects through meticulous examination of image characteristics within the study area. This approach ensures the precision and reliability of land use remote sensing data. Leveraging insights from numerous experts and scholars who have employed remote sensing technology to investigate land use from various perspectives, this paper drew inspiration for its research [8,9,10]. The development of landslide debris flow is not only affected by topographic factors and human activities but also by the formation lithology [11,12,13,14,15].
Typically, older geological formations undergo extended periods of weathering and erosion, leading to diminished stability. Rocks within older strata are prone to greater susceptibility to natural forces, with the potential for increased formation of fractures and joints over time. These factors contribute to heightened fragility within the rock mass, facilitating the occurrence of landslide debris flows [16,17]. The new geological stratum remains relatively dynamic, with materials being relatively fresh and more responsive to water permeability and fluctuations in groundwater levels, influencing surface runoff formation. Due to the lack of extensive weathering and stabilization, geotechnical materials within the new formation tend to be less compact and more susceptible to external factors such as rainfall, thereby heightening the likelihood of landslides [18,19,20].
The exposed strata in this area are mainly Mesozoic and Cenozoic continental strata, the thickest of which is 7000 m, and among which the Triassic is the oldest exposed strata in the study area, with a thickness of 1900 m. The lower strata are calcareous siltstone, and the calcareous limestone and dolomite interlayers can be seen. In the middle are limestone and clay rocks. The upper part is layered calcareous siltstone with thin layers of dolomitic limestone. The Jurassic strata developed with a thickness of up to 3450 m, the angular unconformity covered the lower Triassic strata, and there were obvious fault-cutting phenomena in some areas. The fluctuation of elevation made obvious changes in climate and hydrological conditions in the whole region, resulting in the characteristics of the development of ground fractures [21,22,23,24]. The quaternary system was dominated by loose deposits (Figure 3).
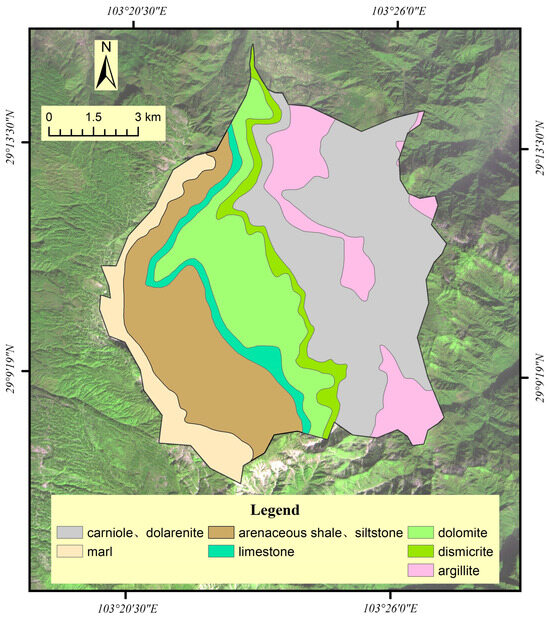
Figure 3.
Stratigraphic lithology map of the study area.
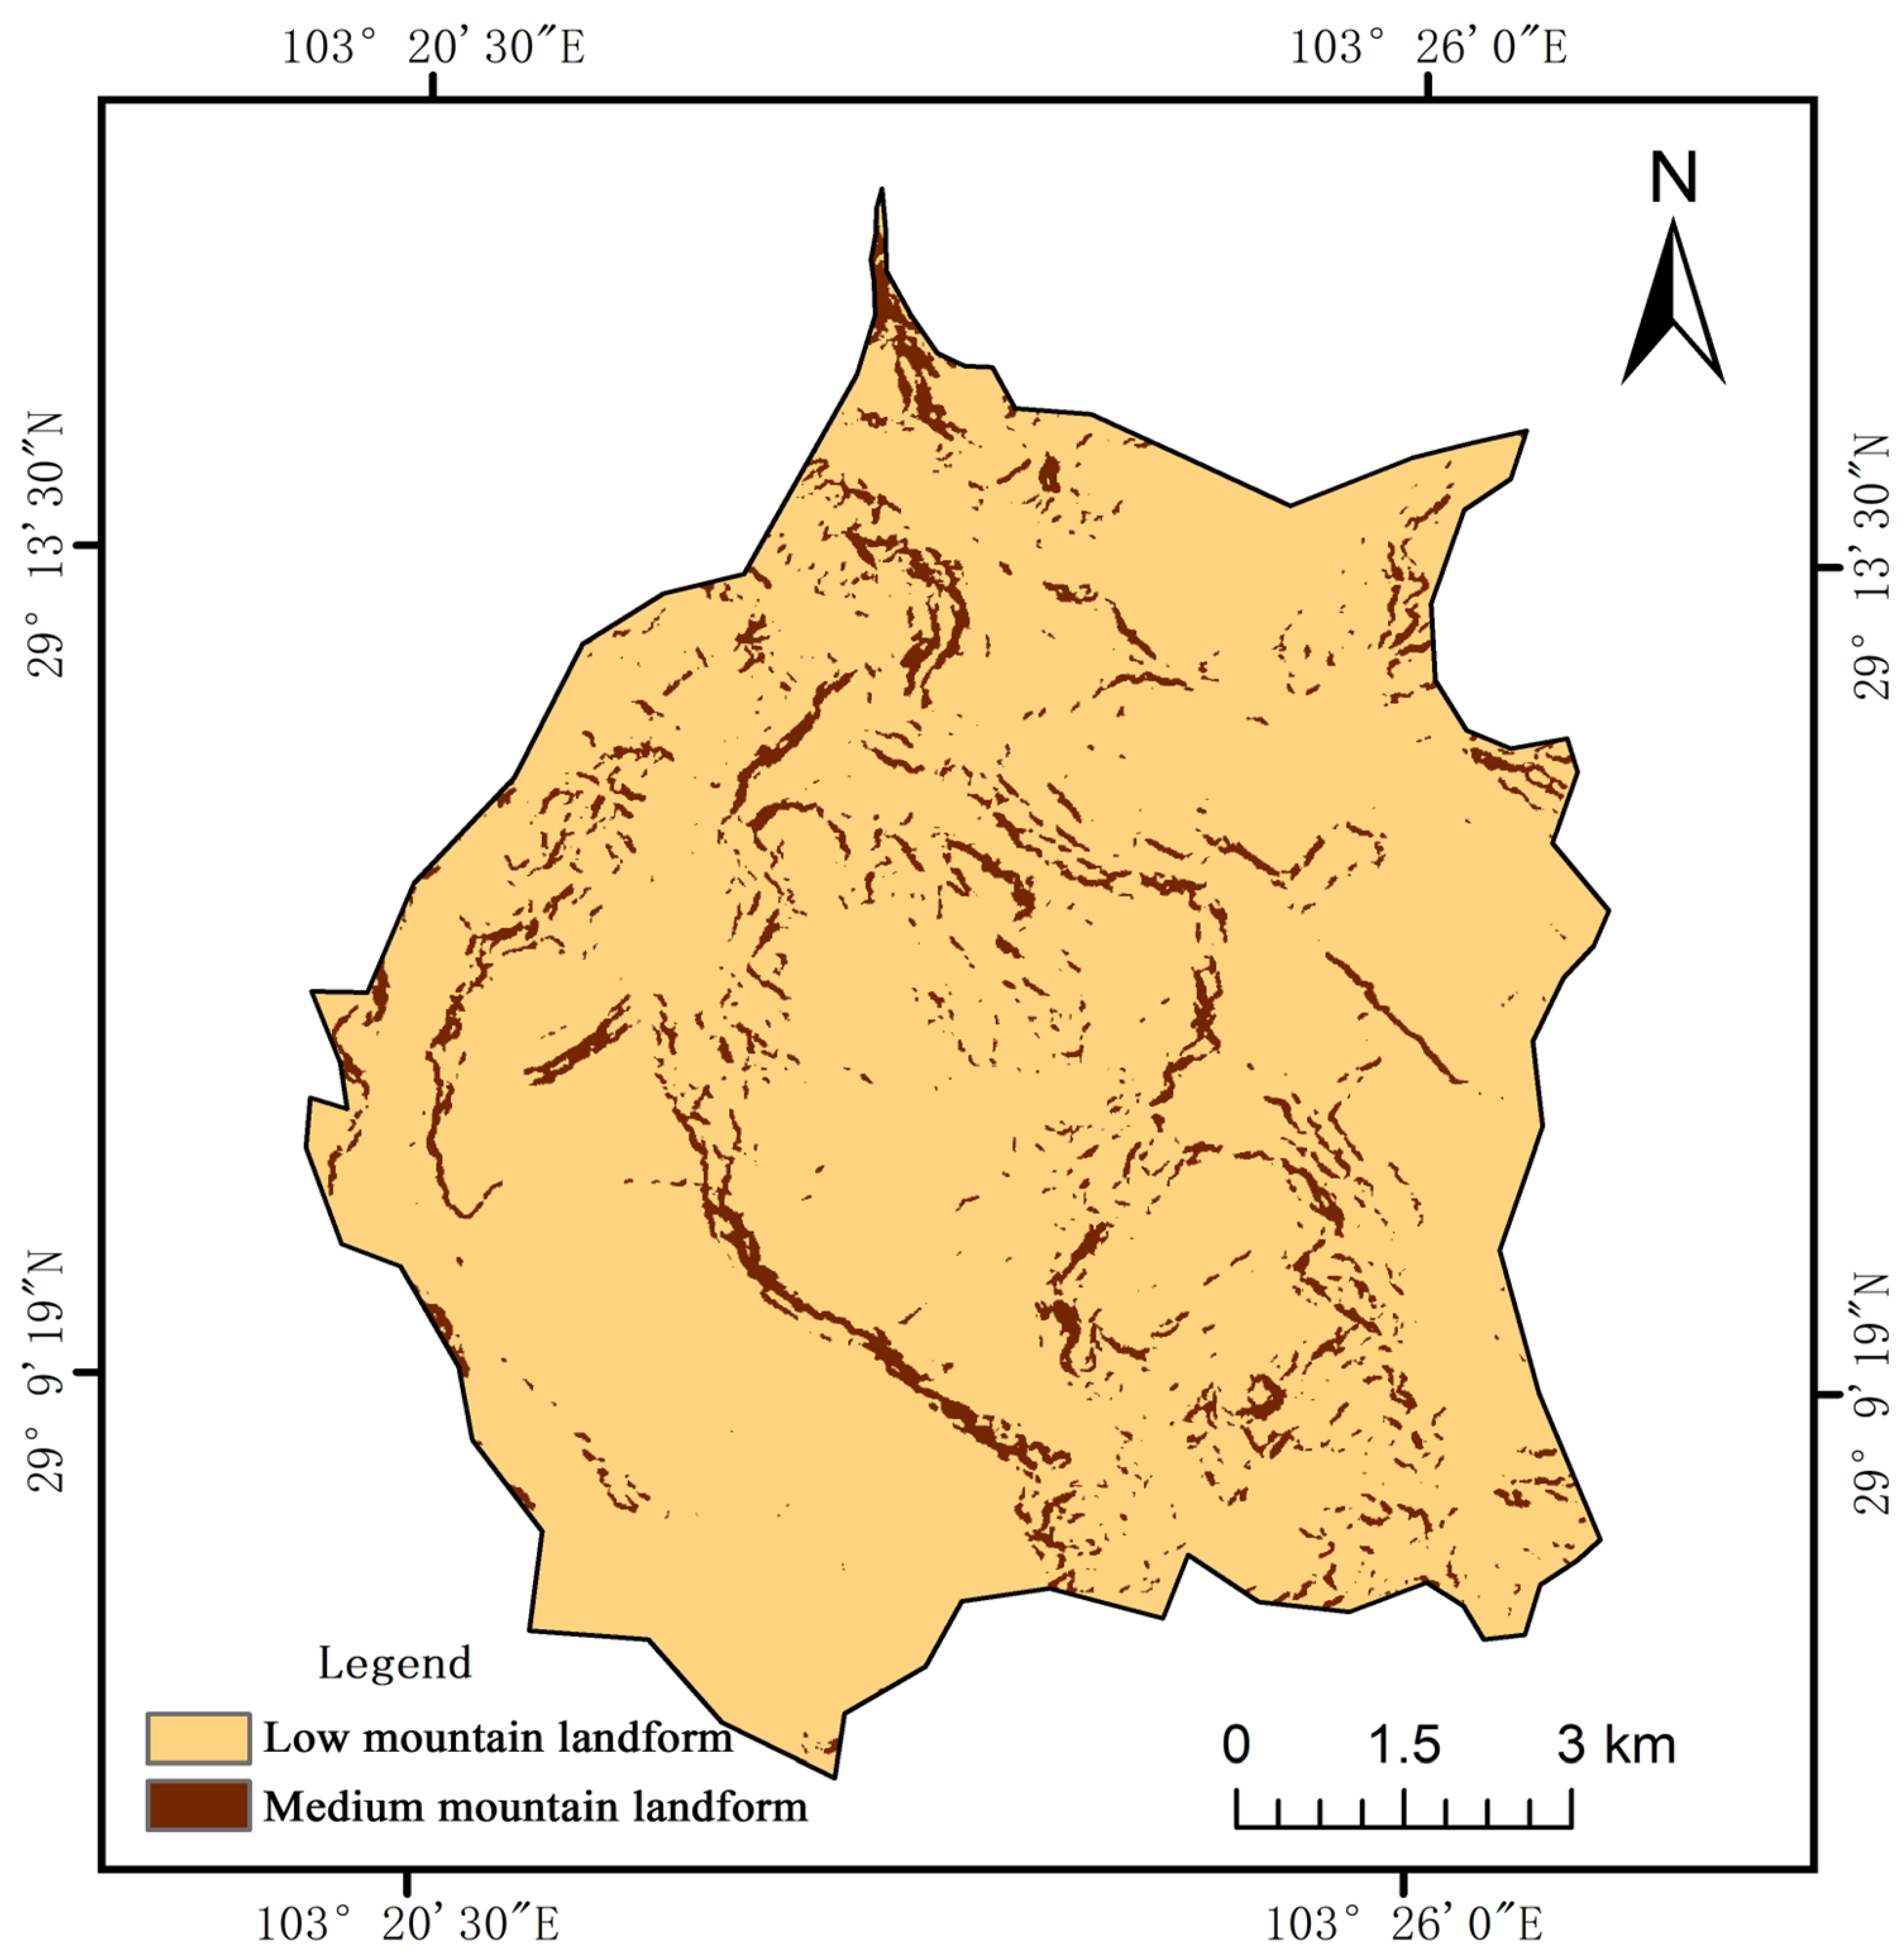
The study area has undergone multiple episodes of movement and is concurrently influenced by precipitation and other factors, resulting in high-volume debris flows. The development and progression of landslide debris flows are influenced by numerous geomorphic features, with steep slopes being a crucial factor. Higher slopes render surface soil and rock more vulnerable to the effects of gravity and landslides, and varying slope orientations may experience disparate impacts from rainfall and sunlight. The topography of the study area is varied, and the surface morphology can be divided into medium mountain (1000 to 3500 m above sea level) and low mountain (500 to 1000 m above sea level) according to the elevation and relief (Figure 4). Areas with significant topographic relief, such as steep cliffs and hillsides, are more susceptible to landslides and debris flows, serving as the driving force and origin for mountain collapses and landslides. Heavy and prolonged rainfall exacerbates the likelihood of debris flow development and severely compromises the stability of the regional geological environment, resulting in heightened risk of geological disaster occurrence.

Figure 4.
Geomorphic map of the study area.
Due to the particularity of the study area, this article adopted support vector machine classification as the method of land use in the study area [25,26,27,28].
In this study, high-resolution remote sensing images were used as data sources, an artificial neural network classification method was adopted, and land use data statistics were used to obtain the trend chart of land use type area change in the study area from 2020 to 2023. Based on previous studies, this article divided the land use of the study area into five categories: forest land, meadow, plowland, construction land, and unutilized land. We obtained the land use classification results of four phases in 2020, 2021, 2022, and 2023 (Figure 5).
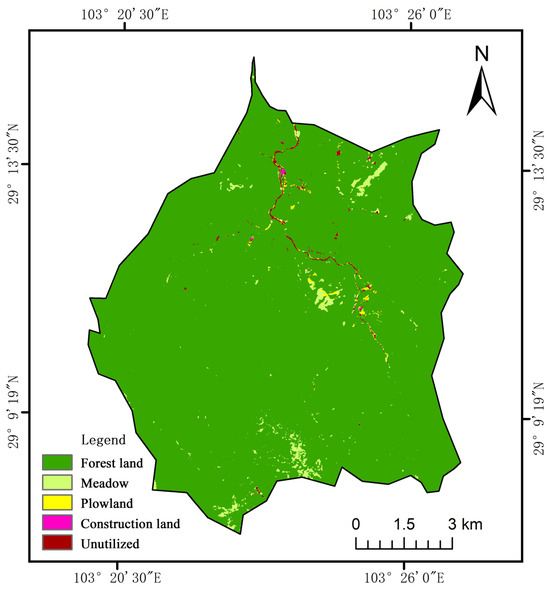
Figure 5.
Land utilization map of the study area.
In order to solve the difficulty of efficiently obtaining and solving the deformation information of landslide debris flow due to lack of basic data support and single technology [29,30,31], this paper used SBAS-InSAR technology and optical remote sensing technology as research methods and combined optical remote sensing data and SAR data to extract landslide debris flow. This allowed for the establishment of a research system of multi-source remote sensing technology fusion and complementary advantages so as to accurately evaluate the development of landslide debris flow.
2.2. Data and Preprocessing
Small Baseline Subset InSAR (SBAS-InSAR) technology enables the monitoring of surface deformation in an all-weather and multi-temporal manner, thereby extending the effective monitoring period for debris flow events [32,33]. Because of its high timeliness and abundant spectral information, optical remote sensing can directly illustrate the distribution characteristics of various topographic factors in the low-frequency coefficient space [34,35]. During the research, to achieve pixel-level fusion and feature-level fusion analysis, two remote sensing analysis platforms, ESASNAP and ENVI, were integrated for more detailed processing and analysis of remote sensing data in the study area. ESASNAP platform was utilized to process the acquired SAR data, which was subsequently imported into ENVI software (version 5.3). Subsequently, appropriate data formats and band information were selected, and the data were calibrated accordingly. This ensured data quality and alignment with other remote sensing datasets, facilitating ongoing research. This paper utilized multi-source and multi-temporal high-resolution Sentinel-1A data, along with revised NDVI data. These high-resolution datasets spanned five phases from 2018 to 2022 and were employed to filter and identify changes in elevation and slope. Throughout the study, SAR images were acquired in VV polarization mode with a resolution of 10 m, with specific parameters detailed in Table 1.

Table 1.
Basic parameters of SAR data.
Given that the low-frequency coefficient effectively captures the dynamic changes within the study area, this paper employs NDVI data from 2018 to 2022 to compute the low-frequency coefficient (Equation (1)) and conducts statistical analysis to derive the fundamental statistical characteristics of NDVI and terrain factors (Table 2). This approach addresses the limitations of threshold values associated with SBAS-InSAR technology. The formula (Equation (1)) is expressed as follows:
where NIR represents the reflectance of the near-infrared band and R represents the reflectance of the red band.
Table 2.
The basic statistical characteristics of NDVI and terrain factors.
After radiation calibration, data with a 10 m resolution in bands 4 and 8 were chosen for image processing. The classification system for coverage range comprises five levels, which are low coverage area (<10%), medium-low coverage area (10–30%), medium coverage area (30–50%), medium-high coverage area (50–70%), and high coverage area (70–100%). As the vegetation growth in the majority of the study area exhibited minimal changes over time, and considering the actual conditions depicted in the images, the conventional classification method was enhanced and reorganized into four levels: lower (<20%), low (20–33%), medium (33–73%), and high coverage area (73–100%) (Table 3).
Table 3.
Classification of vegetation coverage levels.
2.3. Research Method
To proficiently observe the evolving dynamics of landslide debris flow, the methodology for monitoring landslide debris flow changes, as proposed in this paper and based on multi-source remote sensing data extraction technology, primarily encompasses three key aspects (Figure 6), namely basic geographic data screening, SBAS-InSAR data extraction, and optical remote sensing data processing.
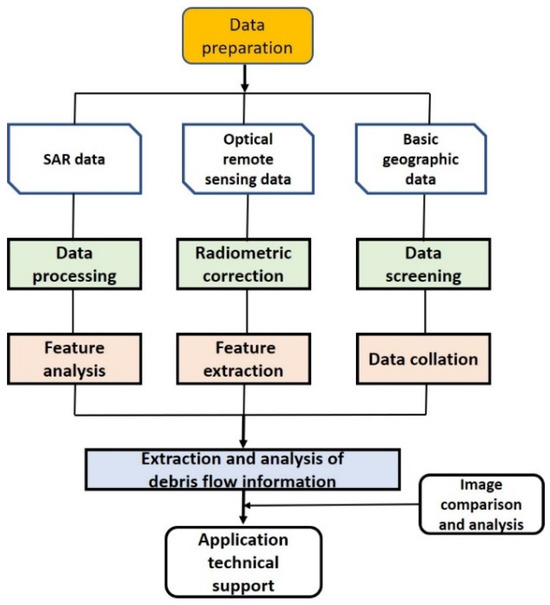
Figure 6.
Multi-source remote sensing data collaborative extraction of landslide debris flow scheme.
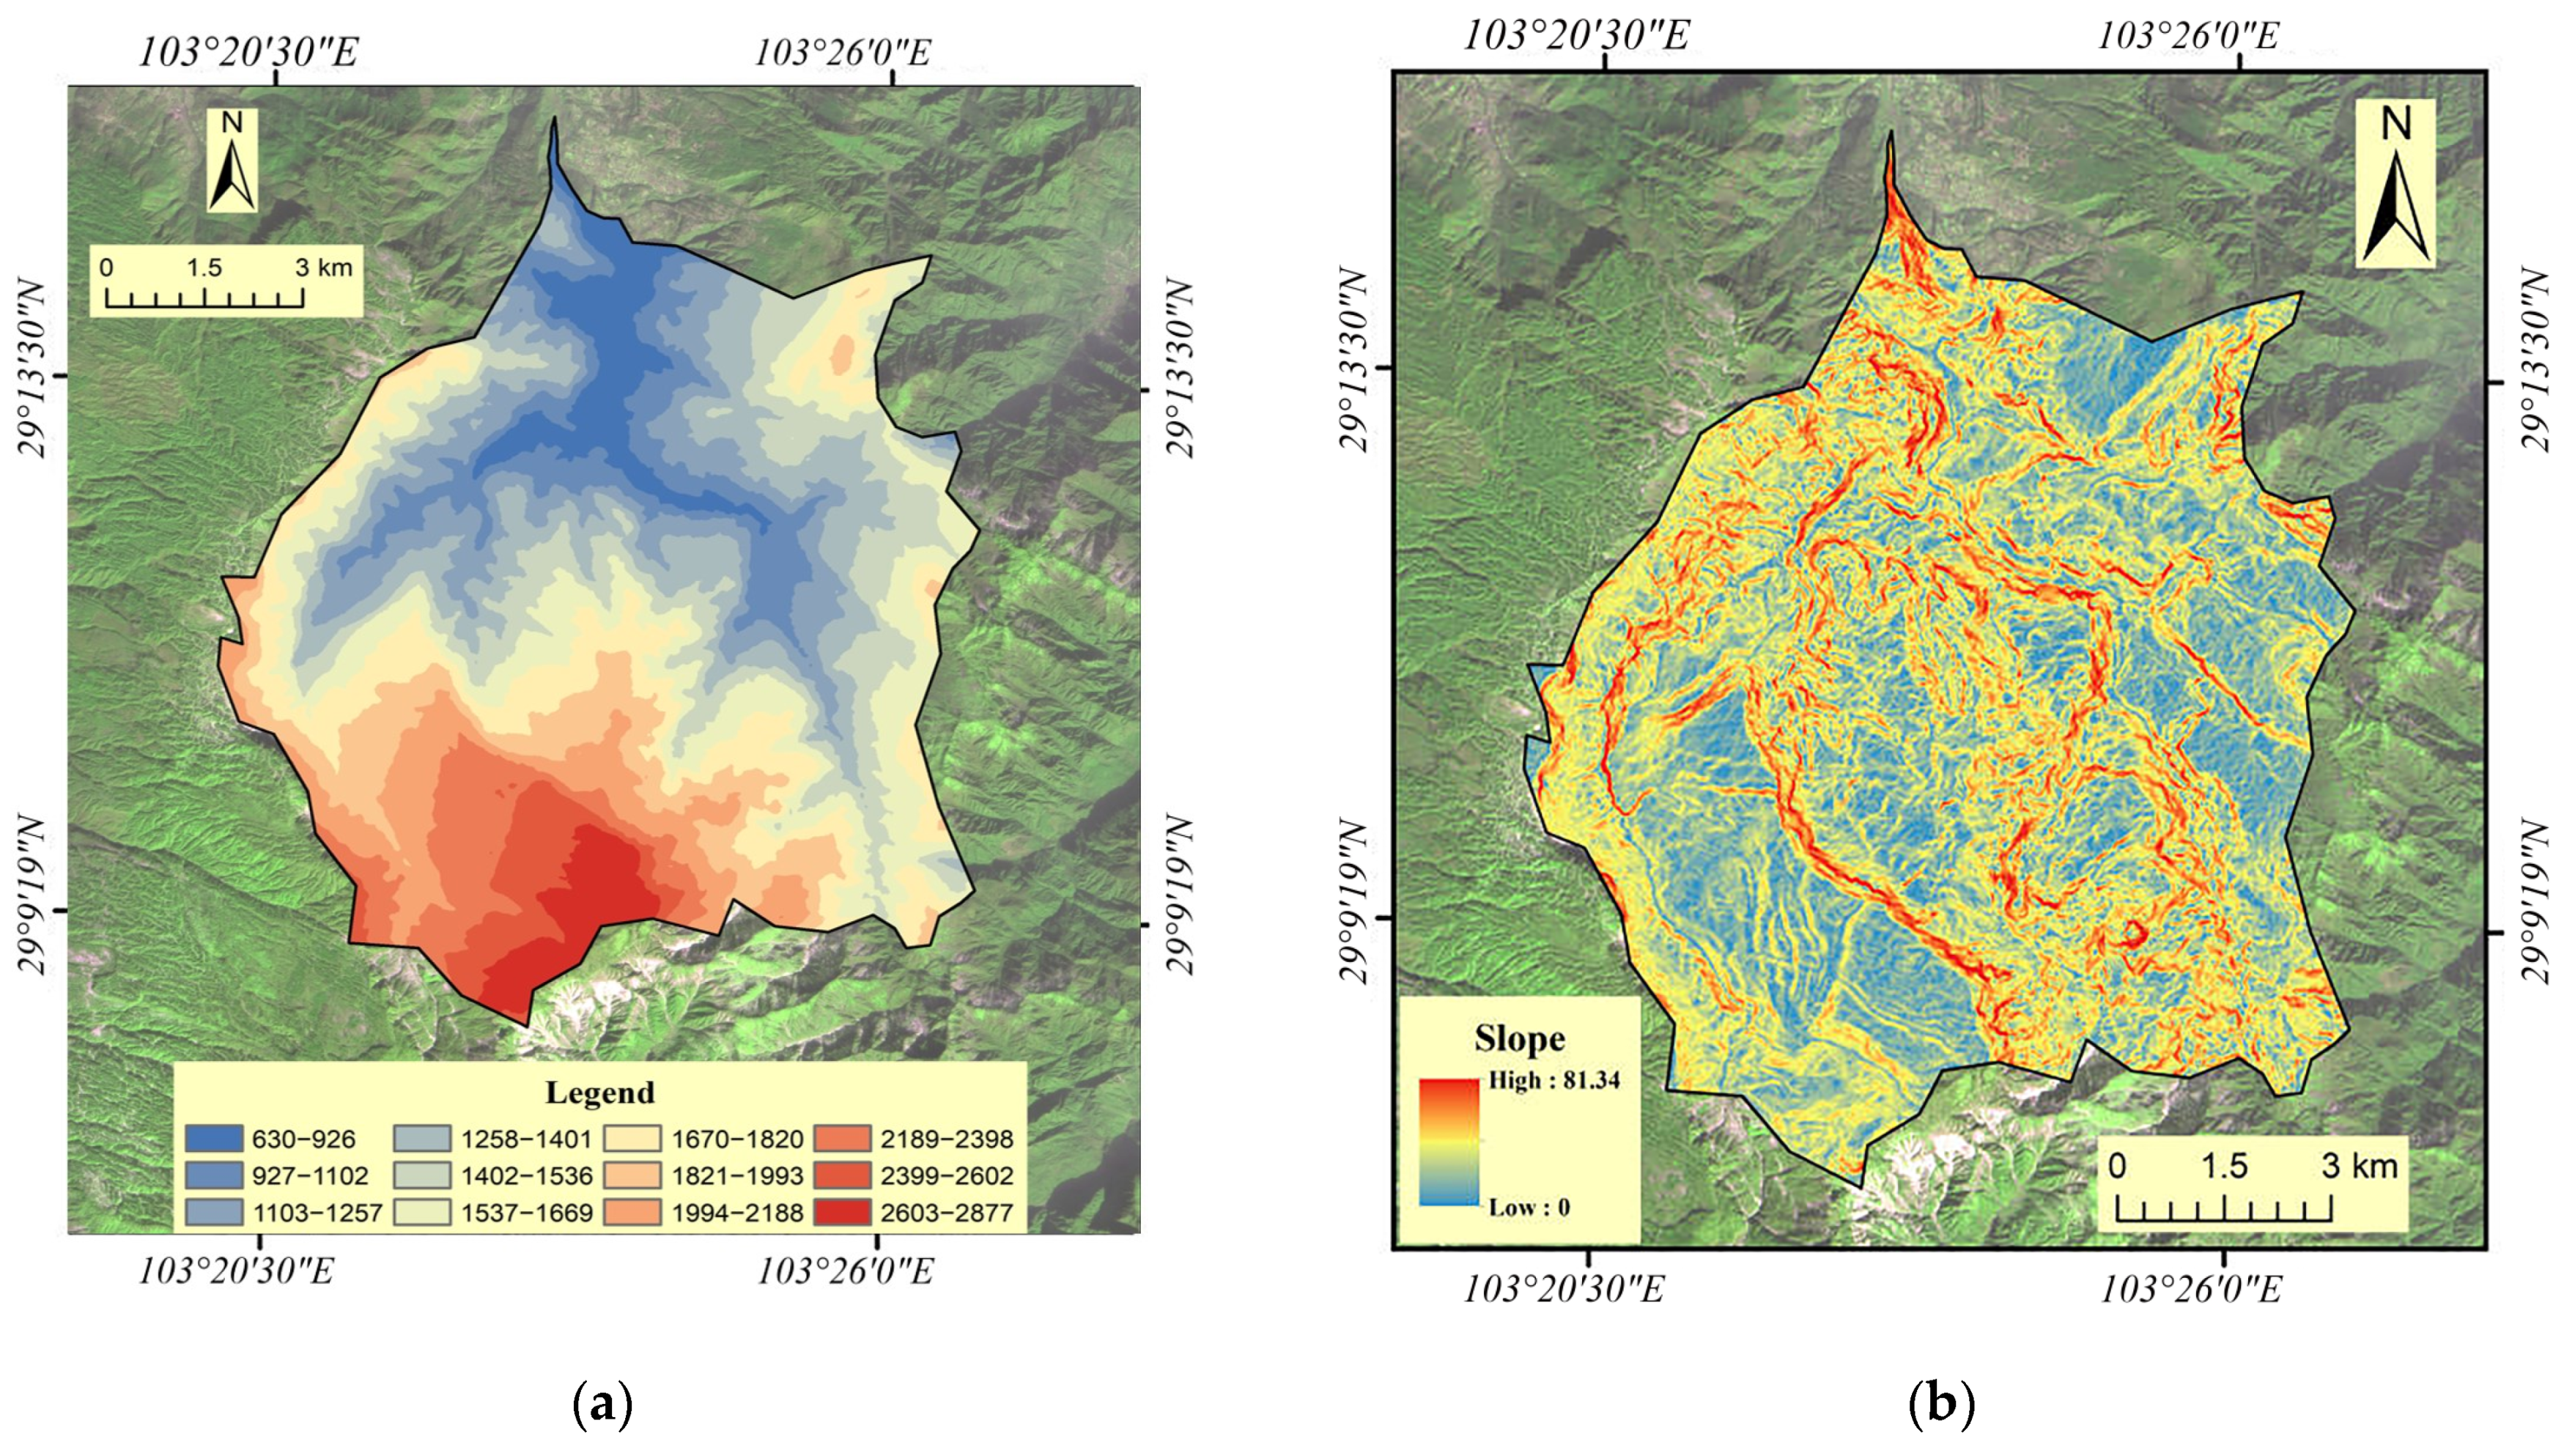
Optical pixel offset was employed to extract surface deformation data. To ensure the map aligns closely with the authentic features of the local valley ridgeline, vector data representing slope units were computed from the digital elevation model (DEM) using hydrological analysis [36,37,38], and elevation (Figure 7a) and slope factor (Figure 7b) were extracted by using ArcGIS software (version 10.7). The highest elevation in the region is 2877 m, the lowest is 630 m, and the height difference is large. The change in NDVI based on the influence of elevation and slope was selected as the index parameter to analyze the development of landslide debris flow [39,40,41].
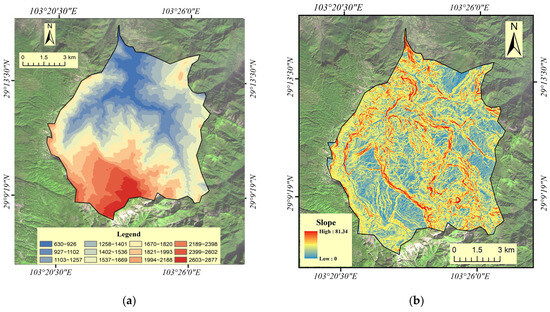
Figure 7.
(a) Elevation factor (unit: meters); (b) slope factor (unit: degrees).
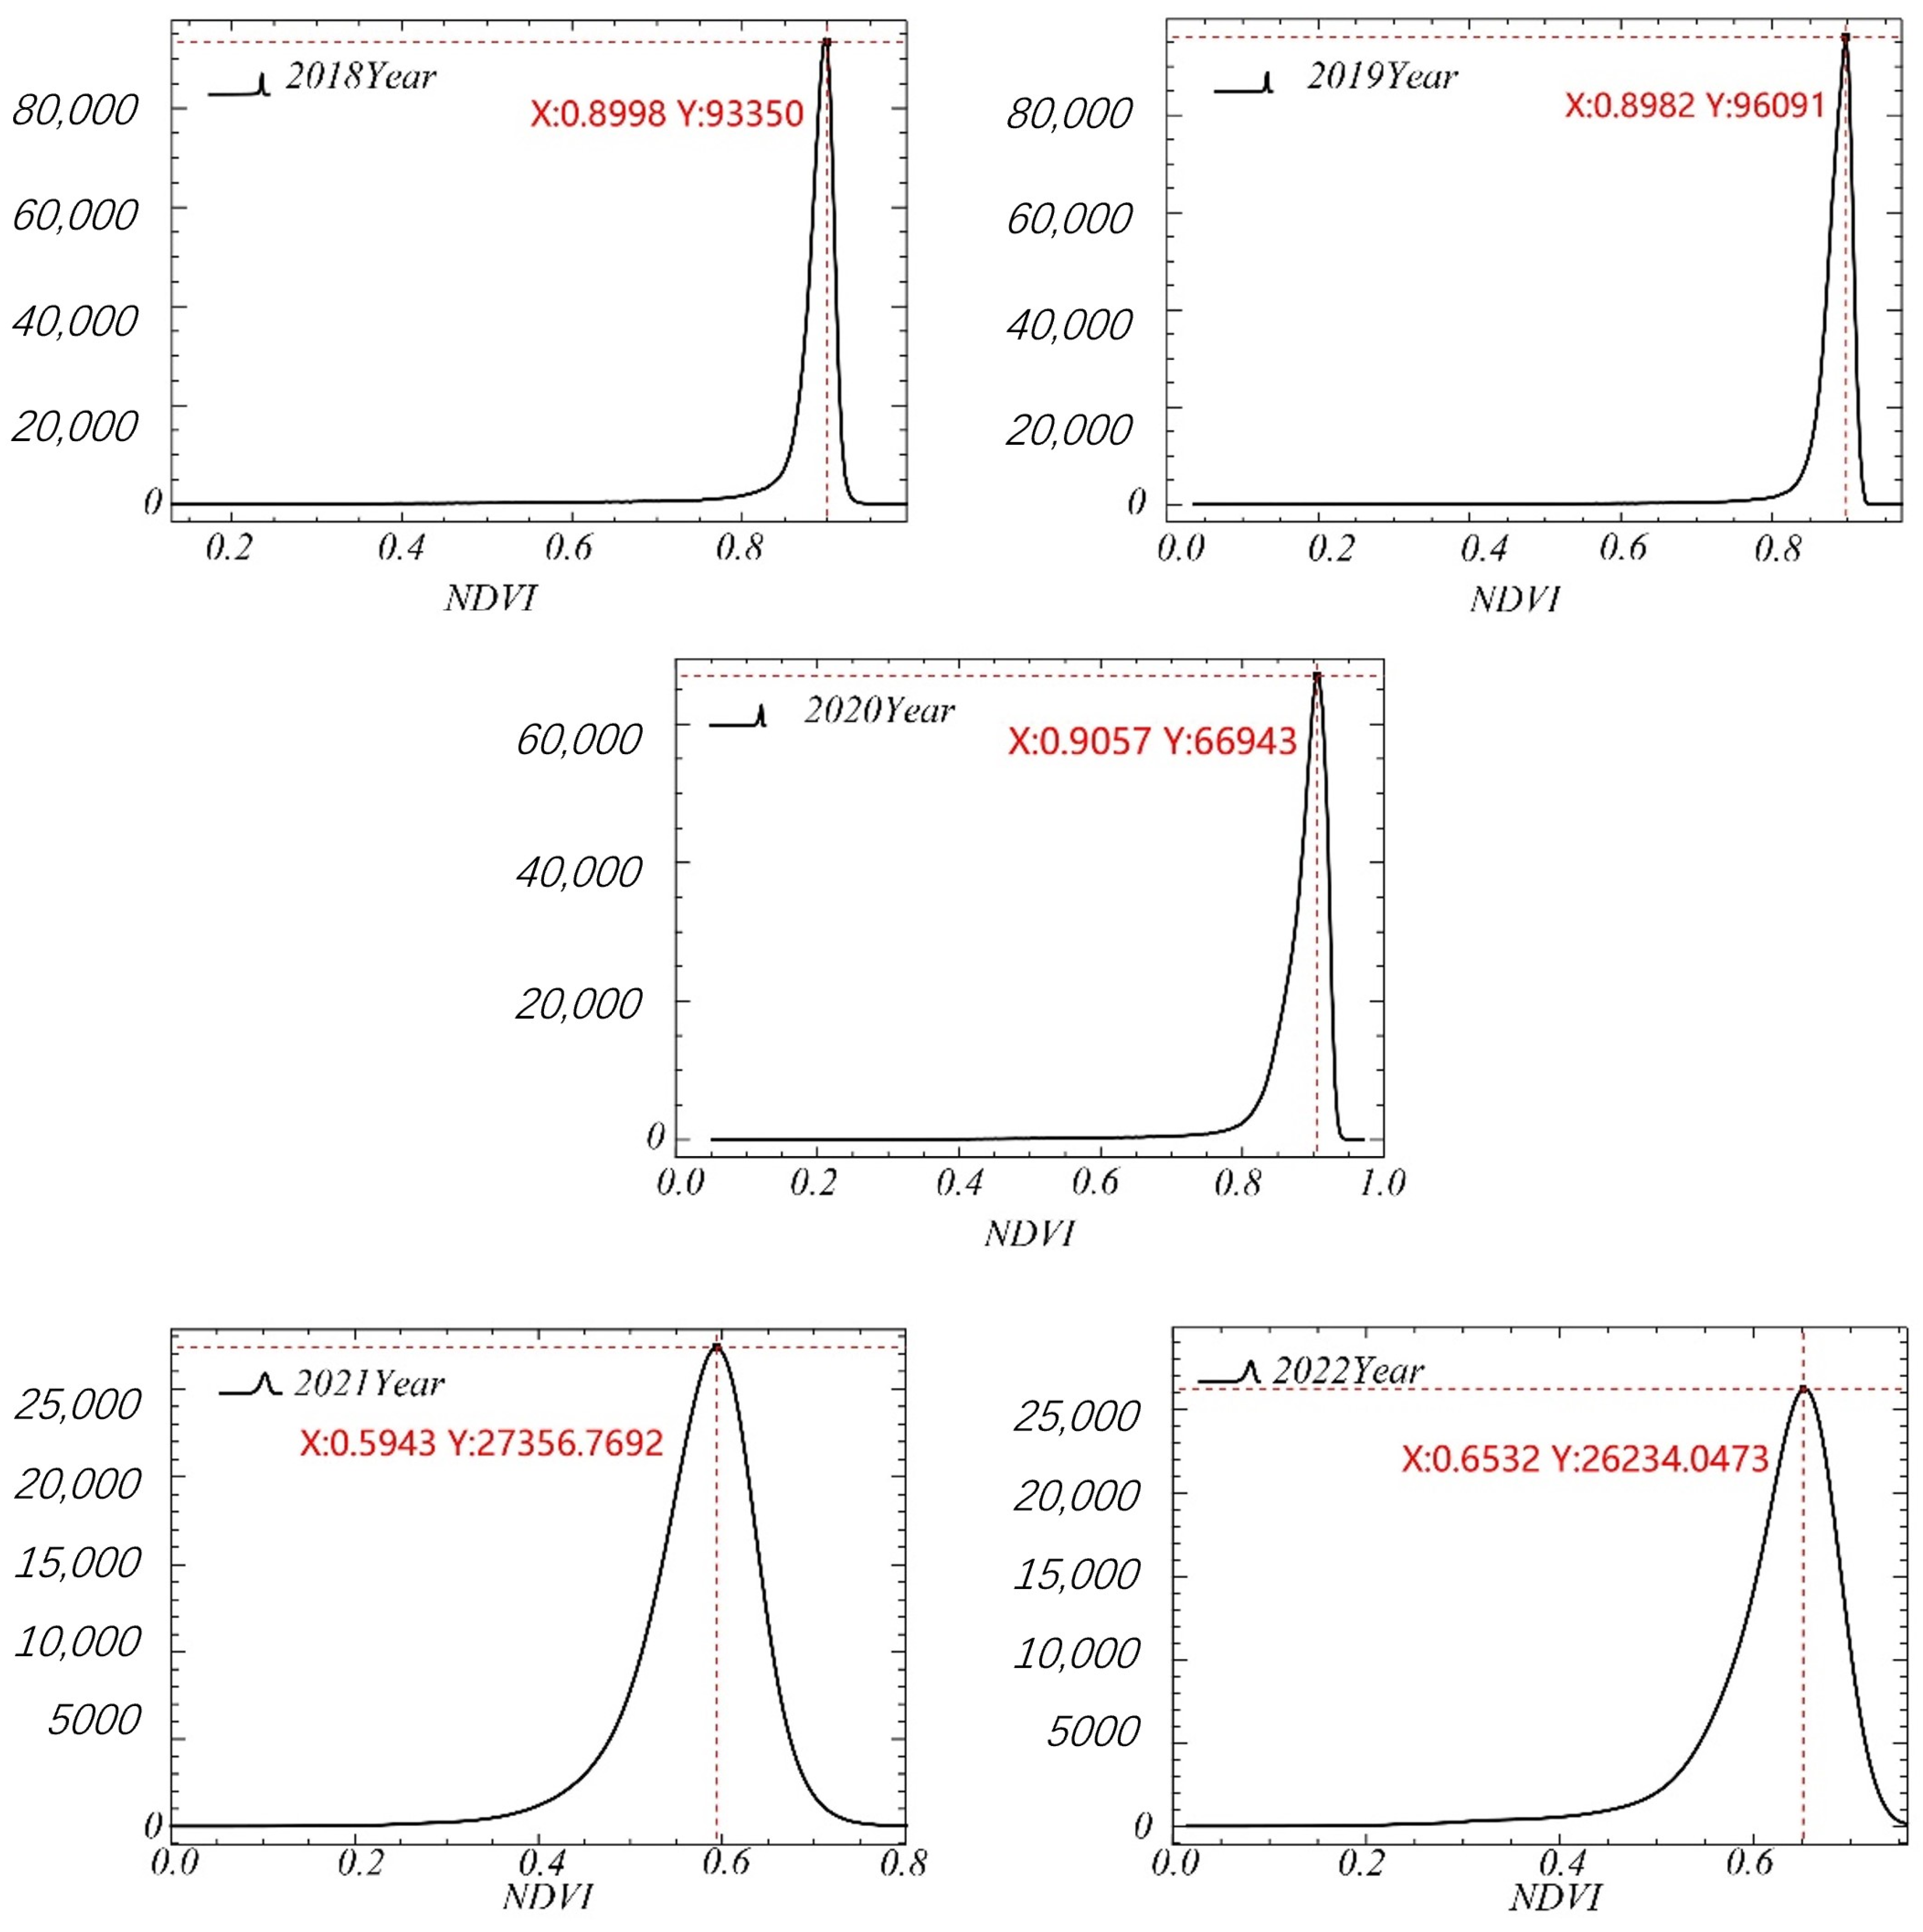
In the case of landslide-type debris flow, NDVI serves as an indicator of vegetation health and coverage changes, allowing monitoring of NDVI alterations. Typically, healthy vegetation exhibits higher NDVI values due to its strong reflection in the near-infrared band. Conversely, landslide debris flow often results in vegetation loss and land cover alteration. Large-scale vegetation decay or disappearance induced by debris flow can significantly decrease NDVI values in affected areas, indicating vegetation absence. The spatial distribution map of NDVI directly depicts the non-uniformity of vegetation cover and reflects areas impacted by debris flow. To ensure an accurate reflection of vegetation growth across various months and years within the same monitoring area, the study selected a timeframe from January 2018 to September 2022, with each year divided into five observation periods: June 2018, August 2019, May 2020, March 2021, and July 2022. Based on the NDVI distribution evolution trend observed during these five periods, statistical analysis was conducted to assess the frequency distribution of NDVI pixels. The frequency distribution of NDVI pixels across the five periods exhibited characteristics consistent with a normal distribution (Figure 8).
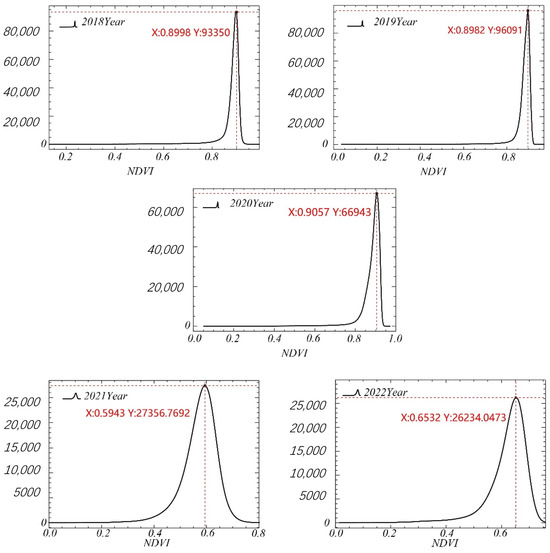
Figure 8.
Relationship curves between NDVI value and the corresponding pixels in different periods from 2019 to 2022 in the study area.
In 2018, the maximum pixel frequency was recorded at 9335, correlating with an NDVI value of 0.8998. Over the years, with seasonal vegetation growth and artificial vegetation management practices, the maximum NDVI value associated with the pixel frequency has exhibited an upward trend. This trend indicates the progressive increase in vegetation greenness and the effectiveness of guided artificial vegetation management measures. Furthermore, the rising NDVI values also signify favorable meteorological conditions and improvements in land development and vegetation restoration efforts.
SBAS-InSAR relies on the matrix singular value decomposition method. In this study, five sets of Sentinel-1A orbital descending image data for the study area were acquired, and the minimum norm solution for surface deformation velocity was computed. Following the untangling of multiple views, differential interferograms were generated to address the space–time incoherence issue, thereby enhancing the accuracy of data processing. The primary processing steps were as follows:
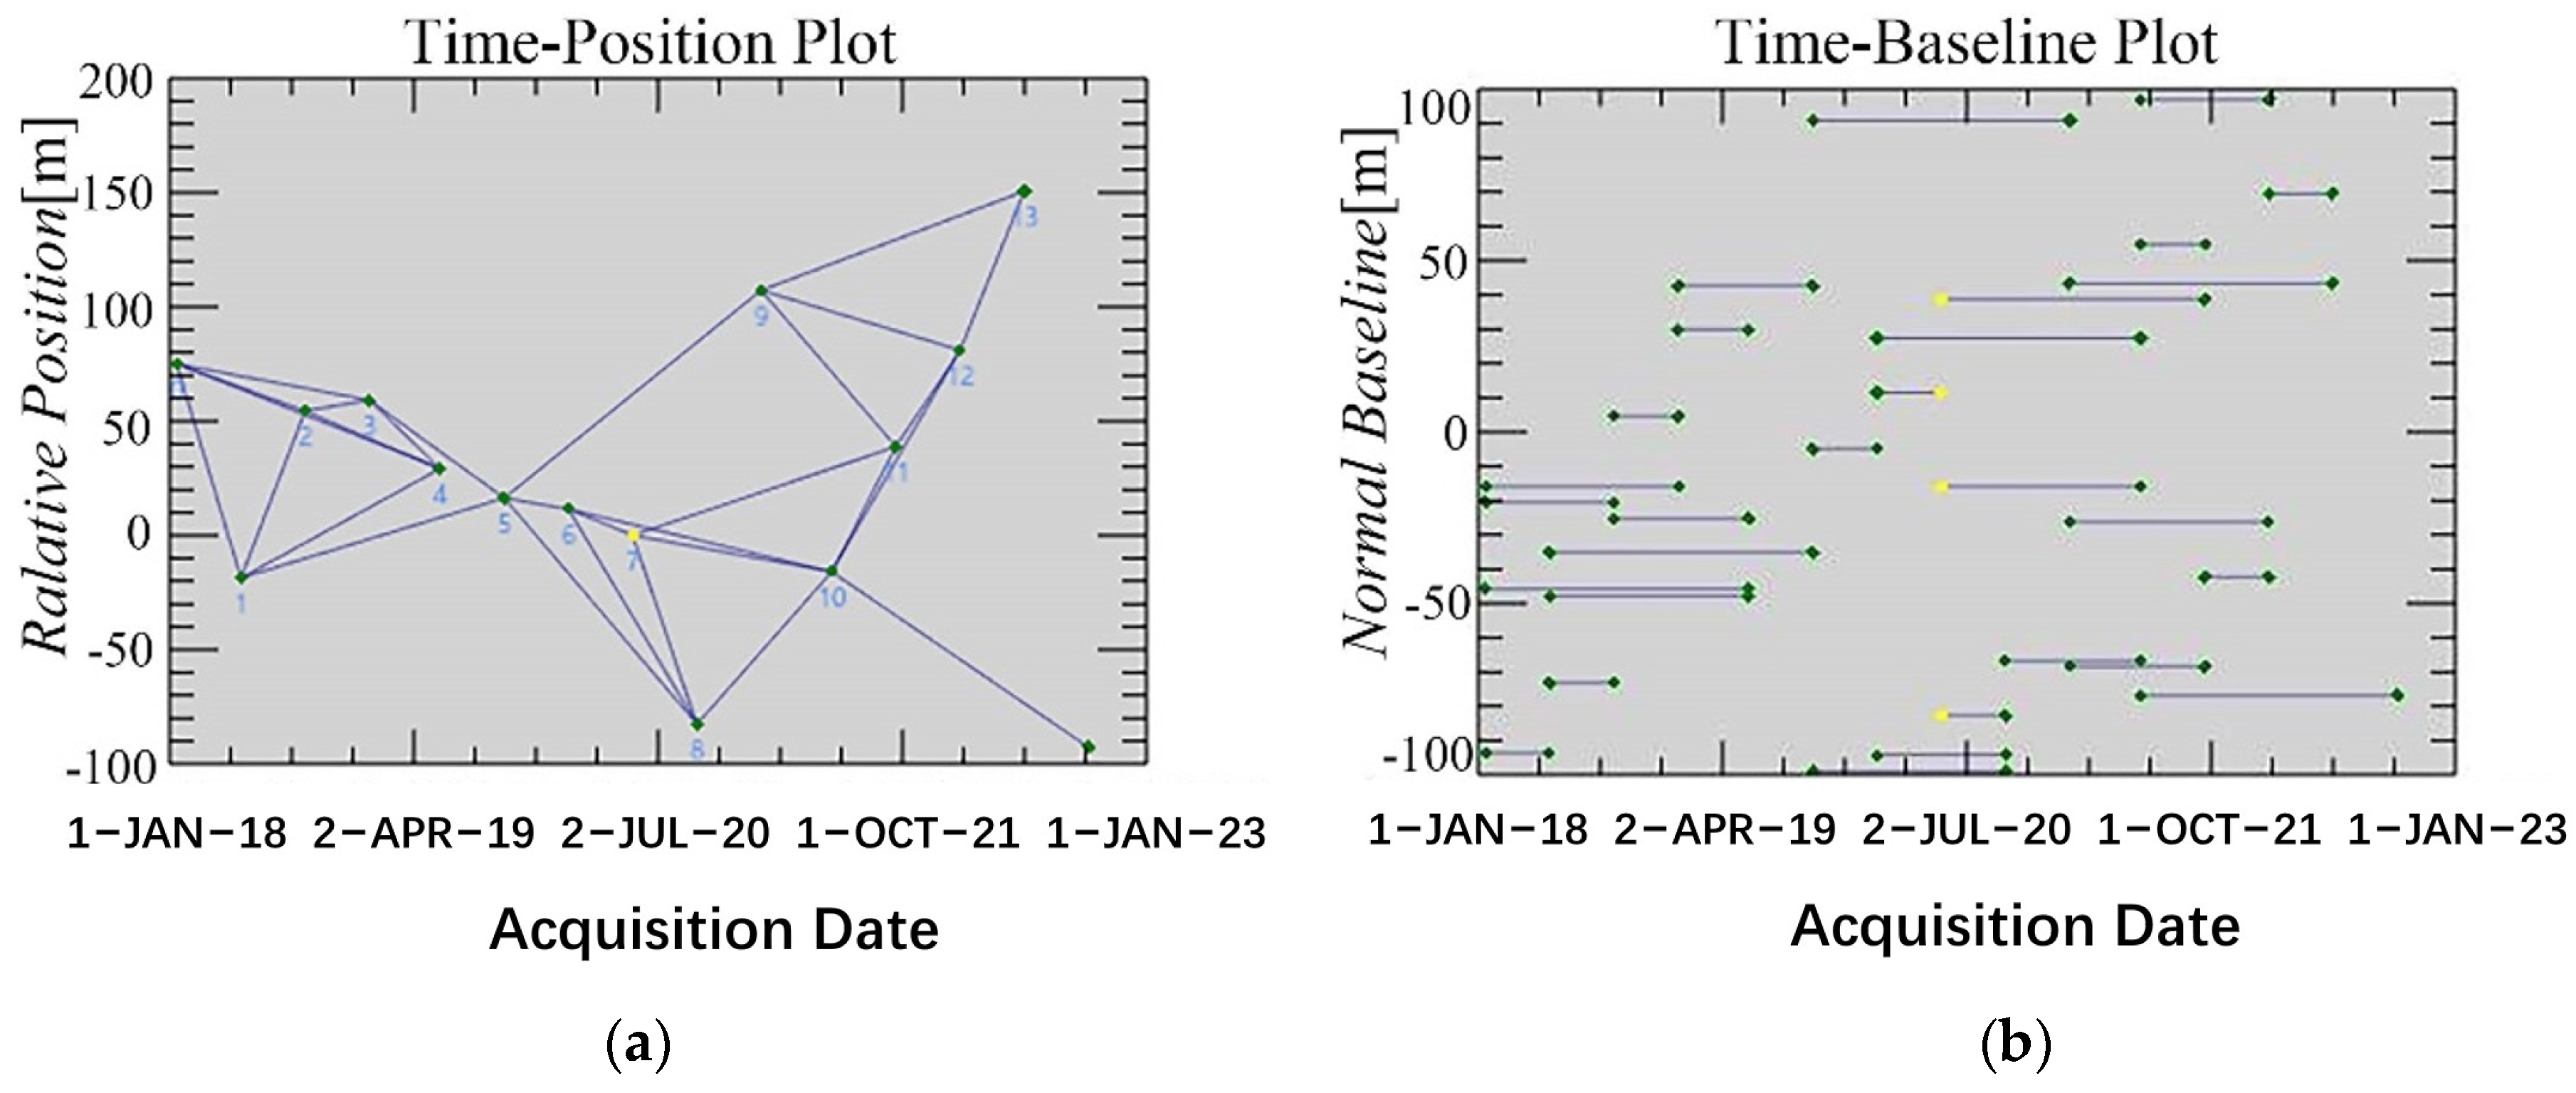
- Interference pair combination. The time and space baselines were calculated for the multi-scene SAR images in different time periods in the coverage area, and the appropriate time and space baseline threshold was selected to select the interference pair (Table 4).
Table 4. Basic parameters of interference pair.The 12-day time baseline was taken as the threshold, interference pairs with poor coherence were excluded, and the estimated results met the experimental requirements. The generated connection diagrams of time baseline and space baseline are shown in Figure 9a and Figure 9b, respectively.
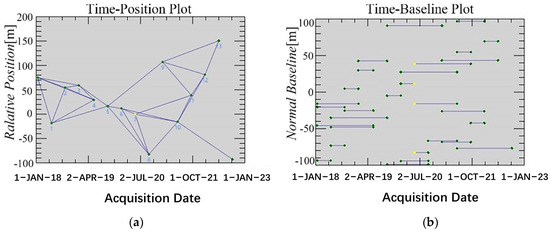 Figure 9. (a) Spatial baseline connection diagram; (b) temporal baseline connection diagram.
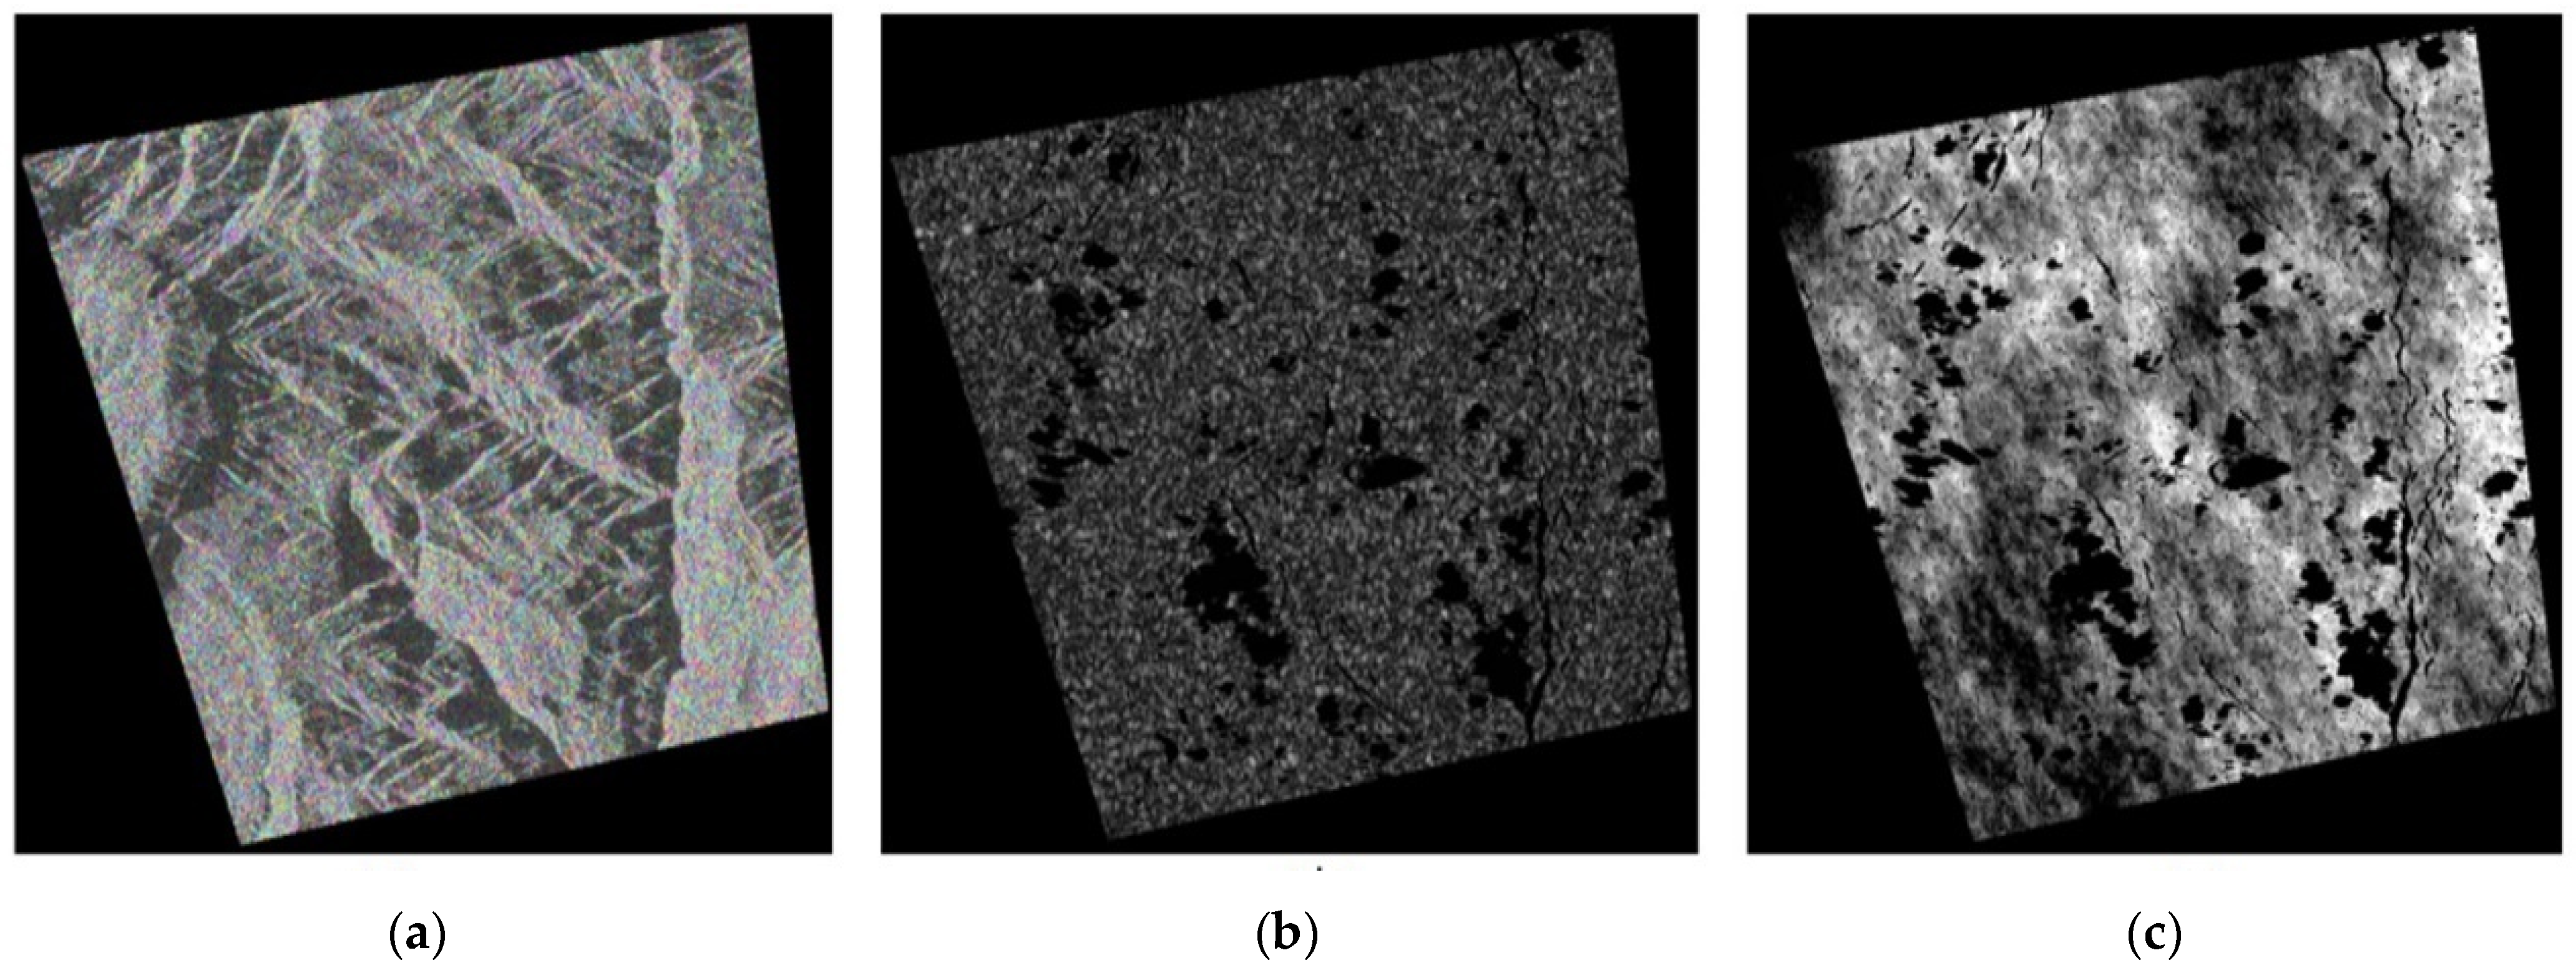
 - Interference pair treatment. Interference processing was carried out on all paired interferogram pairs, including interferogram generation, flattening, filtering, coherence calculation, and phase unwinding. All data pairs were registered to the main image so as to obtain the interferogram (Figure 10a), coherence coefficient diagram (Figure 10b), and phase unwinding diagram (Figure 10c) after filtering and flattening each interference relative pair, which could prepare the data for the next step of orbit refining, rerunning, and SBAS inversion.
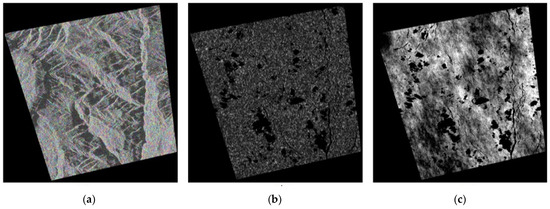 Figure 10. (a) Filtered interference diagram; (b) coherence coefficient diagram; and (c) phase unwrapping diagram.
- Inversion. The residual constant phase and phase ramp after unwinding were estimated and removed. In the initial inversion, deformation rate and residual topography were estimated. In the subsequent inversion, displacement on the time series was calculated, and atmospheric filtering was applied to estimate and eliminate atmospheric phase effects, enhancing the accuracy of the final displacement results on the time series. SAR coordinates were converted to geographic coordinates, and the experimental results were overlaid onto Google images for visualization.
Utilizing remote sensing data-derived vegetation coverage data and NDVI values for each pixel, along with the pixel count of vegetation areas across different time periods, the proportion of landslide-type debris flow occurrences within various vegetation coverage areas was determined.
where P is the proportion of debris flow, expressed in percentage. Aai is the area of debris flow in the i-th pixel. Asj is the total area of the j-th pixel. n is the number of pixels containing debris flow in the study area. m is the total number of pixels in the study area.
3. Results
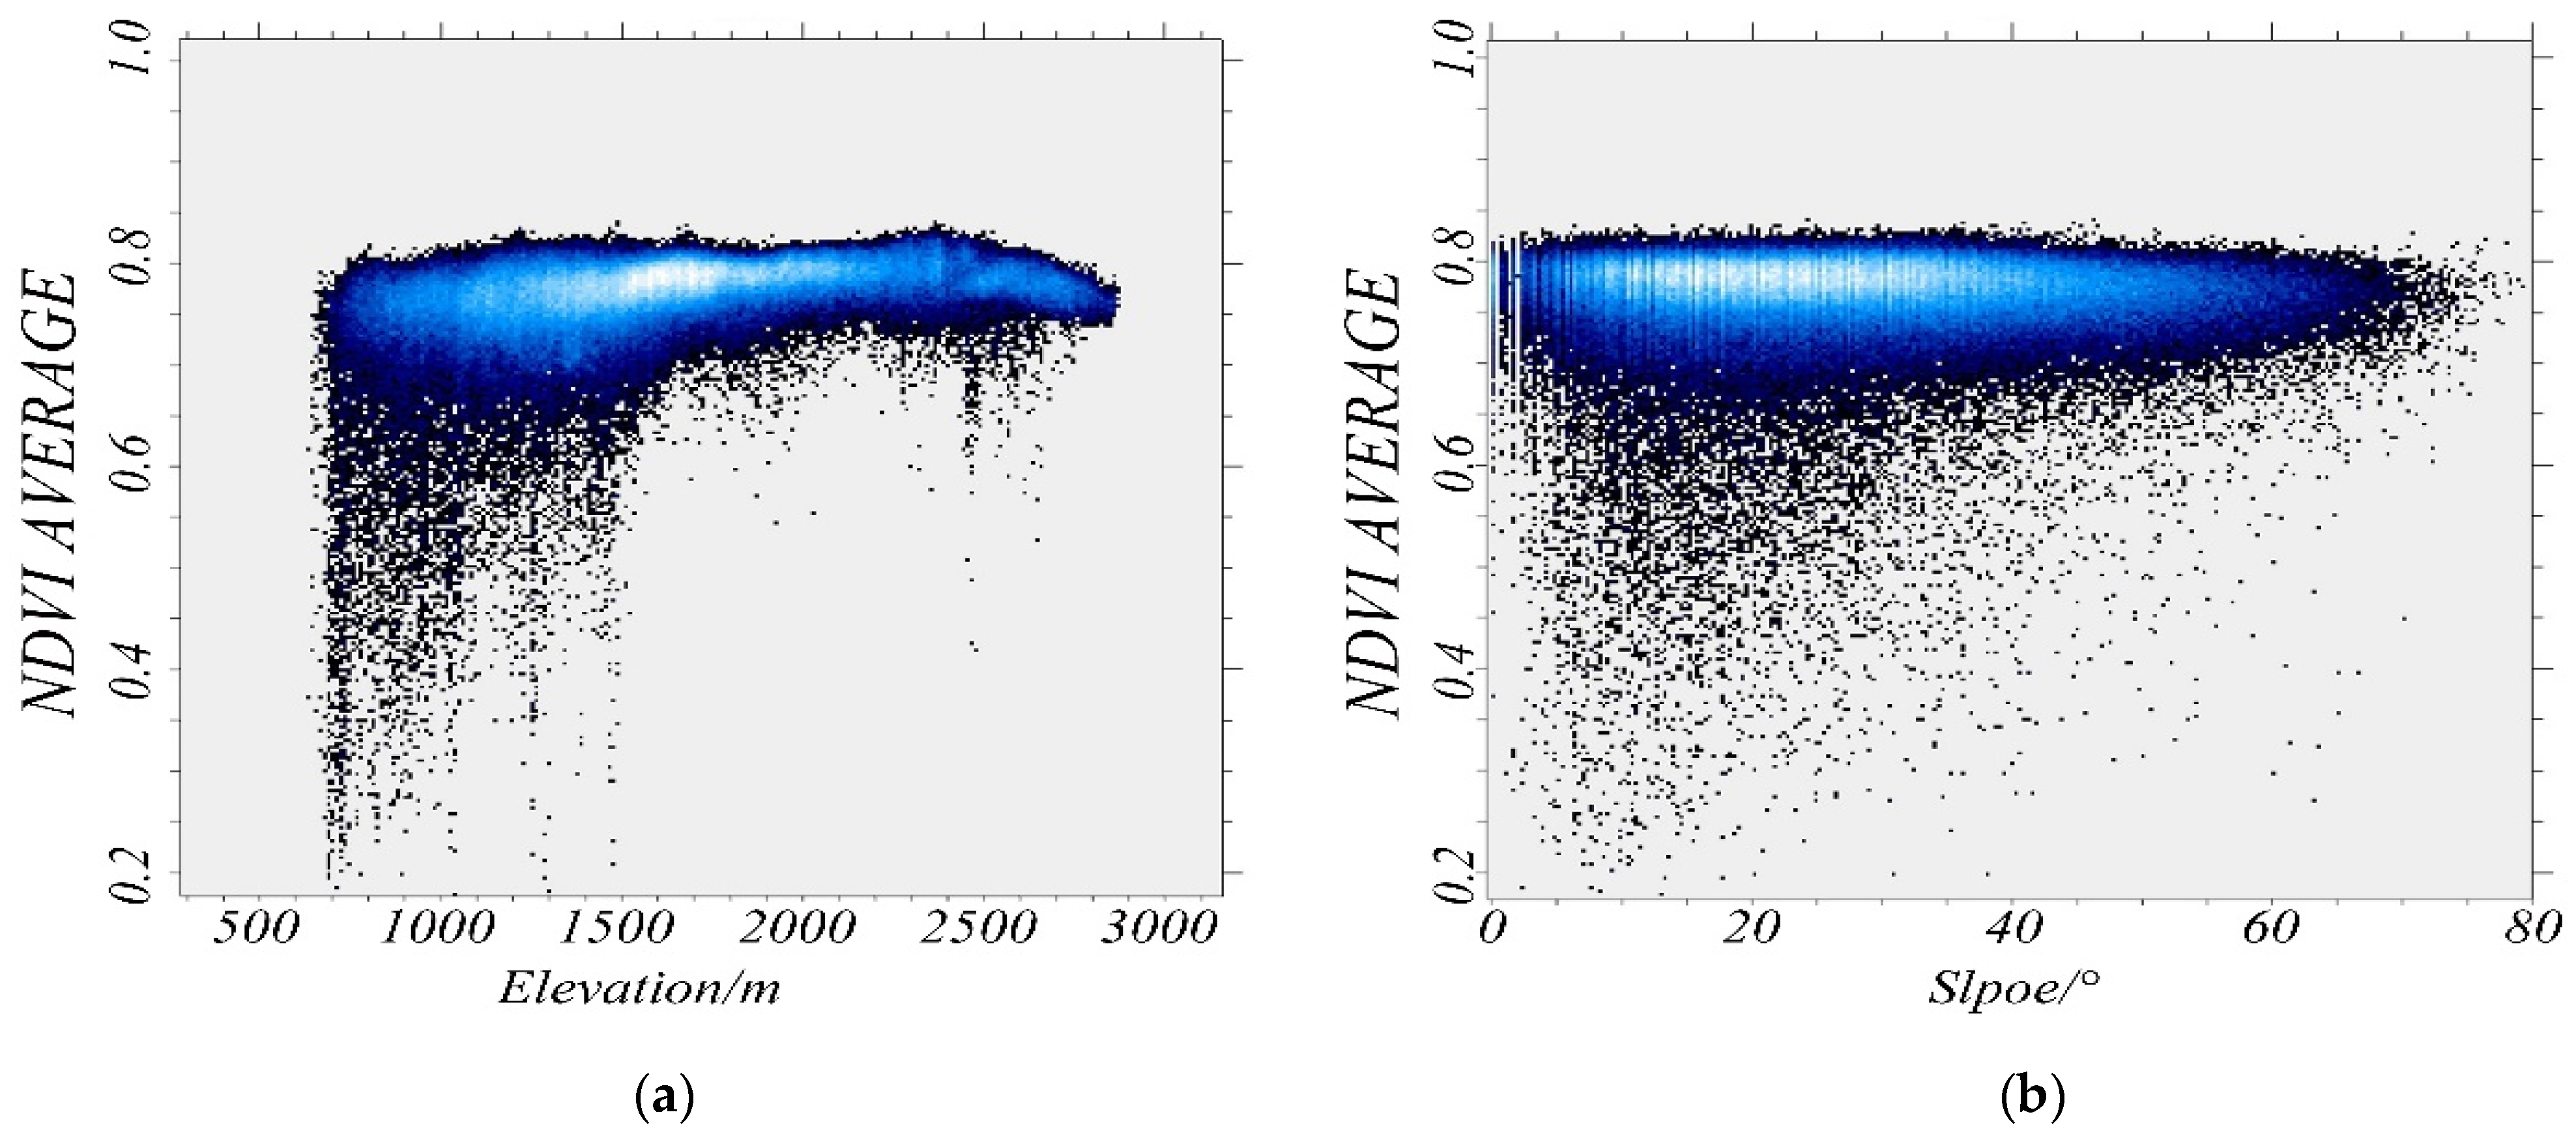
Based on the changes in vegetation coverage with elevation in the study area (Figure 11a), it is evident that in areas with lower coverage, vegetation concentration occurred within the elevation range of 1600 to 2500 m. In regions with low coverage, vegetation cover was concentrated between 700 to 1500 m, 1800 to 2100 m, and 2400 to 2700 m elevation. In areas with medium coverage, two peaks were observed between 700 and 1500 m and 2300 and 2800 m, corresponding to vegetation coverage rates of 0.4–0.6. In regions with high coverage, the maximum coverage reached 0.65 to 0.81, occurring between elevations of 700 and 1700 m, with a peak observed at 1700 m, gradually declining thereafter. Regarding the gradient differentiation rule of vegetation NDVI changes (Figure 11b), it is observed that from 2018 to 2022, vegetation coverage reached its peak value within the slope range of 14° to 38°, with the corresponding peak value recorded at 0.78.

Figure 11.
(a) Scatterplot of NDVI mean value variation with elevation; (b) scatter plot of NDVI mean value with slope variation.
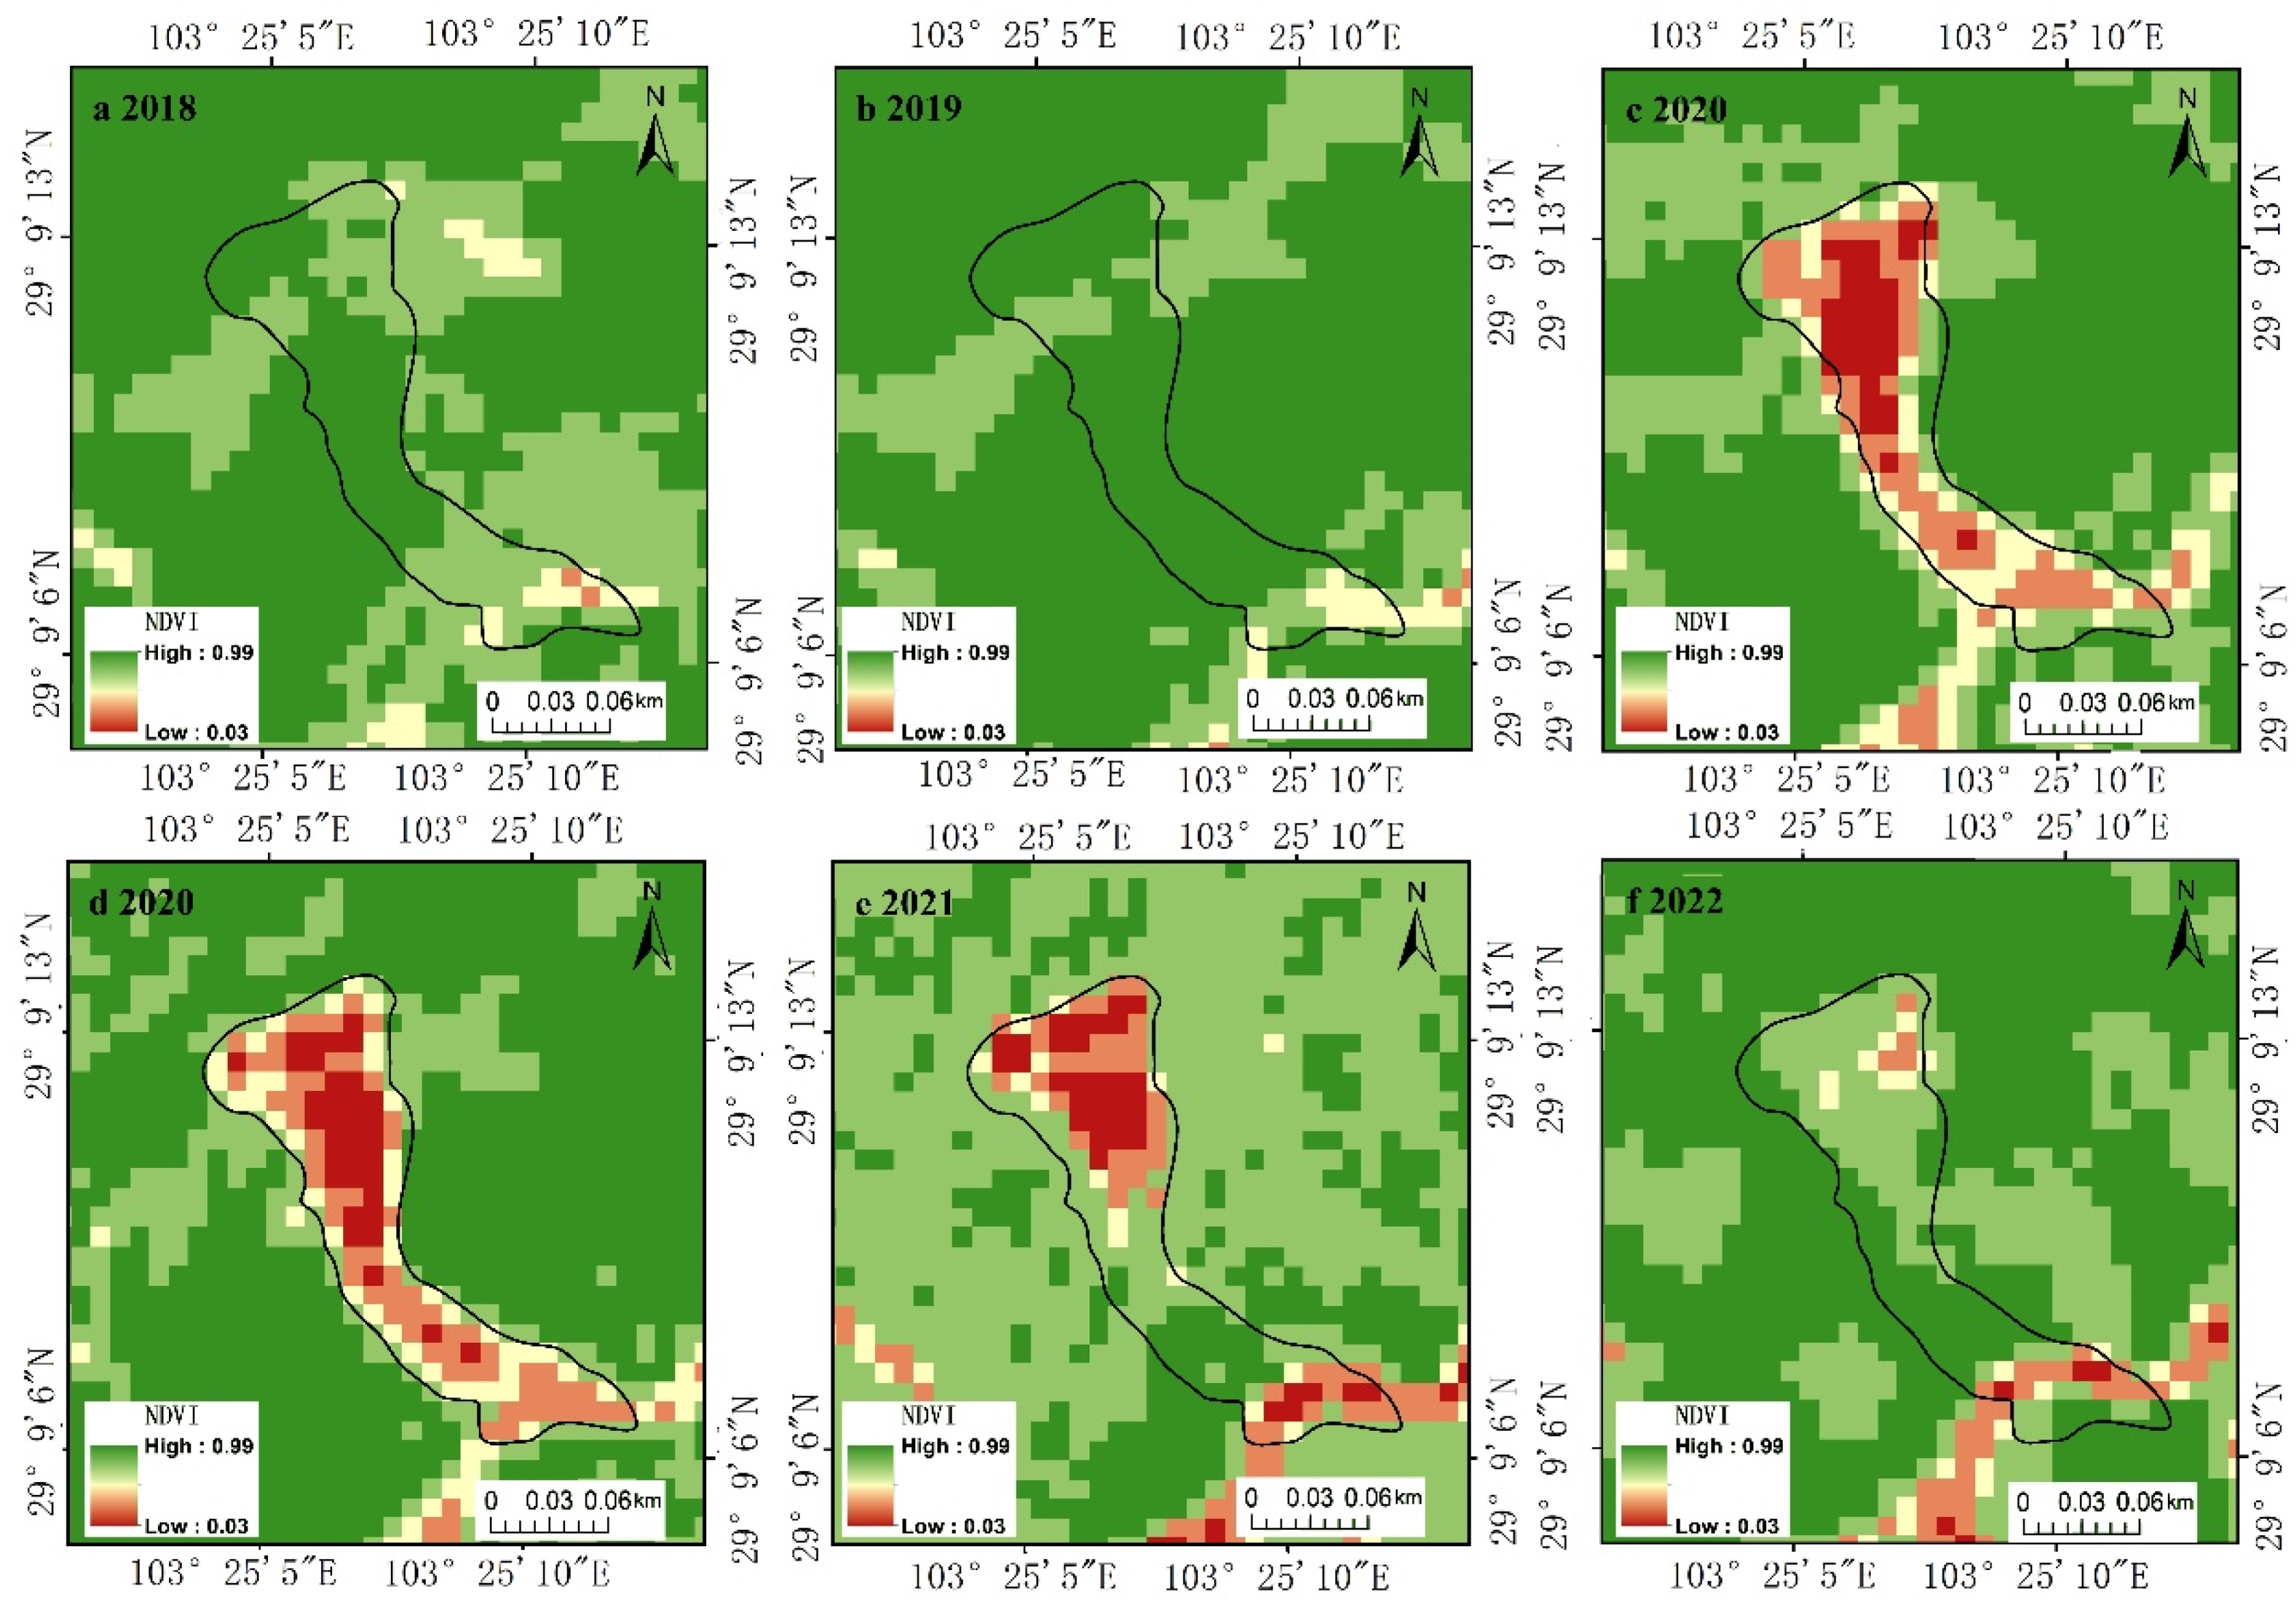
From 2018 to 2020, there was a decreasing trend in the area of high and medium vegetation coverage, albeit at a relatively slow pace. Meanwhile, the area covered by low and lower vegetation coverage increased steadily year by year. The declining trend in high and medium vegetation coverage areas intensified notably from 2020 to 2021, only to reverse slightly from 2021 to 2022. During the observation period from 2019 to 2020, there was a significant increase in the low cover area in the southern part of the study area (highlighted in red). This increase signifies a decline in vegetation cover and degradation of vegetation health attributed to factors such as land use changes (e.g., agricultural expansion, urbanization), extreme weather events, soil erosion, and heightened human activities (Figure 12). The research findings align closely with the susceptibility of landslide debris flow in the region. Through the calculation of each pixel’s classification area, it was determined that the lower and low coverage areas in the northern region represent the high-incidence zones of landslide debris flow, comprising 12% of the total area. Additionally, the medium development areas are dispersed across regions exhibiting sharp declines in vegetation coverage throughout the township, accounting for 9.7% of the total area (Equation (2)).
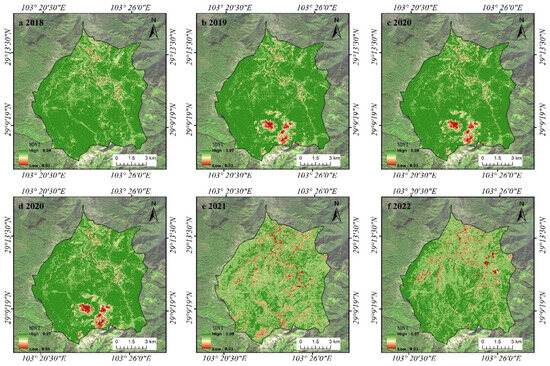
Figure 12.
Spatial and temporal distribution of NDVI from 2018 to 2022.
According to the analysis of landslide-type debris flow development locations in the study area from 2018 to 2022 (Figure 13), it is evident that the locations prone to landslide-type flow align with the expansion of areas with low vegetation cover. This correlation indicates an elevated risk of landslide debris flow formation and development in regions with increased low vegetation coverage.
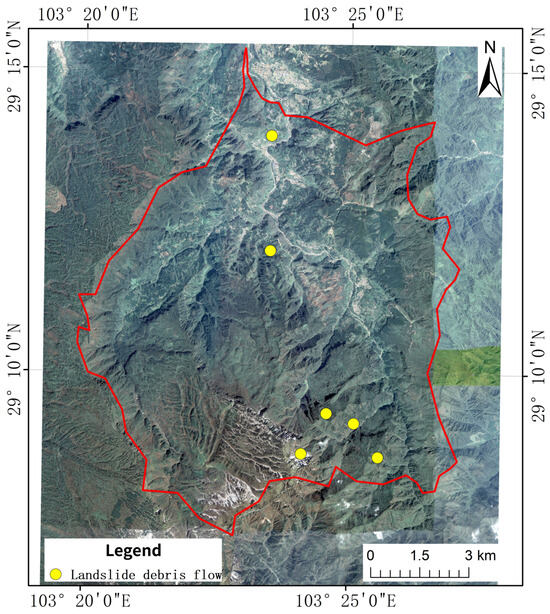
Figure 13.
Statistical map of the prone parts of landslide debris flow in the study area from 2018 to 2022.
Moreover, construction projects within areas of medium coverage and lower to low coverage are primarily concentrated along road edges near water bodies. This concentration facilitates the precise identification of the morphology of debris flow formation areas, flow paths, and accumulation zones (Figure 14). Each pixel in the image serves as an estimator of backscattering within a specific ground range. Consequently, brighter pixels in the image correspond to higher backscattering energy, while darker pixels indicate lower backscattered energy.

Figure 14.
Temporal and spatial sequence evolution of debris flow from 2018 to 2022.
Optical remote sensing technology employs electromagnetic radiation within visible and infrared bands to capture high-resolution images of surface features, recording spectral information pertaining to surface reflection or radiation. On the other hand, SBAS-InSAR derives surface deformation information through differential analysis of SAR interferograms across multiple time periods. By leveraging the strengths of both methods, the consistency in monitoring the development sites of landslide debris flow is affirmed.
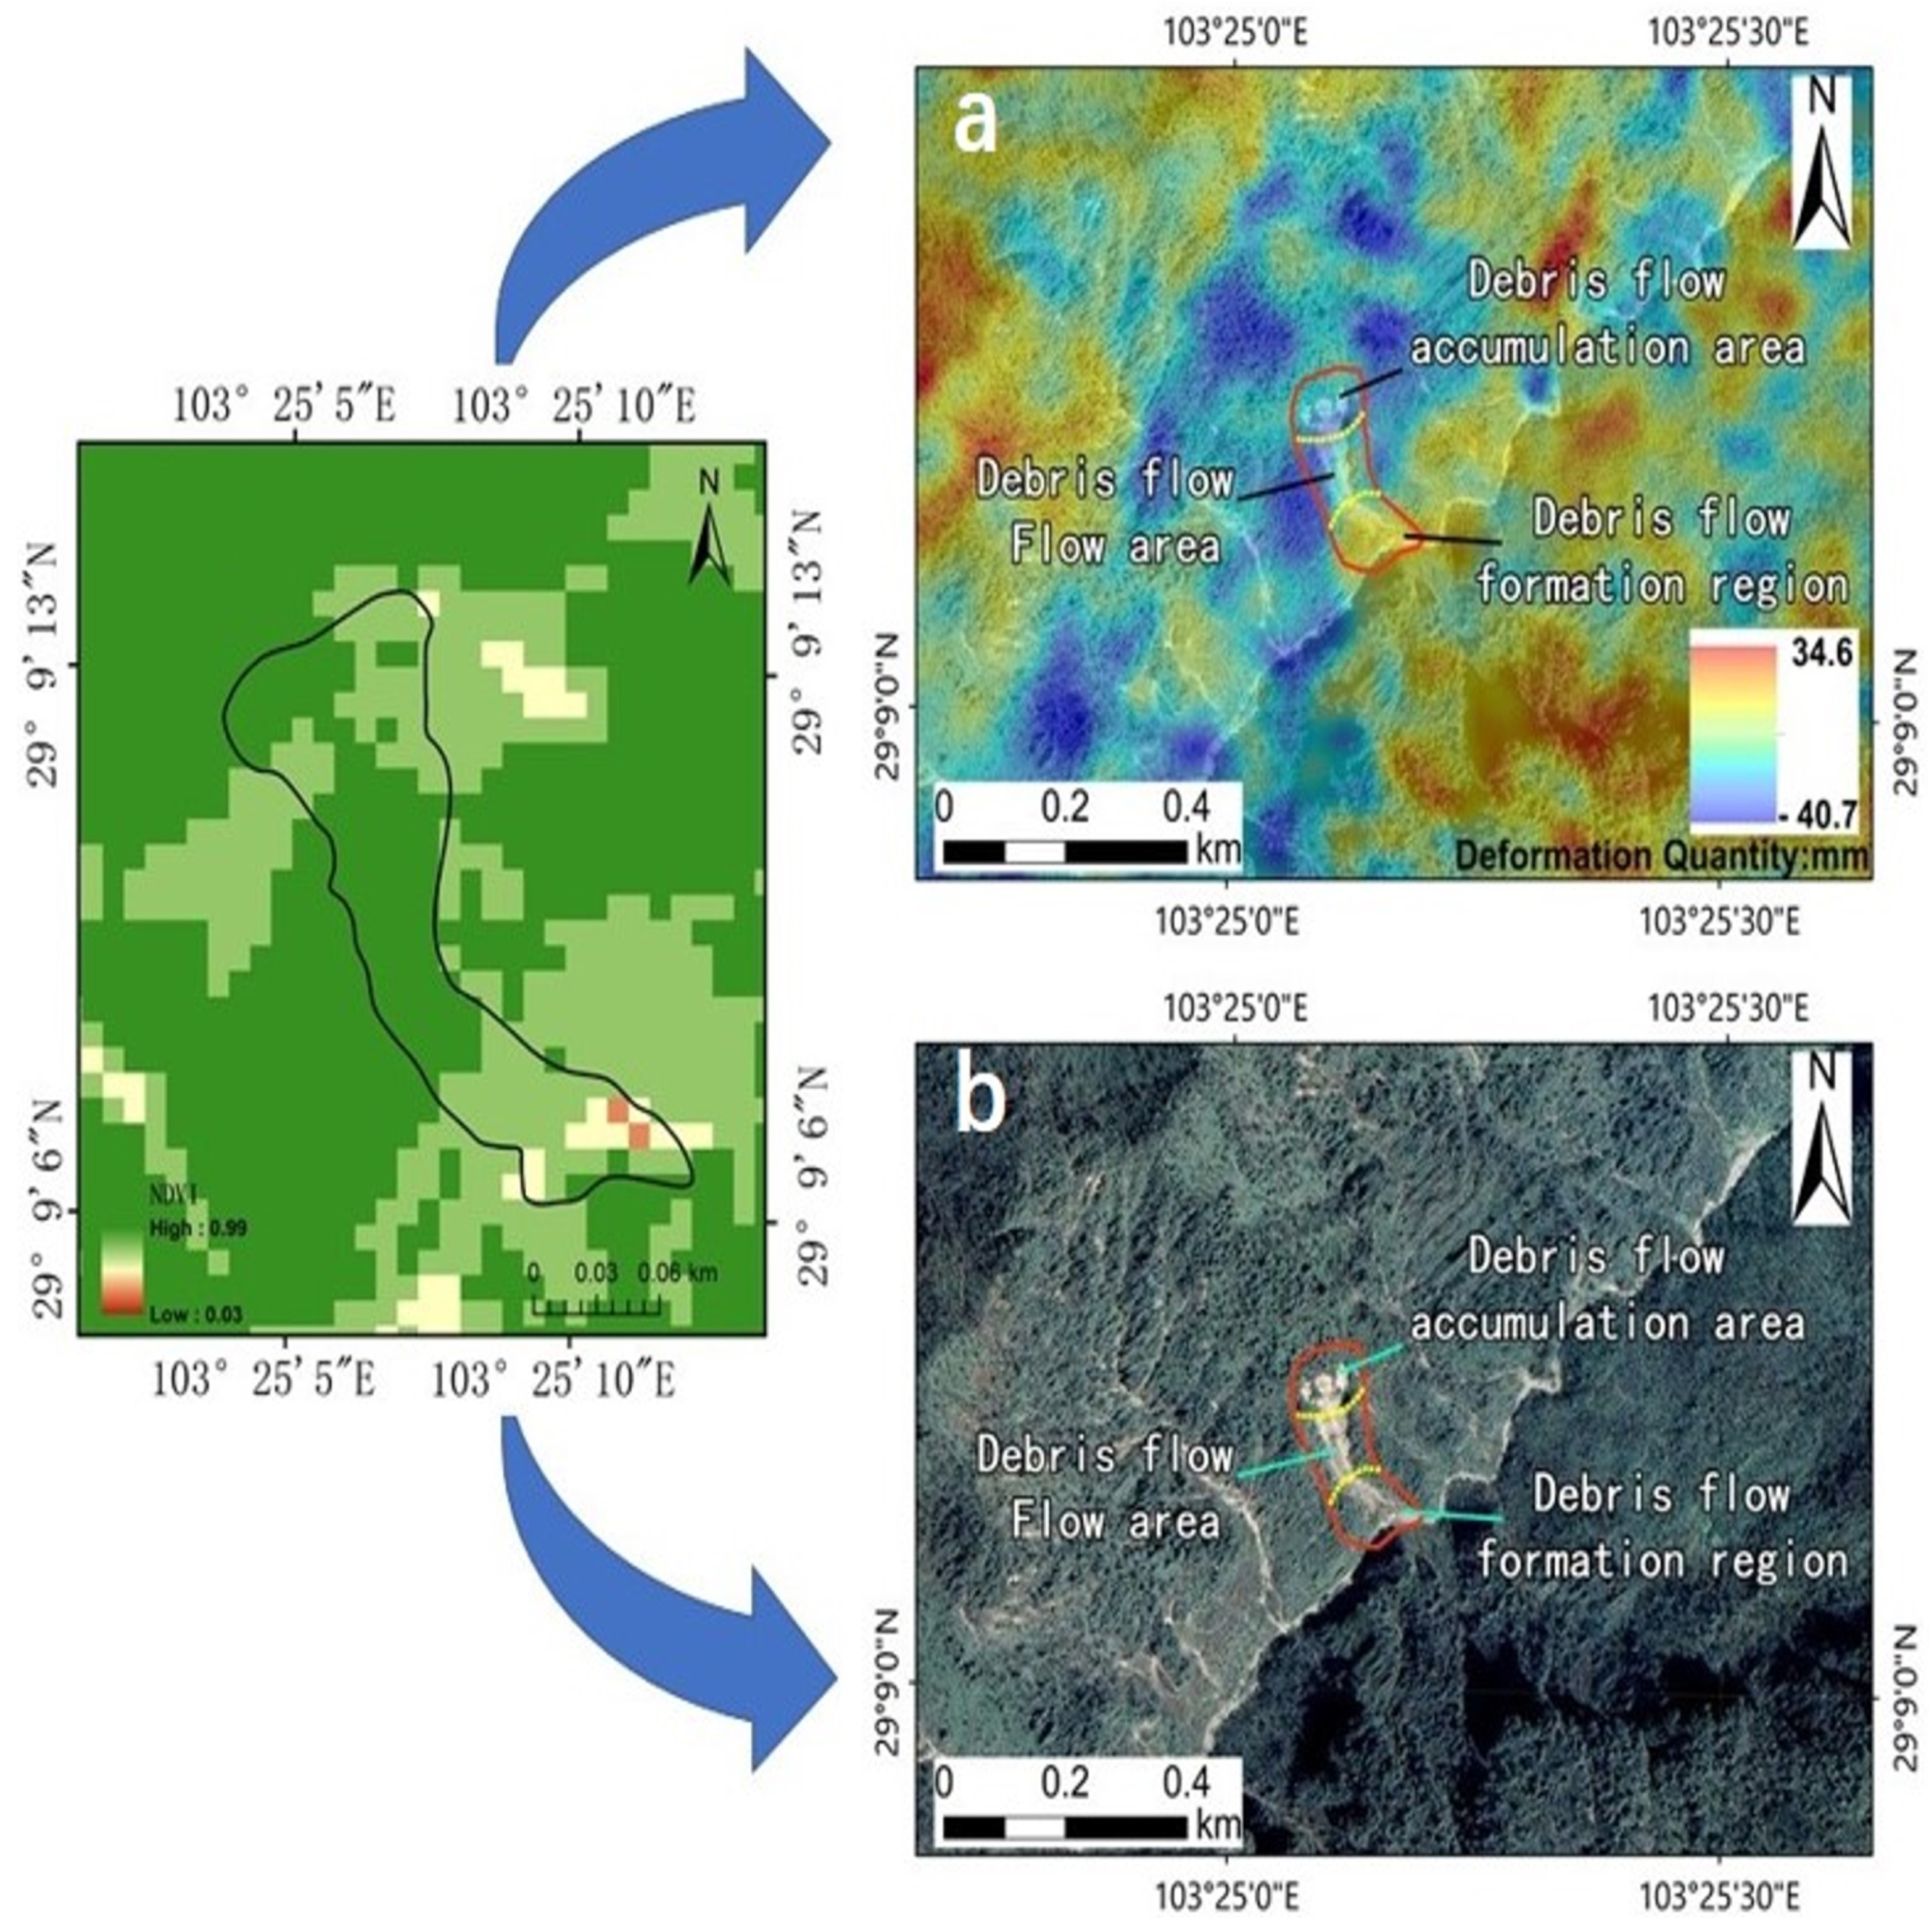
Aerial optical images, obtained through sensors mounted on aircraft or drones, offer a visual representation of the landscape, capturing details of surface features, land cover, and vegetation. In the context of landslide debris flow, these images can reveal visible signs such as soil erosion, vegetation damage, and changes in terrain morphology. The high-resolution nature of aerial optical images allows for detailed analysis of the affected area, aiding in the identification and delineation of landslide debris flow features (Figure 15a). On the other hand, SAR images, acquired using active radar technology from remote sensing satellites, provide information about surface roughness, soil moisture, and terrain characteristics. SAR images are particularly valuable for monitoring changes in the Earth’s surface, including the detection of ground deformation associated with landslide debris flow events. Unlike optical images, SAR images are not affected by weather conditions or time of day, allowing for consistent monitoring even in adverse weather conditions (Figure 15b). By comparing the forms of landslide debris flow extracted from the corresponding aerial optical images and SAR images, the roots of plants play a role in soil stabilization, and the reduction in vegetation coverage in the study area has exacerbated soil erosion and increased groundwater flow. During periods of continuous rainfall, the accumulation of rainwater and surface runoff, combined with hydrological conditions, can exacerbate the impact on geological faults. As a result, the stability of the soil layer is compromised, leading to visible denudation of the exposed rock layer. This denudation manifests in the formation, circulation, and accumulation areas of debris flow, becoming more pronounced under such circumstances. The decrease in vegetation coverage serves as a significant factor in promoting the development of landslides and debris flow, particularly when rainfall does not reach critical levels. It is noteworthy that under such circumstances, the reduced vegetation coverage provides the channel and impetus for the release of energy associated with landslides. However, when rainfall exceeds critical thresholds, despite an increase in vegetation coverage and soil water saturation, vegetation absorption of rainwater mitigates surface runoff but elevates the water content of debris flow. This, in turn, can lead to localized landslides and further promote the development of debris flow.
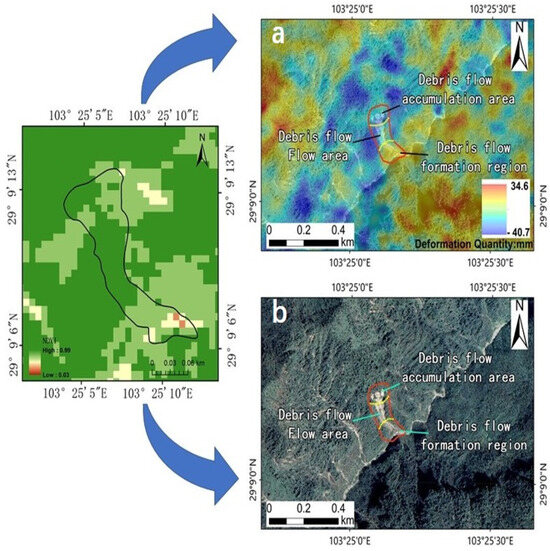
Figure 15.
(a) Optical remote sensing extraction map of landslide debris flow in the study are; (b) SBAS-InSAR extraction map of landslide debris flow in the study area.
4. Discussion
Given the geographical location of the study area within the mountainous surroundings of the basin in western Sichuan, both the geological structure and climatic conditions are notably complex. Despite sparse human settlements, phenomena such as mineral exploitation and deforestation, predominantly driven by human activities, are widespread. Consequently, the region is susceptible to frequent occurrences of landslide-type debris flows. Due to the challenges associated with implementing real-time manual ground investigations comprehensively, there is an urgent need to employ advanced and effective monitoring and investigation methods to mitigate the probability of geological disasters. [42,43,44]. Addressing the aforementioned challenges, this paper introduces a novel approach: a multi-source fusion monitoring and simulation technology combining short baseline interferometry (SBAS-InSAR) and optical remote sensing. This method enables the accurate extraction of landslide debris flow information. By integrating various remote sensing data, including normalized vegetation index, slope, elevation, terrain relief, and formation lithology as constraints, relevant remote sensing image maps are generated. Subsequently, the susceptibility of landslide-type debris flow is objectively evaluated.
Currently, numerous scholars have conducted comprehensive research and analysis on landslide debris flow from diverse perspectives. These studies often involve classifying landslide types based on factors such as active geological structures, topography, and river dynamics. Along the extension areas of active faults, geological conditions become fragile, leading to abnormal rock mass fragmentation and increased susceptibility to water-induced softening, consequently triggering debris flows [45,46]. To meet the requirements of geological hazard risk assessment, researchers have analyzed the changing trends of loose solid sources through the mechanism of the landslide hazard chain. Mathematical models have been developed to classify landslide hazards based on risk levels [47,48]. Additionally, various machine learning models have been utilized to compare the accuracy of different geological hazard susceptibility assessment methods, considering geological environmental conditions and human engineering activities [49,50,51,52]. Building upon previous research endeavors, this paper focuses on the topographic and geomorphic characteristics, as well as land use data, of the study area. By employing multi-source remote sensing technology, this study aims to elucidate the relationship between vegetation coverage changes and the development of landslide-type debris flows. This approach seeks to establish correlations between ecological factors and the progression of land disasters, thereby providing a foundational framework for subsequent research efforts.
The research challenges related to landslide debris flow in the study area primarily stem from several factors. Firstly, the existing research scope within the target area is extensive, with geophysical exploration primarily focusing on petroleum and mineral exploitation. This may result in limited attention being given to non-mineral exploitation issues such as geological disasters. Additionally, studies on geological hazards in the study area often rely on traditional single-factor analyses, such as hydrogeology, atmosphere, and environmental factors. This approach constrains a comprehensive understanding of the complex mechanisms underlying landslide debris flow and may result in outdated or insufficient basic data, leading to delays in research conclusions. Landslide debris flow is influenced by various factors, including terrain, rainfall, and geological structures, among others. However, current research efforts may not adequately address these diverse influencers, necessitating more detailed studies to thoroughly analyze the mechanisms through which different factors impact landslide debris flow. To ensure the accuracy of evaluating the vulnerability of landslide debris flow in the region, this paper leverages previous research findings and applies multi-source remote sensing technology, combining SBAS and optical remote sensing fusion. By extracting landslide debris flow data and correcting external DEM models, this study aims to provide robust data support for subsequent research and offer essential guidance for the deployment of geological disaster monitoring efforts.
However, there is a scarcity of studies focusing on the development and distribution of landslide debris flow in this specific research area. Consequently, correcting external DEM models and extracting and screening effective data proves challenging. Nevertheless, in conjunction with existing field survey data, SBAS-InSAR technology can accurately depict the deformation field and its variations. However, the region’s overall high vegetation coverage and extensive underground water systems pose challenges to effective detection using this method. On the other hand, optical remote sensing offers the capability of extracting changes in surface information, including location, shape, size, shadow, tone, color, texture, pattern, and influence range. This information can be utilized to calibrate the spatial extent of geological disasters and identify potential hidden risks. By leveraging these two methods in tandem, they complement each other’s strengths and can detect the distribution and development of landslide debris flow to a greater extent. This integrated approach is instrumental in the dynamic monitoring of landslide debris flow and the effective prediction of its susceptibility.
To enhance the accuracy of susceptibility evaluations for landslide debris flow, additional influencing factors such as surface runoff and seismic intensity should be incorporated in subsequent stages. This necessitates strengthening geophysical exploration efforts in the region to gather more effective data. By drawing susceptibility evaluation maps that incorporate these factors, it becomes possible to accurately classify high-incidence and low-incidence areas of landslide debris flow. Ultimately, this approach aims to enhance the effectiveness of debris flow disaster prevention measures.
5. Conclusions
In this paper, optical remote sensing and SBAS-InSAR fusion technology were used to extract landslide debris flow data from the study area in multiple dimensions. By processing the extracted data, interference such as space–time discorrelation and phase unentanglement could be avoided, and the resolution of image information was able to be improved. At the same time, through the analysis and research of the bidirectional constraints of the change in vegetation coverage, the change in debris flow distribution, and the characteristics of debris flow morphology, a new idea was provided for disaster monitoring so as to avoid the huge loss of life safety and economic development caused by geological disasters.
The study area boasts a diverse range of mineral resources; however, the complexity of its geomorphological features has led to a lack of geological exploration activities, resulting in slow updates to geological structure data and incomplete statistical data on the distribution and development of geological hazards. Currently, most research data stem from traditional methods such as formation drilling, magnetic exploration, and radioactive exploration, posing challenges to the accuracy and completeness of monitoring information. Given these challenges, dynamic monitoring of the development and distribution characteristics of landslide debris flow in this area is of paramount importance. Such monitoring endeavors not only mitigate potential casualties and economic losses stemming from geological disasters but also provide effective guidance for the process of mineral resources development.
This paper utilizes multi-source and multi-temporal high-resolution Sentinel-1A data, along with revised NDVI data, as the foundation for analysis. Optical pixel offset tracking technology serves as the core of optical remote sensing monitoring. By effectively reducing noise in acquired surface deformation errors, this method ensures the accuracy of monitoring results. Notably, it offers strong timeliness and rich spectral information, facilitating the direct display of distribution characteristics of various terrain factors in the low-frequency coefficient space. However, the significant topography of the region necessitates consideration of shadow error images, which must be addressed using additional technical approaches. Given the unique characteristics of the study area, SBAS-InSAR is employed for pixel offset tracking. SBAS-InSAR pixels are typically distributed across targets in non-urban areas, making its monitoring data well-suited for sparse regions with high order coherence.
Author Contributions
Conceptualization, H.G. and A.M.M.-G.; methodology, H.G.; software, H.G.; validation, H.G. and A.M.M.-G.; formal analysis, H.G.; investigation, H.G. and A.M.M.-G.; resources, H.G.; data curation, H.G.; writing—original draft preparation, H.G. and A.M.M.-G.; writing—review and editing, H.G. and A.M.M.-G.; visualisation, H.G.; supervision, H.G. and A.M.M.-G.; project administration, A.M.M.-G.; funding acquisition, A.M.M.-G. All authors have read and agreed to the published version of the manuscript.
Funding
This research received no external funding.
Data Availability Statement
The raw data supporting the conclusions of this article will be made available by the authors on request.
Acknowledgments
This research was supported by MCIN/AEI/10.13039/501100011033 and the GEAPAGE research group (Environmental Geomorphology and Geological Heritage) of the University of Salamanca.
Conflicts of Interest
The authors declare that they have no known competing financial interests or personal relationships that could have appeared to influence the work reported in this paper.
References
- Jia, J.; Li, Z.Z.; Guo, X.P.; Wu, W.Y. Application of multi-source remote sensing technology in the investigation of rain-induced geological disasters in Mianxian County. J. Northwest Geol. 2023, 56, 268–280. [Google Scholar]
- Ghaderpour, E.; Antonielli, B.; Bozzano, F.; Mugnozza, G.S.; Mazzanti, P. A fast and robust method for detecting trend turning points in InSAR displacement time series. J. Comput. Geosci. 2024, 185, 105546. [Google Scholar] [CrossRef]
- Yi, Y.N.; Xu, X.W.; Xu, G.Y.; Gao, H.R. Landslide Detection Using Time-Series InSAR Method along the Kangding-Batang Section of Shanghai-Nyalam Road. J. Remote Sens. 2023, 15, 1452. [Google Scholar] [CrossRef]
- Li, X.; Li, S.D.; Chen, J.; Liao, Q.L. Coupling mechanism of internal and external dynamics in the formation of geological hazards. Chin. J. Rock Mech. Eng. 2008, 9, 1792–1806. [Google Scholar]
- Wang, Z.Y.; Cui, P.; Liu, H.X. Mountain disaster caused by Wenchuan earthquake and management strategy of blocked lake. J. Hydraul. Eng. 2010, 41, 757–763. [Google Scholar]
- Xiao, H.; Shao, H.; Long, J.; Zhang, S.; He, S.; Wang, D. Spatial-temporal pattern evolution and geological influence factors analysis of ecological vulnerability in Western Sichuan mountain region. Ecol. Indic. 2023, 155, 110980. [Google Scholar] [CrossRef]
- Zhao, J.W.; Chen, G.Y.; Zhao, X.C.; Zhang, L.; Nie, X.; Ying, S.L. Gas and water distribution characteristics and main controlling factors of tight sandstone gas reservoir in X2 Member, Xinchang area, western Sichuan. Fault-Block Oil Field 2024, 2, 1–13. [Google Scholar]
- Huang, H.Y. Dynamic monitoring and analysis of land use based on Remote sensing and GIS. Mapp. Geol. 2023, 5, 202–206. [Google Scholar]
- Taiwo, B.E.; Kafy, A.A.; Samuel, A.A.; Rahaman, Z.A.; Ayowole, O.E.; Shahrier, M.; Abosede, O.O. Monitoring and predicting the influences of land use/land cover change on cropland characteristics and drought severity using remote sensing techniques. Environ. Sustain. Indic. 2023, 18, 100248. [Google Scholar] [CrossRef]
- Darem, A.A.; Alhashmi, A.A.; Almadani, A.M.; Alanazi, A.K.; Sutantra, G.A. Development of a map for land use and land cover classification of the Northern Border Region using remote sensing and GIS. Egypt. J. Remote Sens. Space Sci. 2023, 26, 341–350. [Google Scholar] [CrossRef]
- Tian, S.C.; Liu, X.H. Characteristics and cause analysis of geological hazards in Ebian Yi Autonomous County, Sichuan Province. Jilin Water Resour. 2015, 1, 36–40. [Google Scholar]
- Ortiz, V.J.A.; Martínez-Graña, A.M. A Neural Network Model applied to Landslide Susceptibility Analysis (Capitanejo, Colombia). Geomat. Nat. Hazards Risk 2018, 9, 1106–1128. [Google Scholar] [CrossRef]
- Guo, A.Q.; Hu, J.; Zheng, W.J.; Gui, R.Z.G.; Zhu, W.; He, L.H. N-BEATS deep learning method for landslide deformation monitoring and prediction based on time-series InSAR: A case study of Xinpu landslide. J. Geod. Cartogr. 2019, 51, 2171–2182. [Google Scholar]
- Peng, Y.; Wu, Y.L.; Yang, Y.; Yuan, H.Q. Research on landslide monitoring based on short baseline InSAR technology: A case study of Maoxian County, Sichuan Province. Urban Surv. 2022, 6, 102–107. [Google Scholar]
- Liu, R.; Luo, S.B.; Xu, Y.; Li, G.; Gou, X. Geological hazard susceptibility evaluation in E’bian County based on GIS and slope unit. Sci. Technol. Eng. 2023, 23, 7678–7685. [Google Scholar]
- Hu, Q.L.; Wang, Y.S. Evaluation of landslide hazard vulnerability in western Sichuan geomorphic transition zone based on GIS. J. Chengdu Univ. Technol. Nat. Sci. Ed. 2018, 45, 746–753. [Google Scholar]
- Bai, Y.J.; Tie, Y.B.; Meng, M.J.; Xiong, X.; Gao, Y.; Ge, H.; Ba, R.; Xu, W. Development characteristics and spatiotemporal distribution of geological hazards in western Sichuan. Sediment. Tethys Geol. 2022, 42, 666–674. [Google Scholar]
- Qin, Y.L.; Wu, J.L.; Zhan, H.Y. Discussion on distribution correlation between active faults and geological hazards in Ganzi area, western Sichuan. J. Geomech. 2021, 27, 463–474. [Google Scholar]
- Hao, J.; Jia, Z.Q.; Shen, H.T. Factor analysis of neotectonic activity and secondary landslide disaster in the middle and northern section of Minjiang Fault. Contemp. Chem. Res. 2023, 15, 122–124. [Google Scholar]
- Lunina, V.О.; Gladkov, A.A.; Bochalgin, V.A. Low-amplitude brittle deformations revealed by UAV surveys in alluvial fans along the northwest coast of Lake Baikal: Neotectonic significance and geological hazards. Remote Sens. Environ. 2024, 300, 113897. [Google Scholar] [CrossRef]
- Zhu, Q.; Zeng, H.; Ding, Y.; Xie, X.; Liu, F.; Zhang, L.; Li, H.; Hu, H.; Zhang, J.; Chen, L.; et al. Review on analysis methods of major landslide hazards. J. Surv. Mapp. 2019, 48, 1551–1561. [Google Scholar]
- Xu, R.C. Probability Identification and Prediction of Potential Landslide Hazard Area of Sichuan Tibet Communication Corridor Based on Slope Unit; Chengdu Institute of Mountain Hazards and Environment, Ministry of Water Resources, Chinese Academy of Sciences: Chengdu, China, 2020. [Google Scholar]
- Ahmad, R.; Mahdi, M.K.; Reza, D. Structural Characteristics and Formation Mechanism of the Earth Fissures as a Geohazard in Birjand, Iran. Appl. Sci. 2022, 12, 4144. [Google Scholar]
- Hu, D.S.; Wang, F.; Li, T.; Lian, X.G. Study on correlation between crack distribution and mining surface deformation index by UAV Remote sensing at low altitude. Met. Min 2024, 2, 1–12. [Google Scholar]
- Snehalata, C.; Nitin, P.; Gajanan, S.; Meshram, M.R. A spatio-temporal study of land use land cover change detection using GIS and remote sensing techniques. Int. J. Bio-Resour. Stress Manag. 2021, 12, 26–31. [Google Scholar]
- Liang, J.H. Research on Land use change based on Remote Sensing image processing. Surv. Mapp. Spat. Geogr. Inf. 2023, 46, 110–113+117. [Google Scholar]
- Han, K.L. Research on the Development of Land Archives Information Resources Based on Geographic Information Technology; Heilongjiang University: Harbin, China, 2023. [Google Scholar]
- Li, S.S. Research on land use change based on Remote sensing image processing technology. Surv. Mapp. Spat. Geogr. Inf. 2023, 46, 94–96+99. [Google Scholar]
- Xin, L.B.; Han, L.; Li, L.Z. Intelligent Identification of Landslides Based on Multi-Source Data Fusion. J. Earth Sci. Environ. 2023, 45, 920–928. [Google Scholar]
- Wang, Z.W.; An, L.M.; Zhang, B.; Jia, S.C.; Wang, H.X.; Ru, M.; Zhang, Y.H. Surface collapse monitoring in mining area combined with SBAS-InSAR and optical remote sensing. Sci. Technol. Eng. 2019, 23, 7239–7246. [Google Scholar]
- Yang, P.Z.; Cui, S.H.; Pei, X.G.; He, S.; Wang, H.; Liang, Y.F. Deformation evolution of large toppling deformation based on SBAS-InSAR and optical remote sensing images. Bull. Geol. Sci. Technol. 2023, 42, 63–75. [Google Scholar]
- Yang, M.S. Study on Monitoring Method of Landslide Change by Long Time Series Multi-Source Remote Sensing; University of Chinese Academy of Sciences (Institute of Remote Sensing and Digital Earth): Beijing, China, 2018; p. 6. [Google Scholar]
- Jiang, T. Extraction and analysis of remote sensing information of lithology and structural ore-controlling characteristics: A case study of East Tianshan Copper mine area. Geol. Miner. Mapp. 2019, 39, 1–6. [Google Scholar]
- Dong, C.; Jiang, X.K. An Intelligent Detection Method for Optical Remote Sensing Images Based on Improved YOLOv7; School of Automation, Xi’an University of Posts and Telecommunications: Xi’an, China, 2023; Volume 77, pp. 3015–3036. [Google Scholar]
- Araujo, J.C.; Seoane, J.C.S.; Lima, G.V.; da Silva, E.G.; França, L.G.; de Souza Santos, E.E.; Pereira, P.H.C. High-resolution optical remote sensing geomorphological mapping of coral reef: Supporting conservation and management of marine protected áreas. J. Sea Res. 2023, 196, 102453. [Google Scholar] [CrossRef]
- Xu, H.Q.; Tang, F. A new generation of Landsat series satellites: New features of Landsat 8 remote sensing images and their ecological and environmental significance. Acta Ecol. Sin. 2013, 33, 3249–3257. [Google Scholar]
- Cui, S.H.; Yao, F.J.; Lian, C.Q. Water body information extraction from multi-source remote sensing data in vegetated area. Sci. Technol. Eng. 2018, 18, 116–122. [Google Scholar]
- Đidelija, M.; Kulo, N.; Mulahusić, A.; Tuno, N.; Topoljak, J. Correlation analysis of different optical remote sensing indices for drought monitoring: A case study of Canton Sarajevo, Bosnia and Herzegovina. Environ. Monit. Assess. 2023, 195, 1338. [Google Scholar] [CrossRef]
- Xu, H.J.; Yang, T.B.; Zeng, B. Spatial and temporal changes of vegetation MODISNDVI in Qilian Mountains from 2000 to 2010 and its influencing factors. J. Arid. Land Resour. Environ. 2012, 29, 87–91. [Google Scholar]
- Peng, X.Q.; Zhang, T.J.; Zhong, Y.M.; Wang, Q.; Wang, K. Spatiotemporal variation of NDVI in Heihe River Basin of Qilian Mountains and its response to climate factors. J. Lanzhou Univ. 2013, 49, 192–202. [Google Scholar]
- Zeng, B.; Gao, W.; Yang, T.B. Spatiotemporal variation of MODIS-NDVI and its relationship with climate in Delingha area, Qaidam Basin. J. Lanzhou Univ. Nat. Sci. 2014, 50, 80–88. [Google Scholar]
- Cando-Jácome, M.; Martínez-Graña, A.; Valdés, V. Prevention of Disasters Related to Extreme Natural Ground Deformation Events by Applying Spatial Modeling in Urban Areas (Quito, Ecuador). Int. J. Environ. Res. Public Health 2020, 17, 753. [Google Scholar] [CrossRef]
- Valencia Ortiz, J.A.I.; Martínez-Graña, A. Morphometric Evaluation and Its Incidence in the Mass Movements Present in the Chicamocha Canyon, Colombia. Sustainability 2023, 15, 1140. [Google Scholar] [CrossRef]
- Merchán, L.; Martínez-Graña, A.; Nieto, C.; Criado, M.; Cabero, T. Characterization of the Susceptibility to Slope Movements in the Arribes Del Duero Natural Park (Spain). Land 2023, 12, 1513. [Google Scholar] [CrossRef]
- Lu, M.; Liu, J.F.; Sun, H.; Zhao, W. Disaster process and prevention measures of the “7·5” mudslide in Muli, Sichuan. Chin. J. Geol. Hazards Prev. 2023, 34, 102–109. [Google Scholar]
- Xu, W.; Zheng, X.; Ou, W.; Tie, Y.B.; Fu, X.L.; Song, Y.P.; Yin, W.Q. Liangshan Prefecture, Sichuan. Chin. J. Geol. Hazards Prev. 2024, 24, 1–12. [Google Scholar]
- Li, X.Z.; Kong, J.M. Types and characteristics of typical landslides induced by the “5.12” Wenchuan earthquake. J. Mt. Sci. 2011, 29, 598–607. [Google Scholar]
- Wu, X.P. Study on the Chain Dynamics of High-Speed Remote Landslide Disaster in Wenchuan Earthquake; Chongqing Jiaotong University: Chongqing, China, 2022. [Google Scholar]
- Wang, X.D.; Zhang, C.B.; Wang, C.; Zhu, Y.D.; Wang, H.P. Geological Disaster Susceptibility in Helong City Based on Logistic Regression and Random Forest. Jilin Univ. Earth Sci. Ed. 2022, 52, 1957–1970. [Google Scholar]
- Ma, X.; Wang, N.Q.; Li, X.K.; Yan, D.; Li, J.L. Assessment of Landslide Susceptibility Based on RF-FR Model: Taking Lueyang County as an Example. Northwest Geol. 2022, 55, 335–344. [Google Scholar]
- Li, M.; Li, L.; Lai, Y.; He, L.; He, Z.; Wang, Z. Geological Hazard Susceptibility Analysis Based on RF, SVM, and NB Models, Using the Puge Section of the Zemu River Valley as an Example. Sustainability 2023, 15, 11228. [Google Scholar] [CrossRef]
- Wei, W.H.; Jia, Y.E.; Sheng, Y.E.; Xu, G.L.; Yang, Y.J.; Zhang, R.D. Research on Landslide Susceptibility Evaluation Model Based on I, SVM and I-SVM. Saf. Environ. Eng. 2023, 30, 136–144. [Google Scholar]


Disclaimer/Publisher’s Note: The statements, opinions and data contained in all publications are solely those of the individual author(s) and contributor(s) and not of MDPI and/or the editor(s). MDPI and/or the editor(s) disclaim responsibility for any injury to people or property resulting from any ideas, methods, instructions or products referred to in the content. |
© 2024 by the authors. Licensee MDPI, Basel, Switzerland. This article is an open access article distributed under the terms and conditions of the Creative Commons Attribution (CC BY) license (https://creativecommons.org/licenses/by/4.0/).