Abstract
Integrative development is an effective way to enhance urban potential and implement resource-optimal relocation, especially in urban agglomeration regions. Conventionally, the evaluation of urban integration is usually studied from one aspect of urban interaction intensity or urban functional similarity, but considering both together can better reflect the integrative condition of urban agglomeration. This paper introduces the symbiosis theory into the exploration of urban integration. The production–living–ecological function is taken to analyze urban function, and the improved radiation model is adopted to measure urban interaction. Under the framework of symbiosis theory, we integrate urban function and urban interaction to indicate the integrative condition of urban agglomeration from a production–living–ecological aspect. Urban agglomeration in the Central Yunnan Urban Agglomeration is taken as the study area. The results show that (1) spatial variations occur in high-value areas with distinct functions. The east emphasizes production and living, while the west leans towards ecology. (2) Urban agglomeration is in its early developmental stages without stable symbiosis. Interactions among counties mostly show sporadic point symbiosis, lacking stability. It mainly radiates outward from the central area, with more stable interactions in high-value areas, often causing inter-city competition. (3) Urban agglomeration integration is generally low, with distinct high-value production and ecological areas. The central, eastern, and southern regions exhibit strong production and living interactions, while the west benefits from ecological interactions. These findings can offer some insights for informing relevant policies and fostering the integrated development of urban agglomerations.
1. Introduction
The acceleration of economic globalization and urbanization has led to the rapid growth of urban populations, resulting in urban expansion and restructuring of urban areas [1]. The regional development model has transitioned from independent development of a single city to integrated development facilitated by resource interaction across multiple cities [2]. The regional development model has shifted from the independent development of individual cities to a city agglomeration or group with the core city at its center, driving the collective development of surrounding cities. Urban agglomeration develops as a unified entity, with each city mutually interacting and progressing together. It has been viewed as the predominant model for regional development in China. The integrated development of urban agglomerations is crucial for stabilizing internal dynamism and enhancing county competitiveness. Simultaneously, the integrated development of urban agglomerations is a crucial component of sustainable development. When examining the sustainable development level of urban agglomerations, it is essential to consider interactions and spillover effects between towns within the agglomerations, along with variations in the developmental levels of individual towns [3]. The goal of integrated development is to achieve rapid resource circulation and optimal allocation, including industrial specialization, market expansion, distribution of living resources, and synergistic CO2 reduction effects [4,5,6,7]. Such integration allows the entire urban agglomeration system to not only generate income from individual cities but also realize economies of scale when organized as a whole. Integrative development within urban agglomeration is crucial for enhancing regional competitiveness, optimizing regional resource allocation, and fostering regional sustainable development [8].
In summarizing scholars’ research on the integration of urban agglomeration, two research frameworks are generally involved. The first framework examines the interaction between counties, with a focus on the element flow among inner cities, such as economic interactions [9,10], production transportation [11], population flow [12], information flow [13,14], etc. Quantification of inter-county flow is often achieved through the use of methods such as the gravity model and its extensions [15,16], the field strength model [17] and the radiation model [18]. Additionally, the structure of the urban network is analyzed using social network analysis methods and complex network models to examine the interweaving of flow elements. The second framework focuses on urban functions. These researches typically explore urban functional similarities by analyzing economic complementarities [19], industrial structure similarity [8], commodity price convergence [20], etc. New economic geography models and trade theories are commonly employed for analysis within this research framework. Furthermore, regarding urban elements involved in related research, urban economy and industry have been widely concerned in the exploration of urban integration. Transportation, as a foundation for urban connectivity, has also been extensively studied. As research progresses, scholars have begun to address other integration issues, such as green development [21], ecosystem service value [22], coordinated emission reduction [7], culture tourism industries and culture development [23], etc.
Previous research has made significant contributions to exploring the integrated development of urban agglomerations. However, there are still unresolved issues that require in-depth investigation. First, the research’s focus on urban connection cannot well capture the features of individual cities, and the research conducted based on the individual function features analysis may ignore the interactive condition among member cities. Combining urban interaction and urban function to comprehensively delineate urban development processes requires further research. Second, the integrated degree of the urban area is mostly assessed by synthesizing multiple indicators into a comprehensive measure. However, cities within an urban agglomeration have diverse functional positions, and the overall indicator might lack specificity in describing urban connections. While the overall degree of closeness is generally assessed, the specific modes of city connectivity remain underexplored.
To fix the gap, this paper endeavors to (1) introduce the symbiosis theory into the study of urban agglomeration integration. The symbiosis theory was originally defined as the coexistence of different species according to a certain relationship [24]. Counties are viewed as symbiotic units to observe how they co-exist in a symbiotic environment. The application of symbiosis theory in exploring the integrative development of urban agglomerations can be an effective approach to consider both urban interaction and urban function. (2) Utilizing the functions of production, living, and ecology to elaborate the integrated development of urban areas. Economy, society, and ecology are commonly regarded as the three subsystems of cities, which encompass the functions of production, living, and ecology [25]. These three functions comprehensively summarize the different functions provided by counties within urban agglomeration and serve as a suitable framework for distinguishing diverse functions among different urban agglomerations.
In this paper, urban function is summarized into the aspects of production, living, and ecology. An index system is built to establish the three functions of each town in urban agglomeration. Based on the developed condition of the urban production–living–ecology function, urban interaction and urban functional distance are separately measured by the improved radiation model and functional distance model. Adopting the framework of symbiosis theory, urban interaction and urban function are integrated to explore the integrative degree of urban agglomeration from the aspects of productive integration, living integration, and ecological integration. The Central Yunnan Urban Agglomeration (CYUA), which lies in southwestern China, is taken as a study area. The CYUA serves as the central hub of China’s radiance toward South Asia and Southeast Asia. It strategically intersects the “Belt and Road” and the “Yangtze River Economic Belt” initiatives. Positioned as a significant economic growth pole in the western region of China, research on this area can promote prosperity and stability in border areas. We analyze the urban production–living–ecology function, urban interaction condition, urban symbiotic modes, and integrated development condition in the CYUA from 2000 to 2020. Some policy suggestions are proposed to guide the integrative development of the CYUA. This study provides a research framework for exploring the integrated development of urban agglomerations, not only for the CYUA but also for other counterpart areas.
2. Materials and Methods
2.1. Study Area
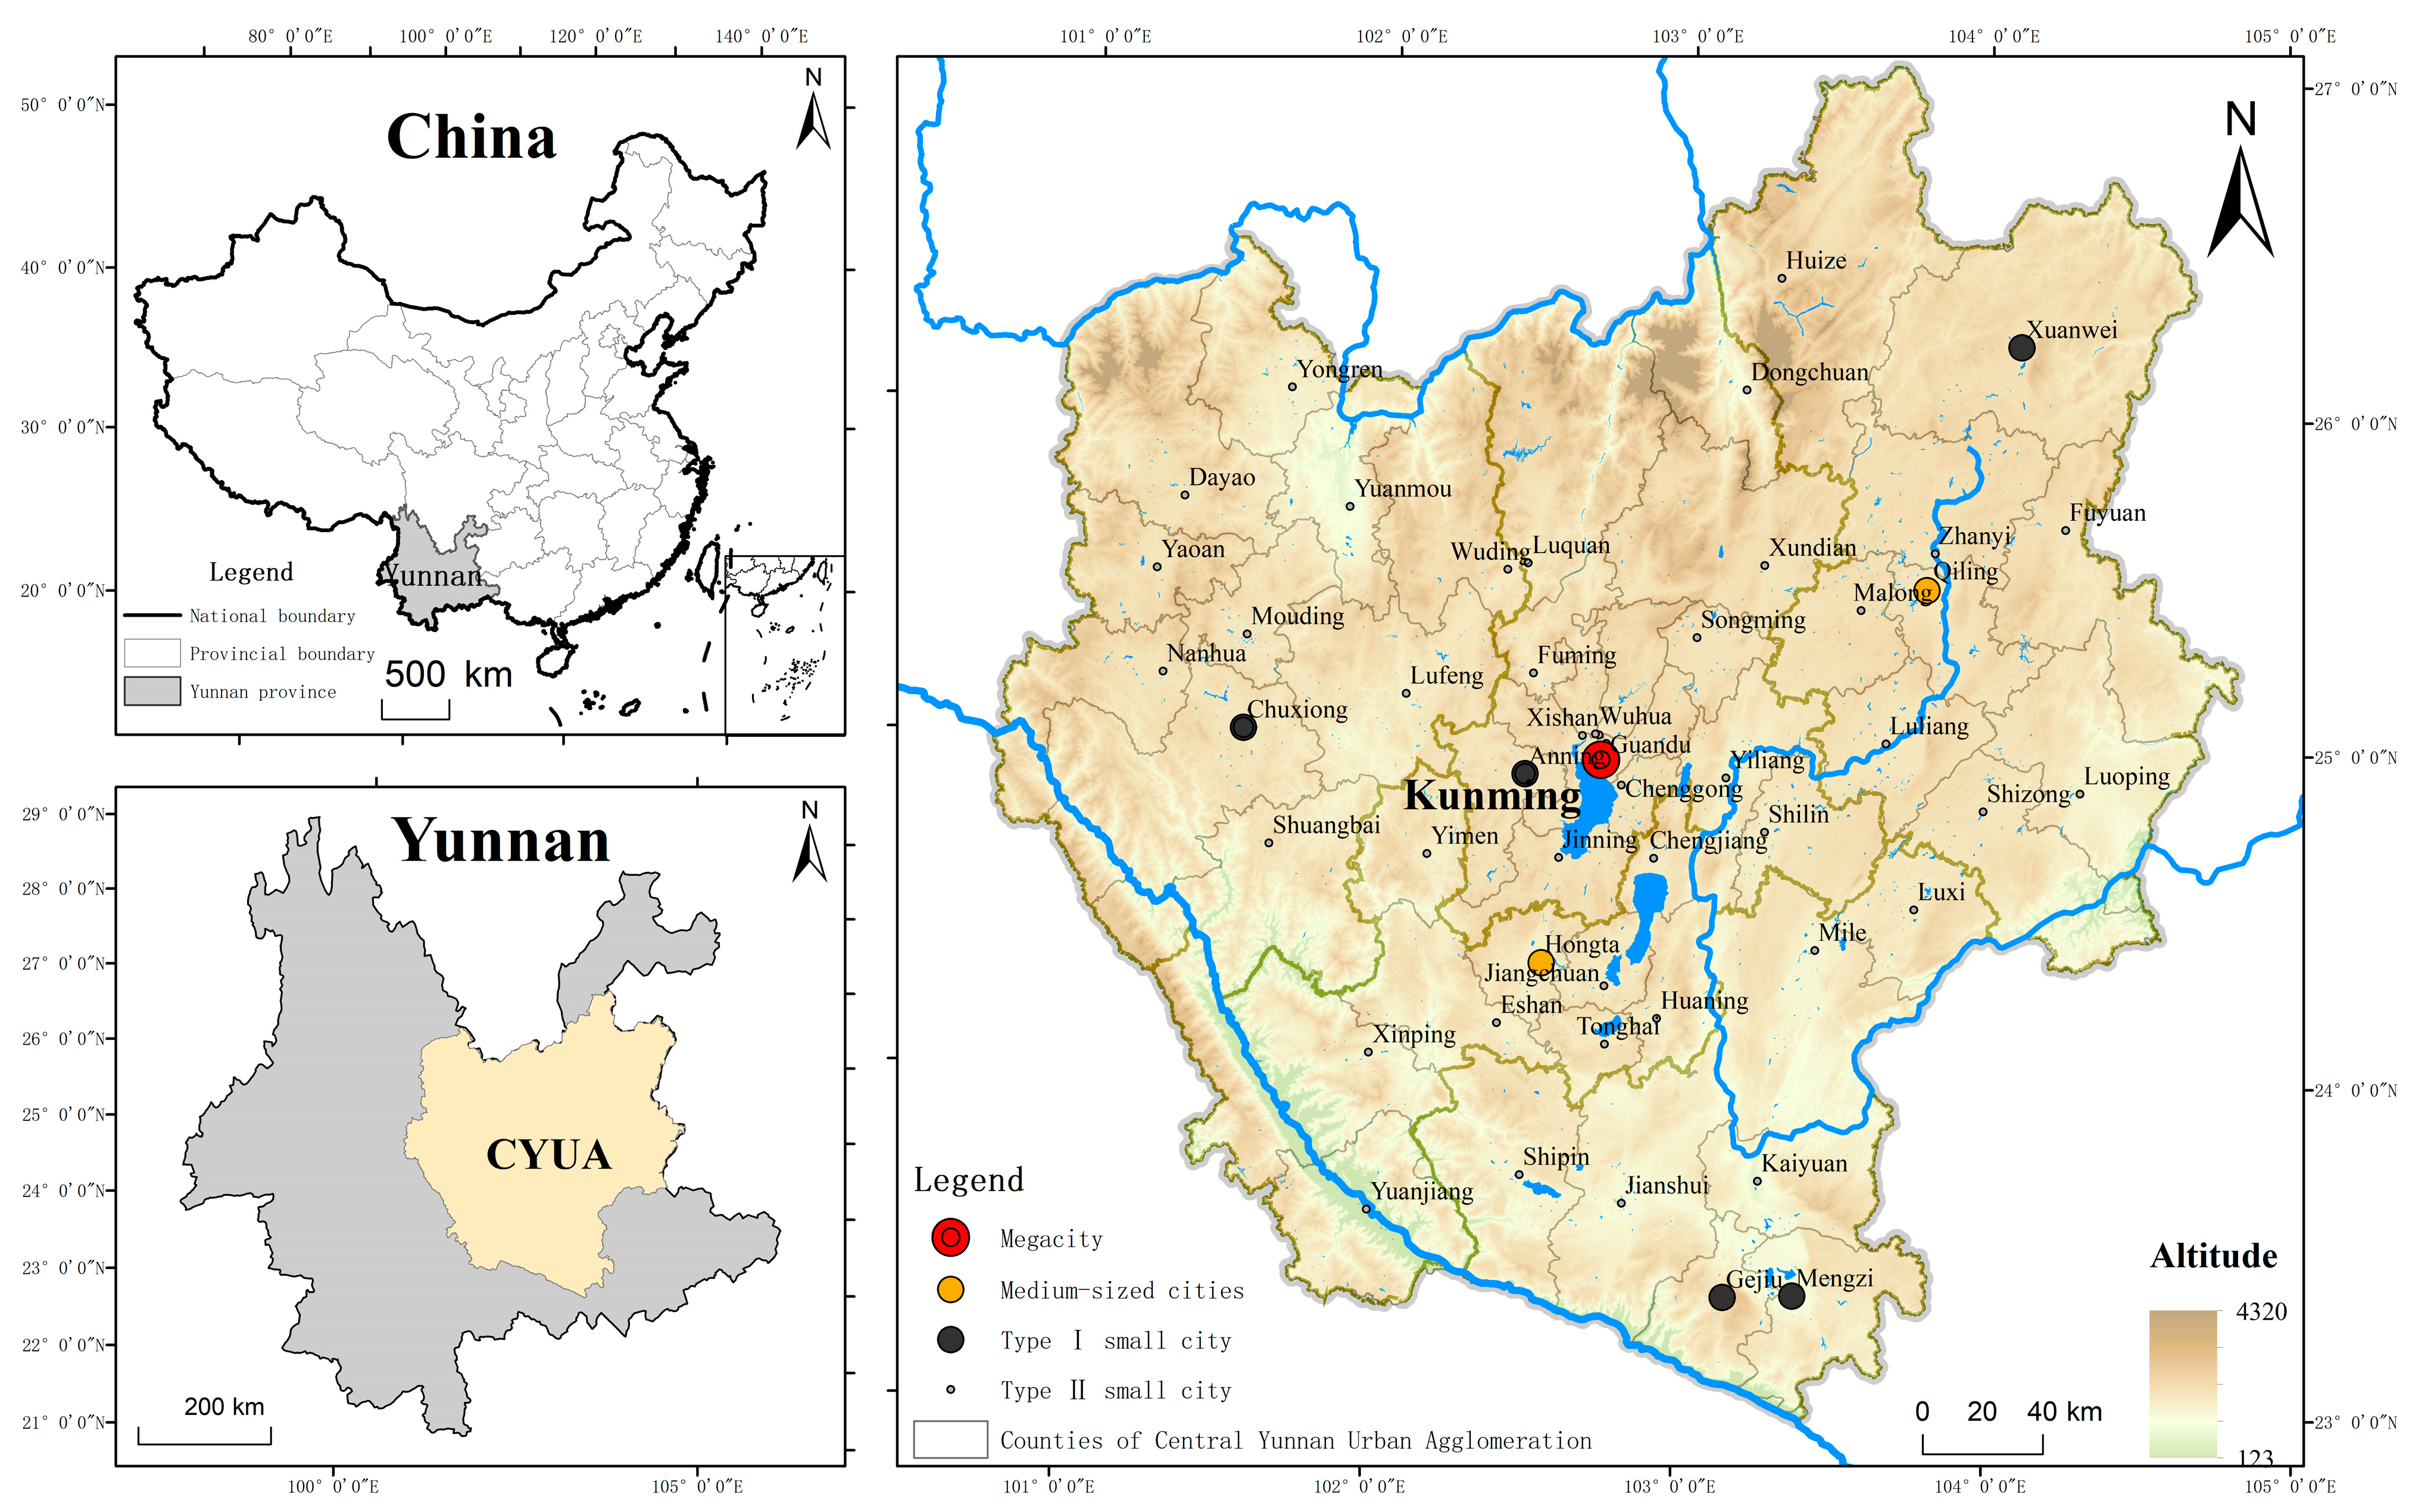
We chose the Central Yunnan Urban Agglomeration (CYUA) as the study area. The CYUA is located in the southwest mountainous plateau region of China, covering Kunming City, Qujing City, Yuxi City, Chuxiong Prefecture, and 7 counties in the northern Honghe Prefecture, a total of 49 counties, as shown in Figure 1. It has a land area of 111,400 square kilometers, a permanent population of 21.27 million, and a GDP of CNY 1.02 trillion, accounting for 28.3%, 44.1%, and 61.6% of the province, respectively. It has the most intensive transportation facilities, the highest degree of development, and the highest level of development in Yunnan Province. It is also the most important industrial agglomeration area in Yunnan Province [26]. However, compared with other urban agglomerations in China, the flow of regional elements in the inner CYUA is not frequent. According to the standards of the seventh national census results, the urban agglomeration has only 1 mega-city (5–10 million people), 2 medium-sized cities (1–3 million people), 5 type I small cities (200,000–500,000 people), and 33 type II small cities (Less than 200,000 people). Furthermore, researchers have pointed out that the urban function of member cities of the CYUA represents an extent of similarity. Investigating the integrative condition of the CYUA with regard to urban interaction and function is imperative not only to steer its own progress but also to be pivotal for the advancement of Yunnan province.
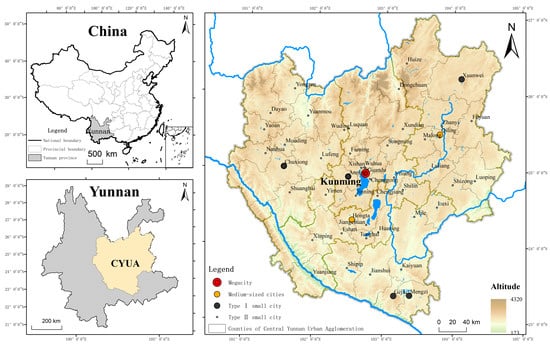
Figure 1.
Location of study area.
2.2. Data Source and Processing
The data used in this study mainly include socioeconomic statistical data, basic geographic information, road network data, and land use data. We use socioeconomic cross-sectional data from the CYUA every five years from 2000 to 2020. These data are collected from the Yunnan Statistical Yearbook (2000–2020) and the China Statistical Yearbook (county-level) (2000–2020). Basic geographic information is acquired from the National Geomatic Center of China. Road networks are obtained from the Open Street Map. Based on the traffic situation in different years, Google Earth is compared to adapt to the actual situation of the region at a specific time. Land use classification data with 30 m precision are obtained from the Resource and Environmental Science Data Center of the Chinese Academy of Sciences. The spatialization processing of all the GIS data is performed in ArcGIS 10.2.
2.3. Methodology
In order to establish a reasonable system to classify urban functions and combine the characteristics of a single county and the interaction between multiple counties to jointly evaluate the integrated development of urban agglomerations, four issues should be considered: firstly, an index system is constructed to measure the production, living, and ecological functions of each town within the CYUA from the year 2000 to 2020. Secondly, based on the production, living, and ecological functions of each town, the improved radiation model is applied to obtain interaction intensity and interaction direction between towns; the functional distance model is employed to identify the specific interaction functions between towns. Thirdly, a symbiotic model is proposed to identify the organizational mode and behavioral pattern of towns based on interaction intensity, interaction direction, and interaction function. Finally, the urban integration index is constructed to explore the degree of coordinated participation of the CYUA and each town within it.
2.3.1. Evaluation Index System of Production–Living–Ecological Function
Based on the connotation of production, living, and ecological functions, we establish an index system of production–living–ecological functions. First, data from different standards need to be normalized. Second, the critic weight method is used to determine the weight of each index in the index system. Finally, by utilizing the aforementioned approach, we calculate the production, living, and ecological function indices of each county within the urban agglomeration, which allows us to better characterize the attributes of each county. The specific steps are as follows:
2.3.2. Establishment of Index System
We refer to the index systems used in previous studies [27,28] to select and consider the rationality and availability of data and establish an index system based on the status of the study area. Twenty-two indicators are selected to establish the evaluation index system presented in Table 1.

Table 1.
Index system of the production–living–ecological function.
2.3.3. The CRITIC Method
The CRITIC (Criteria Importance Through Inter-criteria Correlation) method is used to calculate weights. It is an objective weighting method [29]. This method uses two fundamental weights to evaluate the relative importance of different indicators based on the strength of contrast and conflict between them. The strength of contrast is evaluated using the standard deviation to measure the size of the gap between the same index in the indexing scheme, while the conflict is reflected by the correlation coefficient between the indicators. Based on these concepts, the method constructs an indicator that contains both types of information, which indicates the amount of information contained in the indicator. The formula for calculating this indicator is as follows:
The larger the , the greater the amount of information contained in the evaluation indicator, so the objective weight of the indicator is as follows:
2.3.4. The Improved Radiation Model for Urban Interaction
The radiation model, applied in urban studies, draws on the analysis of material dispersion and absorption processes in physics [30]. Considering the existence of intervening opportunities in urban interaction processes [18], the model characterizes the interaction intensity, which is influenced by the background conditions of both interacting parties. These background conditions include urban interaction potential, urban external capacity, urban interaction channels, and urban interference intermediaries. The specific model framework is shown below:
where is the size of the interaction from location i to location j; and represent the interaction potential of location i and location j, which refers to the self-foundation of interaction between towns, characterized by the production, living, and ecological functions of towns in this study; characterizes the external function of towns, measured using the location entropy model of the three functions of towns, where the size of the location entropy reflects whether the function has an external function. The specific formula is as follows:
where , , , and P represent the magnitude of the j functional quantity of town i, the sum of all functional quantities of town I, the weighted sum of all urban energy in the urban agglomeration, and the sum of all functional quantities in the urban agglomeration. When the location quotient > 1, it is considered that the function has an outward function; that is, the category function exceeds the average level in the region and can provide the category of services to other regions.
represents the potential size of intervening opportunities that may exist in the interaction between town i and town j. Based on the shortest path analysis of the road network, the interaction potential of the towns passed through is summed up and represented as the interfering intermediary between town i and town j. The formula is as follows:
where represents the potential interference opportunities that may exist in the interaction process between town i and town j, and n represents the number of towns passed through in the shortest path between town i and town j during the interaction process. represents the interaction potential of town k.
2.3.5. The Evaluation of Urban Functional Distance
This study uses the urban functional distance model to analyze the functional differences between counties. Based on urban production, living, and ecological function, the functional similarity between counties is evaluated. Generally, the larger the functional distance between towns, the lower the functional similarity between counties and the stronger the complementarity; otherwise, the higher the similarity, the stronger the competition. The specific formula is as follows:
where represents the functional distance between town i and town j. x, y…z represents the functions of the county and is the functional distance index between town i and town j, which this paper characterizes by the production, living, and ecological functions of the county. When ≥ 0.5, it is considered that the functional heterogeneity between cities and towns is large and complementary. When ≤ 0.5, it is considered that the functional homogeneity between cities and towns is large and competition is formed. When −0.5 < < 0.5, it is considered that the functional attributes between towns are not clear.
2.3.6. The Identification of Urban Symbiotic Pattern
Symbiosis, as a concept in ecology, emphasizes cooperation among populations. Symbiotic units, symbiotic patterns, and symbiotic environments are the three fundamental elements of the symbiosis theory framework. In urban symbiosis research, cities are usually taken as the basic unit, and symbiotic patterns refer to the ways in which cities interact with each other. The intermediary required for interaction is called the symbiotic interface, and other elements that affect symbiosis besides the symbiotic interface are referred to as the symbiotic environment. The symbiotic patterns between cities are based on their own attributes and are influenced by the symbiotic interface and environment. Symbiotic evolution is inherent in symbiotic systems, and local measures affecting city conditions can destabilize the region, prompting changes in the urban symbiosis system. The evolution of the symbiosis system bears similarities to the integration process of urban agglomerations, making the application of symbiosis theory a valuable approach to evaluate regional integration.
There are two symbiotic modes in the urban symbiosis system: organizational models and behavioral models. We use symbiosis patterns classification [31] to classify the organizational patterns and behavioral patterns of urban agglomerations. The organizational model gauges the size and intensity of interactions between cities, emphasizing the “absolute value” of these interactions. Behavioral patterns, on the other hand, capture the manner and nature of urban interactions, collectively forming a comprehensive symbiotic relationship. Symbiosis entails both positive and negative effects on the entities involved. Symbiotic units engage in both struggle and cooperation, driven by a mechanism of competition and cooperation that propels mutual advancement and individual excellence.
The organizational pattern is identified based on the interaction intensity and direction between cities, including four categories: point symbiosis, intermittent symbiosis, continuous symbiosis, and integrated symbiosis, which characterize the connections between cities from accidental and occasional interactions to gradually evolving into selective interactions with continuity, and finally reaching a stable state of integrated symbiosis driven by endogenous forces, as shown in Table 2. In this study, the global natural breakpoint method is used to classify the interaction intensity.
Table 2.
Symbiotic organizational pattern type.
The behavioral pattern is identified from the functional differences of towns, and through the comparison of the positive and negative functions between towns, it is divided into six categories: mutual benefit symbiosis, parasitism, competition symbiosis, partial harm symbiosis, partial benefit symbiosis, and irrelevant symbiosis, as shown in Table 3.
Table 3.
Types of symbiotic behavioral patterns.
2.3.7. The Evaluation of Integrative Degree of Urban Agglomeration
The degree of urban agglomeration integration is an important indicator of the degree of urban agglomeration development. We devise an Urban Agglomeration Integration Index by leveraging the organizational and behavioral models of urban agglomeration. This index assesses the extent of active participation of each county within the urban agglomeration integration framework, based on a benign symbiosis model, throughout the urban agglomeration’s development. The fundamental framework is outlined as follows:
Among them, represents the integration index of town i, represents the weighted interaction intensity from town i to town j under the benign symbiosis mode, and represents the weighted total value of all interaction intensities of town i.
Throughout the development of an urban agglomeration, it undergoes a non-linear, spiraling process. Cities within the agglomeration, at different stages, work towards a common goal, engaging in varying degrees of coordinated action. We adopt the coordinated development standard of urban agglomeration to identify the integrative condition of urban agglomeration exhibited by the Int-Indexi [32], as delineated in Table 4. In instances where the integration level falls below 10%, it is referred to as the assist stage, with cities operating independently and engaging in limited collaboration. Upon reaching an integration degree of 10–20%, it is called the cooperative stage. Cities are still relatively independent of each other but are beginning to strengthen their ties, cooperation, and contact. Upon reaching an integration degree of 20–30%, it is called the coordination stage, accompanied by an escalation in conflicts between cities, passing multiple conflicts; only the joint cooperation of cities can solve the problem. Subsequently, when the integration degree reaches 30–40%, the coordination level of urban agglomerations has entered the concordant stage, marked by a substantial increase in inter-city conflicts; cities begin to form alliances to form a community with a shared future. Advancing to an integration degree of 40–50%, it is referred to as the collaborative stage; at this stage, the total number of problems and conflicts faced by each city and the conflicts resolved through collaborative methods are basically the same, and cities exhibit a heightened inclination for mutual development. Upon attaining an integration degree of 50–70%, it is referred to as the co-vibration stage. At this stage, there are far more regional problems and conflicts resolved through collaborative methods among cities than through non-collaborative methods. At the 70–85% integration range, cities establish a closely-knit cooperation mechanism, signifying the attainment of the integration stage. This phase is characterized by a high level of integration, reflecting cities’ strong commitment to collaborative development. Finally, when the integration degree surpasses 85–100%, urban agglomerations achieve a state akin to a single city; this is referred to as the urbanization stage.
Table 4.
Urban agglomeration integration stage table.
3. Result
3.1. The Production–Living–Ecological Functions in the CYUA
Based on the evaluation index system of production–living–ecological function, the quantitative and spatiotemporal features of production function (PF), living function (LF), and ecological function (EF) in the CYUA were calculated. Figure 2 shows the average number of these three functions in each county of the urban agglomeration in 2000, 2005, 2010, 2015, and 2020. From the perspective of the entire urban agglomeration, three functions continuously increased from 2000 to 2020. Among them, the living function had the fastest growth, from 0.08 to 0.38. The production function increased from 0.13 to 0.30, and the ecological function index was in a growing state; however, the increase was not significant, rising from 0.32 to 0.34.
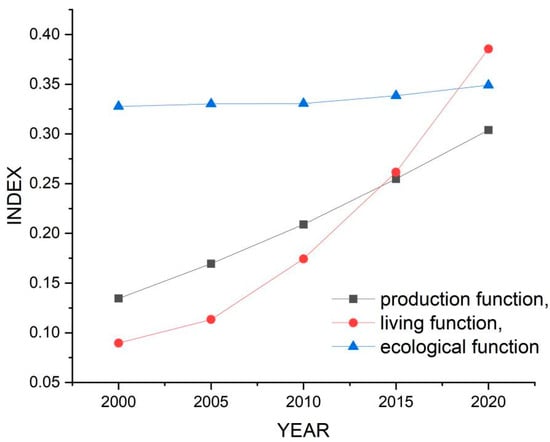
Figure 2.
Changes of the production–living–ecological functions in the CYUA.
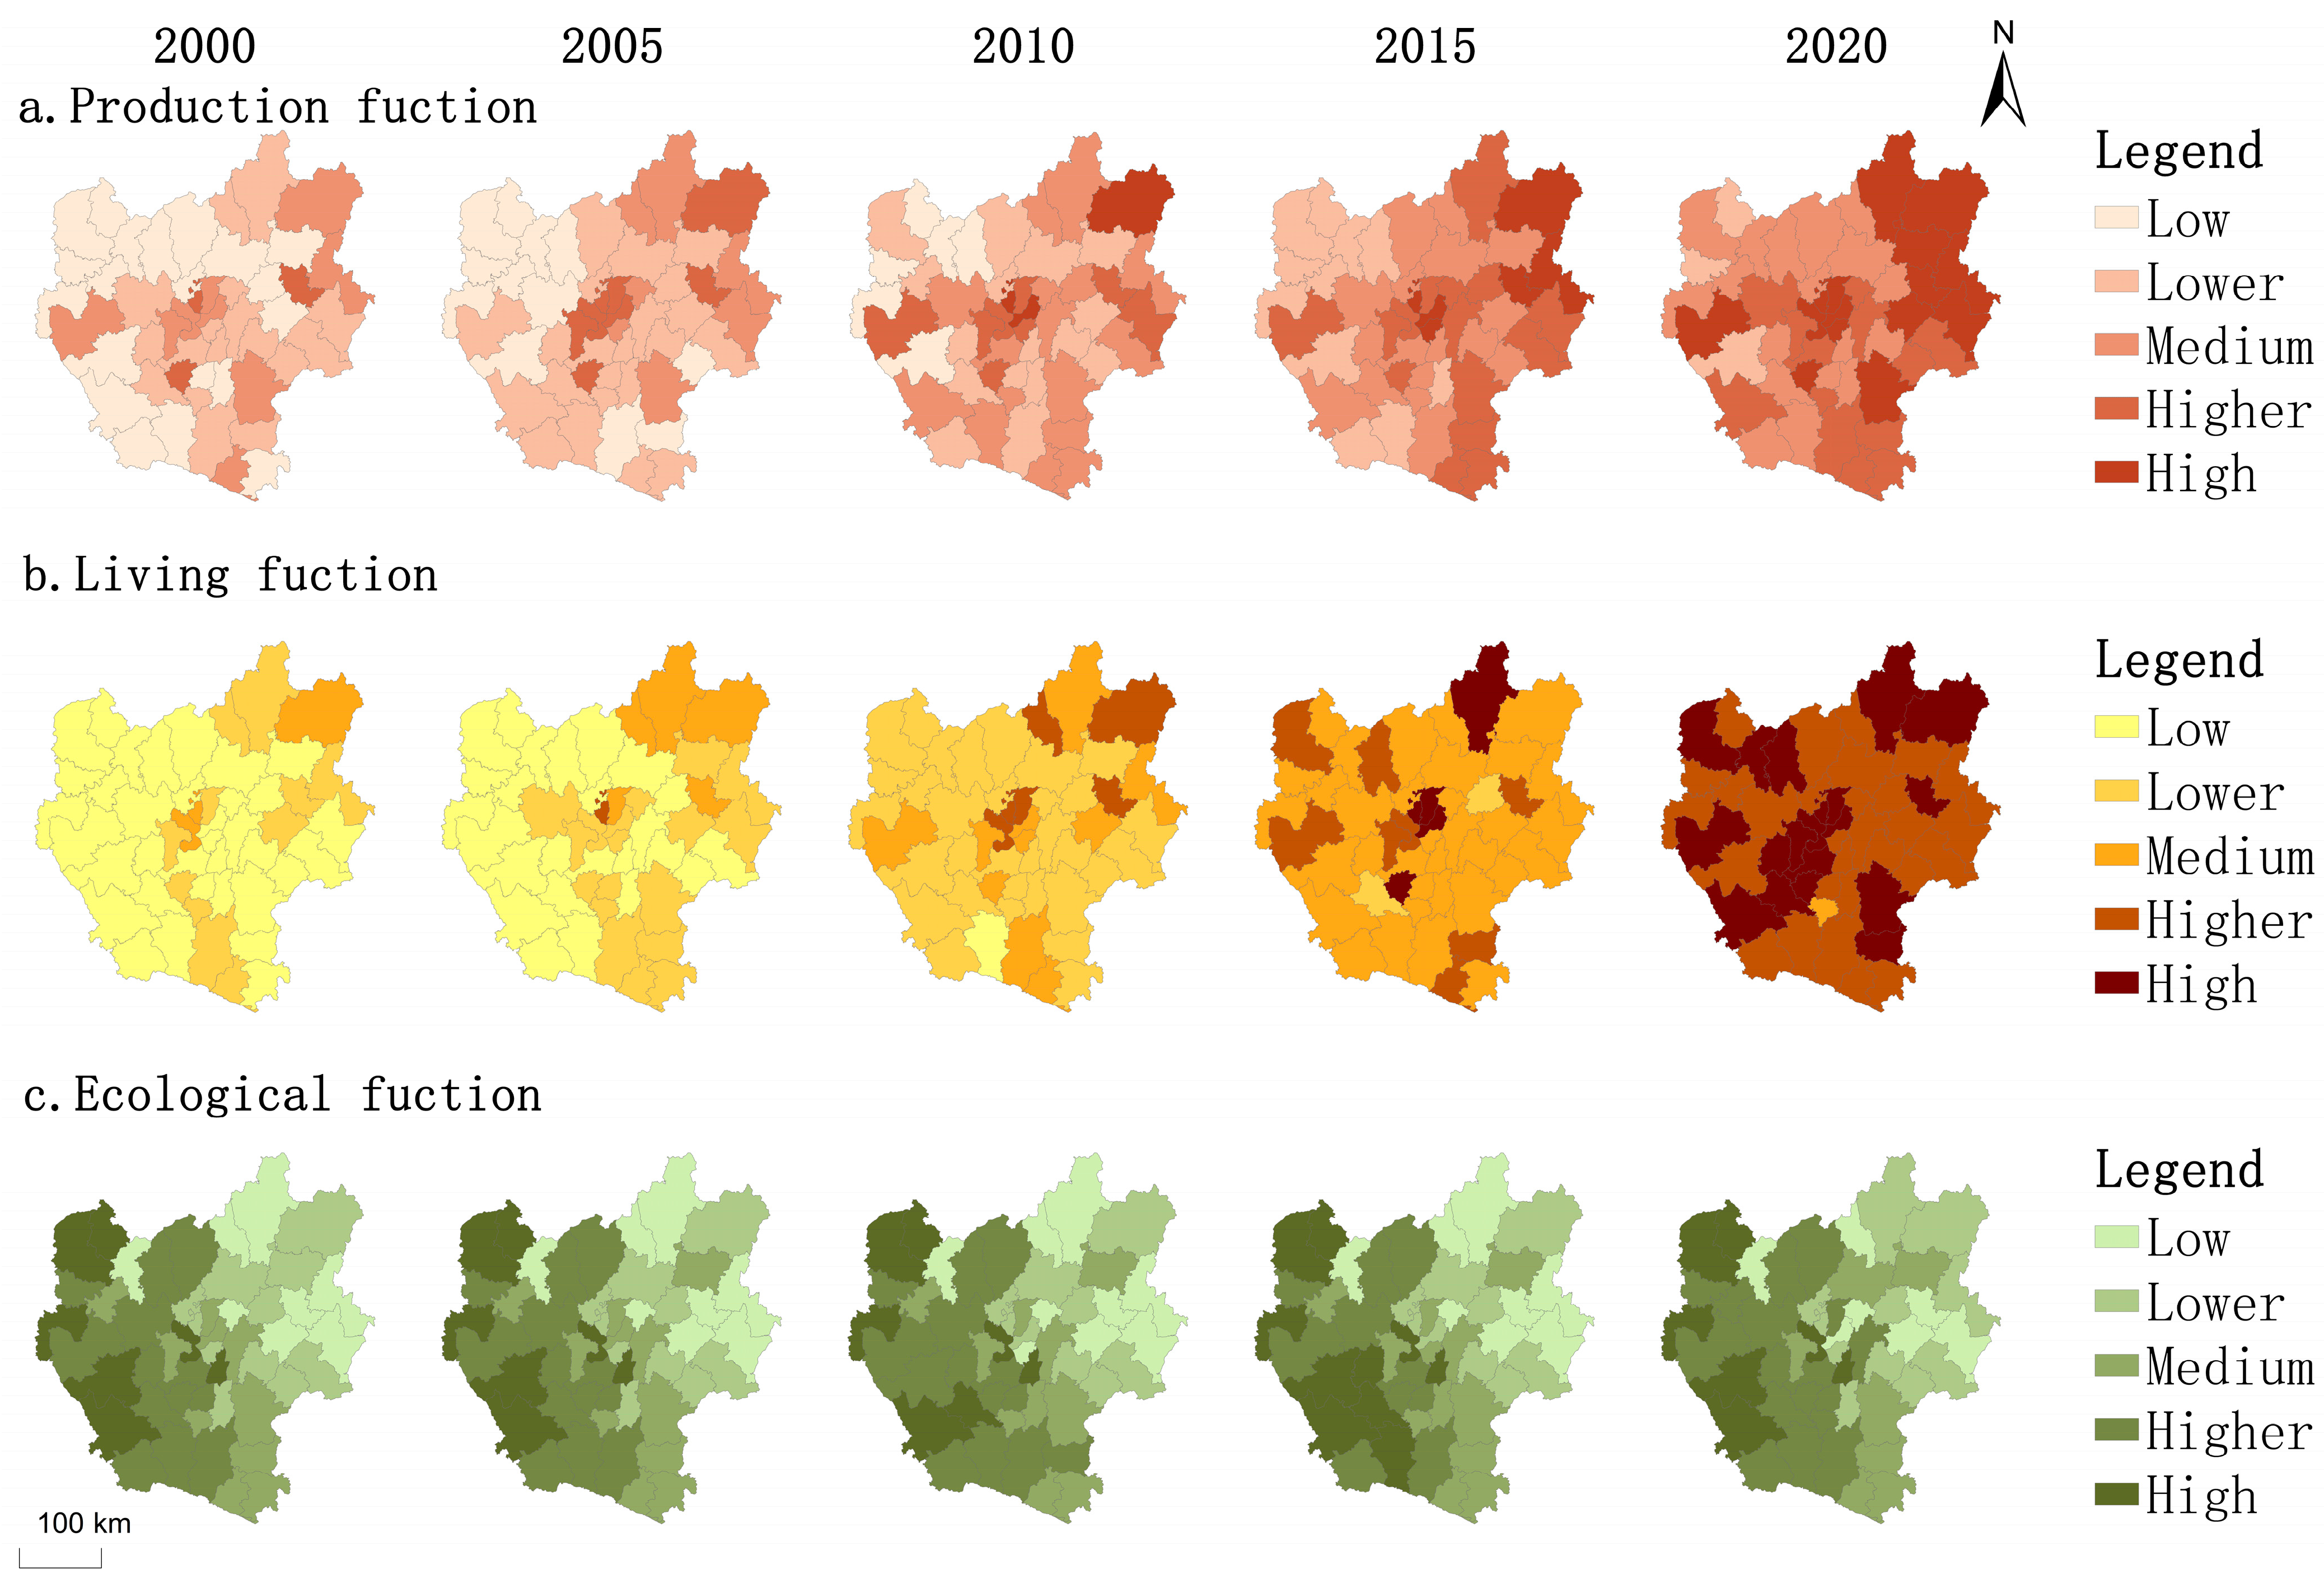
From the perspective of each county in the urban agglomeration, we used the global natural breakpoint method to divide the functional index into five levels: low, low, medium, high, and high, and observe the quantitative changes and spatial distribution. Figure 3 visually displays how these changes occurred spatially.
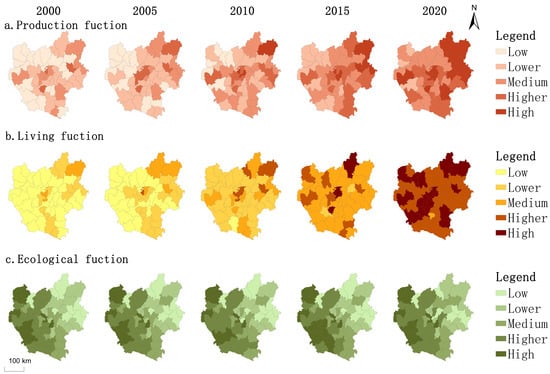
Figure 3.
Spatiotemporal features of production–living–ecological functions.
Figure 3a illustrates the spatiotemporal fluctuation of the production function. High production functions are primarily distributed in the central and eastern regions of the CYUA, with low-value concentrations prevalent in its western reaches. As temporal and spatial changes, the production functions of all counties demonstrated notable improvements between 2000 and 2020. The distribution of high-value areas of the living function index is relatively sporadic, mainly in the central part of the urban agglomeration. As shown in Figure 3b, the change process presents a radial structure in which the central part drives the surrounding areas. As shown in Figure 3c, the distribution of ecological functions is high in the west and low in the east. Between 2000 and 2020, the functional spatial pattern of ecological function remained essentially constant, with only marginal changes in quantity.
3.2. The Symbiotic Mode of Cities in the CYUA
Based on the identification of counties’ production, living, and ecological functions, this study carried out urban interaction measurement based on an improved radiation model and analyzed 2352 interactive relationships among 49 counties in the CYUA from 2000 to 2020. It was found that the total interaction strength, average interaction strength, and maximum interaction strength of production functions in CYUA were 1.69, 0.000144, and 0.026, respectively; life functions were 1.22, 0.000104, and 0.035; ecological functions were 2.49, 0.000212, and 0.028. At the same time, this study calculated the functional distance of towns based on the functional distance model. During the study period, the maximum functional distance reached 3.38. Based on the evaluation results of interaction strength and urban function distance, the symbiotic modes of towns can be identified under the framework of symbiosis theory.
3.2.1. The Organized Mode of Urban Symbiosis in the CYUA
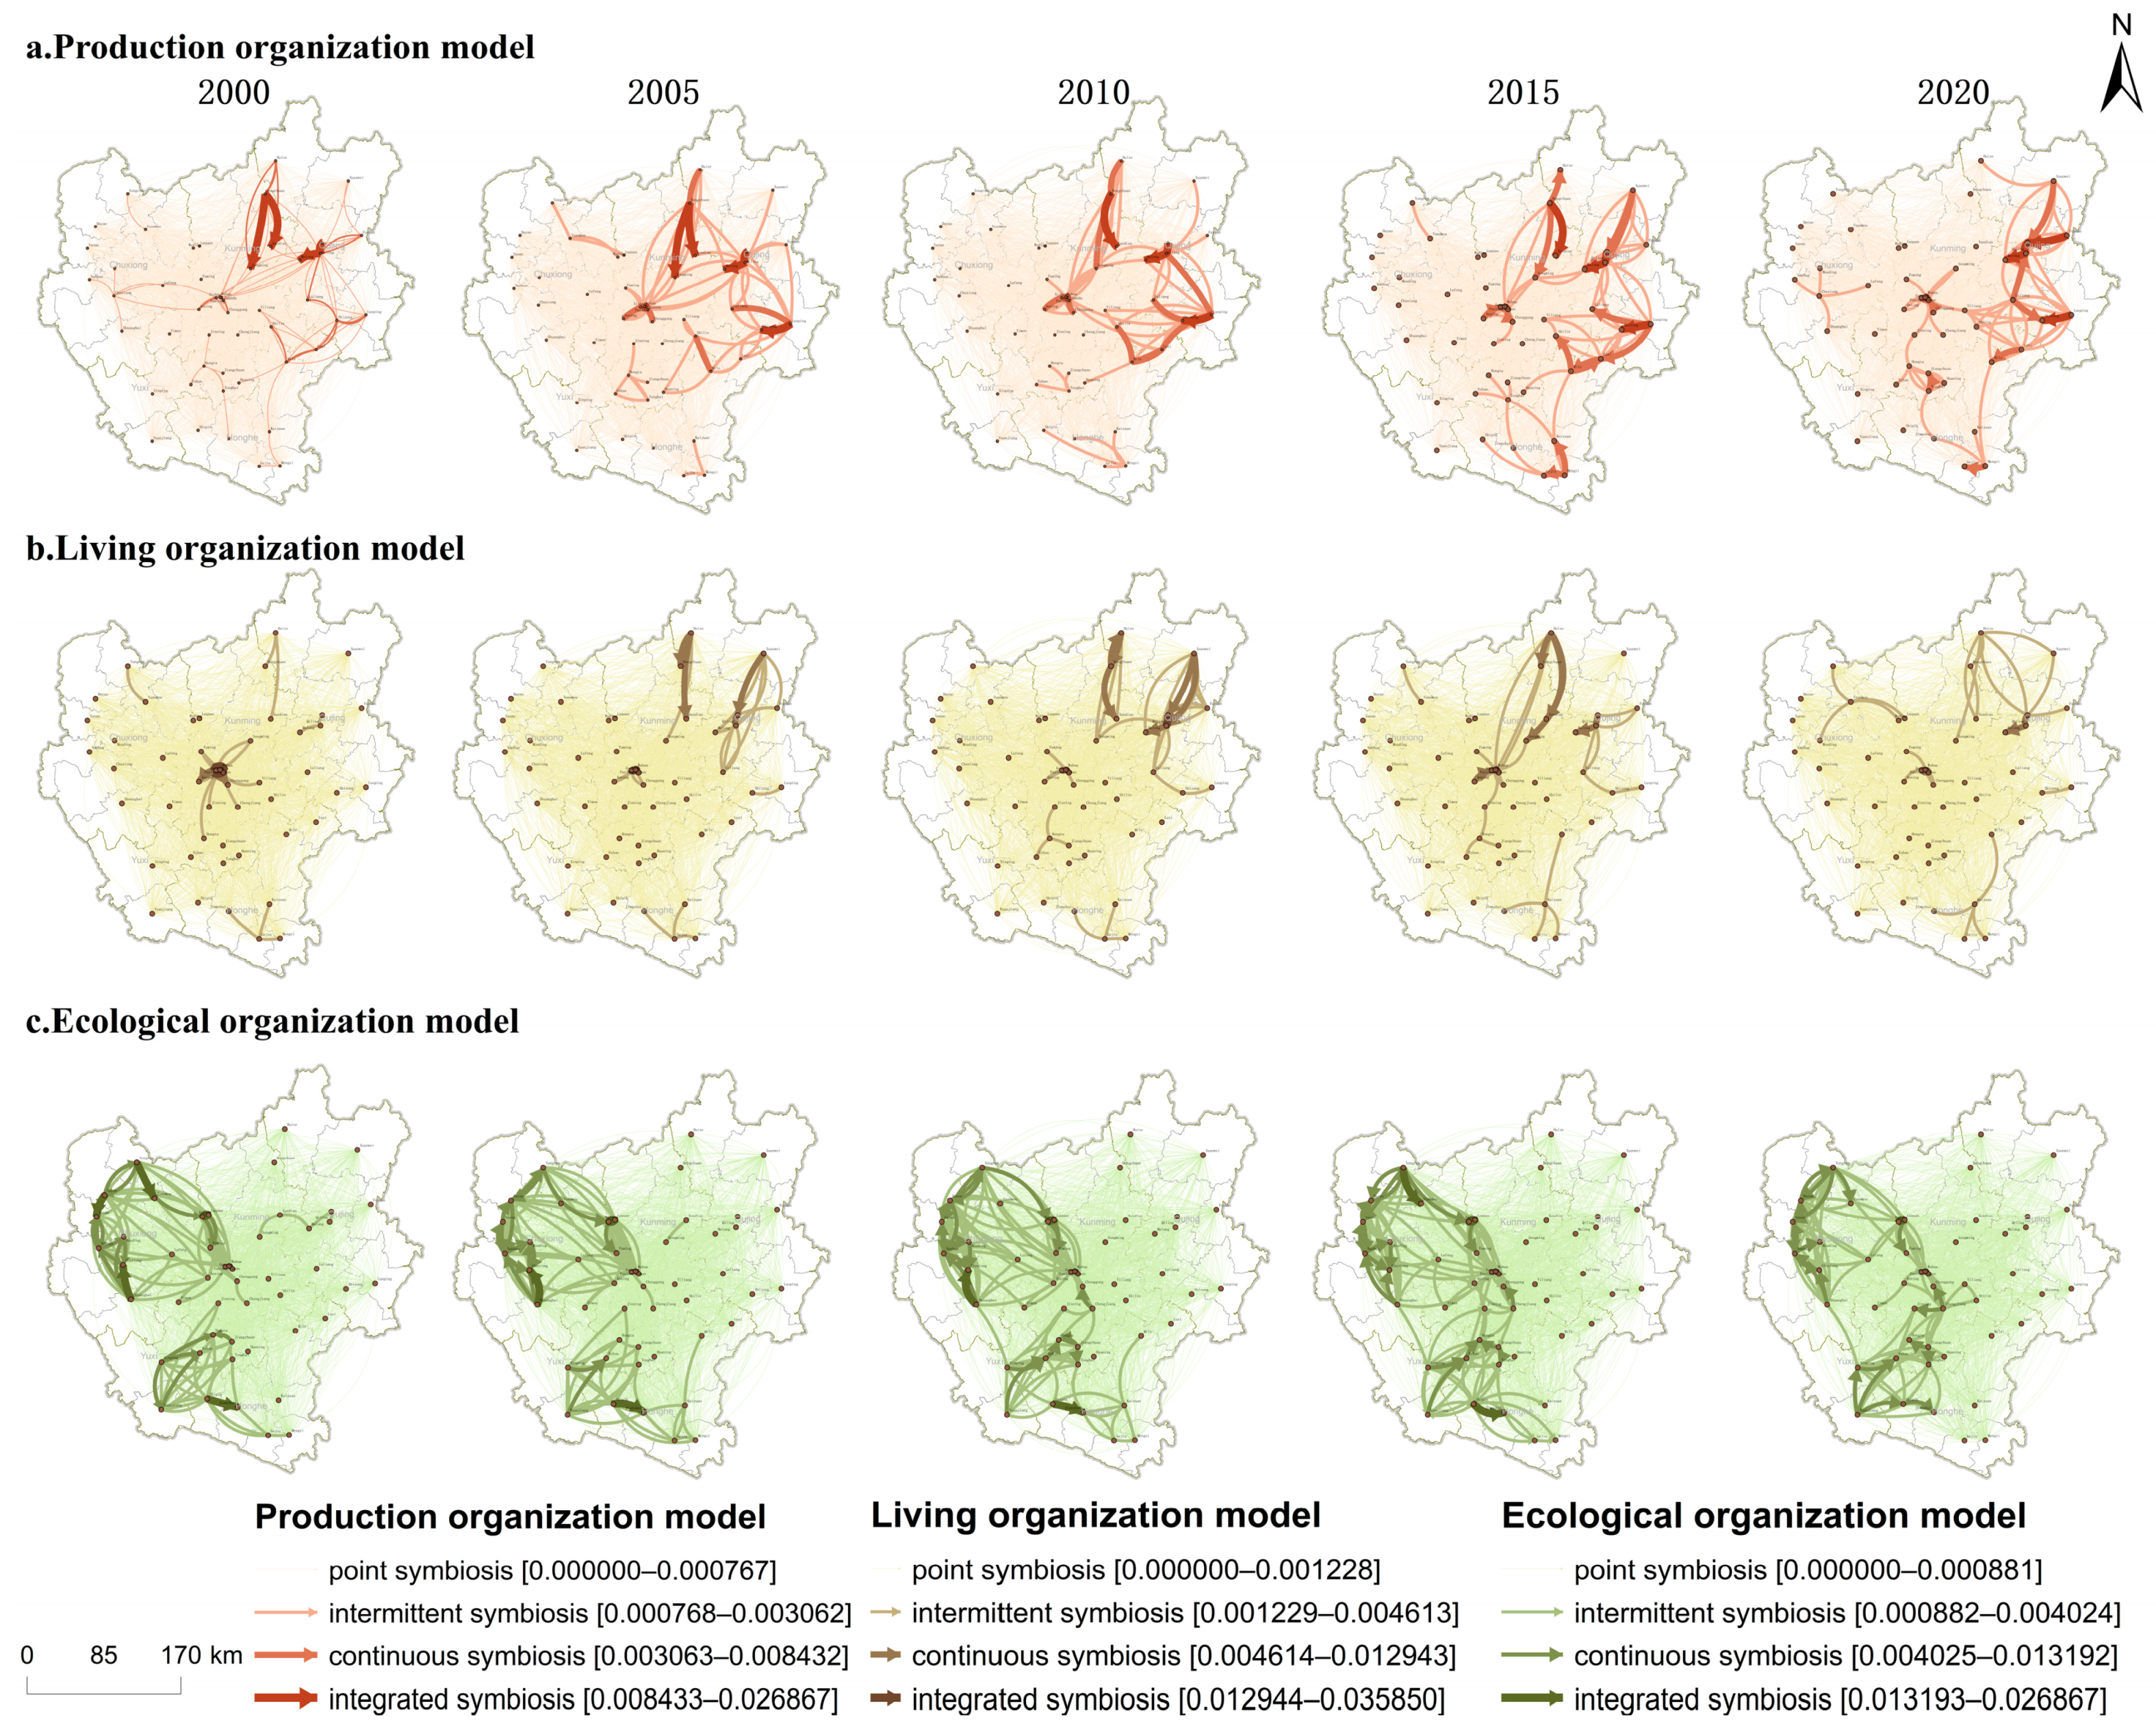
The organized mode of urban symbiosis focuses on the intensity and direction of interaction among counties. Based on the calculation of the improved radiation model, we employed the global natural breakpoint method to classify urban interaction into four classes, which separately represent point symbiosis, intermittent symbiosis, continuous symbiosis, and integrated symbiosis. Figure 4 illustrates the distribution and evolution of the organizational mode of urban symbiosis in the CYUA from 2000 to 2020.
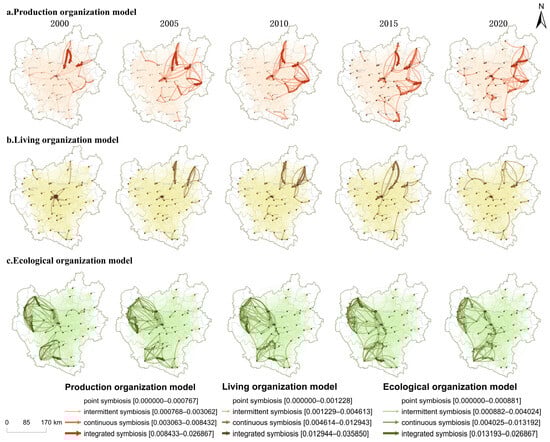
Figure 4.
The organized mode of urban symbiosis.
The production function organization model, depicted in Figure 4a, is primarily characterized by point symbiosis, which constitutes more than 96% of all organizational models. Point symbiosis is commonly observed among secondary counties or those located far apart. Intermittent symbiosis is prevalent between primary and secondary counties within urban agglomerations, whereas continuous and integrated symbioses tend to occur more consistently among primary counties.
The living function organization model is depicted in Figure 4b. The evolution and distribution of the living function organizational model are somewhat dispersed, primarily demonstrated by the central urban area of Kunming acting as a growth pole that extends outward and stimulates reciprocal growth among adjacent sub-poles. This model predominantly follows the pattern of pole-driven development in surrounding counties. Point symbiosis is the dominant organizational model for living functions across the entire urban agglomeration, accounting for over 98% of all living symbiotic models. Integrated symbiosis is mainly observed in the middle and northwest regions of the CYUA, while continuous and intermittent symbiotic patterns tend to occur in high-value areas of living functions scattered throughout the southern, central, and eastern parts of the urban agglomeration.
The ecological function organization model is depicted in Figure 4b. High values of ecological function symbiotic organization span across the western and southern portions of the urban agglomeration. The organizational model is dominated by point symbiosis in up to 95% of all models. The direction of high ecological function symbiotic organization is opposite to that of production and living, which is mainly from west to east.
In general, urban agglomeration is still at a low level of symbiotic organization, and the three functions are all in a low-level interaction range. A stable organizational model with endogenous driving forces has not been formed.
3.2.2. The Behavior Mode of Urban Symbiosis in the CYUA
Combining the functional parity among counties, which is assessed by the functional distance model, the behavior mode of urban symbiosis can be identified based on both urban interaction and urban function. The quantitative characteristics of symbiotic behavior patterns in the CYUA are presented in Table 5. The dominant symbiotic patterns in urban agglomeration include competitive symbiosis, favorable symbiosis, and irrelevant symbiosis. Competitive symbiosis represents the largest proportion, while parasitic symbiosis accounts for the smallest proportion. Competitive symbiosis occurs between symbiotic units.
Table 5.
Quantitative characteristics of symbiotic behavior patterns in the CYUA.
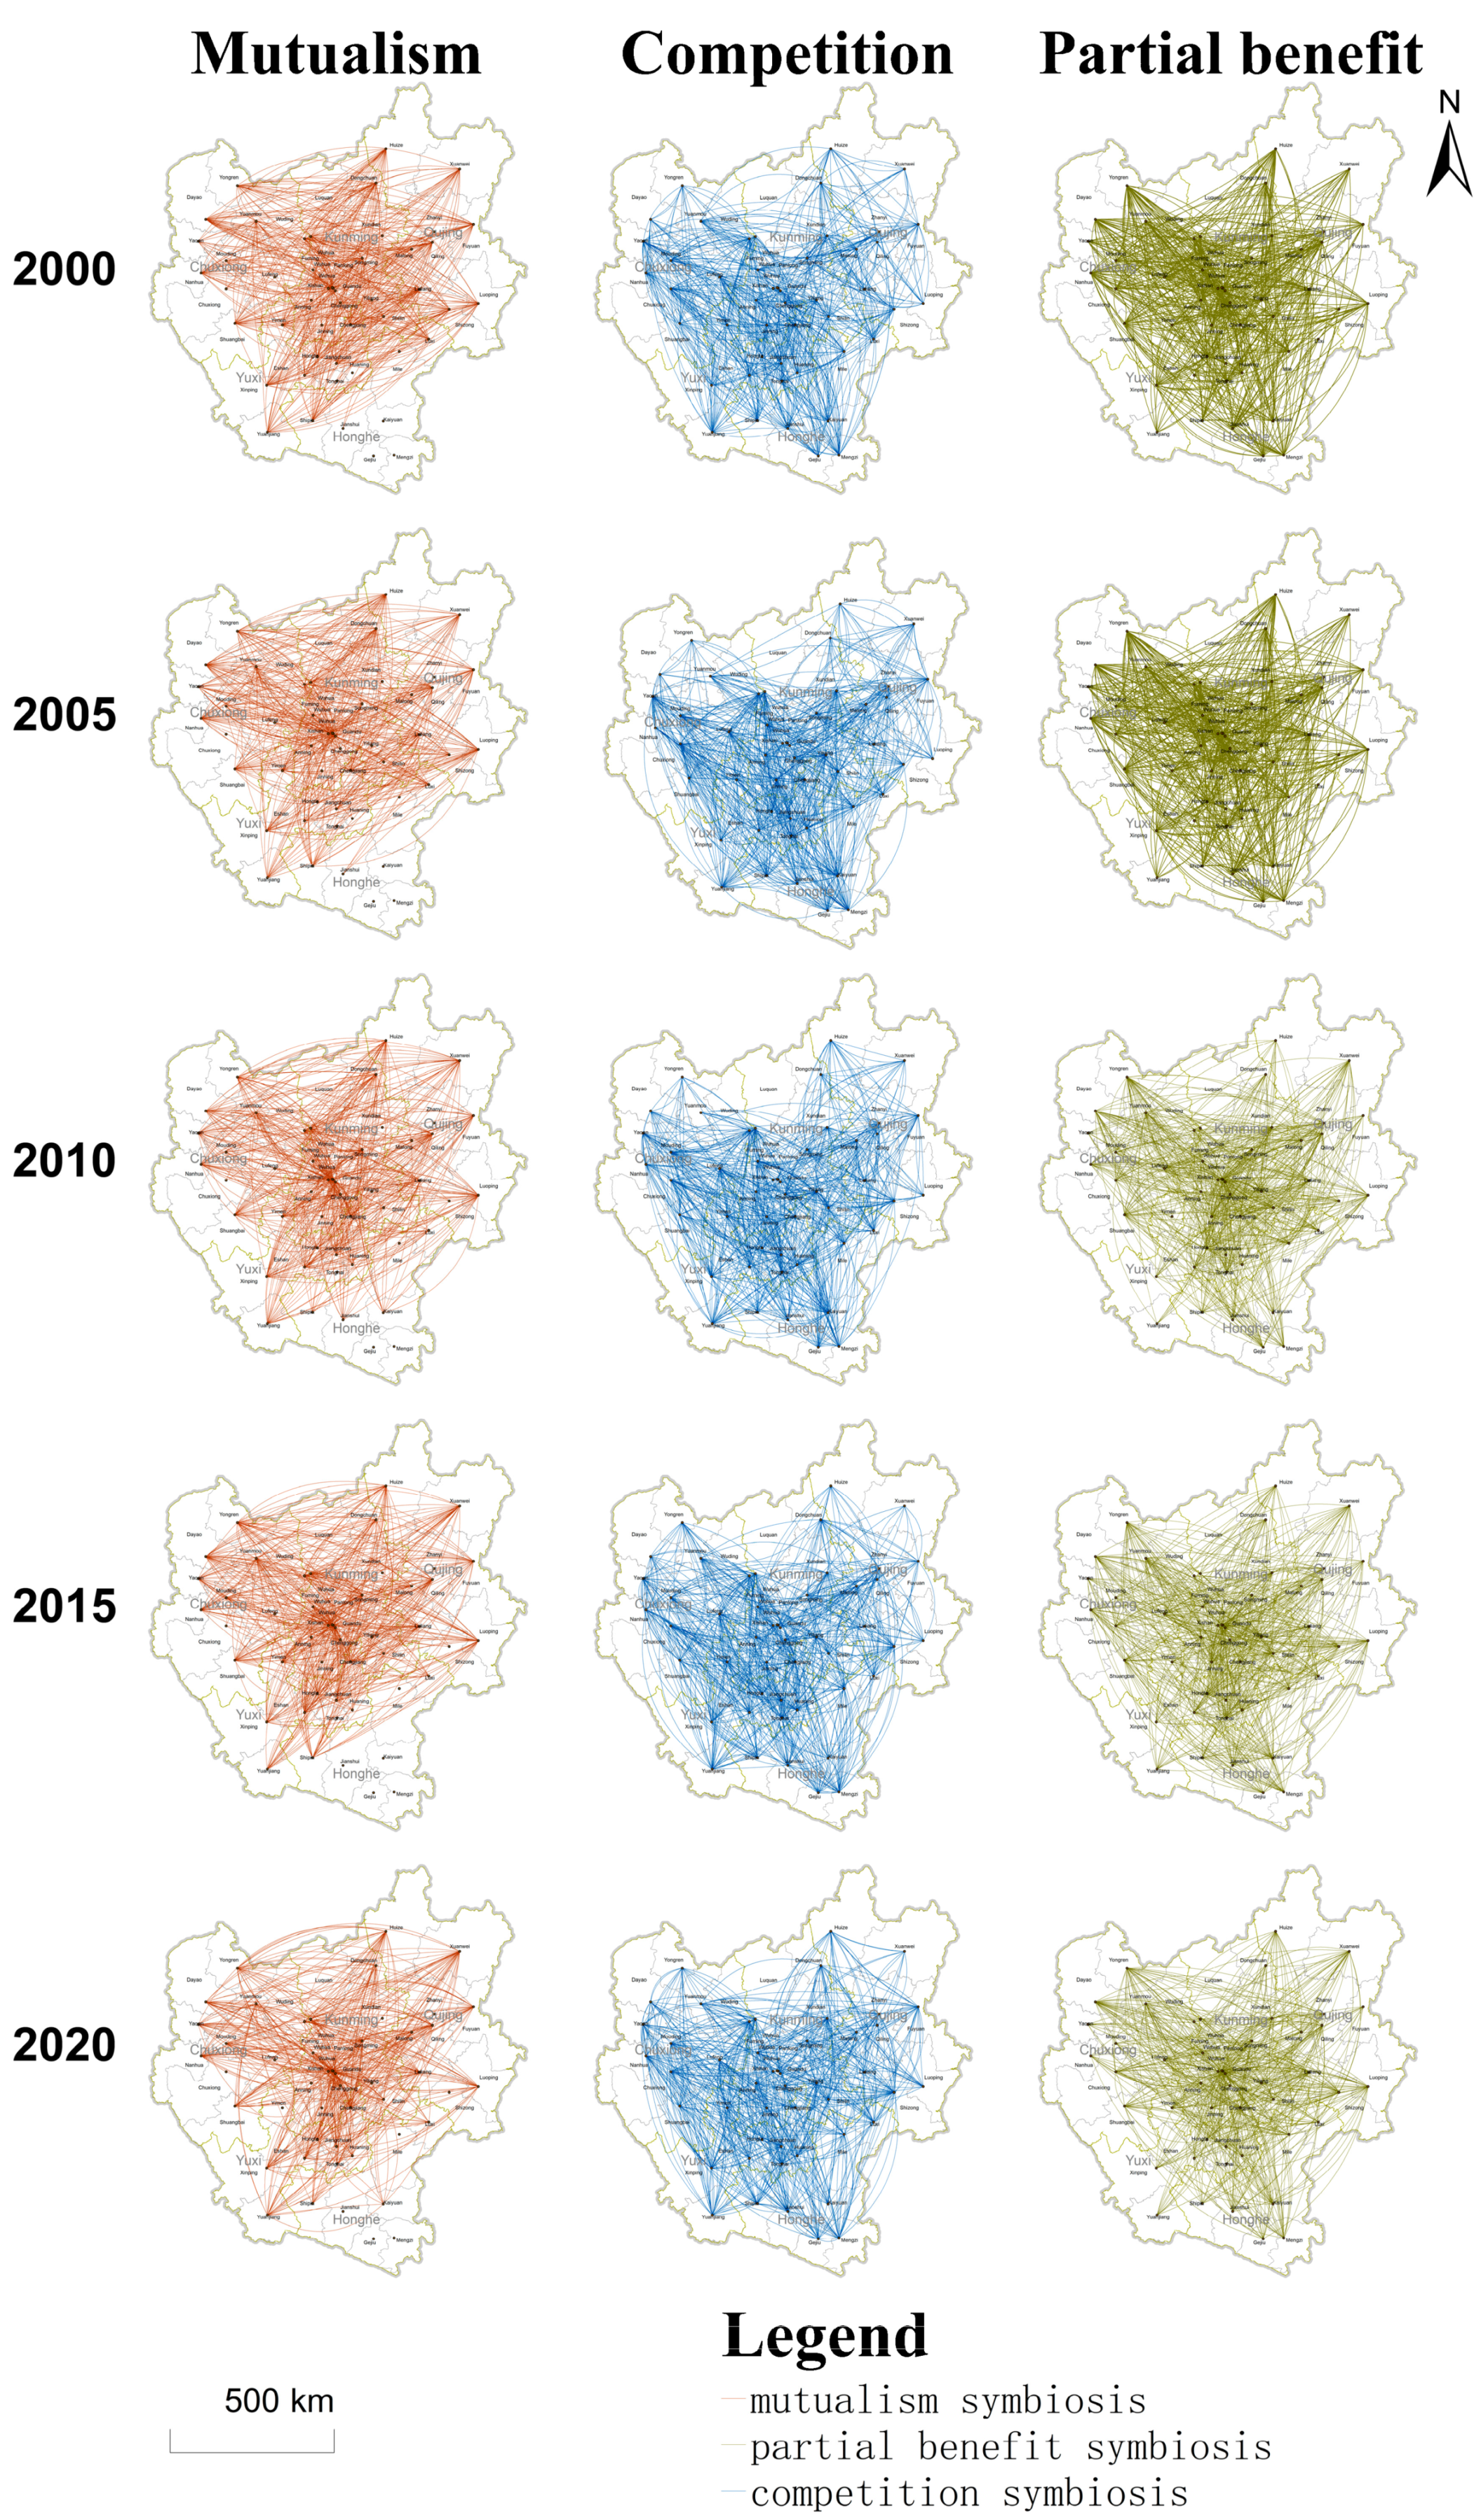
Figure 5 shows the spatial distribution of the three main behavioral modes of the CYUA, namely competition symbiosis, mutualism, and partial benefit symbiosis. In this paper, the cost of travel time was used to represent the interaction distance between counties. Among them, the average time cost between competition symbiosis was 247.42 min, the average time cost between mutualism was 333.44 min, and the time cost between partial benefit symbiosis was 302.87 min, which represents the distance of interaction between counties. Competition symbiosis < partial benefit symbiosis < mutualism. This shows that, in the CYUA, competition symbiosis tends to occur between counties that are close together, while mutualistic symbiosis occurs between counties that are far apart.

Figure 5.
Distribution diagram of the three main behavioral patterns.
3.2.3. The Organized Mode and the Behavior Mode of Urban Symbiosis in the CYUA
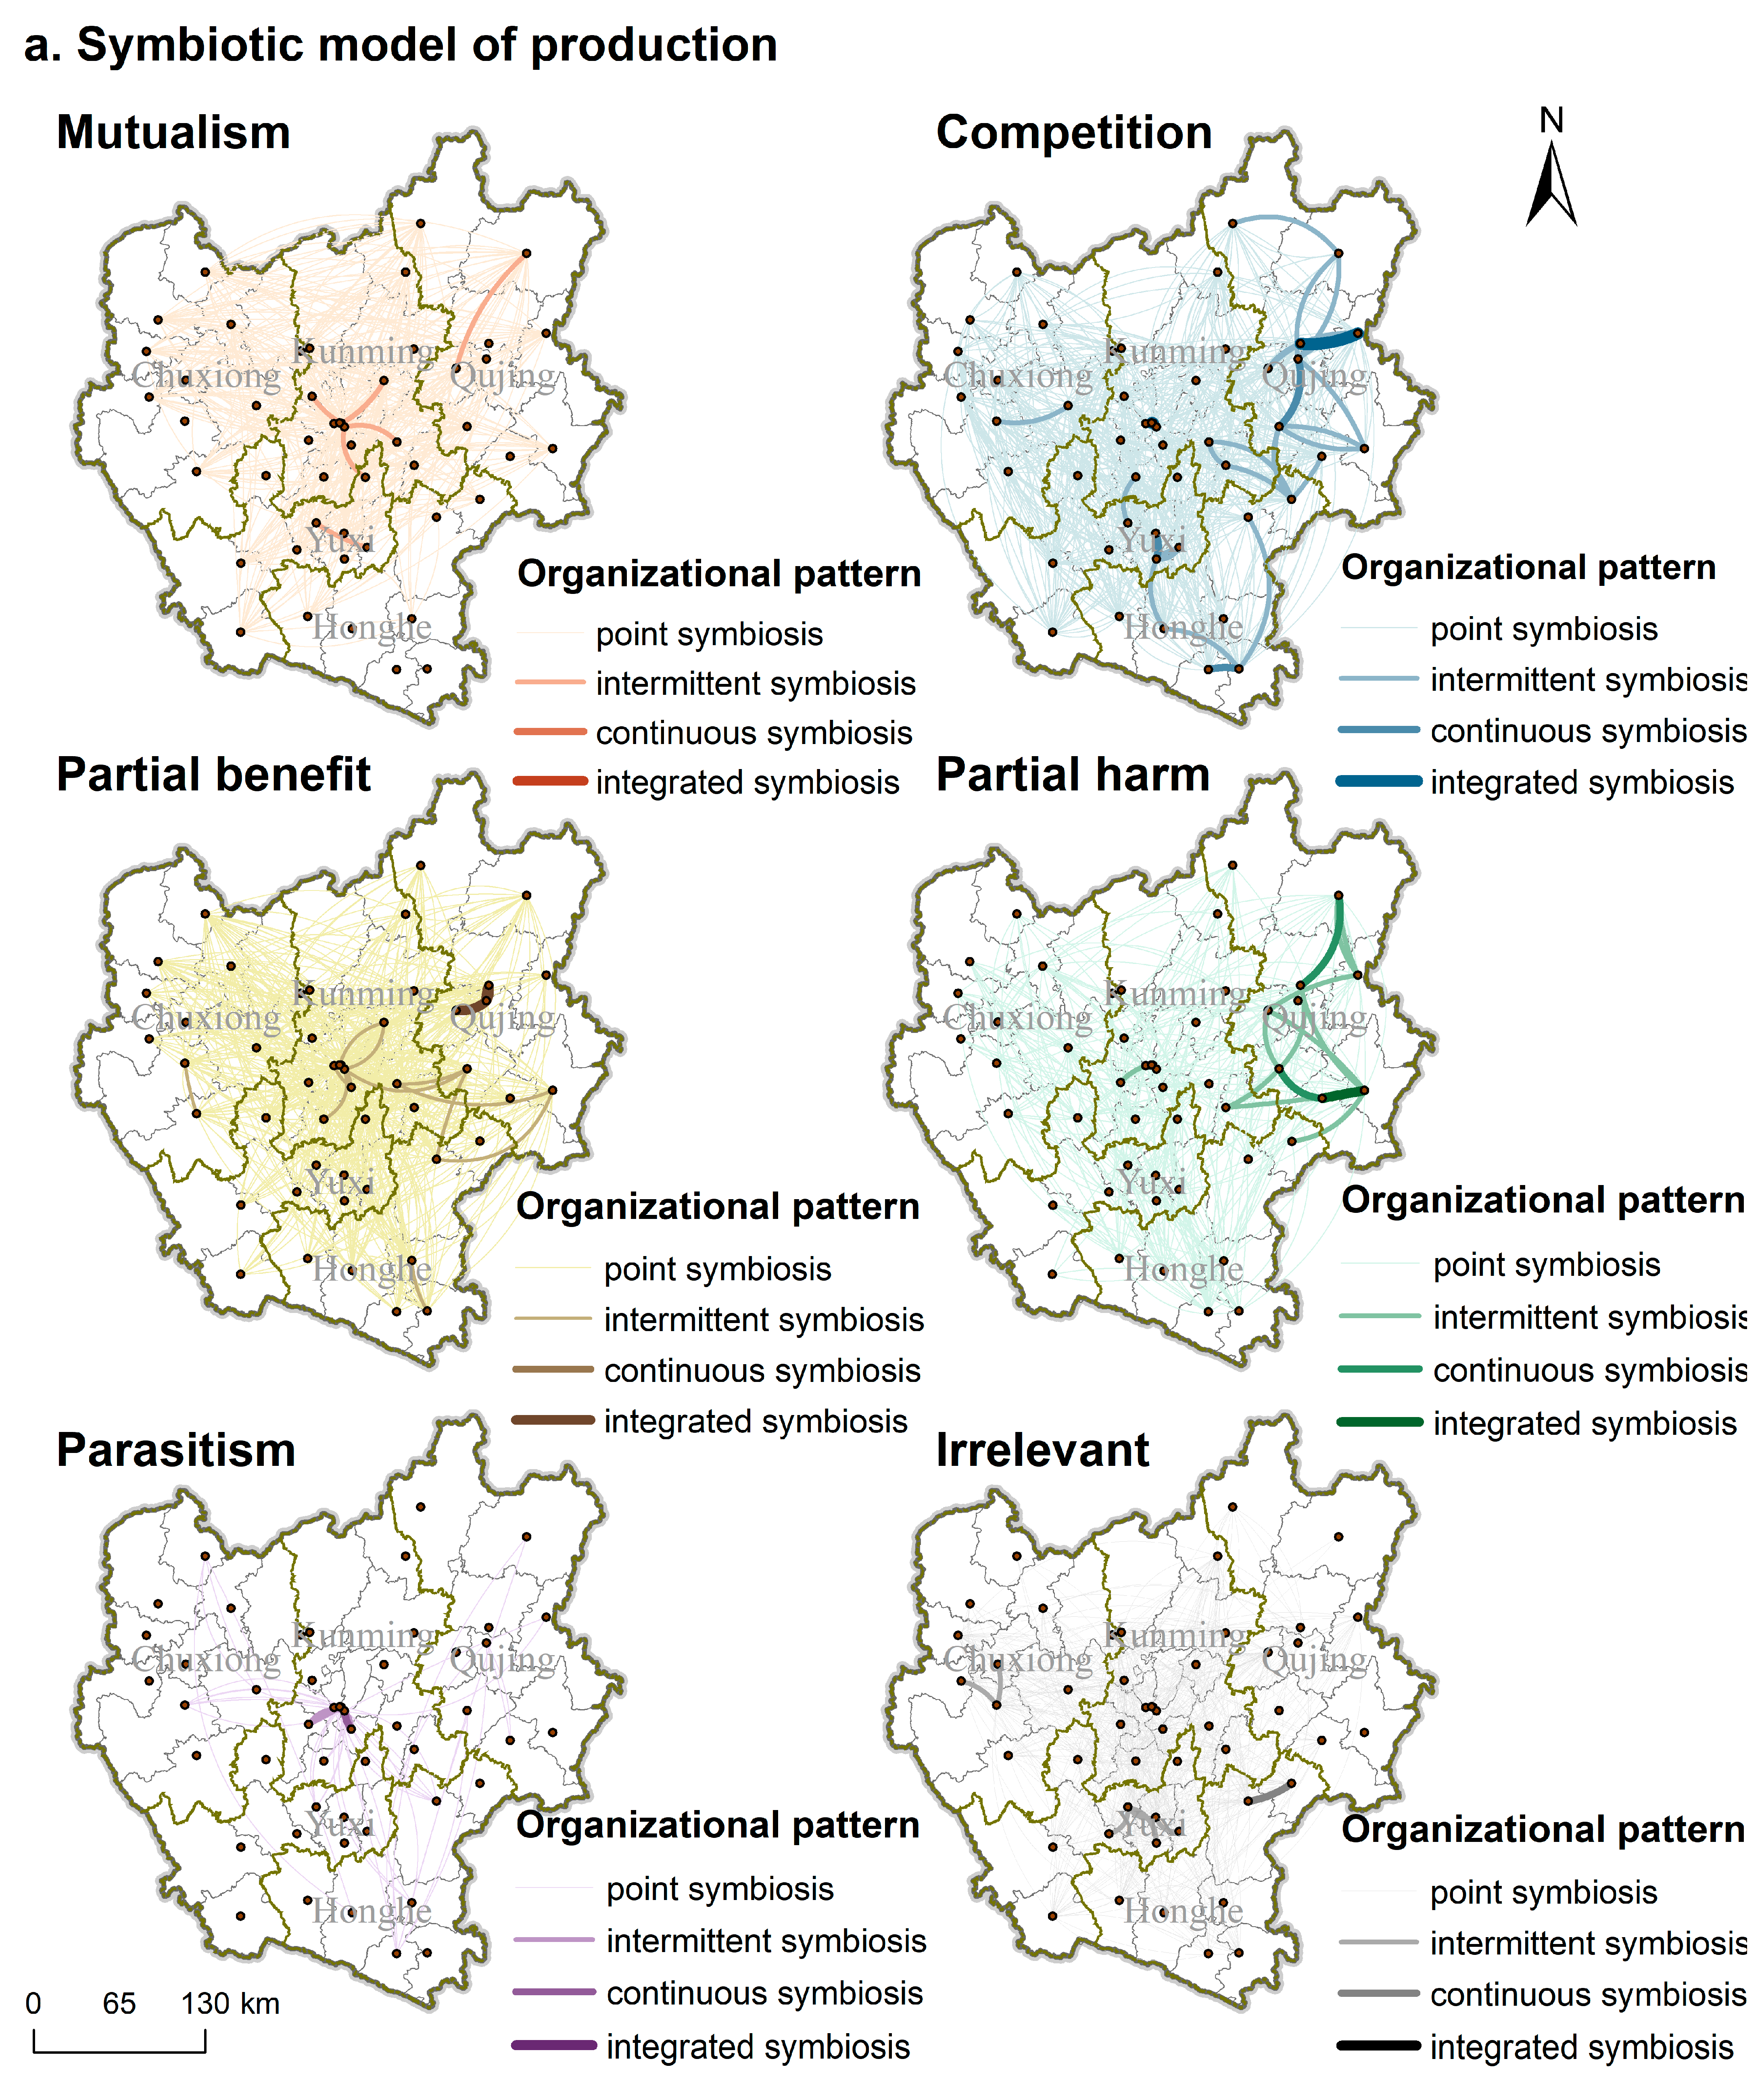
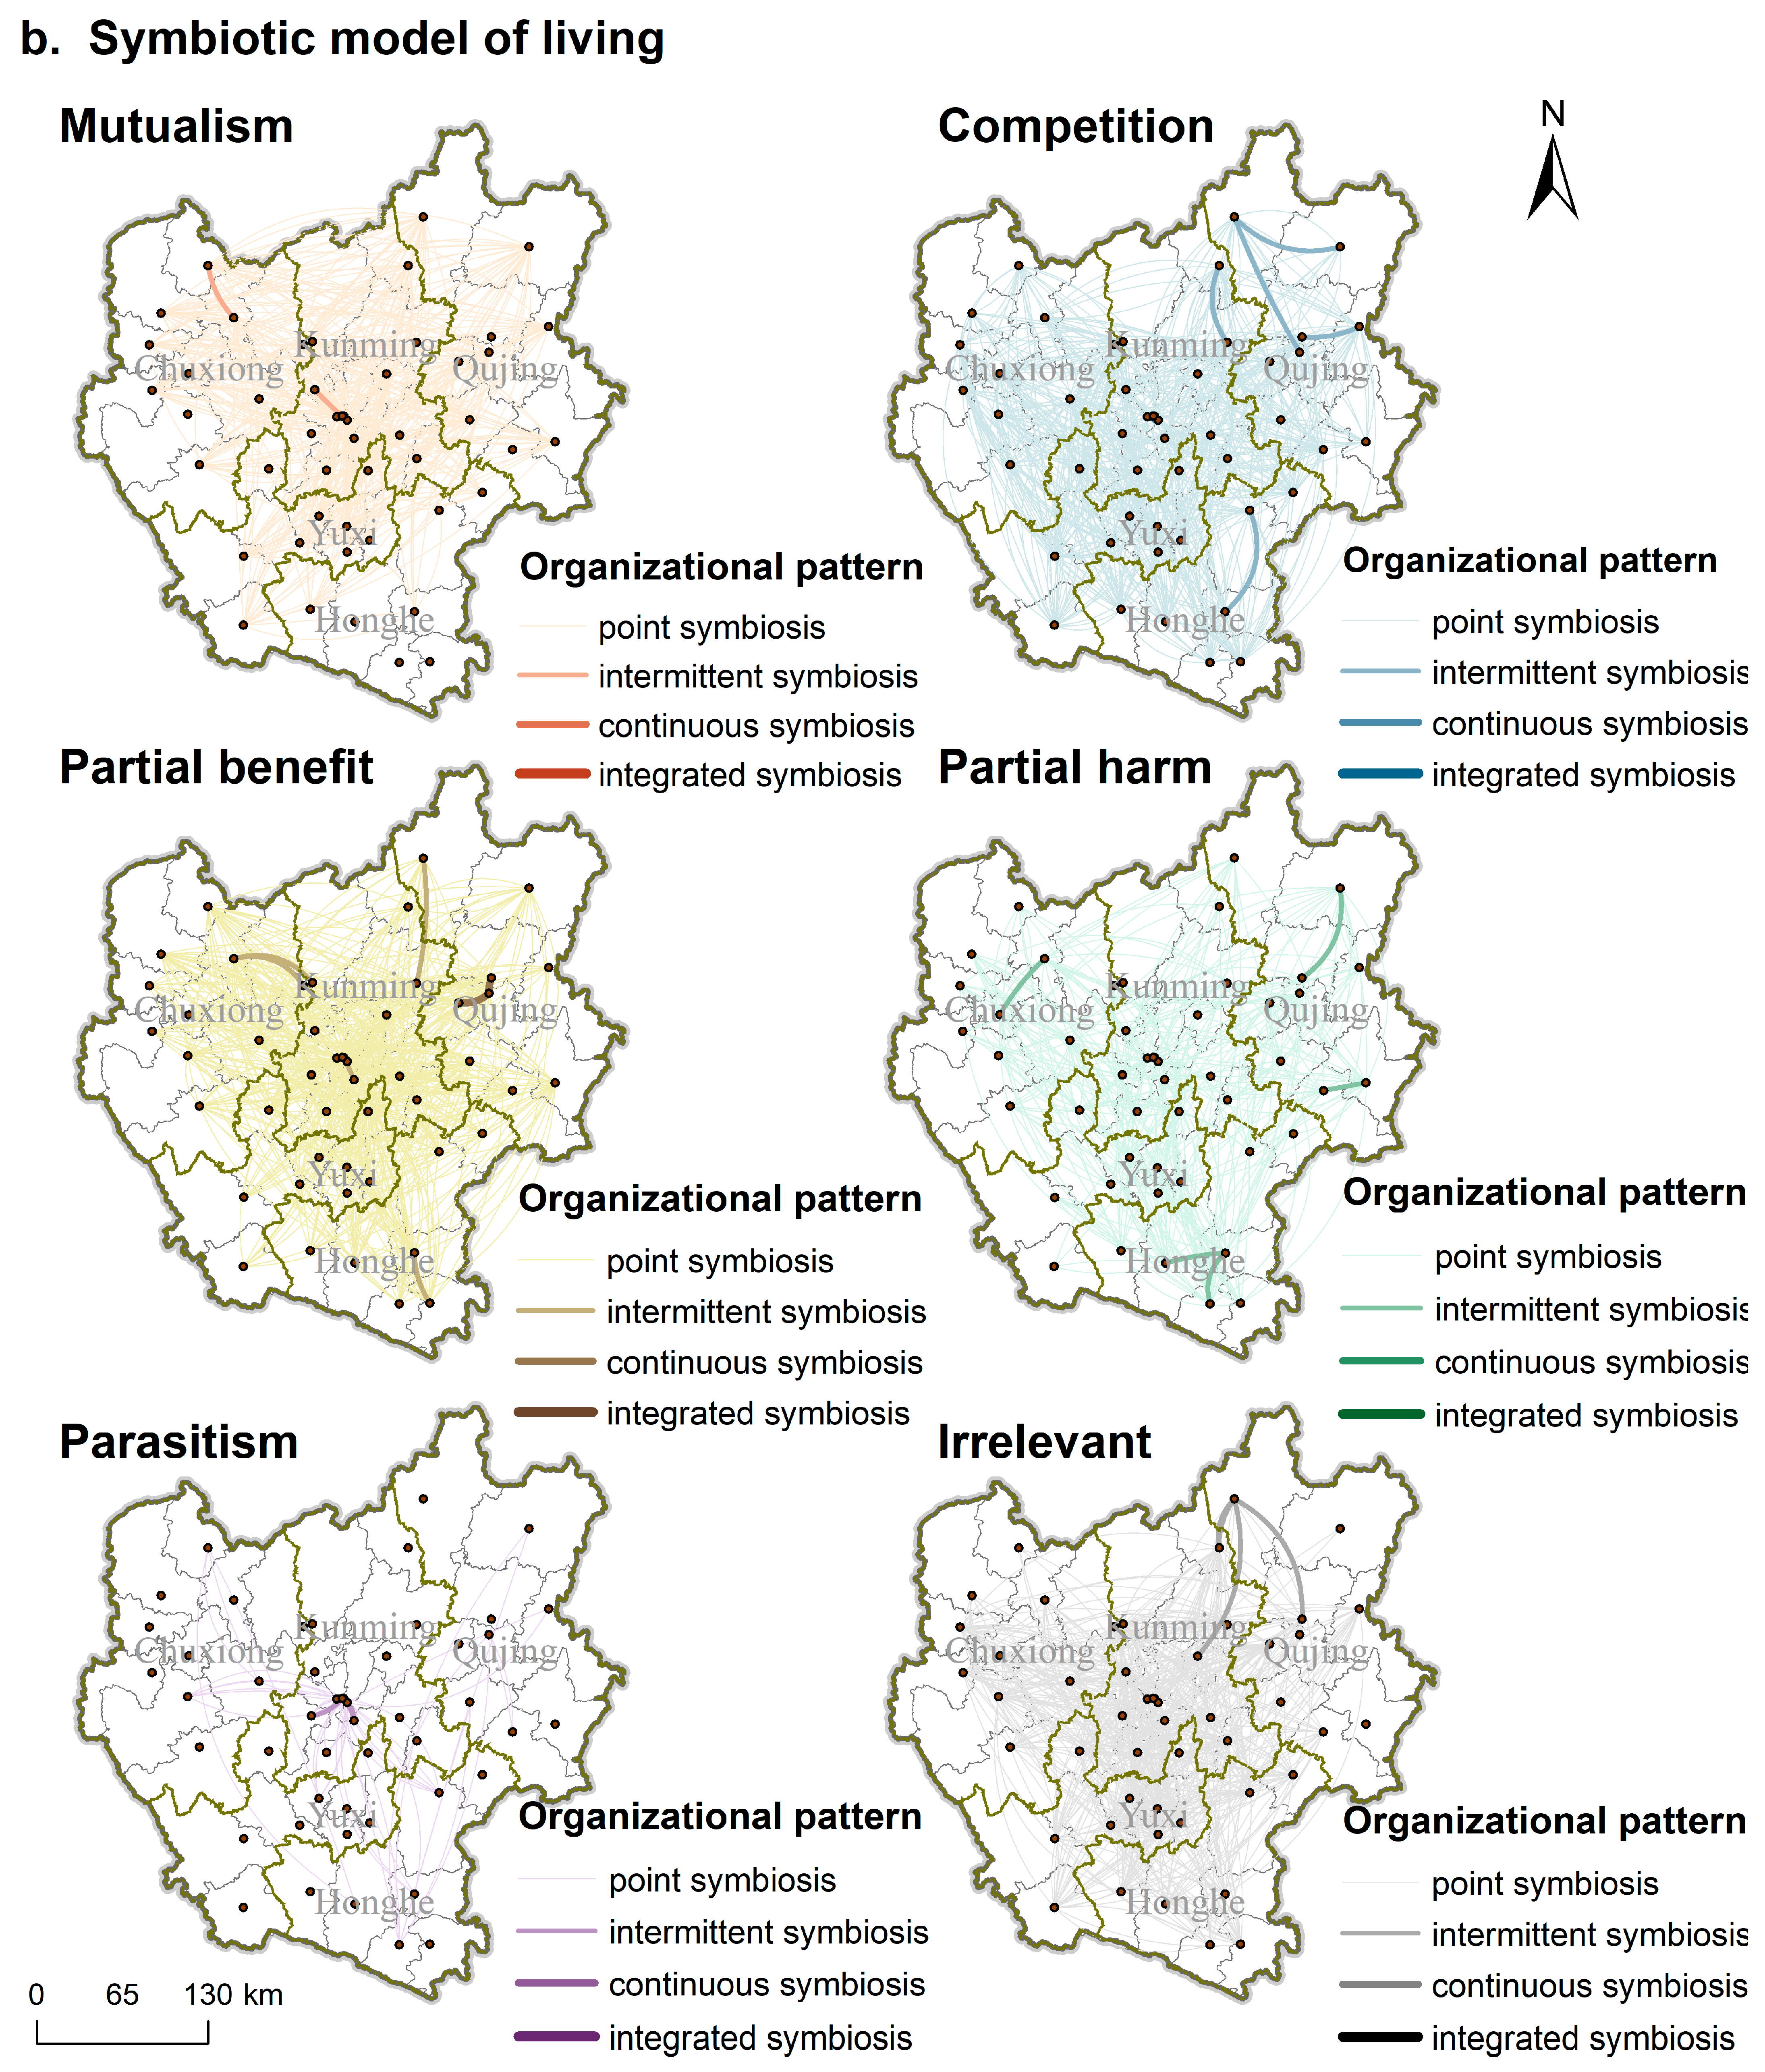
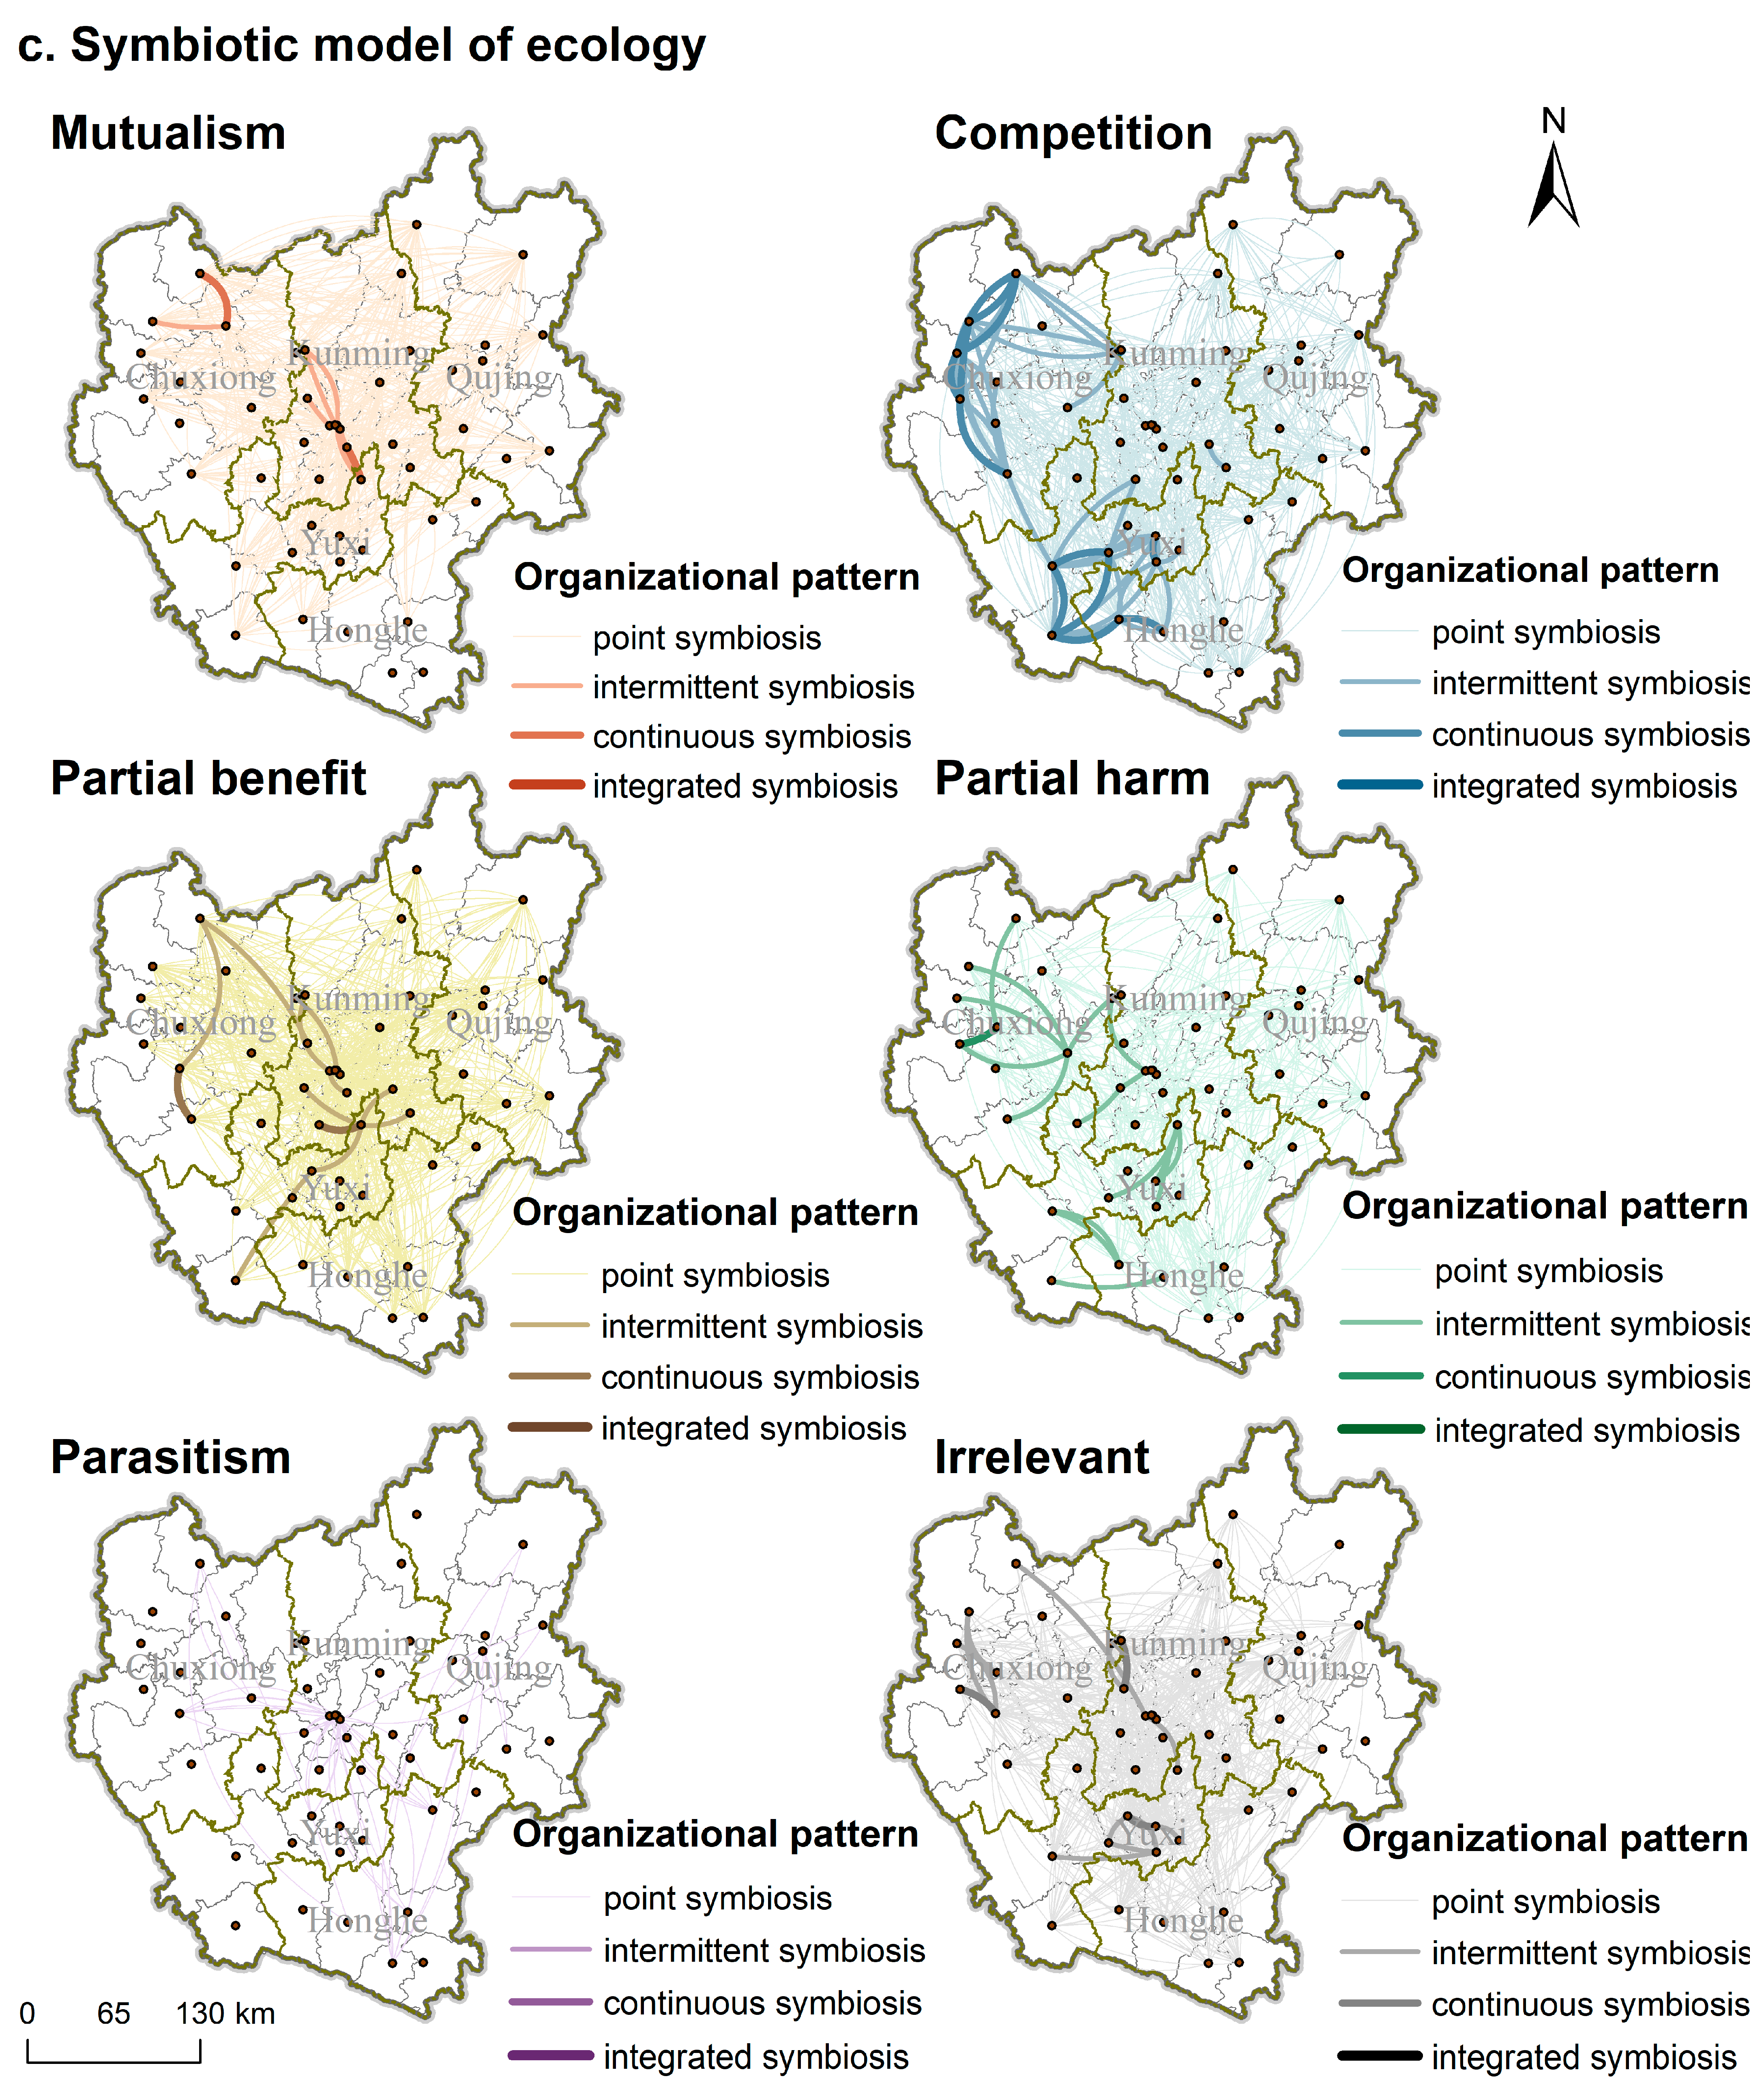
We combined the organizational model and the behavioral model to demonstrate the current state of symbiosis between counties in the CYUA. Figure 6 shows the symbiosis model of the CYUA in 2020. Figure 6a shows the production function symbiosis model, in which counties are mainly concentrated in the central and eastern regions. The counties with strong interaction in the central part are mainly based on mutualism, while the eastern part is mainly based on competition symbiosis and partial-harm symbiosis. It is necessary to adjust the industrial structure to achieve a mutually beneficial development model. Figure 6b clearly shows the symbiosis model of living functions. It can be seen that the interaction intensity of living functions is generally low, the radiation range is small, and the distribution of behavioral patterns is relatively even. Figure 6c shows the ecological functions. In the symbiosis model, counties are mainly concentrated in the central and western regions. The western and central regions mainly adopt mutually beneficial symbiosis or partial-benefit symbiosis, while the counties in the western region mainly adopt competitive symbiosis and partial-harm symbiosis.
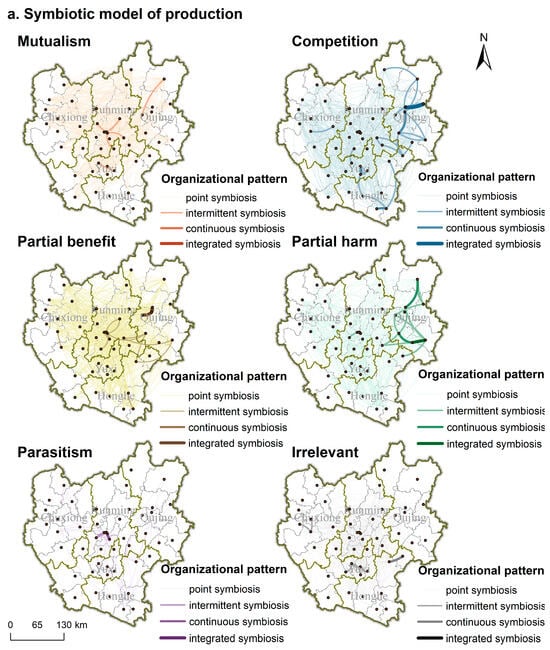
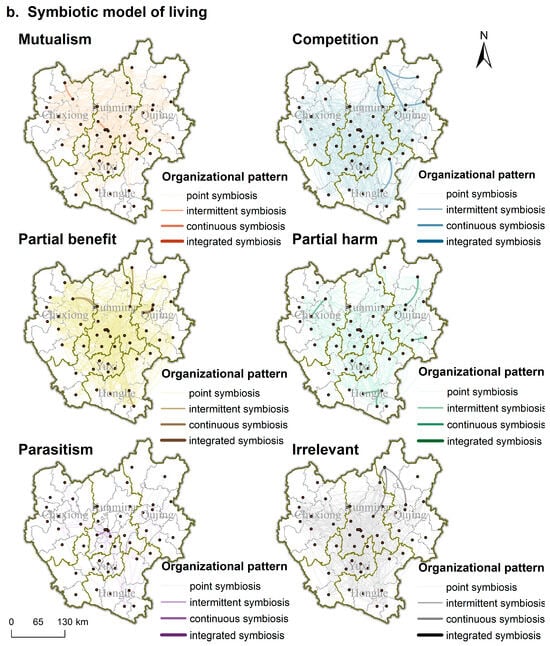
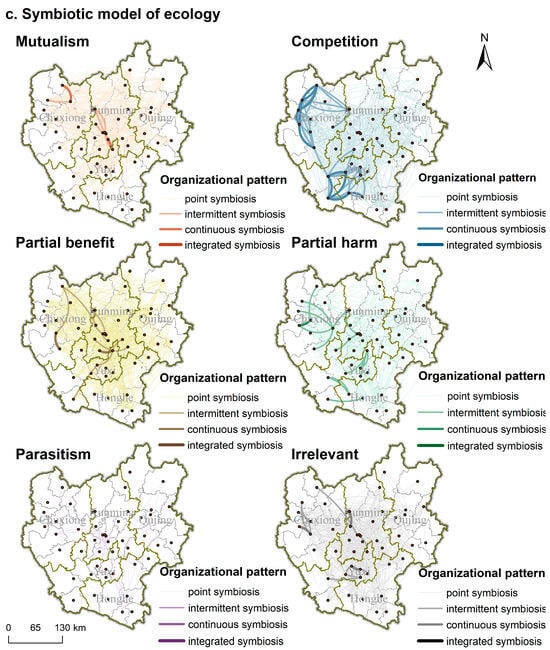
Figure 6.
(a) Spatial distribution of production symbiosis models in 2020. (b) Spatial distribution of living symbiosis models in 2020. (c) Spatial distribution of ecological symbiosis models in 2020.
The CYUA is an urban agglomeration developed with central cities at its core. However, the dynamics within Kunming’s urban area are predominantly competitive. On the contrary, positive interactions can be observed with counties in other areas, such as Yuxi. Yuxi, located in the six-river ecological zone, prominently develops living and ecological functions, fostering a positive symbiotic relationship with Kunming, which primarily focuses on the industrial sector. This phenomenon underscores that, in terms of functional planning, the primary focus remains on city areas. There is a deficiency in functional division planning within the counties, resulting in positive interactions between counties in neighboring cities but competitive dynamics and other symbiotic models within the city itself.
3.3. The Integrated Degree of the CYUA from the Perspective of Production–Living–Ecological Symbiosis
The level of integration was evaluated by analyzing the positive interaction generated by each county. As shown in Figure 7, we calculated changes in the quantitative characteristics of the integrated degree of the CYUA. Figure 8 shows changes in the spatial distribution of the integrated degree of the CYUA.
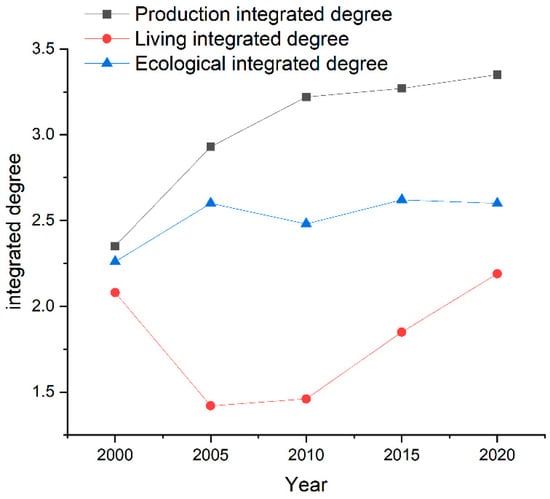
Figure 7.
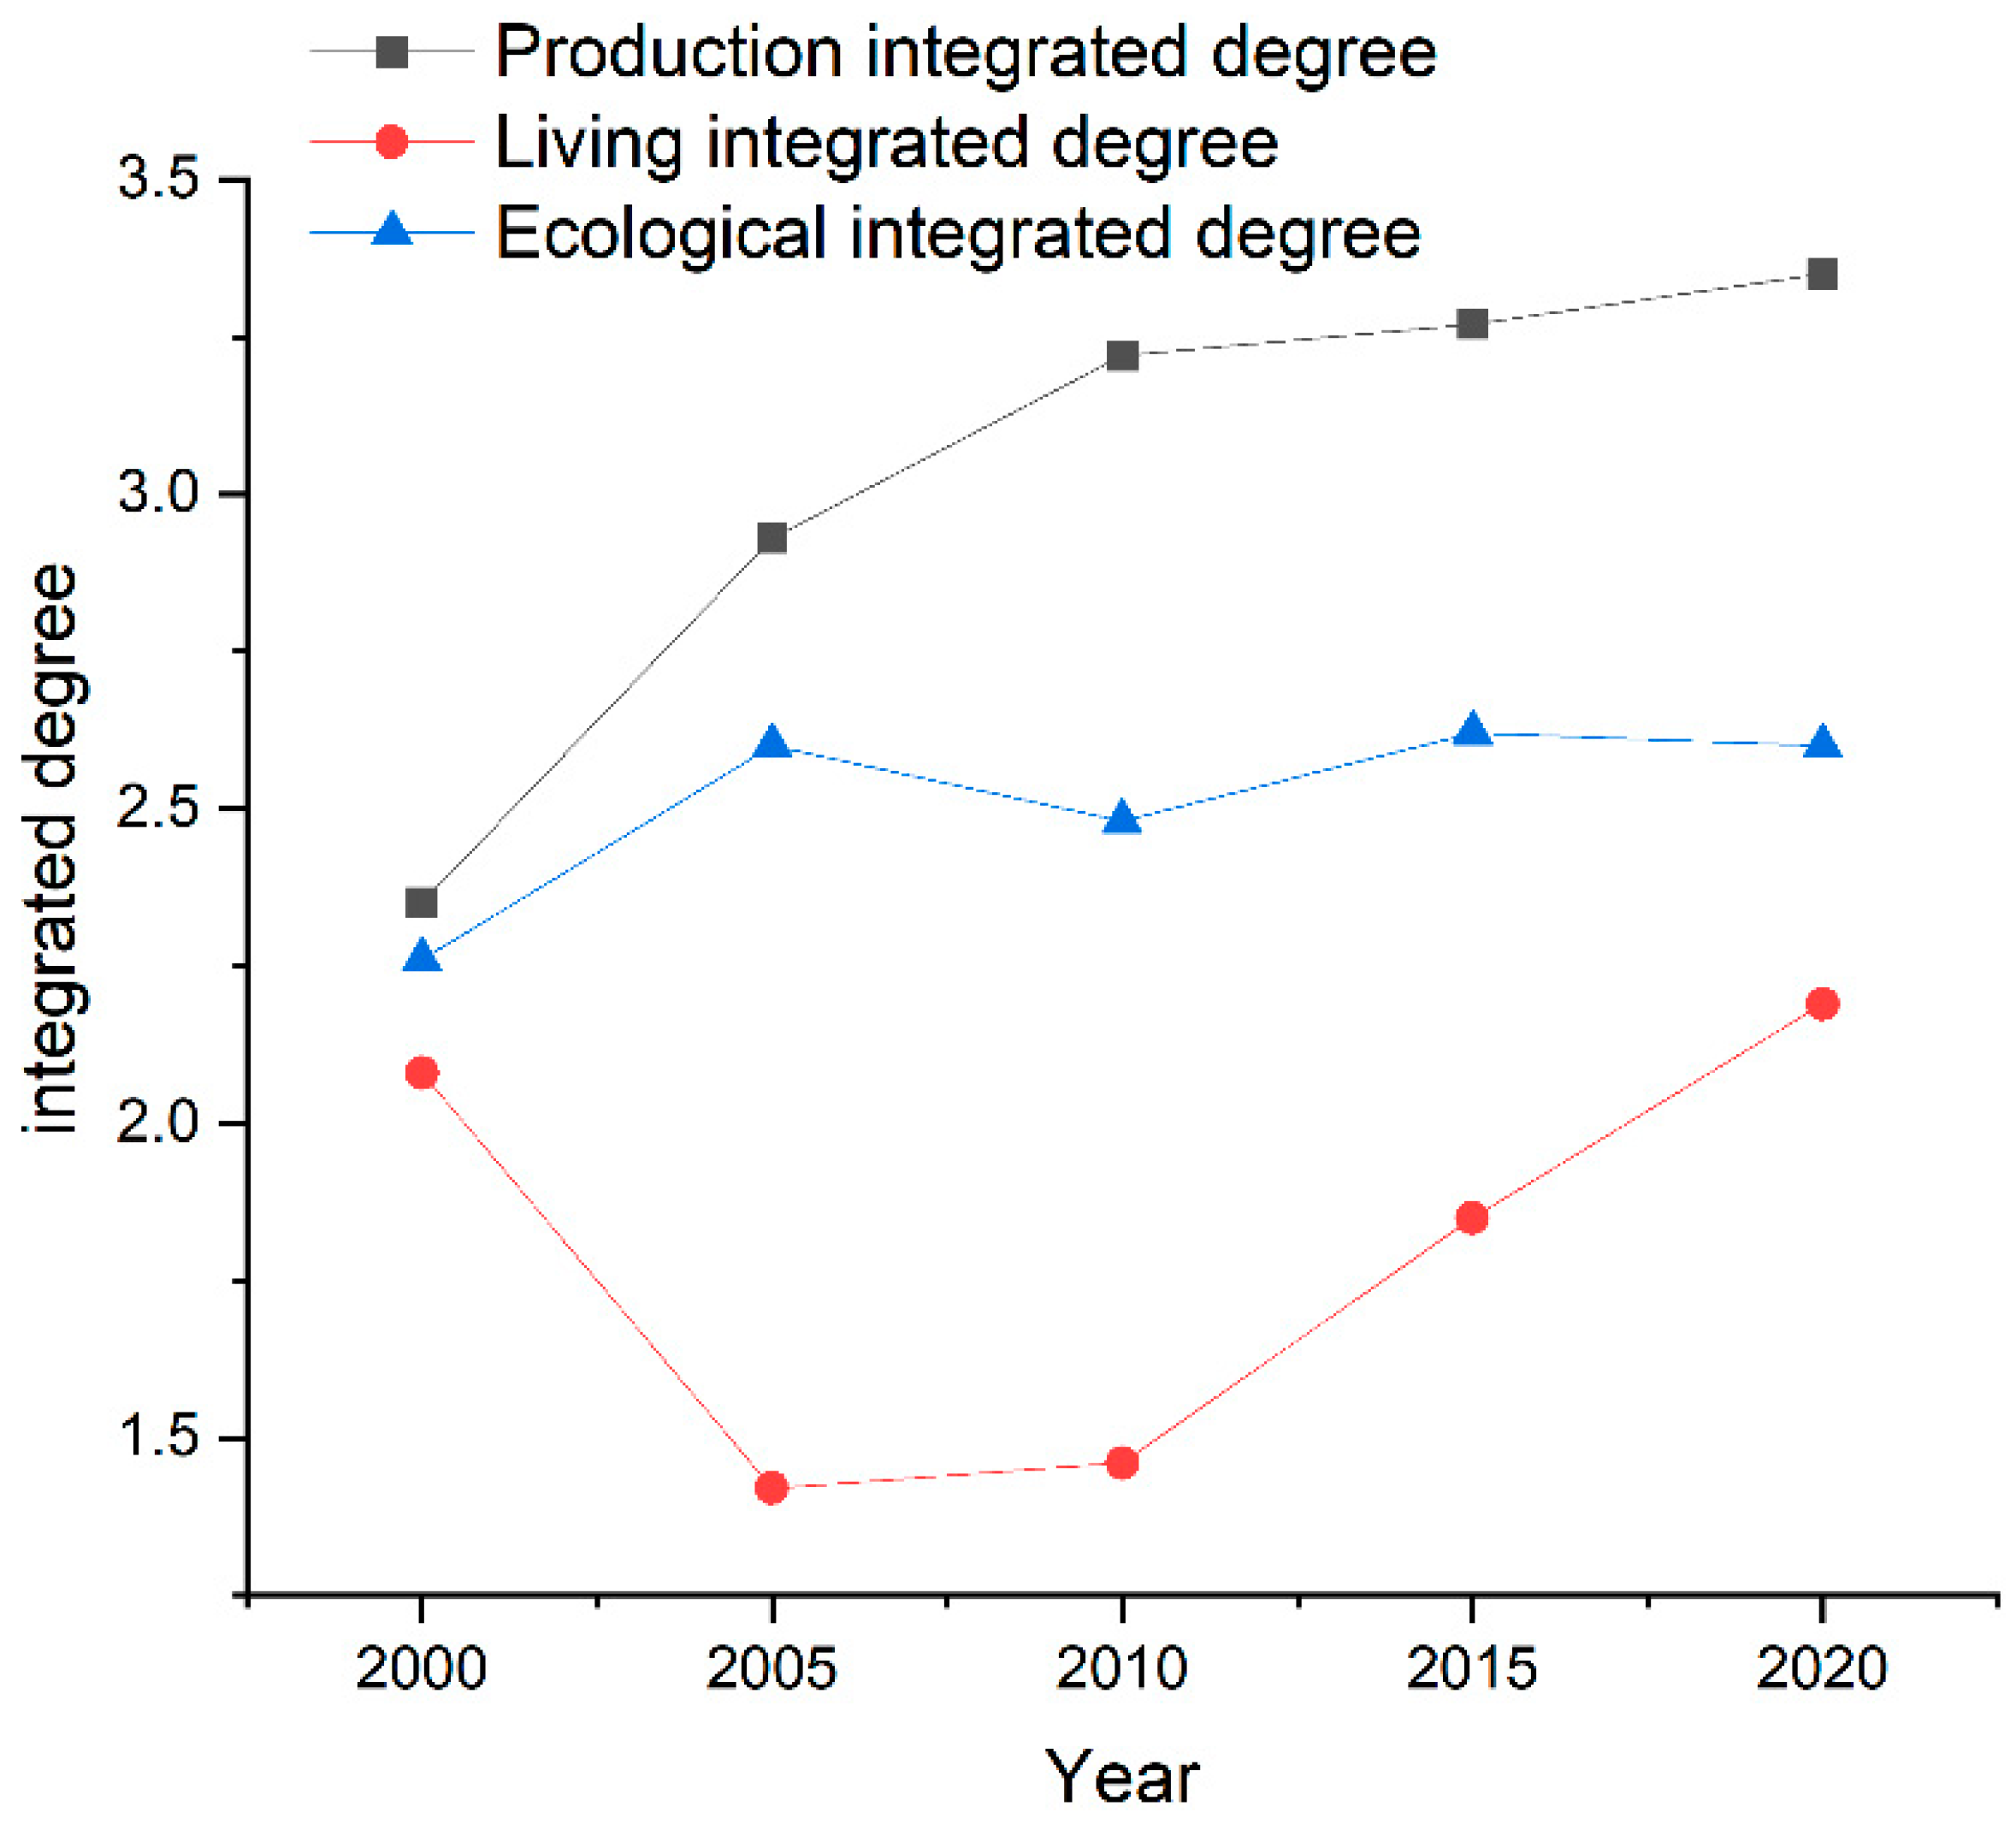
Changes in the quantitative characteristics of the integrated degree of the CYUA from 2000 to 2020.
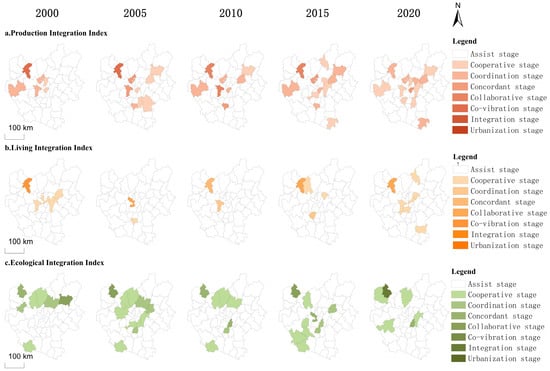
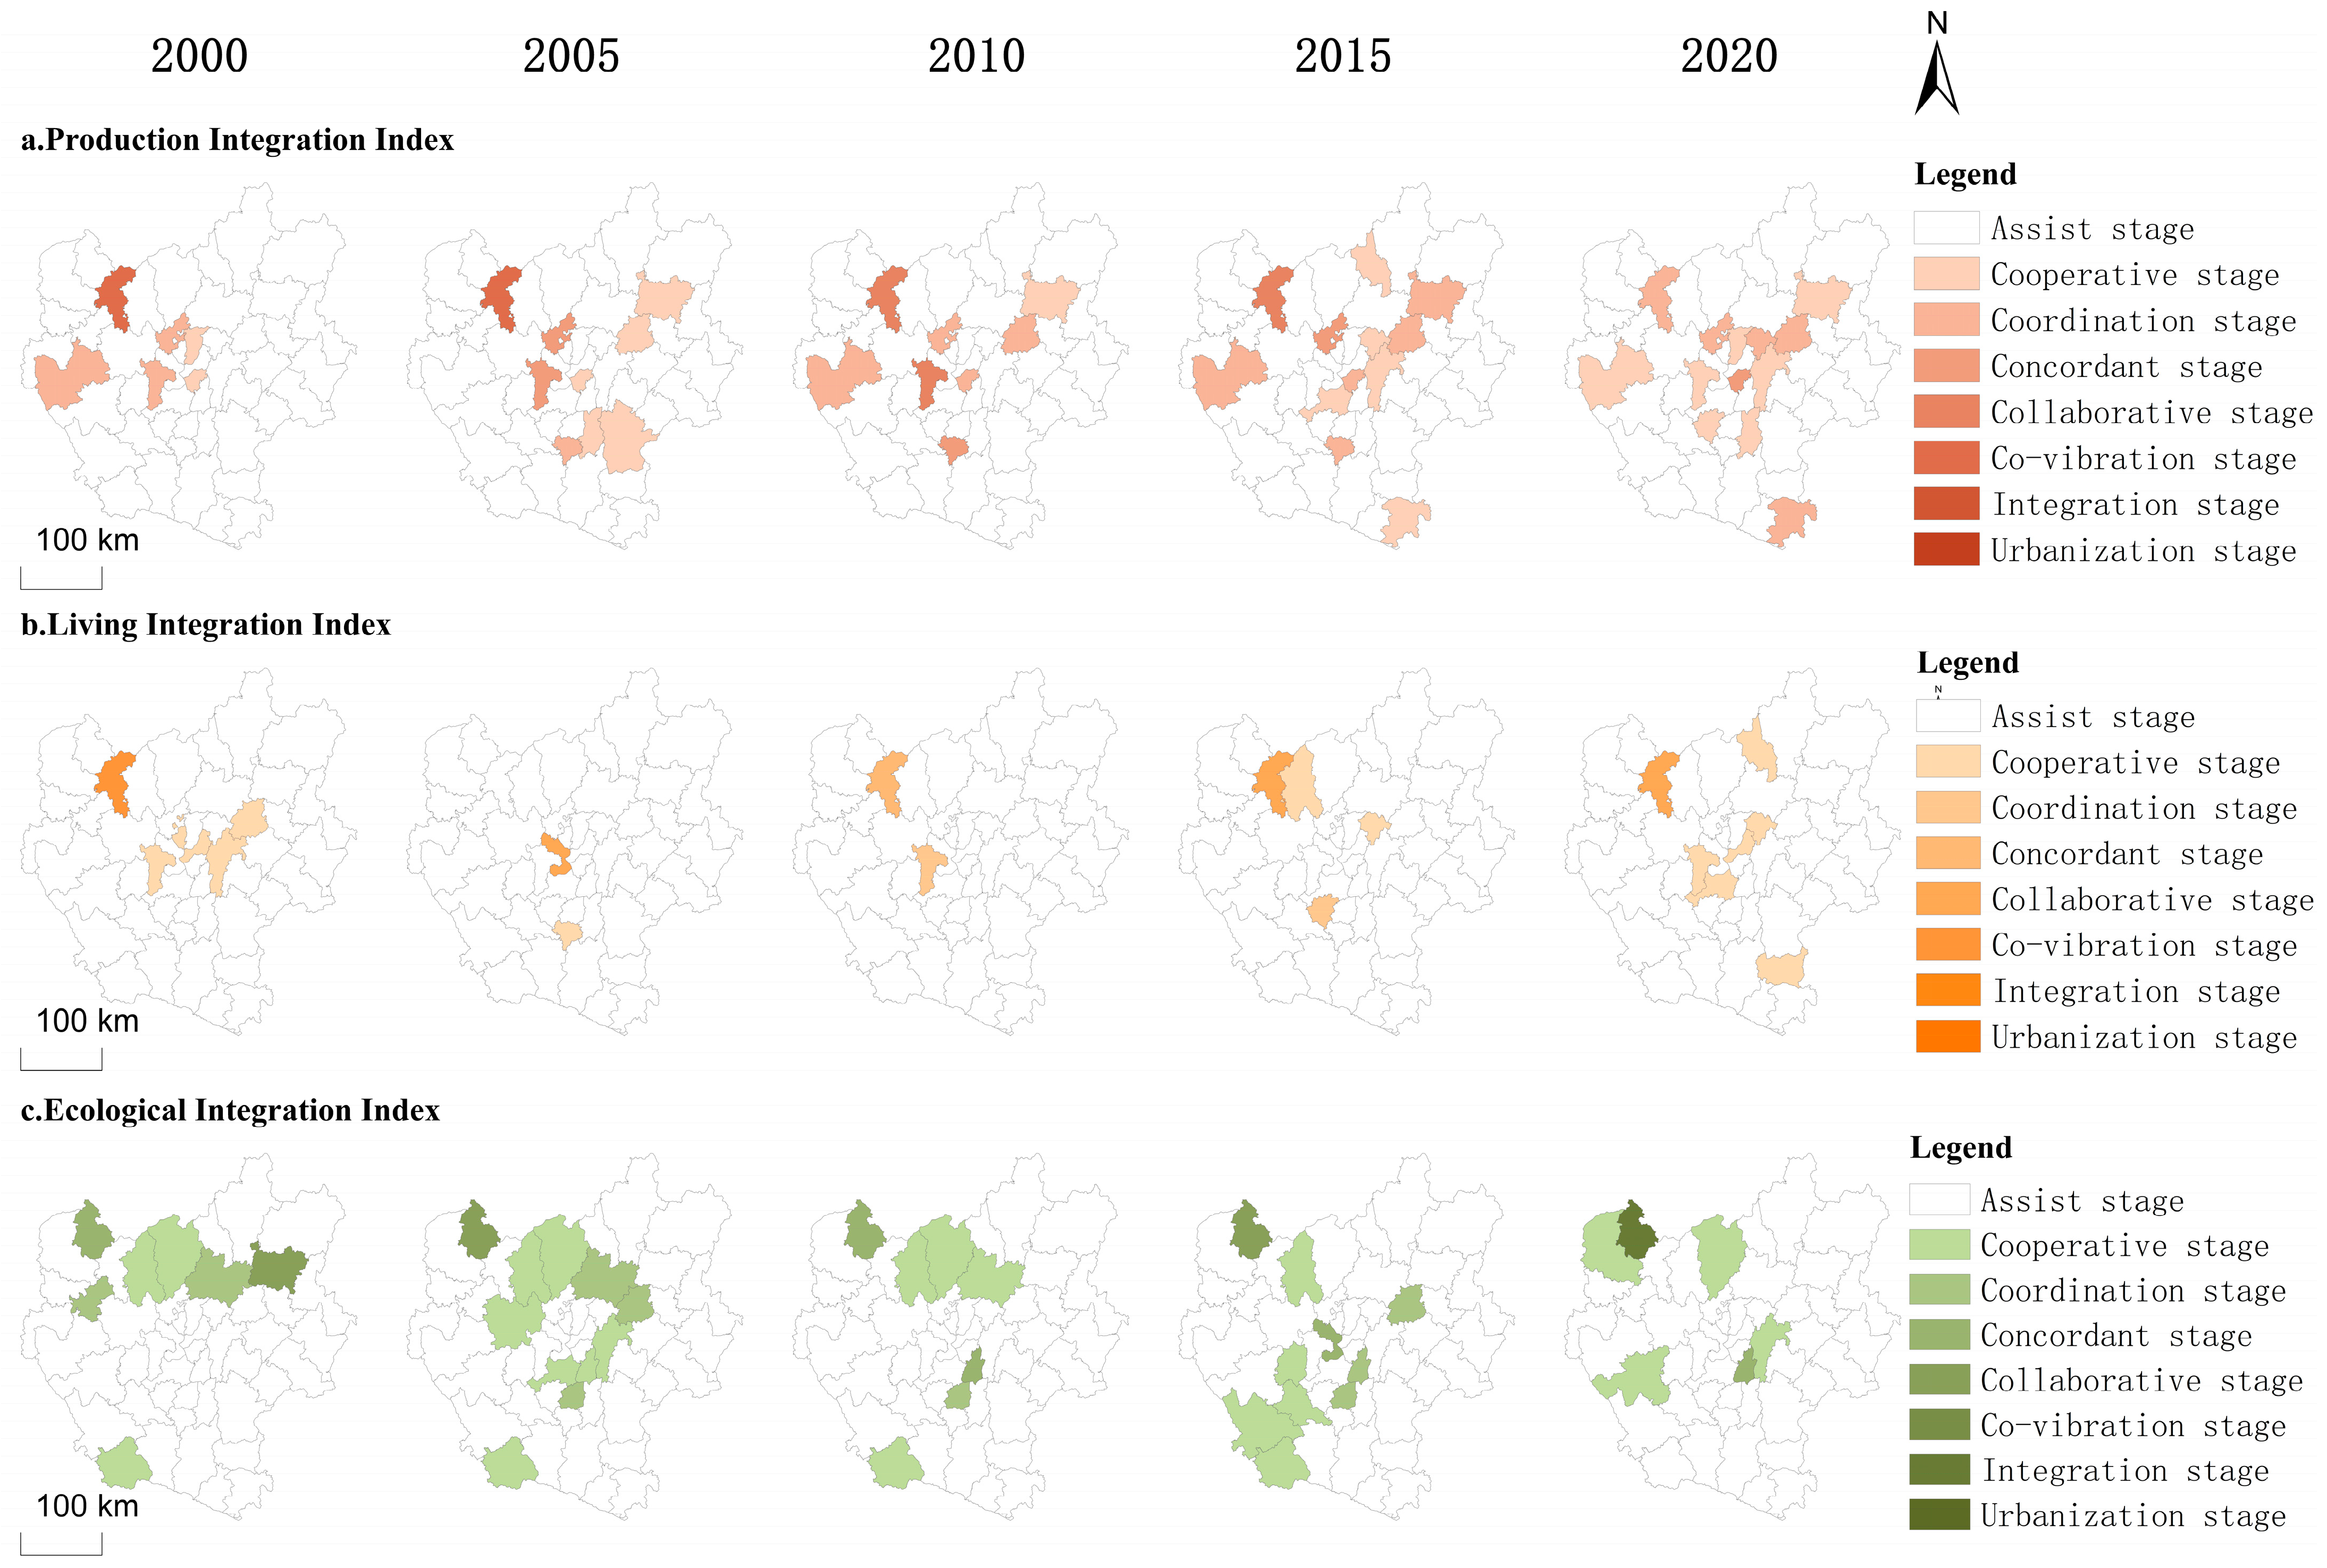
Figure 8.
Changes in the spatial distribution of the integrated degree of the CYUA from 2000 to 2020.
As shown in Figure 8, the integrated level of the production function shows a continuous upward trend from 2000 to 2020. The spatial distribution is shown in Figure 8. Figure 8a shows the spatial distribution of the production integrated degree. It can be seen that the degree of participation in the production integration of urban agglomerations gradually increased. The cities entering the early stage of development increased from 12% to 26% regarding the distribution of urban production integration participation. The situation also developed from discrete distribution to gradually contiguous development. However, it was mainly concentrated below the coordination stage, and the development of integrated production in urban agglomerations was in its early stages. Figure 8b shows the spatial distribution of the living integrated degree. The degree of participation in the living integration of urban agglomerations is low. From 2000 to 2020, the degree of increase was not obvious, from the original 12% to 14%, and development was in the early stage, mainly concentrated in the central region, with scattered urban distribution and no stable development. Figure 8c shows the spatial distribution of the ecological integrated degree. The overall ecological integration of urban agglomerations was also in its early stages. From a distribution perspective, it has not formed a stable development model. The ecological integration of the eastern and southern regions was involved to a lesser extent.
In general, from 2000 to 2020, urban agglomeration was still in its initial stage of development, with few counties capable of participating in integrated development to a significant extent.
4. Discussion
4.1. Symbiotic Modes of Towns Derived from Production–Living–Ecology Conditions in the CYUA
The symbiotic mode of counties from the perspective of production, living, and ecology is continuously improved but still at a low level. Reasonable organizational and behavioral modes among counties are conducive to coordinated development. In order to promote urban agglomeration development, the following aspects must be considered: (1) similar functions tend to cluster regionally, leading to competitive dynamics among counties in areas with high functional organization. In the CYUA, central cities can form a good interactive relationship with the surrounding areas, but the surrounding areas are mainly in a competitive state. It is necessary to clarify the functional positioning of small cities and strengthen the driving ability of sub-poles. (2) The city’s own resource endowment and interaction intensity complement each other, and the stable interaction between counties is rooted in a certain degree of endogenous forces. (3) The development of transportation enhances the level of production organization while hindering the level of ecological organization. The development of transportation within the CYUA is primarily centered around Kunming and radiates outward. This can be observed through the organization models of production and living functions. During the period from 2010 to 2015, Honghe Prefecture, located in the southern part of the urban agglomeration, was officially incorporated into the urban agglomeration planning. The establishment of the Yuxi–Mengzi Railway connected Honghe Prefecture with Yuxi. It is evident that the degree of production organization in the southern and central regions experienced a significant increase during 2010–2015, while the degree of ecological organization was subdued. In the development of urban agglomeration, the improvement of transportation deepens communication among counties. Urban expansion may lead to the decline of the carbon sequestration capacity of vegetation [33] and the loss of biodiversity [34], thus affecting the decline of the overall ecological function interaction of urban agglomeration.
4.2. Integration Development of the CYUA from the Perspective of Production–Living–Ecology
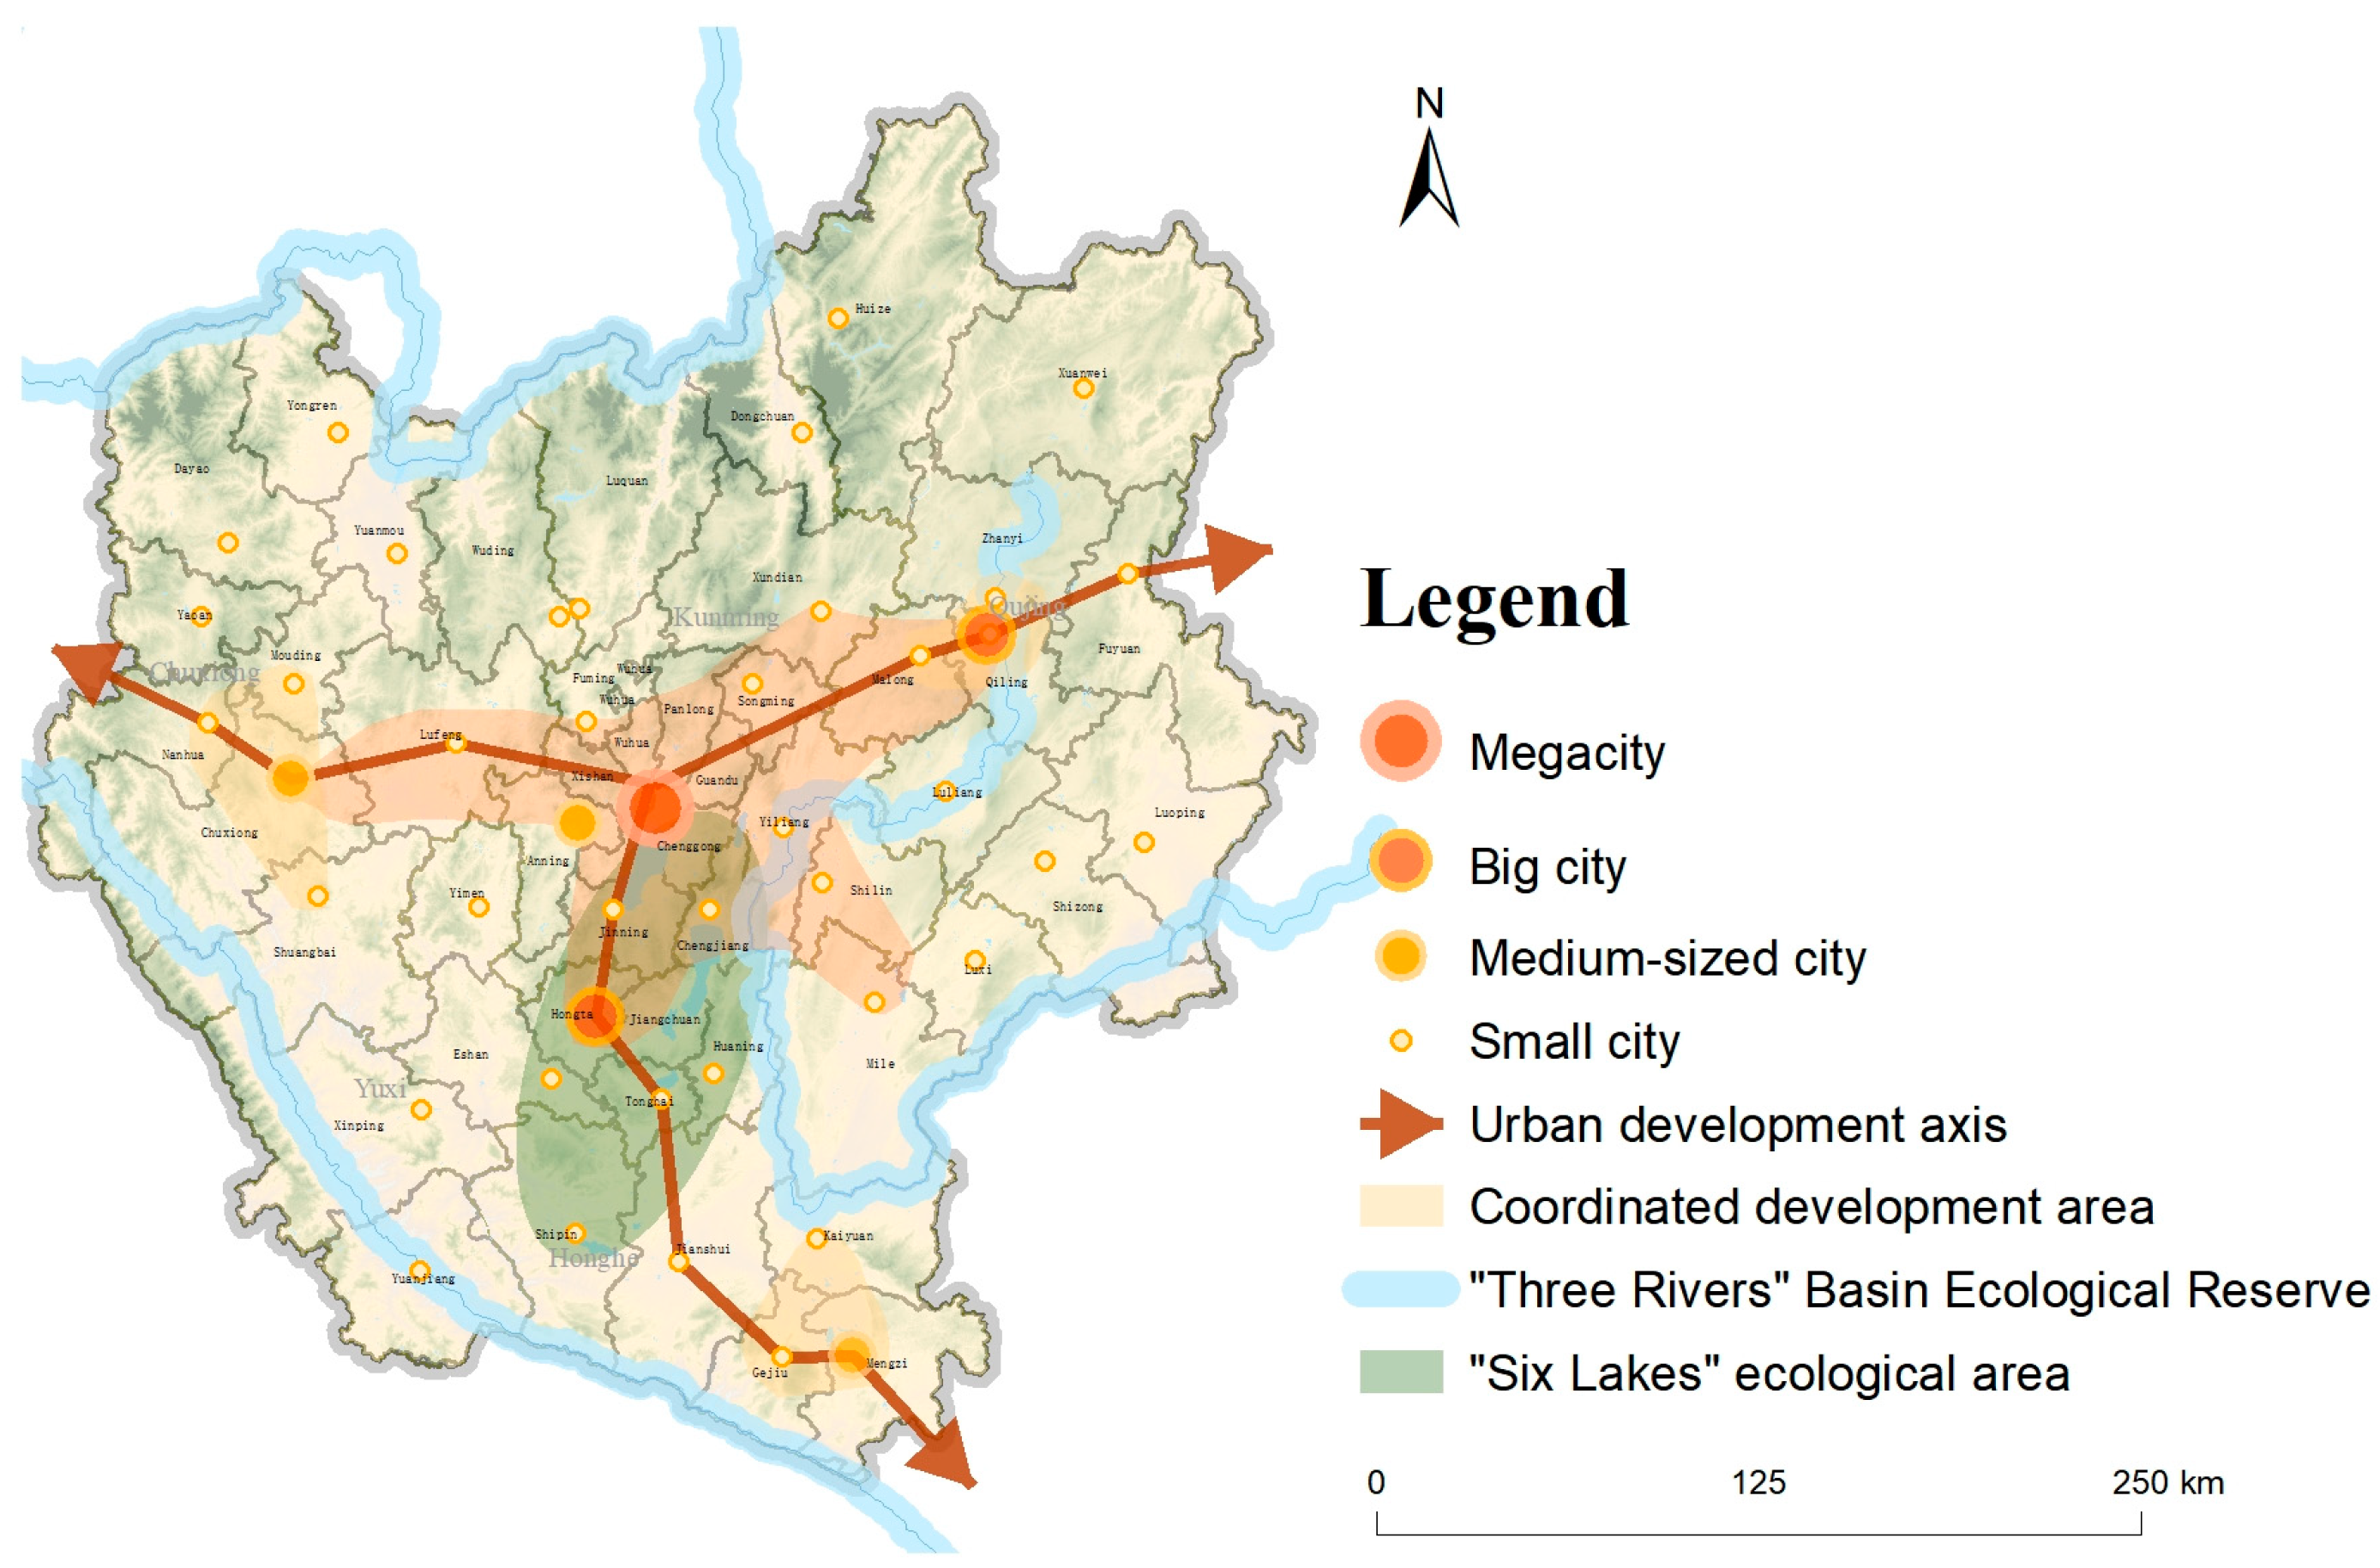
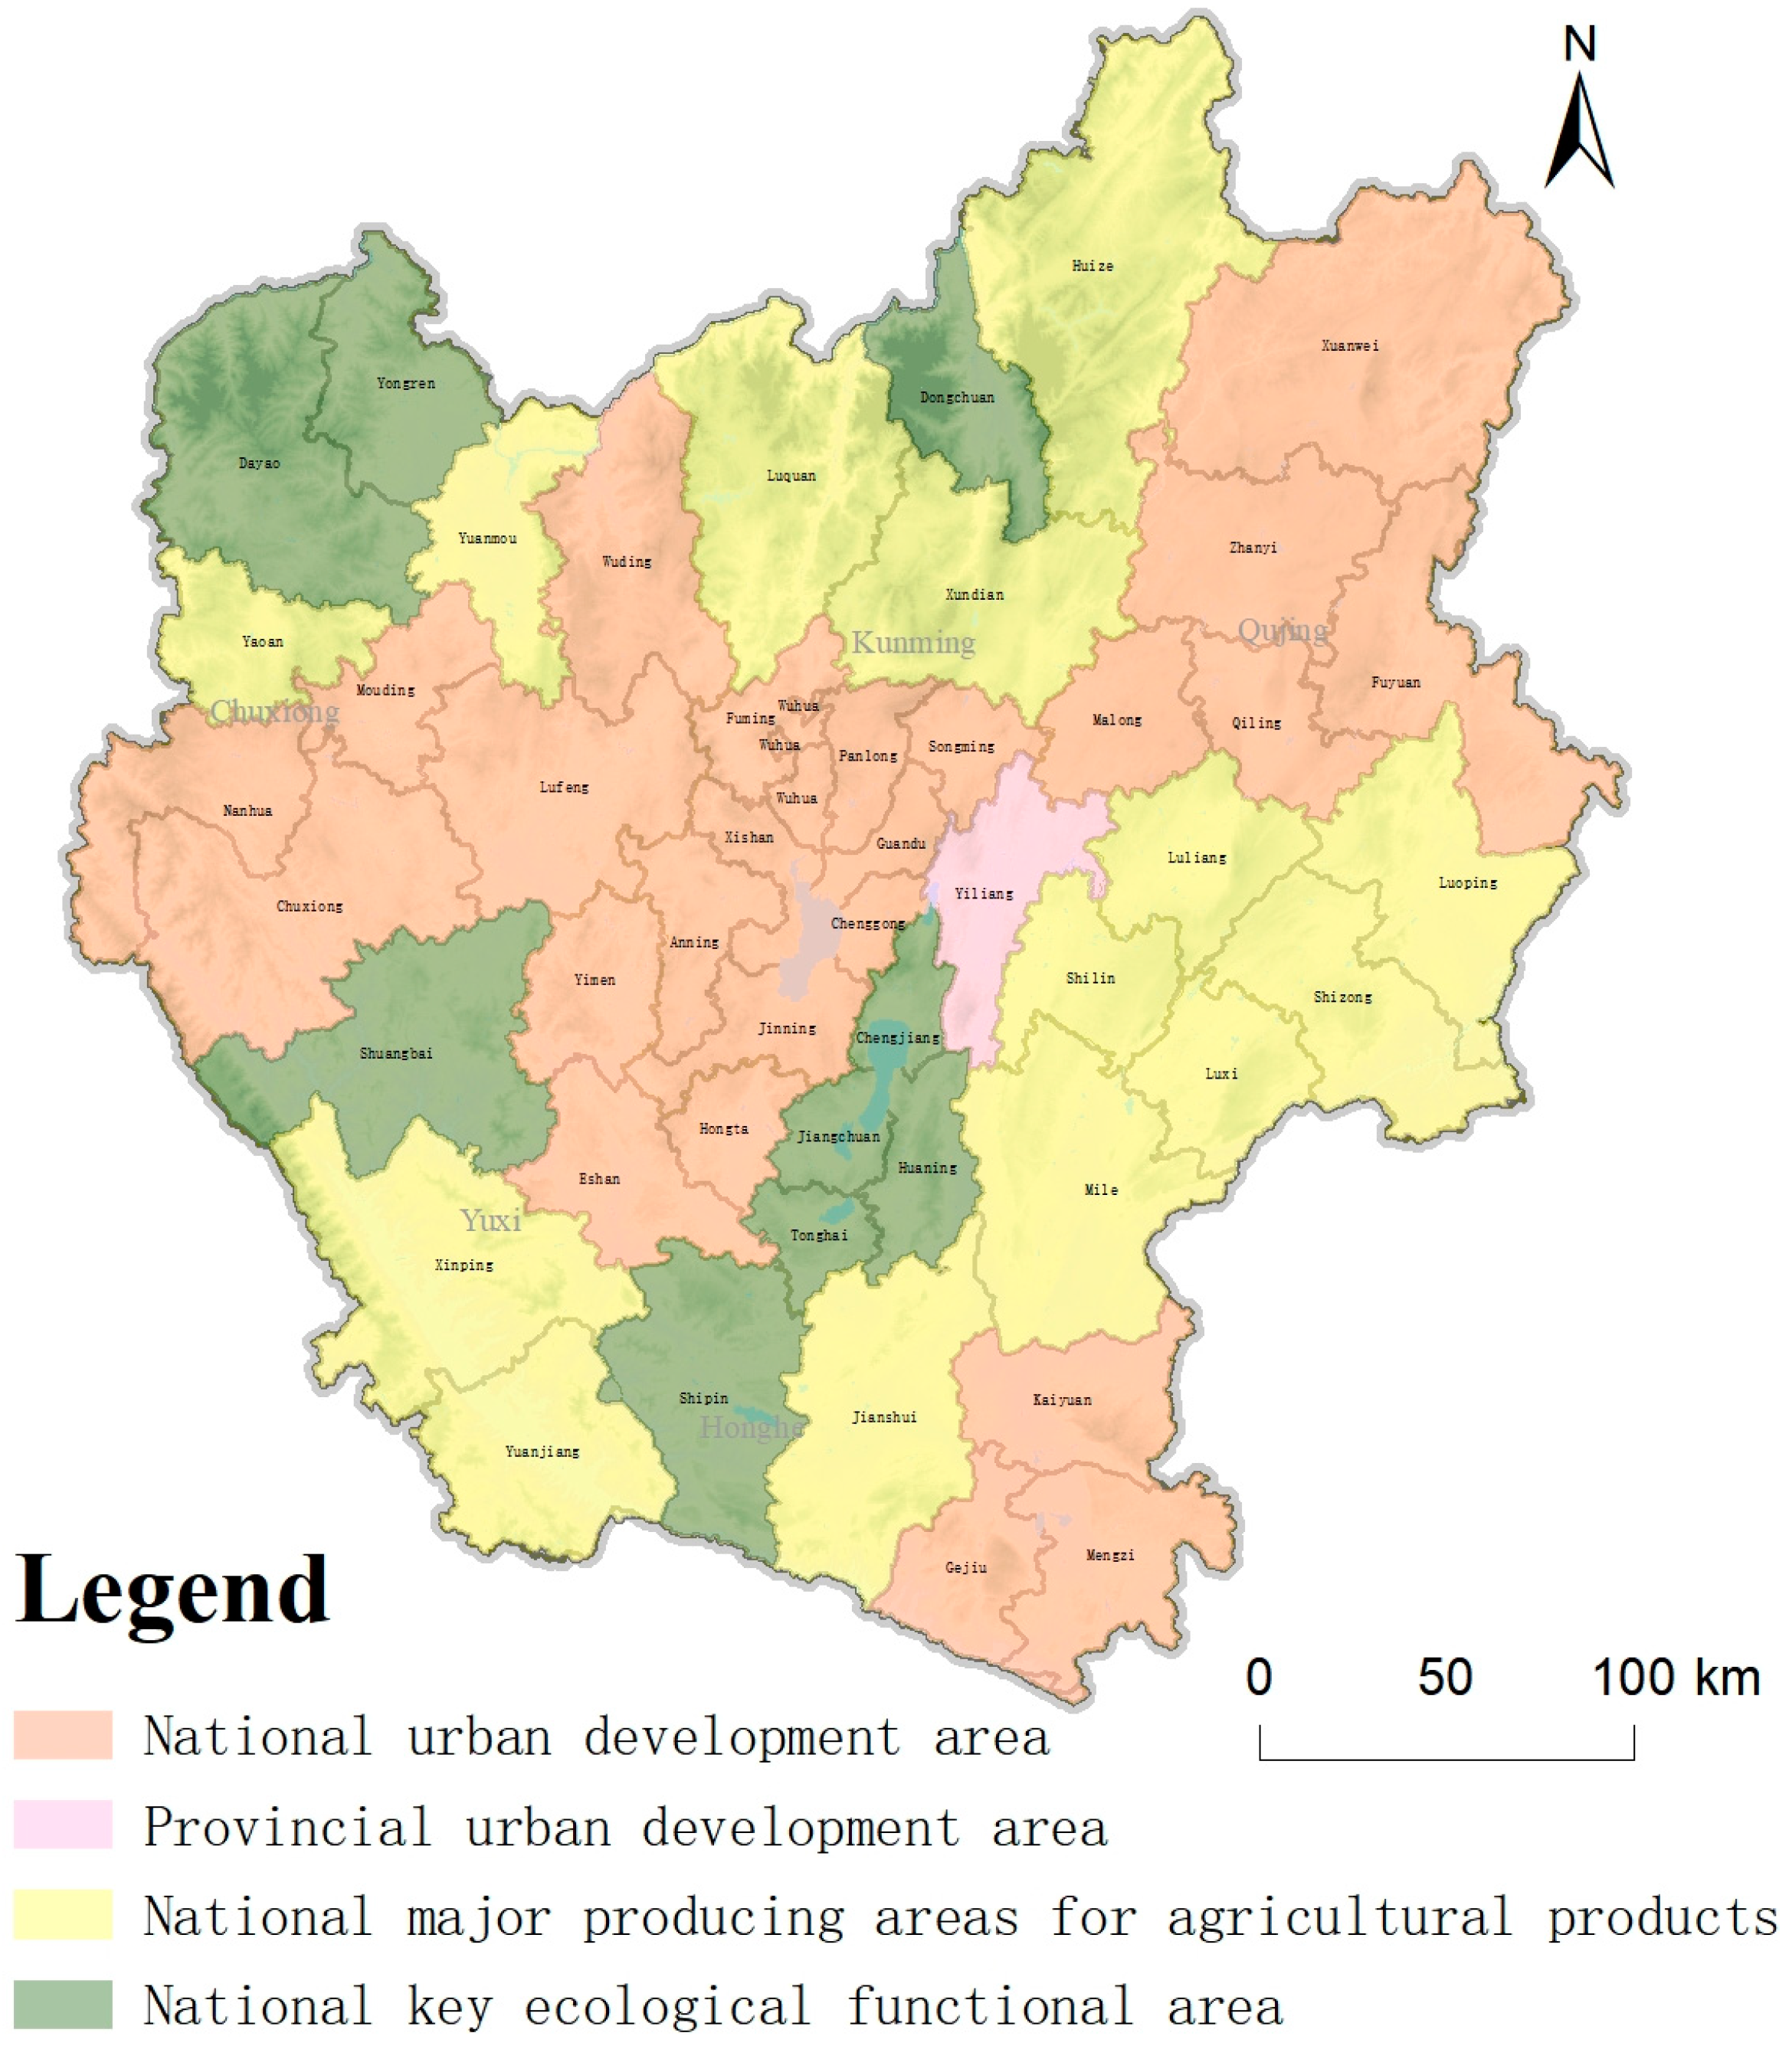
Figure 9 shows the development plan of the CYUA. The CYUA plans to build the Kunming metropolitan area as its center, the integrated development area of Qilin, Zhanyi, and Malone districts as its sub-core, and the Yuxi, Chuxiong, and Honghe Prefectures as three sub-polar areas, including Hongta, the Jiangchuan Group development area, Chuxiong, Nanhua, the Muding Group development area, and the Mengzi Old opening source group development area. This is mainly based on the ecological pattern and relies on the transportation axis to form a two-way “T” shape pattern; that is, a point-axis linkage development pattern with Chuxiong, Kunming, and Qujing as the horizontal axis and Kunming, Yuxi, and Honghe as the vertical axis. Figure 10 shows the current distribution of major functional areas in urban agglomerations.

Figure 9.
Development plan of the CYUA.
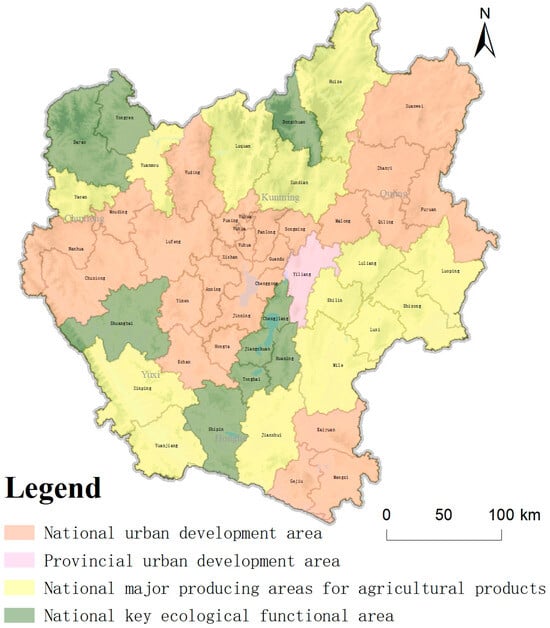
Figure 10.
Distribution of main functional areas in the CYUA.
According to the integration degree of urban agglomerations calculated in this study, from the perspective of production function integration, the overall integration degree of the CYUA is on the rise, and the integration degree of counties on the Kunming–Qujing development axis is gradually deepening, while the integration degree of cities and towns on the Kunming–Chuxiong development axis has no obvious change. From the perspective of living function integration, the overall participation of the living integration degree is low, and the urban development pattern is mainly independent development. From the perspective of ecological function integration, the counties participating in ecological integration are mainly concentrated in ecological function areas, as shown in Figure 10. The integration degree of the central region has been improved under the governance of the six lakes area, while the ecological integration degree of the ecological protection area in the eastern Pearl River Basin needs to be strengthened. On the whole, existing planning mainly focuses on the central provincial capital cities and spreads to the surrounding areas. In the process of urban development in China, the gap in social and economic development in prefecture-level cities is more obvious than that in provincial capital cities [35]. How to coordinate and organize among these cities is also the focus of the coordinated development of the entire urban agglomeration.
Based on the current development situation, this article proposes the following recommendations for strengthening urban agglomeration in the future: (1) regarding production, there is an imbalance in development between the east and west. It is essential to enhance connectivity between the central and western regions, bolstering the industrial functions of the western part and reinforcing its radiation ability to the surrounding areas. (2) In terms of living, currently, participation in the integration of life functions in urban agglomerations is not substantial, with most focusing on isolated development. It is crucial to increase investment in the construction of life functions and expand the investment capacity in living functions. (3) Regarding the ecological aspect, the involvement in ecological integration primarily centers around western cities, with insufficient participation from eastern cities. There is a need to enhance ecological zone governance in eastern cities and strengthen ecological integration efforts in the eastern region.
4.3. The Advantage of Refined Analysis of Integration Development from Production–Living–Ecology Angle
In the course of urban agglomeration development, the interaction among cities is inevitable. The focal point in urban research is how to achieve mutually beneficial outcomes in urban development through these interactions. Conventional research on urban agglomeration development typically employs a comprehensive indicator to investigate interconnection among cities. For instance, by utilizing socioeconomic statistics, traffic data, and network big data, the Urban Connectivity Index (UCI) was developed to gauge the strength of urban connections and assess the correlation between the closeness of urban connections and urban development [36]. Although this method employs comprehensive indicators to depict the intensity among cities, further exploration of the urban symbiosis mechanism requires refinement due to variations in functional positioning among towns. For example, employing spatial big data to examine city connections from a network perspective [37] or investigating the impact of urban agglomeration integration on green development from a market integration viewpoint provides more nuanced insights into urban closeness [21]. These studies delve into specific aspects based on the foundation of urban integrated development. This article sought to go a step further by subdividing the diverse functional positioning of cities beyond a general depiction of city connections. When discussing the integration process of urban agglomerations, we assessed it from three perspectives: production, living, and ecology. China has adopted the practices of production, living, and ecological functions as key measures to attain sustainable urban development. On the one hand, this provides a suitable overview of different functions and illustrates the interaction among towns with different functions. On the other hand, it avoids excessive detail, ensuring an overarching understanding.
Second, this article utilized the radiation model to gauge the interaction between towns. According to spatial interaction theory, key conditions for town interaction encompass complementarity, accessibility, and intermediary interference effects. In comparison with other spatial interaction models, the radiation model is better equipped to consider the impact of intermediary interference effects, leading to a more accurate measurement of spatial interactions between towns.
Third, we also considered the impact of urban functions and interactions. We identified the two-way interaction status between counties under the benign symbiosis model to prevent the overestimation of urban, comprehensive development caused by ineffective interactions. This approach ensured a more accurate measure of the degree of integration within urban agglomeration.
5. Conclusions
5.1. Conclusions
This study focused on the integrative development of urban agglomeration, assessing urban functions and urban interaction across three dimensions: production, living, and ecology. Each county’s functional scale was quantified using an index system, while county relationships were examined utilizing both the improved radiation model and functional distance model. Building upon the calculations mentioned above, we drew from symbiosis theory, delving into the study of organizational and behavioral models from 2000 to 2020. Through these analyses, we evaluated the integration status of urban agglomeration. The results show that (1) the overall integration of production functions of the CYUA is in the primary stage. Examining the developmental trajectory over the past two decades, the production integration value of cities within the agglomeration demonstrated an ascending trend. The number of counties participating in the construction of production integration increased, and spatial contiguous development gradually formed. In spatial distribution, the counties actively involved in the integrated development of production within the urban agglomeration shifted from fragmented states to cohesive and coordinated development patterns emanating outward from the center. (2) The overall integration of living functions of the CYUA is in the primary stage. The degree of integration of life functions was the lowest among the three functions. Meanwhile, the overall integration trend showed an upward trend. Fewer counties are participating in the integration of living, mainly in the central and northern regions, and their distribution is sporadic, without forming a stable development model. (3) The overall integration of ecological functions of the CYUA is in the primary stage. Counties participating in ecological integration are mainly concentrated in the west and north of the CYUA. During the development process of the urban agglomeration, the distribution of ecological integration gradually changed from the original contiguous form to fragmentation. This shows that urban development has a certain inhibitory effect on the integration of ecological functions.
This study exclusively examined the developmental model of urban agglomeration integration, focusing on three dimensions: production, living, and ecology. The objective was to investigate the urban agglomeration development model within the framework of these three functions. However, there is still a need to delve into how these three functions interact during the integration process. Additionally, further research is required to explore external influences on urban agglomerations and other pertinent aspects.
5.2. Limitations and Prospects
This article employed symbiosis theory to examine the integration of urban agglomerations, focusing on three dimensions: production, living, and ecology. This has contributed to the advancement of urban agglomeration development. Nevertheless, certain limitations are acknowledged. Firstly, the exploration of symbiosis within the urban agglomeration employs the county as a unit but neglects the urban–rural relationship, necessitating further exploration in subsequent research. Secondly, the article concentrated on the symbiosis model within the urban agglomeration, recognizing that the region is not a closed system but an open one. As the urban agglomeration interacts internally, it also engages with surrounding cities, requiring additional investigation into the nature of this interaction. Thirdly, the paper utilized the radiation model to simulate the internal interaction of urban agglomeration. In subsequent research, the model can be refined, and its effectiveness enhanced with the support of geographical big data and other relevant information. Fourthly, the interaction between the production, living, and ecological functions of the urban agglomeration was discussed separately; however, understanding how these functions influence each other warrants further exploration. Finally, the CYUA discussed in this article represents an urban agglomeration in its early developmental stages. Future research will continue to explore urban agglomerations at various stages of development.
Author Contributions
Conceptualization, S.L. and C.L.; methodology, S.L. and C.L.; validation, S.L. and C.L.; formal analysis, S.L.; investigation, S.L.; resources, S.L., C.L., Y.L. and L.C.; data curation, S.L.; writing—original draft preparation, S.L.; writing—review and editing, S.L. and C.L.; visualization, S.L. and C.L.; supervision, C.L., Y.L. and L.C.; project administration, C.L.; funding acquisition, C.L. All authors have read and agreed to the published version of the manuscript.
Funding
This research was financially supported by the National Natural Science Foundation of China (No. 42201290) and the Applied Basic Research Programs of Science and Technology Department of Yunnan Province (No. 202001BB050027, No. 202301AT070335).
Data Availability Statement
The data presented in this study are available upon request.
Conflicts of Interest
The authors declare no conflict of interest.
References
- Liu, Y.; Gao, H.; Cai, J.; Lu, Y.; Fan, Z. Urbanization Path, Housing Price and Land Finance: International Experience and China’s Facts. Land Use Policy 2022, 113, 105866. [Google Scholar] [CrossRef]
- Fang, C.; Yu, D. Urban Agglomeration: An Evolving Concept of an Emerging Phenomenon. Landsc. Urban Plan. 2017, 162, 126–136. [Google Scholar] [CrossRef]
- Du, X.; Zhou, J.; Xiao, C. Spatial Effects and Influencing Factors of Urban Sustainable Development: An Analysis of Urban Agglomerations in China. Econ. Anal. Policy 2024, 81, 556–575. [Google Scholar] [CrossRef]
- Florida, R.; Gulden, T.; Mellander, C. The Rise of the Mega-Region. Camb. J. Reg. Econ. Soc. 2008, 1, 459–476. [Google Scholar] [CrossRef]
- Liu, Y.; Zhang, X.; Pan, X.; Ma, X.; Tang, M. The Spatial Integration and Coordinated Industrial Development of Urban Agglomerations in the Yangtze River Economic Belt, China. Cities 2020, 104, 102801. [Google Scholar] [CrossRef]
- Fu, C.; Xu, Y.; Zhou, F. Environmental Collaborative Governance of Urban Agglomeration in China: Influencing Factors and Drivers. Environ. Sci. Pollut. Res. 2022, 30, 38363–38379. [Google Scholar] [CrossRef]
- Shen, W.; Liang, H.; Dong, L.; Ren, J.; Wang, G. Synergistic CO2 Reduction Effects in Chinese Urban Agglomerations: Perspectives from Social Network Analysis. Sci. Total Environ. 2021, 798, 149352. [Google Scholar] [CrossRef]
- Ye, C.; Zhu, J.; Li, S.; Yang, S.; Chen, M. Assessment and Analysis of Regional Economic Collaborative Development within an Urban Agglomeration: Yangtze River Delta as a Case Study. Habitat Int. 2019, 83, 20–29. [Google Scholar] [CrossRef]
- Gao, X.; Zhang, A.; Sun, Z. How Regional Economic Integration Influence on Urban Land Use Efficiency? A Case Study of Wuhan Metropolitan Area, China. Land Use Policy 2020, 90, 104329. [Google Scholar] [CrossRef]
- Huang, T.; Xi, J.-C.; Ge, Q.-S. Spatial Differentiation and Integration Optimization of an Urban Agglomeration Tourism System under the Influence of High-Speed Railway Network Evolution. Appl. Spat. Anal. Policy 2019, 12, 349–376. [Google Scholar] [CrossRef]
- Yang, Y.; Lu, X.; Chen, J.; Li, N. Factor Mobility, Transportation Network and Green Economic Growth of the Urban Agglomeration. Sci. Rep. 2022, 12, 20094. [Google Scholar] [CrossRef] [PubMed]
- Li, Y.; Xiong, C.; Song, Y. How Do Population Flows Promote Urban–Rural Integration? Addressing Migrants’ Farmland Arrangement and Social Integration in China’s Urban Agglomeration Regions. Land 2022, 11, 86. [Google Scholar] [CrossRef]
- Li, H.; Liu, Y.; He, Q.; Peng, X.; Yin, C. Simulating Urban Cooperative Expansion in a Single-Core Metropolitan Region Based on Improved CA Model Integrated Information Flow: Case Study of Wuhan Urban Agglomeration in China. J. Urban Plan. Dev. 2018, 144, 05018002. [Google Scholar] [CrossRef]
- Lin, Q.; Xiang, M.; Zhang, L.; Yao, J.; Wei, C.; Ye, S.; Shao, H. Research on Urban Spatial Connection and Network Structure of Urban Agglomeration in Yangtze River Delta—Based on the Perspective of Information Flow. Int. J. Environ. Res. Public. Health 2021, 18, 10288. [Google Scholar] [CrossRef]
- Ma, W.; Yu, Y.; Meng, W.; Fan, J. Comparative Analysis of City Connection Network Based on Gravity Model and Baidu Index in Wuhan Urban Agglomeration. IOP Conf. Ser. Earth Environ. Sci. 2020, 446, 022050. [Google Scholar] [CrossRef]
- Zhao, Y.; Zhang, G.; Zhao, H. Spatial Network Structures of Urban Agglomeration Based on the Improved Gravity Model: A Case Study in China’s Two Urban Agglomerations. Complexity 2021, 2021, 6651444. [Google Scholar] [CrossRef]
- He, J.; Li, C.; Yu, Y.; Liu, Y.; Huang, J. Measuring Urban Spatial Interaction in Wuhan Urban Agglomeration, Central China: A Spatially Explicit Approach. Sustain. Cities Soc. 2017, 32, 569–583. [Google Scholar] [CrossRef]
- Li, C.; He, J.; Duan, X. Modeling the Collaborative Evolution of Urban Land Considering Urban Interactions under Intermediate Intervention, in the Urban Agglomeration in the Middle Reaches of the Yangtze River in China. Land 2020, 9, 184. [Google Scholar] [CrossRef]
- van Oort, F.; Burger, M.; Raspe, O. On the Economic Foundation of the Urban Network Paradigm: Spatial Integration, Functional Integration and Economic Complementarities within the Dutch Randstad. Urban Stud. 2010, 47, 725–748. [Google Scholar] [CrossRef]
- You, S.; Chen, X. Regional Integration Degree and Its Effect on a City’s Green Growth in the Yangtze River Delta: Research Based on a Single-City Regional Integration Index. Clean Technol. Environ. Policy 2021, 23, 1837–1849. [Google Scholar] [CrossRef]
- Liao, B.; Li, L. How Can Urban Agglomeration Market Integration Promote Urban Green Development: Evidence from China’s Yangtze River Economic Belt. Environ. Sci. Pollut. Res. 2022, 29, 10649–10664. [Google Scholar] [CrossRef]
- Guo, X.; Chuanglin, F.; Xufang, M.; Dan, C. Coupling and Coordination Analysis of Urbanization and Ecosystem Service Value in Beijing-Tianjin-Hebei Urban Agglomeration. Ecol. Indic. 2022, 137, 108782. [Google Scholar] [CrossRef]
- Shen; Chen Zhong; Hou Lulu Temporal-Spatial Evolution and Dynamic Mechanism of the Culture-Oriented Urban Agglomerations:A Focus on the Eastern Guangdong. Trop. Geogr. 2022, 42, 1628–1639.
- Douglas, A.E. Symbiotic Interactions; Oxford University Press: Oxford, UK, 1994; ISBN 0-19-854286-0. [Google Scholar]
- Chen, K.; Long, H.; Liao, L.; Tu, S.; Li, T. Land Use Transitions and Urban-Rural Integrated Development: Theoretical Framework and China’s Evidence. Land Use Policy 2020, 92, 104465. [Google Scholar] [CrossRef]
- Zhang, H.Z.; Wu, Y.D.; Wang, Y.C. Research of the Match State between the Economic Contact and Geo-Economics Relationship in Yunnan Central Urban Agglomeration. Areal Res Dev 2014, 33, 16–19. [Google Scholar]
- Wang, D.; Jiang, D.; Fu, J.; Lin, G.; Zhang, J. Comprehensive Assessment of Production–Living–Ecological Space Based on the Coupling Coordination Degree Model. Sustainability 2020, 12, 2009. [Google Scholar] [CrossRef]
- Yang, Y.; Bao, W.; Liu, Y. Coupling Coordination Analysis of Rural Production-Living-Ecological Space in the Beijing-Tianjin-Hebei Region. Ecol. Indic. 2020, 117, 106512. [Google Scholar] [CrossRef]
- Diakoulaki, D.; Mavrotas, G.; Papayannakis, L. Determining Objective Weights in Multiple Criteria Problems: The Critic Method. Comput. Oper. Res. 1995, 22, 763–770. [Google Scholar] [CrossRef]
- Yan, X.-Y.; Wang, W.-X.; Gao, Z.-Y.; Lai, Y.-C. Universal Model of Individual and Population Mobility on Diverse Spatial Scales. Nat. Commun. 2017, 8, 1639. [Google Scholar] [CrossRef] [PubMed]
- Zhang, H.; Wu, Y. Research on Urban Symbiosis and Co evolutionA Case Study of Central Yunnan Urban Agglomeration. Resour. Dev. Mark. 2016, 32, 1078–1082. [Google Scholar]
- Fang, C. Theoretical foundation and patterns of coordinated development ofthe Beijing Tianjin Hebei Urban Agglomeration. Prog. Geogr. 2017, 36, 15–24. [Google Scholar]
- Zhuang, Q.; Shao, Z.; Li, D.; Huang, X.; Li, Y.; Altan, O.; Wu, S. Impact of Global Urban Expansion on the Terrestrial Vegetation Carbon Sequestration Capacity. Sci. Total Environ. 2023, 879, 163074. [Google Scholar] [CrossRef] [PubMed]
- Li, F.; Wu, S.; Liu, H.; Yan, D. Biodiversity Loss through Cropland Displacement for Urban Expansion in China. Sci. Total Environ. 2024, 907, 167988. [Google Scholar] [CrossRef] [PubMed]
- Ning, Y.; Liu, S.; Smith, A.R.; Qiu, Y.; Gao, H.; Lu, Y.; Yuan, W.; Feng, S. Dynamic Multi-Dimensional Scaling of 30+ Year Evolution of Chinese Urban Systems: Patterns and Performance. Sci. Total Environ. 2023, 863, 160705. [Google Scholar] [CrossRef]
- Yin, J.; Liu, H.; Shi, P.; Zhang, W. Exploring Coupling Relationship between Urban Connection and High-Quality Development Using the Case of Lanzhou-Xining Urban Agglomeration. Complexity 2021, 2021, e9933582. [Google Scholar] [CrossRef]
- Fang, C.; Yu, X.; Zhang, X.; Fang, J.; Liu, H. Big Data Analysis on the Spatial Networks of Urban Agglomeration. Cities 2020, 102, 102735. [Google Scholar] [CrossRef]

Disclaimer/Publisher’s Note: The statements, opinions and data contained in all publications are solely those of the individual author(s) and contributor(s) and not of MDPI and/or the editor(s). MDPI and/or the editor(s) disclaim responsibility for any injury to people or property resulting from any ideas, methods, instructions or products referred to in the content. |
© 2024 by the authors. Licensee MDPI, Basel, Switzerland. This article is an open access article distributed under the terms and conditions of the Creative Commons Attribution (CC BY) license (https://creativecommons.org/licenses/by/4.0/).