Abstract
The rapid increase in the global population is contributing to the urgent challenges we face in ensuring the sustainability of our planet. This demographic shift, which gained momentum in the 1990s, is closely linked to a surge in natural disasters, both in terms of their frequency and severity. The quest for resources and improved quality of life, including the need for housing and essential services, has compounded these challenges. With the world’s population projected to double by 2050, and approximately two-thirds of this population expected to reside in urban areas, we are facing a complex web of interconnected issues that will significantly magnify the impacts of climate change-induced disasters. It is imperative that we build resilient cities capable of withstanding and adapting to these changes. However, the growing complexity of urban services and the necessity for integrated management raise questions about the preparedness of these resilient cities to comprehend and address the multifaceted challenges posed by climate change. In response to these critical concerns, this study endeavors to address the intersection of resilience and climate change. We propose the development of a Smart Resilient City Assessment Framework, comprising two core components: resilience re-evaluation and smartness evaluation. Each component consists of eight essential steps. The culmination of these steps results in a semi-quantitative index that accurately reflects the city’s position regarding resilience and smartness in the face of climate change-related disasters. To demonstrate the framework’s practicality and suitability, we present results from a hypothetical scenario focusing on water supply management, a critical aspect of climate change adaptation. The framework equips city managers with the necessary tools to re-evaluate their cities’ resilience, evaluate their capacity to address climate change-induced challenges, and make informed decisions on integrating resilience and smart solutions to pave the way for a more sustainable and climate-resilient future.
1. Introduction
Cities represent intricate systems interweaving numerous economic, social, institutional, and environmental facets, profoundly affecting individual and community well-being [1]. The urban population has reached unprecedented levels, with the United Nations (UN) projecting that by 2050, cities will house two-thirds of the global population. As urban areas and populations expand, so does the susceptibility to various shocks and stresses. Large cities, in particular, face heightened vulnerability to disruptions due to the complexity of their systems, resulting in significant economic, social, environmental, and institutional ramifications [1]. These stresses encompass a range of factors, including industry structural changes, economic downturns, population movements, natural disasters, energy supply interruptions, and shifts in leadership.
To mitigate the risks and consequences of disasters and enhance citizen safety and well-being, cities must bolster their resilience and preparedness to confront shocks and stresses [2]. The term ‘resilience’ has gained prominence in academic and policymaking spheres, albeit with varied conceptualizations across different fields and stakeholder groups [3]. While resilience theories have roots dating back to the 1960s and early 1970s, their integration into urban planning and design is relatively recent, gaining momentum since 2002 [4,5]. Rising concerns regarding urban transformations, natural calamities, and future uncertainties such as economic fluctuations and climate change have propelled the ascendancy of urban resilience [6]. Fundamentally, resilience, often likened to ‘bouncing back’, denotes a city’s capacity to rebound and restore normalcy post disasters. It encompasses the ability to absorb, adapt, and transform in response to external pressures, ensuring urban security amidst hazards, disasters, or crises [7]. This adaptable definition of resilience facilitates stakeholder collaboration around a common language despite variations in specific interpretations.
Conversely, the operationalization of resilience hinges on its quantification [8]. Schipper, Langston [9] offer a comprehensive overview of various endeavors aimed at assessing and quantifying urban resilience, including initiatives such as the Rockefeller Foundation’s Asian Cities Climate Change Resilience (ACCCRN), Action Research for Community Based Adaptation (ARCAB), UNDP Community-Based Resilience Analysis (CoBRA) Framework, UN/ISDR Disaster Resilience Scorecard for Cities, and Technical Assistance to NGO’s (TANGO) Livelihood Framework. Furthermore, ongoing advancements in research have led to the development of resilience measurement tools tailored to specific contexts, such as those for Tanzania’s water supply systems [10], identifying technical factors influencing water supply system resilience [11], and enhancing resilience through community engagement and the understanding of risks, compensation systems, and community development and cohesion [12,13]. Despite the increasing prevalence of the term “resilient urban design” in urban planning discourse, there remains a paucity of a unified and coherent definition of “resilient places”. This ambiguity poses challenges in operationalizing resilience and devising standardized metrics or measurements [14]. D’Lima and Medda [15] advocate for resilience assessment as an effective strategy for developing measures to enhance system resilience. While resilience measurement methods have been established for various systems, including ecological, engineering, organizational, community, and social systems, no universal tool is applicable across all systems.
Recent disasters have underscored the inadequacy of existing resilient structures in ensuring sufficient protection for people and properties [16,17]. In response to this evolving landscape, there is a pressing need for a substantial re-evaluation of current strategies and a paradigm shift away from traditional approaches to effectively manage future disasters. Concurrently, the concept of smart cities has gained momentum since the late 2000s, with cities worldwide increasingly leveraging Information and Communication Technologies (ICTs) to enhance the efficiency and effectiveness of service delivery, governance, and urban solutions [18]. However, the term “smart city” lacks a universally agreed-upon definition and is utilized across various fields, potentially causing confusion among city policymakers seeking to implement smart initiatives [19]. The emergence of the concept of a smart resilient city represents a novel strategy for addressing urban resilience challenges arising from population growth and human activities. Despite its widespread adoption in urban discourse, a clear and shared understanding of this concept remains elusive [19,20]. Moreover, a substantial gap exists in translating the theoretical concepts of smart resilient cities into practical applications [2,21].
The majority of current resilience frameworks primarily focus on the concept of resilience, with limited attention given to measuring the smartness of a resilient city, a domain that is still in its nascent stages of development. Moreover, as cities continue to experience rapid expansion, the criteria and requirements for achieving resilient status are evolving, necessitating the continual updating of frameworks and evaluation tools. Consequently, a city’s resilience may diminish over time, highlighting the importance of periodic reassessment to ensure its ongoing resilience in the face of dynamic urban challenges.
The current research endeavors to develop a comprehensive framework known as smart resilient cities. This framework is structured into two distinct sections: the initial phase involves reassessing the resilience of the existing resilient city to ensure its continued resilience, while the subsequent part focuses on evaluating the smartness of the resilient city. The aim is to standardize the measurement method while making minor adjustments to accommodate various temporal and spatial conditions. This platform enables resilient cities to assess their capacity to withstand disasters in a more intelligent manner. After providing an overview of smart resilient cities in the introductory section, the background, research methodology, and procedures for designing this innovative framework are delineated. Furthermore, a hypothetical case study is presented to illustrate the framework’s efficacy.
2. Theoretical Background
The subsequent three subsections provide an introduction to urban resilience and smart cities, delving into the definitions of resilience and smartness, the evolution of their frameworks, ongoing projects, and potential connections between these concepts. Given the expansive nature of the topic of urban resilience and smart cities, this section furnishes relevant details on the methodology, proposed framework, and case study pertinent to the current research.
2.1. Urban Resilience
Resilience is a multidimensional concept utilized across various disciplines, including ecology, social sciences, engineering, and economics, to elucidate how systems can better withstand, respond to, recover from, and adapt to the impacts of disasters. The seminal work of ecologist C.S. Holling on the resilience of ecological systems, notably his paper in 1973, serves as a cornerstone of contemporary resilience theory. Holling [22] defines resilience as the ability of an ecosystem to maintain its essential functional characteristics despite disruptions. While some researchers offer broad definitions, others provide context-specific illustrations that emphasize dimensions such as social, economic, and organizational factors [23,24,25].
Despite the widespread interest in the concept of resilient communities, few studies have formalized and applied resilience concepts at the city level. Urban resilience, like resilience in general, is a contested notion that has yet to be defined. According to Godschalk [26], a resilient city encompasses a network of physical systems and human communities capable of withstanding natural disasters. This network includes buildings, infrastructures, waterways, soils, topography, roads, and other biological systems that can endure and function under extreme stress. Meerow, Newell [14] introduce a contemporary concept of urban resilience adaptable to diverse disciplines and stakeholders, defining it as follows: “Urban resilience refers to the ability of an urban system and all its constituent socio-ecological and socio-technical networks across temporal and spatial scales to maintain or rapidly return to desired functions in the face of a disturbance, to adapt to change, and to quickly transform systems that limit current or future adaptive capacity”. According to Mehmood [27], urban resilience embodies a visionary approach to planning, policymaking, and strategic direction, wherein communities play a pivotal role in modeling resilient places through active learning, robustness, creativity, and flexibility. Spaans and Waterhout [28] describe urban resilience as the capacity of individuals, communities, institutions, businesses, and systems within a city to endure, adapt, and thrive amidst chronic stress and acute shocks [29]. Ribeiro and Pena Jardim Gonçalves [29] summarized urban resilience as four fundamental pillars, namely, resistance, recovery, adaptation, and transformation, and five natural, economic, social, physical, and institutional dimensions based on a study of 83 scientific journals. In all cases, the resilience concept is defined based on some or all of the four disaster management stages—mitigation, preparedness, response, and recovery [4]. Baghersad, Wilkinson [30] proposed a comprehensive bank of indicators to measure urban water resilience, aiding decision-making for water management and urban planning. The indicator bank, organized into three layers and based on 12 different indicator codes, offers a structured framework for selecting relevant indicators tailored to urban water systems. Amirzadeh, Sobhaninia [31] explored urban resilience to pandemics amidst the global impact of COVID-19, identifying key dimensions and principles through a systematic review. It proposes a conceptual framework spanning housing, neighborhoods, cities, and regional/national scales, emphasizing pandemic-related health requirements, environmental psychological principles, and general resilience. In the context of indicators and frameworks, particularly when considering multiple layers of indicators, the term “principles” may refer to overarching concepts or fundamental ideas that guide the framework’s selection, organization, and interpretation. These principles often serve as higher level constructs that underpin the design and implementation of the framework, providing a conceptual framework for understanding and evaluating the data generated by the indicators. The framework aids scholars and policymakers in understanding and implementing resilient strategies across various urban scales. Jiang and Jiang [32] examined how regional integration policies (RIPs) in China impact urban resilience, finding a significant 8.6% improvement overall, particularly in economic aspects, driven by agglomeration and urban innovation, yet with varied effects across dimensions and city types.
2.2. Smart City
The term “Smart Cities” encompasses various definitions and interpretations, including four technological city brands: “Digital City”, “Intelligent City”, “Ubiquitous City”, and “Information City” [33]. Arroub, Zahi [34] outlined the characteristics of these city brands. A Digital City refers to the quality of information systems integrating telecommunications, computing, and innovative infrastructure to meet governmental, private, and public needs, which are crucial for the success of digital cities [35]. An Intelligent City can be characterized as a city striving for superior performance through 3D innovation using Information and Communication Technologies (ICTs). The networks driving the Ubiquitous City consist of advanced fixed and mobile infrastructures. The term “Information City” denotes a city that gathers data using sensors and delivers them to residents through online services [33,36,37,38].
The concept of “smart” cities emerged during the 1990s with the integration of ICT into urban infrastructure. The first Smart Communities model was developed by the California Institute, aiming to create intelligent communities through the implementation of advanced ICT systems [39,40]. In 2010, the European Union (EU) adopted the term “smart”, sparking academic discussions on sustainable development, particularly regarding environmental protection [41,42]. However, the term “smart city” lacks a precise definition and is used in various contexts. According to Ismagilova, Hughes [43], smart cities leverage information systems (IS) and intelligent ICT to manage interconnected infrastructure, offering innovative services to urban communities and promoting sustainability of natural resources.
Similarly, there is a lack of specific underlying semantic indicators and standardized critical aspects concerning the topic of smart cities [18,44,45]. Giffinger and Pichler-Milanović [46] devised a framework for assessing smart city development, focusing on six key intelligence factors: smart economy, governance, living, people, the environment, and mobility. This framework comprises 31 secondary and 73 tertiary indicators across these elements. In contrast, Cohen [47] introduced the smart city wheel, designed to facilitate the transformation of communities, neighborhoods, and businesses into smart, innovative, and environmentally sustainable entities. It encompasses 18 ‘working areas’, 24 ‘indicators’, and 64 additional fundamental parameters, categorizing them into six dimensions: environment, mobility, government, economy, people, and living [48,49]. Several other frameworks and models, such as the Lisbon Ranking for Smart Sustainable Cities (LRSC), Smart Sustainable Cities China (SSCC), Cities in Motion Index (CIMI), CITYkeys, and Code for Smart Communities (CSC), have been developed, expanded, and refined to measure smartness, following the framework proposed by Giffinger and Pichler-Milanović [46]. These frameworks and models play a significant role in understanding and identifying potential parameters and aspects for assessing the smartness of cities.
2.3. Synthesis—Smart Resilient City
Some commonalities between the concepts of resilient and smart cities can be delineated through an analysis of their definitions and evolutionary trajectories, although each concept retains its unique characteristics. As evidenced by a significant body of research literature on these subjects, both resilient cities and smart cities share a primary objective of enhancing quality of life, albeit through distinct approaches [45,50]. Resilient cities, on one hand, are widely conceptualized as endeavors aimed at empowering communities and individuals to confront external pressures—whether physical, social, or economic—while smart cities, on the other hand, are often perceived as endeavors capable of tackling urban challenges related to economic competitiveness, with a growing emphasis on issues of social equity and environmental sustainability [50,51,52].
The role of smart systems and technologies in enhancing urban resilience is notably absent from current conceptualizations. By leveraging smart technologies and systems, cities can bolster their disaster resilience capabilities through enhanced monitoring, evaluation, prediction, and adaptation across various systems. The concept of resilience, when applied to cities and urban regions, transcends traditional risk assessment methodologies, which tend to focus narrowly on specific hazards, and instead encompasses a broader spectrum of potentially disruptive events. Rather than solely aiming to prevent or mitigate losses resulting from individual events, the emphasis is on enhancing overall system performance in the face of multiple hazards [53,54]. Bruneau, Chang [55] delineate resilience through four key properties:
(a) Robustness: The capacity to withstand a certain degree of stress or demand without experiencing degradation or loss of functionality.
(b) Redundancy: The presence of interchangeable components, systems, or other units of analysis.
(c) Resourcefulness: The ability to allocate resources appropriately and establish priorities, effectively mobilizing resources in the aftermath of a significant disaster.
(d) Rapidity: The capability to promptly address priorities and achieve targets within defined timeframes, thereby minimizing losses and averting potential disruptions. DesRoches and Taylor [53] further expand upon the concept of resilience by introducing the notion of “smart properties”, as delineated in Table 1.

Table 1.
Smart properties for resilience [53].
Existing research indicates that the current literature predominantly addresses resilient cities and smartness as distinct topics, with a limited integration of these two concepts. According to Khatibi, Wilkinson [21], a city classified as a smart resilient city possesses the ability to (1) anticipate disruptions; (2) forecast the nature of disruptions; (3) determine the most effective method for absorbing disruptions; (4) implement rapid, cost-effective, and straightforward recovery strategies; and (5) leverage advanced technologies, including intelligent devices, sensors, real-time data, and ICT integration—foundational elements of smart cities—to rebound more effectively. Despite some efforts to analyze urban resilience and smartness comprehensively, the concept of a smart resilient city remains in its nascent stages [57,58,59]. This study aims to introduce a framework capable of thoroughly reassessing a city’s resilience and evaluating its level of smartness, thereby addressing urban challenges in a holistic manner.
3. Methodology
A semi-quantitative approach was employed in this study, integrating both qualitative and quantitative elements to comprehensively analyze the phenomenon under investigation. This methodological framework allowed for the utilization of numerical data alongside qualitative observations and descriptions to effectively address the research inquiries. By combining quantitative measurements with qualitative insights, a holistic understanding of the subject matter was obtained, facilitating a nuanced analysis and interpretation of the findings [60]. This study employed a multi-stage methodology to develop and illustrate the framework for smart resilient cities. Each stage of the process is comprehensively detailed in the methodology subsections.
3.1. Selection of Assessment Approaches
Theoretical concepts of smartness and resilience remain abstract without the means to measure them [58,61]. Unfortunately, there is currently no universal measure available [62], posing potential challenges and limiting the holistic assessment of urban resilience and smartness in the future [29]. Cai, Lam [63] conducted a systematic review of 174 scholarly articles on resilience measurement from 2005 to 2017, revealing that 39.7% employed qualitative methods, an equal percentage utilized quantitative methods, and 12.6% employed both methods. Qualitative resilience measurement methods included survey questionnaires, in-depth interviews, focus group discussions, self-evaluation, and comparative analysis. Common quantitative approaches involved statistical and data mining methods, with correlation and multivariate regression analyses being prevalent. Mixed methods research often entailed using qualitative approaches to generate indicators (e.g., interviews, focus groups, or Delphi studies), followed by quantitative methods to calculate the resilience index (e.g., weighted aggregation, principal component analysis, or multiple regression). As a result, this study adapts the Sweya, Wilkinson [64] tool development technique with minor modifications to utilize the mixed approach for both resilience and smart assessments.
3.2. The Proposed Framework and Its Components
The proposed framework aims to measure the smartness of a resilient city. Given the continuous expansion of cities and the ongoing evolution of technology, a city previously deemed resilient may no longer meet current resilience standards. Therefore, before assessing the smartness of a resilient city, it is essential to re-evaluate its resilience. The framework comprises two phases: Part A involves reassessing the city’s resilience, while Part B focuses on evaluating the smartness of the resilient city. Each section follows a structured approach, including the following steps:
- Developing a conceptual framework;
- Defining systems and selecting assessment levels;
- Proposing variables/indicators;
- Expert evaluation;
- Scaling the variables/indicators;
- Weighting the variables/indicators;
- Aggregating the variables/indicators;
- Enhancing city infrastructure (as illustrated in Figure 1).
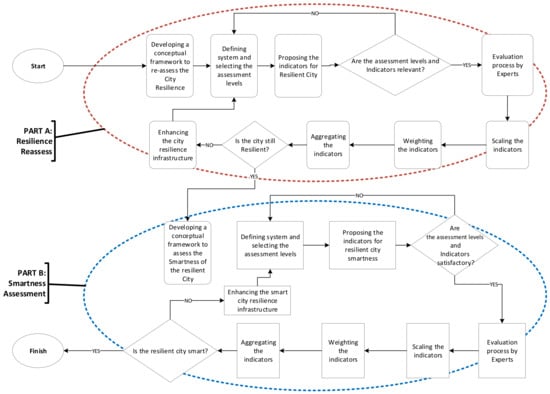 Figure 1. Smart resilient city framework.
- ▪
- Developing a conceptual framework
Most contemporary research on framework development, as noted by Sweya and Wilkinson [4], typically follows one of two approaches: bottom-up or top-down. Bottom-up methodologies aim to involve communities or experts in the development of desired frameworks, yet they encounter challenges due to data unpredictability [65] and often yield non-generalizable results [66]. Conversely, top-down approaches entail an initial literature review to establish general criteria that will inform the new evaluation process. This process delineates the dimensions of resilience and smartness, subsequently defining the variables involved. Experts in the field are then tasked with identifying variables deemed relevant by practitioners and policymakers [67]. The current study applies a combined top-down and bottom-up framework development approach, which involves a literature review to find variables and include experts in refining and establishing important variables.
- ▪
- Defining the system and selecting the assessment levels
Cities represent complex structures encompassing various sectors, and resilience has been conceptualized in a manner adaptable to all facets of urban life. The current framework is flexible and can be implemented across diverse platforms, underscoring the importance of identifying the system or case study at the outset. Bruneau, Chang [55] outlined four levels of city resilience systems that warrant measurement: (1) technological, (2) organizational, (3) social, and (4) economic resilience (TOSE). Similarly, Cimellaro, Renschler [68] proposed a distinctive framework for assessing urban resilience across multiple scales, identifying seven crucial systems: (1) population and demography, (2) ecology and ecosystems, (3) organized government services, (4) physical infrastructure, (5) lifestyle and community competence, (6) economic development, and (7) social-cultural capital, encapsulated by the acronym PEOPLES. Numerous researchers have adapted these frameworks by either adding or removing levels and proposing their own variations. For instance, Vugrin, Warren [69] augmented the TOSE model with environmental and ecological dimensions, while Hughes and Healy [70] delineated technical and organizational dimensions to evaluate the resilience of New Zealand’s transportation infrastructure. Once the system design is complete, the next step involves selecting the assessment levels, which may be adjusted based on the evaluations of researchers and experts. Table 2 illustrates the prevalent assessment levels employed across diverse research endeavors. The framework’s foundational elements are firmly established with the system or case study delineated and the assessment levels defined.
Table 2.
Framework assessment levels and names [71].
- ▪
- Proposing the variables/indicators
The proposed framework utilizes a combination of top-down and bottom-up methodologies, whereby variables are initially drawn from the existing literature and subsequently refined through expert consultation. While there is no prescribed strategy for variable selection, common parameters cited in the literature include validity, sensitivity, objectivity, and simplicity. Validity assesses whether an indicator accurately represents the resilience dimension under consideration, while sensitivity gauges its responsiveness to changes in outcomes. Objectivity examines the indicator’s consistency over time, based on regularly updated and reproducible data. Simplicity refers to the ease with which decision-makers and other stakeholders can comprehend and utilize the indicator effectively. These criteria serve as guiding principles for the selection and refinement of variables within the framework.
- ▪
- Expert evaluation
Expert judgment is commonly employed to ensure the content validity of research methodologies. For instance, Oktari, Comfort [74] engaged 14 experts to validate their data, while Seo and Kang [75] conducted interviews with 21 industry experts from 10 different firms. Sweya, Wilkinson [76] conducted pre-assessment interviews with ten experts spanning public, private, and research organizations, each with a minimum of five years of relevant experience. The selection criteria for suitable experts closely align with the specifics of the case study, including factors such as leadership background, communication skills, networking abilities, supervisory experience, and various position levels within different organizations. The authors recommend inviting 10–15 experts with expertise in urban resilience and smart cities from government, private, and academic sectors. However, it is important to note that involving a large number of experts may extend the data gathering process. The variables will be organized according to the designated assessment levels, and experts will be invited to provide feedback and rate them. They may suggest modifications, additions, or deletions to the indicators. Indicators receiving a consensus agreement of 70% or more among the experts will be incorporated into the study.
- ▪
- Scaling the variables/indicators
The most common approach to analyze smart and resilient concepts involves utilizing variables or indicators, each of which may have different measurement scales. Some indicators may be assessed as percentages, while others may be calculated on a per capita basis. This framework advocates for the use of a Likert scale to enhance ease of use and user-friendliness. The Likert scale methodology commences with a clear definition of the variables, followed by the generation of scale items by a panel of experts. These items are then evaluated by experts on a scale ranging from 1 to 5, with 1 indicating strong disagreement with the concept, 2 denoting slight disagreement, 3 representing uncertainty, 4 indicating some agreement, and 5 signifying strong agreement. If no standardized measurement scale exists for a given variable, the most appropriate assessment scale will be determined in consultation with experts. The researcher may propose alternative scales and seek expert opinions. Discussions with experts may lead to the refinement of the scale for the proposed indicators. In all cases, the researcher must secure expert approval for the chosen scale.
- ▪
- Weighting and aggregating the variables/indicators
Given the challenges associated with assessing numerous indicators [77,78], it becomes essential to streamline and consolidate them to enhance accessibility and comprehension. This is achieved through the utilization of composite indicators, which amalgamate various indicators into a single summarizing index based on an underlying model, facilitating a multidimensional assessment. Such metrics prove invaluable in complex scenarios where direct comparisons would otherwise be arduous. The weighting and aggregation phase of indicators are pivotal in assessment frameworks dealing with extensive information, ensuring that final outcomes are readily interpretable [79,80,81]. According to Saltelli and Saisana [82], weighting techniques can be categorized into three groups: equal weighting, weights derived from statistical models, and participatory-based weights. Equal weighting assigns identical weight to each variable or indicator across all assessment levels, offering simplicity and clear delineation. Weighting based on statistical models involves mathematical manipulation of data and includes methodologies such as principle component analysis (PCA), factor analysis (FA), and regression analysis (RA). The participatory approach to weighting entails experts’ or decision-makers’ judgments to determine weights. Participatory-based methods encompass budget allocation (BA), public opinion (PO), analytic hierarchy process (AHP), and conjoint analysis (CA) [83]. Aggregation procedures play a vital role in integrating weighted components into a single composite index. Commonly, classification schemes for aggregation methods are based on aggregation semantics [84,85], and the extent of permissible compensation [86]. The technological intricacies associated with incorporating weighted indicators are closely tied to this classification scheme [87]. Additive aggregation methods (e.g., arithmetic), multiplicative aggregation methods (e.g., geometric), and non-compensatory aggregation methods, such as multi-criteria analysis, are extensively utilized methods based on this classification scheme. To determine the most effective weighing and aggregation procedures among the widely used methods, we apply the criteria outlined by Gan, Fernandez [88], who proposed a process-oriented approach for identifying the optimal weighting and aggregating technique based on the study’s aim and scope. The output of the proposed framework, which is the result of aggregation, demonstrates the degree of resilience and smartness. Part A of the framework yields the Resilient Index (RI), while Part B yields the Smart Resilient Index (SRI). The results in each part of the framework are presented as a five-point Likert scale index ranging from one to five. This facilitates the identification of areas for improvement and informs decision-making processes. For instance, a score of 2.45 in Part A suggests moderate resilience with suboptimal outcomes, necessitating prompt attention to certain areas. Similarly, a score of 4.66 indicates a high level of resilience and satisfactory performance in terms of outcomes.
4. Results
In this section, the proposed framework is implemented to demonstrate its functionality. As mentioned earlier, the primary objective of the framework is to assess the smartness of a resilient city. Given the rapid growth of cities and the evolving criteria for resilience, cities previously deemed resilient may no longer meet the updated standards. Therefore, the framework is divided into two parts. Part A focuses on reassessing the city’s resilience to confirm its ongoing resilience status, while Part B evaluates the smartness of the resilient city.
4.1. Part A: Reassessment of Resilience
4.1.1. Defining System/Case Study in the Analysis
To execute the proposed framework, a system or case study is necessary. In this paper, a hypothetical case study is employed, a common practice when demonstrating the functionality of frameworks. For instance, a hypothetical flood catastrophe may be utilized to evaluate the resilience of power distribution and metro networks. Similarly, Balaei, Wilkinson [66] introduced a theoretical framework for complete aggregated resilience estimation and demonstrated its application using a hypothetical example. Therefore, a hypothetical scenario is adopted within the proposed smart resilient city framework to illustrate its operational process.
- Hypothetical case study
The proposed framework serves as a versatile tool for assessing the smartness of a resilient city across various sectors and dimensions. Given the multifaceted nature of cities, the framework can be adapted with minor adjustments to suit different contexts. For demonstration purposes, the authors selected the water supply system as a sample case to showcase the framework’s functionality. Water supply systems encounter numerous challenges, including population growth, water value miscalculations, operational issues, and the need to address climate change impacts. Although there is abundant environmental data available at different governmental levels, there remains a lack of systematic strategies for evaluating resource efficiency and environmental performance in water utilities. Sweya, Wilkinson [64] proposed a comprehensive five-dimensional resilience measurement framework for water supply systems, covering technical, organizational, environmental, economic, and social aspects. Subsequently, they developed a measurement tool specifically focusing on the environmental resilience of water supply systems [89]. For the purposes of this demonstration, the hypothetical case study has been narrowed down to focus solely on the environmental dimension of the water supply system.
The hypothetical city of HSLMH has been selected as the case study. In 2009, an assessment of the environmental dimension of HSLMH’s water supply system was conducted, indicating that the system met the criteria for resilience at that time. Recently, the HSLMH council has committed to enhancing the environmental aspects of the water supply system. The proposed framework is applied to analyze the environmental dimension of the water supply system. Part A of the framework reassesses the system’s resilience using updated indicators and criteria, aiming to ensure its continued resilience. If the system is deemed resilient, Part B of the framework will proceed to evaluate the smartness of the resilient system. Based on the framework’s results, the municipal council can identify any weaknesses in the system and take appropriate corrective measures.
4.1.2. Identification of Suitable Assessment Levels
Table 2 provides a summary of the typical assessment levels utilized in various research contexts. For the purpose of reassessing the environmental resilience of the HSLMH water supply system, we have chosen to simplify the assessment process by focusing on two levels: (1) Dimension and (2) Indicators. These assessment levels were selected to ensure simplicity and ease of comprehension while still capturing key aspects of the system’s environmental resilience. It is important to acknowledge that the choice of assessment levels is based on the researcher’s recommendation and may be subject to modification based on expert advice and specific contextual considerations.
4.1.3. Proposing the Variables and Meeting with Experts to Amend, Confirm, and Scale Them
During the initial meeting with fifteen urban resilience specialists, the feasibility, transparency, and logical coherence of the framework’s Part A phases were thoroughly examined. All experts unanimously agreed on the framework’s practicality and suitability for experimentation. Subsequently, the process of identifying relevant indicators commenced. Researchers conducted a comprehensive review of the literature, existing frameworks, and current measurement methods to pinpoint suitable indicators. Seven indicators were initially selected to reassess environmental resilience, and these were further discussed with specialists during the second meeting. The main objective of the second meeting was to validate and rate the indicators. As a result, four indicators proposed by the researchers were deemed unnecessary and removed, while one additional indicator suggested by the experts was included. The indicators removed by the experts are as follows:
- (1)
- Water Quality: Initially suggested to assess the quality of water supplied, including parameters such as pH, turbidity, and contaminant levels. However, the experts decided to remove this indicator due to challenges associated with consistent and standardized monitoring across diverse urban environments, as well as the focus of the study on water coverage and supply efficiency rather than water quality.
- (2)
- Infrastructure Resilience: Initially proposed to evaluate the resilience of water infrastructure to withstand and recover from various hazards and disruptions. The experts removed this indicator citing its overlap with the efficiency in the water supply service and the complexity of quantifying infrastructure resilience within the scope of the study.
- (3)
- Community Engagement: Initially included to gauge the level of community involvement and participation in water management and resilience-building efforts. However, the experts decided to remove this indicator due to its qualitative nature and the difficulty in quantifying community engagement metrics within the framework of the study’s quantitative analysis.
- (4)
- Climate Change Adaptation: Initially suggested to assess the extent to which water supply systems are adapted to climate change impacts such as changing precipitation patterns and extreme weather events. However, the experts opted to remove this indicator, considering it beyond the immediate scope of the study’s focus on basic water supply metrics and efficiency.
In addition, they suggested adding the Wastewater Treatment indicator. This indicator was added to emphasize the importance of wastewater management in ensuring overall water system resilience and environmental sustainability. The experts introduced this indicator to address the critical aspect of wastewater treatment, aligning with the study’s focus on water supply efficiency and resilience.
The final assessment framework comprises four indicators, each with five criteria representing varying levels of performance. The initial rating parameters for the assessments are based on Likert scales ranging from one to five, where a score of one indicates a scenario associated with low resilience, while a score of five represents conditions indicating high resilience. Table 3 presents the selected indicators, measures, and measurement scales for the environmental dimension. These indicators were sourced from previous studies by Sweya and Wilkinson [89], FG-SSC [44], and Khatibi, Wilkinson [90], with some modifications. The weighting and aggregation processes will commence by prioritizing the indicators based on their significance.
Table 3.
Environmental resilience dimension: proposed indicators, measures, and measurement scales.
4.1.4. Indicator Weighting and Aggregating
As mentioned earlier, this study will adopt the method proposed by Gan, Fernandez [88] to determine the most suitable techniques for weighting and aggregating the indicators. The analytic hierarchy process (AHP) approach will be employed for the weighting procedure, while the additive method will be utilized for aggregation. The resulting aggregated value represents the Resilience Index (RI), which is computed as follows:
where:
Table 4 illustrates the summary of the scoring, weighting, and aggregating of the indicators.
Table 4.
Scoring, weighting, and aggregating of indicators.
As a result, the resilience index is computed as follows:
With a RI exceeding 2.5, it is evident that the HSLMH environmental dimension remains resilient. Part A of the framework concludes here, and the focus now shifts to evaluating the system’s smartness in part B. It is important to emphasize that a RI below 2.5 would indicate non-resilience, prompting the identification of vulnerable areas for improvement within the system infrastructure. However, with a RI of 4.28 for our case study, the system’s resilience has been affirmed, and we proceed to part B of the framework to assess its smartness.
4.2. Part B: Assessment of Smartness
4.2.1. Identification of Suitable Assessment Levels
Once Part A confirms the resilience of the system, Part B of the framework is initiated to assess the level of smartness of the resilient system. In this section, we outline the methodology for conducting Part B of the evaluation process.
4.2.2. Proposing the Indicators and Meeting with Experts to Amend, Confirm, and Scale Them
This section, like part A, had two expert meetings. The purpose of the first meeting was to evaluate the framework’s structure and dependability. Fifteen smart city specialists were chosen. Following expert approval of the framework specifications, the researchers proposed six indicators. During the second meeting, the experts reviewed the indicators and their measurements, removing three and adding one new indicator.
The three removed indicators are as follows:
- (1)
- Real-time Environmental Monitoring: Initially suggested to monitor various environmental parameters such as air quality, water quality, and noise levels in real time using ICT solutions. However, the experts decided to remove this indicator due to its broad scope and potential overlap with other environmental monitoring initiatives, focusing instead on more specific aspects of water supply resilience and efficiency.
- (2)
- Smart Infrastructure Management: Initially proposed to assess the integration of smart technologies for the management and maintenance of water supply infrastructure, including sensors, IoT devices, and predictive analytics. This indicator was removed to streamline the assessment framework and focus on metrics directly related to water coverage and consumption efficiency.
- (3)
- Community-based Environmental Initiatives: Initially included to evaluate community-led environmental initiatives related to water conservation, pollution prevention, and ecosystem restoration. However, the experts opted to remove this indicator due to its qualitative nature and the difficulty in quantifying community engagement metrics within the framework of the study’s quantitative analysis.
In addition, the experts suggested the ICT wastewater treatment indicator. This indicator was added to assess the use of ICT solutions for optimizing wastewater treatment processes, including monitoring, control, and automation. The experts introduced this indicator to emphasize the importance of wastewater management in ensuring environmental resilience and sustainability, aligning with the study’s focus on water supply system efficiency and environmental smart resilience. Following the validation process, four indicators were selected to be utilized in the framework. As mentioned earlier, the initial rating criteria for these indicators are based on Likert scales ranging from one to five, where a score of one signifies a low level of smartness and a score of five indicates a high level of smartness. The environmental smart dimension of the resilient system consists of principles, indicators, measures, and scales, as outlined in Table 5.
Table 5.
Environmental smart resilient dimension: indicators, measures, and measurement scales.
4.2.3. Indicator Weighting and Aggregating
According to Balaei, Wilkinson [66], assigning different weights to the principles may lead to a situation where the most important variable of the second-ranked principle holds more significance than the least important variable of the first-ranked principle. To prevent the double weighing of the principles and indicators resulting in a lower ranking, equal weight was given to the principles implemented in the case study. The weighting and aggregating of the variables were carried out using the AHP and additive techniques, similar to part A of the framework. The Smart Resilient Index (SRI) is derived from the aggregation stage, indicating the level of smartness of the resilient system. In this case study, the SRI is calculated to be 3.71. This suggests that the resilient system is sufficiently smart to be categorized as a smart resilient system. Conversely, if the result were less than 2.5, the system would be labeled as non-smart. Based on the indicators, researchers and city planners can propose upgrades to ensure that the resilient system meets the requirements of a smart system. Table 6 provides a summary of the weighting, scoring, and aggregation of principles and indicators.
Table 6.
Indicator weighting, scoring, and aggregating.
The SRI calculating procedures are as follows:
5. Limitations
Despite its potential, the proposed framework encounters several limitations that merit consideration. Firstly, the framework may face challenges related to data availability and affordability in countries with inadequate data management systems. Establishing databases to integrate discrete data into an effective management system could offer a practical and cost-effective solution to address this constraint. However, data collection and framework implementation rely heavily on public institutions, which may subject the process to political pressures and biases when assigning scores and weighting.
Moreover, the use of expert opinions presents another potential limitation. Research indicates that experts’ perspectives on specific issues can be biased, influencing their categorization of systems and potentially skewing the assessment outcomes. For instance, while some experts may classify a water supply system as drought-resilient based on minimal drought experiences, others with different reference points might disagree on the system’s resilience level. To mitigate this limitation, it is essential to involve experienced and certified specialists in the scoring and weighting process.
Additionally, our study’s Smart Resilient City Assessment Framework, despite offering a structured approach, faces uncertainties regarding its real-world effectiveness. While the framework provides a comprehensive methodology, empirical validation through field trials or case studies would enhance its credibility and applicability. Furthermore, the semi-quantitative nature of the framework may oversimplify the complex dynamics of urban resilience and smartness, potentially failing to capture the multifaceted interplay of socio-economic, environmental, and technological factors.
The generalizability of our framework beyond contexts like urban areas in China, where regional integration policies are prevalent, remains uncertain. Further research is needed to assess its applicability in diverse global urban settings. The reliance on data for resilience and smartness assessments may be hampered by issues of data availability and reliability. Inaccurate or incomplete data could compromise the validity of the framework’s results.
Despite efforts to standardize the assessment process, subjective judgments may still influence the evaluation of resilience and smartness, introducing biases and affecting result consistency across different evaluators. Finally, our framework’s focus on economic, social, ecological, and infrastructure dimensions may overlook other critical aspects of urban resilience and smartness, such as governance and community engagement. Given the evolving nature of resilience and smartness, our framework’s static nature may struggle to adapt to future shifts in urban paradigms. Addressing these limitations would enhance the robustness and applicability of our framework in promoting smart resilient cities effectively.
6. Conclusions
The study presents a Smart Resilient City Assessment Framework designed to help cities enhance both their resilience and smartness in anticipating future hazards and disasters. The framework consists of two main parts: a reassessment of resilience followed by an evaluation of a city’s smartness. It offers a structured eight-step process for developing tools that culminate in semi-quantitative indices, indicating the levels of resilience and smartness. These indices serve as a basis for identifying intervention measures to improve city systems.
The framework provides flexibility for researchers and city planners to define and describe the system under assessment, offering options for selecting assessment levels based on user preferences. Assessment variables are initially derived from a literature review and then validated through an expert elicitation process. Furthermore, the framework offers various weighting options, allowing users to choose the weighting approach that best suits their needs before aggregating them into final indices.
Using a hypothetical example of a water supply system in the HSLMH city, the study demonstrates how the framework works. The environmental resilience of the HSLMH city is determined to be 4.28, indicating sufficient resilience, while the smartness level is 3.71, suggesting a smart resilient city. The study highlights that low resilience levels combined with high smartness levels indicate a city that is not resilient despite being smart, and vice versa. Based on these results, appropriate intervention measures can be identified to enhance both resilience and smartness, ultimately making the system a smart resilient one.
7. Future Directions
This study presents a foundational framework for assessing smart resilient cities, yet there are several avenues for further research and application:
- ◦
- Empirical Validation: Future studies should prioritize the empirical validation of the Smart Resilient City Assessment Framework to ascertain its effectiveness and adaptability across diverse urban contexts. Conducting field trials and comparative analyses with established resilience and smartness indicators would provide valuable insights into the framework’s robustness and applicability.
- ◦
- Enhanced Data Integration: There is a need to explore methods for enhancing data integration and reliability to support resilience and smartness assessments. Leveraging emerging technologies such as Internet of Things (IoT) sensors and remote sensing techniques can facilitate the collection of real-time, high-quality data on urban dynamics, thereby strengthening the foundation of the framework.
- ◦
- Dynamic Framework Updates: It is essential to develop mechanisms for dynamically updating the framework to accommodate evolving urban challenges and paradigms. Incorporating feedback loops from city stakeholders and continuously refining the framework based on emerging research findings and best practices will ensure its relevance and effectiveness over time.
- ◦
- Interdisciplinary Collaboration: Fostering interdisciplinary collaboration between urban planners, engineers, social scientists, and policymakers is critical for refining and tailoring the framework to specific urban contexts and challenges. Such collaboration will enrich the framework with diverse perspectives and insights, leading to a more comprehensive understanding of urban resilience and smartness.
- ◦
- Community Engagement: Future research should explore strategies for enhancing community engagement and participation in resilience-building efforts. Integrating community-based indicators and participatory decision-making processes into the framework will ensure that it reflects the needs and priorities of local residents, fostering the greater ownership and sustainability of resilience initiatives.
- ◦
- Policy Integration: Efforts should be made to integrate the framework into urban planning and policymaking processes. Collaborating closely with municipal governments and policymakers to incorporate resilience and smartness considerations into urban development plans and strategies will facilitate the adoption and implementation of the framework at scale.
- ◦
- Long-Term Impact Assessment: Longitudinal studies are needed to assess the long-term impact of resilience-building interventions informed by the framework. Such studies will provide valuable insights into the effectiveness of resilience strategies over time, enabling iterative improvements and informed decision-making.
By pursuing these future directions, researchers and practitioners can advance the understanding and implementation of smart resilient cities, contributing to more sustainable, resilient, and livable urban environments.
Author Contributions
H.K.: conceptualized and designed the study, conducted hypothetical data collection and analysis, and drafted the manuscript. Synthesizing the research findings and revising the manuscript critically. S.W.: Execution. L.N.S.: Hypothetical data collection process. M.B.: Study’s design and methodology. H.D.: Theoretical framework. All authors have read and agreed to the published version of the manuscript.
Funding
This research received no external funding.
Data Availability Statement
Data are contained within the article.
Conflicts of Interest
The authors declare that they have no known competing financial interests or personal relationships that could have appeared to influence the work reported in this paper.
References
- Figueiredo, L.; Honiden, T.; Schumann, A. Indicators for Resilient Cities; OECD iLibrary: Paris, France, 2018. [Google Scholar]
- Hernantes, J.; Maraña, P.; Gimenez, R.; Sarriegi, J.M.; Labaka, L. Towards resilient cities: A maturity model for operationalizing resilience. Cities 2019, 84, 96–103. [Google Scholar] [CrossRef]
- Shafiei Dastjerdi, M.; Lak, A.; Ghaffari, A.; Sharifi, A. A conceptual framework for resilient place assessment based on spatial resilience approach: An integrative review. Urban Clim. 2021, 36, 100794. [Google Scholar] [CrossRef]
- Sweya, L.N.; Wilkinson, S. Tool development to measure the resilience of water supply systems in Tanzania: Economic dimension. Jàmbá J. Disaster Risk Stud. 2021, 13, 860. [Google Scholar] [CrossRef] [PubMed]
- Leitner, H.; Sheppard, E.; Webber, S.; Colven, E. Globalizing urban resilience. Urban Geogr. 2018, 39, 1276–1284. [Google Scholar] [CrossRef]
- Tabibian, M.; Rezapour, M. Assessment of urban resilience; a case study of Region 8 of Tehran city, Iran. Sci. Iran. 2016, 23, 1699–1707. [Google Scholar] [CrossRef][Green Version]
- Rus, K.; Kilar, V.; Koren, D. Resilience assessment of complex urban systems to natural disasters: A new literature review. Int. J. Disaster Risk Reduct. 2018, 31, 311–330. [Google Scholar] [CrossRef]
- Sweya, L.; Wilkinson, S.; Chang-Richard, A. Understanding Water Systems Resilience Problems in Tanzania. Procedia Eng. 2018, 212, 488–495. [Google Scholar] [CrossRef]
- Schipper, E.L.F.; Langston, L.J.A.I. A Comparative Overview of Resilience Measurement Frameworks; Overseas Development Institute: London, UK, 2015; p. 422. [Google Scholar]
- Sweya, L.N.; Wilkinson, S.; Mayunga, J.; Joseph, A.; Lugomela, G.; Victor, J. Development of a Tool to Measure Resilience against Floods for Water Supply Systems in Tanzania. J. Manag. Eng. 2020, 36, 05020007. [Google Scholar] [CrossRef]
- Balaei, B.; Wilkinson, S.; Potangaroa, R.; McFarlane, P. Investigating the technical dimension of water supply resilience to disasters. Sustain. Cities Soc. 2020, 56, 102077. [Google Scholar] [CrossRef]
- Odiase, O.; Wilkinson, S.; Neef, A. Disaster Risk and the Prospect of Enhancing the Resilience of the African Community in Auckland. Risk Hazards Crisis Public Policy 2020, 11, 188–203. [Google Scholar] [CrossRef]
- Dianat, H.; Wilkinson, S.; Williams, P.; Khatibi, H. Planning the resilient city: Investigations into using “causal loop diagram” in combination with “UNISDR scorecard” for making cities more resilient. Int. J. Disaster Risk Reduct. 2021, 65, 102561. [Google Scholar] [CrossRef]
- Meerow, S.; Newell, J.P.; Stults, M. Defining urban resilience: A review. Landsc. Urban Plan. 2016, 147, 38–49. [Google Scholar] [CrossRef]
- D’Lima, M.; Medda, F. A new measure of resilience: An application to the London Underground. Transp. Res. Part A Policy Pract. 2015, 81, 35–46. [Google Scholar] [CrossRef]
- Jovanović, A.; Øien, K.; Choudhary, A. An indicator-based approach to assessing resilience of smart critical infrastructures. In Urban Disaster Resilience and Security; Springer: Berlin/Heidelberg, Germany, 2018; pp. 285–311. [Google Scholar]
- Dianat, H.; Wilkinson, S.; Williams, P.; Khatibi, H. Choosing a holistic urban resilience assessment tool. Int. J. Disaster Risk Reduct. 2022, 71, 102789. [Google Scholar] [CrossRef]
- Sharifi, A. A critical review of selected smart city assessment tools and indicator sets. J. Clean. Prod. 2019, 233, 1269–1283. [Google Scholar] [CrossRef]
- Albino, V.; Berardi, U.; Dangelico, R.M. Smart cities: Definitions, dimensions, performance, and initiatives. J. Urban Technol. 2015, 22, 3–21. [Google Scholar] [CrossRef]
- Negre, E.; Rosenthal-Sabroux, C.; Gascó, M. A knowledge-based conceptual vision of the smart city. In Proceedings of 2015 48th Hawaii International Conference on System Sciences, Kauai, HI, USA, 5–8 January 2015; pp. 2317–2325. [Google Scholar]
- Khatibi, H.; Wilkinson, S.; Baghersad, M.; Dianat, H.; Ramli, H.; Suhatril, M.; Javanmardi, A.; Ghaedi, K. The resilient–smart city development: A literature review and novel frameworks exploration. Built Environ. Proj. Asset Manag. 2021, 11, 493–510. [Google Scholar] [CrossRef]
- Holling, C.S. Resilience and Stability of Ecological Systems. Annu. Rev. Ecol. Syst. 1973, 4, 1–23. [Google Scholar] [CrossRef]
- Sun, J.; Zhai, N.; Mu, H.; Miao, J.; Li, W.; Li, M. Assessment of urban resilience and subsystem coupling coordination in the Beijing-Tianjin-Hebei urban agglomeration. Sustain. Cities Soc. 2024, 100, 105058. [Google Scholar] [CrossRef]
- Amegavi, G.B.; Nursey-Bray, M.; Suh, J. Exploring the realities of urban resilience: Practitioners’ perspectives. Int. J. Disaster Risk Reduct. 2024, 103, 104313. [Google Scholar] [CrossRef]
- Wang, H.; Xue, H.; He, W.; Han, Q.; Xu, T.; Gao, X.; Liu, S.; Jiang, R.; Huang, M. Spatial-temporal evolution mechanism and dynamic simulation of the urban resilience system of the Guangdong-Hong Kong-Macao Greater Bay Area in China. Environ. Impact Assess. Rev. 2024, 104, 107333. [Google Scholar] [CrossRef]
- Godschalk, D.R. Urban Hazard Mitigation: Creating Resilient Cities. Nat. Hazards Rev. 2003, 4, 136–143. [Google Scholar] [CrossRef]
- Mehmood, A. Of resilient places: Planning for urban resilience. Eur. Plan. Stud. 2016, 24, 407–419. [Google Scholar] [CrossRef]
- Spaans, M.; Waterhout, B. Building up resilience in cities worldwide—Rotterdam as participant in the 100 Resilient Cities Programme. Cities 2017, 61, 109–116. [Google Scholar] [CrossRef]
- Ribeiro, P.J.G.; Pena Jardim Gonçalves, L.A. Urban resilience: A conceptual framework. Sustain. Cities Soc. 2019, 50, 101625. [Google Scholar] [CrossRef]
- Baghersad, M.; Wilkinson, S.; Khatibi, H. Comprehensive Indicator Bank for Resilience of Water Supply Systems. Adv. Civ. Eng. 2021, 2021, 2360759. [Google Scholar] [CrossRef]
- Amirzadeh, M.; Sobhaninia, S.; Buckman, S.T.; Sharifi, A. Towards building resilient cities to pandemics: A review of COVID-19 literature. Sustain. Cities Soc. 2023, 89, 104326. [Google Scholar] [CrossRef]
- Jiang, N.; Jiang, W. How does regional integration policy affect urban resilience? Evidence from urban agglomeration in China. Environ. Impact Assess. Rev. 2024, 104, 107298. [Google Scholar] [CrossRef]
- Lee, J.H.; Hancock, M.G.; Hu, M.-C. Towards an effective framework for building smart cities: Lessons from Seoul and San Francisco. Technol. Forecast. Soc. Change 2014, 89, 80–99. [Google Scholar] [CrossRef]
- Arroub, A.; Zahi, B.; Sabir, E.; Sadik, M. A literature review on Smart Cities: Paradigms, opportunities and open problems. In Proceedings of 2016 International Conference on Wireless Networks and Mobile Communications (WINCOM), Fez, Morocco, 26–29 October 2016; pp. 180–186. [Google Scholar]
- Yovanof, G.S.; Hazapis, G.N. An architectural framework and enabling wireless technologies for digital cities & intelligent urban environments. Wirel. Pers. Commun. 2009, 49, 445–463. [Google Scholar]
- Chourabi, H.; Nam, T.; Walker, S.; Gil-Garcia, J.R.; Mellouli, S.; Nahon, K.; Pardo, T.A.; Scholl, H.J. Understanding Smart Cities: An Integrative Framework. In Proceedings of 2012 45th Hawaii International Conference on System Sciences, Maui, HI, USA, 4–7 January 2012; pp. 2289–2297. [Google Scholar]
- Stamopoulos, D.; Dimas, P.; Siokas, G.; Siokas, E. Getting smart or going green? Quantifying the Smart City Industry’s economic impact and potential for sustainable growth. Cities 2024, 144, 104612. [Google Scholar] [CrossRef]
- Gracias, J.S.; Parnell, G.S.; Specking, E.; Pohl, E.A.; Buchanan, R. Smart Cities—A Structured Literature Review. Smart Cities 2023, 6, 1719–1743. [Google Scholar] [CrossRef]
- Alawadhi, S.; Aldama-Nalda, A.; Chourabi, H.; Gil-Garcia, J.R.; Leung, S.; Mellouli, S.; Nam, T.; Pardo, T.A.; Scholl, H.J.; Walker, S. Building understanding of smart city initiatives. In Proceedings of International Conference on Electronic Government, Kristiansand, Norway, 3–6 September 2012; pp. 40–53. [Google Scholar]
- Alshamaila, Y.; Papagiannidis, S.; Alsawalqah, H.; Aljarah, I. Effective use of smart cities in crisis cases: A systematic review of the literature. Int. J. Disaster Risk Reduct. 2023, 85, 103521. [Google Scholar] [CrossRef]
- Dameri, R.P. Searching for smart city definition: A comprehensive proposal. Int. J. Comput. Technol. 2013, 11, 2544–2551. [Google Scholar] [CrossRef]
- Pandya, S.; Srivastava, G.; Jhaveri, R.; Babu, M.R.; Bhattacharya, S.; Maddikunta, P.K.R.; Mastorakis, S.; Piran, M.J.; Gadekallu, T.R. Federated learning for smart cities: A comprehensive survey. Sustain. Energy Technol. Assess. 2023, 55, 102987. [Google Scholar] [CrossRef]
- Ismagilova, E.; Hughes, L.; Dwivedi, Y.K.; Raman, K.R. Smart cities: Advances in research—An information systems perspective. Int. J. Inf. Manag. 2019, 47, 88–100. [Google Scholar] [CrossRef]
- United Nations; International Telecommunication Union (ITU-T); Focus Group on Smart Sustainable Cities (FG-SSC). Smart Sustainable Cities: An Analysis of Definitions; Technical Report; ITU-T: Geneva, Switzerland, 2014. [Google Scholar]
- Bibri, S.E.; Krogstie, J.; Kaboli, A.; Alahi, A. Smarter eco-cities and their leading-edge artificial intelligence of things solutions for environmental sustainability: A comprehensive systematic review. Environ. Sci. Ecotechnol. 2024, 19, 100330. [Google Scholar] [CrossRef]
- Giffinger, R.; Pichler-Milanović, N. Smart Cities: Ranking of European Medium-Sized Cities; Centre of Regional Science, Vienna University of Technology: Vienna, Austria, 2007. [Google Scholar]
- Cohen, B. Smart City Wheel. Retrieved from SMART CIRCLE. 2013. Available online: https://www.smart-circle.org/smart-city/boyd-cohen-smart-city-wheel/ (accessed on 16 February 2024).
- Shah, M.N.; Nagargoje, S.; Shah, C. Assessment of Ahmedabad (India) and Shanghai (China) on Smart City Parameters Applying the Boyd Cohen Smart City Wheel. In Proceedings of the 20th International Symposium on Advancement of Construction Management and Real Estate; Springer: Singapore, 2017; pp. 111–127. [Google Scholar]
- Yigitcanlar, T.; Xia, B.; Cortese, T.T.P.; Sabatini-Marques, J. City 4.0: Digital Transformation of Urban Settlements. Sustainability 2024, 16, 671. [Google Scholar] [CrossRef]
- Papa, R.; Galderisi, A.; Vigo Majello, M.C.; Saretta, E. Smart and Resilient Cities. A Systemic Approach for Developing Cross-sectoral Strategies in the Face of Climate Change. TeMA—J. Land Use Mobil. Environ. 2015, 8, 19–49. [Google Scholar] [CrossRef]
- Wolfram, M. Deconstructing smart cities: An intertextual reading of concepts and practices for integrated urban and ICT development. In Proceedings of the REAL CORP 2012, Schwechat, Austria, 14–16 May 2012. [Google Scholar]
- Huda, N.U.; Ahmed, I.; Adnan, M.; Ali, M.; Naeem, F. Experts and intelligent systems for smart homes’ Transformation to Sustainable Smart Cities: A comprehensive review. Expert Syst. Appl. 2024, 238, 122380. [Google Scholar] [CrossRef]
- DesRoches, R.; Taylor, J. The promise of smart and resilient cities. Bridge 2018, 48. [Google Scholar]
- Gkontzis, A.F.; Kontsiantis, S.; Feretzakis, G.; Verykios, V.S. Enhancing Urban Resilience: Smart City Data Analyses, Forecasts, and Digital Twin Techniques at the Neighborhood Level. Future Internet 2024, 16, 47. [Google Scholar] [CrossRef]
- Bruneau, M.; Chang, S.E.; Eguchi, R.T.; Lee, G.C.; O’Rourke, T.D.; Reinhorn, A.M.; Shinozuka, M.; Tierney, K.; Wallace, W.A.; Von Winterfeldt, D. A framework to quantitatively assess and enhance the seismic resilience of communities. Earthq. Spectra 2003, 19, 733–752. [Google Scholar] [CrossRef]
- Conrado, S.P.; Neville, K.; Woodworth, S.; O’Riordan, S. Managing social media uncertainty to support the decision making process during emergencies. J. Decis. Syst. 2016, 25, 171–181. [Google Scholar] [CrossRef]
- Baron, M. Do we need smart cities for resilience. J. Econ. Manag. Eng. 2012, 10, 32–46. [Google Scholar]
- Zhu, S.; Li, D.; Feng, H. Is smart city resilient? Evidence from China. Sustain. Cities Soc. 2019, 50, 101636. [Google Scholar] [CrossRef]
- Guenduez, A.A.; Mergel, I.; Schedler, K.; Fuchs, S.; Douillet, C. Institutional work in smart cities: Interviews with smart city managers. Urban Gov. 2024. [Google Scholar] [CrossRef]
- Lilli, G.; Sanavia, M.; Oboe, R.; Vianello, C.; Manzolaro, M.; De Ruvo, P.L.; Andrighetto, A. A semi-quantitative risk assessment of remote handling operations on the SPES Front-End based on HAZOP-LOPA. Reliab. Eng. Syst. Saf. 2024, 241, 109609. [Google Scholar] [CrossRef]
- Prior, T. Measuring critical infrastructure resilience: Possible indicators. CSS Risk Resil. Rep. 2015, 9. [Google Scholar]
- Willis, H.H.; Loa, K. Measuring the Resilience of Energy Distribution Systems; RAND Corporation: Santa Monica, CA, USA, 2015. [Google Scholar]
- Cai, H.; Lam, N.S.N.; Qiang, Y.; Zou, L.; Correll, R.M.; Mihunov, V. A synthesis of disaster resilience measurement methods and indices. Int. J. Disaster Risk Reduct. 2018, 31, 844–855. [Google Scholar] [CrossRef]
- Langroudi, B.; Salehi, E.; Keshani, S.; Baghersad, M. Evaluation of Seismic Damage for Gisha Bridge in Tehran by HAZUS Methodology. Int. J. Archit. Civ. Constr. Sci. 2011, 5, 255–259. [Google Scholar] [CrossRef]
- Cutter, S.L. The landscape of disaster resilience indicators in the USA. Nat. Hazards 2016, 80, 741–758. [Google Scholar] [CrossRef]
- Balaei, B.; Wilkinson, S.; Potangaroa, R.; Hassani, N.; Alavi-Shoshtari, M. Developing a Framework for Measuring Water Supply Resilience. Nat. Hazards Rev. 2018, 19, 04018013. [Google Scholar] [CrossRef]
- Cox, R.S.; Hamlen, M. Community disaster resilience and the rural resilience index. Am. Behav. Sci. 2015, 59, 220–237. [Google Scholar] [CrossRef]
- Cimellaro, G.P.; Renschler, C.; Reinhorn, A.M.; Arendt, L. PEOPLES: A framework for evaluating resilience. J. Struct. Eng. 2016, 142, 04016063. [Google Scholar] [CrossRef]
- Vugrin, E.D.; Warren, D.E.; Ehlen, M.A.; Camphouse, R.C. A framework for assessing the resilience of infrastructure and economic systems. In Sustainable and Resilient Critical Infrastructure Systems; Springer: Berlin/Heidelberg, Germany, 2010; pp. 77–116. [Google Scholar]
- Hughes, J.F.; Healy, K. Measuring the Resilience of Transport Infrastructure; New Zealand Transport Agency: Wellington, New Zealand, 2014. [Google Scholar]
- Khatibi, H.; Wilkinson, S.; Eriwata, G.; Sweya, L.N.; Baghersad, M.; Dianat, H.; Ghaedi, K.; Javanmardi, A. An integrated framework for assessment of smart city resilience. Environ. Plan. B Urban Anal. City Sci. 2022, 49, 1556–1577. [Google Scholar] [CrossRef]
- Cabell, J.F.; Oelofse, M. An indicator framework for assessing agroecosystem resilience. Ecol. Soc. 2012, 17, 18. [Google Scholar] [CrossRef]
- Perry, H. An Approach to Assessing the Resilience of the Water Service in England and Wales–Can We Answer the Question: Is the Service Resilient or Brittle? Ph.D. Dissertation, University of Birmingham, Birmingham, UK, 2013. [Google Scholar]
- Oktari, R.S.; Comfort, L.K.; Dwitama, P. Measuring coastal cities’ resilience toward coastal hazards: Instrument development and validation. Prog. Disaster Sci. 2020, 5, 100057. [Google Scholar] [CrossRef]
- Seo, W.; Kang, Y. Performance Indicators for the Claim Management of General Contractors. J. Manag. Eng. 2020, 36, 04020070. [Google Scholar] [CrossRef]
- Sweya, L.; Wilkinson, S.; Kassenga, G.; Mayunga, J. Developing a tool to measure the organizational resilience of Tanzania’s water supply systems. Glob. Bus. Organ. Excell. 2020, 39, 6–19. [Google Scholar] [CrossRef]
- Ji, M.; Wang, J. Review and comparison of various hydrogen production methods based on costs and life cycle impact assessment indicators. Int. J. Hydrogen Energy 2021, 46, 38612–38635. [Google Scholar] [CrossRef]
- Taques, F.H.; López, M.G.; Basso, L.F.; Areal, N. Indicators used to measure service innovation and manufacturing innovation. J. Innov. Knowl. 2021, 6, 11–26. [Google Scholar] [CrossRef]
- Paracchini, M.L.; Pacini, C.; Calvo, S.; Vogt, J. Weighting and aggregation of indicators for sustainability impact assessment in the SENSOR context. In Sustainability Impact Assessment of Land Use Changes; Springer: Berlin/Heidelberg, Germany, 2008; pp. 349–372. [Google Scholar]
- Tangian, A. Analysis of the third European survey on working conditions with composite indicators. Eur. J. Oper. Res. 2007, 181, 468–499. [Google Scholar] [CrossRef]
- Kang, S.M. A sensitivity analysis of the Korean composite environmental index. Ecol. Econ. 2002, 43, 159–174. [Google Scholar] [CrossRef]
- Saltelli, A.; Saisana, M. Settings and methods for global sensitivity analysis–a short guide. In PAMM: Proceedings in Applied Mathematics and Mechanics; Wiley Online Library: Hoboken, NJ, USA, 2007; pp. 2140013–2140014. [Google Scholar]
- Jiang, Y.; Shen, J. Weighting for what? A comparison of two weighting methods for measuring urban competitiveness. Habitat Int. 2013, 38, 167–174. [Google Scholar] [CrossRef]
- Beliakov, G.; Pradera, A.; Calvo, T. Aggregation Functions: A Guide for Practitioners; Springer: Berlin/Heidelberg, Germany, 2007; Volume 221. [Google Scholar]
- Grabisch, M.; Marichal, J.-L.; Mesiar, R.; Pap, E. Aggregation Functions; Cambridge University Press: Cambridge, UK, 2009; Volume 127. [Google Scholar]
- OECD. Handbook on Constructing Composite Indicators: Methodology and User Guide; OECD Publishing: Washington, DC, USA, 2008. [Google Scholar]
- Wilson, M.V.; Wilson, E. Authentic Performance in the Instrumental Analysis Laboratory: Building a Visible Spectrophotometer Prototype. J. Chem. Educ. 2017, 94, 44–51. [Google Scholar] [CrossRef]
- Gan, X.; Fernandez, I.C.; Guo, J.; Wilson, M.; Zhao, Y.; Zhou, B.; Wu, J. When to use what: Methods for weighting and aggregating sustainability indicators. Ecol. Indic. 2017, 81, 491–502. [Google Scholar] [CrossRef]
- Sweya; Wilkinson, S. A tool for measuring environmental resilience to floods in Tanzania water supply systems. Ecol. Indic. 2020, 112, 106165. [Google Scholar] [CrossRef]
- Khatibi, H.; Wilkinson, S.; Dianat, H.; Baghersad, M.; Ghaedi, K.; Javanmardi, A. Indicators bank for smart and resilient cities: Design of excellence. Built Environ. Proj. Asset Manag. 2021, 12, 5–19. [Google Scholar] [CrossRef]

Disclaimer/Publisher’s Note: The statements, opinions and data contained in all publications are solely those of the individual author(s) and contributor(s) and not of MDPI and/or the editor(s). MDPI and/or the editor(s) disclaim responsibility for any injury to people or property resulting from any ideas, methods, instructions or products referred to in the content. |
© 2024 by the authors. Licensee MDPI, Basel, Switzerland. This article is an open access article distributed under the terms and conditions of the Creative Commons Attribution (CC BY) license (https://creativecommons.org/licenses/by/4.0/).