Article

Effects of Water-Level Fluctuation on Soil Aggregates and Aggregate-Associated Organic Carbon in the Water-Level Fluctuation Zone of the Three Gorges Reservoir, China

1
Chongqing Jinfo Mountain Karst Ecosystem National Observation and Research Station, School of Geographical Sciences, Southwest University, Chongqing 400715, China
2
Observation and Research Station of Ecological Restoration for Chongqing Typical Mining Areas, Ministry of Natural Resources, Chongqing Institute of Geology and Mineral Resources, Chongqing 401120, China
3
Wansheng Mining Area Ecological Environment Protection and Restoration of Chongqing Observation and Research Station, Ministry of Natural Resources, Chongqing Institute of Geology and Mineral Resources, Chongqing 400715, China
*
Author to whom correspondence should be addressed.
These authors contributed equally to this work.
Land 2024, 13(3), 313; https://doi.org/10.3390/land13030313
Submission received: 21 January 2024 / Revised: 28 February 2024 / Accepted: 28 February 2024 / Published: 1 March 2024

Abstract

:
Water-level fluctuation (WLF) can destroy soil aggregates and induce soil organic carbon (SOC) loss, potentially triggering impacts on the concentration of atmospheric carbon dioxide. However, responses of soil aggregate content and aggregate-associated organic carbon to WLF have not been well studied, especially in the water-level fluctuation zone (WLFZ) of the Three Gorges Reservoir (TGR). Therefore, samples from different elevations (145 m, 155 m and 165 m) in the WLFZ of the TGR were collected for experiments. The wet sieving method was used to divide soil into silt and clay (<0.053 mm), micro-aggregate (0.053–0.25 mm) and macro-aggregate (>0.25 mm). The K2Cr2O7-H2SO4 oxidation method was used to measure total SOC content in different soil aggregates. A modified Walkley and Black method was used to measure labile carbon in different soil aggregates. Results showed that macro-aggregate content substantially decreased, while micro-aggregate content remained stable and silt and clay fraction accumulated with a decrease in water-level elevations. Moreover, total SOC content and labile carbon in macro-aggregate were obviously higher than those in the micro-aggregate and the silt and clay fraction. Macro-aggregate contributed the most to SOC sequestration, while micro-aggregate contributed the least, and the contribution of macro-aggregate increased with a decrease in water-level elevations. We concluded that the macro-aggregate was the most active participant in the SOC sequestration process, and preferentially increasing the macro-aggregate content of the lowest water-level elevation was conducive to an improvement in soil carbon sequestration potential and would mitigate climate change.

1. Introduction

The Three Gorges Reservoir (TGR) was built in 2009, with flood control, power generation and water replenishment as its main functions [1]. It is best known as one of the world’s largest reservoirs [2]. As water level continues to rise and fall, the wetland formed by the impoundment and flood discharge of the TGR has become one of the most dynamic places of biogeochemical processes, making it a focal point in global carbon cycle research [3]. Within the elevation range of 145~175 m on both sides of the reservoir area, a reservoir fluctuation zone opposite to the fluctuation season of the natural river has formed [4,5]. This unique area is a transition between aquatic and terrestrial ecosystems, resulting in a special soil–water and soil–air interaction [6,7]. And this will adversely affect the stability of soil aggregates [8,9]. Hence, an in-depth understanding of the soil dynamics at different water levels will enable a more precise prediction of soil anti-erosion capability and will support soil ecosystem functions [10]. Several studies have researched the impacts of water-level fluctuation (WLF) on soil structure and soil organic carbon (SOC) [11,12,13]. Considering that soil aggregate is an important index to identify the stability of soil and SOC, and that SOC in soil aggregates has not been well investigated [14,15], we aim to identify the effects of WLF on SOC via measuring SOC in bulk soil, macro-aggregate, micro-aggregate, and silt and clay fraction.
Soil aggregate, the smallest unit of soil structure, can store SOC [16]. The development and modification of soil aggregates are directly related to carbon sequestration and fertility [17]. The value of ecological function can also be evaluated by soil size and pore stability [18]. Soil aggregates contain solid particles of different grain sizes [19]. Normally, micro-aggregates are those with a diameter of less than 0.25 mm, while macro-aggregates have a diameter higher than 0.25 mm [20]. SOC is a cementation material that forms aggregates, and only when SOC is confined in aggregates can it maintain its durability [21]. Once the aggregates are destroyed, SOC will be exposed and decomposed by microorganisms [22]. However, aggregates formed by SOC become more stable. This is a crucial mechanism of carbon sequestration [23].
WLF can destroy the physical stability and organic carbon of soil aggregates by causing soil to shrink and expand [24]. Moreover, long-term changes in soil-inherent properties caused by water stress may indirectly induce the change of soil aggregates, and SOC may also change significantly [25]. Under normal conditions, healthy and stable soil aggregates can maintain soil environmental functions under various wet conditions [26]. In contrast, unstable soil aggregates are widely disintegrated under the action of dry and wet, forming soil seals and eventually crusts [27]. When it dries, the soil crust on the surface will form a hard surface to prevent moisture entry, thus accelerating the soil erosion on site [18]. At present, the composition and pore structure of aggregates in the water-level fluctuation zone (WLFZ) have received a lot of attention [28,29,30]. Nsabimana et al. (2023) reported that micro-aggregate content increased with elevation increases [28]. Jiang et al. reported that due to alternations in hydrological regime, the hydrological stress at lower elevations has a stronger destructive effect on soil aggregates than that at higher elevations [7]. The results of some recent studies on the WLFZ showed that the stability of aggregates decreases as hydrological stress increases [18,31,32]. However, studies on the impacts of WLF on the carbon sequestration of different aggregates are still lacking [33].
SOC represents the site where soil and ecosystem carbon elements are converted to each other, and small changes in it will significantly affect the global atmospheric carbon dioxide [23]. Therefore, understanding the alternations of SOC in the wetland in the WLFZ is extremely important for the global carbon cycle [34]. However, the background value of SOC is large, and it is difficult to respond quickly to alternations in soil carbon and environment [33]. According to the difficulty of SOC oxidation, Chan et al. divided organic carbon into four fractions [35]. Among them, labile carbon has poor stability, easy decomposition and mineralization, and directly participates in the biochemical transformation process of soil, which can quickly respond to changes in the external environment [36,37]. Hence, the study of labile carbon in the WLFZ is crucial for the global carbon cycle [38]. However, unfortunately, there are fewer studies on the labile carbon fraction in different aggregates than on the total SOC dynamics in different aggregates in the WLFZ [33]. Too little research of this was becoming a severe impediment to understanding causes affecting SOC sequestration in the WLFZ of the TGR.
In this study, our aims were to (1) identify the dynamics of aggregate distribution in the TGR’s WLFZ; (2) measure the dynamics of SOC and labile carbon content for different particle size aggregates in the TGR’s WLFZ; and (3) identify the contributions of soil aggregates to SOC sequestration in the TGR’s WLFZ.

2. Materials and Methods
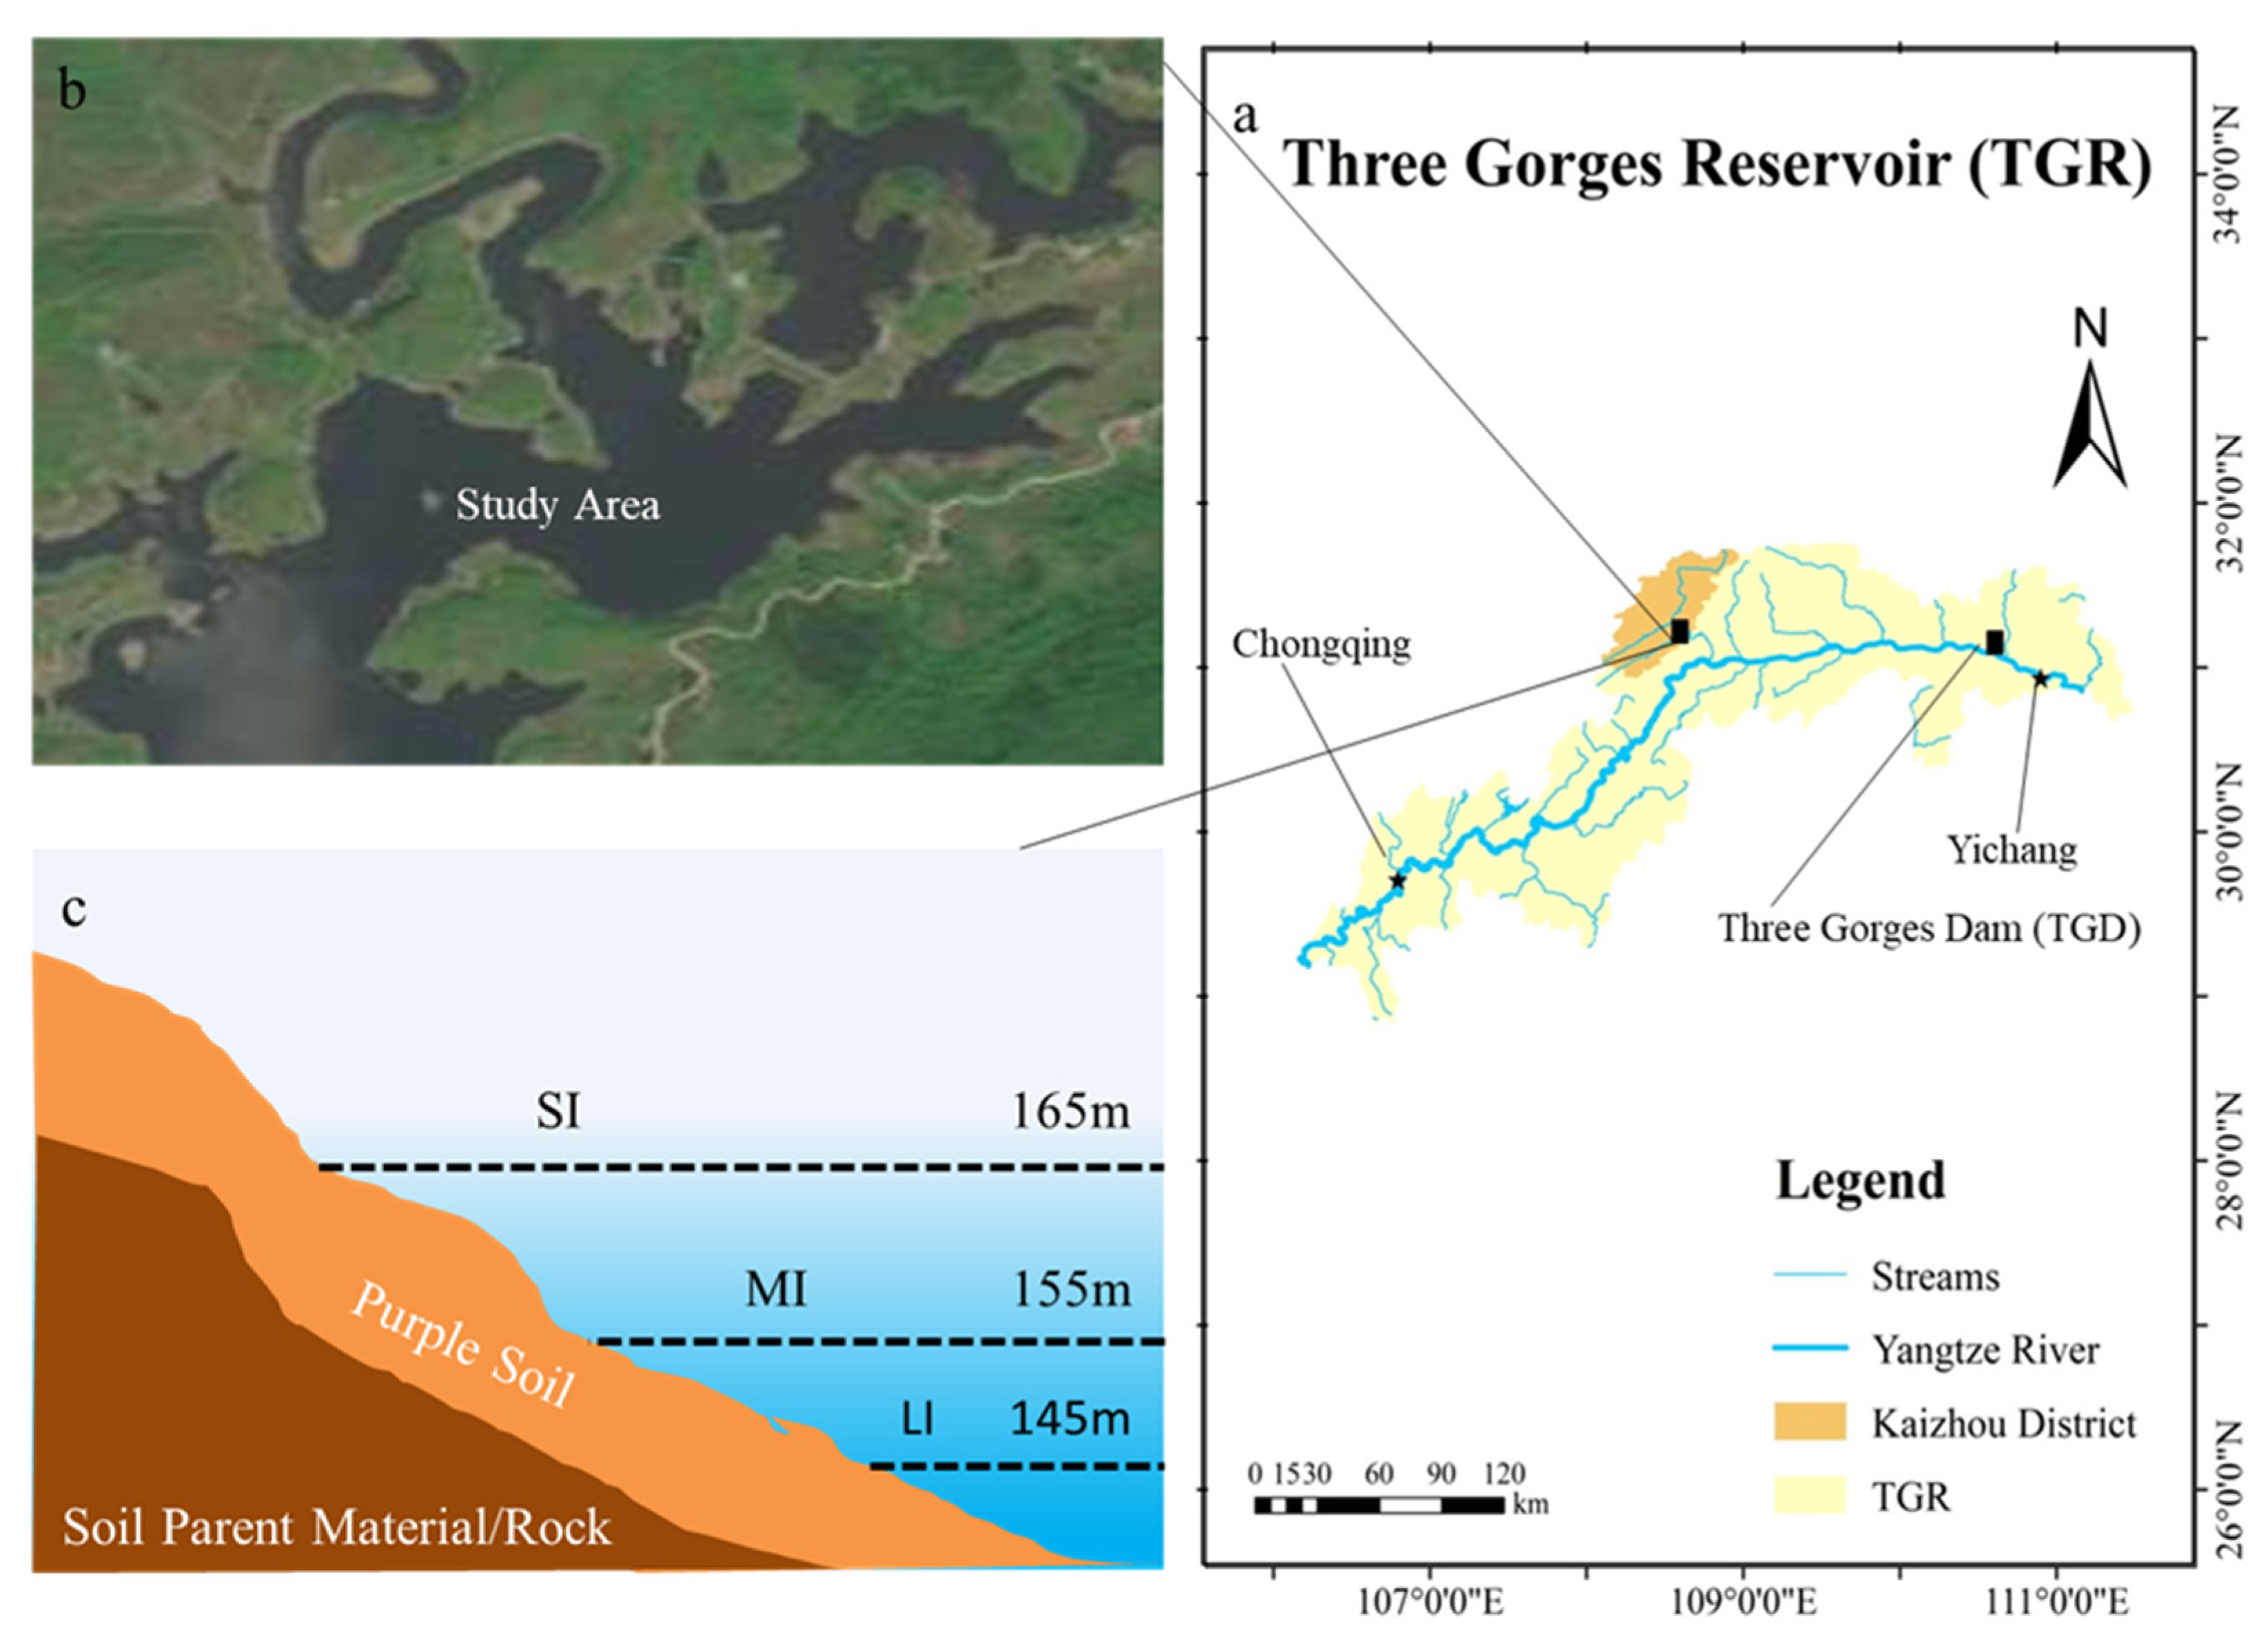
2.1. Study Area

The investigation occurred in the Pengxihe Nature Reserve (108°27′32″~108°34′55″ E, 31°05′35″~31°12′29″ N), Kaizhou District, Chongqing municipality (Figure 1). The Pengxihe Nature Reserve is a hilly landform of middle and low mountains parallel to ridges and valleys in the east of the basin with an area of 4107.27 ha (1 ha = 10,000 m2). The climate is a humid monsoon climate in the subtropical zone, with an average annual temperature of 18.5 °C. There is roughly 1300 mm of precipitation on average every year. The soil in the test area is purple soil, which is a kind of non-zonal soil transformed by purple shale and sandstone. It has high porosity, a strong infiltration capacity and a shallow soil layer. Purple soil is classified as Eutric Regosols in the FAO [28]. Due to the unique natural and geographical conditions of the WLFZ and the implementation of ecological protection measures, the reserve is rich in plant resources. Most of the vegetation is annual or perennial herbs, mainly Chloris virgate, Cynodon dactylon, Xanthium sibiricum, Leptochloa chinensis, etc.

2.2. Sampling Design

In this study, four transects with the same texture were randomly selected in the WLFZ of the Pengxihe Nature Reserve by GPS positioning in June 2022. To mitigate the impact of land use, soil and vegetation on the research results, a plot with purple soil with similar habitat types was selected to collect soil samples. The lowest water level in the study area was 145 m, and the highest water level was about 165 m. According to the difference in soil flooding time and elevations in the subsidence zone and referencing previous studies, each transect was divided into three elevation treatments along the elevation gradient: LI (145 m) in the lower part of the subsidence zone, MI (155 m) in the middle part and SI (165 m) in the upper part. A 1 m × 1 m quadrat was established at each elevation treatment in each transect. Considering the difference of aboveground biomass input and water erosion resistance at different soil depths, two soil layers, 0–10 cm and 10–20 cm, were selected for research. At a soil depth of 0–10 cm and 10–20 cm in each quadrat, four samples were randomly taken with a 3 cm diameter soil corer (screw corer purchased from a store called “Zhengxiang Instruments”), and the samples from each quadrat were mixed into a single composite sample. We ended up with 24 composite soil samples. Then we separated them from gravel and plants and brought them back to the laboratory.

2.3. Soil Analysis

Soil samples were separated by the wet sieving method [21]. All samples were sifted through a 0.25 mm sieve (soil sieve purchased from a store called “Shengchao screening mall”) and a 0.053 mm sieve (soil sieve purchased from a store called “Shengchao screening mall”) to group them into >0.25 mm (macro-aggregate), 0.053–0.25 mm (micro-aggregate) and <0.053 mm (silt and clay fraction). Then, soil aggregates were dried for 48 h at 50 °C to constant weight.
Total SOC content under different water levels was determined by the K2Cr2O7-H2SO4 oxidation method [23]. The labile carbon in soil fractions in different water levels was determined by a modified Walkley and Black method [39,40]. We put the bulk soil and soil aggregates into a glass bottle and mixed 10 mL of 0.5 M K2Cr2O7 with 2.5 mL of 18 M H2SO4 to measure labile carbon. This resulted in an acid–aqueous solution with a ratio of 1:0.25.

2.4. Statistical Analysis

According to the results of aggregate distribution measured by the wet sieving method, common indexes such as mean weight diameter (MWD), geometric mean diameter (GMD) and fractal dimension (D) of the aggregates were calculated to determine the stability of the aggregates [39].
M W D = ( i = 1 h X i × m i ) / m
G W D = exp ( i = 1 h m i × ln x i / m )  
where h  refers to the number of sieves, m i refers to the weight of each particle size aggregate (g), X i   is the mean diameter of each particle size aggregate (mm) and m is the total weight of the soil sample (g).
D = 3 ( l o g 10 ( w i / m ) ) / ( log 10 ( X i / X m a x ) )
where w i is the cumulative weight (g) with a diameter of less than X i , m is the total weight of the sample (g), X i   is the average diameter of each particle size aggregate (mm) and X m a x   is the mean diameter of the maximum soil particle size (mm).
C o n t r i b u t i o n s   t o   t o t a l   S O C   c o n t e n t = O C s a × P i / O C s b × 100 %
where O C s a   is the content of aggregate-associated OC, O C s b   is the content of OC in the bulk soil and P i refers to the proportion (%) of each particle size aggregate to the total sample.
C o n t r i b u t i o n s   t o   l a b i l e   c a r b o n   f r a c t i o n = L C s a × P i / L C s b × 100 %
where L C s a   is the stocks of aggregate-associated labile carbon, L C s b is the stocks of labile carbon and P i refers to the proportion (%) of each particle size aggregate to the total sample.
We performed all statistical analysis in the SPSS 25.0 statistical software package, with a significance level of p < 0.05. We used one-way analysis of variance (ANOVA) to test the effect of the water level on the content and stability of soil aggregates, SOC content and labile carbon content in the soil fractions. Fisher’s least significant difference test (LSD) was used to compare the differences in those soil properties for the three water levels. The independent-samples T test was used to compare the differences in those soil properties between the two soil depths.

3. Results

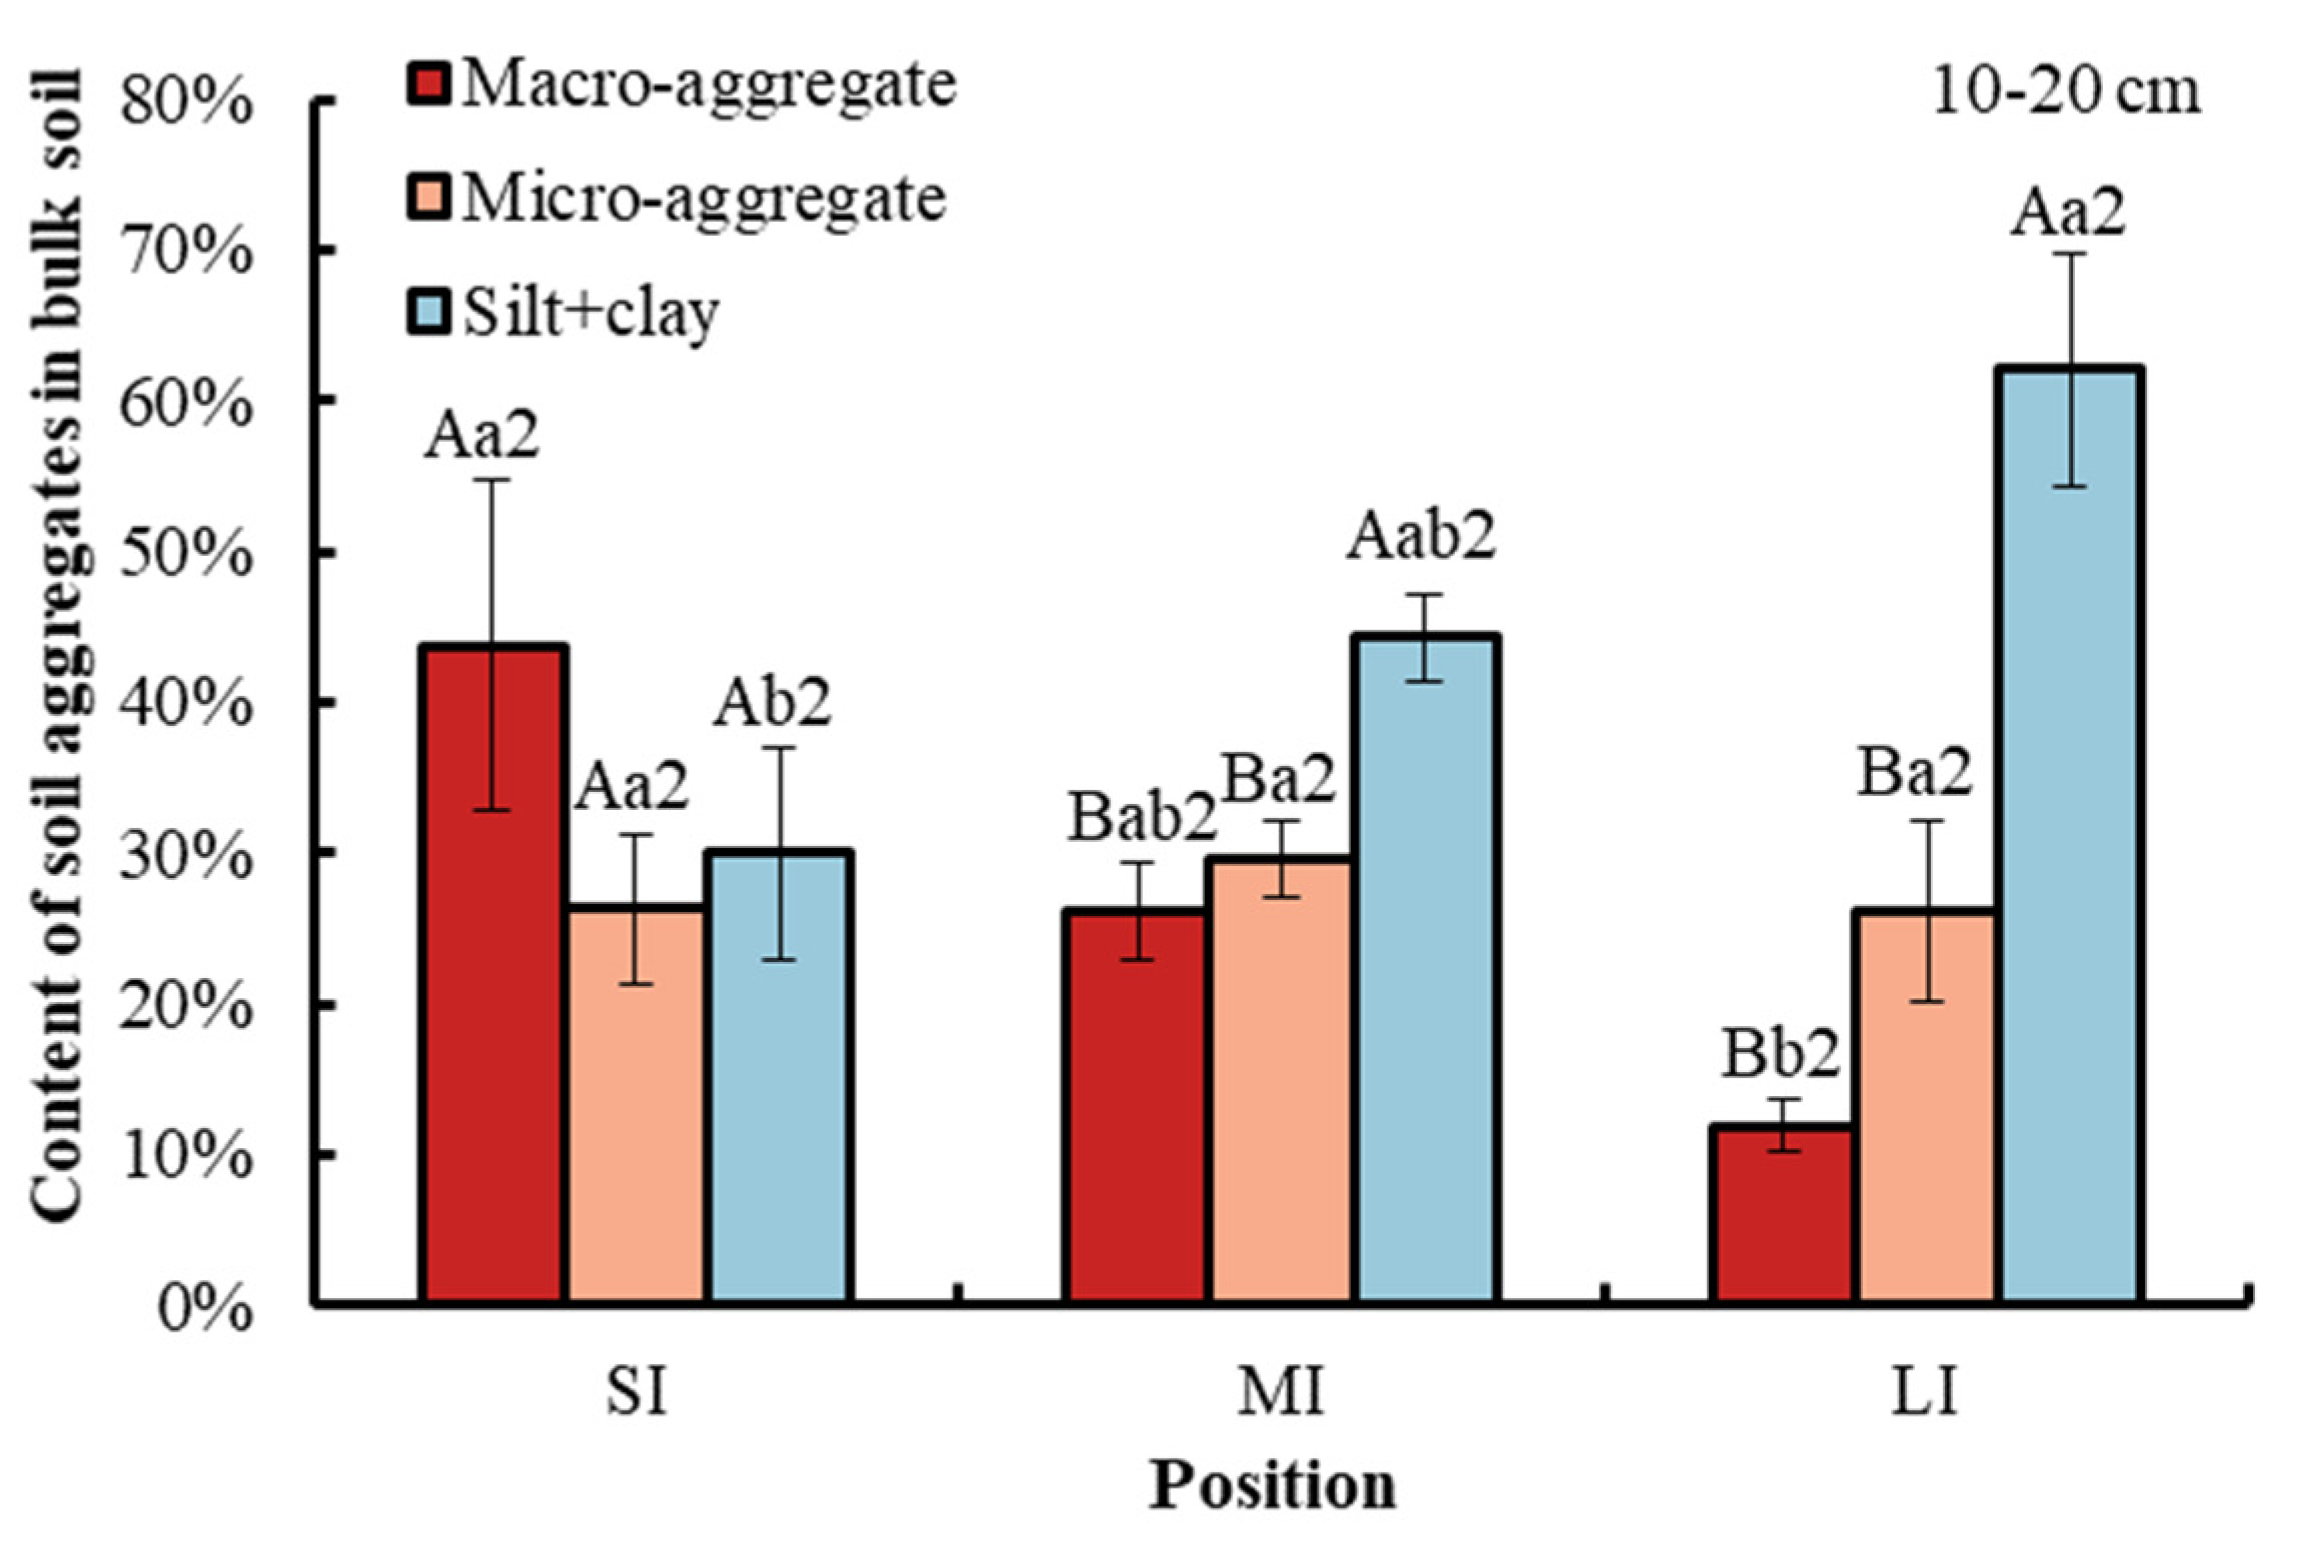
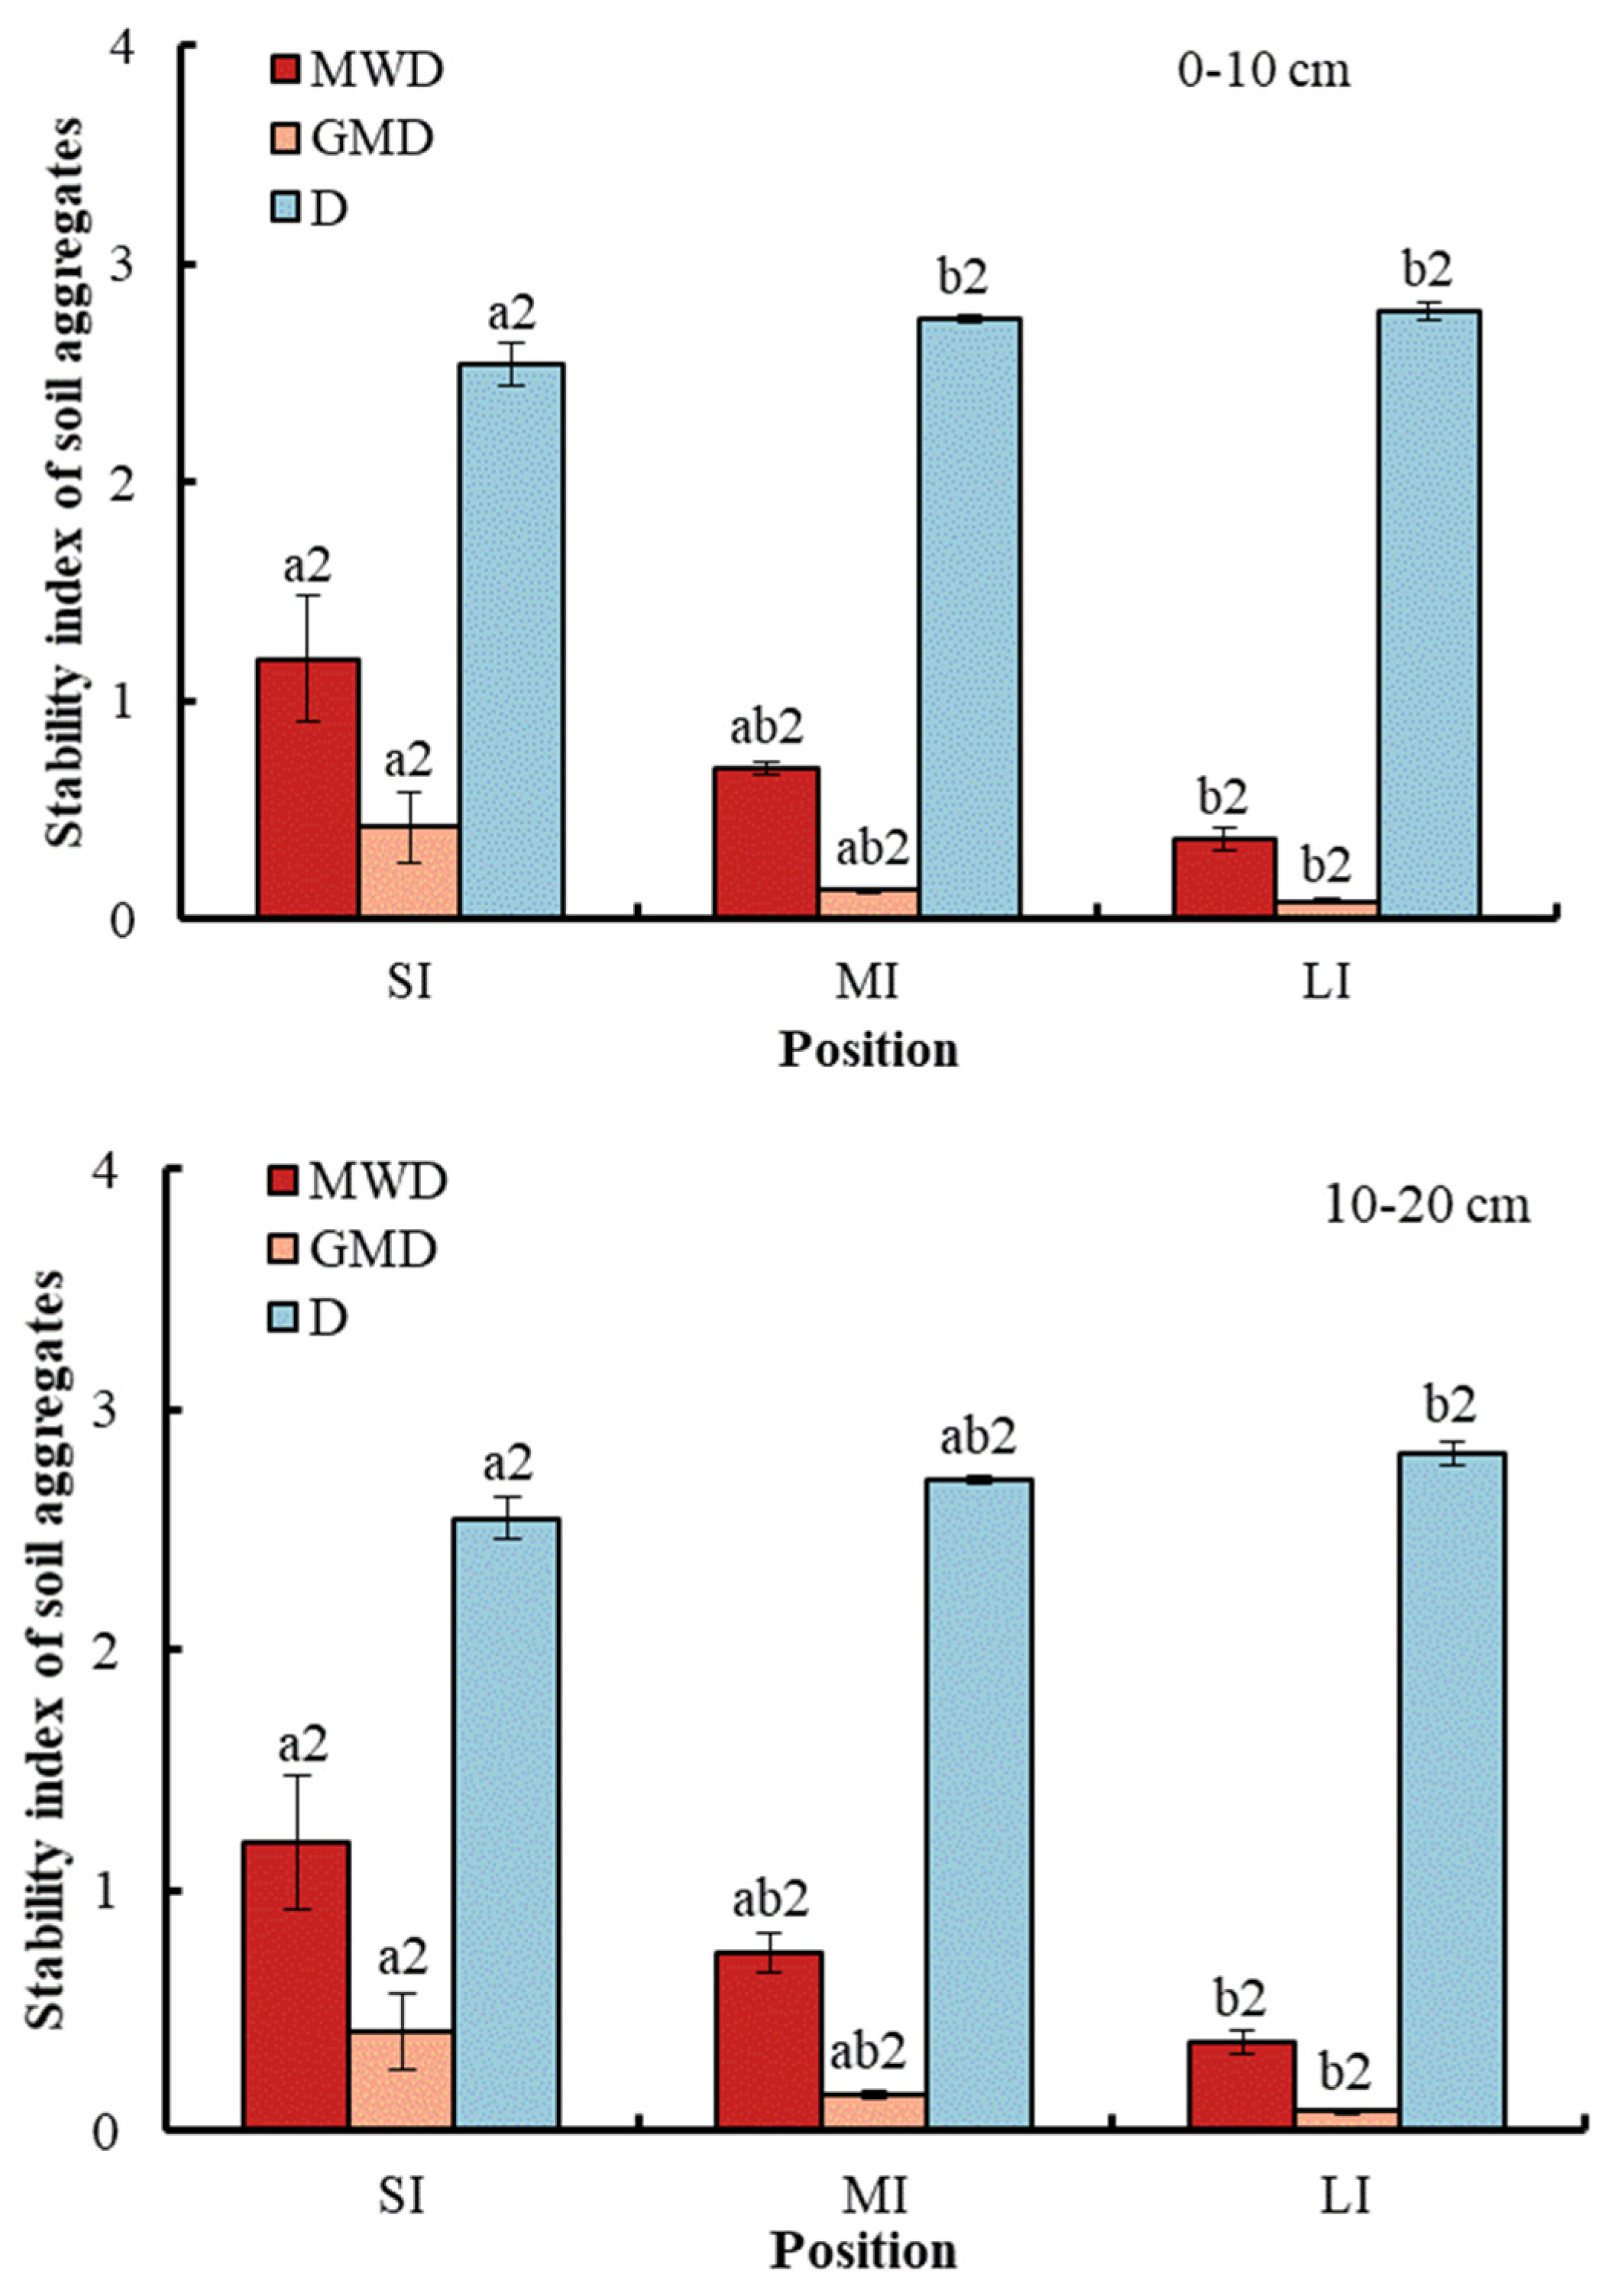
3.1. Content and Stability of Different Soil Aggregates in the Bulk Soil

Compared with macro-aggregate and micro-aggregate, the content of the silt and clay fraction in the bulk soil was obviously higher in the LI and MI regions at a depth of 0–20 cm in the WLFZ. Compared with macro-aggregate, the content of micro-aggregate was significantly higher in the LI region at a depth of 0–10 cm. However, there was no obvious difference between macro-aggregate and micro-aggregate at a depth of 10–20 cm (Figure 2). Elevations from SI to LI significantly decreased macro-aggregate content in the bulk soil by 32.33% at a depth of 0–10 cm and by 31.95% at a depth of 10–20 cm. By comparison, the content of silt and clay fraction was significantly increased by 23.73% at a 0–10 cm soil depth and by 32.12% at a 10–20 cm soil depth, while the micro-aggregate did not show any significant variations among the three water levels. There was no significant difference in soil aggregate content between the two soil depths.
With respect to soil stability, conversion from SI to LI significantly reduced the MWD and GMD of the aggregate, while the D of the aggregates was significantly increased (Figure 3). Specifically, compared with SI, the MWD and GMD at a depth of 0–10 cm in the fluctuation zone decreased by 68.91% and 80.95%, respectively, while D significantly increased by 9.45%. Similarly, compared with SI, the MWD and GMD at a depth of 10–20 cm in the fluctuation zone decreased by 69.17% and 80.49%, respectively, while D significantly increased by 10.59%. There was no significant difference in soil stability between the two soil depths.

3.2. Total SOC Content in the Bulk soil and Different Particle Size Aggregates

WLF and soil depth obviously affected total SOC content in the bulk soil and different particle size aggregates (Figure 4). At a 0–10 cm soil depth in the fluctuation zone, the organic carbon content in the bulk soil and macro-aggregate was significantly lower in the SI region compared to the MI and LI regions. At a 10–20 cm soil depth in the fluctuation zone, the organic carbon content in the bulk soil and macro-aggregate was significantly higher in the LI region compared to the SI and MI regions. With respect to soil depth, compared with 0–10 cm, the SOC content in soil fractions in the MI region was significantly lower at 10–20 cm. In the MI and LI regions, compared with other soil fractions, total SOC content in the macro-aggregate was significantly higher, whereas at a depth of 10–20 cm in the MI region, there was no significant difference among bulk soil, macro-aggregate, and silt and clay fraction. No obvious change was observed in the SI region between bulk soil and soil aggregates.

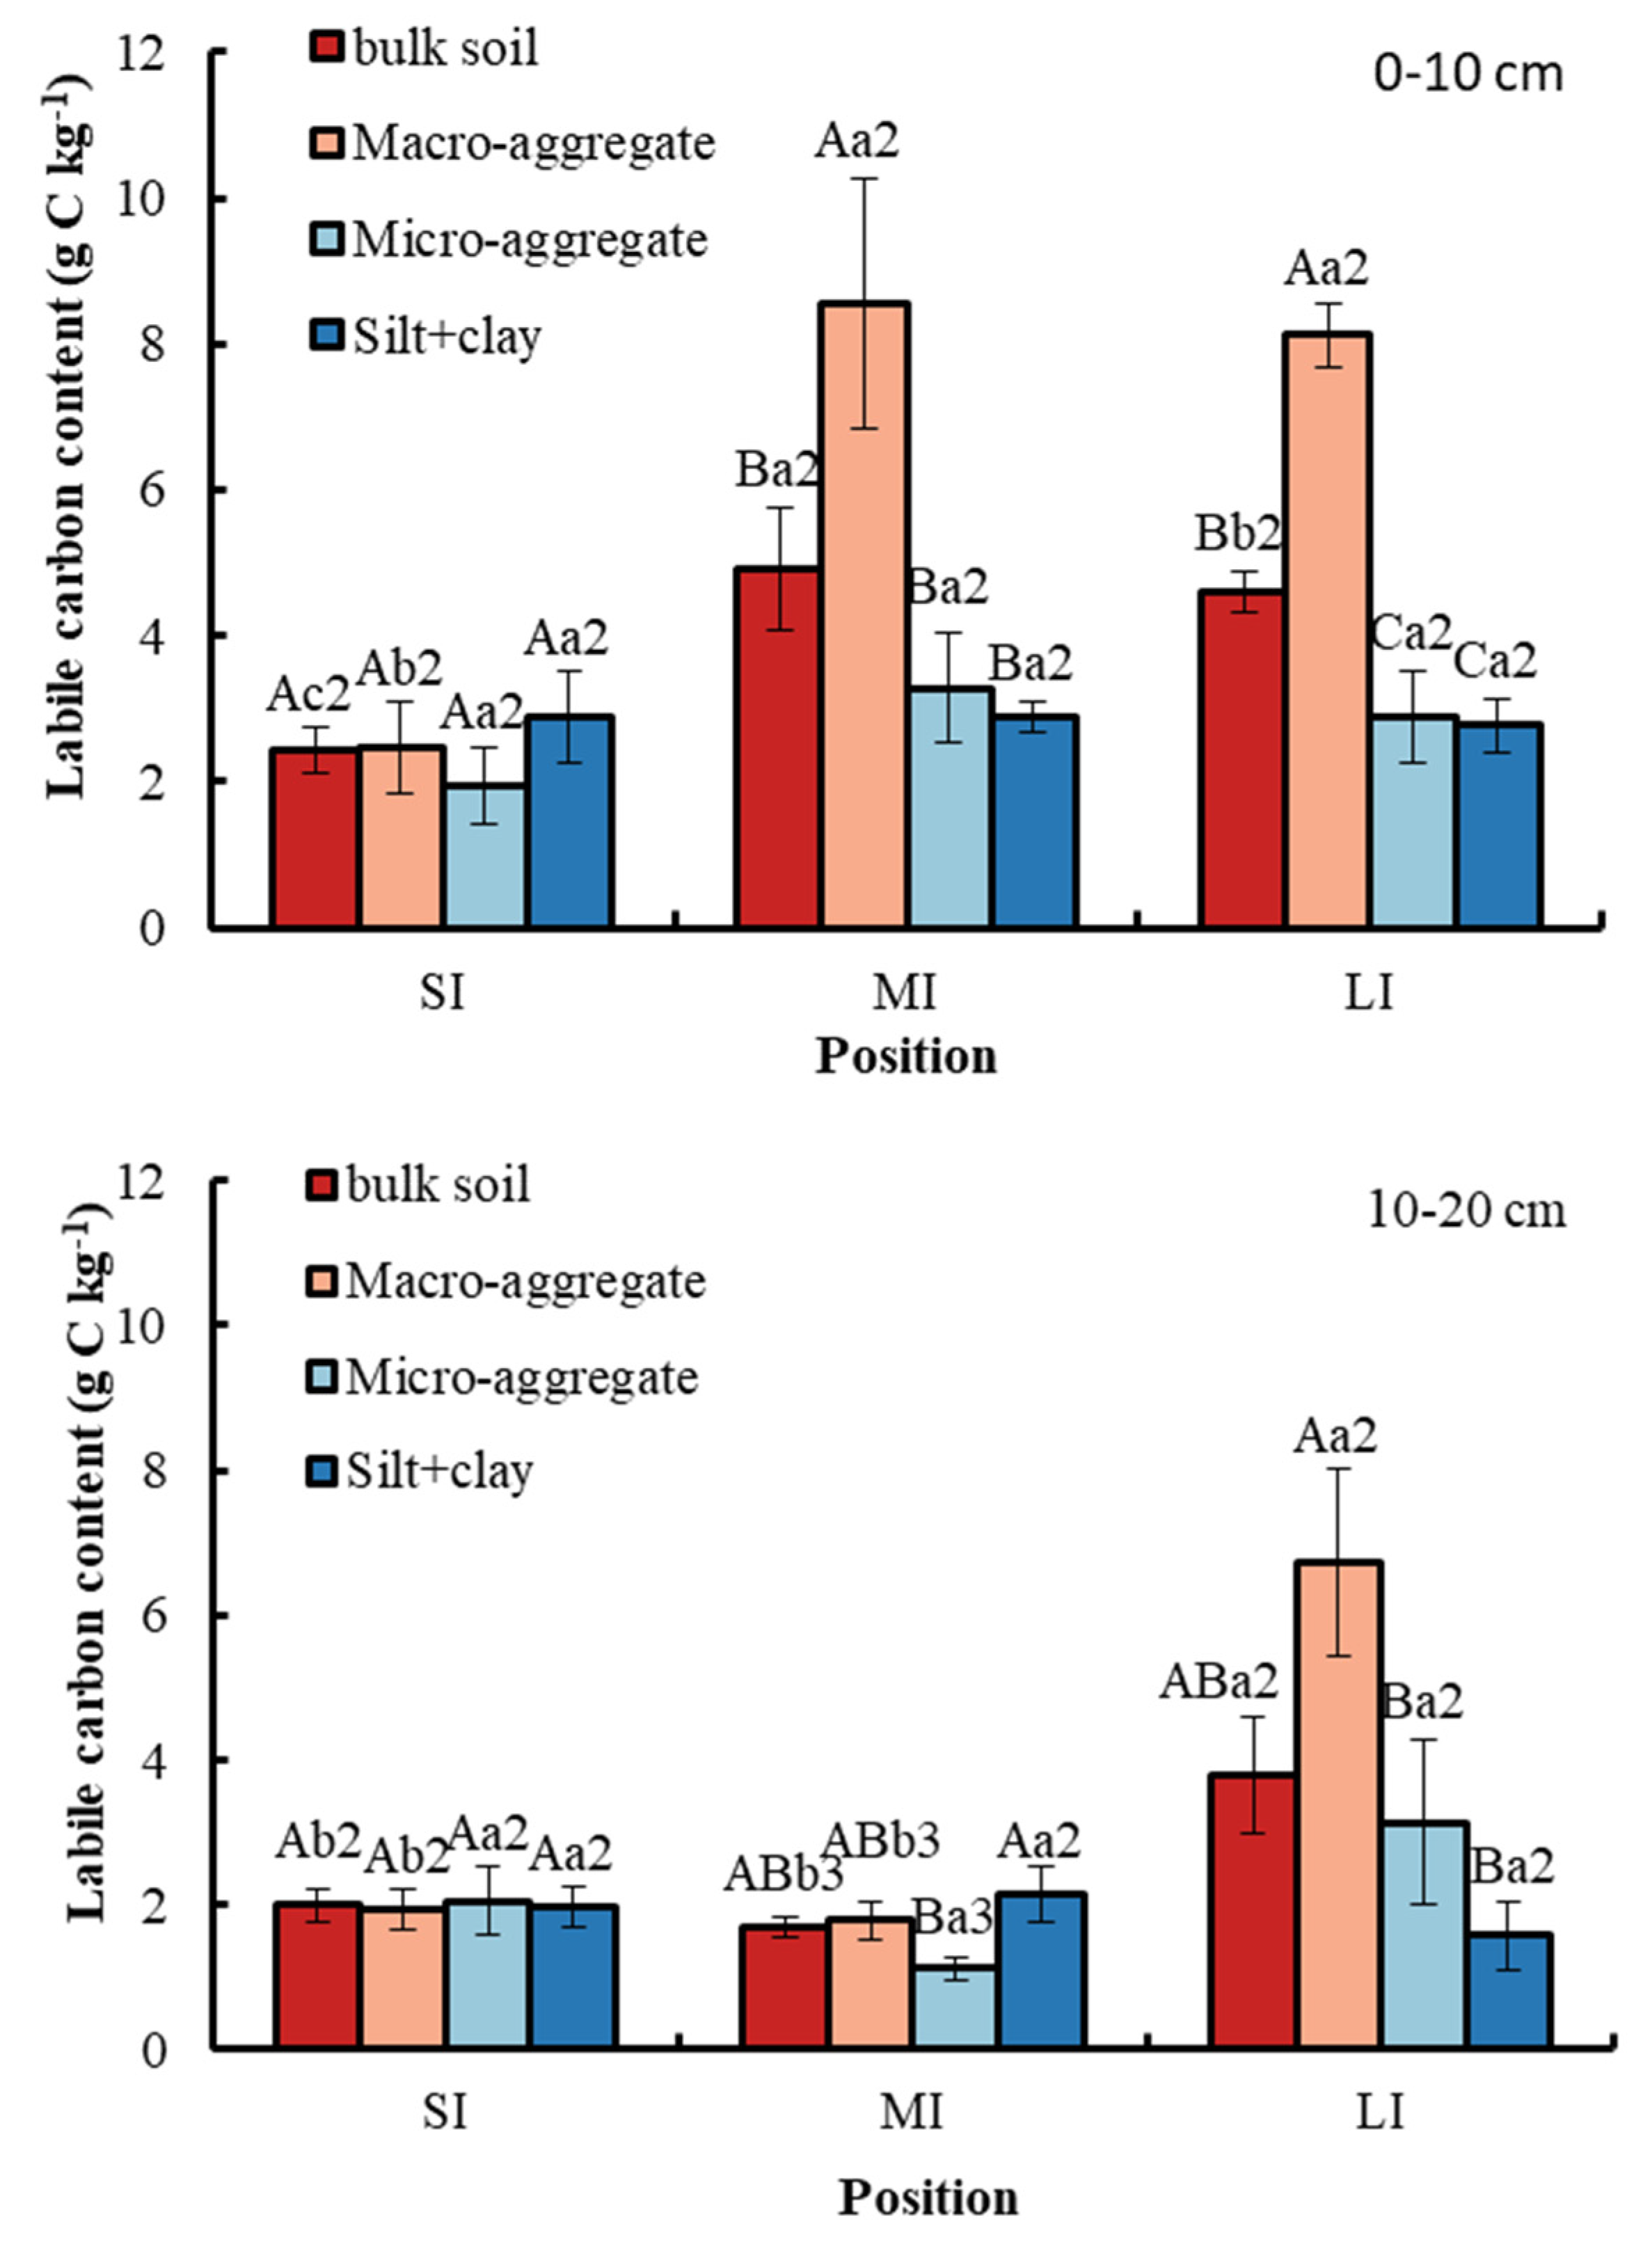
3.3. Labile Carbon Content in the Bulk Soil and Different Particle Size Aggregates

The macro-aggregate had the highest labile carbon content among the different particle size aggregates at a 0–10 cm soil depth in the MI and LI regions, which was 8.56 g kg−1 and 8.12 g kg−1, respectively (Figure 5). However, there was no obvious significance of labile carbon content among aggregates at a depth of 0–10 cm in the SI region. Similarly, the macro-aggregate had the highest labile carbon content among different particle size aggregates at a 10–20 cm soil depth in the LI region, which was 6.72 g kg−1. Moreover, the micro-aggregate had the smallest labile carbon content among different particle size aggregates at a 10–20 cm soil depth in the MI region, which was 1.12 g kg−1, while there was no significant difference in labile carbon among the other three soil fractions. There was no obvious significance in labile carbon content among the aggregates at a depth of 10–20 cm in the SI region. Additionally, conversion from SI to LI significantly increased the labile carbon content in bulk soil and macro-aggregate. With respect to soil depth, compared with 0–10 cm, the SOC content in bulk soil, macro-aggregate and micro-aggregate in the MI region was significantly lower at 10–20 cm.

3.4. Contributions of Different Particle Size Aggregates to SOC Sequestration

Conversion from SI to LI significantly increased the contribution of macro-aggregate to SOC sequestration by 20.61% at a 0–10 cm depth and by 25.72% at a 10–20 cm depth (Figure 6). In contrast, the contribution of the silt and clay fraction to SOC sequestration showed a downward trend. At a depth of 10–20 cm, during conversion from SI to MI, the contribution of micro-aggregate to SOC sequestration significantly decreased. With respect to soil depth, compared with a soil depth of 0–10 cm, the SOC contribution of macro-aggregate and silt and clay fraction to SOC sequestration in the MI region was significantly higher at 10–20 cm. In the LI region and the MI region at a 0–10 cm soil depth, macro-aggregate contributed the most to SOC sequestration. In the MI region at a 10–20 cm soil depth, micro-aggregate contributed the least to SOC sequestration. The contribution of soil fractions in the SI region to SOC sequestration was not significant.

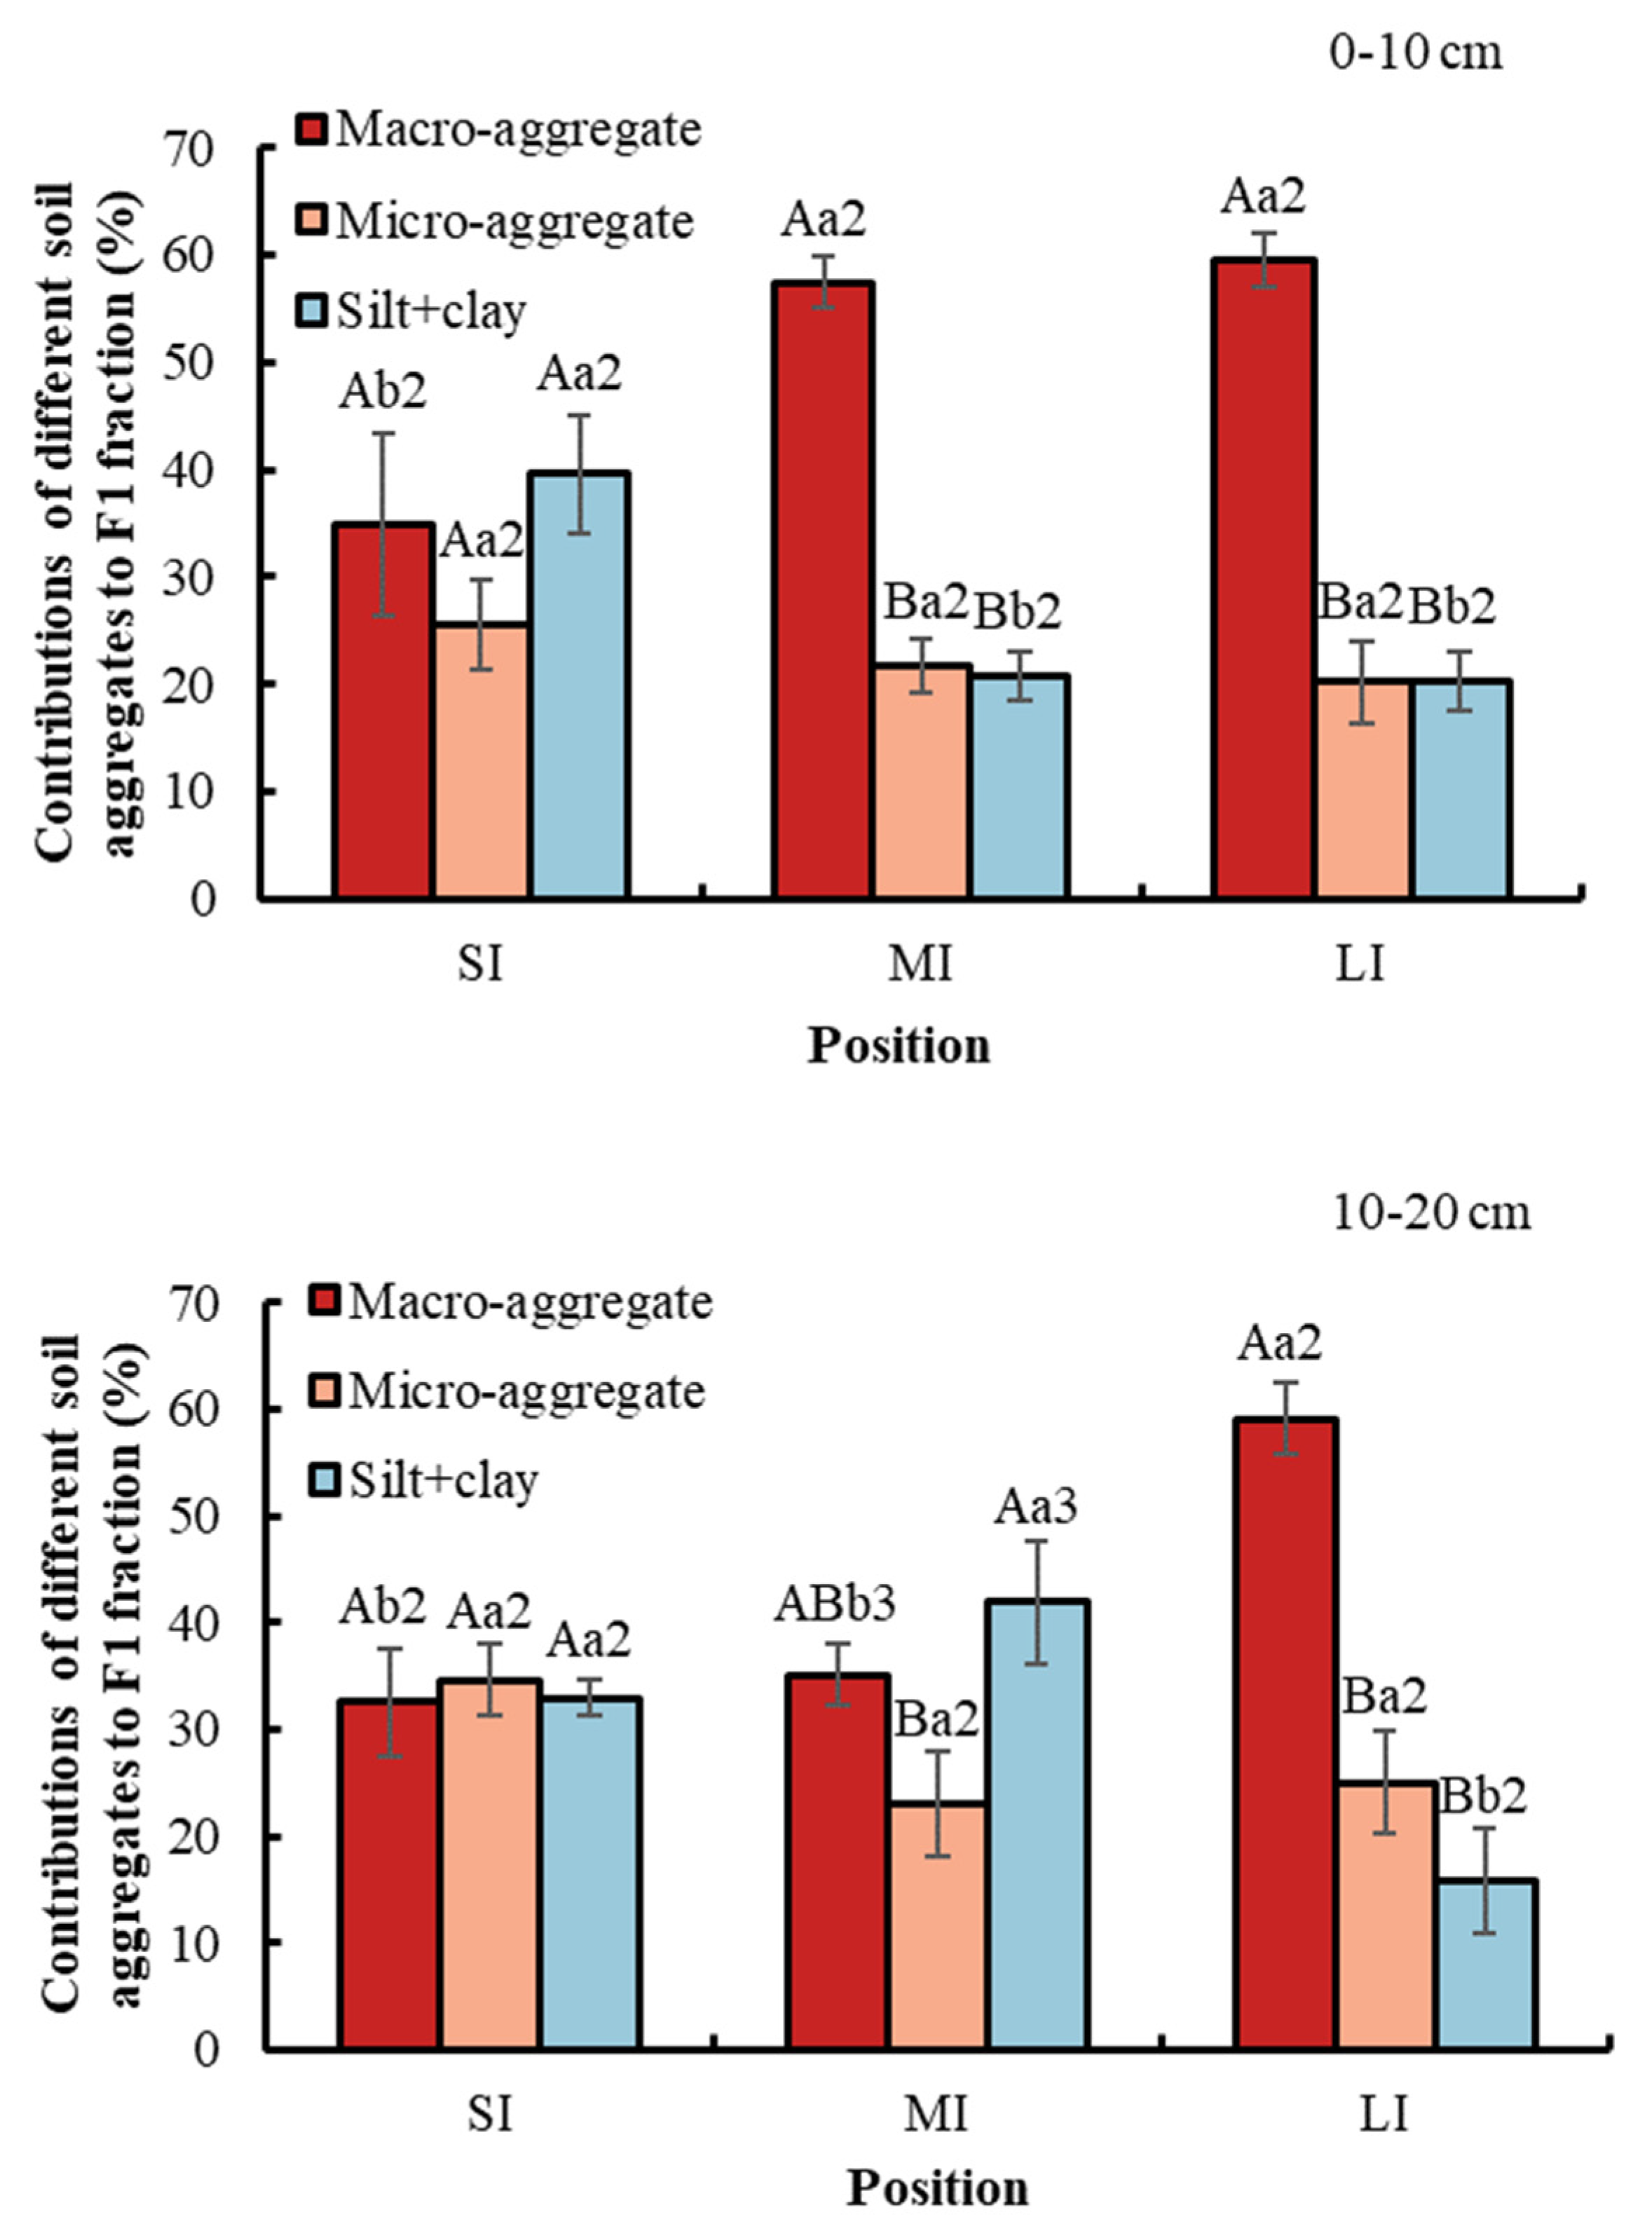
3.5. Contributions of Different Particle Size aggregates to Labile Carbon Fraction

Conversion from SI to MI and LI increased the contribution of macro-aggregate to the labile carbon fraction (Figure 7). By contrast, the contribution of the silt and clay fraction decreased. Moreover, in the SI region, the contribution of soil fractions to the labile carbon fraction was not significant. Besides this, in the LI region, the largest contribution to the labile carbon fraction was macro-aggregate, which was 61.42% at a 0–10 cm soil depth and 57.44% at a 10–20 cm soil depth, while the contribution of micro-aggregate and silt and clay fraction was not significant. Collectively, in the MI region at a 0–10 cm soil depth, macro-aggregate contributed the most to the labile carbon fraction, whereas in the MI region at a 10–20 cm soil depth, micro-aggregate contributed the least to the labile carbon fraction. With respect to soil depth, compared with soil depth at 0–10 cm, the SOC contribution of macro-aggregate and silt and clay fraction to the labile carbon fraction in the MI region was significantly higher at 10–20 cm.

4. Discussion

Purple soil is easy to disperse and decompose when it is exposed to water because of its poor structural water stability [28,41]. Both the erosion and vegetation reconstruction of purple soil in the TGR’s WLFZ have been reported by numerous studies [31,32,42]. Yet there is limited research on the characteristics of soil aggregates and aggregate-associated organic carbon in the WLFZ [33,43]. Using the modified Walkley and Black method to extract labile carbon from SOC provided a helpful way to measure the alternations of labile carbon after WLF [44]; hence we could better understand the effect of WLF on different particle size aggregates and aggregate-associated organic carbon. In our study, the content of macro-aggregate significantly decreased from SI to LI, while that of silt and clay significantly increased (Figure 2). These findings were in line with other studies and revealed that the alternation of dry and wet water levels in the WLFZ of the TGR has caused great damage to soil aggregates [9,45]. This may be related to the disintegration of aggregates caused by the rise and drop of water in the WLFZ [24,46,47]. Water quickly enters aggregates and compresses the air in the process of water flooding, leading to increasing internal pressure of aggregates, finally causing the disintegration of aggregates. In addition, with the increase in flooding depth and water pressure, the degree of softening and argillization of purple soil increased, and the dissipation of aggregates was enhanced. As a result, large size aggregates were broken into small size aggregates. Although the macro-aggregate content decreased from SI to LI, macro-aggregate content increased with an increase in soil depth at each water level, which was speculated to be due to the difference in soil root distribution patterns [39]. MWD, GMD and D are quantitative indexes to identify the structure stability of soil aggregates, which is highly correlated with soil corrosion resistance. The order of MWD and GMD were SI > MI > LI, while the order of D was SI < MI < LI (Figure 3), indicating that soil erosion resistance in the SI region was the strongest and in the LI region was the worst. Aggregate stability decreased significantly with a decrease in water-level elevation. Previous studies documented that topography and existing vegetation would exert an influence on soil erosion in the WLFZ [48,49]. Besides this, due to the short surface exposure time and steep slope in the LI area, soil nutrients will be continuously eroded by waves under suitable soil moisture conditions and cause a faster decomposition rate [50]. At the same time, the flat terrain of the SI can lead to high levels of nutrient deposition, thereby improving the aggregation and soil nutrient stability [51]. On the other hand, the LI region is dominated by newly born annual herbs. The latest water-level drop and slow vegetation growth can then result in thin and weak roots, thus reducing the plants. Short and sparse plants are ultimately not conductive to aggregate stability [52]. At the same time, the main vegetation community in the SI region is the Cynodon dactylon community, with developed roots and luxuriant growth [53]. The strong soil-fixing ability of plant roots and the strong adhesion of root exudates will inevitably promote the stability of aggregates. In summary, topography and existing vegetation may be the two major pathways helping to explain the difference in aggregate stability observed in the WLFZ [54].
Organic carbon content in soil aggregates can represent soil organic matter balance and mineralization rate, which are vital for soil quality and the soil carbon sink [39]. Compared with the SI region in the WLFZ, the SOC content in the LI region was obviously higher (Figure 4). On the one hand, the rise in the water level in the lower part of the WLFZ leads to a large amount of sediment deposition, which increases the source of nutrients; on the other hand, if the water level stays for a long time, various nutrients will be deposited to a relatively high degree. In addition, Fierer et al. (2002) and Cosentino et al. (2006) reported that soil drying and rewetting exerted significant pressure on soil microbial communities, and thus changed the SOC content under different water levels [55,56]. It has been reported that SOC content in different particle size aggregates varied obviously [20]. From SI to LI, although SOC content in macro-aggregate significantly increased, changes in SOC content in the other two particle size aggregates were not obvious. In general, SOC content in macro-aggregate was higher compared with other soil aggregates. Our findings were supported by earlier research reported by Mustafa et al. (2020) in southern China and by Somasundaram et al. (2018) in central India [57,58]. The significant difference between macro-aggregate and other fractions can be attributed to the extent to which organic carbon is protected by the aggregates [59]. Specifically, macro-aggregate was mainly composed of micro-aggregate or peripheral basic particles that are entered by fresh organic matter [57], which is thus less vulnerable to microbial decomposition and ultimately causes higher SOC content. On the other hand, there is less easily decomposed organic matter in the micro-aggregate and silt and clay fraction, leading to low organic matter content.
The labile carbon fraction was easily oxidized and can make a contribution to macro-aggregate formation and nutrient cycling [60]. Moreover, labile carbon, which had quick mineralization and a fast turnover, could exert a dramatic impact on global carbon cycling [61,62]. Previous studies have shown that carbon content usually increases within several days after dry soil is rewetted [63]. Moreover, compared with the relatively large but stable organic carbon, labile carbon accounts for a small proportion of total SOC (<20% of total SOC) [64]. Therefore, a change in labile carbon after an environmental change is easy to observe [37]. In the recent study, the labile carbon of each aggregate in the SI region was not obviously different, while the labile carbon content of macro-aggregate was obviously higher compared with other aggregates at 0–10 cm in the MI region and 0–20 cm in the LI region (Figure 5). The highest content of labile carbon indicated that the stability of SOC in the macro-aggregate was worse than that in other aggregates [36]. Thus, macro-aggregate in the LI region was not conductive to SOC sequestration. Previous research has reported that an increase in carbon and labile carbon content was conductive for the formation of macro-aggregate, and the formation of macro-aggregate can increase the stability of soil aggregates, thus improving soil erosion resistance [40]. The difference in labile carbon among different particle size aggregates resulted from the physico-chemical property of the soil and the soil ecological process affected by vegetation absorption. In addition, the difference in nutrient sources, nutrient deposition degree and the difficulty of different aggregates being decomposed by microorganisms caused by the fluctuation of the WLFZ may also be important factors [65,66]. This is consistent with the report of Cotrufo et al. (2013), who found that microorganisms could readily use labile carbon to create microbial products [67]. These products could then be strongly combined with the mineral soil matrix to encourage soil aggregation.
According to reports, aggregate-associated organic carbon can be stored in micro-aggregates for an extended amount of time or in macro-aggregates for a shorter amount of time [68]. In this study, the trend of aggregate contribution to carbon sequestration was consistent with the trend of aggregate organic carbon content. Furthermore, changes in the contribution of different aggregates to total organic carbon and labile carbon caused by WLF were more pronounced in macro-aggregate than the other two particle size aggregates (Figure 6 and Figure 7). Our results showed that macro-aggregate contributed the most to carbon sequestration, especially in the LI region, which may be attributed to the structure and formation of soil aggregate [59,69]. Fresh input into the soil preferentially forms macro-aggregate. Specifically, fine mineral particles are cemented into micro-aggregate, and various blinding agents enter the soil to bind to micro-aggregate to form macro-aggregate [70]. Organic carbon promotes soil aggregate consolidation, and soil aggregates physically protect organic carbon [21]. There was no obvious difference in the contribution of aggregates to SOC and labile carbon in the SI region and the MI region at a 10–20 cm soil depth. The contribution of macro-aggregate to SOC and labile carbon in the LI and MI regions at 0–10 cm soil depth was obviously greater than that of the other two particle size aggregates, whereas the contribution of other two aggregates to SOC and labile carbon was not significant. These results once again proved that macro-aggregate was the most active participant in the SOC sequestration process among different aggregates. Unfortunately, although we have studied the effects of WLF on SOC and organic carbon fraction in soil and soil fractions, the quantification of the stability of organic carbon in soil fractions has not been investigated, impeding accurate estimates and comprehension of SOC stability and sequestration [23]. On the other hand, Nsabimana et al. (2023) reported that the damage to aggregates caused by short-term infrequent water fluctuation was weaker compared with long-term frequent water fluctuation. Therefore, long-term frequent WLF was not conducive to soil carbon storage and soil health [28]. Considering the lack of long-term studies on the organic carbon content of aggregates in the Three Gorges area, we suggest that the time scale should be increased when studying the effect of WLF on SOC dynamics. With long-term observations, our understanding of soil–ecosystem interactions in dynamic environments like the TGR will be enhanced in terms of carbon capture and soil and water conservation.

5. Conclusions

The effects of WLF on soil distribution and fractal characteristics, soil aggregate organic carbon and labile carbon were quantitatively identified. Results showed that the trend of MWD and GMD was consistent with that of the proportion of macro-aggregate, the order of which was SI > MI > LI. By comparison, the trend of D was SI < MI < LI. Soil structure in the LI region was poor, while that in the SI region was better. Improving soil structure and increasing organic carbon content of soil aggregates in the LI region could improve soil erosion resistance and reduce soil erosion. WLF had a significant influence on the organic carbon of soil aggregates. The organic carbon content and labile carbon in the bulk soil and macro-aggregate in the SI region were obviously lower than those in the LI region, indicating that the fluctuation of water level in the LI region was beneficial to the increase in organic carbon content. The contribution of macro-aggregate to organic carbon and labile carbon was the largest in the fluctuation zone, and the contribution increased from SI to LI, indicating that the macro-aggregate was the most suitable for the increase in organic carbon. Increasing the content of macro-aggregate can effectively increase carbon sequestration in the fluctuation zone. Overall, these findings highlighted the importance of SOC dynamics in macro-aggregate to carbon sequestration, and were vital for further learning about the increase in organic carbon sequestration in the TGR’s WLFZ.

Author Contributions

Conceptualization, S.L., C.L., P.Y. and J.L.; methodology, L.J., X.S., C.L., H.T., F.Z. and Z.D.; software, F.Z., X.S., H.T., L.J. and L.M.; data curation, X.S., K.J., F.Z. and J.L.; resources, K.J., H.T., J.L., L.M. and Z.D.; writing—original draft, X.S.; writing—review and editing, K.J., Z.D., L.M., C.L., S.L. and P.Y.; supervision, S.L.; funding acquisition, S.L. All authors have read and agreed to the published version of the manuscript.

Funding

This work was supported by the National Natural Science Foundation of China (42171175) and the Natural Science Foundation of Chongqing (CSTB2022NSCQ-MSX0753, CSTB2022NSCQ-MSX1529, CSTB2022NSCQ-MSX1121 and CSTB2022NSCQ-MSX0280).

Data Availability Statement

The original contributions presented in the study are included in the article, further inquiries can be directed to the corresponding author.

Conflicts of Interest

The authors declare no conflicts of interest.

References

  1. Chen, C.; Cheng, H.; Jia, J.; Wang, X.; Zhao, J. Use it or not: An agroecological perspective to flooded riparian land along the Three Gorges Reservoir. Sci. Total Environ. 2019, 650, 1062–1072. [Google Scholar] [CrossRef]
  2. Ran, Y.; Ma, M.; Liu, Y.; Zhu, K.; Yi, X.; Wang, X.; Wu, S.; Huang, P. Physicochemical determinants in stabilizing soil aggregates along a hydrological stress gradient on reservoir riparian habitats: Implications to soil restoration. Ecol. Eng. 2020, 143, 105664. [Google Scholar] [CrossRef]
  3. Nsabimana, G.; Bao, Y.H.; He, X.B.; Nambajimana, J.D.D.; Wang, M.F.; Yang, L.; Li, J.L.; Zhang, S.J.; Khurram, D. Impacts of water level fluctuations on soil aggregate stability in the three Gorges reservoir, China. Sustainability 2020, 12, 9107. [Google Scholar] [CrossRef]
  4. Tang, Q.; Bao, Y.; He, X.; Fu, B.; Collins, A.L.; Zhang, X. Flow regulation manipulates contemporary seasonal sedimentary dynamics in the reservoir fluctuation zone of the Three Gorges. Sci. Total Environ. 2016, 548, 410–420. [Google Scholar] [CrossRef] [PubMed]
  5. Thomas, N.; Zongqiang, X. Impacts of large dams on riparian vegetation: Applying global experience to the case of China’s Three Gorges Dam. Biodivers. Conserv. 2008, 17, 3149–3163. [Google Scholar]
  6. Wang, F.; Yuan, X.Z.; Xiong, S.; Hang, Y.Z.; Liu, H.; Pan, Y.Z. Spatial patterns of biodiversity and hotspots in Chongqing Pengxi River Wetland Nature Reserve, China. Chin. J. Appl. Ecol. 2020, 31, 1682–1690. [Google Scholar]
  7. Jiang, P.; Shi, D.; Hu, X.; Huang, X.; Li, Y.; Guo, T. Soil stability characteristics of mulberry lands at hydro-fluctuation belt in the Three Gorges Reservoir area, China. Environ. Monit. Assess. 2015, 187, 634. [Google Scholar] [CrossRef]
  8. Su, X.; Nilsson, C.; Pilotto, F.; Liu, S.; Shi, S.; Zeng, B.O. Soil erosion and deposition in the new shorelines of the Three Gorges Reservoir. Sci. Total Environ. 2017, 599–600, 1485–1492. [Google Scholar] [CrossRef]
  9. Ran, Y.; Ma, M.; Liu, Y.; Zhou, Y.; Sun, X.; Wu, S.; Huang, P. Hydrological stress regimes regulate effects of binding agents on soil aggregate stability in the riparian zones. Catena 2021, 196, 104815. [Google Scholar] [CrossRef]
  10. Chen, S.Q.; Zhang, G.H.; Luo, Y.F.; Zhou, H.; Wang, K.W.; Wang, C.S. Soil erodibility indicators as affected by water level fluctuations in the Three Gorges Reservoir area, China. Catena 2021, 207, 105692. [Google Scholar] [CrossRef]
  11. Zhang, X.; Li, Y.H.; Ren, S.Y.; Zhang, X.F. Papers soil CO2 emissions and water level response in an arid zone lake wetland under freeze-thaw action. J. Hydrol. 2023, 625, 130069. [Google Scholar] [CrossRef]
  12. Yan, W.C.; Wang, Y.Y.; Ju, P.J.; Huang, X.Y.; Chen, H. Water level regulates the rhizosphere priming effects on SOM decomposition of peatland soil. Rhizosphere 2022, 21, 100455. [Google Scholar] [CrossRef]
  13. Wu, H.; Yu, Y.R.; Wang, J.Y.; Zhao, Y.B.; Gao, Y.F.; Li, X.L.; Bu, G.J.; Xue, D.; Wu, L. Lower water table increase shrub plant diversity and biomass but decrease soil organic carbon content: A case study of oligotrophic peatland in the Southwestern Hubei Province. Biol. Sci. 2023, 31, 22600. [Google Scholar] [CrossRef]
  14. Chen, K.L.; Huo, T.C.; Zhang, Y.W.; Guo, T.T.; Liang, J.Y. Response of soil organic carbon decomposition to intensified water variability co-determined by the microbial community and aggregate changes in a temperate grassland soil of northern China. Soil Biol. Biochem. 2023, 176, 108875. [Google Scholar] [CrossRef]
  15. Ran, Y.G.; Wu, S.J.; Jiang, Y.; Qu, J.F.; Herath, L.K.; Huang, P. The legacy effects of soil types on carbon content are erased by extreme flooding stress in a water-level drawdown zone. Catena 2023, 231, 107283. [Google Scholar] [CrossRef]
  16. Liu, Y.; Ma, M.H.; Wu, S.J.; Ran, Y.G.; Wang, X.X.; Hang, P. Research progress and prospect of soil aggregate stability under dry-wet alternation. Soils 2018, 50, 853–865. [Google Scholar]
  17. Zhang, H.L.; Qu, H.Y.; Huang, C.M.; Lei, H.; Li, H.X.; Jia, G.M. Organic carbon of soil aggregates in reservoir’s draw-down zone: Its response to water-level fluctuation. Environ. Sci. Technol. 2021, 44, 111–117. [Google Scholar]
  18. Nsabimana, G.; Bao, Y.H.; He, X.B.; Nambajimana, J.D.; Yang, L.; Li, J.L.; Uwiringiyimana, E.; Nsengumuremyi, P.; Ntacyabukura, T. Soil aggregate stability response to hydraulic conditions in water level fluctuation zone of the Three Gorges Reservoir, China. Catena 2021, 204, 105387. [Google Scholar] [CrossRef]
  19. Luo, Y.X.; Li, Y.X.; Leng, Z.Y.; Rao, J.B.; Huang, D.Y.; Yu, P.J. Dynamics of soil organic carbon fractions in soil aggregates of mollisols under different land-uses in northeast china. Fresenius Environ. Bull. 2021, 30, 4544–4552. [Google Scholar]
  20. Okolo, C.; Gebresamuel, G.; Zenebe, A.; Haile, M.; Eze, P.N. Accumulation of carbon in various soil aggregate sizes under different land use systems in a semi-arid environment. Agric. Ecosyst. Environ. 2020, 297, 106924. [Google Scholar] [CrossRef]
  21. Zhong, Z.K.; Han, X.H.; Xu, Y.D.; Zhang, W.; Fu, S.Y.; Liu, W.C.; Ren, C.J.; Yang, G.H.; Ren, G.X. Effects of land use change on organic carbon dynamics associated with soil aggregate fractions on the Loess Plateau, China. Land Degrad. Dev. 2019, 30, 1070–1082. [Google Scholar] [CrossRef]
  22. Cao, S.; Zhou, Y.Z.; Zhou, Y.Y.; Zhou, X.; Zhou, W.J. Soil organic carbon and soil aggregate stability associated with aggregate fractions in a chronosequence of citrus orchards plantations. J. Environ. Manag. 2021, 293, 112847. [Google Scholar] [CrossRef]
  23. Yu, P.J.; Li, Y.X.; Liu, S.W.; Liu, J.L.; Ding, Z.; Ma, M.G.; Tang, X.G. Afforestation influences soil organic carbon and its fractions associated with aggregates in a karst region of Southwest China. Sci. Total Environ. 2022, 814, 152710. [Google Scholar] [CrossRef] [PubMed]
  24. Liu, Y.; Ma, M.H.; Ran, Y.G.; Yi, X.; Wu, S.J.; Huang, P. Disentangling the effects of edaphic and vegetational properties on soil aggregate stability in riparian zones along a gradient of flooding stress. Geoderma 2021, 385, 114883. [Google Scholar] [CrossRef]
  25. Ran, Y.; Wu, S.J.; Zhu, K.; Li, W.J.; Liu, Z.M.; Huang, P. Soil types differentiated their responses of aggregate stability to hydrological stresses at the riparian zones of the Three Gorges Reservoir. J. Soils Sediments 2020, 20, 951–962. [Google Scholar] [CrossRef]
  26. Xue, B.; Huang, L.; Huang, Y.; Yin, Z.; Li, X.; Lu, J. Effects of organic carbon and iron oxides on soil aggregate stability under different tillage systems in a rice–rape cropping system. Catena 2019, 177, 1–12. [Google Scholar] [CrossRef]
  27. Al-Kaisi, M.M.; Douelle, A.; Kwaw-Mensah, D. Soil microaggregate and macroaggregate decay over, time and soil carbon change as influenced by different tillage systems. J. Soil Water Conserv. 2014, 69, 574–580. [Google Scholar] [CrossRef]
  28. Nsabimana, G.; Li, H.; Bao, Y.H.; Nambajimanna, J.D.; Li, J.L.; Ntacyabukura, T.; He, X.B. Soil aggregate disintegration effects on soil erodibility in the water level fluctuation zone of the Three Gorges Reservoir, China. Environ. Res. 2023, 217, 114928. [Google Scholar] [CrossRef] [PubMed]
  29. Hu, B.; Wang, Y.; Wang, B.; Wang, Y.; Liu, C.; Wang, C. Impact of drying-wetting cycles on the soil aggregate stability of Alfisols in southwestern China. J. Soil Water Conserv. 2018, 73, 469–478. [Google Scholar] [CrossRef]
  30. Xu, Q.X.; Wang, T.W.; Cai, C.F.; Li, Z.X.; Shi, Z.H. Effects of soil conservation on soil properties of citrus orchards in the Three-Gorges Area, China. Land Degrad. Dev. 2012, 23, 34–42. [Google Scholar] [CrossRef]
  31. Cui, J.F.; Tang, X.Y.; Zhang, W.; Liu, C.D. The effects of timing of inundation on soil physical quality in the water-level fluctuation zone of the Three Gorges Reservoir Region, China. Vadose Zone J. 2018, 17, 1–12. [Google Scholar] [CrossRef]
  32. Zhu, K.; Li, W.J.; Yang, S.; Ran, Y.G.; Lei, X.H.; Ma, M.H.; Wu, S.J.; Hang, P. Intense wet-dry cycles weakened the carbon sequestration of soil aggregates in the riparian zone. Catena 2022, 212, 106117. [Google Scholar] [CrossRef]
  33. Jia, G.M.; He, L.; Liu, X.; Dan, F.J.; Chen, F.Q. Characteristics of Soil Oxidizable Stable Organic Carbon in Riparian of Three Gorges Reservoir Area. Res. Soil Water Conserv. 2016, 23, 14–19. [Google Scholar]
  34. Kayranli, B.; Scholz, M.; Mustafa, A.; Hedmark, A. Carbon Storage and Fluxes within Freshwater Wetlands: A Critical Review. Wetlands 2010, 30, 111–124. [Google Scholar] [CrossRef]
  35. Chan, K.Y.; Bowman, A.; Oatea, A. Oxidizible organic carbon fractions and soil quality changes in an oxic paleustalf under different pasture leys. Soil Sci. 2001, 166, 61–67. [Google Scholar] [CrossRef]
  36. Yu, P.J.; Han, K.X.; Li, Q.; Zhou, D.W. Soil organic carbon fractions are affected by different land use in an agro-pastoral transitional zone in Northern China. Ecol. Indic. 2017, 73, 331–337. [Google Scholar] [CrossRef]
  37. Luo, Y.X.; Li, Y.X.; Liu, S.W.; Yu, P.J. Effects of vegetation succession on soil organic carbon fractions and stability in a karst valley area, Southwest China. Environ. Monit. Assess. 2022, 194, 562. [Google Scholar] [CrossRef]
  38. Wu, J.M.; Ji, X.H.; Huo, L.J.; Peng, H.; Liu, Y. Fraction changes of oxidation organic carbon in paddy soil and its correlation with CH4 emission fluxes. Acta Ecol. Sin. 2013, 33, 4599–4607. [Google Scholar]
  39. Li, Y.X.; Yu, P.J.; Shen, L.C. Changes in soil aggregate stability and aggregate-associated organic carbon during old-field succession in karst valley. Environ. Monit. Assess. 2022, 194, 15. [Google Scholar] [CrossRef]
  40. Yu, P.J.; Liu, J.L.; Tang, H.Y.; Sun, X.Z.; Liu, S.W.; Tang, X.G.; Ding, Z.; Ma, M.G.; Ci, E. Establishing a soil quality index to evaluate soil quality after afforestation in a karst region of Southwest China. Catena 2023, 230, 107237. [Google Scholar] [CrossRef]
  41. Zhong, S.Q.; Han, Z.; Duo, J.; Ci, E.; Ni, J.P.; Xie, D.T.; Wei, C.F. Relationships between the lithology of purple rocks and the pedogenesis of purple soils in the Sichuan Basin, China. Sci. Rep. 2019, 9, 13272. [Google Scholar] [CrossRef]
  42. Zhang, S.J.; Tang, Q.; Bao, Y.H.; He, X.B.; Tian, F.X.; Lu, F.Y.; Wang, M.F.; Anjum, R. Effects of seasonal water-level fluctuation on soil pore structure in the Three Gorges Reservoir, China. J. Mt. Sci. 2018, 15, 2192–2206. [Google Scholar] [CrossRef]
  43. Denef, K.; Zotarelli, L.; Boddey, R.M.; Six, J. Microaggregate-associated carbon as a diagnostic fraction for management-induced changes in soil organic carbon in two Oxisols. Soil Biol. Biochem. 2007, 39, 1165–1172. [Google Scholar] [CrossRef]
  44. Jiang, K.; Jia, Y.; Yang, Y.; Chen, Q.; Yu, P. Effects of land change on soil aggregate stability and soil aggregate organic carbon in karst area of Southwest China. Environ. Sci. 2023, 1–11. [Google Scholar] [CrossRef]
  45. Zhang, S.J.; Chen, T.Y.; Bao, Y.H.; Tang, Q.; Li, Y.T.; He, X.B. The impacts of the hydrological regime on the soil aggregate size distribution and stability in the riparian zone of the Three Gorges Reservoir, China. Water 2023, 15, 1791. [Google Scholar] [CrossRef]
  46. Guo, P.; Xiao, H.; Gao, F.; Li, Z.J.; Hu, H.; Zhang, Q.H.; Xia, Z.Y.; Li, M.Y.; Yang, Y.S. The vertical heterogeneity of soil detachment by overland flow on the water-level fluctuation zone slope in the Three Gorges Reservoir, China. Hydrol. Process 2021, 35, 14282. [Google Scholar] [CrossRef]
  47. Bao, Y.H.; Yu, Y.T.; Tang, Q.; He, X.B.; Wei, J.; Hu, Y.H.; Li, J.L. Combined effects of hillslope–concentrated flows and riverine stream waves on soil erosion in the reservoir riparian zone. Water 2022, 13, 3465. [Google Scholar] [CrossRef]
  48. Bao, Y.H.; He, X.B.; Wen, A.B.; Gao, P.; Tang, Q.; Yan, D.C.; Long, Y. Dynamic changes of soil erosion in a typical disturbance zone of China’s Three Gorges Reservoir. Catena 2018, 169, 128–139. [Google Scholar] [CrossRef]
  49. Xu, W.X.; Yang, L.; Bao, Y.H.; Li, J.L.; Wei, J. Soil anti-scourability enhanced by herbaceous species roots in a reservoir water level fluctuation zone. J. Mt. Sci. 2021, 18, 392–406. [Google Scholar] [CrossRef]
  50. Wang, Y.J.; Chen, F.Q.; Zhang, M.; Wu, Y.; Chen, S.H. Characteristics of soil nutrient and spatial distribution on riparian zone restored by different vegetation restoration methods at Wanzhou section in the Three Gorges Reservoir area, China. J. Agric. Resour. Econ. 2016, 33, 127–133. [Google Scholar]
  51. Jia, G.M.; Liu, X. Soil microbial biomass and metabolic quotient across a gradient of the duration of annually cyclic drainage of hillslope riparian zone in the Three Gorges Reservoir area. Ecol. Eng. 2017, 99, 366–373. [Google Scholar] [CrossRef]
  52. Peres, G.; Cluzeau, D.; Menasseri, S.; Soussana, J.F.; Bessler, H.; Engels, C.; Habekost, M.; Gleixner, G.; Weigelt, A.; Weisser, W.W.; et al. Mechanisms linking plant community properties to soil aggregate stability in an experimental grassland plant diversity gradient. Plant Soil 2013, 373, 285–299. [Google Scholar] [CrossRef]
  53. Lu, Z.C.; Bao, X.Y.; Liu, X.; Zhang, H.L.; Xiang, H.Y. Stability of soil aggregates in riparian zone of the Three Gorges Reservoir studied using the le bissonnais method. J. Irrig. Drain. Eng. 2018, 37, 115–120. [Google Scholar]
  54. Zhang, S.J.; He, X.B.; Bao, Y.H.; Tang, Q. Change Characteristics of Soil Aggregates at Different Water Level in the Water-level Fluctuation Zone of the Three Gorges Reservoir. Res. Soil Water Conserv. 2021, 28, 25–30. [Google Scholar]
  55. Fierer, N.; Schimel, J.P. Effects of drying-rewetting frequency on soil carbon and nitrogen transformations. Soil Biol. Biochem. 2002, 34, 777–787. [Google Scholar] [CrossRef]
  56. Cosentino, D.; Chenu, C.; Le Bissonnais, Y. Aggregate stability and microbial community dynamics under drying-wetting cycles in a silt loam soil. Soil Biol. Biochem. 2006, 38, 2053–2062. [Google Scholar] [CrossRef]
  57. Mustafa, A.; Xu, M.G.; Shah, S.A.A.; Abrar, M.M.; Sun, N.; Wang, B.W.; Cai, Z.J.; Saeed, Q.; Naveed, M.; Mehmood, K.; et al. Soil aggregation and soil aggregate stability regulate organic carbon and nitrogen storage in a red soil of southern China. J. Environ. Manag. 2020, 270, 110894. [Google Scholar] [CrossRef] [PubMed]
  58. Somasundaram, J.; Chaudhary, R.S.; AwanishKumar, D.; Biswas, A.K.; Sinha, N.K.; Mohanty, M.; Hati, K.M.; Jha, P.; Sankar, M.; Patra, A.K.; et al. Effect of contrasting tillage and cropping systems on soil aggregation, carbon pools and aggregate-associated carbon in rainfed vertisols. Eur. J. Soil Sci. 2018, 69, 879–891. [Google Scholar] [CrossRef]
  59. Bai, Y.X.; Zhou, Y.C.; He, H.Z. Effects of rehabilitation through afforestation on soil ag-agregate stability and aggregate-associated carbon after forest fires in subtropical China. Geoderma 2020, 376, 114548. [Google Scholar] [CrossRef]
  60. Barreto, P.A.B.; Gama-Rodrigues, E.F.; Gama-Rodrigues, A.C.; Fontes, A.G.; Polidoro, J.C.; Moço, M.K.S.; Machado, R.C.R.; Baligar, V.C. Distribution of oxidizable organic C fractions in soils under cacao agroforestry systems in Southern Bahia, Brazil. Agrofor. Syst. 2011, 81, 213–220. [Google Scholar] [CrossRef]
  61. Mclauchlan, K.K.; Hobbie, S.E. Comparison of labile soil organic matter fractionation techniques. Soil Sci. Soc. Am. J. 2004, 68, 1616–1625. [Google Scholar] [CrossRef]
  62. Sprunger, C.D.; Robertson, G.P. Early accumulation of active fraction soil carbon in newly established cellulosic biofuel systems. Geoderma 2018, 318, 42–51. [Google Scholar] [CrossRef]
  63. Franzluebbers, A.; Haney, R.; Honeycutt, C.; Schomberg, H.; Hons, F. Flush of carbon dioxide following rewetting of dried soil relates to active organic pools. Soil Sci. Soc. Am. J. 2000, 64, 613–623. [Google Scholar] [CrossRef]
  64. Diederich, K.M.; Ruark, M.D.; Krishnan, K.; Arriaga, F.J.; Silva, E.M. Increasing labile soil carbon and nitrogen fractions require a change in system, rather than practice. Soil Sci. Soc. Am. J. 2019, 83, 1733–1745. [Google Scholar] [CrossRef]
  65. Gao, L.Q.; Bowker, M.A.; Xu, M.X.; Sun, H.; Tuo, D.F.; Zhao, Y.G. Biological soil crusts decrease erodibility by modifying inherent soil properties on the Loess Plateau, China. Soil Biol. Biochem. 2017, 105, 49–58. [Google Scholar] [CrossRef]
  66. Haydu-Houdeshell, C.A.; Graham, R.C.; Hendrix, P.F.; Peterson, A.C. Soil aggregate stability under chaparral species in southern California. Geoderma 2018, 310, 201–208. [Google Scholar] [CrossRef]
  67. Cotrufo, M.F.; Wallenstein, M.D.; Boot, C.M.; Denef, K.; Paul, E. The microbial efficiency-matrix stabilization (MEMS) framework integrates plant litter decomposition with soil organic matter stabilization: Do labile plant inputs form stable soil organic matter? Glob. Chang. Biol. 2013, 19, 988–995. [Google Scholar] [CrossRef]
  68. Gelaw, A.M.; Singh, B.R.; Lal, R. Organic carbon and nitrogen associated with soil aggregates and particle sizes under different land uses in Tigray, northern Ethiopia. Land Degrad. Dev. 2015, 26, 690–700. [Google Scholar] [CrossRef]
  69. Qiu, L.P.; Wei, X.R.; Gao, J.L.; Zhang, X.C. Dynamics of soil aggregate-associated organic carbon along an afforestation chronosequence. Plant Soil 2015, 391, 237–251. [Google Scholar] [CrossRef]
  70. Erktan, A.; C’ecillon, L.; Graf, F.; Roumet, C.; Legout, C.; Rey, F. Increase in soil aggregate stability along a Mediterranean successional gradient in severely eroded gully bed ecosystems: Combined effects of soil, root traits and plant community characteristics. Plant Soil 2016, 398, 121–137. [Google Scholar] [CrossRef]
Figure 1. The sampling site in the Three Gorges Reservoir (a), satellite view of the study area (b) and the elevation changes caused by variations in water level (c). SI: upper part of the WLFZ; MI: middle part of the WLFZ; LI: lower part of the WLFZ.
Land 13 00313 g001
Figure 2. Content of different particle size aggregates at water levels under study. Error bar shows standard error. A, B and C (in the figure of 0–10 cm soil depth) show statistical differences across soil aggregates at p < 0.05; a and b show statistical variations in water levels at p < 0.05. The number 2 indicates no statistical difference in soil depth at p < 0.05. SI: upper part of the WLFZ (165 m); MI: middle part of the WLFZ (155 m); LI: lower part of the WLFZ (145 m).
Land 13 00313 g002aLand 13 00313 g002b
Figure 3. Stability indexes of soil aggregates at different water levels. Error bar shows standard error; a and b show statistical variations in water levels at p < 0.05. The number 2 shows no statistical difference in soil depth at p < 0.05. SI: upper part of the WLFZ (165 m); MI: middle part of the WLFZ (155 m); LI: lower part of the WLFZ (145 m).
Land 13 00313 g003
Figure 4. Total SOC content in bulk soil and different particle size aggregates. Error bar shows standard error. A, B, C and D show statistical differences across soil aggregates at p < 0.05; a and b show statistical variations in water levels at p < 0.05. The numbers 2 and 3 show statistical difference in soil depth at p < 0.05. SI: upper part of the WLFZ (165 m); MI: middle part of the WLFZ (155 m); LI: lower part of the WLFZ (145 m).
Land 13 00313 g004
Figure 5. Labile carbon content in bulk soil and different particle size aggregates. Error bar shows standard error. A, B and C show statistical differences across soil aggregates at p < 0.05; a, b and c show statistical variations in water levels at p < 0.05. The numbers 2 and 3 show statistical difference in soil depth at p < 0.05. SI: upper part of the WLFZ (165 m); MI: middle part of the WLFZ (155 m); LI: lower part of the WLFZ (145 m).
Land 13 00313 g005
Figure 6. Contributions of different particle size aggregates to SOC sequestration. Error bar shows standard error. A and B show statistical differences across soil aggregates at p < 0.05; a and b show statistical variations in water levels at p < 0.05. The numbers 2 and 3 show statistical difference in soil depth at p < 0.05 for the same aggregate and the same water level. SI: upper part of the WLFZ (165 m); MI: middle part of the WLFZ (155 m); LI: lower part of the WLFZ (145 m).
Land 13 00313 g006
Figure 7. Contributions of different soil aggregates to labile carbon fraction. Error bar shows standard error. A and B show statistical differences across soil aggregates at p < 0.05; a and b show statistical variations in water levels at p < 0.05. The numbers 2 and 3 show statistical difference in soil depth at p < 0.05 for the same aggregate and the same water level. SI: upper part of the WLFZ (165 m); MI: middle part of the WLFZ (155 m); LI: lower part of the WLFZ (145 m).
Land 13 00313 g007
Disclaimer/Publisher’s Note: The statements, opinions and data contained in all publications are solely those of the individual author(s) and contributor(s) and not of MDPI and/or the editor(s). MDPI and/or the editor(s) disclaim responsibility for any injury to people or property resulting from any ideas, methods, instructions or products referred to in the content.

