Abstract
China’s urbanization has received as much attention as its economic growth in recent years. While rapid urbanization has promoted modernization and wealth creation, it has also brought many problems and challenges. So, since 2014, the Chinese government has implemented a new urbanization policy nationwide. However, few researchers have examined whether China’s new urbanization policies promote sustainable urbanization. This paper evaluates the sustainable urbanization of 19 urban agglomerations in China using the elastic coefficient. The results indicate a significant increase in the number of cities achieving sustainable urbanization since the implementation of China’s new urbanization policy. The number has risen from 46 in the period of 2010–2015 to 71 in the period of 2015–2021. Considering the impact of the new coronavirus on economy, there would have been even more cities entering sustainable urbanization during the latter period. This indicates that the new urbanization policy has a positive influence on the sustainable urbanization of China’s urban agglomerations. The sustainable urbanization status is not static and changes with different policies that are implemented in different time periods. Therefore, it is important to find useful policies that can guide and enhance the urbanization process in these cities. In addition, cities that have a sustainable urbanization status are not perfect. To address this issue, it is important to categorize and implement targeted policies for cities experiencing both sustainable and non-sustainable urbanization. Changes in a city’s size or urbanization rates are not related to the city’s sustainable urbanization status. A larger city size does not indicate sustainable urbanization, and, similarly, cities with faster urbanization rates do not exhibit a higher level of urbanization sustainability.
1. Introduction
Urbanization is a complex phenomenon that is accompanied by the concentration of population and economic activities in cities. Global urbanization has grown at an unprecedented rate in recent decades. According to a report by the United Nations [1], 55% of the world’s population—4.2 billion people—live in cities. This trend is expected to continue, with urban inhabitants projected to reach 9.7 billion people in 2050. The proportion of the global population residing in urban areas is anticipated to increase to 68%. Rapid urbanization has brought many benefits, including increased employment opportunities, wealth creation, advancements in education and healthcare, as well as fostering innovation and efficiency. Many economists view urbanization as a positive achievement in the path to prosperity [2]. As emphasized by Glaeser [3], a 10% increase in urbanization is associated with a 61% increase in the GDP per capita. However, urbanization also brings many challenges, including overcrowding, crime, epidemic diseases, the urban–rural dichotomy, poverty, and inequity [3,4,5]. The most prominent problem is the environmental degradation that urbanization has resulted in, including phenomena such as global warming, reduced tillage, and the pollution of air, soil, and water, along with biodiversity loss [6,7,8]. Therefore, sustainable urbanization has become an inevitable choice for meeting the challenges posed by urbanization.
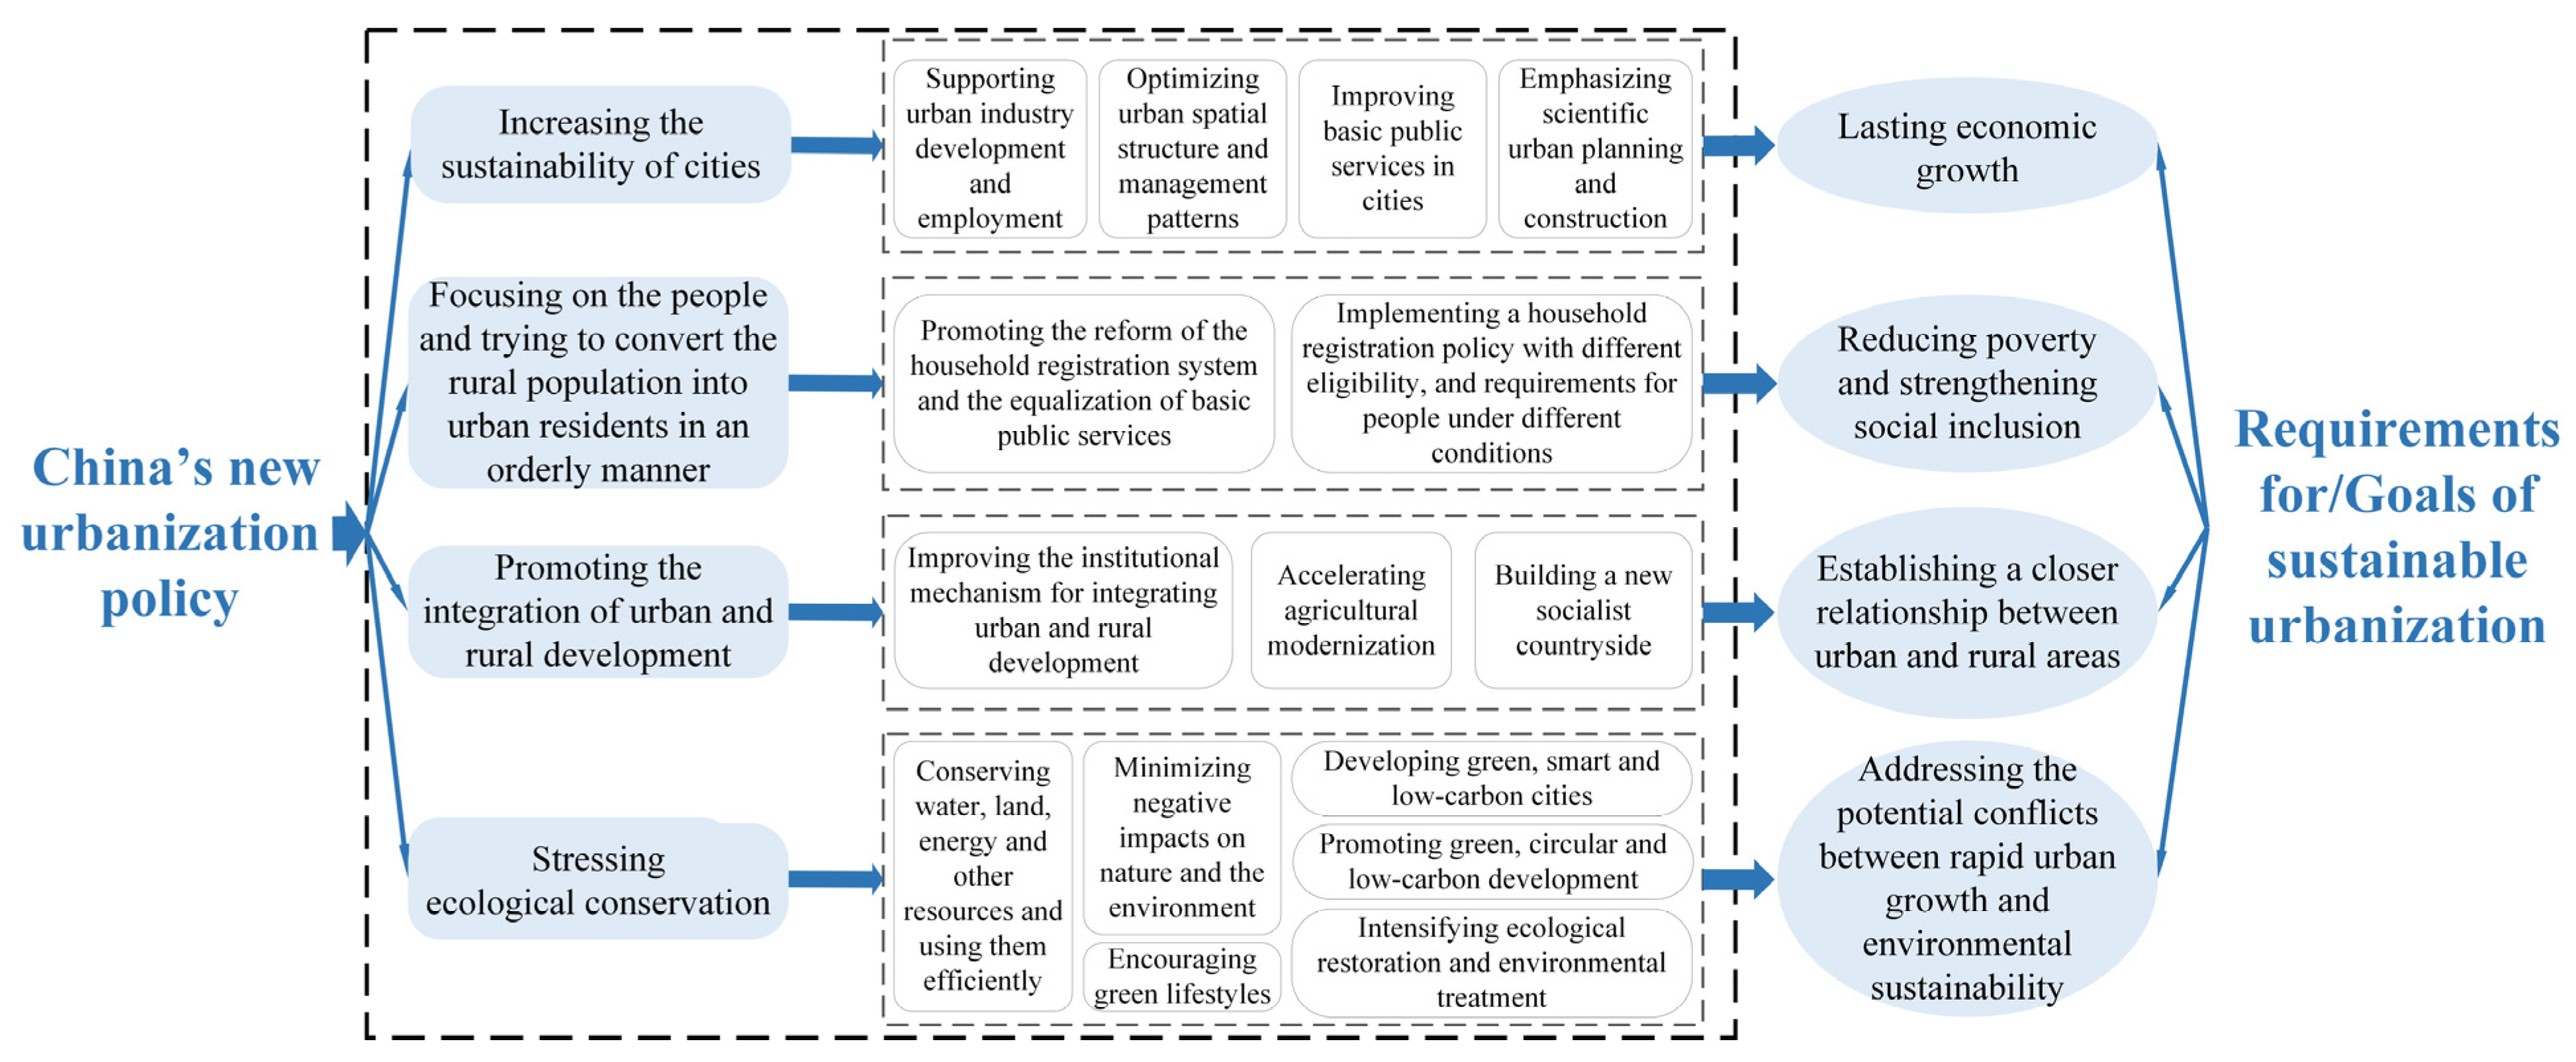
China’s urbanization has received as much attention as its economic growth. Driven by the manufacturing and service sectors, China’s urbanization experienced rapid growth after the year 2000 [9]. In 2001, Nobel Prize winner Joseph Stiglitz asserted at a World Bank conference that urbanization in China and high-tech development in the United States would be two key factors profoundly influencing human development in the twenty-first century. Many regional governments were significantly encouraged by this view. From 2011 to 2013, a prevailing viewpoint in China suggested that the sole means of maintaining high economic growth was to persist in accelerating urbanization [10]. Many places planned various types of “new areas”, “new cities”, and “development zones”, often exceeding the actual need for economic development and population growth [11]. This has led to the wastage of land resources and the creation of some ghost towns [12]. Other problems caused by rapid urbanization, such as rural hollowing, air and water pollution, and environmental degradation, have made the Chinese government aware of the necessity of taking certain measures. In March 2014, the Chinese government released the national new urbanization plan (2014–2020) as a guiding framework for the urbanization of the country. After 2020, the Chinese government proceeded to release the national new urbanization plan (2021–2035) and issued a notice outlining initiatives aimed at promoting new urbanization during the fourteenth five-year plan period (2021–2025). The new urbanization is regarded as being more effective, inclusive, and sustainable, distinct from traditional urbanization [13]. Scholars have conducted numerous studies on China’s new urbanization. [14,15,16,17,18]. However, few studies have examined whether China’s new urbanization is in line with the principle of sustainable urbanization or whether China’s new urbanization policies promote sustainable urbanization. According to UN−HABITAT [19], “sustainable urbanization requires lasting economic growth, resulting in reduced poverty and greater social inclusion, and taking account of the relationships between rural and urban areas”. Figure 1 concludes that the main policy behind China’s new urbanization may meet the requirements for sustainable urbanization. For example, in terms of lasting economic growth, the new urbanization plan proposes to increase the sustainability of cities, including the support for urban industrial development and employment, the optimization of urbanization space structures, the improvement of public services, and scientific urban planning and construction. In this study, we evaluated this newe urbanization from the perspective of sustainable urbanization.

Figure 1.
The main policy of China’s new urbanization.
Urban agglomerations have been the primary areas of urban population growth and GDP creation [1]. A study by Fang [20] found that, in China, urban agglomerations contribute to 72% of the country’s urban population and generate 80.05% of its GDP on just 29.12% of the country’s land area. However, urban agglomerations are also disaster zones of environmental pollution. In 2014, they were responsible for discharging 73% of the nation’s wastewater, 72% of the nation’s exhaust, and 65% of the nation’s solid waste [6]. Urbanization in urban agglomerations has a significant impact on the implementation of the new urbanization policy in China. The Chinese government has planned 19 different types and levels of urban agglomerations, designating them as the primary areas for promoting sustainable urbanization [21]. In this paper, we will evaluate the dynamic sustainability performance of Chinese urban agglomerations from 2010 to 2021, assessing their sustainable urbanization status both before and after the implementation of the new urbanization policy. This analysis aims to reveal whether the new urbanization in China is progressing in a sustainable manner.
Despite the Chinese government’s release of the new urbanization plan in March 2014, numerous local governments commenced preparations for their local new urbanization plans at different paces. Consequently, many local governments only unveiled their local new urbanization plans either by the end of 2014 or in 2015. Furthermore, following Chinese custom, most plans follow a five-year cycle. Therefore, we selected 2015 as the pivotal year to examine the implementation period of the new urbanization plan.
The remainder of this paper is organized as follows: Section 2 outlines the literature review of this study. Section 3 provides an introduction to the study area and methods. Section 4 presents the results obtained. Section 5 discusses the main findings. Finally, Section 6 presents the main conclusions.
2. Literature Review
2.1. Studies on Sustainable Urbanization
Since sustainable urbanization was adopted by UN−HABITAT [19] as an effective ways to achieve Target 11 of the Millennium Development Goals, it has attracted increased attention and has become an important research area. Regarding the notion of sustainable urbanization, Pivo [22] pointed out that sustainable urbanization refers to an urbanization way that follows the principles of sustainability. Drakakis-Smith and Dixon [23] presented a framework for understanding the components of sustainable urbanization, encompassing economic, social, environmental, demographic, and political dimensions. UN−HABITAT [19,24] summarized sustainable urbanization as a dynamic, multi-dimensional process incorporating environmental, social, economic, and political institutional sustainability. It aims to addresses poverty, inequality, climate change, and other global challenges by creating economic, social, and environmental value. Rasoolimanesh et al. [25] conducted a comparison between sustainable cities and sustainable urbanization, emphasizing that sustainable urbanization focuses on the process of achieving the appropriate conditions in which environmental, economic, social, and governance sustainability are given equal attention.
In recent years, some scholars have attempted to develop quantitative methods to evaluate sustainable urbanization. For example, Shen et al. [26] introduced an alternative model for assessing sustainable urbanization by examining the relationship between urbanization and urban sustainability. Zhang [27] proposed a bi-dimensional matrix model to illustrate theoretical and practical patterns of sustainable urbanization practices in the urban–rural transition process. Shen et al. [28] optimized the modeling of the above through the use of elasticity coefficients and a new-type McKinsey matrix to evaluate sustainable urbanization. Fang et al. [29] adopted a spatio-temporal coupling coordinated development model to evaluate sustainable urbanization in the Shandong Peninsula. Their conclusion emphasized that increasing the level of coupling-coordinated development is conducive to maintaining sustainable urbanization. In China, new-type urbanization is regarded as a sustainable urbanization mode. It is designed to solve existing urbanization challenges and emphasize a sustainable people-centered approach [14]. Some scholars have attempted to establish a system of indicators for evaluating the level of new urbanization from the perspectives of economic, social, demographic, and environmental urbanization [15,16,17,18]. However, current researchers have not reached a uniform consensus on the assessment of the level of new urbanization. Different scholars may use a variety of indicators and methodologies, leading to the absence of a standardized criteria in evaluating new urbanization. For main indicator systems and methods for the assessment of sustainable urbanization are shown in Table 1.

Table 1.
Indicator systems and methods of sustainable urbanization evaluation.
Research efforts on sustainable urbanization are also exploring reasonable solutions to related policy issues. In India, Verma et al. [35] suggested building high-speed rails to promote the sustainable urbanization of cities. Through case studies in Bangladesh and China, Roy [36] and Xu et al. [37] found that sustainable urbanization goals can be achieved through effective urban planning. Xiong et al. [38] proposed public–private partnerships as a governance response to achieve sustainable urbanization in China. Yang et al. [39] and Wu et al. [40] argued that the ESG ratings of companies and monetary policy adjustments can be used in practice to promote new urbanization. Ochoa et al. [4] conducted a study on 185 best practices for sustainable urbanization worldwide. They identified that community engagement, capacity building, education, partnerships, and job creation are important for urban sustainable development. The policies for sustainable urbanization encompass a broad spectrum, ranging from macro to micro levels. These policies encompass natural-based, environmental, social, and economic solutions, emphasizing the comprehensive and integrated nature of strategies.
2.2. Studies on Urban Agglomeration
Urban agglomerations are concentrated urbanized areas that represent highly developed forms of integrated cities [41]. Numerous studies have been conducted on urban agglomerations. Early research efforts primarily focused on discussions of the notion of agglomerations, the identification of boundaries, analyses of their formation process, and examinations of their development patterns [42,43,44]. As research progressed, scholars shifted their focus towards examining the linkages and divisions between cities within urban agglomerations. These studies included economic linkages, population mobility logistics, tourism, finance, accessibility, and coordinated development [45,46,47,48]. However, as urban agglomerations undergo growth and development, numerous challenges and issues become more evident. Indeed, scholars began to pay attention to the sustainable development of urban agglomerations, such as industrial wastewater discharge reduction [49], vulnerability assessment [50], carbon emissions [51], environmental quality assessment [52], sustainability performance evaluation, etc. [53].
The discussion above suggests that the existing studies are multifaceted, including global, national, and regional scales. However, few studies have been conducted on the sustainable urbanization performance of urban agglomerations. To address this research gap, this paper aims to assess the dynamic sustainable urbanization status of 19 urban agglomerations in China.
3. Study Area and Methods
3.1. Study Area
Based on the thirteenth five-year plan for the economic and social development of the People’s Republic of China and the urban agglomeration plans released by the government, our research focuses on the evaluation of the sustainable urbanization status within 19 urban agglomerations in China (Figure 2). Taking into account data availability, this paper only investigates 200 prefecture-level cities in urban agglomerations. In 2021, urban agglomerations accounted for 82.5% of China’s GDP and comprised 73.7% of the country’s population. As major population and economic agglomerations in China, the sustainable urbanization of these urban agglomerations is of particular importance to the country.
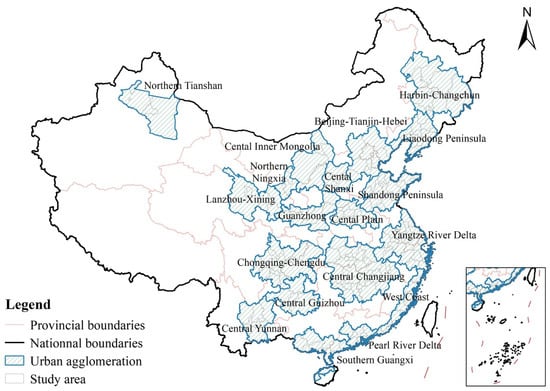
Figure 2.
Nineteen urban agglomerations in China.
3.2. Data Source
The data were primarily sourced from the following references: China City Construction Statistical Yearbook (2011–2022), China City Statistical Yearbook (2011–2022), China Population and Employment Statistics Yearbook (2011–2022), the statistical yearbooks of twenty-three provinces, five autonomous regions, and four municipalities (2011–2022), and the EPS (Economic Prediction System) data platform. The missing values for some years were filled in by interpolation.
3.3. Methods
3.3.1. The Elastic Coefficient Method for Assessing Sustainable Urbanization
This paper adopts the elastic coefficient proposed by Shen et al. [28] to evaluate the sustainable urbanization status of 19 urban agglomerations in China. The equation utilized is presented as follows:
where Esu is the elastic coefficient, ∆us denotes the variation in a city’s urbanization sustainability during the study period (the detailed calculation process is described in Section 3.3.3), ∆us = ust2 − ust1, ∆ur indicates the change in a city’s urbanization rate, namely, ∆ur = urt2 − urt1, while t2 and t1 are the study time points.
Esu = (∆us)/(∆ur)
The value of Esu can be either positive or negative, presenting eight scenarios in Shen et al. [28], which are detailed in Table 2.
Table 2.
The eight scenarios of Esu.
3.3.2. Measurement of Urbanization Rate
The urbanization rate (ur) is measured by the proportion of people residing in cities and towns compared to the total population. The formula for this calculation is the following:
where Up denotes the urban population, and Tp is the total population.
3.3.3. Measurement of Urbanization Sustainability
- (a)
- Indicator System
The scientific assessment of urbanization sustainability is a prerequisite for governments to formulate reasonable policies. Numerous studies have been conducted on urbanization sustainability, and indicator-based systems are popular approaches. These systems often utilize single composite indicators such as the ecological footprint (EF), the green city index (GCI), the city development index (CDI), the human development index (HDI), and the happy planet index (HPI) [54]. The system of indicators used for evaluating the sustainability of urbanization in cities, including the pressure–state–response (PSR) framework set of indicators and the set of indicators based on the United Nations’ Sustainable Development Goals (SDGs) framework, plays a crucial role in assessing the sustainability of urbanization [55]. Indicators that denote sustainability are usually organized into three dimensions: environment, economy, and society. As pointed out by Harris [56], if individual component systems cannot function properly, the entire system cannot be sustainable. In this paper, we align ourselves with the mainstream of sustainability and select 27 indicators from economic, social, and environmental dimensions (Table 3).
Table 3.
The indicators selected for measuring urbanization sustainability.
In the economic dimension, we selected eight indicators, considering five categories: economic growth (S1, S2), development quality (S3), structural optimization (S4, S5), income growth (S6), and scientific and technological investment and innovation (S7, S8). For social sustainability, nine indicators were chosen from six categories: employment status (S9), social security (S10), urban–rural income gap (S11), education (S12, S13), health (S14, S15), and infrastructure provision (S16, S17). In the environmental pillar, we selected ten indicators, considering three categories: resource consumption and pollution emissions (S18, S19, S20, and S21), pollution control and protection (S22, S23, S24, and S25), and per capita resources (S26, S27).
- (b) Aggregation
In this paper, we first tried to use the entropy method to determine the weights. However, the weights were not satisfactory. Consequently, we opted to adopt methodologies similar to those employed by the United Nations in the SDG index. An equal weight of 0.33 was subjectively assigned to each dimension of urbanization sustainability—economic, social, and environmental. This assignment underscored the equal importance of all three dimensions. Subsequently, we assigned an equal weight to each category in the economic, social, and environmental dimensions, respectively. The main steps were as follows:
Step 1: Normalize the input values of the indicators to eliminate bias.
Positive:
Negative:
Xij is the value of the jth indicator in the ith year, and min{Xj} and max{Xj} are the minimum and maximum values of the jth indicator in all years.
Step 2: Calculate the evaluation score of each single indicator.
where Wj is the weight of indicator i.
Step 3: Calculate the comprehensive evaluation score in year i.
where n is the number of indicators, and Seij, Ssij, and Senij represent the values of the sustainability indexes in the economic, social, and environmental dimensions, respectively.
4. Results
4.1. Urbanization Rate Change in China’s Urban Agglomerations
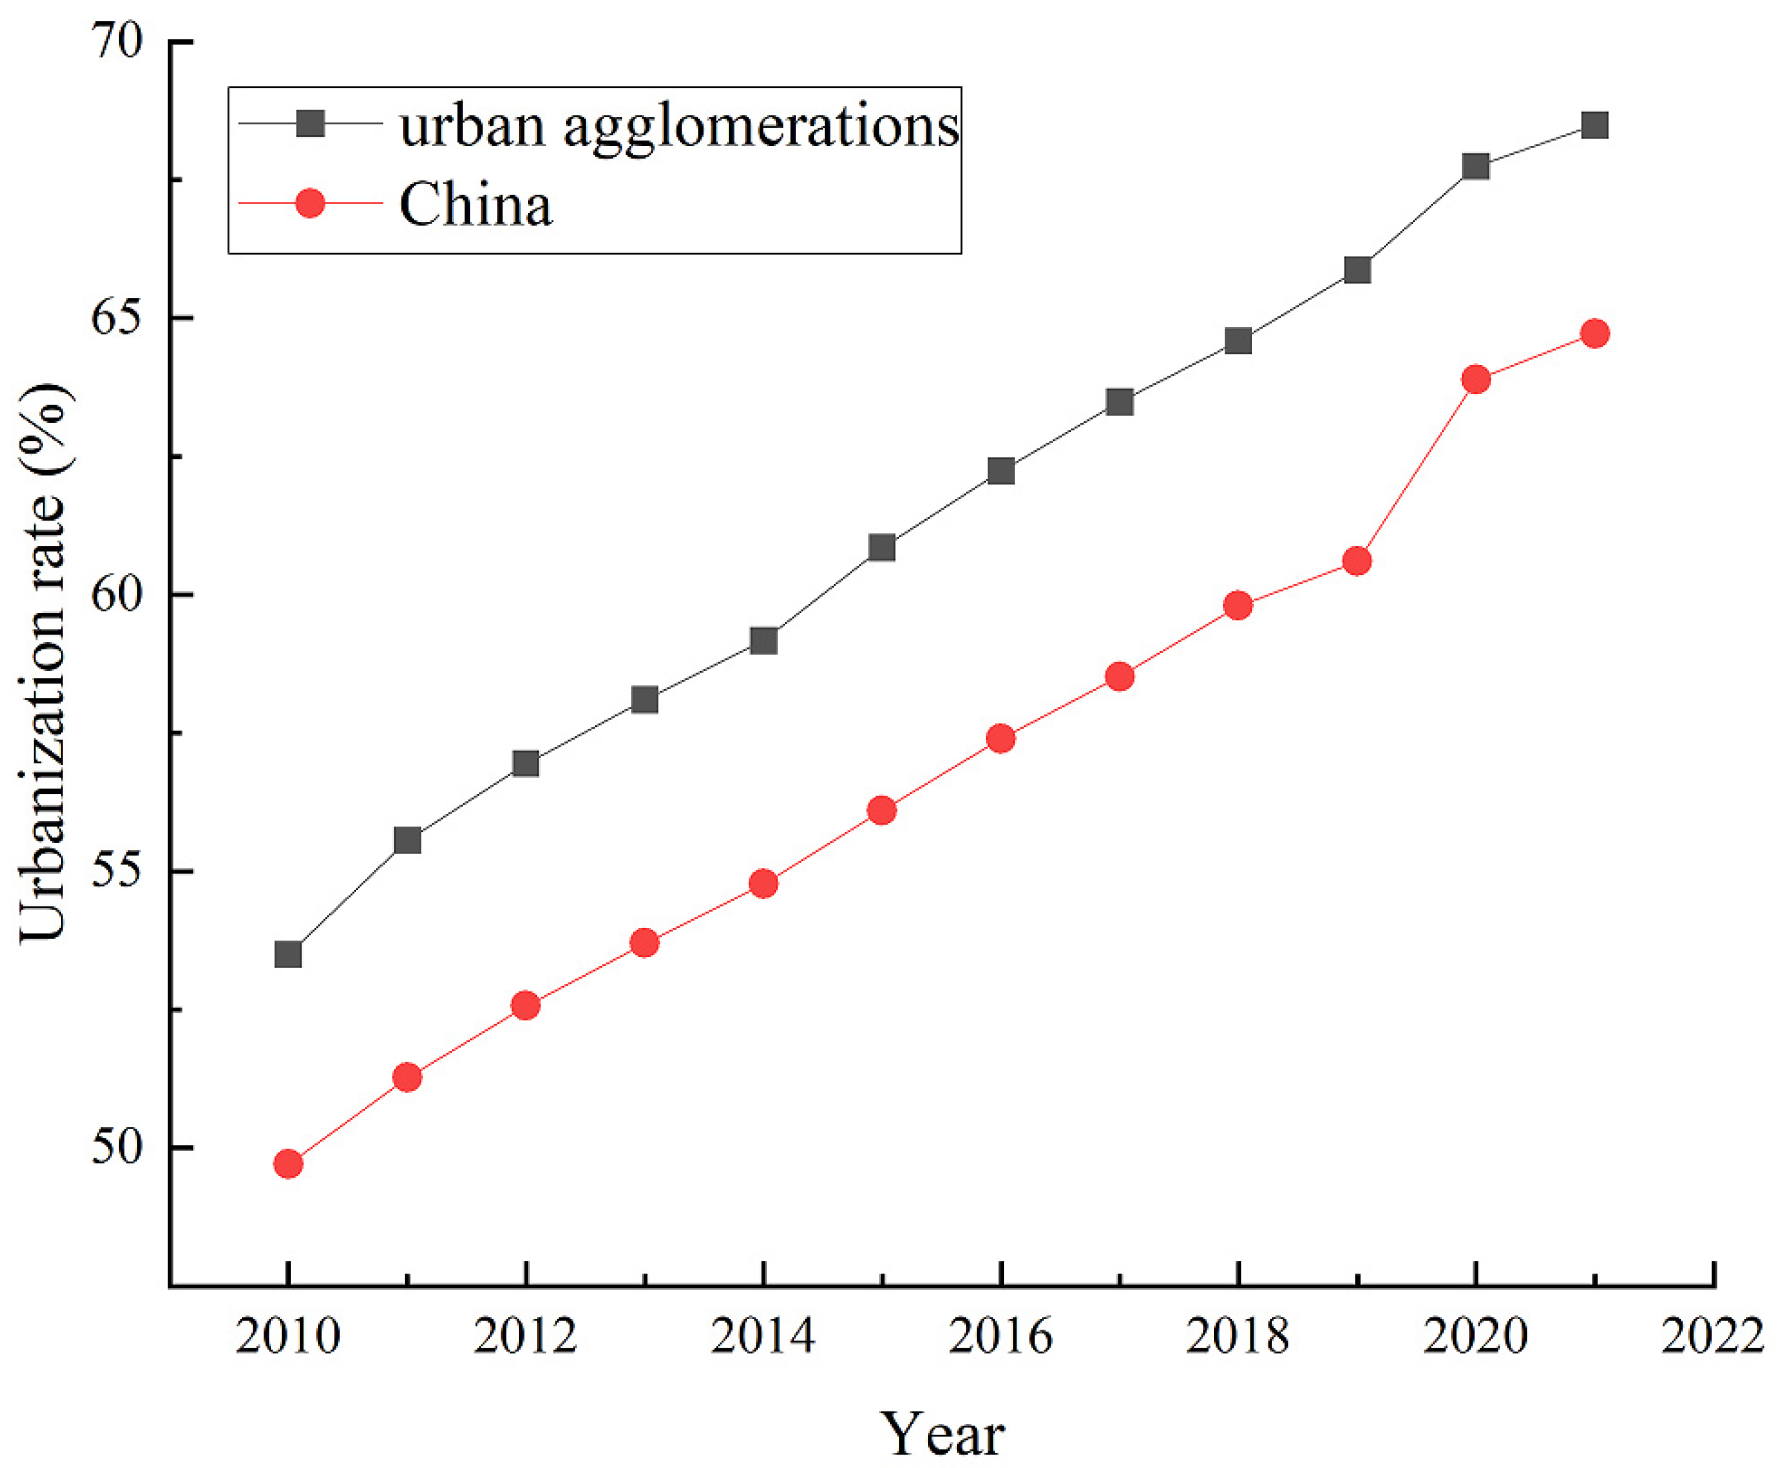
Urban agglomerations are the most-urbanized geographic regions in China. In 2010, approximately 511.8 million people resided in urban areas of urban agglomerations, a number which increased to 713.3 million in 2021. Simultaneously, the proportion of the population residing in urban areas in China’s urban agglomerations increased from 53.5% to 68.5%, approximately 3.8% higher than the national urbanization rate (Figure 3).

Figure 3.
Changes in urbanization rate in Chinese urban agglomerations.
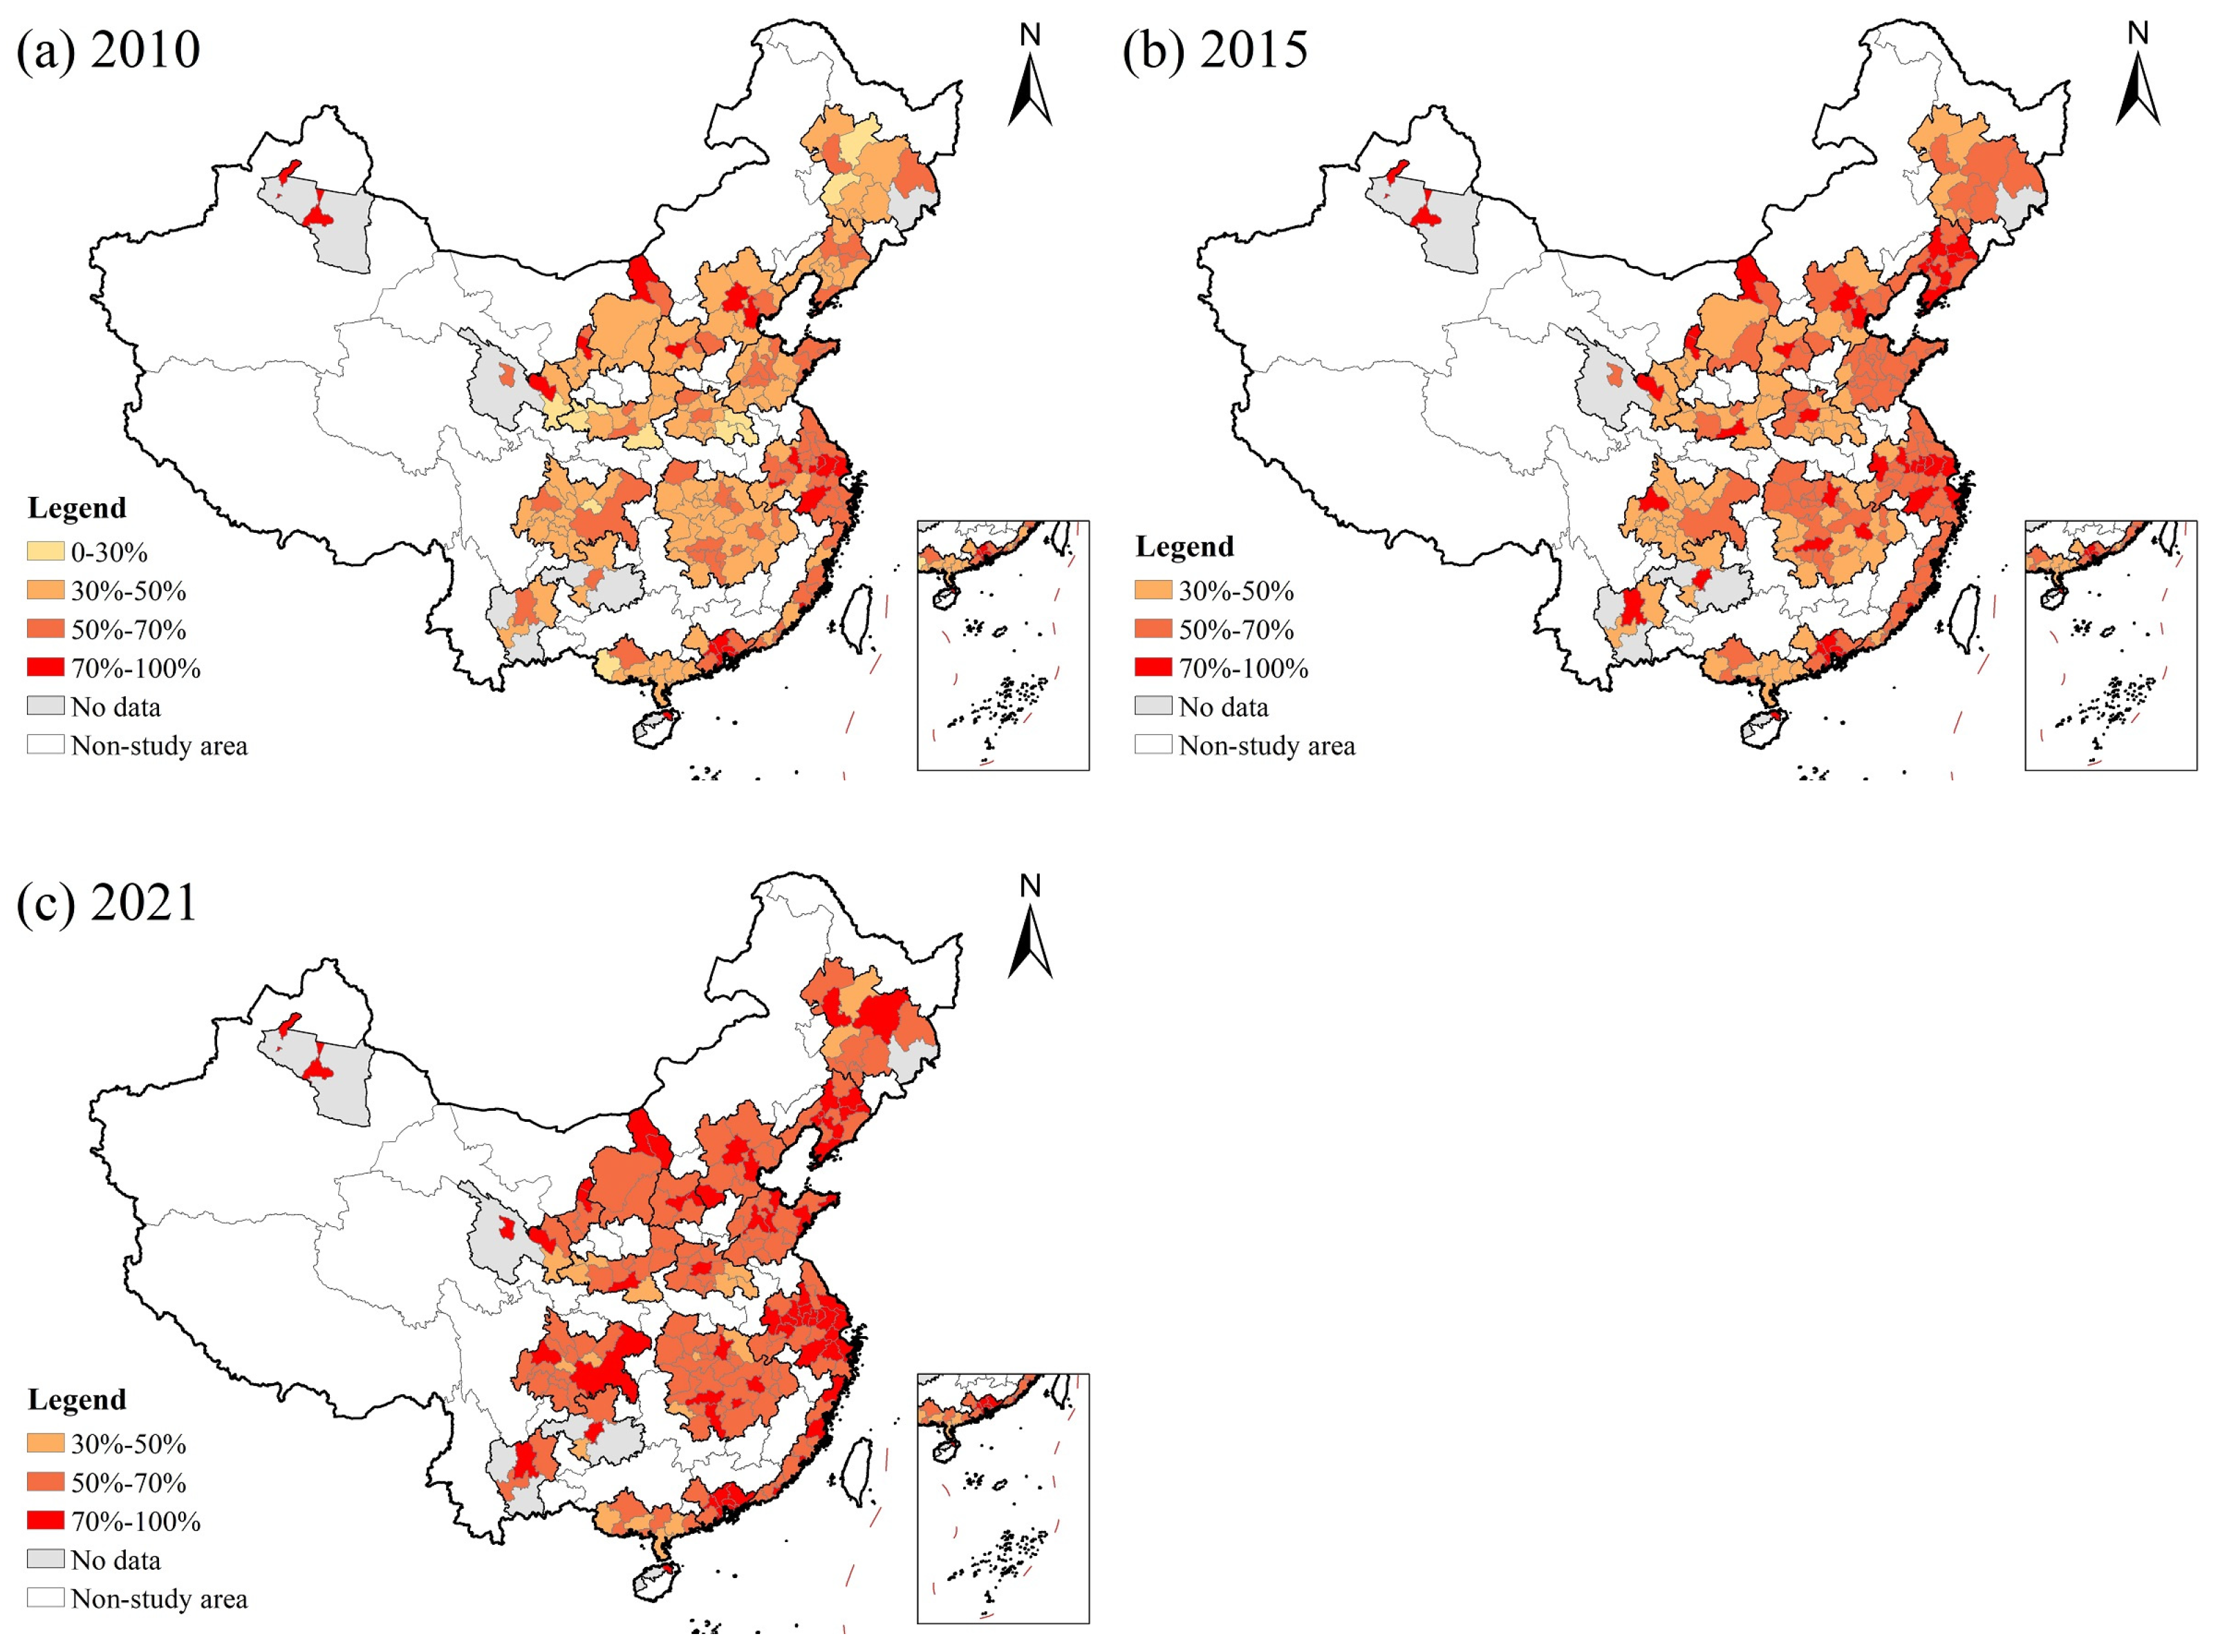
Figure 4 indicates that cities in urban agglomerations have experienced, over time, very different urbanization rates across the geographic regions observed. Among the 200 cities, the lowest urbanization rates in 2010 were observed in Dingxi (23.4%) and Suihua (26.3%), while the highest rates were in Shenzheng and Kelamayi (each 100%), followed by Wulumuqi (96.9%). In the urban agglomerations analyzed, only 22 cities had urbanization rates surpassing 70%, and most of them were economically developed coastal cities, resource cities, or provincial inland capital cities. Sixty-four cities reported urbanization rates between 50% and 70%, while eleven cities exhibited urbanization rates below 30% (Figure 4a). In 2015, the median urbanization rate in China’s urban agglomerations increased from 47.2% to 55.1%, with almost all the cities having urbanization rates exceeding 30% (Figure 4b). The urbanization rate exceeded 70% in 39 cities within urban agglomerations, while 92 cities recorded rates between 50% and 70%. This rapid increase in the urbanization rate was also accompanied by a significant rise in urban dwellers. In 2015, the urban agglomerations comprised 7 megacities (more than or around 10 million inhabitants), 22 large cities (5 to 10 million inhabitants), and 144 medium-sized cities (1 to 5 million inhabitants). In 2021, 65 cities in urban agglomerations reported urbanization rates exceeding 70%, and 116 cities recorded urbanization rates between 50% and 70% (Figure 4c). The number of megacities increased to 12, including Beijing, Shanghai, Shenzhen, Chengdu, Chongqing, Guangzhou, Wuhan, Tianjin, Suzhou, Xi’an, Hangzhou, and Zhenzhou. Shanghai and Chongqing stood out as the most populous, each with over 20 million inhabitants residing in urban settlements.

Figure 4.
Spatial changes in urbanization rate in Chinese urban agglomerations.
Different patterns of urbanization can be observed in the 19 urban agglomerations.. The Beijing–Tianjin–Hebei, Yangtze River Delta, Peral River Delta, Liaodong Peninsula, and Northern Tianshan urban agglomerations currently exhibit high levels of urbanization but with a slowing growth rate. Additionally, 52.3% of the cities in these agglomerations have an urbanization rate exceeding 70% (Figure 4). The Central Plain, Harbin–Changchun, and Southern Guangxi urban agglomerations exhibit the lowest urbanization rates (below 60%) due to their comparatively less-robust economic development compared to the urban agglomerations on the eastern seaboard.
4.2. The Change in Urbanization Sustainability in Chinese Urban Agglomerations
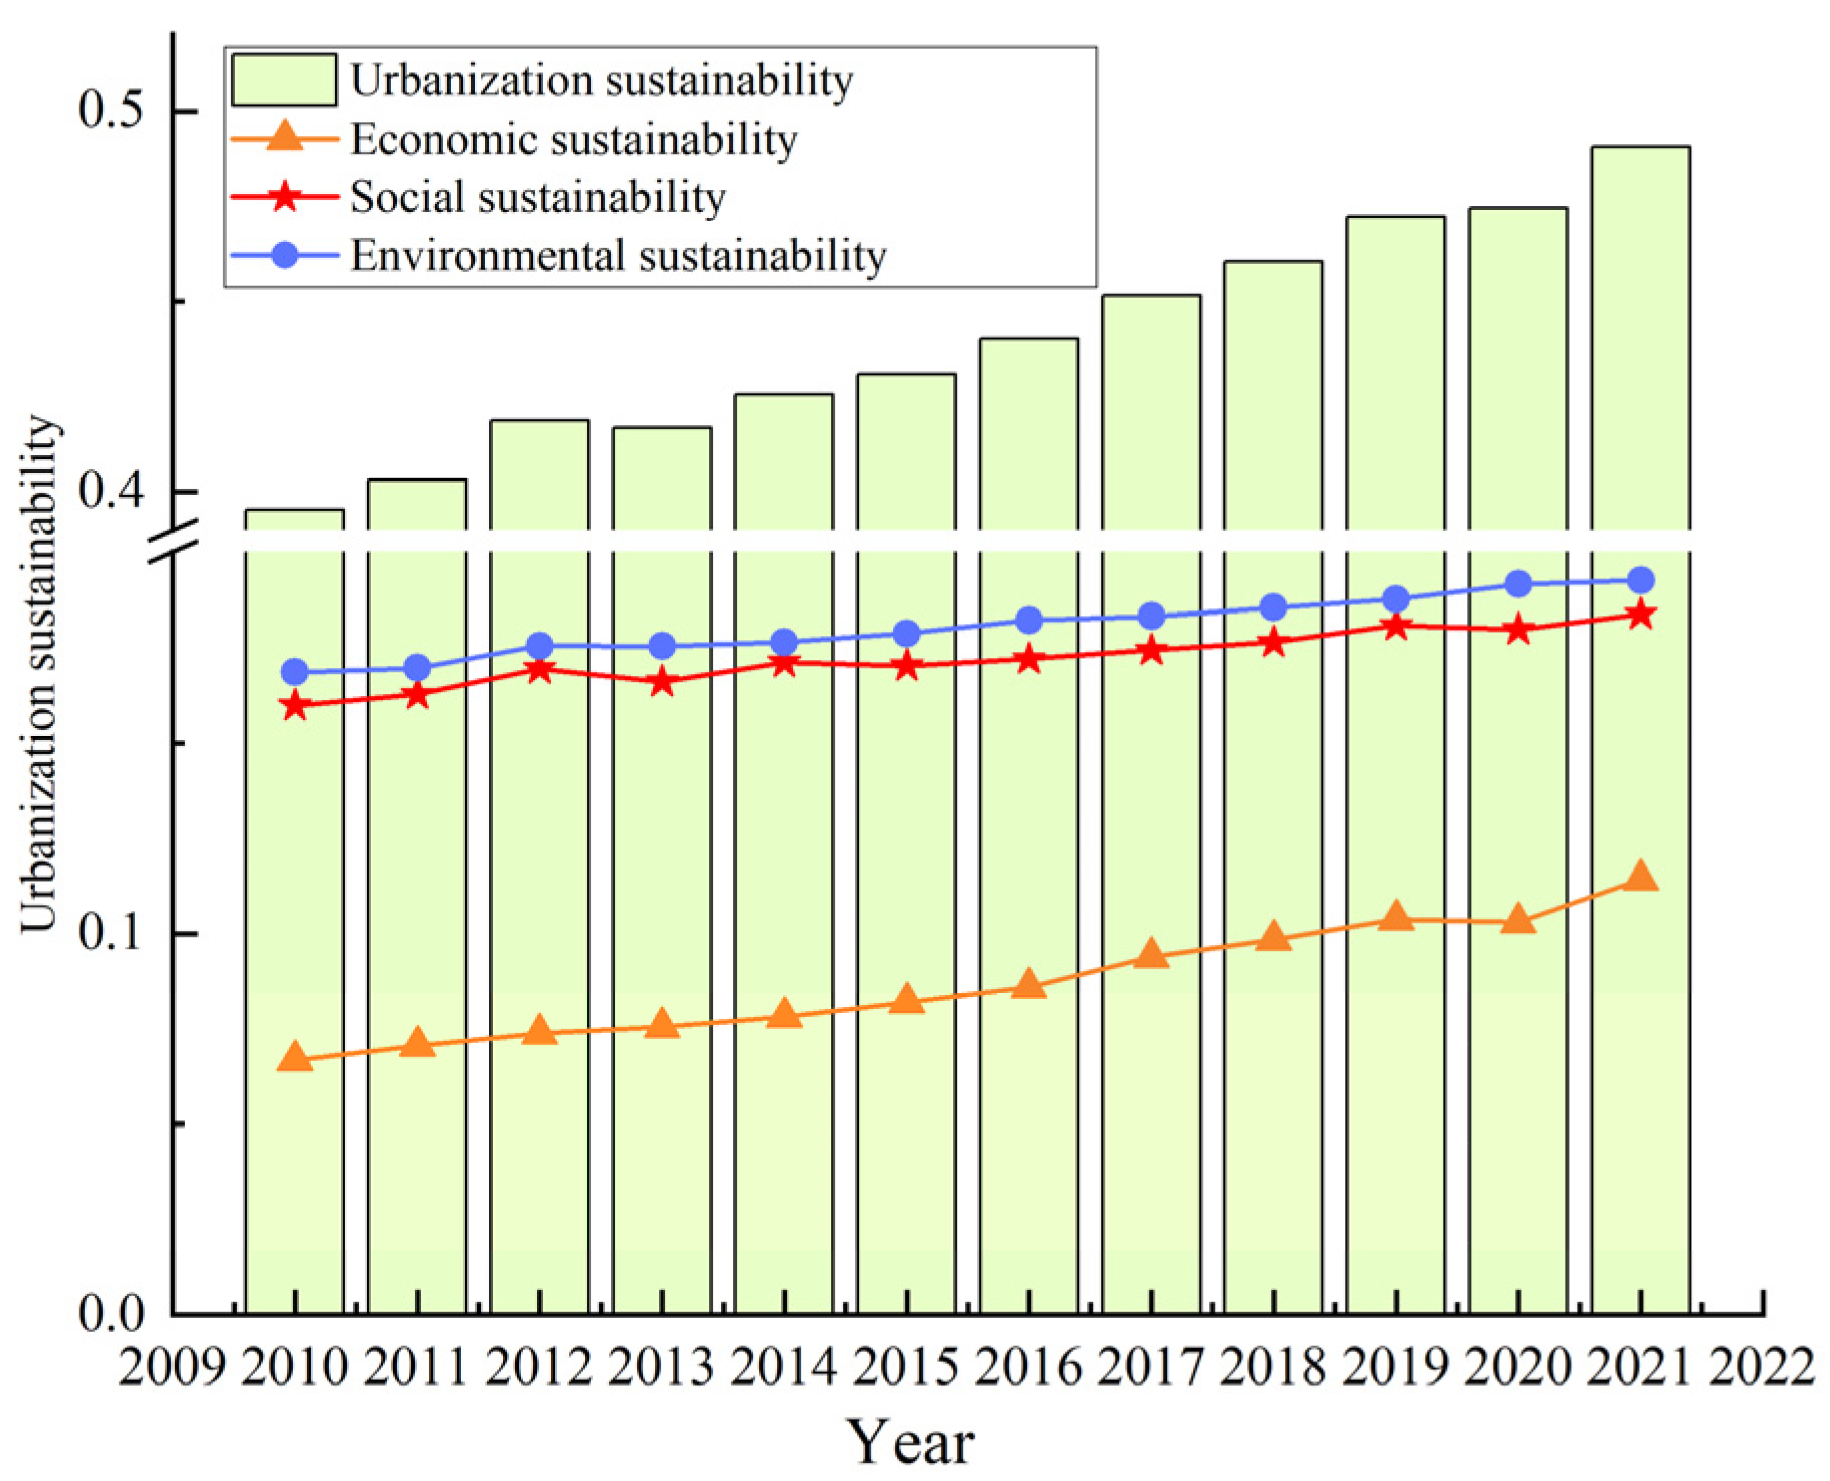
By applying Formulas (3)–(6), introduced in the previous section, the urbanization sustainability value of Chinese urban agglomerations can be calculated (Figure 5). As shown in Figure 5, the synthesized value of the urbanization sustainability in Chinese urban agglomerations increased in the time period ranging from 2010 to 2020. The urbanization sustainability value rose by approximately 24.2%, increasing from a score of 0.3952 in 2010 to 0.4907 in 2021. Among the three dimensions, environmental sustainability contributed the largest share, accounting for approximately 41% of the total, followed by social sustainability at 39% and economic sustainability at 20%. Economic sustainability witnessed the highest increment, rising from a score of 0.0668 in 2010 to 0.1143 in 2021, representing a 71.2% increase. Meanwhile, social sustainability and environmental sustainability only grew by 15% and 14.3% between 2010 and 2020.
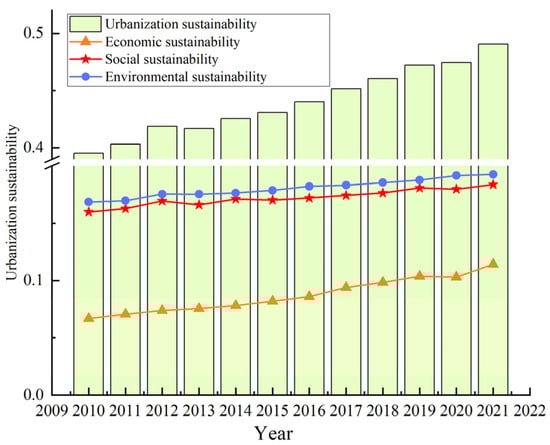
Figure 5.
Changes in urbanization sustainability in Chinese urban agglomerations.
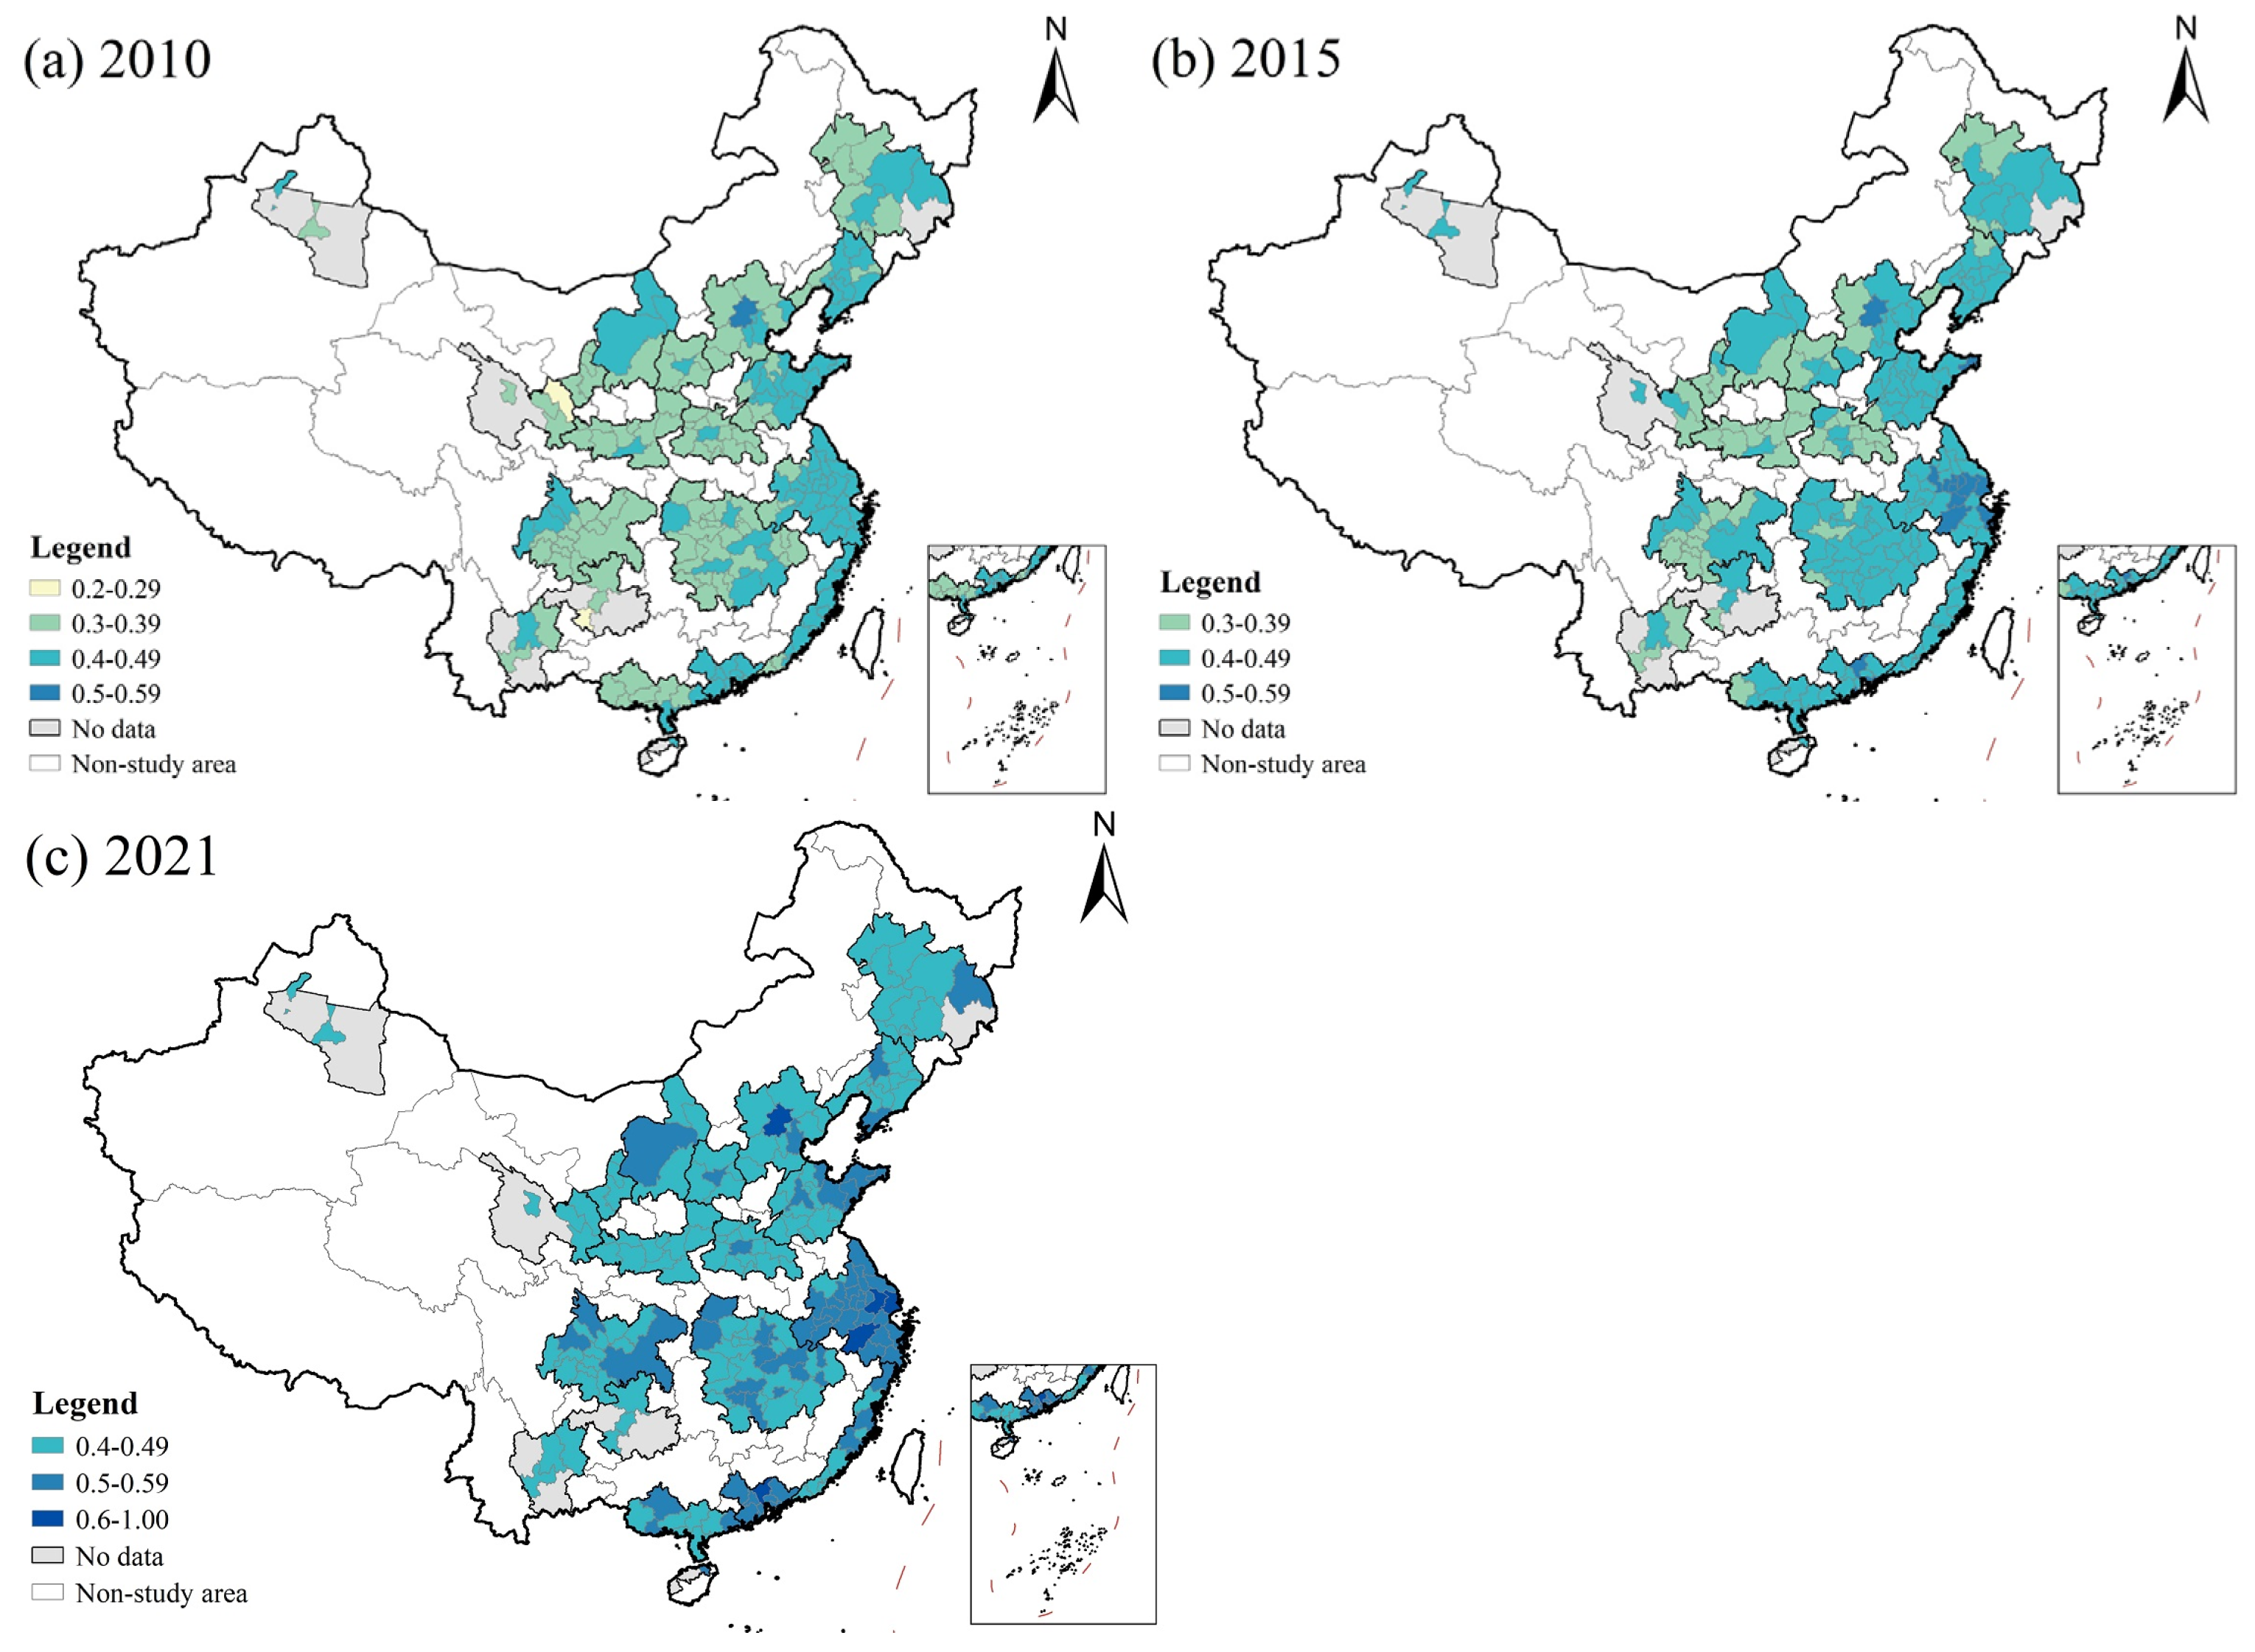
Substantial spatial heterogeneity occurred in the urbanization sustainability values across these cities. At the city level, 98.5% of all 200 cities scored between 0.3 and 0.49 in the urbanization sustainability value for the year 2010. In 2010, only one city (Beijing) had an urbanization sustainability value above 0.5, while the bottom two cities, Anshun and Baiying, both had sustainability values below 0.3 (Figure 6a). Beijing, as the capital city, performed well in both social and economic sustainability. In contrast, Anshun and Baiyin scored low in all the dimensions due to their poor performance in many aspects. Taking Anshun as an example, the industrial sulfur dioxide emissions per unit of GDP was the highest, at 63.4 Ton/CNY, and the per capita green area was the lowest, with only 1.2 m2 in 2010.

Figure 6.
Spatial changes in urbanization sustainability in Chinese urban agglomerations.
In 2015, the urbanization sustainability value on the city scale ranged from 0.3394 to 0.5565, with a mean value of 0.4310. Thirteen cities had urbanization sustainability values above 0.5, with Hangzhou being the highest (0.5565). The majority of the cities with high urbanization sustainability values were located in the Yangtze River Delta urban agglomeration (Figure 6b). These cities benefit from advantageous locations and well-developed transportation facilities, playing important roles in the Yangtze River Delta urban agglomeration, which hosts globally important industries specialized in electronics, automobiles, and machineries [57]. Many cities in the Yangtze River Delta urban agglomeration ranked at the top in terms of their economic and social sustainability performance in 2015. In 2015, 68% of these cities scored between 0.4 and 0.59 in urbanization sustainability, with none scoring below 0.3. However, Baoding, Dazhou, Dandong, Lvliang, Yibin, Tieling, Anshan, and Changchun presented a decreasing sustainability value between 2010 and 2015. Most of the cities experiencing a decline in sustainability were old industrial cities with slow economic growth, and their social or environmental sustainability values decreased during the period from 2010 to 2015. If we take Tieling as an example, the growth rate of the GDP was only −6.2% in 2015, compared to the 16% measured in 2010, and the social insurance coverage rate dropped from 52.2% in 2010 to 32.7% in 2015. With population growth and industrial development, the water resources per capita decreased from 1320 cubic meters/person in 2010 to 429.1 cubic meters/person in 2015, while the annual mean concentration of PM2.5 and the electricity consumption per unit of GDP both increased in this period.
In 2021, the urbanization sustainability values of Beijing, Guangzhou, Shanghai, Hangzhou, and Suzhou all exceeded 0.6, with Beijing once again leading with a score of 0.6169. Since 2015, these cities have implemented a series of new urbanization measures, resulting in a significant increase in sustainability. For example, Beijing has focused on developing its economy by strengthening original innovation, promoting core technology research, and developing “high-precision and top grade” industries. In 2018, the R&D investment and number of invention patents per 10,000 people in Beijing ranked first in the country. Another 67 cities scored between 0.5 and 0.59, and 128 cities scored between 0.4 and 0.49 in their urbanization sustainability values in 2021, while none of the cities scored below 0.4. Between 2015 and 2020, all the cities except for Fushun demonstrated stable improvements in their urbanization sustainability values. Twenty-five cities, such as Xiangtan, Yibin, Zigong, Mudanjiang, Shangqiu, and Yuxi, experienced the fastest growth in their sustainability values, with growth rates exceeding 20% (Figure 6c).
All the urban agglomerations studied experienced an increase in their urbanization sustainability values from 2010 to 2021 (Figure 6, Table 4), and most agglomerations demonstrated a faster urbanization sustainability growth in 2015–2021 than in 2010–2015. The new urbanization plan emphasizes urban agglomerations as an important form of urbanization, supported by an extensive accommodation capacity and safeguarded by institutional innovation. Many regions have adopted policies to promote the integrated development of urban agglomerations. For example, the Chengdu–Chongqing urban agglomeration has accelerated its transport connectivity, with an average of more than 200 direct passenger trains per day. The municipal governments of the two provinces have jointly issued an implementation plan for the high-quality joint development of the automobile and electronic information industries. Chengdu and Chongqing have jointly delineated the ecological protection red line and carried out cross-border river pollution prevention and “zero waste city” construction. Zhang et al. [58] classified 19 urban agglomerations in China according to their developmental stages (Table 4). As Table 4 shows, urban agglomerations in their mature stage exhibited the highest value of sustainability, followed by urban agglomerations in their late growth stage, early growth stage, and primary stage. This suggests that the more mature the urban agglomeration, the higher its level of urbanization sustainability.
Table 4.
The development trends of urbanization sustainability in urban agglomerations at different development stages.
4.3. Dynamic Sustainable Urbanization of Chinese Urban Agglomerations from 2010 to 2021
According to Equation (1), this paper calculated the elasticity coefficients in 2010–2015, 2015–2021, and 2010–2021 and identified the sustainable urbanization scenarios for each city. By comparing the analysis results with the scenario analysis presented in Table 2, the dynamic status of sustainable urbanization in 200 cities can be reported (Figure 7).
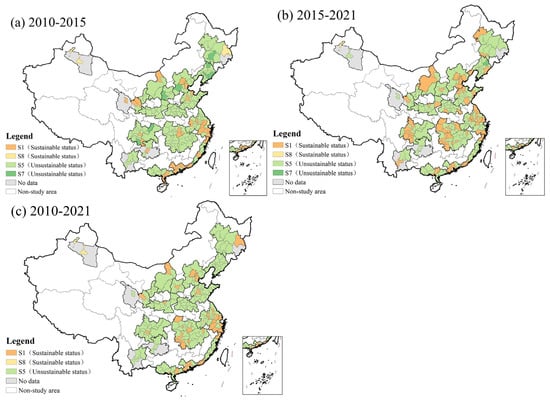
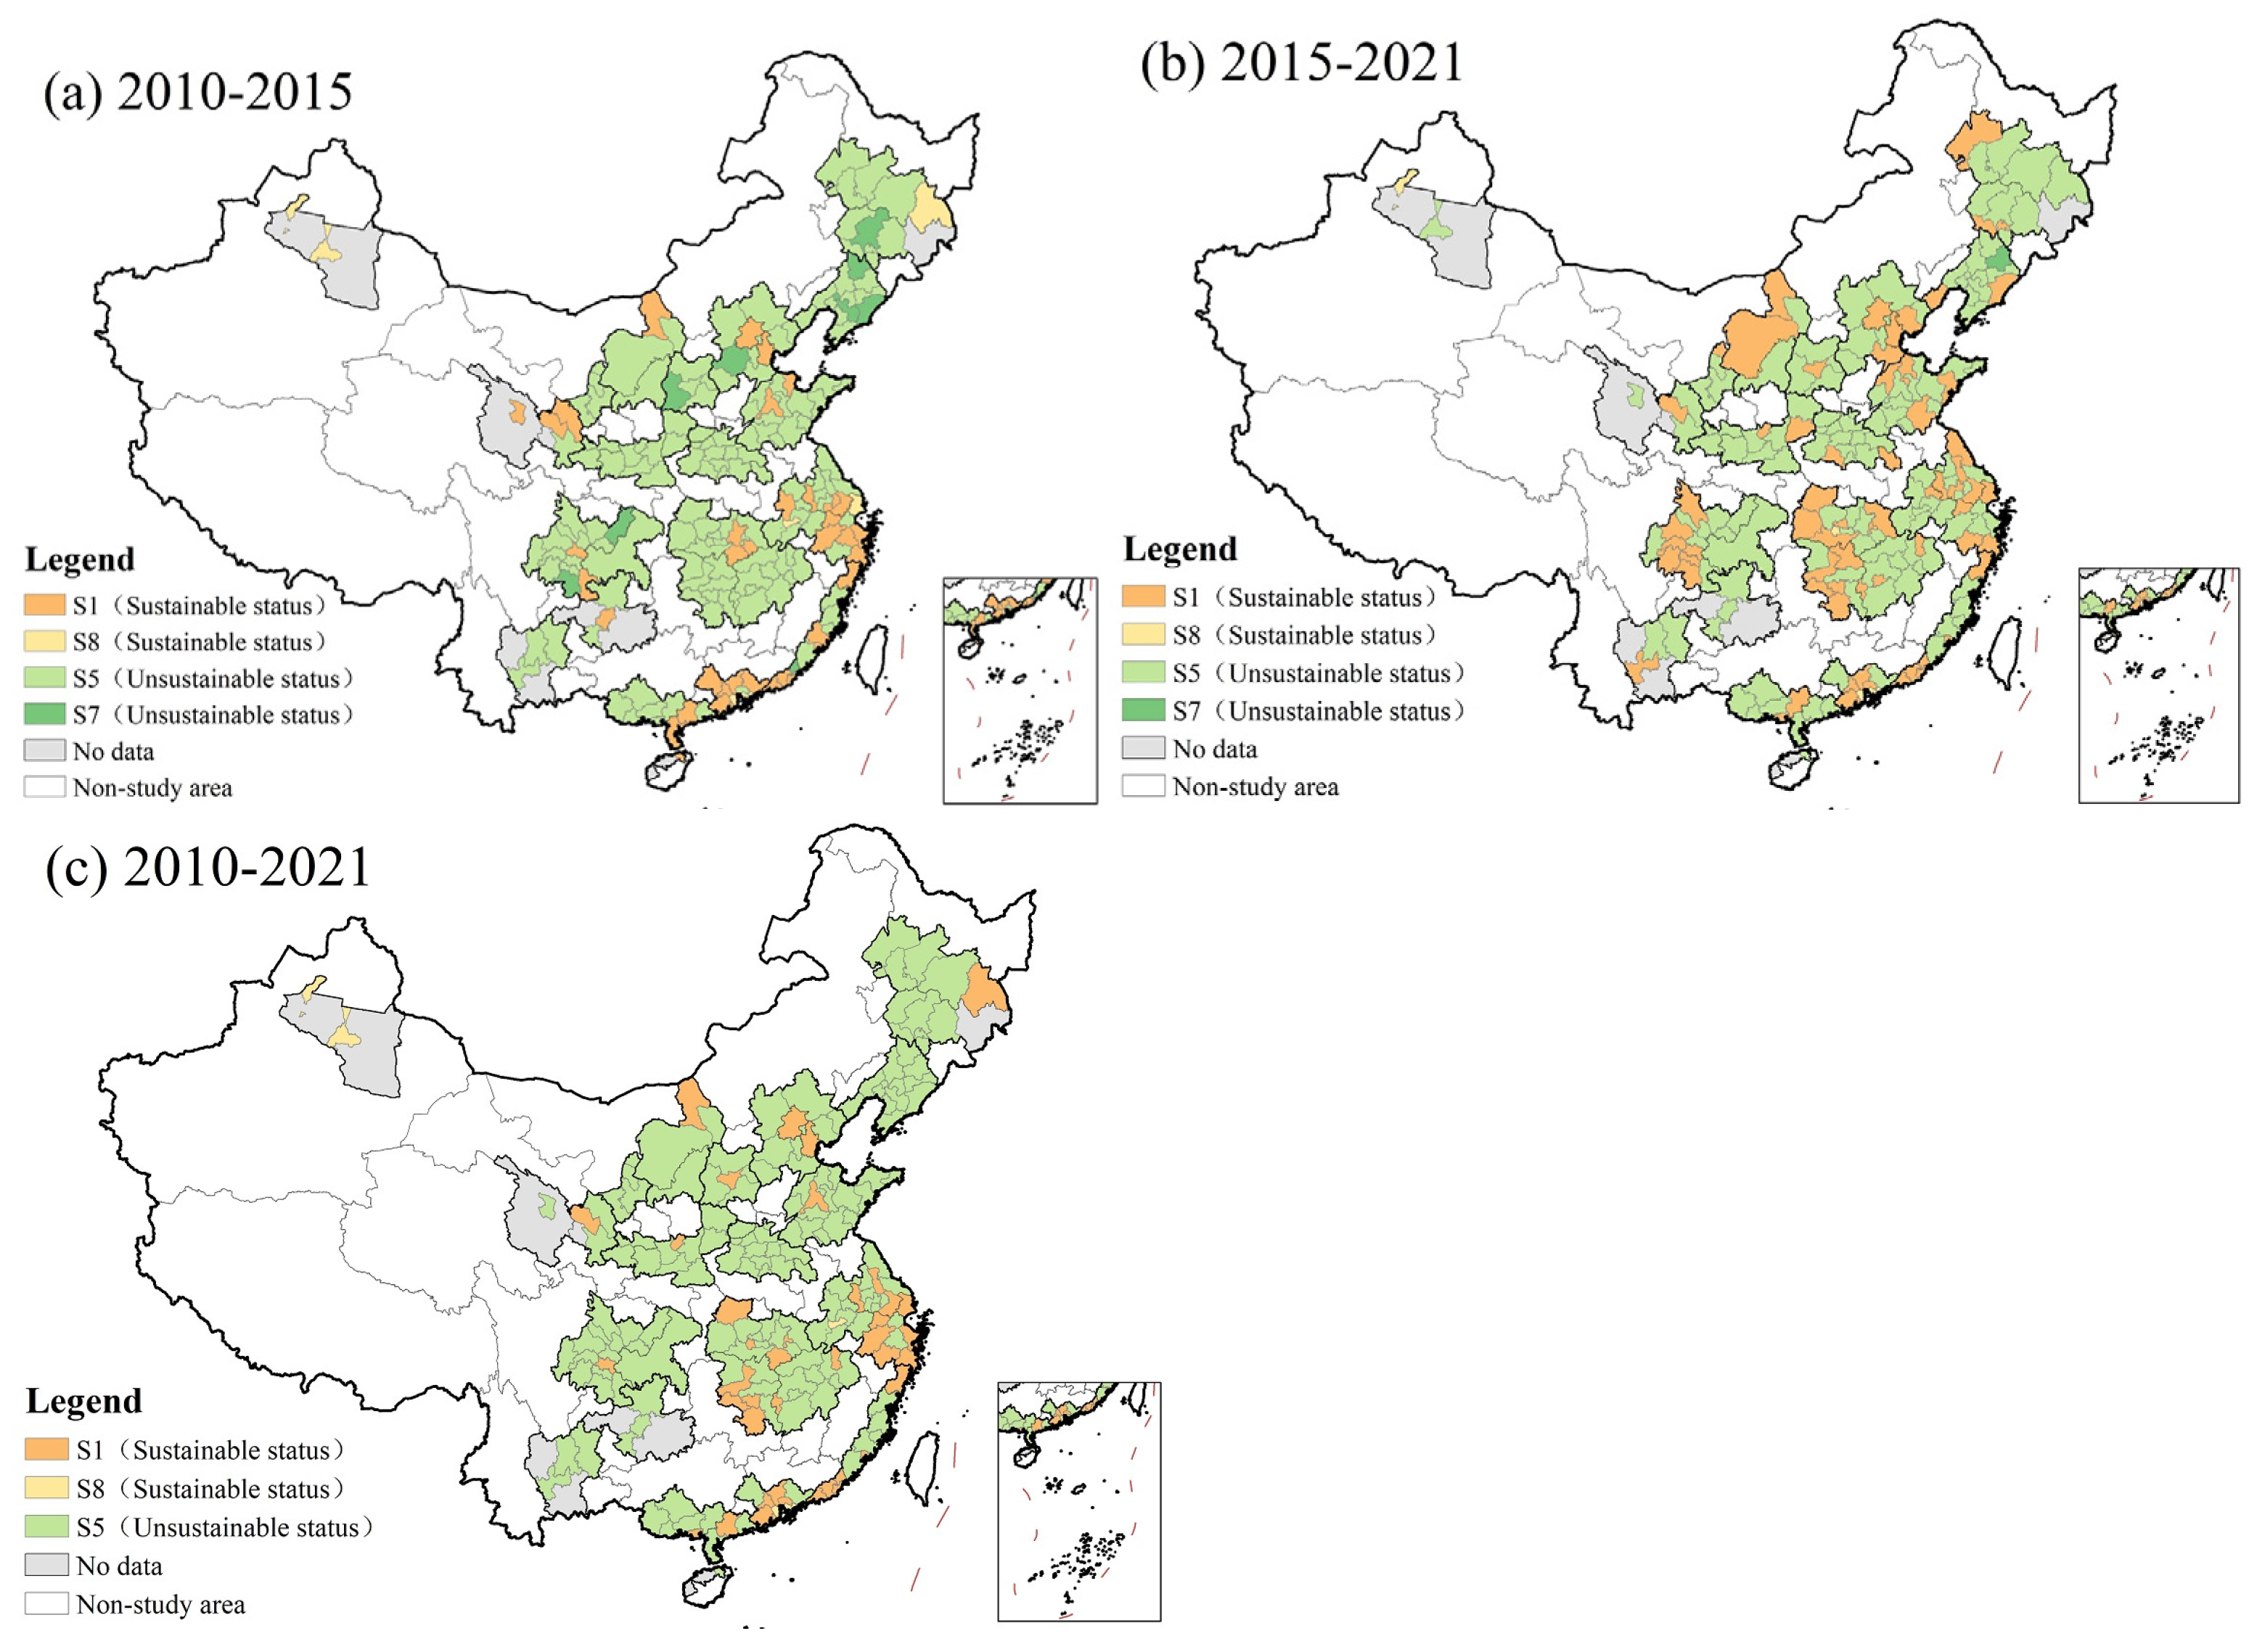
Figure 7.
Spatial changes in sustainable urbanization status (scenarios) in Chinese urban agglomerations in 2010–2021.
From 2010 to 2015, the urbanization rate increased in all the cities except for Shenzhen, Zhongshan, Shanghai, Kelamayi, Mudanjiang, Urumqi, and Tongling. Cities in the Liaodong Peninsula experienced a significant increase in their urbanization rate, with all their ∆ur values increasing by more than 20%. The urbanization sustainability increased in all the cities except for Chaozhou, Baoding, Dazhou, Dandong, Luliang, Yibin, Tieling, Anshan, and Changchun. Tianmen, Anshun, Baiyin, Zhuhai, Anqing, and Kaifeng exhibited significant increases in their urbanization sustainability, although these cities are dispersed across different urban agglomerations. As shown in Figure 7a, the statuses of sustainable urbanization in the study area can be divided into four categories (S1, S5, S7, and S8). During the surveyed period (2010–2015), the urbanization processes in 46 cities were sustainable. Among them, 39 cities, including Beijing, Tianjin, and Nanjing, belonged to scenario S1, while Shanghai, Tongling, Shenzhen, Zhongshan, Mudanjiang, Urumqi, and Kelamayi belonged to scenario S8, in Table 2. Among them, the cities with the highest absolute values of Esu were Shenzhen, Zhuhai, Guangzhou, Foshan, Shanwei, Xiamen, Beijing, Zhongshan, and Shanghai, all of them with absolute values of Esu > 6. However, 77% of cities had been engaging in unsustainable urbanization processes, with 145 cities belonging to scenario S5 and 9 cities to scenario S7. This indicated that urbanization sustainability increased in most cities between 2010 and 2015, with the ur increasing faster than the us.
During the surveyed period, from 2015 to 2021, the level of urbanization increased in all the cities except for Shenzhen, Zhongshan, Kelamayi, and Tianmen. Among them, 34 cities, such as Urumqi, Zhangjiakou, and Chuzhou demonstrated dramatic growth in their urbanization rates, with all of their ∆ur > 10%. Urbanization sustainability increased in all the cities except for Fushun during this period. The ∆us in 79.5% of the cities was higher than that observed during the period of 2010–2015. The statuses of sustainable urbanization between 2015 and 2021 can be categorized into four categories (S1, S5, S7, and S8). Fushun fell under S7, while Shenzhen, Zhongshan, Qianjiang, and Kalamayi belonged to S8. The remaining 67 and 128 cities belonged to S1 and S5, respectively. The identified scenarios presented in Figure 7b suggest that 71 cities entered a sustainable urbanization process during the period of 2015–2021. The absolute values of Esu in Shenzhen, Shanghai, Foshan, Beijing, and Xiamen were higher than five during this period, indicating that urbanization sustainability in these cities was continuously increasing, while their urbanization rate had not changed significantly. During the surveyed period, from 2015 to 2021, the urbanization process in 64.5% of the cities was unsustainable. Most of these cities belonged to S5, indicating that, although both the urbanization sustainability (us) and the urbanization rate (ur) were increasing, the urbanization rate increased faster than the urbanization sustainability from 2015 to 2021. Figure 7c indicates the sustainable urbanization scenarios of the cities in the study area, showing different statuses throughout the entire time period from 2010 to 2021. The status of sustainable urbanization of these cities is divided into three categories (S1, S5, and S8). Forty-seven cities entered a sustainable urbanization process, while the urbanization process in 153 cities was unsustainable during the whole surveyed period (2010–2021).
On the urban agglomeration scale, only the urbanization of the Yangze River Delta (S1), Pearl River Delta (S1), and Northern Tianshan (S8) urban agglomerations was sustainable in 2010–2021. In addition, the West Coast, Lanzhou–Xining, Harbin–Changchun, and Beijing–Tianjing–Hebei urban agglomerations experienced sustainable urbanization during the surveyed periods of 2010 to 2015 and 2015 to 2021 (Table 5).
Table 5.
Sustainable urbanization scenarios for urban agglomerations in 2010–2021.
5. Discussion
5.1. Dynamics of Sustainable Urbanization Status
From 2010–2015 to 2015–2021, the sustainable urbanization status of 119 cities remained unchanged. Among them, 21 cities, including Beijing, Tianjin, and Nanjing, maintained a sustainable urbanization status (S1 or S8), while 98 cities, including Shijiazhuang, Qinhuangdao, and Zhangjiakou continued to have an unsustainable urbanization status (S5). At the same time, 81 cities changed their sustainable urbanization status from 2010–2015 to 2015–2021 (Table 6). Table 6 shows that the status of sustainable urbanization in a city is not static. It changes with the implementation of different policies in different time periods. This finding was in line with the results of Shen et al. [28], who observed highly dynamic sustainability performances of urbanization among BRICS countries. Therefore, when studying the sustainable urbanization of cities, the choice of the study period is very important. Even if a city’s urbanization status appears to be unsustainable over a longer period, it is important to shorten the study period to reveal potential differences. So, if the city in question exhibits a sustainable urbanization status during the shortened study period, it is necessary to study the policies adopted by the government during this period. These useful policies can be employed to guide the city’s sustainable urbanization in the future. In addition, research conducted on different scales may lead to different results in the evaluation of sustainable urbanization. Therefore, it is necessary to conduct focused studies on different scales and recommend appropriate policies.
Table 6.
Cities changes in sustainable urbanization status (scenarios) from 2010–2015 to 2015–2021.
Moreover, cities that have obtained a sustainable urbanization status are not without challenges. They also have many problems that need to be improved to maintain said sustainable urbanization. For example, Beijing experienced severe haze events in the winters of 2013–2016, with PM2.5 levels significantly exceeding the standard value [59]. Since 2013, the Beijing’s government has implemented a series of measures to deal with the haze. These initiatives include planting billions of trees in the north and northwest of Beijing, shutting down coal-fired power plants, promoting cleaner heating, gradually phasing out older motor vehicles, and encouraging the use of new energy vehicles and public transportation. As a result of these measures, the annual average PM2.5 concentration in Beijing decreased from 89.5 to 33 micrograms per cubic meter between 2013 and 2021. This remarkable achievement has been acknowledged by the United Nations as the “Beijing Miracle”. Therefore, it is necessary to categorize cities undergoing sustainable and unsustainable urbanization and propose targeted policies to effectively promote sustainable urban development.
5.2. Change in City Size and Sustainable Urbanization Status
This section further explores the following question: does a faster city size growth contribute more to sustainable urbanization? By utilizing urban population to represent a city’s size, this paper analyzes the correlation relationship between changes in a city’s size and sustainable urbanization status (the elastic coefficient Esu) using Pearson’s correlation analysis. The results indicate that the correlation coefficients between the change in a city’s size and Esu for urban agglomerations in the years 2010–2015, 2015–2021, and 2010–2021 are 0.0107, 0.0002, and 0.0006, respectively (Figure 8). These correlation coefficients, all below 0.50, indicate that there is no significant corresponding relationship between the change in a city’s size and Esu. The expansion of a city’s size does not indicate that urbanization is progressing toward a sustainable status.
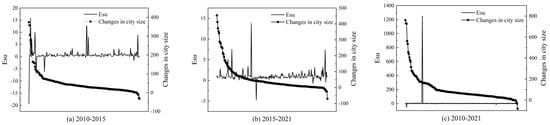
Figure 8.
Relationship between Esu and the change in a city’s size.
For example, between 2010 and 2015, 151 cities experienced population size increases but failed to enter a sustainable urbanization scenario. Conversely, Jieyang, Shanwei, and Mudanjiang, cities which experienced a decrease in their urban population size, demonstrated sustainable urbanization scenarios from 2010 to 2015. During the surveyed period (2015–2021), 119 cities experienced population size increases but exhibited unsustainable urbanization scenarios. Nine cities, including Beijing, Tianjin, Qianjiang, Tianmen, Yiyang, Pingxiang, Siping, Tongchuan, and Erdos, witnessed declines in their population size while engaging in sustainable urbanization scenarios. These results are consistent with scholars’ research indicating that the concentration of a large population in cities leads to urban sprawl, traffic congestion, the urban heat island effect, inadequate facilities, and a decline in residents’ standard of living, ultimately impacting the sustainability of cities [7].
5.3. Urbanization Growth Rate and Sustainable Urbanization Status
This section further explores whether rapidly urbanizing cities can be more sustainable. From 2010 to 2015, Dalian exhibited the fastest-growing urbanization rate, with an average annual increase of 5.2%, followed by Dandong, Panjin, Yingkou, and 25 other cities, all experiencing average annual increases of more than 2%. Additionally, 53 cities had average annual increases in their urbanization rates between 1.5% and 2%. However, despite this rapid urbanization, all these cities exhibited unsustainable urbanization scenarios during the study period. The situation in 2015–2021 was similar to that in 2010–2015. The difference was that the cities with a faster growth in their urbanization rates changed. Forty-four cities experienced an average annual growth rate exceeding 1.5%, but they all presented unsustainable urbanization in 2010–2015. From 2010 to 2021, the cities with an average annual growth rate of urbanization above 1.5% also engaged in unsustainable scenarios. This paper further investigated the correlation relationship between the change in a city’s urbanization rate (∆ur) and sustainable urbanization status (the elastic coefficient Esu) using Pearson’s correlation analysis. The results indicated that the correlation coefficients between the ∆ur and Esu for urban agglomerations in the years of 2010–2015, 2015–2021, and 2010–2021 were 0.017, 0.096, and 0.025, respectively (Figure 9). These coefficients indicate that there is no corresponding relationship between the ∆ur and Esu. Rapid urbanization brings economic prosperity but also poses enormous challenges. If a government fails to address them effectively, these challenges will hinder the sustainable development of cities. These findings were in line with the results of Almulhim and Cobbinah [60] in Saudi Arabia, who found that inadequate urban planning makes rapid urbanization a fundamental threat to sustainable urbanization.
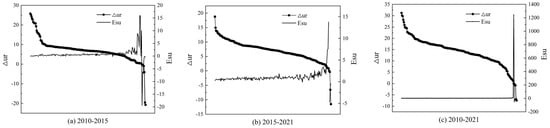
Figure 9.
Relationship between Esu and ∆ur.
5.4. The New Urbanization Policy and Sustainable Urbanization of Urban Agglomerations
The results of this study indicated a significant increase in the number of cities achieving sustainable urbanization since the implementation of China’s new urbanization policy. From 2010 to 2015, 46 cities in China’s urban agglomerations achieved sustainable urbanization, and the number increased to 71 during 2015–2021, an increase of 25 cities. In terms of the change in the urbanization sustainability values, 159 cities experienced a greater increase in Δus during 2015–2021 compared to the period from 2010 to 2015. The Esu exhibited a similar pattern, with approximately 70% of cities experiencing a significant increase between 2015 and 2021 compared to the period of 2010 to 2015. During the period of 2015–2021, specific indicators of social sustainability exhibited promising trends: 60% of cities experienced a reduction in their registered unemployment rate, and 95% witnessed a decrease in the income disparity between urban and rural residents. Additionally, 53% of cities observed an increase in the ratio of teachers to students in primary and middle schools. Moreover, 85% of cities witnessed a rise in the number of college students per million population, and 96% reported an increase in the number of licensed doctors per million population. Moreover, it is noteworthy to consider the impact of the novel coronavirus pandemic. A study conducted by Duan et al. [61] reveals that the Chinese industry and services sectors were severely affected, resulting in a 3.5% reduction in China’s economic growth in 2020. It is plausible that more cities would have entered a sustainable urbanization status had they not been impacted by the pandemic. Therefore, it can be concluded that the implementation of the new urbanization policy promotes the sustainable urbanization of cities in Chinese urban agglomerations.
6. Conclusions
This study evaluated the sustainable urbanization status of urban agglomerations in China using the elastic coefficient proposed by Shen et al. [28]. The results indicate a consistent upward trend in the synthesized value of urbanization sustainability across Chinese urban agglomerations from 2010 to 2020. Urban agglomerations in their mature stage exhibited the highest sustainability values, followed by those in their late, early, and primary growth stages. Throughout the study period, the majority of cities experienced a continuous increase in their urbanization sustainability values, particularly with a significant progress being observed between 2015 and 2021. During the surveyed period (2010–2015), sustainable urbanization processes were observed in 46 cities, a number which increased to 71 in the subsequent period, from 2015 to 2021. However, when investigating the entire time period from 2010 to 2021, only 46 cities maintained a sustainable urbanization status. This result revealed that the status of sustainable urbanization is dynamic and changes with the implementation of different policies in different time periods. Therefore, it is important to find out which policies are adopted by a government during a sustainable urbanization period, as these policies can be further utilized to guide the urbanization process of the city in the future. Moreover, cities with a sustainable urbanization status also face various challenges and issues. It is necessary to categorize cities undergoing sustainable and unsustainable urbanization and propose targeted policies to effectively promote sustainable urban development. This paper examined the relationships between changes in a city’s size or urbanization growth rate and sustainable urbanization, separately. The results indicated that there is no correspondence between them. A larger city size does not indicate sustainable urbanization, and, similarly, cities with faster urbanization rates do not exhibit a higher sustainability.
Since the implementation of China’s new urbanization policy, most cities witnessed notable improvements in their urbanization sustainability from 2015 to 2021, surpassing the progress observed in the period from 2010 to 2015. Simultaneously, there has been a substantial increase in the number of cities entering sustainable urbanization processes after 2015. Considering the impact of the new coronavirus, it is anticipated that more cities would have entered a sustainable urbanization process had they not been affected. Consequently, the implementation of the new urbanization policy promotes the sustainable urbanization of Chinese urban agglomerations. However, there are still many problems and challenges. Economic sustainability remains low in many cities. Therefore, it is crucial to increase the vitality of the economic development of a city in the future to ensure lasting economic growth. There is no correlation between changes in a city’s size or urbanization rate and its sustainable urbanization status. Therefore, in promoting the process of this new urbanization, it is not possible simply to pursue the expansion of a city’s size or increase the rate of urbanization. The urban agglomerations in the eastern region have a relatively high level of economic and social sustainability and will need to control population growth in their megacities and strengthen environmental protection and governance. The urban agglomerations in central and western China need to accelerate their scientific and technological innovation, rely on comparative advantages, develop modern industries, coordinate the division of functions between cities, and enhance the vitality of the economic development of their urban agglomerations.
In this study, we primarily employed the subjective empowerment method and statistical data to evaluate the effect of China’s new urbanization policy from the perspective of sustainable urbanization. Future research endeavors could focus on employing the objective empowerment method and expanding the theoretical framework between new-type urbanization policies and sustainable urbanization outcomes. Moreover, the Chinese government has implemented three batches of new urbanization pilot areas, encompassing two provinces and over two hundred cities and towns, since 2014. It is necessary to select typical cases from these pilot areas to study the effects and sustainability of this new urbanization at the provincial, city, county, and town levels.
Author Contributions
Conceptualization, S.L. and L.J.; methodology, X.L.; validation, S.L., L.J. and F.Z.; formal analysis, S.L.; investigation, L.J.; resources, L.J.; data curation, R.W. and L.Z.; writing—original draft preparation, L.J.; writing—review and editing, S.L. and X.T.; visualization, L.J.; iproject administration, L.J.; funding acquisition, S.L. and X.T. All authors have read and agreed to the published version of the manuscript.
Funding
This research was funded by the National Natural Science Foundation of China (42171175), the Innovation Research 2035 Pilot Plan of Southwest University of China (SWUPilotPlan031), and the Special Fund for Youth Team of the Southwest University (SWU-XJPY202307).
Data Availability Statement
The data that support this study are available from the corresponding author upon reasonable request.
Conflicts of Interest
The authors declare no conflicts of interest.
References
- United Nations, Department of Economic and Social Affairs, Population Division. World Urbanization Prospects: The 2018 Revision (ST/ESA/SER.A/420); United Nations: New York, NY, USA, 2019. [Google Scholar]
- Bloom, D.E.; Canning, D.; Fink, G. Urbanization and the Wealth of Nations. Science 2008, 319, 5864. [Google Scholar] [CrossRef] [PubMed]
- Glaeser, E. Cities, Productivity, and Quality of Life. Science 2011, 333, 6042. [Google Scholar] [CrossRef] [PubMed]
- Ochoa, J.J.; Tan, Y.T.; Qian, Q.K.; Shen, L.Y.; Moreno, E.L. Learning from best practices in sustainable urbanization. Habitat Int. 2018, 78, 83–95. [Google Scholar] [CrossRef]
- Ahmad, N.; Raid, M.; Alzyadat, J.; Alhawal, H. Impact of urbanization and income inequality on life expectancy of male and female in South Asian countries: A moderating role of health expenditures. Humanit. Soc. Sci. Commun. 2023, 10, 552. [Google Scholar] [CrossRef]
- Fang, C.L.; Bao, C.; Ma, H.T. China’s Urban Agglomeration Development Report in 2016; People’s Publishing House: Beijing, China, 2016. [Google Scholar]
- Kalnay, E.; Cai, M. Impact of urbanization and land-use change on climate. Nature 2003, 423, 528–531. [Google Scholar] [CrossRef]
- Olivier, T.; Thébault, E.; Elias, M.; Fontaine, B.; Fontaine, C. Urbanization and agricultural intensification destabilize animal communities differently than diversity loss. Nat. Commun. 2020, 11, 2686. [Google Scholar] [CrossRef] [PubMed]
- Guo, J.H.; Yu, Z.Q.; Ma, Z.H.; Xu, D.Y.; Cao, S.X. What factors have driven urbanization in China? Environ. Dev. Sustain. 2022, 24, 6508–6526. [Google Scholar] [CrossRef]
- Lu, D.D.; Chen, M.X. Several viewpoints on the background of compiling the “National New Urbanization Planning (2014–2020)”. Acta Geogr. Sin. 2015, 70, 179–185. (In Chinese) [Google Scholar]
- Fang, C.L.; Ma, H.T. New City District Development and Intensive Land Use in the Context of New-type Urbanization. China Land Sci. 2013, 27, 4–9. (In Chinese) [Google Scholar]
- Chen, M.X.; Gong, Y.H.; Lu, D.D.; Ye, C. Build a people-oriented urbanization: China’s new-type urbanization dream and Anhui model. Land Use Policy 2019, 80, 1–9. [Google Scholar] [CrossRef]
- Chu, Y.W. China’s new urbanization plan: Progress and structural constraints. Cities 2020, 103, 102736. [Google Scholar] [CrossRef]
- Bai, X.M.; Shi, P.J.; Liu, Y.S. Society: Realizing China’s urban dream. Nature 2014, 509, 158–160. [Google Scholar] [CrossRef] [PubMed]
- Chen, M.X.; Liu, W.D.; Lu, D.D.; Chen, H.; Ye, C. Progress of China’s new-type urbanization construction since 2014: A preliminary assessment. Cities 2018, 78, 180–193. [Google Scholar] [CrossRef]
- Yu, B.B. Ecological effects of new-type urbanization in China. Renew. Sustain. Energy Rev. 2021, 135, 110239. [Google Scholar] [CrossRef]
- Xu, C.; Wang, S.X.; Zhou, Y.; Wang, L.T.; Liu, W.L. A Comprehensive Quantitative Evaluation of New Sustainable Urbanization Level in 20 Chinese Urban Agglomerations. Sustainability 2016, 8, 91. [Google Scholar] [CrossRef]
- Yang, Y.; Huang, C.; He, C.Y.; Huang, Q.X. The Spatiotemporal Dynamics of New-Type Urbanization Comprehensive Level in Shandong Peninsula Urban Agglomeration. Econ. Geogr. 2017, 37, 77–85. (In Chinese) [Google Scholar]
- UN-Habitat/DFID. Sustainable Urbanisation: Achieving Agenda 21; UN-Habitat/DFID: Nairobi, Kenya, 2002. [Google Scholar]
- Fang, C.L. Important Progress and Prospects of China’s Urbanization and Urban Agglomeration in the Past 40 Years of Reform and Opening-Up. Econ. Geogr. 2018, 38, 1–9. (In Chinese) [Google Scholar]
- Fang, C.L.; Cui, X.G.; Li, G.D.; Bao, C.; Wang, Z.B.; Ma, H.T.; Sun, S.; Liu, H.M.; Luo, K.; Ren, Y.F. Modeling regional sustainable development scenarios using the Urbanization and Eco-environment Coupler: Case study of BeijingTianjin-Hebei urban agglomeration, China. Sci. Total Environ. 2019, 689, 820–830. [Google Scholar] [CrossRef]
- Pivo, G. Toward sustainable urbanization on Mainstreet Cascadia. Cities 1996, 13, 339–354. [Google Scholar] [CrossRef]
- Drakakis-Smith, D.; Dixon, C. Sustainable urbanization in Vietnam. Geoforum 1997, 28, 21–38. [Google Scholar] [CrossRef]
- UN-Habitat/DFID. World Cities Report 2020: The Value of Sustainable Urbanization. 2020. Available online: https://www.citiesalliance.org/newsroom/news/urban-news/world-cities-report-2020-value-sustainable-urbanization (accessed on 20 August 2023).
- Rasoolimanesh, S.M.; Badarulzaman, N.; Jaafar, M. City Development Strategies (CDS) and Sustainable Urbanization in Developing World. Procedia-Soc. Behav. Sci. 2012, 36, 623–631. [Google Scholar] [CrossRef]
- Shen, L.Y.; Peng, Y.; Zhang, X.L.; Wu, Y.Z. An alternative model for evaluating sustainable urbanization. Cities 2012, 29, 32–39. [Google Scholar] [CrossRef]
- Zhang, X.L. Sustainable urbanization: A bi-dimensional matrix model. J. Clean. Prod. 2016, 134, 425–433. [Google Scholar] [CrossRef]
- Shen, L.Y.; Shuai, C.Y.; Jiao, L.D.; Tan, Y.T.; Song, X.S. Dynamic sustainability performance during urbanization process between BRICS countries. Habitat Int. 2017, 60, 19–33. [Google Scholar] [CrossRef]
- Fang, X.; Shi, X.Y.; Phillips, T.K.; Du, P.; Gao, W.J. The coupling coordinated development of urban environment towards sustainable urbanization: An empirical study of Shandong Peninsula, China. Ecol. Indic. 2021, 129, 107864. [Google Scholar] [CrossRef]
- Cui, X.G.; Fang, C.L.; Liu, H.M.; Liu, X.F. Assessing sustainability of urbanization by a coordinated development index for an Urbanization-Resources-Environment complex system: A case study of Jing-Jin-Ji region, China. Ecol. Indic. 2019, 96, 383–391. [Google Scholar] [CrossRef]
- Kovács, Z.; Farkas, J.Z.; Szigeti, C.; Harangozó, G. Assessing the sustainability of urbanization at the sub-national level: The Ecological Footprint and Biocapacity accounts of the Budapest Metropolitan Region, Hungary. Sustain. Cities Soc. 2022, 84, 104022. [Google Scholar] [CrossRef]
- Liu, S.W.; Zhang, P.Y.; Jiang, X.L.; Lo, K. Measuring sustainable urbanization in China: A case study of the coastal Liaoning area. Sustain. Sci. 2013, 8, 585–594. [Google Scholar] [CrossRef]
- Longato, D.; Cortinovis, C.; Balzan, M.; Geneletti, D. A method to prioritize and allocate nature-based solutions in urban areas based on ecosystem service demand. Landsc. Urban Plan. 2023, 235, 104743. [Google Scholar] [CrossRef]
- Hernández, R.C.; Camerin, F. Assessment of ecological capacity for urban planning and improving resilience in the European framework: An approach based on the Spanish case. Cuad. Investig. Geográfica 2023, 49, 119–142. [Google Scholar] [CrossRef]
- Verma, A.; Sudhira, H.S.; Sudhira, S.; King, R.; Dash, N. Sustainable urbanization using high speed rail (HSR) in Karnataka, India. Res. Transp. Econ. 2013, 38, 67–77. [Google Scholar] [CrossRef]
- Roy, M. Planning for sustainable urbanization in fast growing cities: Mitigation and adaptation issues addressed in Dhaka, Bangladesh. Habitat Int. 2009, 33, 276–286. [Google Scholar] [CrossRef]
- Xu, Q.R.; Zheng, X.Q.; Zheng, M.R. Do urban planning policies meet sustainable urbanization goals? A scenario-based study in Beijing, China. Sci. Total Environ. 2019, 670, 498–507. [Google Scholar] [CrossRef] [PubMed]
- Xiong, W.; Chen, B.; Wang, H.M.; Zhu, D.J. Public–private partnerships as a governance response to sustainable urbanization: Lessons from China. Habitat Int. 2020, 95, 102095. [Google Scholar] [CrossRef]
- Yang, C.Y.; Zhu, C.H.; Albitar, K. ESG ratings and green innovation: A U-shaped journey towards sustainable development. Bus. Strategy Environ. 2023. [Google Scholar] [CrossRef]
- Wu, J.W.; Yang, C.Y.; Chen, L. Examining the non-linear effects of monetary policy on carbon emissions. Energy Econ. 2024, 131, 107206. [Google Scholar] [CrossRef]
- Fang, C.L.; Yu, D.L. Urban agglomeration: An evolving concept of an emerging Phenomenon. Landsc. Urban Plan. 2017, 162, 126–136. [Google Scholar] [CrossRef]
- Rice, S.A. Problems in the statistics of urban agglomeration: The growth of urban areas has made necessary new concepts and reformulations in social statistics. Science 1958, 128, 1111–1114. [Google Scholar] [CrossRef]
- Kanemoto, Y.; Tokuoka, K. Proposal for the standards of metropolitan areas of Japan. J. Appl. Reg. Sci. 2002, 7, 1–15. [Google Scholar]
- Lang, R.; Knox, P.K. The new metropolis: Rethinking megalopolis. Reg. Stud. 2009, 43, 789–802. [Google Scholar] [CrossRef]
- Mun, S.I. Transport network and system of cities. J. Urban Econ. 1997, 42, 205–221. [Google Scholar] [CrossRef]
- Goetz, A.R. Air passenger transportation and growth in the US urban system 1950–1987. Growth Chang. 1992, 23, 218–242. [Google Scholar] [CrossRef]
- Sohn, J. Do birds of a feather flock together? Economic linkage and geographic proximity. Ann. Reg. Sci. 2004, 38, 47–73. [Google Scholar] [CrossRef]
- Chen, H.; Lu, L.; Zhang, S.T. The Spatial Network Structure of the Tourism Destinations in Urban Agglomerations Based on Tourist Flow: A Case Study of the Pearl River Delta. Acta Geogr. Sin. 2011, 66, 257–266. (In Chinese) [Google Scholar]
- Hua, C.; Zhang, Z.H.; Miao, J.J.; Sun, H.P.; Jia, F.L. Do urban agglomeration planning policies promote the discharge reduction of industrial wastewater: Evidence from the Yellow River Basin in China. Environ. Res. 2023, 239, 117445. [Google Scholar] [CrossRef]
- Yang, Y.; Zhao, N. Vulnerability assessment of urban agglomerations to the risk of heat waves in China since the 21st century. Environ. Pollut. 2023, 336, 122443. [Google Scholar] [CrossRef] [PubMed]
- Hu, R.F.; Xu, W.Q.; Liu, L.F.; Cui, Z.Y.; Zhao, C.Y. The impact of urban agglomerations on carbon emissions in China: Spatial scope and mechanism. J. Clean. Prod. 2023, 419, 138250. [Google Scholar] [CrossRef]
- Guan, X.G.; Ren, F.R.; Cui, Z.; Zhang, X.R.; Zhang, X.; Jing, Z.Y. Environmental quality assessment and spatial spillover effects of three urban agglomerations in China: A Meta-EBM approach. Heliyon 2023, 9, e19028. [Google Scholar] [CrossRef]
- Cui, Z.; Yang, F.; Ren, F.R.; Zhang, X.; Jing, Z.Y. Assessing sustainability environmental performance of three urban agglomerations in China: An input–output modeling approach. Ecol. Indic. 2021, 130, 108079. [Google Scholar] [CrossRef]
- Huang, L.; Wu, J.G.; Yan, L.J. Defining and measuring urban sustainability: A review of indicators. Landsc. Ecol. 2015, 30, 1175–1193. [Google Scholar] [CrossRef]
- Pallathadka, A.; Chang, H.J.; Ajibade, I. Urban sustainability implementation and indicators in the United States: A systematic review. City Environ. Interact. 2023, 19, 100108. [Google Scholar] [CrossRef]
- Harris, J.M. Basic Principles of Sustainable Development. Development and Comp Systems. Global Development and Environment Institute Working Paper 00-04. 2000. Available online: https://econwpa.ub.uni-muenchen.de/econ-wp/dev/papers/0106/0106006.pdf (accessed on 1 October 2023).
- Department of Development Planning National Development and Reform Commission. China Integrated City Index 2016 Development Strategy of Megalopolis 2016; People’s Publishing House: Beijing, China, 2016. [Google Scholar]
- Zhang, G.J.; Wang, Y.Z.; Chen, Y.; Zhou, C.S. Spatiotemporal characteristics and differentiation mechanism of high-quality development of urban agglomerations in China. Geogr. Res. 2022, 41, 2109–2124. [Google Scholar]
- Cai, W.; Li, K.; Liao, H.; Wang, H.J.; Wu, L.X. Weather conditions conducive to Beijing severe haze more frequent under climate change. Nat. Clim. Chang. 2017, 7, 257–262. [Google Scholar] [CrossRef]
- Almulhim, A.I.; Cobbinah, P.B. Can rapid urbanization be sustainable? The case of Saudi Arabian cities. Habitat Int. 2023, 139, 102884. [Google Scholar] [CrossRef]
- Duan, H.B.; Bao, Q.; Tian, K.L.; Wang, S.Y.; Yang, C.H.; Cai, Z.W. The hit of the novel coronavirus outbreak to China’s economy. China Econ. Rev. 2021, 67, 101606. [Google Scholar] [CrossRef] [PubMed]


Disclaimer/Publisher’s Note: The statements, opinions and data contained in all publications are solely those of the individual author(s) and contributor(s) and not of MDPI and/or the editor(s). MDPI and/or the editor(s) disclaim responsibility for any injury to people or property resulting from any ideas, methods, instructions or products referred to in the content. |
© 2024 by the authors. Licensee MDPI, Basel, Switzerland. This article is an open access article distributed under the terms and conditions of the Creative Commons Attribution (CC BY) license (https://creativecommons.org/licenses/by/4.0/).