Article

Geochemical Factors as a Tool for Distinguishing Geogenic from Anthropogenic Sources of Potentially Toxic Elements in the Soil

1
Faculty of Mining, Geology and Petroleum Engineering, University of Zagreb, Pierottijeva 6, 10000 Zagreb, Croatia
2
GDi, Baštijanova 52a, 10000 Zagreb, Croatia
*
Author to whom correspondence should be addressed.
Land 2024, 13(4), 434; https://doi.org/10.3390/land13040434
Submission received: 4 March 2024 / Revised: 25 March 2024 / Accepted: 26 March 2024 / Published: 29 March 2024
(This article belongs to the Section Land, Soil and Water)

Abstract

:
Potentially toxic element (PTE) contamination of soils and their sources remains one of key global environmental concerns. Agricultural soil in Kalinovac, Podravina region, Croatia is the subject of this study. The main aims include determining the concentration and distribution of PTEs in the soil, differentiation between possible geogenic and anthropogenic sources, and determining the correlation between the analysed PTEs and soil parameters. To achieve these objectives, geochemical analyses of the soil in the study area were carried out. Spatial distribution of the individual PTE contents, enrichment factors (EF), contamination factors (CF), and geoaccumulation index (Igeo) were created using GIS tools. In addition, statistical data processing was carried out, including the calculation of the correlation matrix, hierarchical cluster analysis (HCA), and factor analysis. The obtained results show that certain elements such as lead, chromium, copper, and cadmium were predominantly of anthropogenic origin in the study area, while others tended to have more geogenic origin. By applying different methods used in this study, it is possible to distinguish between geogenic and anthropogenic sources of PTEs in soils of this type.

1. Introduction

Nowadays, with the evermore accelerated progress of technology and society, various parts of the environment can be endangered. Certain toxic substances can cause serious problems if they enter the environment, especially the soil. Potentially toxic elements (PTEs) are among the substances that can potentially endanger the soil [1]. PTEs can enter the environment as naturally occurring compounds or anthropogenically from various sources [2]. The main sources of anthropogenic inputs of PTEs to soils are household waste, industrial activities, traffic emissions, and agricultural activities (pesticides and fertilisers) [3,4,5,6,7].
Various factors and calculation methods are proposed through literature to quantify the accumulation of PTEs and to evaluate the geogenic and anthropogenic source of these substances in soils [8,9,10,11,12]. Sun et al. [11] concluded that human activity is the main reason for soil contamination with Cu and Pb. Their study determined that industrial and agronomic practices were associated with elevated Cu concentrations, while industrial exhaust, coal combustion exhaust, and domestic waste were the main sources of Pb.
Three factors are commonly used in soil geochemistry: the enrichment factor (EF), geoaccumulation index (Igeo), and contamination factor (CF). Numerous studies have used these factors to distinguish the sources of contamination [13,14,15]. Yaylalı-Abanuz [14], using the mentioned factors, found that high concentrations of PTEs in soils surrounding industrial complexes originated from an anthropogenic source associated with uncontrolled solid and liquid wastes from industrial facilities and heavy traffic.
Some studies [16,17,18,19,20] have also used EF as a discriminator to determine the importance of the lithological contribution compared to the anthropogenic origin. Bourennane et al. [17] used EF maps to support the assessment of enrichment of upper soil horizons with external input of trace elements. The results of this study concluded that surface horizons are highly enriched with Cd due to strong anthropogenic activities (vehicle emissions and metallurgical industries) and in agricultural areas due to the use of urban sewage sludge, manure, and phosphate-enriched fertilisers.
The geoaccumulation index (Igeo) is useful for assessing and analysing trace elements in soil as it intuitively reflects the impact of human activities on trace elements as well as the impact of trace elements on the environment [21,22]. The method was introduced by Muller [23] and is commonly used to quantify metal pollution in soils and aquatic sediments. Wdowczyk et al. [22] found increased Cd levels in areas where intensive mining as well as metallurgical and industrial activities were carried out. Their study also indicates the impact of human activities on heavy metal concentrations in soils.
The contamination factor (CF) is used to assess the degree of soil contamination and to distinguish between natural and anthropogenic inputs [24,25]. Said et al. [25] identified uncontaminated to moderately contaminated soils, indicating traffic emissions and phosphate fertilisers as important sources of Pb in soil.
The subject of this study is the PTEs in soils in the area of Kalinovac, Podravina (Croatia). Elevated concentrations of PTEs in soils were found in previous regional-scale investigations in this area. Halamić and Miko [26] concluded that the elevated Cd, Pb, and Zn concentrations in Podravina are a consequence of the drainage of the Drava River in areas naturally rich in zinc and many years of mining activities in the Republic of Slovenia and Austria. To confirm such claims, additional analyses, in the form of geochemical factors, were carried out.
The objectives of this study are as follows: (a) to determine the concentration and distribution of PTEs in soils, (b) to distinguish between anthropogenic and natural sources of PTEs, and (c) to establish a correlation between the analysed PTEs in soils. To achieve these objectives, geochemical analyses of surface soils were carried out. The data obtained were analysed using statistical and spatial analyses.

2. Geological and Pedological Characteristics of the Area

The Kalinovac site is situated in the heart of the Drava River valley in the Podravina region, belonging to the Croatian part of the Pannonian Basin (Figure 1). The Podravina region, which stretches from the northern banks of the Drava River to the Bilogora Hills and the northern slopes of Kalnik in the south, is primarily a lowland area with altitude varying between 115 and 135 m.
The current Podravina landscape bears the marks of a significant warming period that marked the end of the Pleistocene and the beginning of the Holocene. During this period, due to increase in temperature, snow began melting in the Alps, triggering torrents and significant fluvial erosion that was transported to Podravina region. The deposition of sand and gravel, subsequently overlaid by a humus layer, largely determines the modern geography of Podravina. This landscape includes Drava River, with its numerous meanders and an extensive alluvial plain on both left and right riverbanks [27].
Drava River alluvial plain contains three river terraces. The third terrace, being the oldest, was formed at the end of the Pleistocene and consists of loess sediments. The interplay between cold, dry periods and occasional warmer periods led to the accumulation of aeolian sand and loess and intermittent fluvial deposits [28]. The second terrace, formed during the second Würm interglacial [29], exhibits a transition from a more coarse-grained sands at its base to fine-grained silts at its top. Typical mineralogical components suggest the Eastern Alps as its origin. The youngest, the first terrace, is closest to the Drava River and sometimes overlies the second terrace. It was formed during the third Würm interglacial and has an uneven surface that is often flooded during periods of high water levels. The sedimentary units predominating here consist of sands, gravelly sands, and sandy gravels [30]. The samples obtained for this study are situated on the second Drava River terrace.
The predominant soil in the study region are Gleysols and Fluvisols, with sporadic occurrences of Stagnosols (hydromorphic) [31]. Previous field investigation identified the soil at the observed site as Gleysols, with significantly elevated Fe contents [28]. These wetland Gleysols have localised redoximorphic features, mainly Fe-oxyhydroxides [32], a consequence of complex and variable redox conditions within the soil. The study site is located on an agricultural parcel where maize is grown in monoculture, as confirmed by previous field investigations.

3. Materials and Methods

3.1. Sampling and Sample Preparation

A field investigation was carried out in spring 2022, resulting in acquiring 56 soil samples using Eijkelkamp drill. Precise positions of the sampling locations and the sampling density were determined using a regular square grid (75 × 75 m), created within ArcGIS Pro 3.0 software (Figure 1). ArcGIS Field Maps software, with precision less than 1 m, was used for field data collection. The accuracy achieved was less than 1 m. At each of the sampling points, a soil auger was used to drill 5 holes in a central position and about 1 m in each direction, creating a composite sample, from the 10 to 30 cm soil profile sampled. Since the uppermost 10 cm in agricultural soils are usually in direct contact with chemical pesticides, this area was avoided during sampling. The samples were placed into designated plastic bags and conveyed to the lab. Following this, soil samples underwent air-drying and were sifted through a 2 mm sieve to prepare them for laboratory analysis.

3.2. Laboratory Work

Geochemical contents of Cr, Ni, Cu, Cd, Pb, and Zn were measured using the Hitachi XMET 8000 Expert Geo portable X-ray fluorescence (pXRF) instrument (Bruker Corporation, Billerica, Massachusetts, United States of America). Each sample was measured five times using Soil calibrations, with the average value calculated. The accuracy of analysis was ensured through the examination of standard soil material (NIST 2711) within the sample batches under study. Instrumental precision, determined through five measurements alongside blanks and standards, maintained a margin of error of ±5% or lower. Total carbon (TC) and total inorganic carbon (TIC) analyses were carried out on soil samples to determine the percentage of organic matter. The analyses were carried out using the Multi EA 4000 CS analyser (Analytik Jena GmbH+Co. KG, Jena, Germany). For both analyses, about 600 to 800 mg of previously dried, crushed, and ground samples were used. The total carbon analysis was carried out on all 56 samples, while the TIC analysis was only carried out on two samples, as the TIC values were below the detection limit. It was therefore concluded that the TC value originates exclusively from organic carbon.

3.3. Geochemical Factors

The EF is calculated as the ratio between the studied element and the reference element and normalised with the same ratio for the composition of the continental crust [33]. Many researchers use local background values instead of the average crust composition [34,35]. Iron (Fe) was used as the conservative element for EF calculation, due to variable redox conditions in the study area. Several authors have employed Fe to normalise heavy metals [13,36,37,38].
The formula to calculate EFs can be generalised to be (where ‘‘crust’’ can be replaced by a local or/and state background):
E F E l E l s a m p l e / X s a m p l e E l c r u s t / X c r u s t
where Elsample/Xsample represents the ratio of concentration of the analysed element (Elsample) and concentration of Fe (Xsample), and Elcrust/Xcrust is the ratio of element concentrations (As, Cd, Cu, Cr, Zn, Pb, Ni) in local background materials and the background concentration of Fe in local materials. According to Barbieri [39], EF < 2 is deficiency to minimal enrichment; 2–5 is moderate enrichment; 5–20 is significant enrichment; 20–40 is very high enrichment; and >40 is extremely high enrichment.
The geoaccumulation index (Igeo) for soil samples was calculated using the following equation:
I g e o = l o g 2 ( C n / 1.5 B n )
where Cn is the concentration of PTEs measured in soil samples at the study site, Bn is the background value of the corresponding PTEs (n), and the factor 1.5 is the background matrix correction due to lithogenic effects [40]. In this study, Bn values for PTEs were taken from the Geochemical Atlas of Croatia for the Podravina region [26]. The geoaccumulation index (Igeo) comprises seven classes (0–6): uncontaminated (<0), uncontaminated to moderately contaminated (1), moderately contaminated (2), moderately to heavily contaminated (3), heavily contaminated (4), heavily to very heavily contaminated (5), and very heavily contaminated (6) [40].
Contamination factor (CF) is calculated as a ratio between the PTEs in the samples and the background level of the corresponding PTEs [40]. The contamination factor was classified into four groups by [24]: low (CF < 1), moderate (1 ≤ CF ≤ 3), considerable (3 ≤ CF ≤ 6), and very high (CF > 6).

3.4. Spatial and Statistical Analyses

The spatial distribution of selected geochemical elements was performed using the Spline with Barriers interpolation method, which is available as part of the Spatial Analyst Tools in ArcGIS Pro 3.0 software. This tool uses an interpolation technique that employs a mathematical function to estimate values and minimise the overall curvature of the surface. This results in the creation of a smooth surface that precisely traverses the input points. Distribution maps of selected PTEs were created, categorising the data into six classes using the natural breaks classification method (Jenkins). EF, Igeo, and CF distribution maps were classified according to the previously mentioned classification for each of the parameters [24,39,40].
Basic descriptive statistics, including minimum, maximum, mean, and standard deviation, were generated for all analysed samples using TIBCO Statistica 13.5. To determine statistically significant results and reject the null hypothesis, a t-test was performed for all observed data. The null hypothesis assumes that there is no difference between the groups exposed to different influences, but assumes that the populations do not differ in the analysed characteristic, i.e., that the observed differences are random. A confidence level of 95% was used for this study (p = 0.05). To ensure that each variable is equally weighted, the analysed data were standardised using the z-score method of the Statistica 13.5 software package.
To assess the relationship between soil parameters and geochemical data, a hierarchical cluster analysis was conducted employing tree diagrams. Euclidean distance served as the primary measure of similarity between the variables under observation. The Ward method was utilised as the principal linkage rule, employing an agglomerative clustering algorithm to minimise variance within clusters. At each distance step, cluster pairs were merged to minimise the total increase in variance within clusters. Additionally, a principal component analysis (PCA) was carried out as a factor analysis to further examine the relationship between soil parameters. This approach drastically reduced dimensionality while retaining the majority of information within the dataset.

4. Results

4.1. Geochemistry of Soils

The obtained results of the selected PTEs (Table S1) were compared with the median values in the study region according to [26]. The greatest deviations from the median values were found for Cd and Cr, with noticeable elevated contents of Pb and Ni. The highest measured Cr concentration was 403.00 mg/kg, the lowest 145.20 mg/kg, which was far above the median value of 75 mg/kg. The Cd concentrations in the soil varied between 0 and 15 mg/kg, which was above the 0.2 mg/kg median value in the region. Ni concentrations exceeded the median values in half of the analysed samples, with contents varying between 13.6 and 54.2 mg/kg. Zn concentrations in the measured samples ranged from 36.20 to 112.40 mg/kg, Cu concentrations from 0 to 29.4 mg/kg, and Pb concentrations from 0 to 42.60 mg/kg.

4.2. Spatial Distribution of PTEs and Geochemical Factors

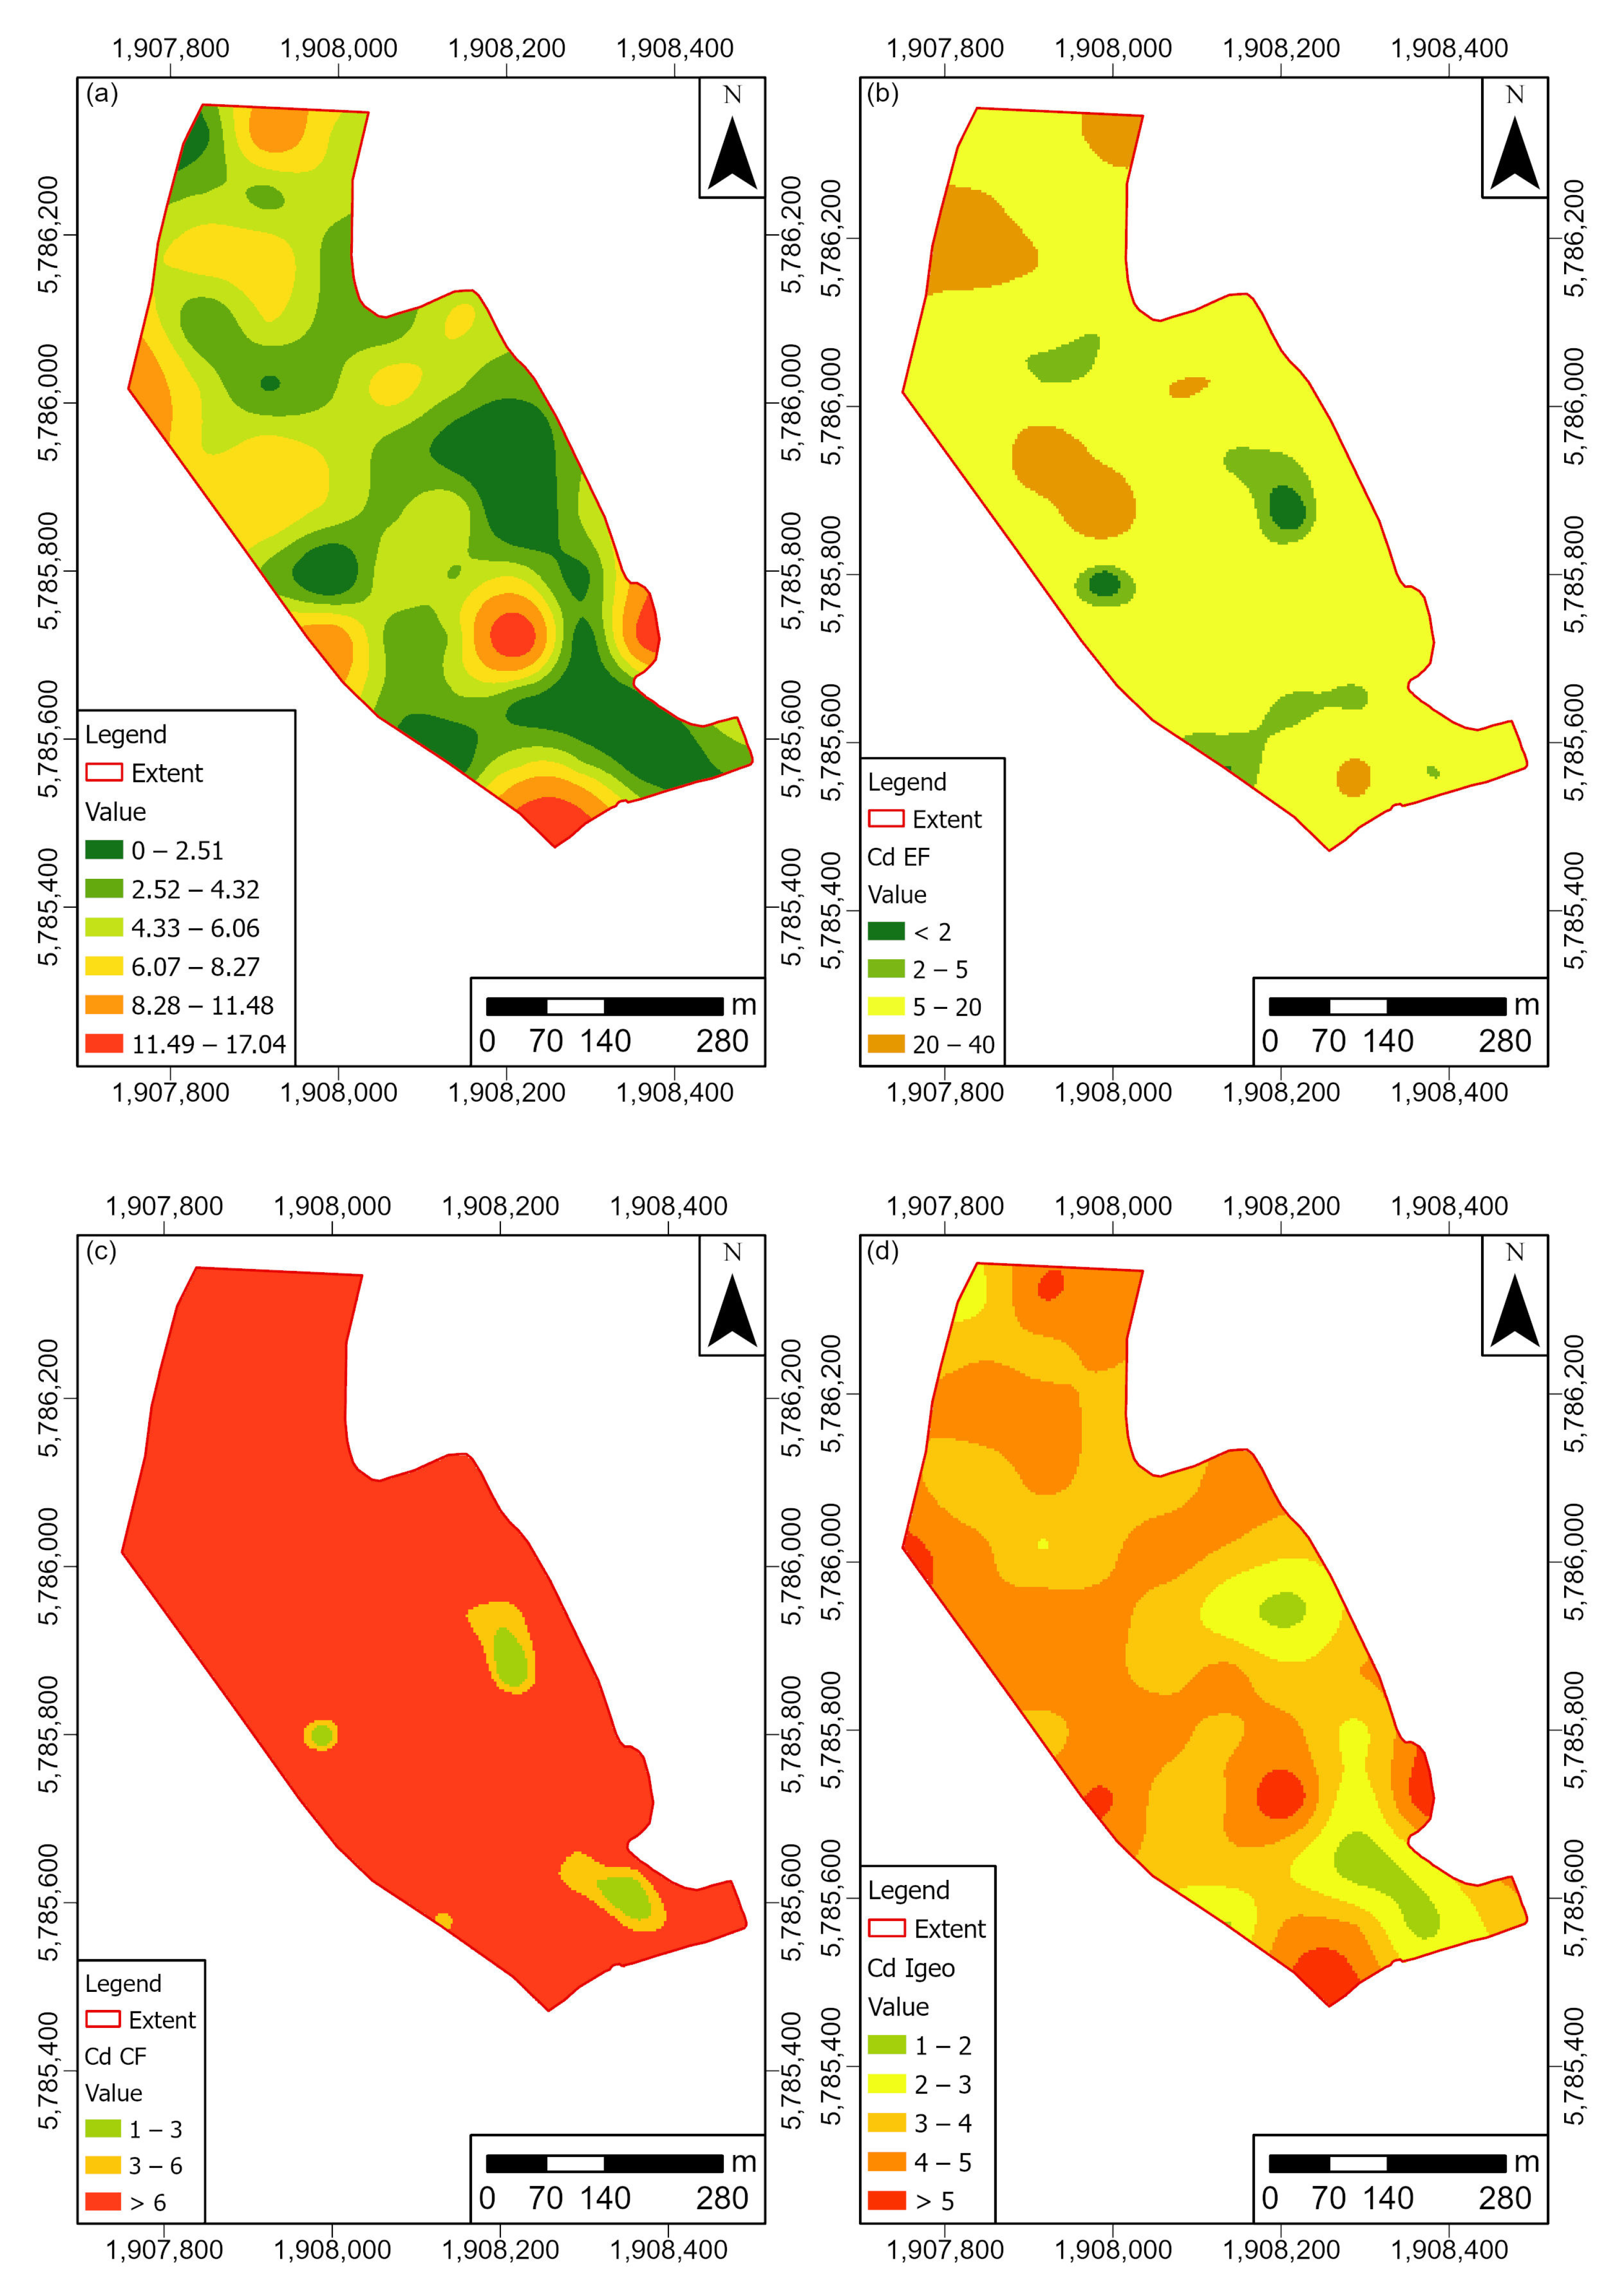
The cadmium levels (Figure 2) showed variable distribution in the study area. Several zones with elevated values were able to be identified, especially in the western and central part of the site. The enrichment factor (EF) showed elevated values in the entire study area, which were able to be described as significant or very high enrichment. The contamination factor (CF) was consistent with the EF and indicated soils as being very highly contaminated with cadmium in the studied area. The geoaccumulation index (Igeo) also indicated heavily contaminated to very heavily contaminated soil in the central part and only moderately contaminated soil in the eastern part of the site.
Chromium had very high values, especially in the northern part of the study area, where the values were up to 390 mg/kg (Figure 3). The maximum value was determined in sample 8-3 (403 mg/kg). However, the EF showed deficiency to minimal enrichment in the western part and moderate enrichment in the northern and eastern parts of the site. The CF indicated moderately to heavily contaminated soils in the study area, while the Igeo indicated uncontaminated to moderately contaminated soils.
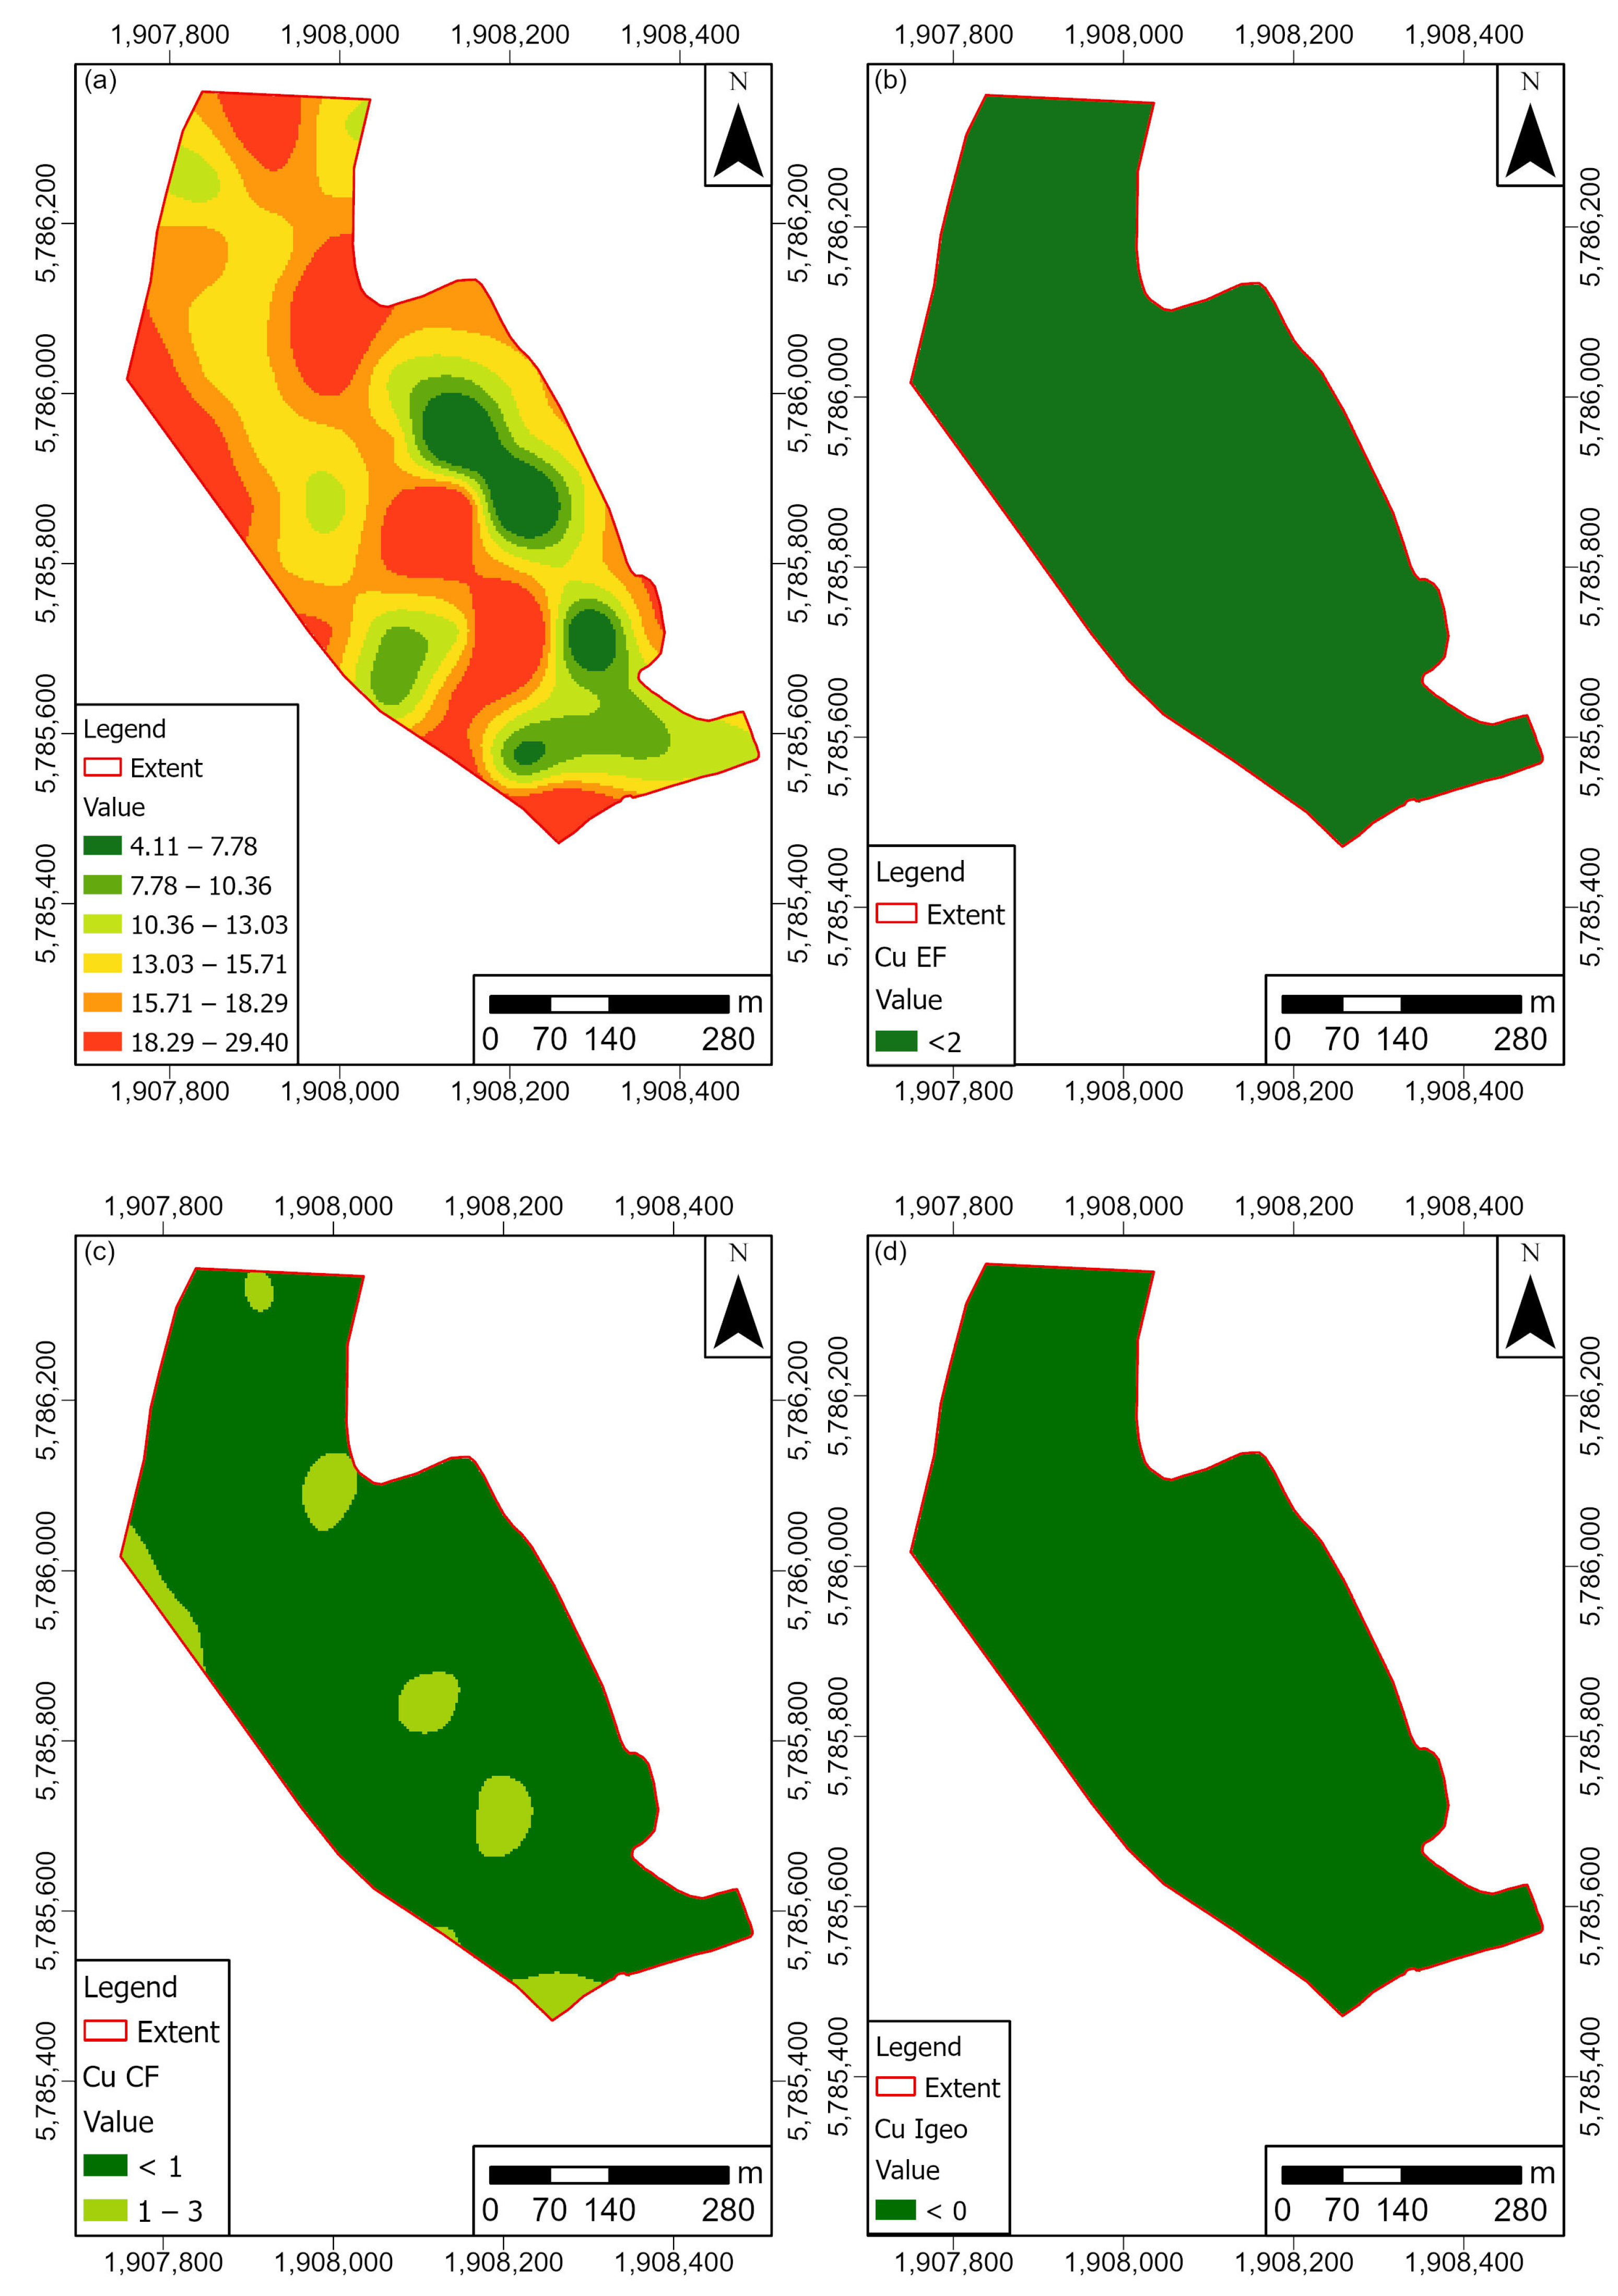
Copper concentration (Figure 4) was elevated in the northern, western, and central parts of the study area. However, the EF, CF, and Igeo indicated uncontaminated soils.
Nickel levels were consistent with the distribution of copper (Figure 5). Elevated values were found in the northern and western parts of the study area, while the lowest values were found in the eastern and southern parts of the site, which is consistent with the zones of sand deposits. The EF and Igeo indicated uncontaminated soil, while the CF indicated moderately contaminated soil in the central part and uncontaminated soil in the eastern part of the study area.
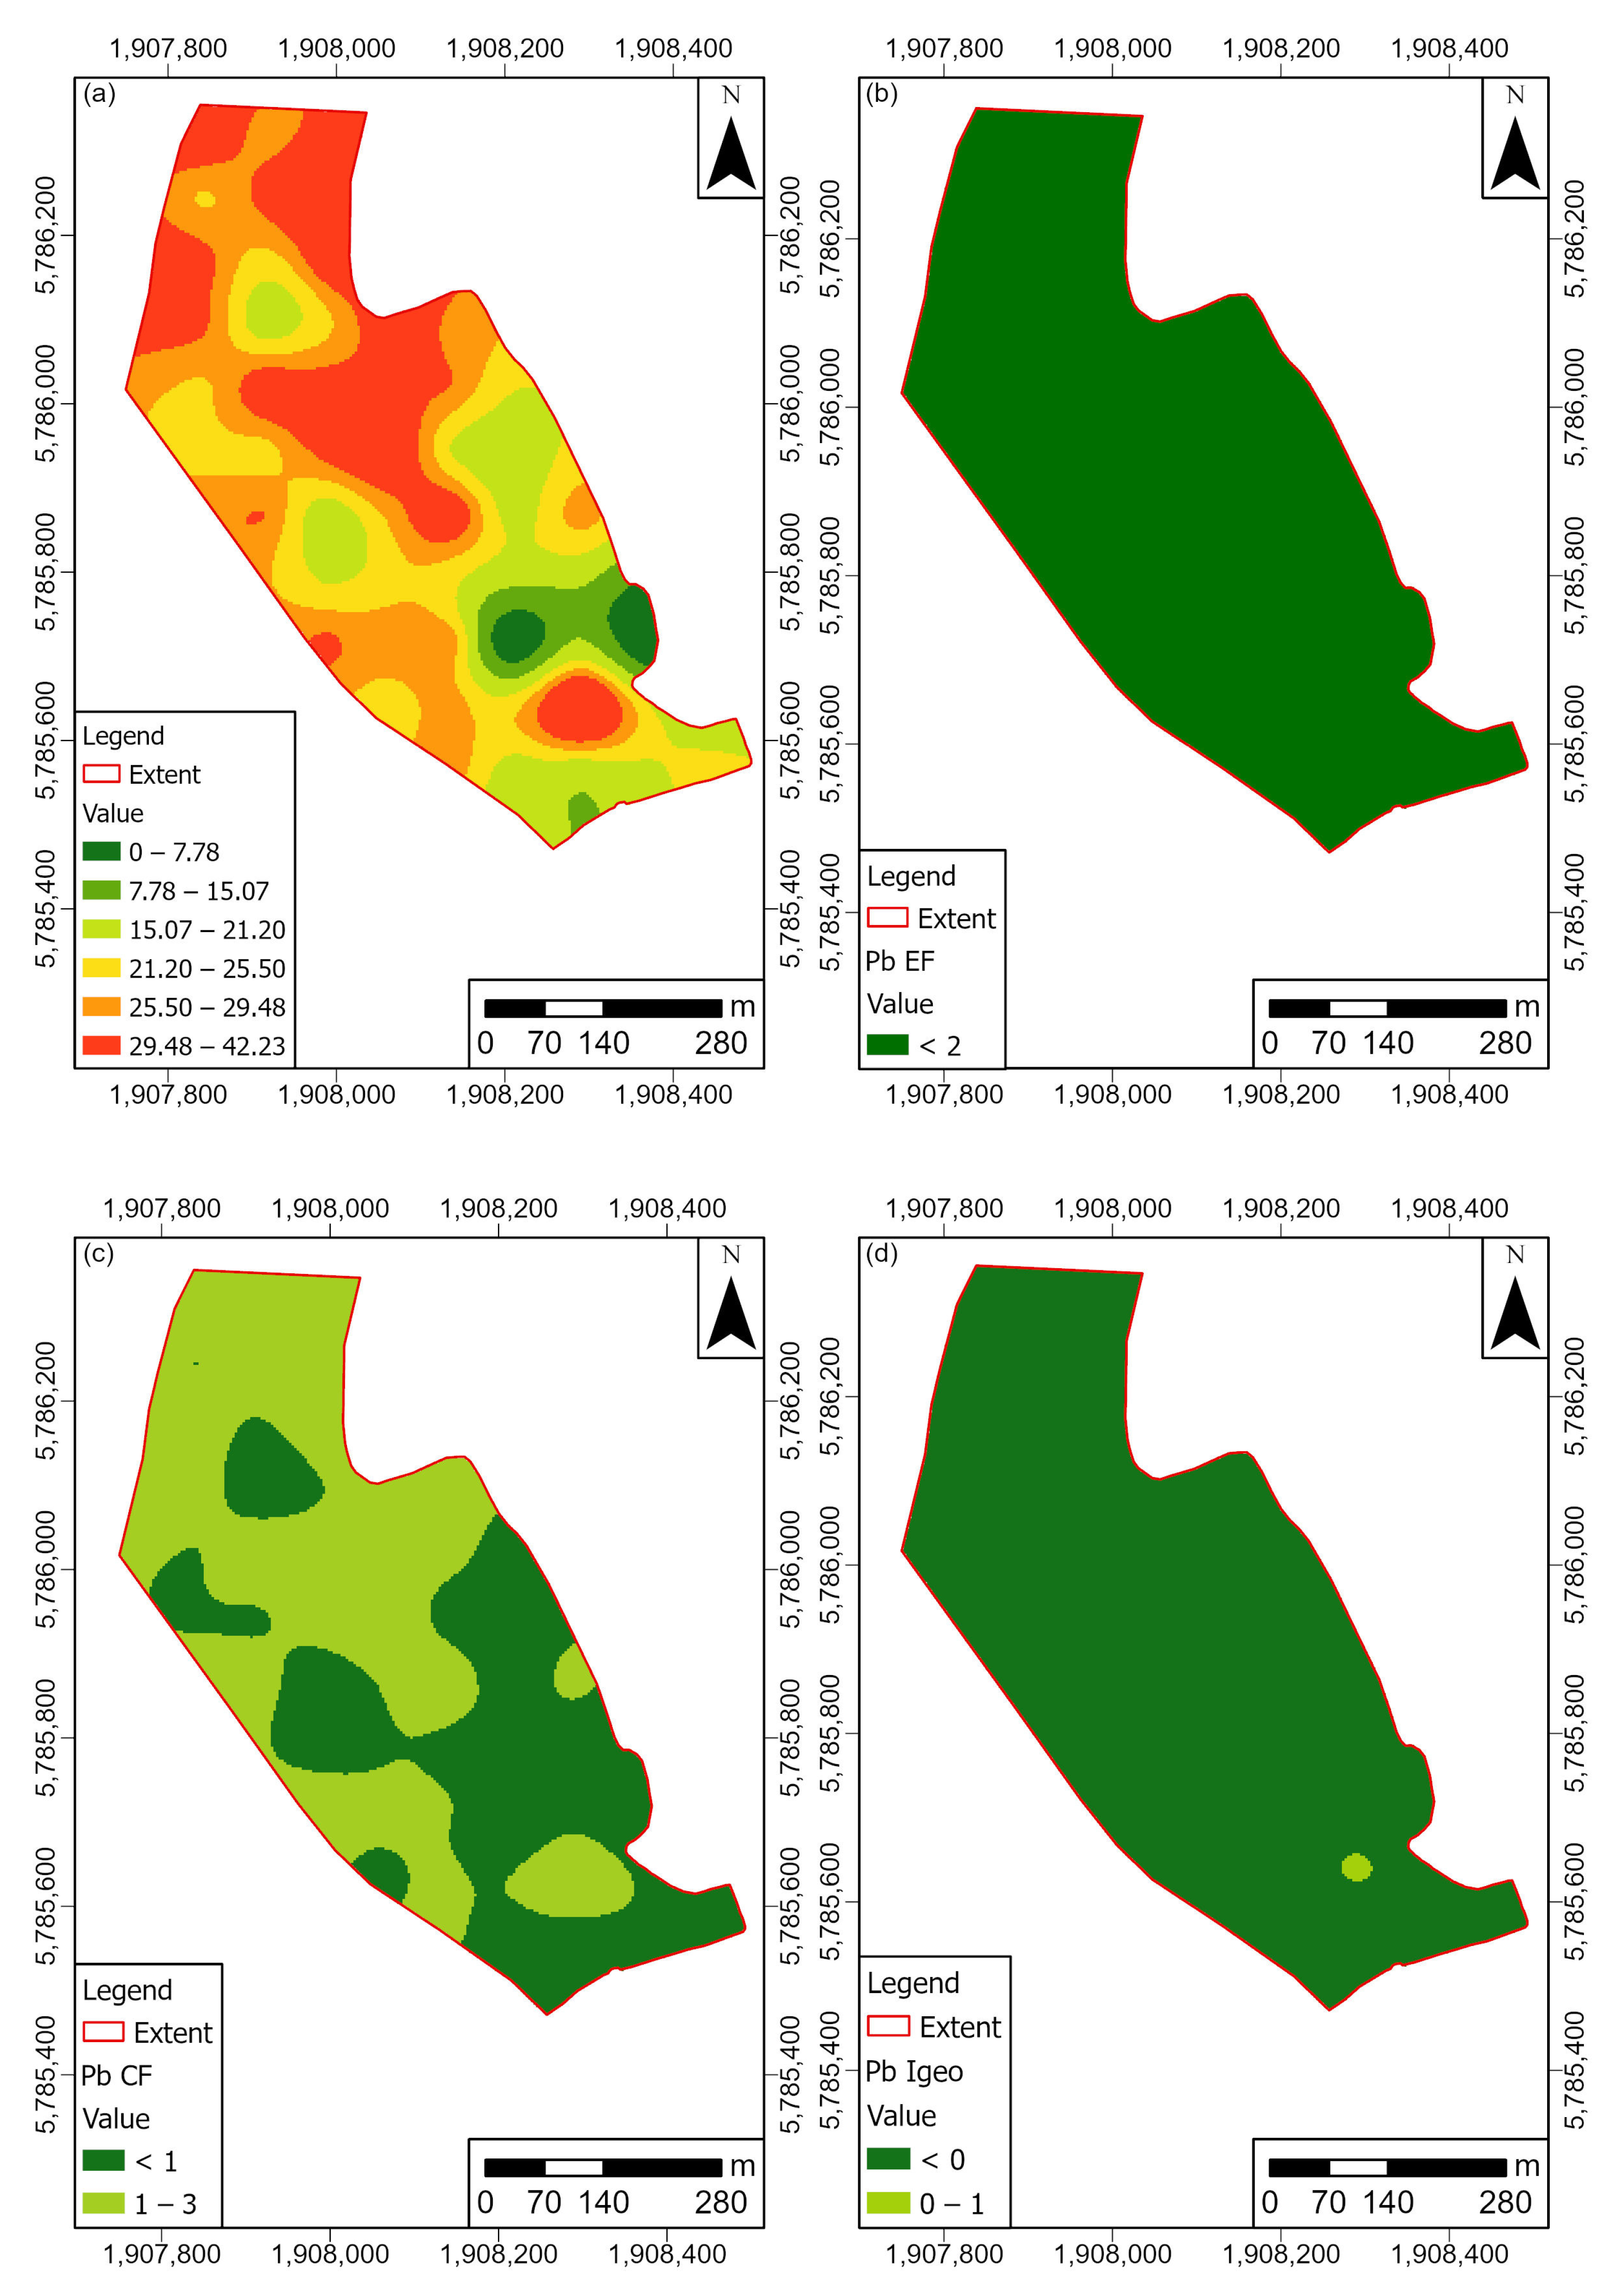
Lead concentrations showed elevated values in the northern part of the study area (Figure 6). The highest value was found in the southern part of the study area (42.60 mg/kg). Similar to nickel, the EF and Igeo indicated uncontaminated soil, while the CF indicated moderately contaminated soil in the northern, central, and western parts and uncontaminated soil in the eastern part of the study area.
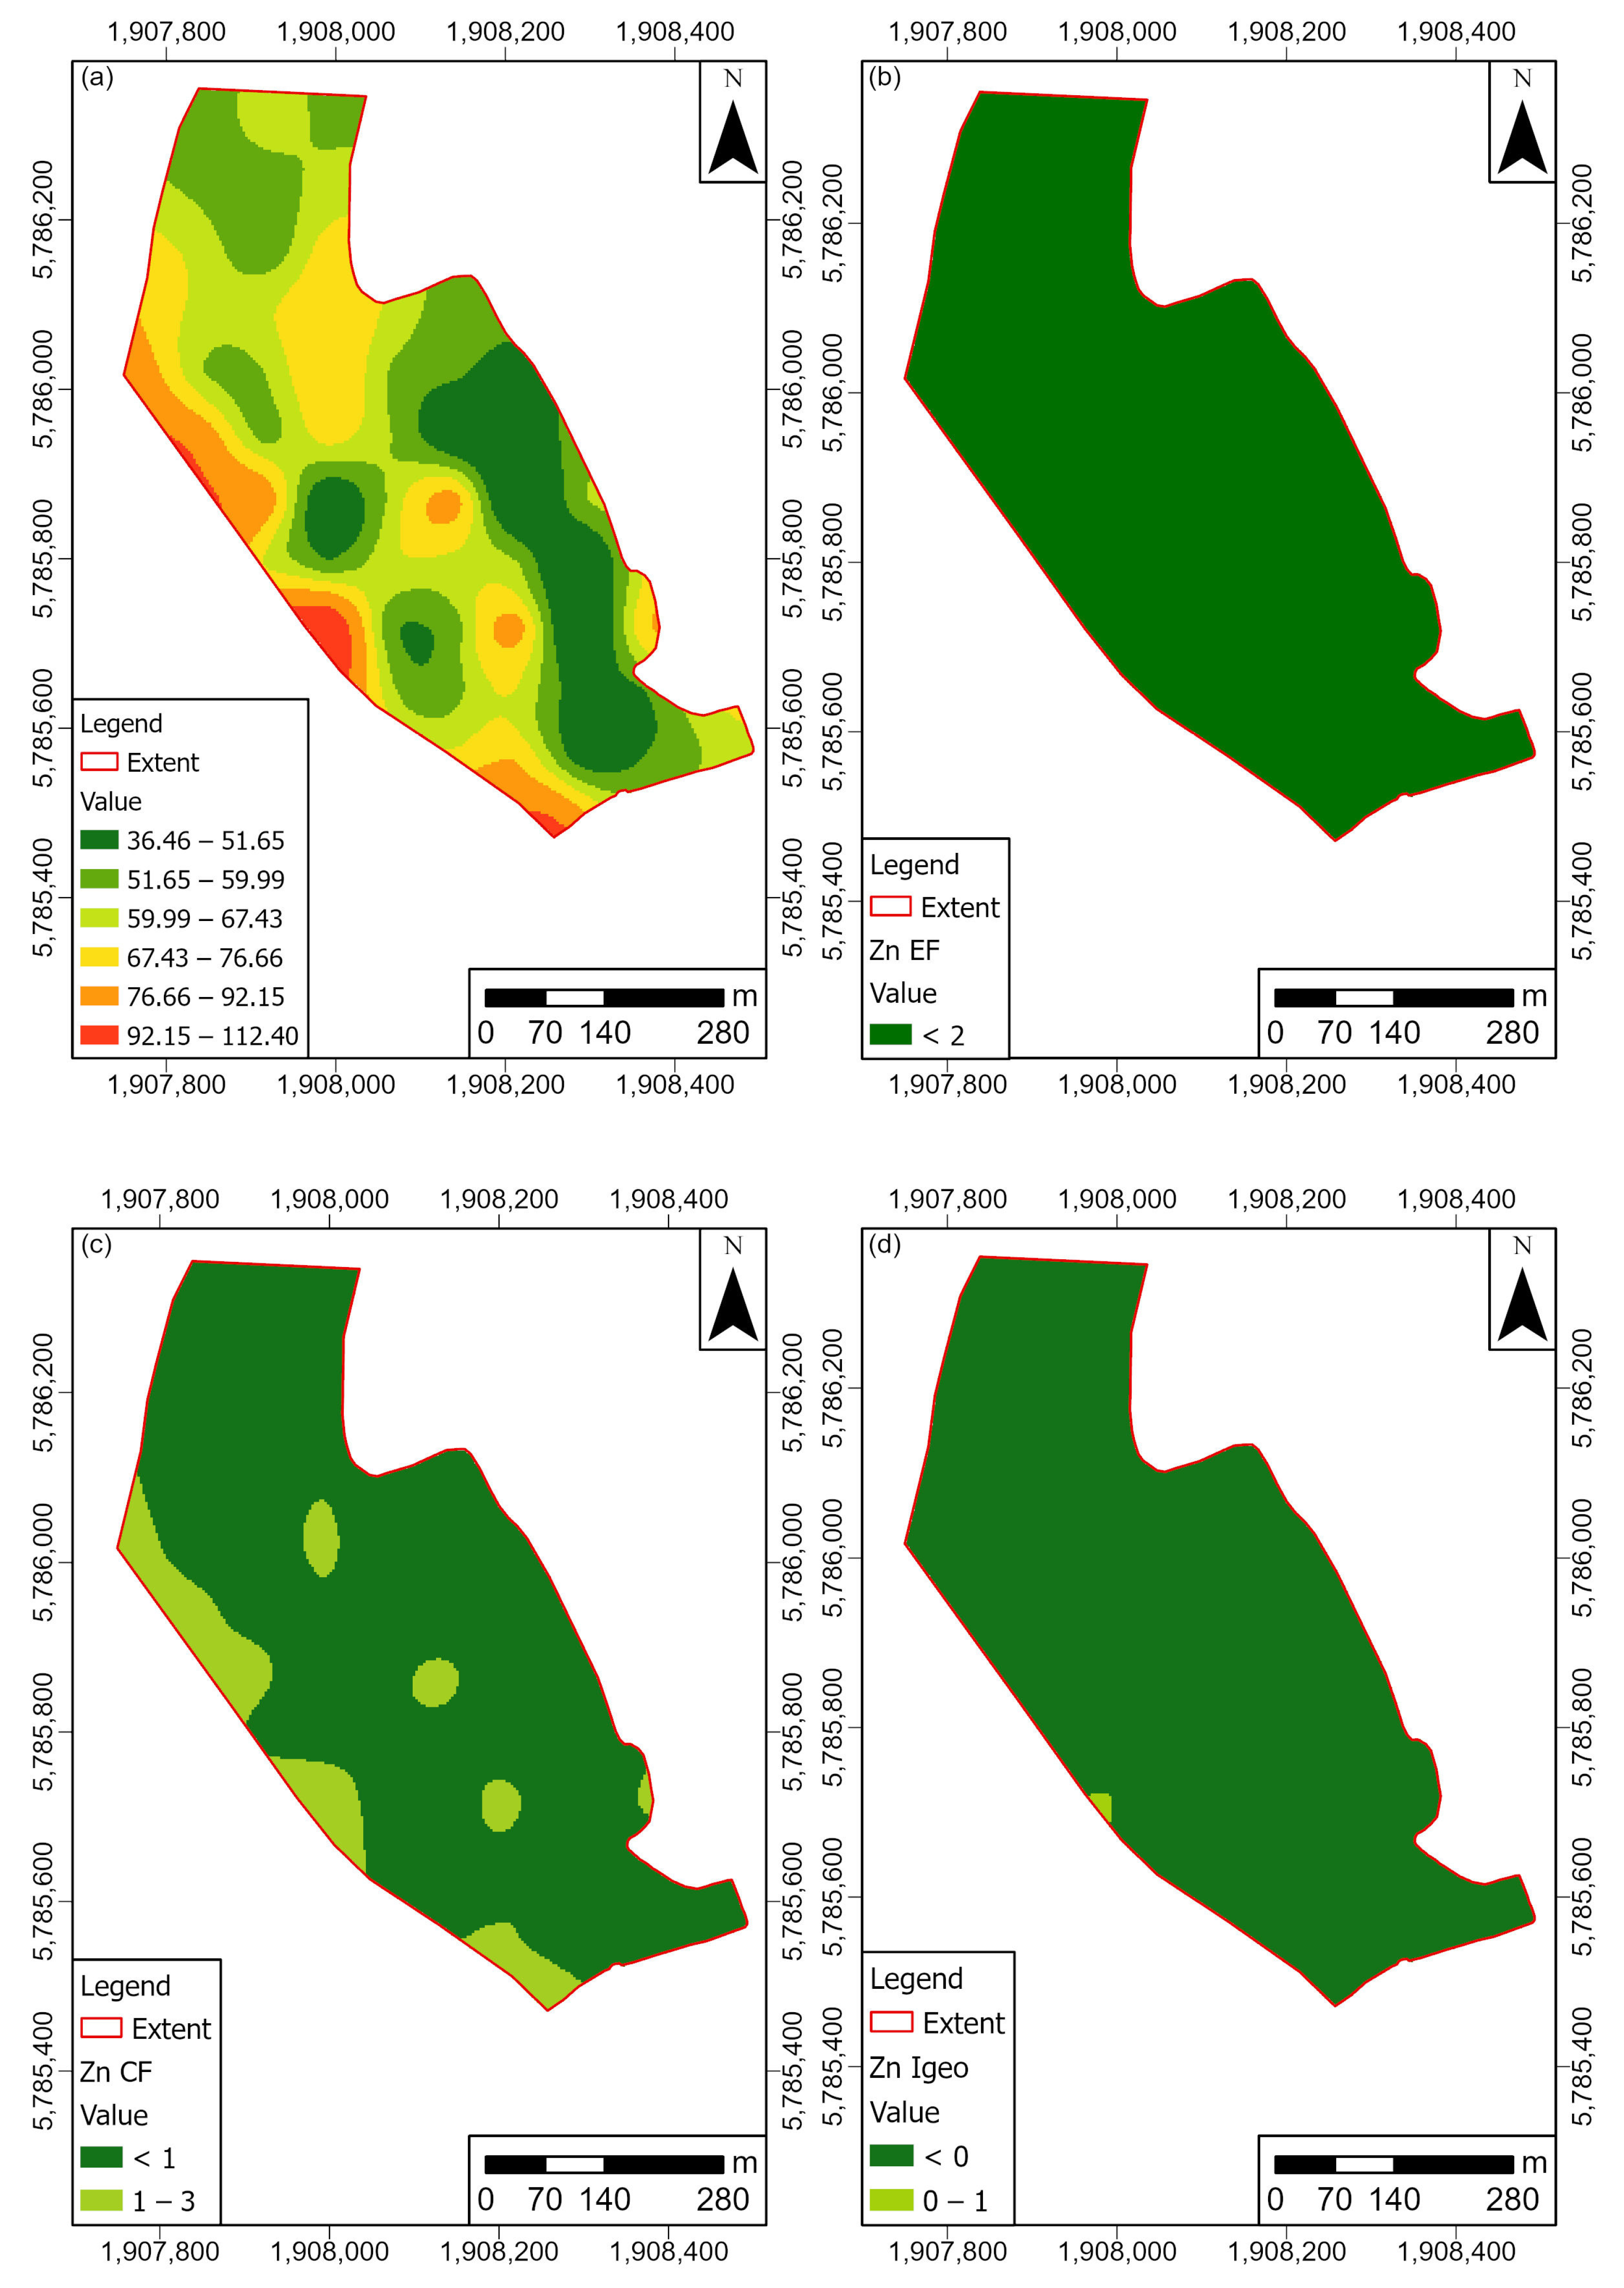
The zinc concentration (Figure 7) showed low values in the eastern and central part of the observed area. Slightly elevated zinc content was found in the western part, in the immediate vicinity of the local road passing by there. The EF and the Igeo indicated uncontaminated soils, while the CF indicated moderately contaminated parts in the western part of the site.

4.3. Statistical Analyses

The correlation matrix of the observed soil parameters is given in Table 1. It can be seen that a significant amount of the observed data had statistically significant values (marked in red). Chromium showed a slight negative correlation with Fe (−0.40), while showing a very slight positive correlation with Si (0.29) and Al (0.30). Nickel showed a positive correlation to Cu (0.79), Zn (0.75), Cd (0.61), Fe (0.67), and CEC (0.52), with a slight negative correlation towards Si (−0.61). Copper showed a positive correlation towards Zn (0.69), with a medium positive correlation towards Fe (0.56) and TC (0.48) and negative correlation towards Si (−0.48). Zinc showed a medium positive correlation with Cd (0.63), Fe (0.70), pH (0.50), and CEC (0.68), while exhibiting a negative correlation towards Si (−0.66). Cadmium showed a negative correlation with Si (−0.60), Al (−0.62), pH (−0.58), and silt content (−0.57), while it had no significant positive correlations. Lead content showed a more pronounced negative correlation only with respect to Fe (−0.61), while the other parameters showed practically no statistically reliable correlation.
Hierarchical cluster analysis resulted in the formation of a dendrogram (Figure 8a). Based on the observation of step and linkage distances (Figure 8b), the position of the cut-off line (red line on Figure 8a) was plotted on the linkage distance of eight, resulting in the formation of seven clusters. The majority of observed PTEs (Ni, Cu, Zn, and Cd) formed a cluster with Fe, while Cr and Pb formed individual clusters, at first not showing connection to the other observed parameters.
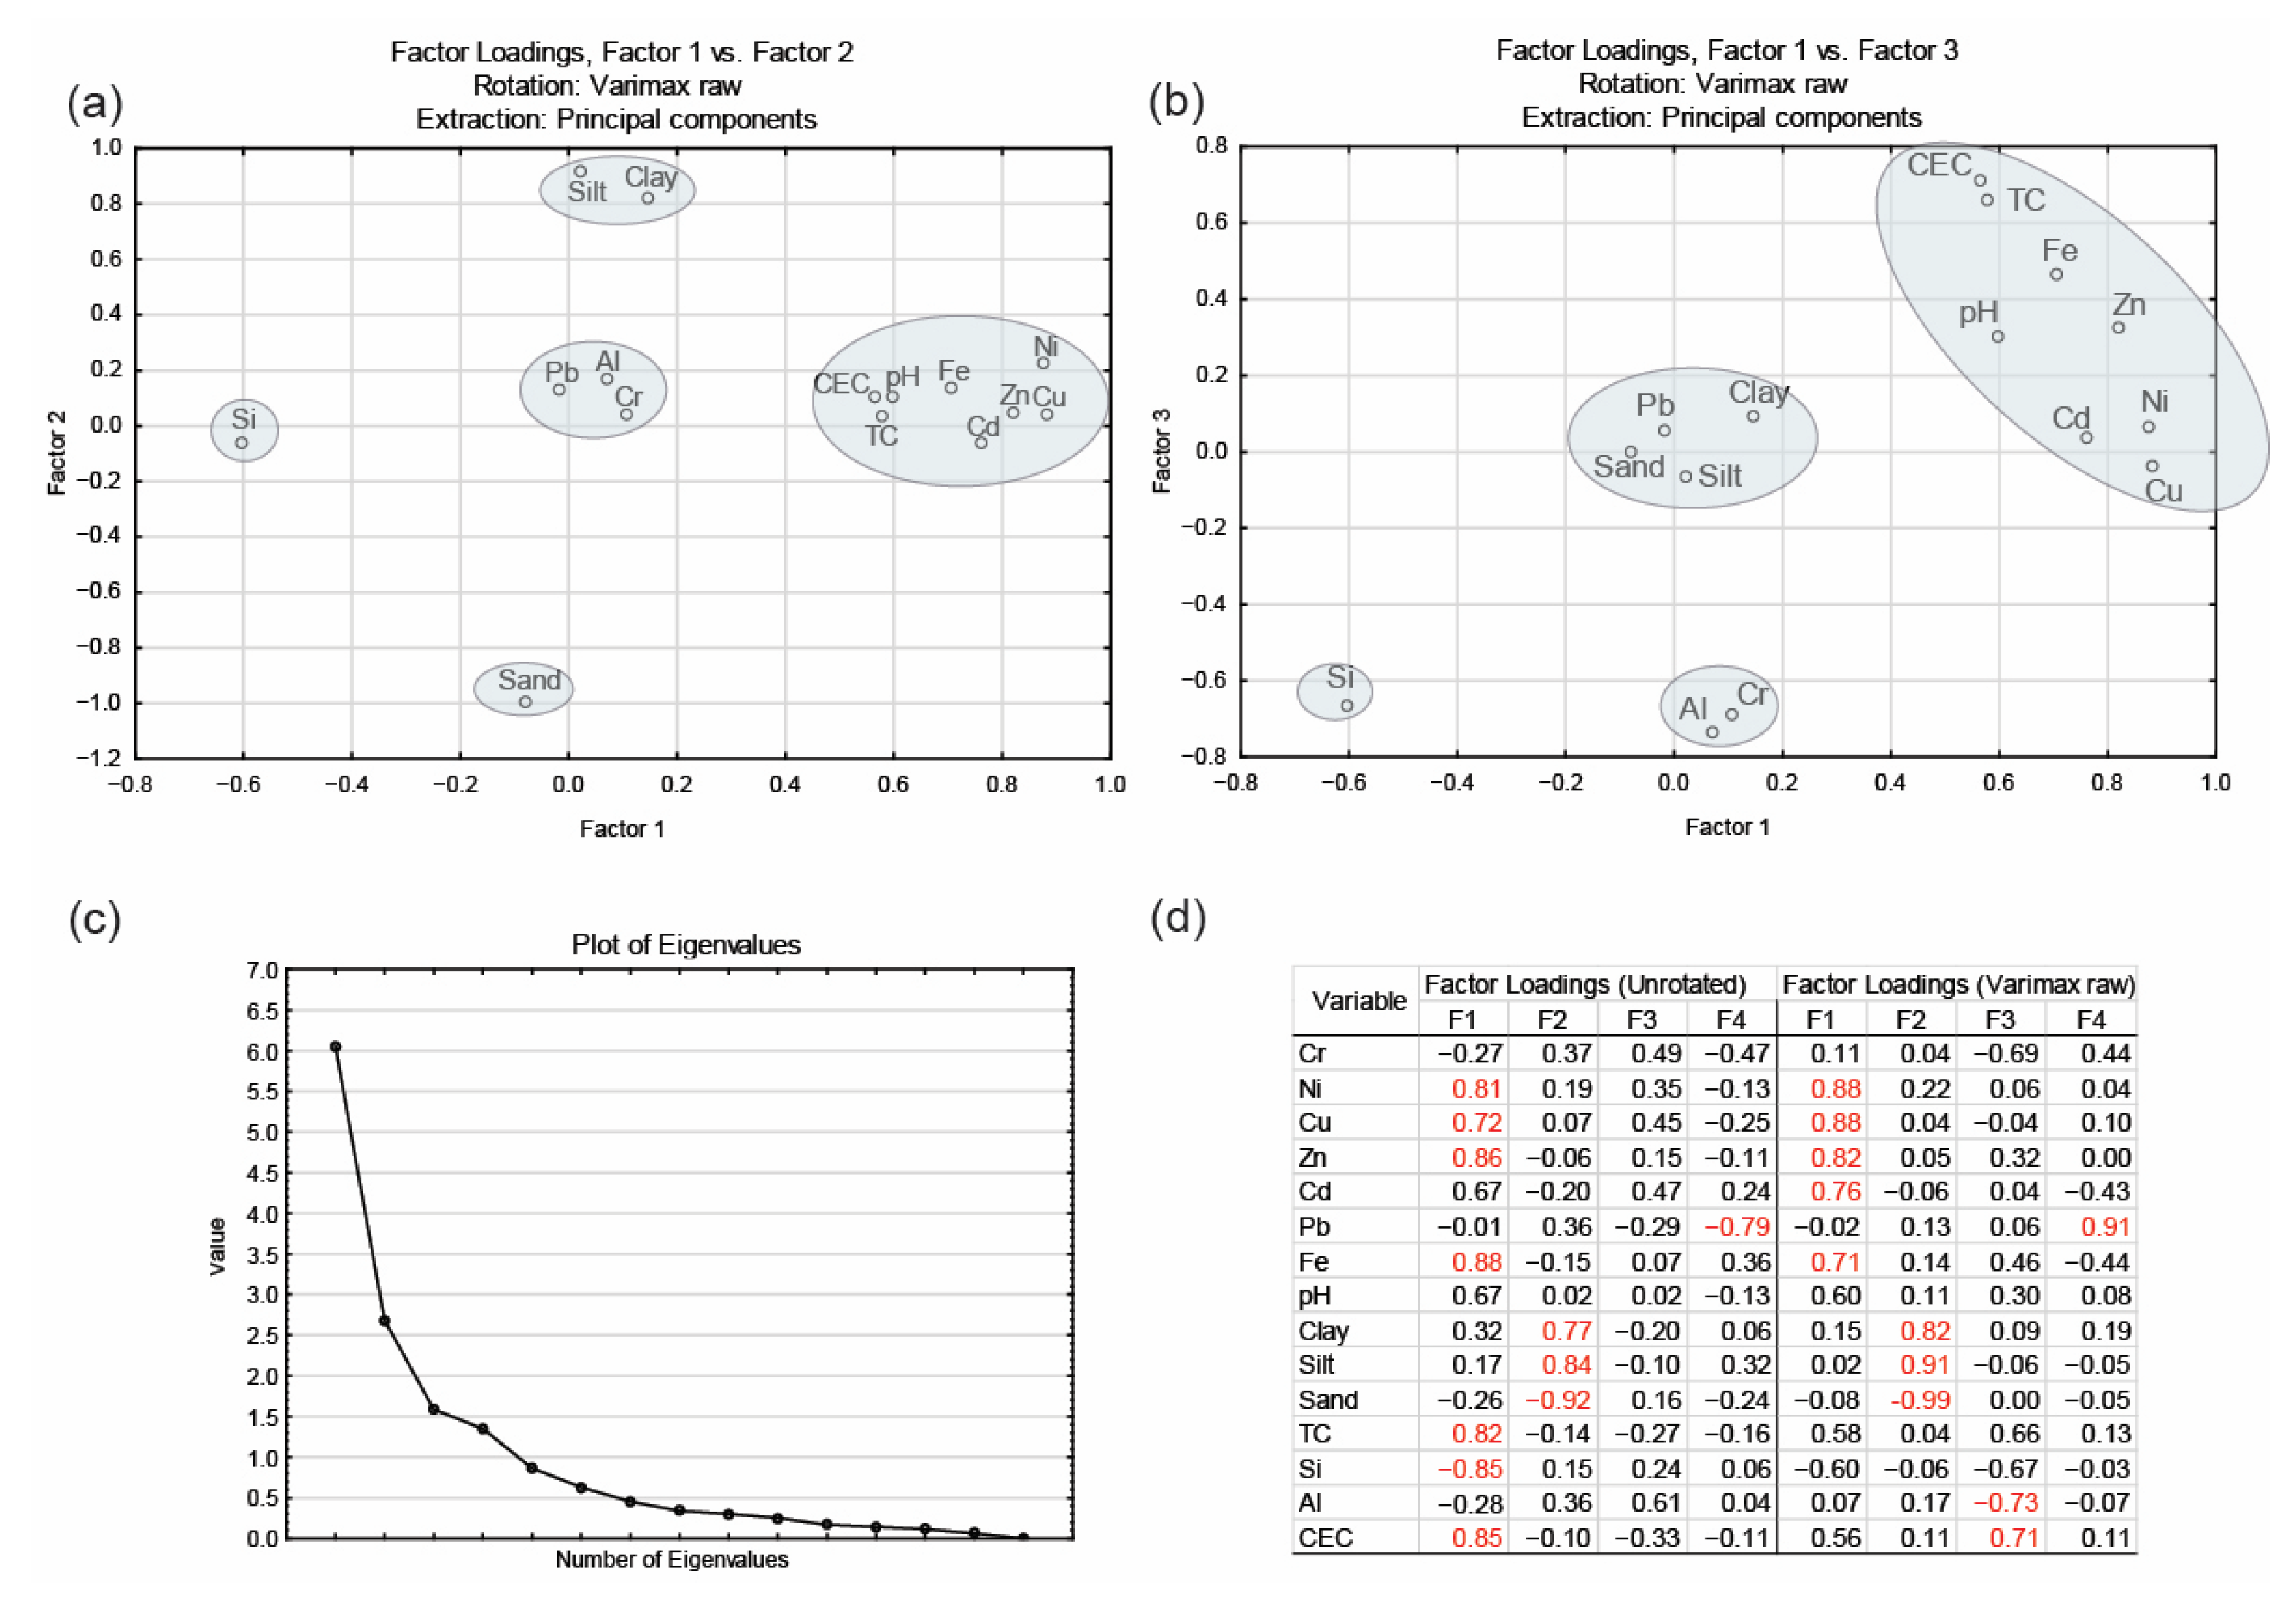
Factor analysis resulted in the formation of four factors (F), explaining 77.82% of the total variance (Figure 9d). Based on the inflection point of the eigenvalue diagram (Figure 9c), the first three factors were chosen for the analysis. Figure 9a shows the relationship between rotated F1 and F2 loadings, where five groups of parameters can be seen. The largest group consisted of Cd, Cu, Ni, Zn, Fe, CEC, pH, and TC. The second group consisted of Cr, Pb, and Al; the third group of silt and clay; while Si and sand formed individual groups. The plot diagram of F1 and F3 (Figure 9b) revealed similarities to the F1 vs. F2 diagram, with the only change being that Pb was grouped with clay, silt, and sand, resulting in four groups in total.

5. Discussion

5.1. Geogenic and Anthropogenic Sources of PTEs

The geochemical analysis of the samples revealed varying concentrations of PTEs. According to the Geochemical Atlas of the Republic of Croatia [26], the highest concentrations above the median values for certain elements were found for Cr, Cd, and Ni (Table S1). Nickel is most abundant in some types of igneous and metamorphic rocks [42]. Minerals that contain Ni in their structure are primary minerals formed by magmatic or metamorphic processes, such as olivine, pyroxenes, sulphides, and the spinel group. The investigated site is located on the second river terrace of the Drava, and it can be assumed that the material originates from the Eastern Alps [28]. From this, it can be concluded that the high Ni concentrations could be related to this. Elevated nickel concentrations in soils formed on river terraces have also been found in some previous studies [43,44,45], in which the authors found that nickel was transported and deposited in alluvial material from mountain areas.
Cadmium is an element that enters nature mainly from anthropogenic sources. Anthropogenic sources of cadmium in soil and groundwater include combustion emissions, wastewater, landfills, transport, metal industry, and mining [46,47,48]. A common reason for elevated cadmium concentrations in soil and groundwater is the use of phosphate fertilisers containing cadmium as an impurity. This pathway of Cd flux to soil, in addition to groundwater, has been studied in the United States, Canada, the United Kingdom, Norway, Sweden, Finland, Denmark, Germany, Australia, and New Zealand [47,48,49].
In this study, cadmium can be associated with agrochemicals as the site is located in an agricultural area. Ružičić et al. [50] found elevated cadmium concentrations in soil due to the influence of various agrochemicals.
Chromium is an element that in nature mostly originates from rocks such as ultrabasic and basic igneous rocks [42]. Ružičić et al. [2] concluded in their calculations of EF and Igeo that Cr is probably predominantly of geogenic origin, which is the result of natural processes related to the erosion of basic and ultrabasic rocks and the transport of alluvium from the nearby mountains. However, the Cr in the study area is thought to originate from airborne deposition, probably from a nearby cement factory or metal processing plant. In some cases, Cr can enter the environment from various anthropogenic sources, such as petrochemical production, the cement industry, or metal processing [51,52]. Poznanović Spahić et al. [53] found that the Cr content in soils is higher due to the impact of industrial facilities such as cement factories.
When all three analysed indicators (EF, Igeo, CF) were considered, the results showed that Ni was most likely of geogenic origin, while cadmium and chromium were of anthropogenic origin. As already mentioned, Ni was most likely the result of weathering processes of basic and ultrabasic igneous rocks and the transport of alluvial material from the Eastern Alps. According to Morrison et al. [44], the elevated Ni concentrations in Sacramento Valley soils are the result of weathering of igneous rocks and transport to the Sierra Nevada alluvial plain.
The spatial map for Igeo is consistent with the spatial distribution of Cd concentrations, suggesting that the Cd originated from anthropogenic sources (Figure 2). The presence of Cd near roads is attributed to dust from petrol combustion [54]. The spatial distribution of the enrichment factors shows that almost the entire study area was very highly enriched, while the spatial distribution of CF and EF for Cd was consistent (Figure 2).
The spatial distribution of Cu (Figure 3) corresponded to the distribution of Cd and can possibly be related to the use of agrochemicals. Ružičić et al. [50] stated that Cu and Cd in the soil can result from the influence of agricultural activities such as the use of fertilisers, manure, fungicides, and sewage sludge as soil fertiliser. It has already been mentioned in the text that the investigated area is used for agricultural purposes, i.e., it is under the constant influence of agrochemicals. It is known that Cu is added to the soil through agricultural activities [55], and that it is widely used as a fertiliser [56].
According to the distribution of Pb (Figure 6), it is possible that it was deposited in sulphide mineral-rich alluvial material (galena) and is bound to its structure. According to Halamić and Miko [26], the increased lead concentrations could be related to the occurrence of this element in the upstream areas (Austria, Slovenia) and to the intensive mining activities in the last two centuries (Bleiberg, Mežica, etc.). These anomalies in Pb concentrations have also been detected along local roads where lead accumulates in the upper soil layer due to traffic [57,58].
Elevated Zn concentrations (Figure 7) in the subsurface soil horizon can be caused by traffic. It is known that zinc has a possible source from roads [59]. According to Jiries et al. [60], Zn can enter the soil system through mechanical abrasion and oil leakage from vehicles. The high concentrations in the study area were probably due to the traffic of larger lorries and tractors used for transport to and from industrial sites or surrounding smaller landfills. However, based on geochemical factors, it appears that only the western part of the study area is under anthropogenic influence, while for the remaining part, Zn is probably of geogenic origin.

5.2. Influence of Soil Parameters on PTE Mobility

The availability of PTEs in the soil environment is an extremely important parameter to understand and determine. The mobilisation and immobilisation of PTEs in the soil environment mainly depends on the origin and properties of the soil, such as particle size, amount of cation exchange capacity, type of clay minerals, soil pH, form of Fe/Mn oxyhydroxides, and organic matter content [61]. According to this statement, the factor analysis of our study revealed that PTEs such as Cd, Cu, Ni, Zn, and Fe are associated with CEC, pH, and TC. Redox potential may play an important role in the binding ability of PTEs, especially in wetlands or waterlogged farmland, as is the case in the study area. The study area is known to have fluctuating groundwater, with the water table sometimes up to 10 cm below the surface [28]. Therefore, complex interactions of redox conditions are assumed.
Previous studies [28,41] have found low pH in the study area. Low pH can lead to a lower negative charge in the variable soil charge, which can reduce the adsorption of cation (positive) forms of PTEs [62]. Cation exchange capacity (CEC) is also an important parameter that determines the binding capacity of the soil. Lower CEC values mean a higher concentration of metals in the soil solution, which increases their leachability and mobility. CEC is closely related to the composition of clay minerals and organic matter in the soil, with lower values indicating a greater potential for the release of metals into the soil solution. This interaction highlights the critical role that soil texture and organic content play in influencing the availability and movement of metals within the soil matrix. As CEC levels decrease, the soil becomes more susceptible to leaching of PTEs, facilitating the transfer of elements to plant roots or more generally in the soil system [63].
The hierarchical cluster analysis revealed that Cd, Cu, Ni, and Zn have an affinity for Fe. Furthermore, factor analysis revealed that the majority of PTEs are associated with Fe. It is obvious that Fe, probably in the form of Fe oxyhydroxides, is the most important parameter controlling the mobility of PTEs. According to Ružičić et al. [41], continuous Fe input has an overwhelming influence on iron redox geochemistry and mineralogy, leading to the precipitation of Fe oxyhydroxides (especially ferrihydrite and goethite). In the upper 30 cm of soils, oxidised conditions generally prevail, in which oxide concentrations tend to be higher [64]. Studies have already shown that the distribution and mobility of PTEs is controlled by the Fe oxide content [2,65,66]. Some other PTEs, such as Pb, show an affinity for binding to the clay and silt content. This can be explained by the fact that soils with high clay and silt content (fine fractions) tend to retain higher amounts of Pb compared to sandy soils with coarse textures [2].

6. Conclusions

In this study, the enrichment factor (EF), contamination factor (CF), index of geo-accumulation (Igeo), and statistical analysis were used to explore the contamination status by PTEs (Cd, Cr, Cu, Ni, Pb, and Zn). Furthermore, geochemical factors were used to distinguish between anthropogenic and natural sources of PTEs. The results of the enrichment factor (EF) suggest that the soil of the investigated region has significant or very high enrichment. The results of CF and Igeo suggest that the soil of the investigated region is heavily contaminated to very heavily contaminated in the central part and only moderately contaminated in the eastern part of the site due to various discrete sources.
The results show that Ni is most likely of geogenic origin, while Pb, Cd, Cr, and Cu are of anthropogenic origin. Zinc exhibits both anthropogenic and geogenic origin.
Statistical analysis confirms that Fe, probably in the form of Fe-oxyhydroxides, is the most important parameter controlling the mobility of PTEs.
Geochemical factors appear to be an efficient tool to discriminate between anthropogenic and geogenic sources of PTEs. This study provides a basis for effective targeting of measures to reduce PTEs inputs and protect arable soils from accumulation of these contaminants.
In addition, periodically environmental monitoring of PTEs is highly recommended, planting of crops sensitive to PTEs should be avoided, and excessive usage of agrochemicals should be minimised.

Supplementary Materials

The following supporting information can be downloaded at https://www.mdpi.com/article/10.3390/land13040434/s1. Table S1: Geochemical contents and soil parameter characteristics from the Kalinovac area.

Author Contributions

Conceptualisation T.B., S.R. and M.P.; methodology, T.B., M.C. and S.R.; software M.P., T.B. and N.R.; validation, T.B., M.P., S.R., N.R. and M.C.; writing—original draft preparation, T.B., S.R. and N.R.; writing—review and editing, T.B. and S.R.; visualisation—M.P., S.R., N.R. and T.B.; supervision, T.B. and S.R. All authors have read and agreed to the published version of the manuscript.

Funding

This research received no external funding.

Data Availability Statement

The data that supports the finding of this study are available from the corresponding author upon reasonable request.

Acknowledgments

This work was supported by the Virtulab project (KK.01.1.1.02.0022), co-funded by the European Regional Development Fund. This work was supported in part by the Croatian Science Foundation under the project GEOlogical characterisation of the Eastern part of the Drava depression subsurface intended for the evaluation of Energy Potentials GEODEP (UIP-2019-04-3846).

Conflicts of Interest

The authors declare no conflicts of interest.

References

  1. Adimalla, N.; Qian, H.; Nandan, M.J.; Hursthouse, A.S. Potentially toxic elements (PTEs) pollution in surface soils in a typical urban region of south India: An application of health risk assessment and distribution pattern. Ecotoxicol. Environ. Saf. 2020, 203, 111055. [Google Scholar] [CrossRef] [PubMed]
  2. Ružičić, S.; Balaž, B.-I.; Kovač, Z.; Filipović, L.; Nakić, Z.; Kopić, J. Nickel and Chromium Origin in Fluvisols of the Petruševec Well Field, Zagreb Aquifer. Environments 2022, 9, 154. [Google Scholar] [CrossRef]
  3. Dong, R.; Jia, Z.; Li, S. Risk assessment and sources identification of soil heavy metals in a typical county of Chongqing Municipality, Southwest China. Process Saf. Environ. 2018, 113, 275–281. [Google Scholar] [CrossRef]
  4. Ni, M.; Mao, R.; Jia, Z.; Dong, R.; Li, S. Heavy metals in soils of Hechuan County in the upper Yangtze (SW China): Comparative pollution assessment using multiple indices with high-spatial resolution sampling. Ecotoxicol. Environ. Saf. 2018, 148, 644–651. [Google Scholar] [CrossRef] [PubMed]
  5. Antoniadis, V.; Levizou, E.; Shaheen, S.M.; Ok, Y.S.; Sebastian, A.; Baum, C.; Prasad, M.N.V.; Wenzel, W.W.; Rinklebe, J. Trace elements in the soil-plant interface: Phytoavailability, translocation, and phytoremediationda review. Earth Sci. Rev. 2017, 171, 621–645. [Google Scholar] [CrossRef]
  6. Kumar, V.; Sharma, A.; Kaur, P.; Sidhu, G.P.S.; Bali, A.S.; Bhardwaj, R.; Thukral, A.K.; Cerda, A. Pollution assessment of heavy metals in soils of India and ecological risk assessment: A state-of-the-art. Chemosphere 2019, 216, 449–462. [Google Scholar] [CrossRef] [PubMed]
  7. Huang, Y.; Chen, Q.; Deng, M.; Japenga, J.; Li, T.; Yang, X.; He, Z. Heavy metal pollution and health risk assessment of agricultural soils in a typical peri-urban area in southeast China. J. Environ. Manag. 2018, 207, 159–168. [Google Scholar] [CrossRef] [PubMed]
  8. Birch, G.A. Scheme for Assessing Human Impacts on Coastal Aquatic Environments Using Sediments. In Coastal GIS; Woodcoffe, C.D., Furness, R.A., Eds.; Wollongong University Papers in Center for Maritime Policy: Wollongong, Australia, 2003. [Google Scholar]
  9. Chen, T.B.; Zheng, Y.M.; Lei, M.; Huang, Z.C.; Wu, H.T.; Chen, H.; Fan, K.; Yu, K.K.; Wu, X.; Tian, Q.Z. Assessment of heavy metal pollution in surface soils of urban parks in Beijing, China. Chemosphere 2005, 60, 542–551. [Google Scholar] [CrossRef]
  10. Sun, Y.; Zhou, Q.; Xie, X.; Liu, R. Spatial, source and risk assessment of heavy metal contamination of urban soils in typical regions of Shenyang. China. J. Hazard. Mat. 2010, 174, 455–462. [Google Scholar] [CrossRef] [PubMed]
  11. Sun, C.; Liu, J.; Wang, Y.; Sun, L.; Yu, H. Multivariate and geostatistical analyses of the spatial distribution and sources of heavy metals in agricultural soil in Dehui, Northeast China. Chemosphere 2013, 92, 517–523. [Google Scholar] [CrossRef] [PubMed]
  12. Wei, B.; Yang, L. A review of heavy metal contaminations in urban soils, urban road dusts and agricultural soils from China. Microchem J. 2010, 94, 99–107. [Google Scholar] [CrossRef]
  13. Dragovic, S.; Mihailovic, N.; Gajic, B. Heavy metals in soils: Distribution, relationship with soil characteristics and radionuclides and multivariate assessment of contamination sources. Chemosphere 2008, 72, 491–495. [Google Scholar] [CrossRef] [PubMed]
  14. Yaylalı-Abanuz, G. Heavy metal contamination of surface soil around Gebze industrial area, Turkey. Microchem. J. 2011, 99, 82–92. [Google Scholar] [CrossRef]
  15. Taghipour, H.; Mosaferi, M.; Armanfar, F.; Gaemmagami, S.J. Heavy metals pollution in the soils of suburban areas in big cities: A case study. J. Environ. Sci. Techn. 2013, 10, 243–250. [Google Scholar] [CrossRef]
  16. Blaser, P.; Zimmermann, S.; Luster, J.; Shotyk, W. Critical examination of trace element enrichments and depletions in soils: As, Cr, Cu, Ni, Pb, and Zn in Swiss forest soils. Sci. Total. Environ. 2000, 249, 257–280. [Google Scholar] [CrossRef] [PubMed]
  17. Bourennane, H.; Douay, F.; Sterckeman, T.; Villanneau, E.; Ciesielski, H.; King, D.; Baize, D. Mapping of anthropogenic trace elements inputs in agricultural topsoil from Northern France using enrichment factors. Geoderma 2010, 157, 165–174. [Google Scholar] [CrossRef]
  18. Reimann, C.; De Caritat, P. Intrinsic flaws of element enrichment factors (EFs) in environmental geochemistry. Environ. Sci. Technol. 2000, 34, 5084–5091. [Google Scholar] [CrossRef]
  19. Reimann, C.; De Caritat, P. Distinguishing between natural and anthropogenic sources for elements in the environment: Regional geochemical surveys versus enrichment factors. Sci. Total Environ. 2005, 337, 91–107. [Google Scholar] [CrossRef] [PubMed]
  20. Soubrand-Colin, M.; Neel, C.; Bril, H.; Grosbois, C.; Caner, L. Geochemical behaviour of Ni, Cr, Cu, Zn and Pb in an Andosol–Cambisol climosequence on basaltic rocks in the French Massif Central. Geoderma 2007, 137, 340–351. [Google Scholar] [CrossRef]
  21. Shui, L.; Pan, X.; Chen, X.; Chang, F.; Wan, D.; Liu, D.; Hu, M.; Li, S.; Wang, Y. Pollution characteristics and ecological risk assessment of heavy metals in sediments of the three gorges reservoir. Water 2020, 12, 1798. [Google Scholar] [CrossRef]
  22. Wdowczyk, A.; Tomczyk, P.; Szymańska-Pulikowska, A.; Wiatkowska, B.; Rosik-Dulewska, C. Copper and cadmium content in Polish soil: Analysis of 25-year monitoring study. Land Degrad. Dev. 2023, 34, 4857–4868. [Google Scholar] [CrossRef]
  23. Muller, G. Index of geoaccumulation in the sediments of the Rhine River. Geojournal 1969, 2, 108–118. [Google Scholar]
  24. Pekey, H.; Karakas, D.; Ayberk, S.; Tolun, L.; Bakoglu, M. Ecological risk assessment using trace elements from surface sediments of Izmit Bay (Northeastern Marmara Sea) Turkey. Mar. Poll. Bull. 2004, 48, 946–953. [Google Scholar] [CrossRef] [PubMed]
  25. Said, I.; Salman, S.A.; Elnazer, A.A. Multivariate statistics and contamination factor to identify trace elements pollution in soil around Gerga City, Egypt. Bull. Natl. Res. Cent. 2019, 43, 43. [Google Scholar] [CrossRef]
  26. Halamić, J.; Miko, S. Geochemical Atlas of the Republic of Croatia; Croatian Geological Survey: Zagreb, Croatia, 2009; p. 87. [Google Scholar]
  27. Feletar, D.; Feletar, P. The Natural Basis as a Factor of the Inhabitation of the Upper Croatian Podravina Region. Podravina 2008, 2, 167–212. [Google Scholar]
  28. Brenko, T.; Borojević Šoštarić, S.; Ružičić, S.; Sekelj Ivančan, T. Evidence for the formation of bog iron ore in soils of the Podravina region, NE Croatia: Geochemical and mineralogical study. Quarter. Intern. 2020, 536, 13–29. [Google Scholar] [CrossRef]
  29. Prelogović, E.; Velić, I. Kvartarna tektonska aktivnost zapadnog dijela Dravske depresije (eng. Quaternary tectonic activity of western part of the Drava basin). Geološki Vjesn. 1988, 42, 287–299. (In Croatian) [Google Scholar]
  30. Šimunić, A.; Hećimović, I.; Avanić, R. Basic Geological Map of the Republic of Croatia, M 1:100 000, Sheet Koprivnica (L33-70); Croatian Geological Survey: Zagreb, Croatia, 1990. [Google Scholar]
  31. IUSS Working Group WRB. World Reference Base for Soil Resources 2014, Update 2015—International Soil Classification System for Naming Soils and Creating Legends for Soil Maps; World Soil Resources Reports No. 106; FAO: Rome, Italy, 2015. [Google Scholar]
  32. Husnjak, S. Sistematika Tala Hrvatske (Eng. Soil Systematics of Croatia); University of Zagreb: Zagreb, Hrvatska, 2014. [Google Scholar]
  33. Varol, M.; Sünbül, M.R.; Aytop, H.; Yılmaz, C.H. Environmental, ecological and health risks of trace elements, and their sources in soils of Harran Plain, Turkey. Chemosphere 2020, 245, 125592. [Google Scholar] [CrossRef] [PubMed]
  34. Loska, K.; Wiechula, D.; Barska, B.; Cebula, E.; Chojnecka, A. Assessment of arsenic enrichment of cultivated soils in Southern Poland. Pol. J. Environ. Stud. 2003, 12, 187–192. [Google Scholar]
  35. Loska, K.; Wiechulła, D.; Korus, I. Metal contamination of farming soils affected by industry. Environ. Int. 2004, 30, 159–165. [Google Scholar] [CrossRef] [PubMed]
  36. Schiff, K.C.; Weisberg, S.B. Iron as a reference element for determining trace metal enrichment in Southern California coast shelf sediments. Mar. Environ. Res. 1999, 48, 161–176. [Google Scholar] [CrossRef]
  37. Neto, B.J.A.; Smith, B.J.; McAllister, J.J. Heavy metal concentrations in surface sediments in a near shore environment Jurujuba Sound Southeast Brazil. Environ. Poll. 2000, 109, 1–9. [Google Scholar] [CrossRef] [PubMed]
  38. Mucha, A.P.; Vasconcelos, M.T.S.D.; Bordalo, A.A. Macrobenthic community in the Douro Estuary: Relations with trace metals and natural sediment characteristics. Environ. Poll. 2003, 121, 169–180. [Google Scholar] [CrossRef] [PubMed]
  39. Barbieri, M. The Importance of Enrichment Factor (EF) and Geoaccumulation Index (Igeo) to Evaluate the Soil Contamination. J. Geol. Geophys. 2016, 5, 1000237. [Google Scholar] [CrossRef]
  40. Rajmohan, N.; Prathapar, S.A.; Jayaprakash, M.; Nagarajan, R. Vertical distribution of heavy metals in soil profile in a seasonally waterlogging agriculture field in Eastern Ganges Basin. Environ. Monitor. Assess. 2014, 186, 5411–5427. [Google Scholar] [CrossRef] [PubMed]
  41. Ružičić, S.; Puljko, M.; Brenko, T. Spatial and statistical analyses of parameters influencing arsenic distribution in the lowland Drava River area, northeastern Croatia. Environ. Earth Sci. 2023, 82, 403. [Google Scholar] [CrossRef]
  42. Alloway, B.J. Heavy Metals in Soils, 2nd ed.; Blackie Academic & Professional: London, UK, 1995. [Google Scholar]
  43. Izbicki, J.A.; Ball, J.W.; Bullen, T.D.; Sutley, S.J. Chromium, chromium isotopes and selected traced elements, western Mojave Desert, USA. Appl. Geochem. 2008, 23, 1325–1352. [Google Scholar] [CrossRef]
  44. Morrison, J.M.; Goldhaber, M.B.; Lee, L.; Holloway, J.M.; Wanty, R.B.; Wolf, R.E.; Ranville, J.F. A regional-scale study of chromium and nickel in soils of northern California, USA. Appl. Geochem. 2009, 24, 1500–1511. [Google Scholar] [CrossRef]
  45. Morrison, J.M.; Goldhaber, M.B.; Mills, C.T.; Breit, G.N.; Hooper, R.L.; Holloway, J.M.; Diehl, S.F.; Ranville, J.F. Weathering and transport of chromium and nickel from serpentinite in the Coast Range ophiolite to the Sacramento Valley, California, USA. Appl. Geochem. 2015, 61, 72–86. [Google Scholar] [CrossRef]
  46. Bigalke, M.; Ulrich, A.; Rehmus, A.; Keller, A. Accumulation of cadmium and uranium in arable soils in Switzerland. Environ. Pollut. 2017, 221, 85–93. [Google Scholar] [CrossRef] [PubMed]
  47. Mirlean, N.; Roisenberg, A. The effect of emissions of fertilizer production on the environment contamination by cadmium and arsenic in southern Brazil. Environ. Pollut. 2006, 143, 335–340. [Google Scholar] [CrossRef] [PubMed]
  48. Sprynskyy, M.; Kowalkowski, T.; Tutu, H.; Cozmuta, L.M.; Cukrowska, E.M.; Buszewski, B. The adsorption properties of agricultural and forest soils towards heavy metal ions (Ni, Cu, Zn, and Cd). Soil Sediment Contam. 2011, 20, 12–29. [Google Scholar] [CrossRef]
  49. Grant, C.A. Influence of phosphate fertilizer on cadmium in agricultural soils and crops. Pedologist 2011, 3, 143–155. [Google Scholar] [CrossRef]
  50. Ružičić, S.; Kovač, Z.; Borovčak, T. Possible Influence of Agriculture on an Unsaturated Zone in Croatia. Pol. J. Environ. Stud. 2019, 28, 4341–4349. [Google Scholar] [CrossRef]
  51. Panagopoulos, I.; Karayannis, A.; Kollias, K.; Xenidis, A.; Papassiopi, N. Investigation of Potential Soil Contamination with Cr and Ni in Four Metal Finishing Facilities at Asopos Industrial Area. J. Hazard. Mater. 2015, 281, 20–25. [Google Scholar] [CrossRef] [PubMed]
  52. Sarkar, A.; Rano, R.; Udaybhanu, G.; Basu, A.K.A. Comprehensive Characterization of Fly Ash from Thermal Power Plant in Eastern India. Fuel Process. Technol. 2006, 87, 259–277. [Google Scholar] [CrossRef]
  53. Poznanović Spahić, M.M.; Sakan, S.; Glavaš-Trbić, B.M.; Tančić, P.; Škrivanj, S.; Kovacevic, J.; Manojlović, D.D. Natural and anthropogenic sources of chromium, nickel and cobalt in soils impacted by agricultural and industrial activity (Vojvodina, Serbia). J. Environ. Sci. Health Toxic/Hazard. Part A 2019, 54, 219–230. [Google Scholar] [CrossRef] [PubMed]
  54. Kuklová, M.; Kukla, J.; Hniličková, H.; Hnilička, F.; Pivková, I. Impact of Car Traffic on Metal Accumulation in Soils and Plants Growing Close to a Motorway (Eastern Slovakia). Toxics 2022, 10, 183. [Google Scholar] [CrossRef] [PubMed]
  55. Bonten, L.T.C.; Römkens, P.F.A.M.; Brus, D.J. Contribution of heavy metal leaching from agricultural soils to surface water loads. Environ. Forensics 2008, 9, 252–257. [Google Scholar] [CrossRef]
  56. Schipper, P.N.M.; Bonten, L.T.C.; Plette, A.C.C.; Moolenaar, S.W. Measures to diminish leaching of heavy metals to surface waters from agricultural soils. Desalination 2008, 226, 89–96. [Google Scholar] [CrossRef]
  57. Kabata-Pendias, A. Trace Elements in Soils and Plants, 4th ed.; CRC Press: Boca Raton, FL, USA, 2011. [Google Scholar]
  58. Grigalavičienė, I.; Rutkovienė, V.; Marozas, V. The Accumulation of Heavy Metals Pb, Cu and Cd at Roadside Forest Soil. Pol. J. Environ. Stud. 2005, 14, 109–115. [Google Scholar]
  59. Sollitto, D.; Romic, M.; Castrignanò, A.; Romic, D.; Bakic, H. Assessing heavy metal contamination in soils of the Zagreb region (Northwest Croatia) using multivariate geostatistics. Catena 2010, 80, 182–194. [Google Scholar] [CrossRef]
  60. Jiries, A.G.; Hussein, H.H.; Halash, Z. The quality of water and sediments of street runoff in Amman, Jordan. Hydrolog. Proc. 2001, 15, 815–824. [Google Scholar] [CrossRef]
  61. Palansooriya, K.N.; Shaheen, S.M.; Chen, S.S.; Tsang, D.C.W.; Hashimoto, Y.; Hou, D.; Bolan, N.S.; Rinklebe, J.; Ok, Y.S. Soil amendments for immobilization of potentially toxic elements in contaminated soils: A critical review. Environ. Int. 2020, 134, 105046. [Google Scholar] [CrossRef] [PubMed]
  62. Sparks, D.; Singh, B.; Siebecker, M.G. Environmental Soil Chemistry; Elsevier: Amsterdam, The Netherland, 2003; p. 447. [Google Scholar] [CrossRef]
  63. Grisso, R.; Allex, M.; Holshouser, D.; Thomason, W. Precision Farming Tools: Soil Electrical Conductivity; Virginia State University Cooperative Extension: Petersburg, VA, USA, 2005; pp. 442–508. [Google Scholar]
  64. Rinklebe, J.; Shaheen, S.M.; Yu, K. Release of As, Ba, Cd, Cu, Pb, and Sr under pre-definite redox conditions in different rice paddy soils originating from the U.S.A. and Asia. Geoderma 2016, 270, 21–32. [Google Scholar] [CrossRef]
  65. Sipos, P.; Choi, C.; Németh, T.; Szalai, Z.; Póka, T. Relationship between iron and trace metal fractionation in soils. Chem. Speciat. Bioavailab. 2014, 26, 21–30. [Google Scholar] [CrossRef]
  66. Antoniadis, V.; Shaheen, S.M.; Tsadilas, C.D.; Selim, M.H. Zinc sorption by different soils as affected by selective removal of carbonates and hydrous oxides. Appl. Geochem. 2018, 88, 49–58. [Google Scholar] [CrossRef]
Figure 1. Study area and position of sampling sites in regards to regional position.
Land 13 00434 g001
Figure 2. Spatial distribution of (a) cadmium (mg/kg), (b) cadmium enrichment factor, (c) cadmium contamination factor, and (d) cadmium geoaccumulation index in the study area.
Land 13 00434 g002
Figure 3. Spatial distribution of (a) chromium (mg/kg), (b) chromium enrichment factor, (c) chromium contamination factor, and (d) chromium geoaccumulation index in the study area.
Land 13 00434 g003
Figure 4. Spatial distribution of (a) copper (mg/kg), (b) copper enrichment factor, (c) copper contamination factor, and (d) copper geoaccumulation index in the study area.
Land 13 00434 g004
Figure 5. Spatial distribution of (a) nickel (mg/kg), (b) nickel enrichment factor, (c) nickel contamination factor, and (d) nickel geoaccumulation index in the study area.
Land 13 00434 g005
Figure 6. Spatial distribution of (a) lead (mg/kg), (b) lead enrichment factor, (c) lead contamination factor, and (d) lead geoaccumulation index in the study area.
Land 13 00434 g006
Figure 7. Spatial distribution of (a) zinc (mg/kg), (b) zinc enrichment factor, (c) zinc contamination factor, and (d) zinc geoaccumulation index in the study area.
Land 13 00434 g007
Figure 8. (a) Dendrogram of hierarchical cluster analysis with the red cut-off line and (b) step and linkage distance diagram for determining the cut-off line and linkage distance 8.
Land 13 00434 g008
Figure 9. (a) Projection of factors 1 and 2; (b) projection of factors 1 and 3; (c) scree plot of total factor variance; and (d) factor loadings for the first four factors (samples marked in red show negative or positive correlation above ±0.70).
Land 13 00434 g009
Table 1. Correlation matrix of the observed PTMs and other soil parameters in the research area. Samples marked in red show statistically reliable values (p < 0.05). * data taken from Ružičić et al. [41].
VariableCrNiCuZnCdPbFepH *Clay *Silt *Sand *TCSi *Al *CEC *
Cr1.00
Ni0.061.00
Cu0.120.791.00
Zn−0.240.750.691.00
Cd−0.140.610.570.631.00
Pb0.190.070.050.08−0.321.00
Fe−0.400.670.560.700.67−0.371.00
pH *−0.130.460.410.500.350.070.551.00
Clay *0.110.300.190.120.030.240.200.171.00
Silt *0.050.240.060.10−0.040.100.100.090.541.00
Sand *−0.09−0.30−0.13−0.120.01−0.17−0.16−0.14−0.82−0.931.00
TC−0.250.490.480.670.370.080.670.560.170.03−0.091.00
Si *0.29−0.61−0.48−0.66−0.47−0.03−0.74−0.52−0.23−0.010.11−0.771.00
Al *0.30−0.06−0.02−0.14−0.030.00−0.220.030.050.17−0.13−0.380.471.00
CEC *−0.380.520.470.680.390.120.690.630.270.03−0.150.83−0.76−0.371.00
Disclaimer/Publisher’s Note: The statements, opinions and data contained in all publications are solely those of the individual author(s) and contributor(s) and not of MDPI and/or the editor(s). MDPI and/or the editor(s) disclaim responsibility for any injury to people or property resulting from any ideas, methods, instructions or products referred to in the content.