1. Introduction
Tranquil places have been characterized as pleasant and calming environments that can provide recreational and restorative benefits to people [
1,
2]. Previous studies have noted positive associations between “tranquility” and human health through stress reduction [
3], emotional and attention restoration [
4], and pain relief [
5]. These benefits to public health have encouraged policymakers to delimit and protect areas that can provide a tranquil experience. For example, the European Union has an Environmental Noise Directive (END) that advances the notion of “quiet areas” and requires EU member states to identify, map, and formulate strategies to protect such places [
6]. These “quiet zones” are frequently identified by their (lack of) proximity to anthropogenic noise sources such as highways or residential or industrial facilities [
7] and are therefore typically far removed from daily urban life. Although well-intentioned, these places have limited utility in terms of their effect on public well-being because few people can experience their benefits. In addition, quiet areas focus on aurally defined places; we suspect that there are also visually driven considerations in assessing tranquil places. In this study, we focus on the landscape-based, visual aspects of the phenomena.
A host of previous studies have proposed multiple ways to assess tranquility and visual context [
8,
9,
10]. The tranquil experience has been recognized as a process of multi-sensorial interactions [
2] which include both acoustic and visual factors [
9,
11]. Hunter et. al. (2010) noted that tranquil views increased connectivity within the auditory cortex, which facilitated a feeling of tranquility despite being situated in environments where the acoustic characteristics resemble noise [
11]. However, the ways in which different landscape elements influence the determination of tranquility remain unclear. Because tranquility is a personal construct, traditional data collection methods (personal survey interactions) are usually costly, time-consuming, site-specific, and difficult to generalize.
In this study, we propose a big-data approach to quantify what makes a tranquil place from the perspective of the visual landscape. We analyze image-based and text-based crowdsourced posts to identify areas in urban settings that have been noted to promote a state of tranquility. Content analysis of the images helps to determine the key landscape attributes of these settings in support of improving landscape design decisions. The use of non-experimental, observational data means our study does not control for ambient noise levels. However, areas with high noise levels are unlikely to be identified as tranquil in our analysis.
The work addresses the following research questions: (a) Can tranquil urban places be identified from crowdsourced observational data? (b) If so, what are their landscape component parts? And (c) How do they contribute to a sense of tranquility? We investigate the place features of tranquil experiences through user-generated landscape photographs shared via social media. Semantic segmentation techniques help to quantify eye-level visual features in these photos to discern the landscape characteristics that represent tranquil places. Our research offers recommendations for urban landscape practice aimed at fostering tranquil spaces, provides insights for experimental studies on tranquil scene visualization, and underscores the value of leveraging crowdsourced social media data to enhance our understanding of built environment perceptions.
This paper is structured as follows:
Section 2 reviews the literature on tranquility, crowdsourced data, deep learning, and computer vision technologies.
Section 3 details our methodology and analytical framework. In
Section 4, we present our findings, and
Section 5 interprets the results, discusses design implications, and acknowledges limitations.
Section 6 concludes by considering future directions informed by this Swedish case study.
2. Literature Review
Tranquility is said to be experienced as a calm mental state [
12]. Noted as more than a quiet acoustic environment, it has at times been conceptualized as “cognitive quiet” [
9]. Tranquility is generally recognized as a personal construct that results from a complex array of experiential and multi-sensorial sources [
2,
9]. Previous studies have identified the tranquil experience as a process of visual-auditory interactions [
8,
9,
10,
11,
13]. For example, Carles et al. (1999) found a deep coherence between sound and image on the perception of the total environment [
8]. Viollon et al. (2002) assessed how visual settings affect listeners’ judgments of urban acoustic environment and argued that these two modalities interact and reinforce each other in complex ways [
10]. According to Pheasant et al. (2008), a tranquil place is determined by both auditory and visual factors, namely maximum sound pressure level (L
Amax) and the percentage of natural features in the visual context [
9]. Hunter et al. (2010) conducted a laboratory experiment with functional magnetic resonance imaging (FMRI) and found that tranquil scenes enhance activity in different regions of the brain depending on the view [
11]. Finally, Herzog and Chernick (2000) found that the presence of landscape elements enhances a feeling of tranquility, in their case waterbody elements [
13]. These findings highlight the contribution of visual context in eliciting perceived tranquility.
Descriptors, measurements, and prediction models from multiple disciplines have been proposed to assess perceived tranquility [
3,
14]. For example, Payne (2013) developed the Perceived Restorativeness Soundscape Scale (PRSS) to assess perceived tranquility and its potential in attention restoration [
14]. Öhrström et al. (2006) investigated the “perceived soundscape” based on different environmental noise levels [
3]. These studies conducted direct assessments of the personal tranquility states of the participants, and these approaches are primarily based on environmental-psychological approaches such as laboratory experiments and socio-acoustic surveys. These direct assessments and their required intensive data collection methods have several weaknesses: they tend to be site-specific, they are limited by the sample size of participants, and they can be time-consuming and expensive.
Spatial models have been utilized to characterize and map tranquil areas. The Quietness Suitability Index (QSI) is an important evaluation model that considers contextual auditory information in an assessment of tranquility [
6]. QSI identifies areas that are potentially quiet using noise classes and the way people perceive noise [
15]. It suggests that anthropogenic noise directly affects tranquility, although the disturbance declines with distance-based curves according to land use and population. In contrast, the Tranquility Rating Prediction Tool (TRAPT) recognizes tranquil space as a product of both auditory and visual criteria. The tool predicts tranquility using a linear expression of sound pressure level and natural visual elements like vegetation and water. Introduced in 2008, TRAPT has been used to develop a country-wide sound policy in the United Kingdom [
9]. Subsequent studies have expanded visual components, incorporating a broader range of natural and contextual features including buildings, landmarks, monuments, and other landscape elements [
16]. Each of these models contributes to identifying and proposing zones that have a high potential for supplying tranquil experiences.
Both TRAPT and QSI demonstrate the supply side of tranquility by pointing out places that theoretically minimize anthropogenic noise. But we also need to understand the demand side of tranquility—that is, where tranquility is actually perceived, experienced, and appreciated. The increasing availability of geo-tagged social media photos enables us to address the latter issue with large geographic place-based experiences and almost real-time simulations.
2.1. Crowdsourced Data
A large and growing body of advanced data-processing technologies has provided ways to gain new insights into the human perception of the built environment by mining data generated from crowdsourcing, social media, and other platforms. These platforms enable users to share texts and photographs that often include geographic information along with descriptions, perceptions, and personal interactions about specific places. This allows researchers to capture geo-based experiences passively, without the direct involvement of respondents [
17,
18]. Given the enormous number of participants, this passively and inexpensively collected information has the potential to help shape design decisions.
Crowdsourced social media data offer a continuous and direct flow of data on human activities with wide coverage and easy access. They have been widely adopted in many environmental studies fields including conservation science, hazard preparedness, tourism, and cultural ecosystem services, among others [
19]. Social media data have also shown great novelty for investigating the human perception of the acoustic environment [
20,
21,
22]. Chesnokova and Purves (2018) extracted texts related to sound descriptions conducted using tags attached to geo-referenced images on social media [
20]. They applied sentiment classification techniques to show how the perception of sound in specific places affects mood. Wartmann et al. (2019) used geo-tagged photos to map the distribution of tranquil areas based on user-generated content in Scotland [
22]. They found that remoteness and the absence of anthropogenic noise are not requirements for a tranquil experience. On the contrary, they noted significant numbers of tranquility tags in high-density, highly accessible, semi-natural areas. Similarly, Chesnokova et al. (2019) found that people can experience tranquility even near noisy, busy streets [
21].
While some visual or contextual elements have been described as important factors for a tranquil experience, current related studies are usually limited to qualitative discussions of photo contents. For example, Wartmann et al. (2019) labeled landscape photos manually based on visual features, such as “open views”, “dominant sky”, “special atmospheric”, and the presence (or absence) of water, greenery, or pedestrians [
22]. These categorizations yield insights into how various landscape features might correlate with tranquility. However, the definitions of certain categories, such as “open view” (or “vegetation”), can be ambiguous, and there is a need for a more nuanced categorization and analysis.
2.2. Deep Learning and Computer Vision Technologies
In the past few years, computer vision technologies have been widely applied in urban and environmental studies using deep learning techniques [
23]. The fast development of these applications has dramatically informed urban studies by learning feature presentations of large datasets such as visual feature recognition and object detection [
24]. Semantic segmentation is a computer vision technique used to parametrize images into semantic variables. It has been adapted to measure multiple aspects of the human perception in the built environment, such as feelings towards street views [
25] and preference for recreational activities [
26].
Although prolific in some respects, the application of computer vision techniques to understanding the urban landscape has been limited. For instance, a large number of recent human-scaled studies have relied mainly on “street view”, even though street-level images fail to reflect the diversity or depth of a landscape available to people beyond roadways mapped by Google [
25,
27].
Since deep-learning-based computer vision models need to be trained on a large volume of data before testing and application, the quality of the training dataset is a key issue for determining recognition accuracy. Some landscape-related studies have used training data that cover only a limited number of landscape elements which, in turn, limits their utility [
28]. Some of these models were developed for autonomous vehicle sensors, which are pre-trained on datasets focused on road conditions such as Cityscape [
29] and CamVid [
30]. These datasets miss important landscape elements (such as off-the-road waterbodies) that may be less relevant for driving purposes but significant in facilitating a sense of the tranquil landscape in general.
3. Methodology
In this study, we use geo-tagged photos from the photo-sharing platform Flickr (flickr.com) to evaluate tranquil landscapes in Sweden. Text descriptors and visual and spatial features of places are extracted based on the content, time, and location of the photos. We first conduct text recognition to identify places with tags noted to be tranquil. We use a list of common phrases in both English and Swedish to sort these images. Photos without tranquil tags are also sampled as a control group. For both groups of images, we obtain landscape photos that represent the eye-level environment. Next, we apply semantic segmentation to produce quantitative representations of the environments where the photos were taken. A vision transformer (ViT) model pretrained on ADE20K is used for this task. These segmentation results, together with the time features of the photos, are used to fit in regression models to examine the correlations between landscape elements and the presence of tranquility.
3.1. Study Area
Sweden is a European country that follows the UN quiet areas principles. It is generally known for its connection to sustainable principles, green space access, and natural landscapes. The nation boasts a broad spectrum of landscape types, including alpine, forest, mire, lake, coastal, or river landscape [
31]. It is also one of a handful of European countries implementing policies on the preservation and creation of quiet areas. Quiet areas are included in the planning process for 41% of municipalities, mostly in rural settings [
6]. The European Union’s Environmental Noise Directive (END) directs nations to map environmental noise from human sources including transportation and industrial sources. The END also directs nations to develop strategies to prevent and reduce noise and to protect quiet areas.
Before the passage of the Environmental Noise Directive, planners and transportation agencies in Sweden were paying attention to road noise. In 1998, the Swedish Road Administration began mapping quietness [
6]. This research was followed by more mapping and research projects, including “Soundscapes for better health”, that explored the impact of environmental noise. However, policies to protect residential areas from traffic noise have been relaxed since 2015. Nonetheless, for the nation as a whole, Sweden has a larger extent of quiet areas than most nations in the EU: quiet areas in Sweden cover more than 70% of the territory [
7].
3.2. Data Collection and Pre-Processing
Flickr is an image- and video-hosting community where a wide demographic of active users shares photographs with tags, descriptions, and locations. A total of 60 million active users participate per month, uploading more than 25 million photos on a daily basis [
32]. Because of its wide coverage and easy access, the Flickr dataset has been widely applied in environmentally based studies on topics ranging from aesthetic preferences [
33] to perceptual characters [
34], tourism [
35], and conservation sciences [
36].
We use the Flickr Application Planning Interface (API) to crawl images in Sweden from January 2010 to April 2022. The crawling process is performed in R 4.3.1 software with the package “photosearcher”. This package allows batch work for searching and downloading Flickr photos based on keywords and geographic references [
37]. We crawl the photos and their metadata of location (coordinate, city, country, etc.), time (when the photo was taken, uploaded, and edited on the Flickr website), semantics (title, tags, and descriptions), owner ID, and review counts. We retain the set of pictures for each user taken on a unique day as photo-user-day (PUD) to measure photographic activities. This measurement makes unique combinations of users and date information and it is frequently applied in assessing visitations because it removes the bias toward active users [
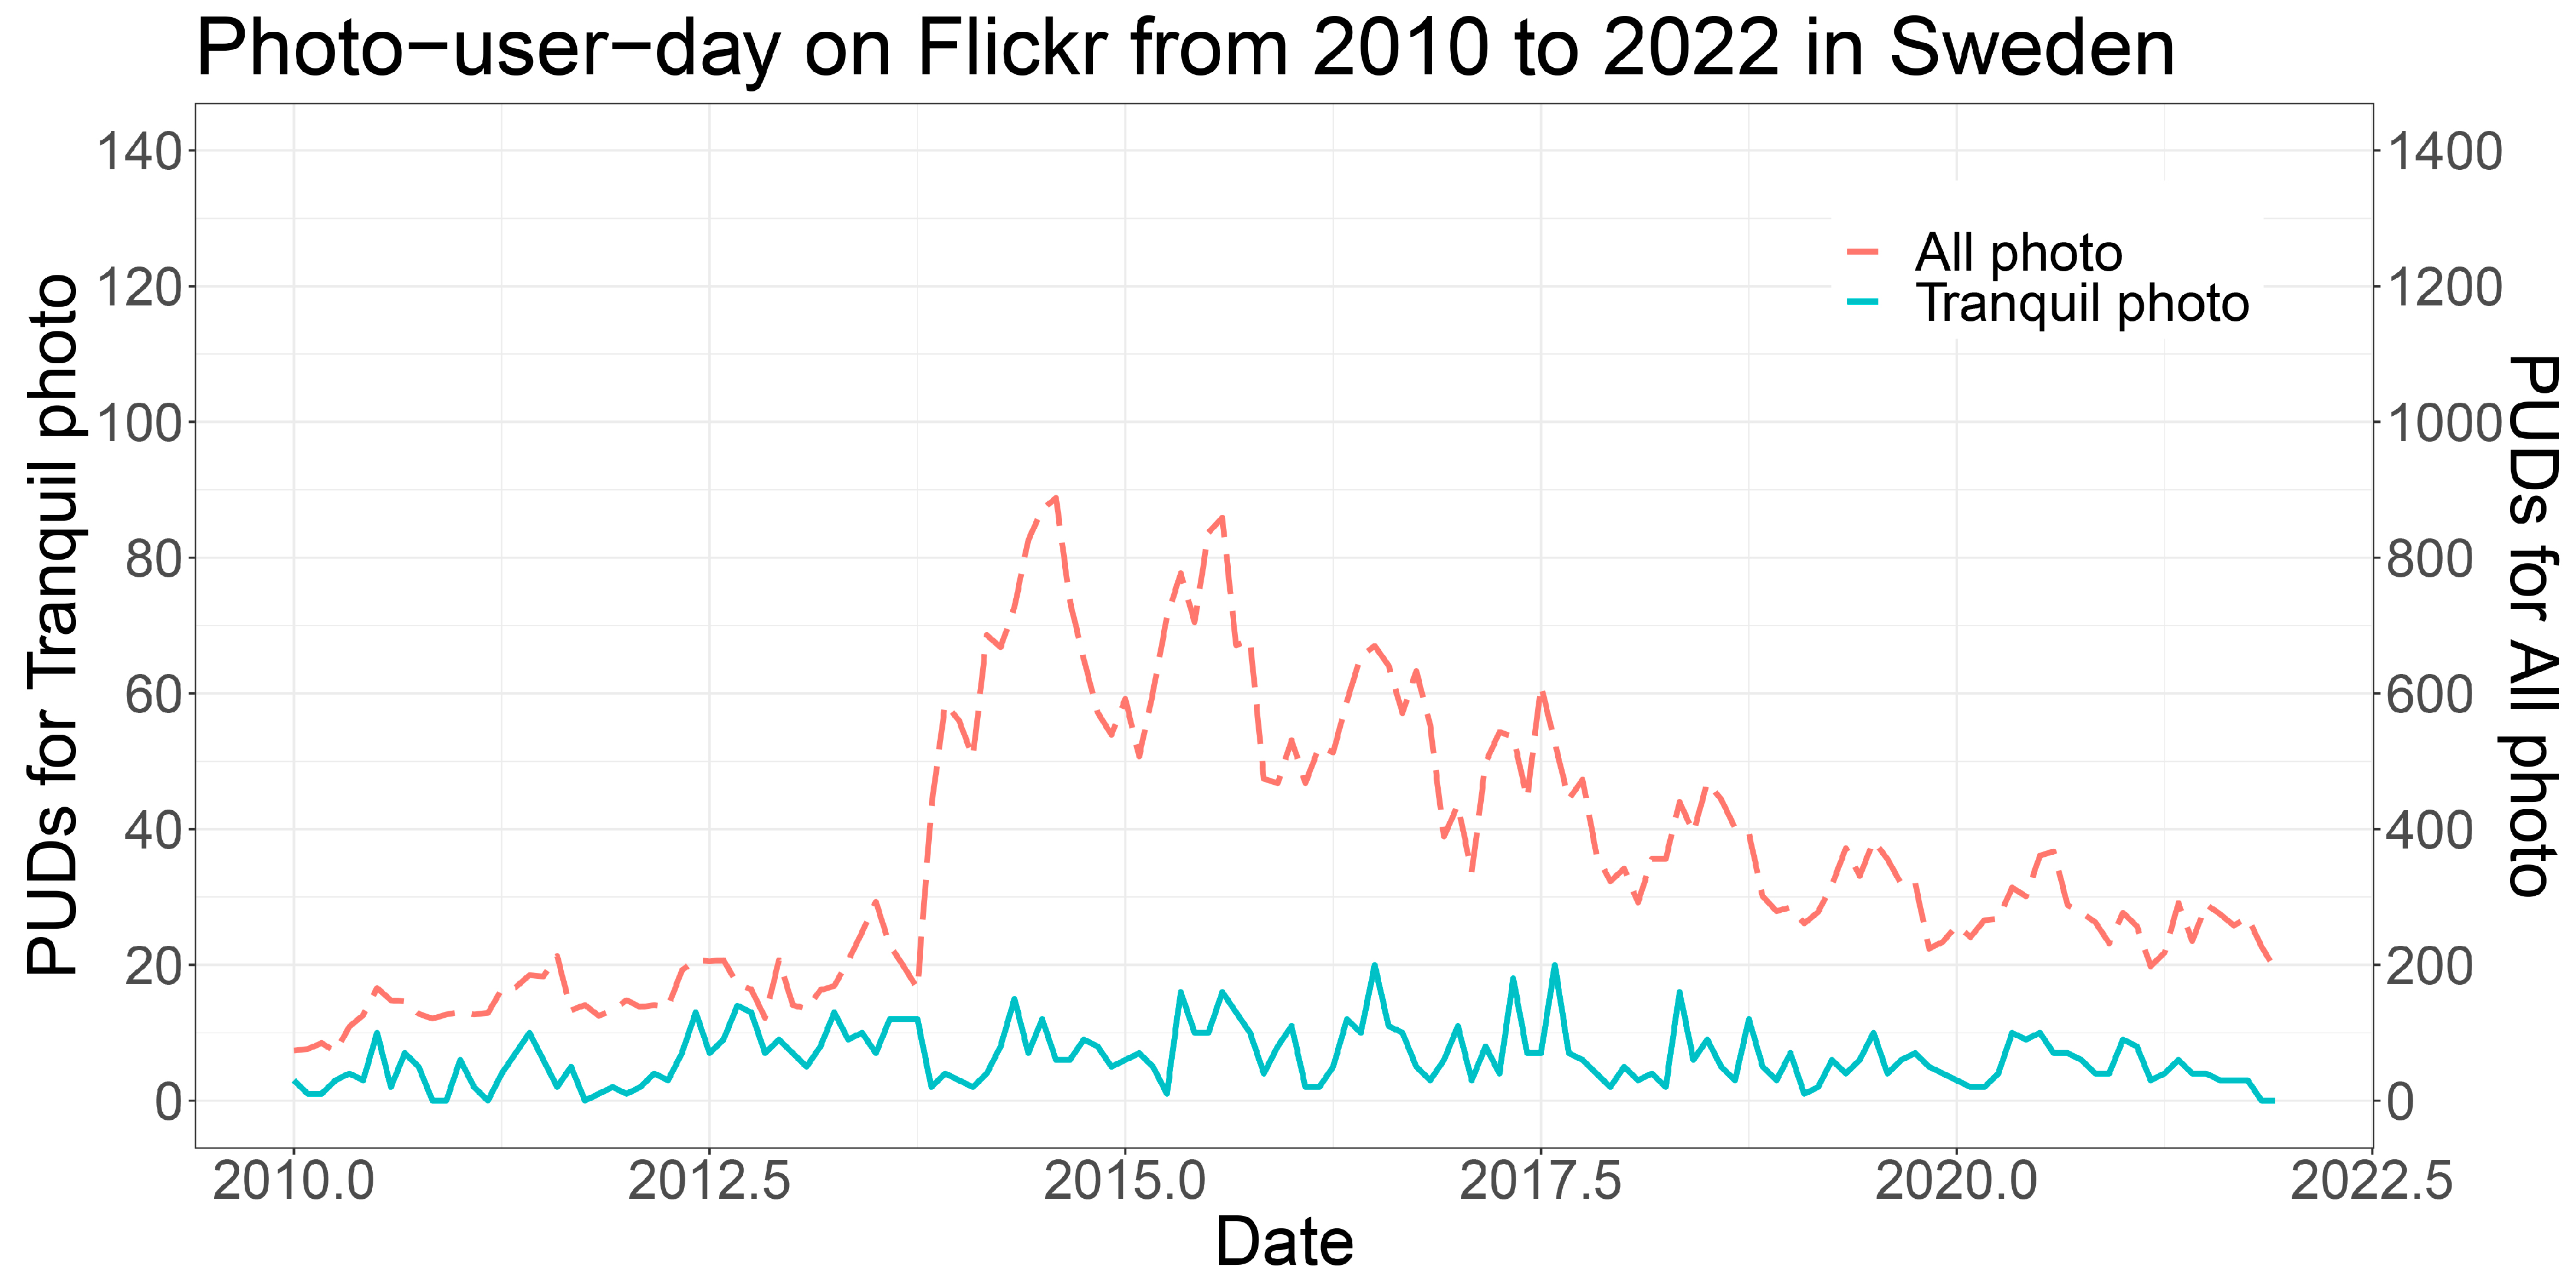
38]. We collected 159,250 Flickr photos and 77,475 PUD posted in Sweden over the study period.
We categorize photographs into two groups based on tranquility in tags. One group contains a tagged tranquil scene (tagged) while the other works as a control group (non-tagged). To filter the tranquilly tagged photos, we use a list of tranquility oriented terms found in the previous literature [
22]. The final list contains 15 tagged terms (in both English and Swedish)—quiet, quietness, peace, peaceful, serene, tranquil, tranquility, silence, silent, lugn (calm), lugnness, fred (peace), fredlig (peaceful), tystnad (silence), and tyst (quiet). Although not an exhaustive list of terms, it provided 1051 unique “tranquil” photographs. The photo search is based exclusively on tags (titles or descriptions are not included), because we have found them to be more concise and less prone to include complex language structures, such as negations or double negatives (e.g., “not noisy at all”). We assume that when users upload a photograph and tag it with terms related to tranquility, they are indicating an association between the depicted landscape and their personal tranquil experience at that moment. It is important to note that the definition of a “tranquil scene” may vary from person to person and case to case, since tranquility is a complex state that involves a range of experiential and emotional factors in addition to sensory responses to the physical environment [
9]. Therefore, while one visitor may recognize a place as “tranquil”, another may not. Although the absence of a tranquil tag does not promise an absence of tranquility, we believe the tranquility was less noteworthy compared to the tranquility-tagged photo group.
We select photos (from both tagged and non-tagged groups) that represent identifiable landscape elements based on the following principles:
The photo should be taken in an outdoor environment.
The photo should be close to “eye level”. Close-up photography of a miniature object is filtered out.
Photos that are made with exaggerated filters or noticeable photoshop edits are excluded.
Drawings and images created by combining several photos are also dropped.
Photos are manually classified by 2 landscape architecture students and examined using Cohen’s Kappa to measure the level of agreement between the 2 classifiers. The Cohen’s Kappa coefficient is 0.632, which indicates a substantial agreement. After final sorting, there were 449 PUDs for tranquil landscape photos and 2451 image samples for non-tranquil landscapes.
Figure 1 shows the distribution of photo-user-day (PUD) of all photographic uploads from 2010 to 2022. Tranquil landscape photos only account for a minor percentage (less than 1%) of the total.
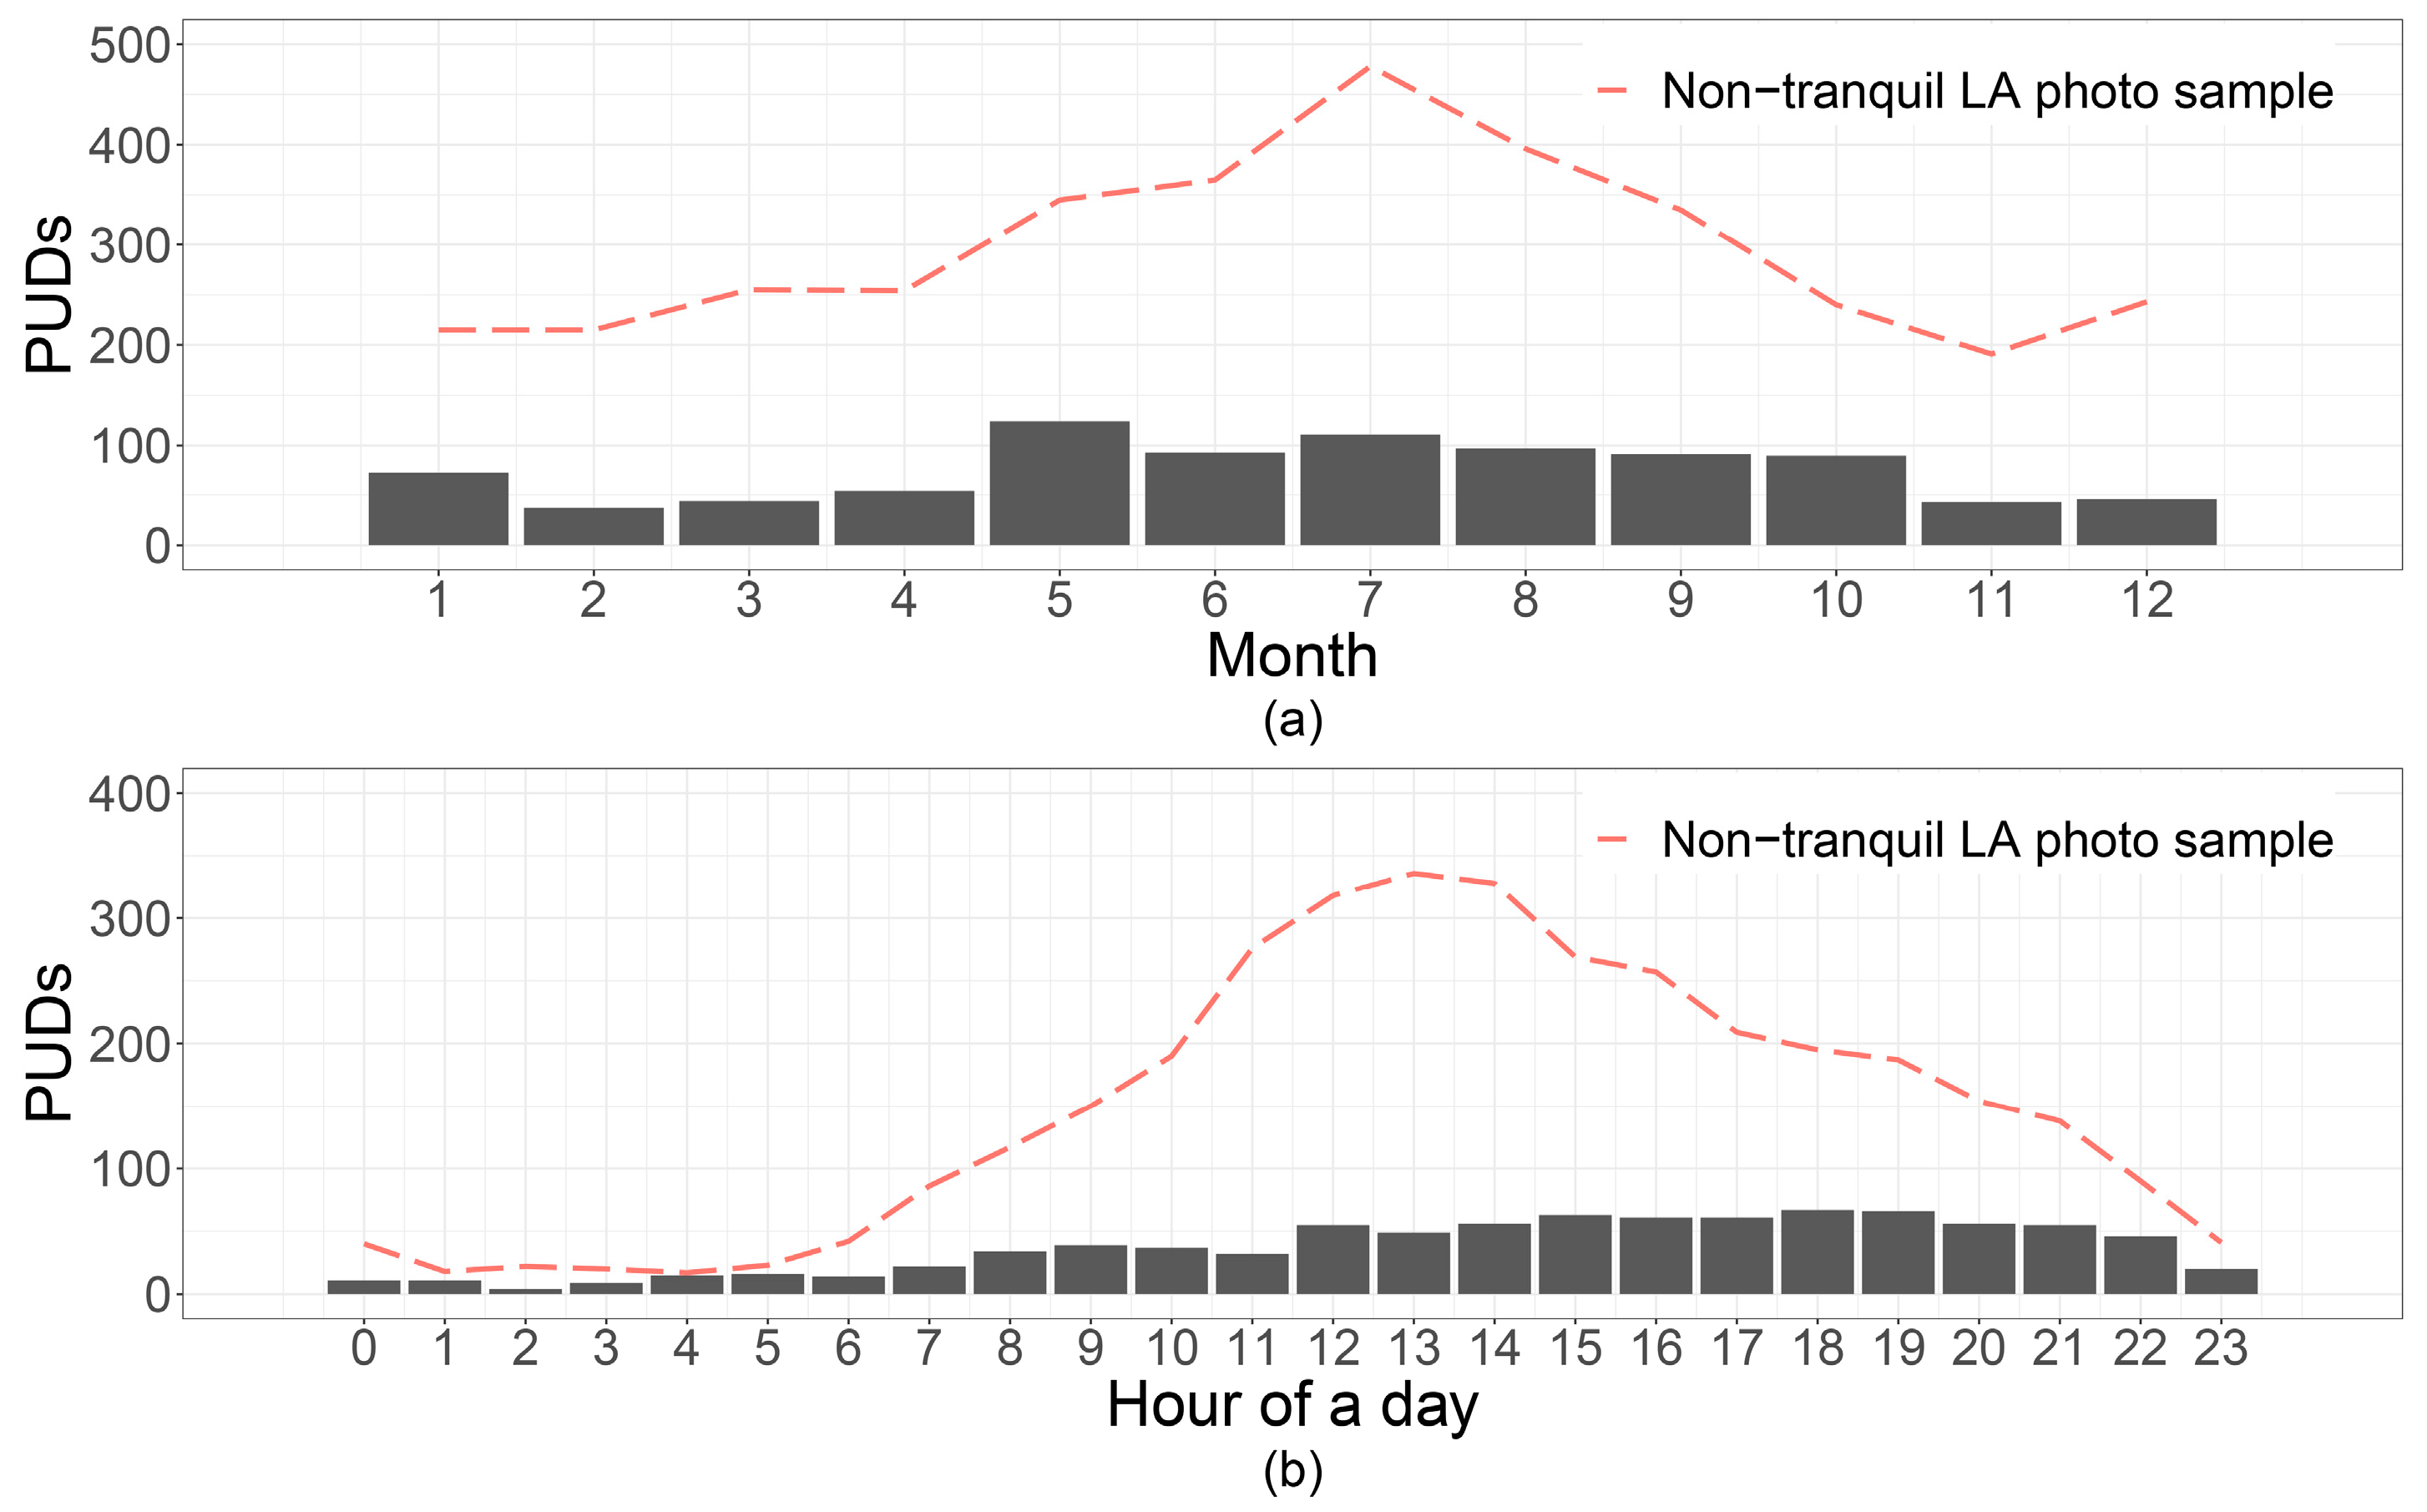
To understand if there is a temporal pattern for taking tranquil photos, we compare the cumulative PUDs between tranquil photos and other landscape photo samples (
Figure 2). Peak landscape photographic periods are in the summer months for both tagged and non-tagged PUDs. The seasonal changes of the two groups are similar from eye level (
Figure 2a), indicating no preference for a specific season for facilitating a state of tranquility. In contrast, there seems to be a notable percentage of tranquil landscape photos taken during dawn and dusk in our hourly examination (
Figure 2b). While it is expected that a larger number of PUDs are recorded during the daytime for both sets of landscape photos, the rate of increase in tranquil photos during these hours is comparatively slower than that of non-tranquil landscape photos. This suggests that landscape photographs captured at dawn or dusk are more likely to be tagged as tranquil compared to those taken during the daytime. Thus, in addition to visual factors, the temporal pattern may serve as a potential contributing factor in creating a tranquil atmosphere. Given that the presence of daylight (or twilight) can influence the appearance of landscape elements, we have elected to incorporate time as an interacting variable for the regression analysis detailed in
Section 3.4.
3.3. Quantifying the Human-Scale Environment with Semantic Segmentation
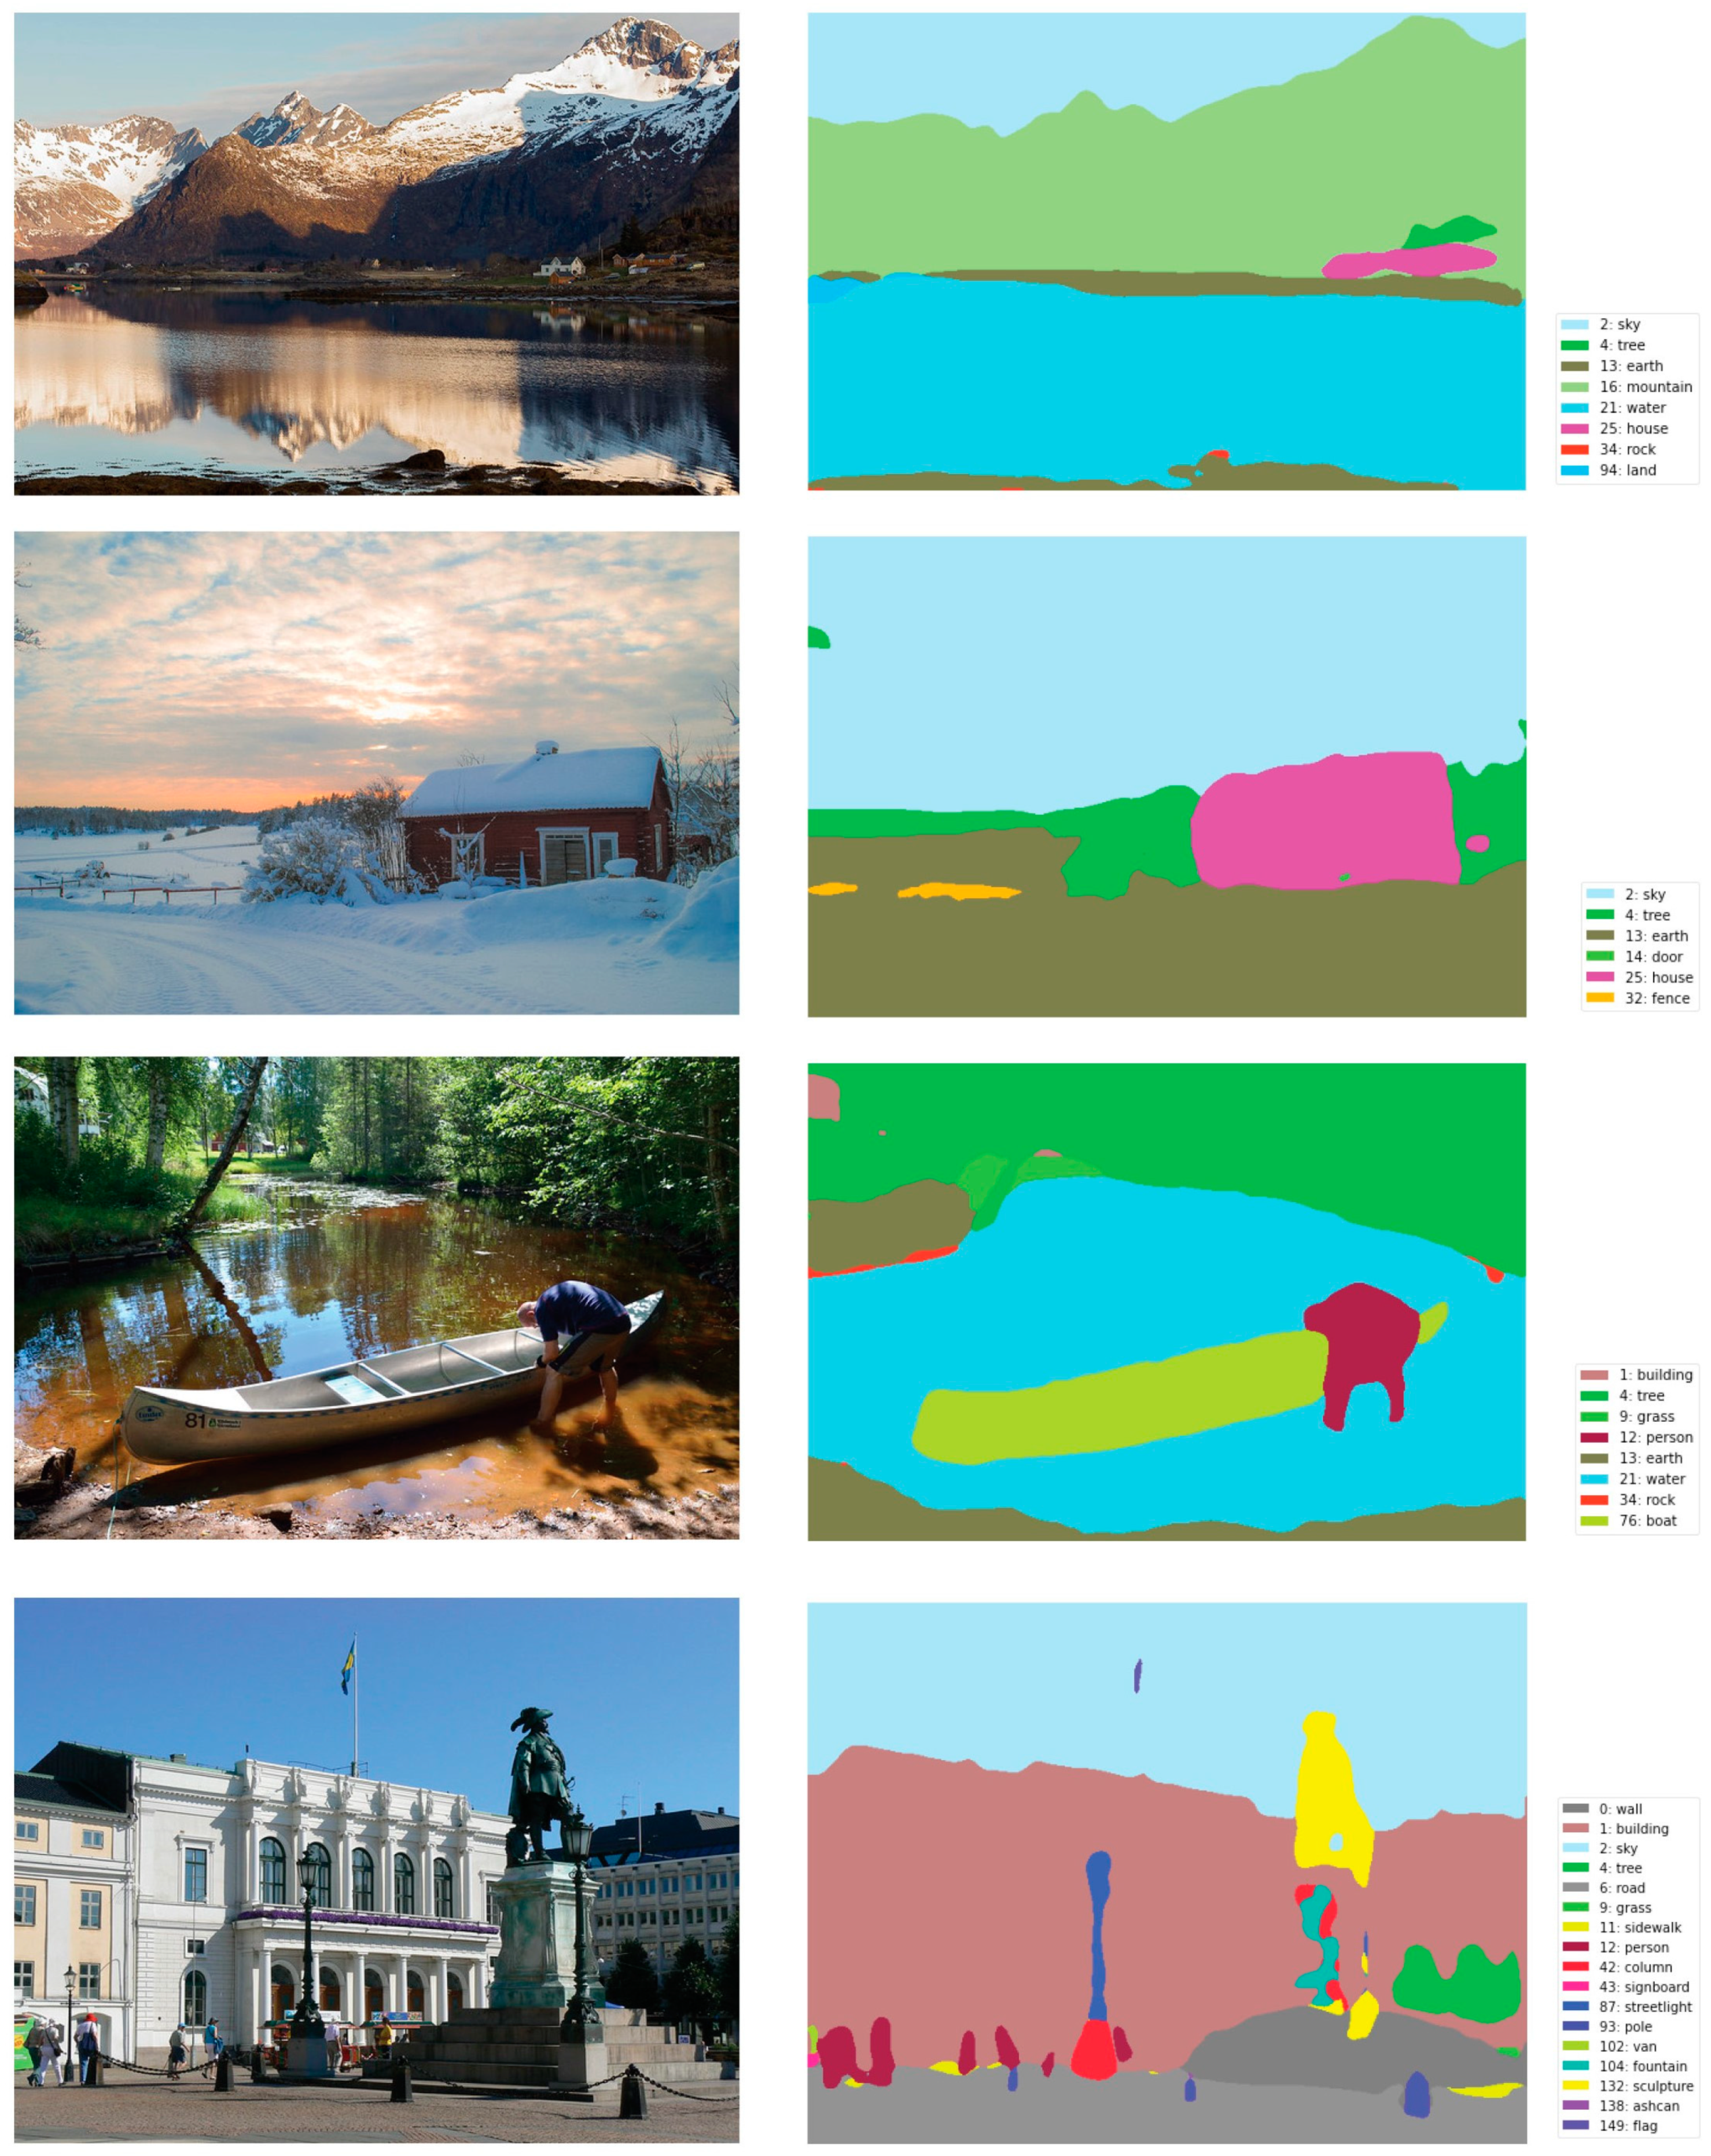
Image parameterization is conducted within a comprehensive landscape classification framework similar to the Street Scene Ontology described by Zhang et al. (2018). A semantic segmentation modeling approach is used to identify and segment various landscape elements into the above classifications. Semantic segmentation is a computer vision process that makes a pixel-scaled image assessment. In this model, each pixel in the image is assigned to a specific landscape category (i.e., sky, tree, or water, for example, as shown in
Figure 3). Previous environmental studies have frequently employed CNN-based algorithms like PSPNet to perform this task [
27]. In this paper, we adopt a vision transformer (ViT) model [
39] because the ViT algorithms typically have a much higher accuracy in the segmentation task. We use a pre-trained model released by MMDetection Toolbox [
40] to perform the segmentation task. This model is pre-trained on the dataset ADE20K [
41] and reached an 88.55% pixel-wise accuracy when classifying 150 object categories. This level of precision enables the accurate identification of landscape elements in our photo sets (
Figure 3). The approach adeptly identifies objects under snow cover and distinguishes waterbody shadows from actual objects.
From the results of the segmentation, we develop a visual descriptor
P to quantify the field of view for each landscape photo. For object
i in image
j, a descriptor
P can be calculated based on expression (1):
where
pi represents the number of pixels for object
i in image
j, while
Nj represents the total pixel number of image
j. We calculate the
P value for all the 2900 landscape photos in Sweden based on the 150 object categories listed in ADE20K. Then, we select the landscape elements and merge similar categories according to a semantic taxonomic framework, as shown in
Table 1. This step reduces the number of variables for the following model-fitting step.
3.4. Regression Modeling
The statistical analysis is conducted in two steps. To understand which visual feature variables explain the PUDs of the tranquil images, we first perform a pre-selection with simple linear regression. The accumulative portion of pixels (visual descriptor P) for each landscape element is used as the independent variable, and whether the landscape photo is tagged with tranquil semantics is used as the dependent variable. Considering the number crowdsourced images can be massive and vary significantly in terms of lighting, orientation, and quality, a p-value < 0.1 is used as the significance threshold, and all insignificant landscape elements are dropped after this step.
Next, we fit a multi-variable logistic regression with the time factors, with all the significant landscape elements selected as the full model. To test if there is an impact of the time factor on a tranquil photo record, we label each photo based on the time it was taken during the day. As the daylight duration in Sweden changes greatly cross the year, the period classification varies throughout the year based on the sunrise and sunset. For example, the sun rises at 3 a.m. and sets at 9 p.m. in summer, while the dawn starts at 7 a.m. and the dusk ends before 6 p.m. in winter. The dependent variable is whether the photo has tranquil tags, and the independent variables are the intersections between time classification and all the visual descriptors P selected in the previous step. All the regression models in this paper are performed in R software.
4. Results
Of the 18 explanatory variables describing visual elements, 13 are selected with statistical significance (
p < 0.1) in predicting a tranquil scene (
Table 2). Overall, most natural elements show positive associations with the identification of tranquil tags. Human-made elements are less likely to elicit tranquility, and dynamic elements suggest strongly negative associations with tranquil scenes. Natural waterbodies such as rivers and lakes obtain the greatest significance in identifying a tranquil-tagged photo. Sky also shows a positive association but with a significant
p-value (
p < 0.001). As for the vegetation, it is interesting that the presence of greenness does not guarantee the facilitating of a state of tranquility: the estimated coefficient for trees is positive, while the estimates for other plants are negative. The estimates for human-made constructs such as buildings and fences are negative, while the impacts from landmarks or leisure amenities are not significant. Most dynamic elements play a destructive role in a tranquil scene, especially for people and vehicles (
p < 0.001).
To examine the interactions between landscape elements and time factors, we perform the full regression model with 13 selected variables based on the significant features in the Wald Test (
p < 0.1). As shown in
Table 3, there are distinguishable impact patterns between different “landscape elements–time” combinations. Waterbody is the only element that obtains a significant positive association with a tranquil experience all the time throughout the day. Sky mainly makes contributions to a tranquil scene at dusk. Most of the other variables, including man-made constructions, greenness, and dynamic elements, mainly show significant associations during the daytime. Trees are another important feature of a tranquil scene except for daybreak. The occurrence of trees relates to more tranquil states during daytime and dusk, but it shows the opposite effect at night. Other vegetation, including grasslands, flowers, and other bioretention, also indicate a negative impact on a tranquil scene. A view with dynamic objects such as people, animals, and vehicles, reduces the possibility of a tranquil experience, especially during the daytime.
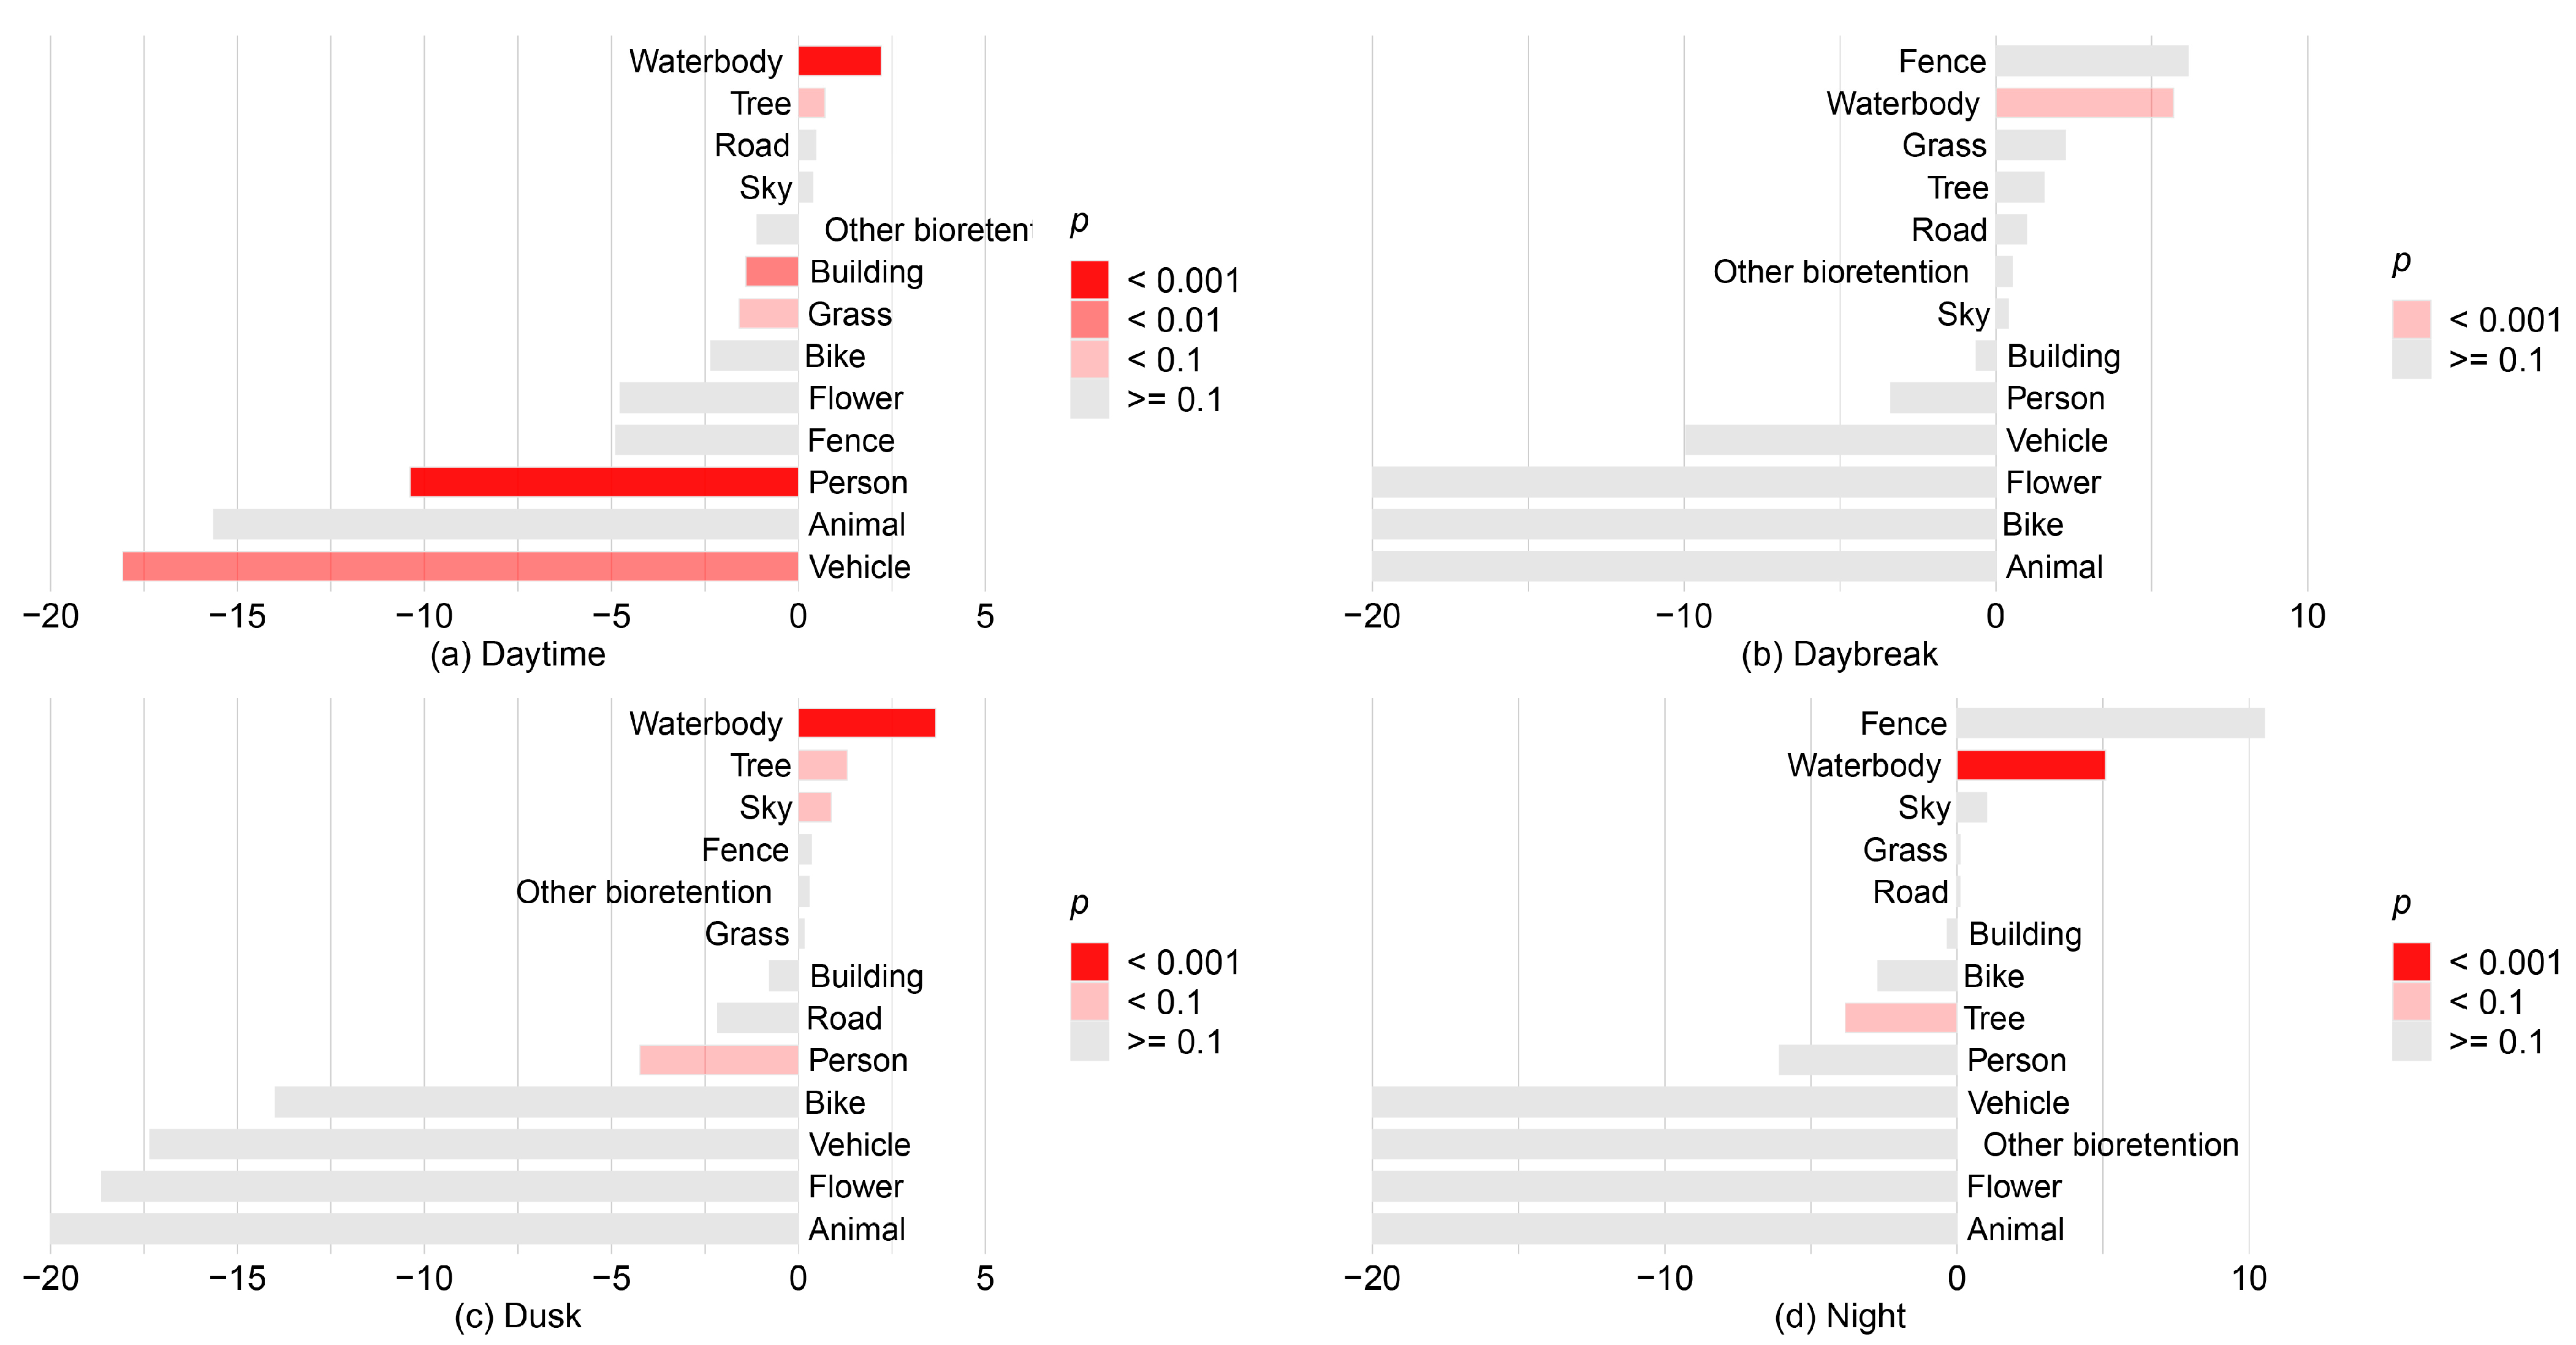
Based on the full model results, we can start to see the sensitivity of landscape elements. In
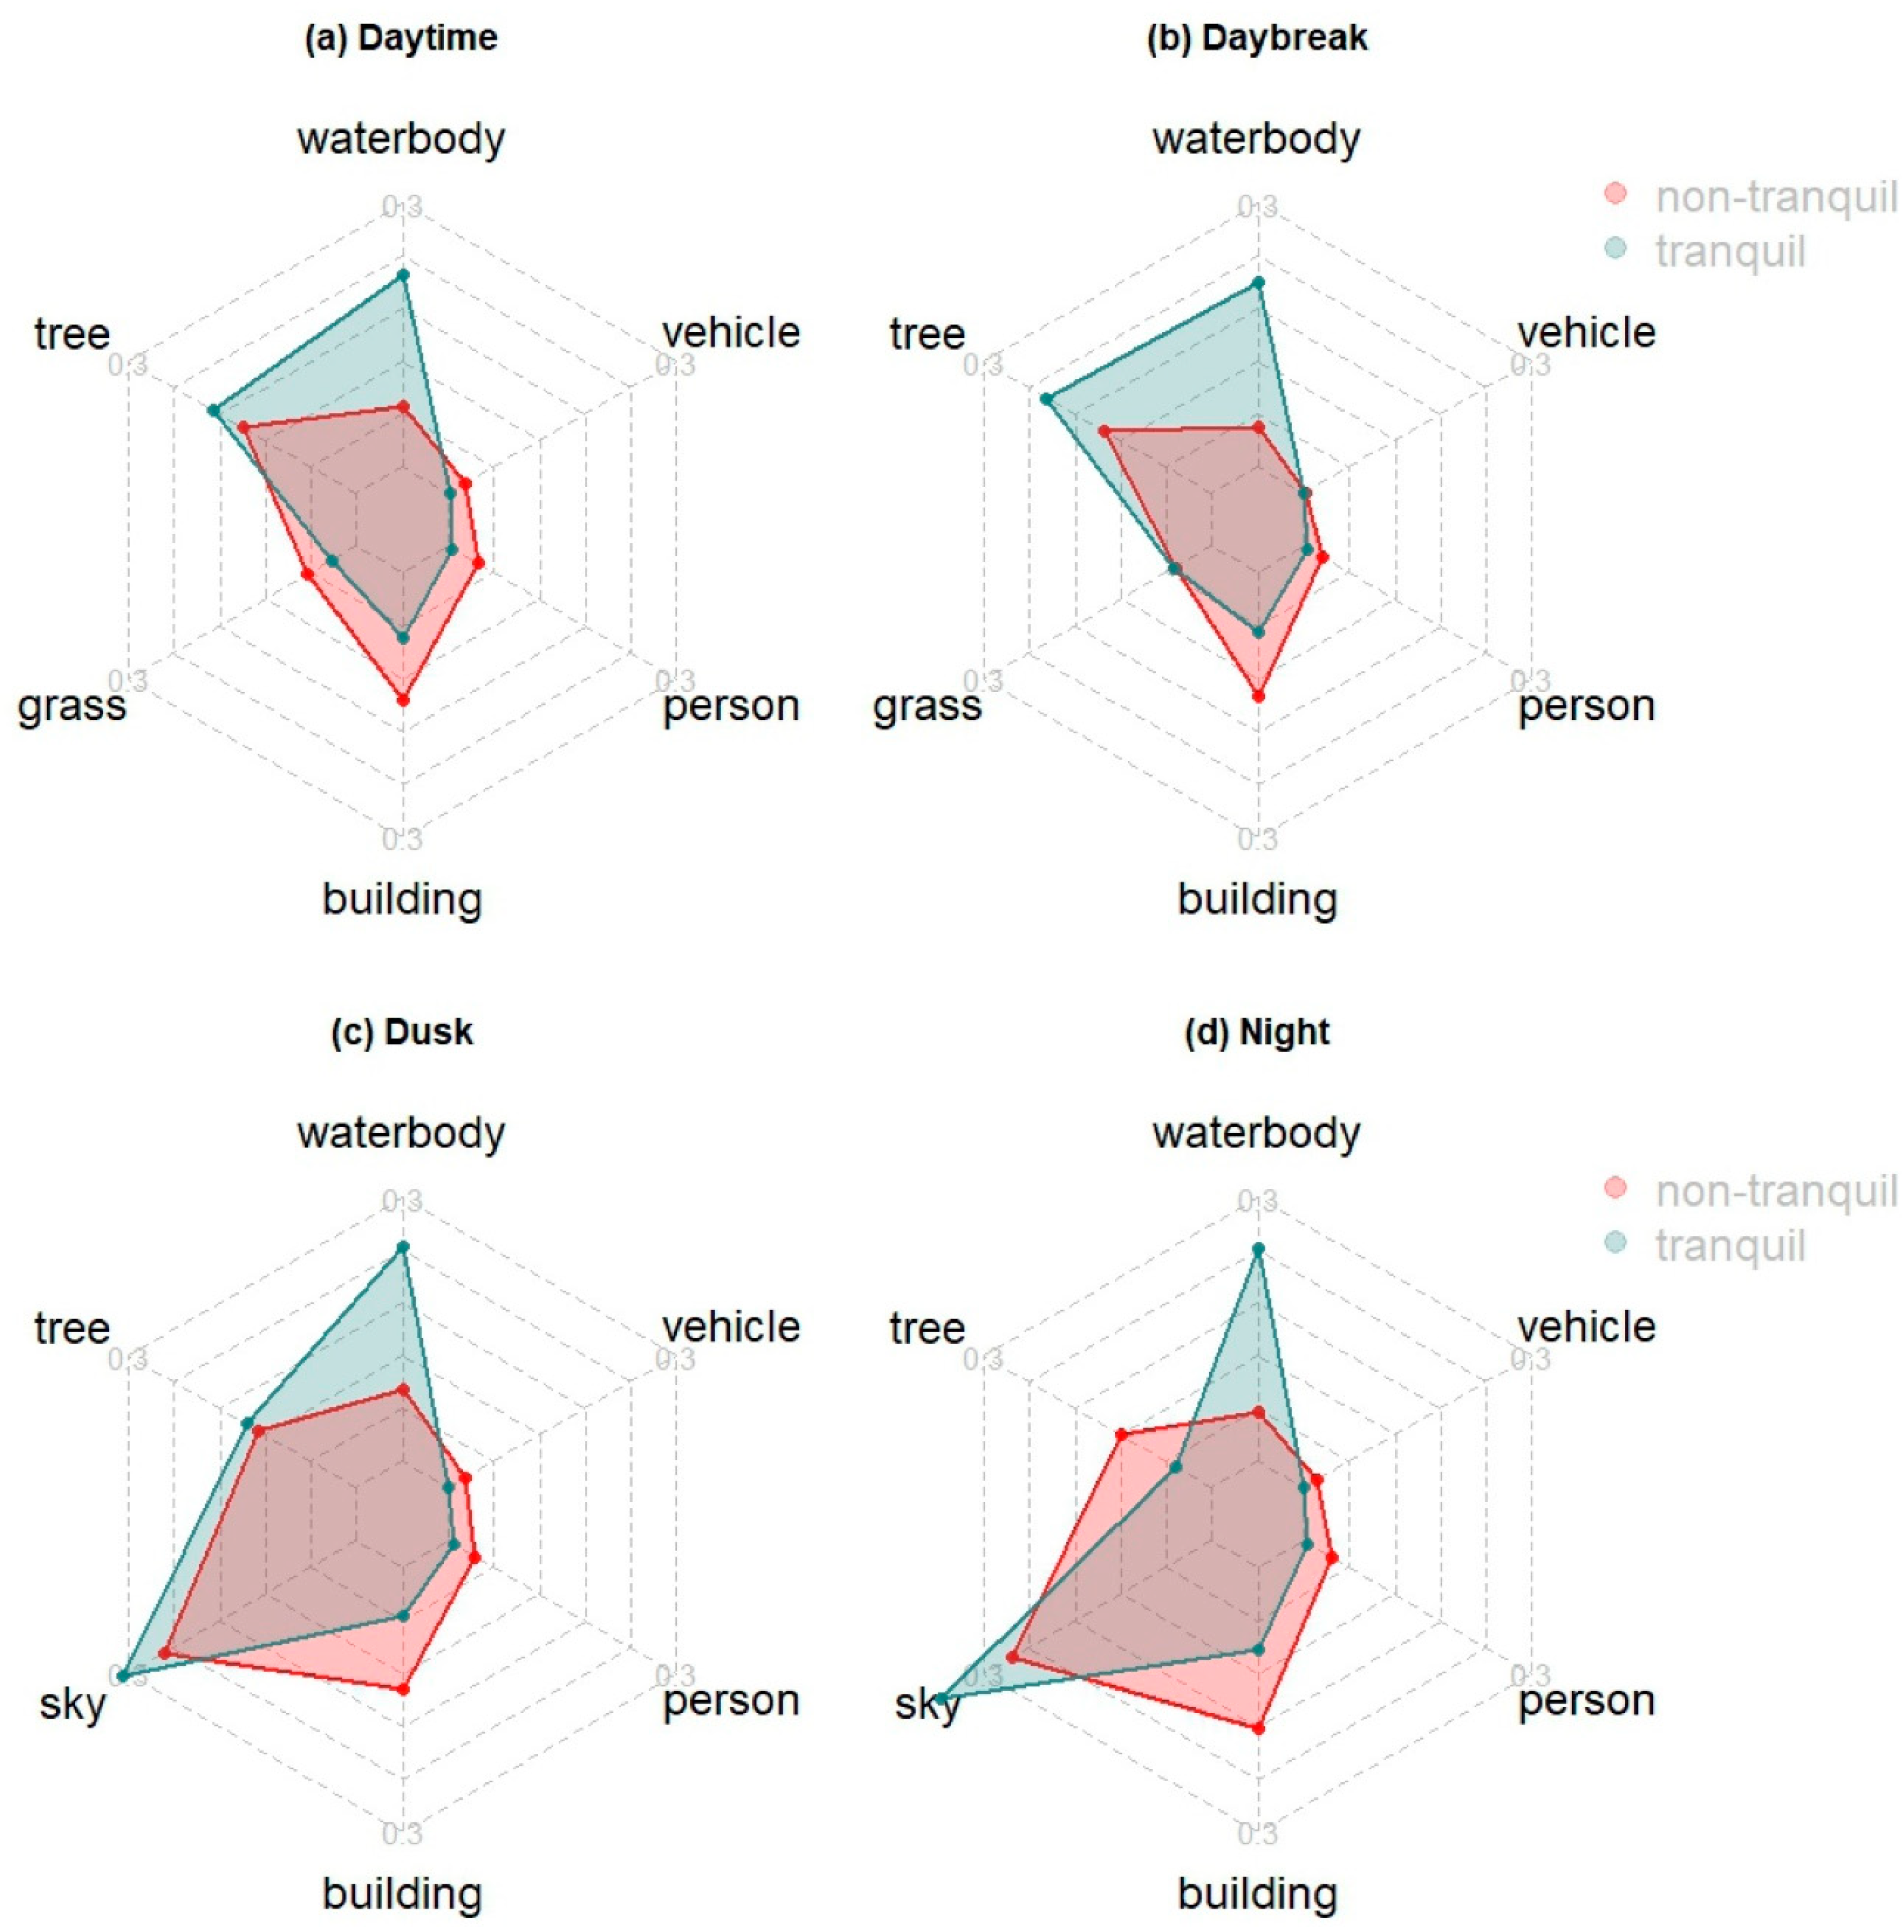
Figure 4, the x-axis represents the estimate coefficients in the full model, and the color indicates their significance level. The bars on the right side indicate that the occurrence of this feature facilitates a state of tranquility, while the left-side bars suggest the feature decreases the possibility of a tranquil scene. The longer the bar is, the stronger sensitivity it has; the darker the color is, the more confident we are in its impact. Then, we select the top six most significant landscape elements and visualize the average tranquil and non-tranquil views based on the six dimensions, as shown in
Figure 5. In each radar chart, the axis length for each dimension indicates the average accumulative portion of pixels (
P) in the field of view.
With these two figures, we can describe the visual features of a typical tranquil view in each period. As shown in
Figure 5a, a tranquil scene during the daytime contains more waterbodies and trees, fewer grasslands or buildings, and almost no motor vehicles or pedestrians. Although the difference in the average pixels of vehicles and people between the two photo groups is small, these two elements show strong sensitivity to their negative impact, as shown in
Figure 4a. In other words, a minor increase in motor vehicles or people significantly decreases the possibility of a tranquil state.
Figure 5b suggests that a tranquil view at daybreak consists of more trees and waterbodies, and fewer buildings or people. Only waterbodies show significance in these periods, which may be due to insufficient data (
n = 100), as fewer people are taking photographs compared to other periods. People like to take photos of the sky at dusk, and a tranquil-tagged photo usually contains more pixels of water and fewer pixels of buildings according to
Figure 5c. Similarly, the difference in the average
P of trees, sky, and people is small, but a small change in these landscape features can result in significant changes (
p < 0.1) to the tranquility state based on
Figure 4c. As for the night, a tranquil view is significantly attached to more waterbodies and fewer trees, while other visual elements are not significant (
Figure 4d).
5. Discussion
Tranquility is experienced as a personal state and can be influenced by a wide range of factors. Some of them are not controllable, such as time, weather, or real-time sound levels, while some other environmental factors can be managed by designers. In this study we focus on the latter with the question, what are the design considerations for producing a tranquil experience? Based on our results, most landscape elements significantly affect the presence of a tranquil state, mainly during daylight hours. For dawn and dusk, people may be focusing exclusively on the sky or the rising/setting sun in order to experience a similar state. This section discusses the essential visual context for a state of tranquility during the daytime and provides design considerations for a tranquil place.
5.1. Natural Context
A view with natural components, such as greenness and waterbodies, has been proven to benefit human health and well-being, such as through stress recovery and attention restoration [
42]. Previous research has associated such restorative natural environments with places rated by visitors as tranquil, and has found that vegetation is a crucial contributory factor to a tranquil trip [
2]. The perceived tranquility was also rated higher in nature compared to urban settings according to laboratory experiments [
13]. The Tranquility Rating Prediction Tool (TRAPT) rates the estimated tranquility of a place with man-made noise and the percentage of natural features in the landscape [
9], where the impact of natural elements is linear and there is no difference among various landscape types, which is too general to describe the semi-natural environment in the real world. In another study where tranquil trips are identified with social media photos in Scotland [
22], the dataset indicates a negative correlation between perceived tranquility and overall vegetation, but they think this is a particular case for Scotland rather than a generalizable artifact.
Our results indicate that different natural landscapes have distinct effects on shaping tranquil places: trees significantly facilitate a state of tranquility but have the opposite effect at night, while other vegetation like grass or flowers may show negative correlations compared to non-tranquil landscape views. On the one hand, trees perform better at reducing noise pollution compared to grasslands [
43]. Also, a safe environment may facilitate a peaceful feeling, while tree cover in open areas is associated with increased feelings of safety [
44], and the orderly arrangement of trees contributes to residents’ preferential feeling and sense of safety as well [
45]. However, tree shadows at night hinder people’s sense of safety and, therefore, prevent people from feeling tranquility. The strategic incorporation of trees within urban landscapes is crucial for creating a tranquil environment during the daytime. On the other hand, grasslands in urban areas are usually associated with playgrounds, where people gather and enjoy outdoor activities, and which create plenty of anthropogenic noise. Meanwhile, flowers are generally visual attractors in urban green spaces and thus, may disturb the emergence of a tranquil sense. Moreover, as the uploads of landscape photos are regarded as an indicator of landscape preference in previous studies related to cultural ecosystem services, landscape photos in the control group may also obtain a higher portion of vegetation in segmentation results because of the affective quality of greenery. Designers should carefully consider tree placement, such as creating tree-lined pathways or orderly arrangements in open areas. However, caution must be exercised to avoid excessive tree shading that may evoke feelings of insecurity during nighttime hours. Grasslands and flowers, which possess visual attractiveness, should be carefully balanced to prevent visual dominance and potential noise disturbances, as they are attractive to group activities.
Based on our results, natural waterbodies are the only landscape elements that make a positive contribution to a tranquil scene regardless of time. This finding is supported by previous studies including case studies and laboratory experiments. A series of laboratory experiments testing the impacts of natural settings on tranquility found that large waterscapes are positively correlated with tranquility [
13]. According to a survey of 100 people conducted in Turkey, natural and almost-natural water views, together with a wide water surface, create a sense of tranquility [
46]. Designers should prioritize the integration of water elements, such as fountains, ponds, or small streams, as they provide visual and auditory cues that enhance the tranquil experience irrespective of the time of day.
5.2. Dynamic Factors
In this study, dynamic factors refer to the moving objects in urban landscapes including people, animals, and vehicles. Most landscape elements in this category show a negative correlation with tranquil scenes (
p < 0.1), and their average of accumulative pixels (
P) is close to 0 (<2%) for the tranquil photos, potentially due to aural considerations, because the effect was less significant during dawn, dusk, or night hours when noise would generally be less of a factor. A previous study has pointed out that seeing and hearing the products of human activities commonly leads to non-tranquility [
47]. Another field survey in Hong Kong pointed out that vehicles and crowds are detrimental to a tranquil environment [
48]. A landscape view with plenty of dynamic elements not only contributes to anthropogenic noise in the acoustic environment, but also hinders the perception process of tranquility because of the visual context. According to a magnetic resonance imaging experiment conducted by Hunter (2010), a view with signs of traffic such as roads and vehicles results in less possibility of a feeling of tranquility. From the perspective of planners and designers, visual barriers and screening with natural elements are good recommendations to help control noise in urban areas. Traffic control and pedestrian flow management are also important. In general, areas with the potential for high noise levels were less likely to be identified as tranquil.
5.3. Limitations
First, our crowdsourced method cannot account for visual aural activity and noise levels. Although areas with high noise levels are less likely to be identified as tranquil, some of our findings might reflect place characteristics associated with aural characteristics. For example, grass areas in parks are often linked to playgrounds, which could imply higher noise levels, or views of streets could imply the presence of car noise. Consequently, there is a risk that our images highlight places that are more likely to be quiet, and do not reflect tranquility through visual context. We contend, however, that regardless of the auditory sensation, some connection can be made to the visual components of feelings of tranquility.
In addition, the representativeness of this study is limited by biases in social media data sourcing. In Sweden, younger people use social media more than older people; at least 92% of internet users born between 1980 and 2009 use social media daily, while just over 40% of users born between 1920 and 1939 use social media daily [
49]. In total, 80% of Flickr users tend to be younger (between 18 and 55 years old), and more than 95% of Flickr photos are taken with iPhones or single-lens reflex cameras [
32]. Therefore, our results may be limited to the perceptions of younger middle- or high-income adults. Also, social media data can be performative, and what is deemed shareworthy on social media platforms may not fully represent the broader spectrum of tranquil experiences. The variability in the orientation and quality of our images also necessitated the adoption of a significance level of 0.01, which is less stringent than the standard 0.05 level, reducing our confidence in the significance of some outcomes. The dataset might also be skewed towards daytime images—that is when people use cameras, resulting in limited representativeness for other times of the day. In general, however, we believe the use of crowdsourced data can provide valuable insights into the nature of human/landscape interactions.
6. Conclusions
This study explores the roles of physical settings in perceived tranquility from a landscape design perspective. We investigated the landscape design characteristics of tranquil spaces with a case study based on the spatial distribution, temporal pattern, and visual contexts of self-identified tranquil scenes using crowdsourced social media data. We quantified self-reported views of tranquil places through a semantic segmentation analysis, examining the contributions of visual landscape features. Our results show that visual landscape elements have diverse effects, and time is an influential factor in their extent. We found a significant time preference for dusk and night with a majority view of the sky, which indicates little about the site itself apart from openness. A waterbody appears to be an important landscape feature for a tranquil place. In our study, it was the only landscape element that contributed to all time periods. We found some tranquility-related impacts from most vegetation, human-made constructions, and dynamic objects in the daytime. Trees significantly facilitated a state of tranquility, while other plants like grasslands and flowers were less likely to have tranquility-oriented tags. All the moving objects including people and vehicles impeded the self-reported tranquil experience in our study.
Our study highlights the role of crowdsourced data in understanding the perceived qualities of the built environment. Because of the limitations of traditional data collection methods, subjective assessments including the tranquility of the built environment are usually confined to the site scale. We provide an example of an approach for extracting information from crowdsourced images and text to understand tranquility and its relation to visual landscape elements on a national scale. Our research identifies distinct roles played by various natural elements in fostering tranquility, offering valuable insights for future empirical studies conducted in controlled laboratory settings.
It is crucial to recognize that our conclusions are derived from the visual context of big data, a methodology distinct from controlled laboratory experiments that might include variables such as sound levels. As such, our findings are intended to inspire subsequent research in controlled settings to investigate how different landscape elements contribute more precisely to a sense of tranquility. For example, recording both sound levels and videos during tranquil sound walks could be instrumental in quantifying the visual and acoustic environments across different times. Employing environmental sound sensors at strategic locations to gauge sound levels could also offer acoustic data that complement the tranquil experiences depicted in geo-tagged crowdsourced contributions. Additionally, it is important to adapt the design recommendations we propose to the specific cultural, social, and environmental context. Future research aims at validation and an improved understanding of the variations in perceptions of tranquility across cultures, as well as assessing the efficacy of various design approaches in diverse urban settings. Discussions about the impact of seasonal variations, the prolonged dusks and extended twilight periods in Sweden, wind effects, and surrounding bio-physical environments in addition to the photo views are also worthwhile. Considering the complexity of perceived tranquility, using qualitative and phenomenological research methods in conjunction with one another is favorable for future exploration.
Given the interdisciplinary nature of tranquility, these findings can deepen our understanding of tranquil spaces within urban contexts. They also hold the potential to inform and enhance future landscape design practices aimed at creating tranquil environments and promoting overall well-being.
Author Contributions
Conceptualization, Y.Z. and B.D.; Methodology, Y.Z. and B.D.; Software, Y.Z. and T.H.; Validation, Y.Z., S.A. and T.H.; Formal analysis, Y.Z.; Investigation, Y.Z.; Writing—original draft, Y.Z.; Writing—review & editing, Y.Z., B.D. and S.A.; Visualization, Y.Z.; Project administration, Y.Z. All authors have read and agreed to the published version of the manuscript.
Funding
This research received no external funding.
Data Availability Statement
Data are contained within the article.
Conflicts of Interest
The authors declare no conflict of interest.
References
- Marafa, L.M.; Tsang, F.; Watts, G.; Yuan, X. Perceived Tranquility in Green Urban Open Spaces. World Leis. J. 2018, 60, 221–234. [Google Scholar] [CrossRef]
- Watts, G. Tranquillity Trails for Urban Areas. Urban For. Urban Green. 2018, 29, 154–161. [Google Scholar] [CrossRef]
- Öhrström, E.; Skånberg, A.; Svensson, H.; Gidlöf-Gunnarsson, A. Effects of Road Traffic Noise and the Benefit of Access to Quietness. J. Sound Vib. 2006, 295, 40–59. [Google Scholar] [CrossRef]
- Shepherd, D.; Welch, D.; Dirks, K.N.; McBride, D. Do Quiet Areas Afford Greater Health-Related Quality of Life than Noisy Areas? Int. J. Environ. Res. Public Health 2013, 10, 1284–1303. [Google Scholar] [CrossRef]
- Lechtzin, N.; Busse, A.M.; Smith, M.T.; Grossman, S.; Nesbit, S.; Diette, G.B. A Randomized Trial of Nature Scenery and Sounds Versus Urban Scenery and Sounds to Reduce Pain in Adults Undergoing Bone Marrow Aspirate and Biopsy. J. Altern. Complement. Med. 2010, 16, 965–972. [Google Scholar] [CrossRef]
- Cerwén, G.; Mossberg, F. Implementation of Quiet Areas in Sweden. Int. J. Environ. Res. Public Health 2019, 16, 134. [Google Scholar] [CrossRef]
- Votsi, N.-E.P.; Kallimanis, A.S.; Pantis, J.D. The Distribution and Importance of Quiet Areas in the EU. Appl. Acoust. 2017, 127, 207–214. [Google Scholar] [CrossRef]
- Carles, J.L.; Barrio, I.L.; de Lucio, J.V. Sound Influence on Landscape Values. Landsc. Urban Plan. 1999, 43, 191–200. [Google Scholar] [CrossRef]
- Pheasant, R.; Horoshenkov, K.; Watts, G.; Barrett, B. The Acoustic and Visual Factors Influencing the Construction of Tranquil Space in Urban and Rural Environments Tranquil Spaces-Quiet Places? J. Acoust. Soc. Am. 2008, 123, 1446–1457. [Google Scholar] [CrossRef] [PubMed]
- Viollon, S.; Lavandier, C.; Drake, C. Influence of Visual Setting on Sound Ratings in an Urban Environment. Appl. Acoust. 2002, 63, 493–511. [Google Scholar] [CrossRef]
- Hunter, M.D.; Eickhoff, S.B.; Pheasant, R.J.; Douglas, M.J.; Watts, G.R.; Farrow, T.F.D.; Hyland, D.; Kang, J.; Wilkinson, I.D.; Horoshenkov, K.V.; et al. The State of Tranquility: Subjective Perception Is Shaped by Contextual Modulation of Auditory Connectivity. NeuroImage 2010, 53, 611–618. [Google Scholar] [CrossRef]
- Kaplan, R.; Kaplan, S. The Experience of Nature: A Psychological Perspective; Cambridge University Press: Cambridge, UK, 1989; ISBN 0-521-34939-7. [Google Scholar]
- Herzog, T.R.; Chernick, K.K. Tranquility and Danger in Urban and Natural Settings. J. Environ. Psychol. 2000, 20, 29–39. [Google Scholar] [CrossRef]
- Payne, S.R. The Production of a Perceived Restorativeness Soundscape Scale. Appl. Acoust. 2013, 74, 255–263. [Google Scholar] [CrossRef]
- EEA. Quiet Areas in Europe—The Environment Unaffected by Noise Pollution; European Environment Agency/Publications Office of the European Union: Luxembourg, 2016. [Google Scholar]
- Watts, G.; Pheasant, R. Factors Affecting Tranquillity in the Countryside. Appl. Acoust. 2013, 74, 1094–1103. [Google Scholar] [CrossRef]
- Heikinheimo, V.; Minin, E.D.; Tenkanen, H.; Hausmann, A.; Erkkonen, J.; Toivonen, T. User-Generated Geographic Information for Visitor Monitoring in a National Park: A Comparison of Social Media Data and Visitor Survey. ISPRS Int. J. Geo-Inf. 2017, 6, 85. [Google Scholar] [CrossRef]
- Martí, P.; Serrano-Estrada, L.; Nolasco-Cirugeda, A. Social Media Data: Challenges, Opportunities and Limitations in Urban Studies. Comput. Environ. Urban Syst. 2019, 74, 161–174. [Google Scholar] [CrossRef]
- Zeng, Y.; Deal, B. What Role Do Urban Parks Play in Forming a Sense of Place? Lessons for Geodesign Using Social Media. Land 2023, 12, 1960. [Google Scholar] [CrossRef]
- Chesnokova, O.; Purves, R.S. From Image Descriptions to Perceived Sounds and Sources in Landscape: Analyzing Aural Experience through Text. Appl. Geogr. 2018, 93, 103–111. [Google Scholar] [CrossRef]
- Chesnokova, O.; Taylor, J.E.; Gregory, I.N.; Purves, R.S. Hearing the Silence: Finding the Middle Ground in the Spatial Humanities? Extracting and Comparing Perceived Silence and Tranquillity in the English Lake District. Int. J. Geogr. Inf. Sci. 2019, 33, 2430–2454. [Google Scholar] [CrossRef]
- Wartmann, F.M.; Tieskens, K.F.; van Zanten, B.T.; Verburg, P.H. Exploring Tranquillity Experienced in Landscapes Based on Social Media. Appl. Geogr. 2019, 113, 102112. [Google Scholar] [CrossRef]
- Long, Y.; Ye, Y. Measuring Human-Scale Urban Form and Its Performance. Landsc. Urban Plan. 2019, 191, 103612. [Google Scholar] [CrossRef]
- LeCun, Y.; Bengio, Y.; Hinton, G. Deep Learning. Nature 2015, 521, 436–444. [Google Scholar] [CrossRef]
- Ramírez, T.; Hurtubia, R.; Lobel, H.; Rossetti, T. Measuring Heterogeneous Perception of Urban Space with Massive Data and Machine Learning: An Application to Safety. Landsc. Urban Plan. 2021, 208, 104002. [Google Scholar] [CrossRef]
- Zhang, Y.; Ong, G.X.; Jin, Z.; Seah, C.M.; Chua, T.S. The Effects of Urban Greenway Environment on Recreational Activities in Tropical High-Density Singapore: A Computer Vision Approach. Urban For. Urban Green. 2022, 75, 127678. [Google Scholar] [CrossRef]
- Zhang, F.; Zhang, D.; Liu, Y.; Lin, H. Representing Place Locales Using Scene Elements. Comput. Environ. Urban Syst. 2018, 71, 153–164. [Google Scholar] [CrossRef]
- Wu, C.; Peng, N.; Ma, X.; Li, S.; Rao, J. Assessing Multiscale Visual Appearance Characteristics of Neighbourhoods Using Geographically Weighted Principal Component Analysis in Shenzhen, China. Comput. Environ. Urban Syst. 2020, 84, 101547. [Google Scholar] [CrossRef]
- Cordts, M.; Omran, M.; Ramos, S.; Rehfeld, T.; Enzweiler, M.; Benenson, R.; Franke, U.; Roth, S.; Schiele, B. The Cityscapes Dataset for Semantic Urban Scene Understanding. In Proceedings of the 2016 IEEE Conference on Computer Vision and Pattern Recognition, Las Vegas, NV, USA, 26 June–1 July 2016; pp. 3213–3223. [Google Scholar]
- Brostow, G.J.; Fauqueur, J.; Cipolla, R. Semantic Object Classes in Video: A High-Definition Ground Truth Database. Pattern Recognit. Lett. 2009, 30, 88–97. [Google Scholar] [CrossRef]
- Nilsson, C.; Gotmark, F. Protected Areas in Sweden: Is Natural Variety Adequately Represented? Conserv. Biol. 1992, 6, 232–242. [Google Scholar] [CrossRef]
- Matic Broz Flickr Statistics, User Count, & Facts (November 2022). Available online: https://photutorial.com/flickr-statistics/ (accessed on 20 November 2022).
- Yoshimura, N.; Hiura, T. Demand and Supply of Cultural Ecosystem Services: Use of Geotagged Photos to Map the Aesthetic Value of Landscapes in Hokkaido. Ecosyst. Serv. 2017, 24, 68–78. [Google Scholar] [CrossRef]
- Dunkel, A. Visualizing the Perceived Environment Using Crowdsourced Photo Geodata. Landsc. Urban Plan. 2015, 142, 173–186. [Google Scholar] [CrossRef]
- Wood, S.A.; Guerry, A.D.; Silver, J.M.; Lacayo, M. Using Social Media to Quantify Nature-Based Tourism and Recreation. Sci. Rep. 2013, 3, 2976. [Google Scholar] [CrossRef] [PubMed]
- Wilkins, E.J.; Wood, S.A.; Smith, J.W. Uses and Limitations of Social Media to Inform Visitor Use Management in Parks and Protected Areas: A Systematic Review. Environ. Manag. 2021, 67, 120–132. [Google Scholar] [CrossRef]
- Fox, N.; August, T.; Mancini, F.; Parks, K.E.; Eigenbrod, F.; Bullock, J.M.; Sutter, L.; Graham, L.J. “Photosearcher” Package in R: An Accessible and Reproducible Method for Harvesting Large Datasets from Flickr. SoftwareX 2020, 12, 100624. [Google Scholar] [CrossRef]
- Hamstead, Z.A.; Fisher, D.; Ilieva, R.T.; Wood, S.A.; McPhearson, T.; Kremer, P. Geolocated Social Media as a Rapid Indicator of Park Visitation and Equitable Park Access. Comput. Environ. Urban Syst. 2018, 72, 38–50. [Google Scholar] [CrossRef]
- Dosovitskiy, A.; Beyer, L.; Kolesnikov, A.; Weissenborn, D.; Zhai, X.; Unterthiner, T.; Dehghani, M.; Minderer, M.; Heigold, G.; Gelly, S.; et al. An Image Is Worth 16x16 Words: Transformers for Image Recognition at Scale 2021. In Proceedings of the Ninth International Conference on Learning Representations, Virtual, 3–7 May 2021. [Google Scholar]
- MMS Contibutors. OpenMMLab Semantic Segmentation Toolbox and Benchmark. 2020. Available online: https://github.com/open-mmlab/mmsegmentation (accessed on 1 August 2023).
- Zhou, B.; Zhao, H.; Puig, X.; Fidler, S.; Barriuso, A.; Torralba, A. Scene Parsing through ADE20K Dataset. In Proceedings of the 2017 IEEE Conference on Computer Vision and Pattern Recognition, Honolulu, HI, USA, 21–26 July 2017; pp. 633–641. [Google Scholar]
- Li, D.; Sullivan, W.C. Impact of Views to School Landscapes on Recovery from Stress and Mental Fatigue. Landsc. Urban Plan. 2016, 148, 149–158. [Google Scholar] [CrossRef]
- Reid, C.E.; Clougherty, J.E.; Shmool, J.L.C.; Kubzansky, L.D. Is All Urban Green Space the Same? A Comparison of the Health Benefits of Trees and Grass in New York City. Int. J. Environ. Res. Public Health 2017, 14, 1411. [Google Scholar] [CrossRef] [PubMed]
- Suppakittpaisarn, P.; Chang, C.-Y.; Deal, B.; Larsen, L.; Sullivan, W.C. Does Vegetation Density and Perceptions Predict Green Stormwater Infrastructure Preference? Urban For. Urban Green. 2020, 55, 126842. [Google Scholar] [CrossRef]
- Kuo, F.E.; Bacaicoa, M.; Sullivan, W.C. Transforming Inner-City Landscapes: Trees, Sense of Safety, and Preference. Environ. Behav. 1998, 30, 28–59. [Google Scholar] [CrossRef]
- Sakici, C. Assessing Landscape Perceptions of Urban Waterscapes. Anthropologist 2015, 21, 182–196. [Google Scholar] [CrossRef]
- Hewlett, D.; Harding, L.; Munro, T.; Terradillos, A.; Wilkinson, K. Broadly Engaging with Tranquillity in Protected Landscapes: A Matter of Perspective Identified in GIS. Landsc. Urban Plan. 2017, 158, 185–201. [Google Scholar] [CrossRef]
- Watts, G.; Marafa, L. Validation of the Tranquillity Rating Prediction Tool (TRAPT): Comparative Studies in UK and Hong Kong. Noise Mapp. 2017, 4, 67–74. [Google Scholar] [CrossRef]
- Andersson, J.; Blomdahl, F. Svenskarna och Internet: 2022; Stiftelsen för Internetinfrastruktur: Stockholm, Sweden, 2022; p. 298. Available online: https://svenskarnaochinternet.se/rapporter/svenskarna-och-internet-2022 (accessed on 7 April 2024).
| Disclaimer/Publisher’s Note: The statements, opinions and data contained in all publications are solely those of the individual author(s) and contributor(s) and not of MDPI and/or the editor(s). MDPI and/or the editor(s) disclaim responsibility for any injury to people or property resulting from any ideas, methods, instructions or products referred to in the content. |
© 2024 by the authors. Licensee MDPI, Basel, Switzerland. This article is an open access article distributed under the terms and conditions of the Creative Commons Attribution (CC BY) license (https://creativecommons.org/licenses/by/4.0/).


