Abstract
The Tibetan Plateau (TP) region contains maximal alpine grassland ecology at the mid-latitudes. This region is also recognized as an ecologically fragile and sensitive area under the effects of global warming. Regional climate modeling and ecosystem research depend on accurate land cover (LC) information. In order to obtain accurate LC information over the TP, the reliability and precision of five moderate/high-resolution LC products (MCD12Q1, C3S-LC, GlobeLand30, GLC_FCS30, and ESA2020 in 2020) were analyzed and evaluated in this study. The different LC products were compared with each other in terms of areal/spatial consistency and assessed with four reference sample datasets (Geo-Wiki, GLCVSS, GOFC-GOLD, and USGS) using the confusion matrix method for accuracy evaluation over the TP. Based on the paired comparison of these five LC datasets, all five LC products show that grass is the major land cover type on the TP, but the range of grass coverage identified by the different products varies noticeably, from 43.35% to 65.49%. The fully consistent spatial regions account for 43.72% of the entire region of the TP, while, in the transition area between grass and bare soil, there is still a large area of medium-to-low consistency. In addition, a comparison of LC datasets using integrated reference datasets shows that the overall accuracies of MCD12Q1, C3S-LC, GlobeLand30, GLC_FCS30, and ESA2020 are 54.29%, 49.32%, 53.03%, 53.73%, and 60.11%, respectively. The producer accuracy of the five products is highest for grass, while glaciers have the most reliable and accurate characteristics among all LC products for users. These findings provide valuable insights for the selection of rational and appropriate LC datasets for studying land-atmosphere interactions and promoting ecological preservation in the TP.
1. Introduction
The TP, referred to as the Earth’s ‘Third Pole’, is renowned for its unique topography and environment, as it contains the alpine ecosystem with the largest area in the world [1]. This unique alpine ecosystem is also considered to be ecologically fragile and sensitive under the background of global warming [2,3]. Land cover (LC) is an important variable in describing surface heterogeneity and ecosystem diversity. LC plays an crucial part in the exchange of energy and matter between the Earth’s surface and the surrounding atmosphere, which profoundly affects the structure and function of terrestrial processes, such as vegetation productivity, carbon and water cycling, and energy balance [4,5,6]. On the one hand, LC data are important surface parameters for regional climate modeling. Studies, especially in the TP region, have shown that the uncertainty of LC data affects the simulation of land-air interactions [7,8], permafrost distribution [9], and local circulation and precipitation [10]. On the other hand, LC data are important variables for assessing changes in terrestrial ecosystems. The accuracy of LC data directly affects the assessment of surface desertification and ecosystem stability [11], as well as the calculation of the terrestrial carbon cycle. Therefore, reliable and accurate LC products are essential and urgently needed for conducting regional climate change studies and developing ecological conservation measures in the region.
Empirical evidence has demonstrated that remote sensing is a more efficient and effective approach for obtaining accurate land cover information, compared to the time consuming and substantial investment required for field surveys [12,13]. Over the past several decades, satellite sensing technology and algorithms have rapidly developed, resulting in an increasing number of LC datasets with higher spatial resolution [14,15]. Originally, several LC maps were produced in a 1 km resolution, such as the IGBP DISCover (1992–1993) [16], the UMD (1992–1993) [17], and the GLC(2000) [18]. Subsequently, several global LC products have been produced based on MODIS and MERIS satellites at 500 m and 300 m resolutions, including the MCD12Q1 (2001–present, annually) with a 500 m resolution [19], and the GlobCover (2005/2009) and the CCI-LC (1992–2015) at 300 m [20,21]. Recently, a series of LC products with enhanced spatial resolutions, such as 30 m and 10 m, have been released successively. These LC products with a resolution of 30 m encompass the GlobeLand30 (2000/2010/2020) dataset, developed by the NGCC [22]. Moreover, the global land-cover product with fine classification system (GLC_FCS30), which covers the period from 1985 to 2020 with a 5-year update cycle, is also available. This dataset was developed by the AIR, CAS [23]. Furthermore, Tsinghua University has contributed to the Finer Resolution Observation and Monitoring of Global Land Cover (FROM-GLC30, 2015) dataset [24]. In addition, the first 10 m resolution global LC product (FROM-GLC10, 2017) has been successfully realized by Tsinghua University [4], and the latest global 10 m LC datasets have been released by the ESA (ESA2020, 2020) and ESRI (ESRI2020, 2020), respectively [25,26]. The above LC products provide great convenience for scientific research. Meanwhile, as an increasing variety of these products emerge, it becomes crucial to prioritize the rational selection and utilization of LC datasets for regional studies.
However, the effectiveness of these LC products in specific applications is often impeded by uncertainties and inconsistencies, such as data source, thematic detail, classification scheme, and spatial resolution [27,28,29]. For example, Quaife et al. showed that the presence of uncertainty in land cover data derived from satellites significantly impacts the accuracy of carbon flux estimates based on models [30]. Pan et al. found that uncertainty in LC data could impact permafrost simulations on the TP [9]. Therefore, the accuracy assessment of various LC products is particularly essential, as it not only provides valuable insights for producers to improve future updates but also enables users to use the data more effectively. At present, numerous researchers have conducted accuracy evaluations for multiple LC datasets [31,32,33,34,35]. For example, on the global scale, Hansen et al. and Giri et al. proved that the consistency of IGBP-DIS-Cover and UMD datasets, and the GLC2000 and MODIS land cover data consistency is 49% and 59%, respectively [17,36]. Hua et al. conducted an analysis on the spatial agreement of five multi-source LC datasets (GLC2000, CCI-LC, MCD12, GLCNMO, and GLOBCOVER). They found that the global overall consistency of these datasets ranged from 49% to 68% [29]. At the national scale, Bai et al. compared the consistencies and discrepancies in pairs among five LC datasets in China (UMD, GLCC, MODIS, GLC2000, and GlobCover), and revealed that large discrepancies existed in forest, shrub, and wetland [37]. Wang and Jin assessed the uncertainty of MCD12, ESA CCI, and MEaSURES VCF datasets. Their findings indicate an average difference of 8% in forest coverage among these three products in China [38]. In addition, to enhance the efficiency of accuracy assessments across various LC products, several LC reference datasets have been released, and some researchers have used global or regional reference datasets to evaluate accuracy, such as Geo-Wiki, GLCVSS, GOFC-GOLD, and LUCAS [15,39,40,41]. In particular, based on the CHINA2000 reference dataset, Song et al. identified obvious confusion of grass in China within GLOBCOVER, MODIS2005, MODIS2000, and GLC2000 products. Gao et al. evaluated the capability of three LC datasets by comparing them to the LUCAS reference dataset across the European Union, and showed that disagreement primarily occurred in regions characterized by heterogeneity [27]. The above studies have drawn useful conclusions by evaluating different LC products in pairs.
So far, no systematic consistency and accuracy assessment has been conducted for the 2020 medium (500 m, 300 m) and high (30 m, 10 m) resolution LC products at the TP. Given the importance of LC maps in regional climate modeling and alpine ecosystem change studies, there is an urgent need for a quantitative estimation of the accuracy of commonly used LCs at the TP. This study compares the distributional characteristics and spatial consistency among five different LC products in pairs (MCD12Q1, C3S-LC, GlobeLand30, GLC_FCS30, and ESA2020), and calculates the OA, PA, UA, and Kappa coefficient for individual LC products from the four integrated reference datasets (Geo-Wiki, GLCVSS, GOFC-GOLD, and USGS). We aim to provide guidance for the rational utilization of LC products in ecosystem and climate change studies.
2. Materials and Methods
2.1. Study Area
The TP, situated in the southwestern region of China, boasts an average altitude exceeding 4000 m above sea level and encompasses a vast area of approximately 2.5 million km2, establishing it as the most elevated plateau globally (Figure 1). The TP is surrounded by various mountain ranges, including the Kunlun Mountains, Tanggula Mountains, Hengduan Mountains, and Himalaya Mountains. The TP is characterized by low temperature, low levels of precipitation, and high solar radiation [42,43]. In addition, except for the poles, the TP region and the adjacent areas boast an extensive concentration of glaciers, surpassing any other region in terms of quantity. The study area represents the diverse heterogeneity expressed by different LC classes.
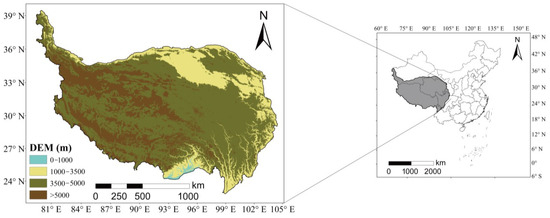
Figure 1.
Digital elevation model (DEM) map and the location of Tibetan Plateau.
2.2. Datasets
2.2.1. Land Cover Datasets
In this study, five free available moderate/high-resolution LC products were selected for analysis and assessment on the TP (Table 1). Before analyzing and evaluating these LC products, we need to understand the information related to the generation of these datasets:
- (1)
- MCD12Q1, produced by NASA, encompasses six categorization frameworks, and we use the International Geosphere Biosphere Program (IGBP) classification system (Table 2). It provides global LC data at a medium spatial resolution of 500 m from 2001 to the present [44,45].
- (2)
- C3S-LC version 2.1.1 is produced by ESA CCI Land Cover project, which provides annual LC maps from 2016 to 2020 at a 0.002778° (approximately 300 m) spatial resolution. This dataset offers a total of 22 distinct categories for land cover (Table 2).
- (3)
- GlobeLand30, produced by the NGCC, is a world-wide LC dataset developed by using multispectral images (TM, Enhanced TM+, HJ-4) for 2000, 2010, and 2020. The classification system of GlobeLand30 contains 10 LC types. The overall accuracy of GlobeLand30 is 85.7% [22].
- (4)
- GLC_FCS30 is produced and released by the AIR, CAS. GLC_FCS30-2015 is developed on the Google Earth Engine platform [23]. Based on GLC_FC30-2015, the new GLC_FCS30-2020 product has been developed by incorporating the 2019–2020 time series of reflectance data, global thematic auxiliary datasets, DEM terrain elevation data, Sentinel-1SAR data, and a prior knowledge dataset. Additional comprehensive details regarding the GLC_FCS30 can be accessed within the work of Zhang et al. [23]. The GLC_FC30-2020 dataset was chosen for our study, and contains 29 land cover types [46].
- (5)
- ESA2020 is extracted from ESA at 10 m resolution for 2020. The product is defined using UN-LCCS and offers a comprehensive range of 11 land cover classifications [25].
Table 1 summarizes the details of the five LC datasets. Considering the close proximity of the dataset phases, the LC maps evaluated in this study are all from 2020. The Land Cover Classification Systems (LCCSs) of these five different LC datasets include the IGBP (The International Geosphere-Biosphere Programme), UN (United Nations), and some custom classification systems.

Table 1.
Detailed information of the five LC datasets.
Table 1.
Detailed information of the five LC datasets.
| Land Cover Products | MCD12Q1 | C3S-LC | GlobeLand30 | GLC_FCS30 | ESA2020 |
|---|---|---|---|---|---|
| Spatial Resolution (m) | 500 | 300 | 30 | 30 | 10 |
| time | 2020 | 2020 | 2020 | 2020 | 2020 |
| Overall Accuracy (%) | 71.6% | 70.8% | 85.7% | 81.4% | 74.4% |
| Satellite Sensor | Terra and Aqua MODIS | Sentinel-3 OLCI | Landsat TM/ETM+/OLI, HJ-1 A/B, GF-1 multispectral image | Landsat TM/ETM+/OLI, Sentinel-1SAR-C | Sentinel-1 SAR-C, Sentinel-2 MSI |
| Classification Scheme | 17 classes | 22 classes | 10 classes | 29 classes | 11 classes |
| Classification Technique | Supervised Classification | Supervised and Unsupervised Change Detection | POK (based on pixels, objects, and knowledge rules) | Random Forest Model | Cat boost |
| Institution | National Aeronautics and Space Administration (NASA) | European Space Agency (ESA) | National Geomatics Center of China (NGCC) | Chinese Academy of Sciences | European Space Agency (ESA) |
| Download Link | https://ladsweb.modaps.eosdis.nasa.gov (accessed on 8 January 2023) | https://www.esa-landcover-cci.org (accessed on 2 January 2023) | http://www.globallandcover.com (accessed on 20 January 2023) | https://data.casearth.cn/sdo/detail/5fbc7904819aec1ea2dd7061 (accessed on 25 January 2023) | https://esa-worldcover.org/en (accessed on 16 January 2023) |
Table 2.
The initial categorization and identification codes of compared LC datasets.
Table 2.
The initial categorization and identification codes of compared LC datasets.
| MCD12Q1 | C3S-LC | GlobeLand30 | GLC_FCS30 | ESA2020 |
|---|---|---|---|---|
| Evergreen Needleleaf Forests (1) | Cropland, rainfed (10) | Cropland (10) | Rainfed cropland (10) | Tree cover (10) |
| Evergreen Broadleaf Forests (2) | Cropland, irrigate or post-flooding (20) | Forest (20) | Herbaceous cover (11) | Shrubland (20) |
| Deciduous Needleleaf Forests (3) | Mosaic cropland (>50%)/natural vegetation (tree, shrub, herbaceous cover) (30) | Grassland (30) | Tree or shrub cover (Orchard) (12) | Grassland (30) |
| Deciduous Broadleaf Forests (4) | Mosaic natural vegetation (tree, shrub, herbaceous cover) (>50%)/cropland (<50%) (40) | Shrubland (40) | Irrigated cropland (20) | Cropland (40) |
| Mixed Forests (5) | Tree cover, broad-leaved, evergreen, closed to open (>15%) (50) | Wetland (50) | Open/Closed evergreen broad-leaved forest (51/52) | Built-up (50) |
| Closed Shrublands (6) | Tree cover, broad-leaved, deciduous, closed to open (>15%) (60) | Waterbodies (60) | Open/Closed deciduous broad-leaved forest (61/62) | Barren/sparse vegetation (60) |
| Open Shrublands (7) | Tree cover, needle-leaved, evergreen, closed to open (>15%) (70) | Tundra (70) | Open/Closed evergreen needle-leaved forest (71/72) | Snow and Ice (70) |
| Woody Savannas (8) | Tree cover, needle-leaved, deciduous, closed to open (>15%) (80) | Artificial surface (80) | Open/Closed deciduous needle-leaved forest (81/82) | Open water (80) |
| Savannas (9) | Tree cover, mixed leaf type (broad-leaved and needle-leaved) (90) | Bare areas (90) | Open/Closed mixed leaf forest (broad-leaved and needle-leaved (91/92) | Herbaceous wetland (90) |
| Grasslands (10) | Mosaic herbaceous cover (>50%)/herbaceous cover (<50%) (100) | Glaciers and permanent snow (100) | Shrubland/Evergreen shrubland/Deciduous shrubland (120/121/122) | Mangroves (95) |
| Permanent Wetlands (11) | Mosaic herbaceous cover (>50%)/tree and shrub (<50%) (110) | Grassland (130) | Moss and lichen (100) | |
| Croplands (12) | Shrubland (120) | Lichen and mosses (140) | ||
| Urban and Built-up Lands (13) | Grassland (130) | Sparse vegetation/Sparse shrubland/Sparse herbaceous (150/152.153) | ||
| Cropland/Natural Vegetation Mosaics (14) | Lichens and mosses (140) | Wetlands (180) | ||
| Permanent Snow and Ice (15) | Sparse vegetation (tree, shrub, herbaceous cover) (<15%) (150) | Impervious surfaces (190) | ||
| Barren (16) | Tree cover, flooded, fresh or brackish water (160) | Bare areas/Consolidated bare areas/Unconsolidated bare areas (200/201/202) | ||
| Water Bodies (17) | Tree cover, flooded, saline water (180) | Water body (210) | ||
| Shrub or herbaceous cover, flooded, fresh/saline/brackish water (180) | Permanent ice and snow (220) | |||
| Urban area (190) | ||||
| Bare areas (200) | ||||
| Water bodies (210) | ||||
| Permanent snow and ice (220) |
2.2.2. Reference Land Cover Datasets
The lack of a common reference dataset is one of the primary limitations in conducting validation [32]. Nevertheless, new datasets developed in recent years are making validation data more accessible. This study benefits from the utilization of openly accessible and publicly shared reference datasets, which have been integrated into a unified dataset (Figure 2). Further details can be found below and in Table 3.
- (1)
- The Geo-Wiki Global Validation Sample Set (2011–2012) was acquired from the Geo-Wiki crowdsourcing platform (https://zenodo.org/communities/geo-wiki, accessed on 6 February 2023), and includes 10 LC types. The Geo-Wiki datasets describe information on human impacts, LC variability, wilderness, and reference data. These data can be used as baseline data for worldwide satellite-derived products and for comprehensive monitoring of terrestrial ecosystems [47,48]. After our processing, a total of 1491 Geo-Wiki validation samples were obtained for the study area.
- (2)
- The Global Land Cover Validation Sample Set (GLCVSS, 2009–2011) (https://zenodo.org/record/3551995, accessed on 10 February 2023), was obtained using a random sampling strategy to ensure equitable distribution across the entire globe. It is based on the interpretation of Landsat TM and ETM+ images, and several existing reference datasets (such as the STEP reference dataset, GLCNMO2008 training dataset, Global cropland reference data, VIIRS reference dataset, and so on [49]). The GLCVSS samples were obtained from 689 validation samples after processing in the study area.
- (3)
- The Global Observation for Forest Cover and Land Dynamics (GOFC-GOLD) has established a data access portal (http://www.gofcgold.wur.nl/sites/gofcgold_refdataportal.php, accessed on 15 February 2023) which provides various validation datasets. After processing the GOFC-GOLD global validation samples, a combined sum of 6 validation samples were obtained for the study area.
- (4)
- The US Geological Survey (USGS) Global Land Cover Reference Dataset was produced to offer a comprehensive collection of thematic classes for the purpose of supplying reference data in thematic classifications [50] (https://www.sciencebase.gov/catalog/item/6116c890d34e3267c611bfdd, accessed on 21 February 2023). After processing the USGS reference samples, we obtained 413 validation samples covering the study area.

Figure 2.
(a) Spatial distribution of the four reference validation samples, (b) and their land cover classification.
Figure 2.
(a) Spatial distribution of the four reference validation samples, (b) and their land cover classification.
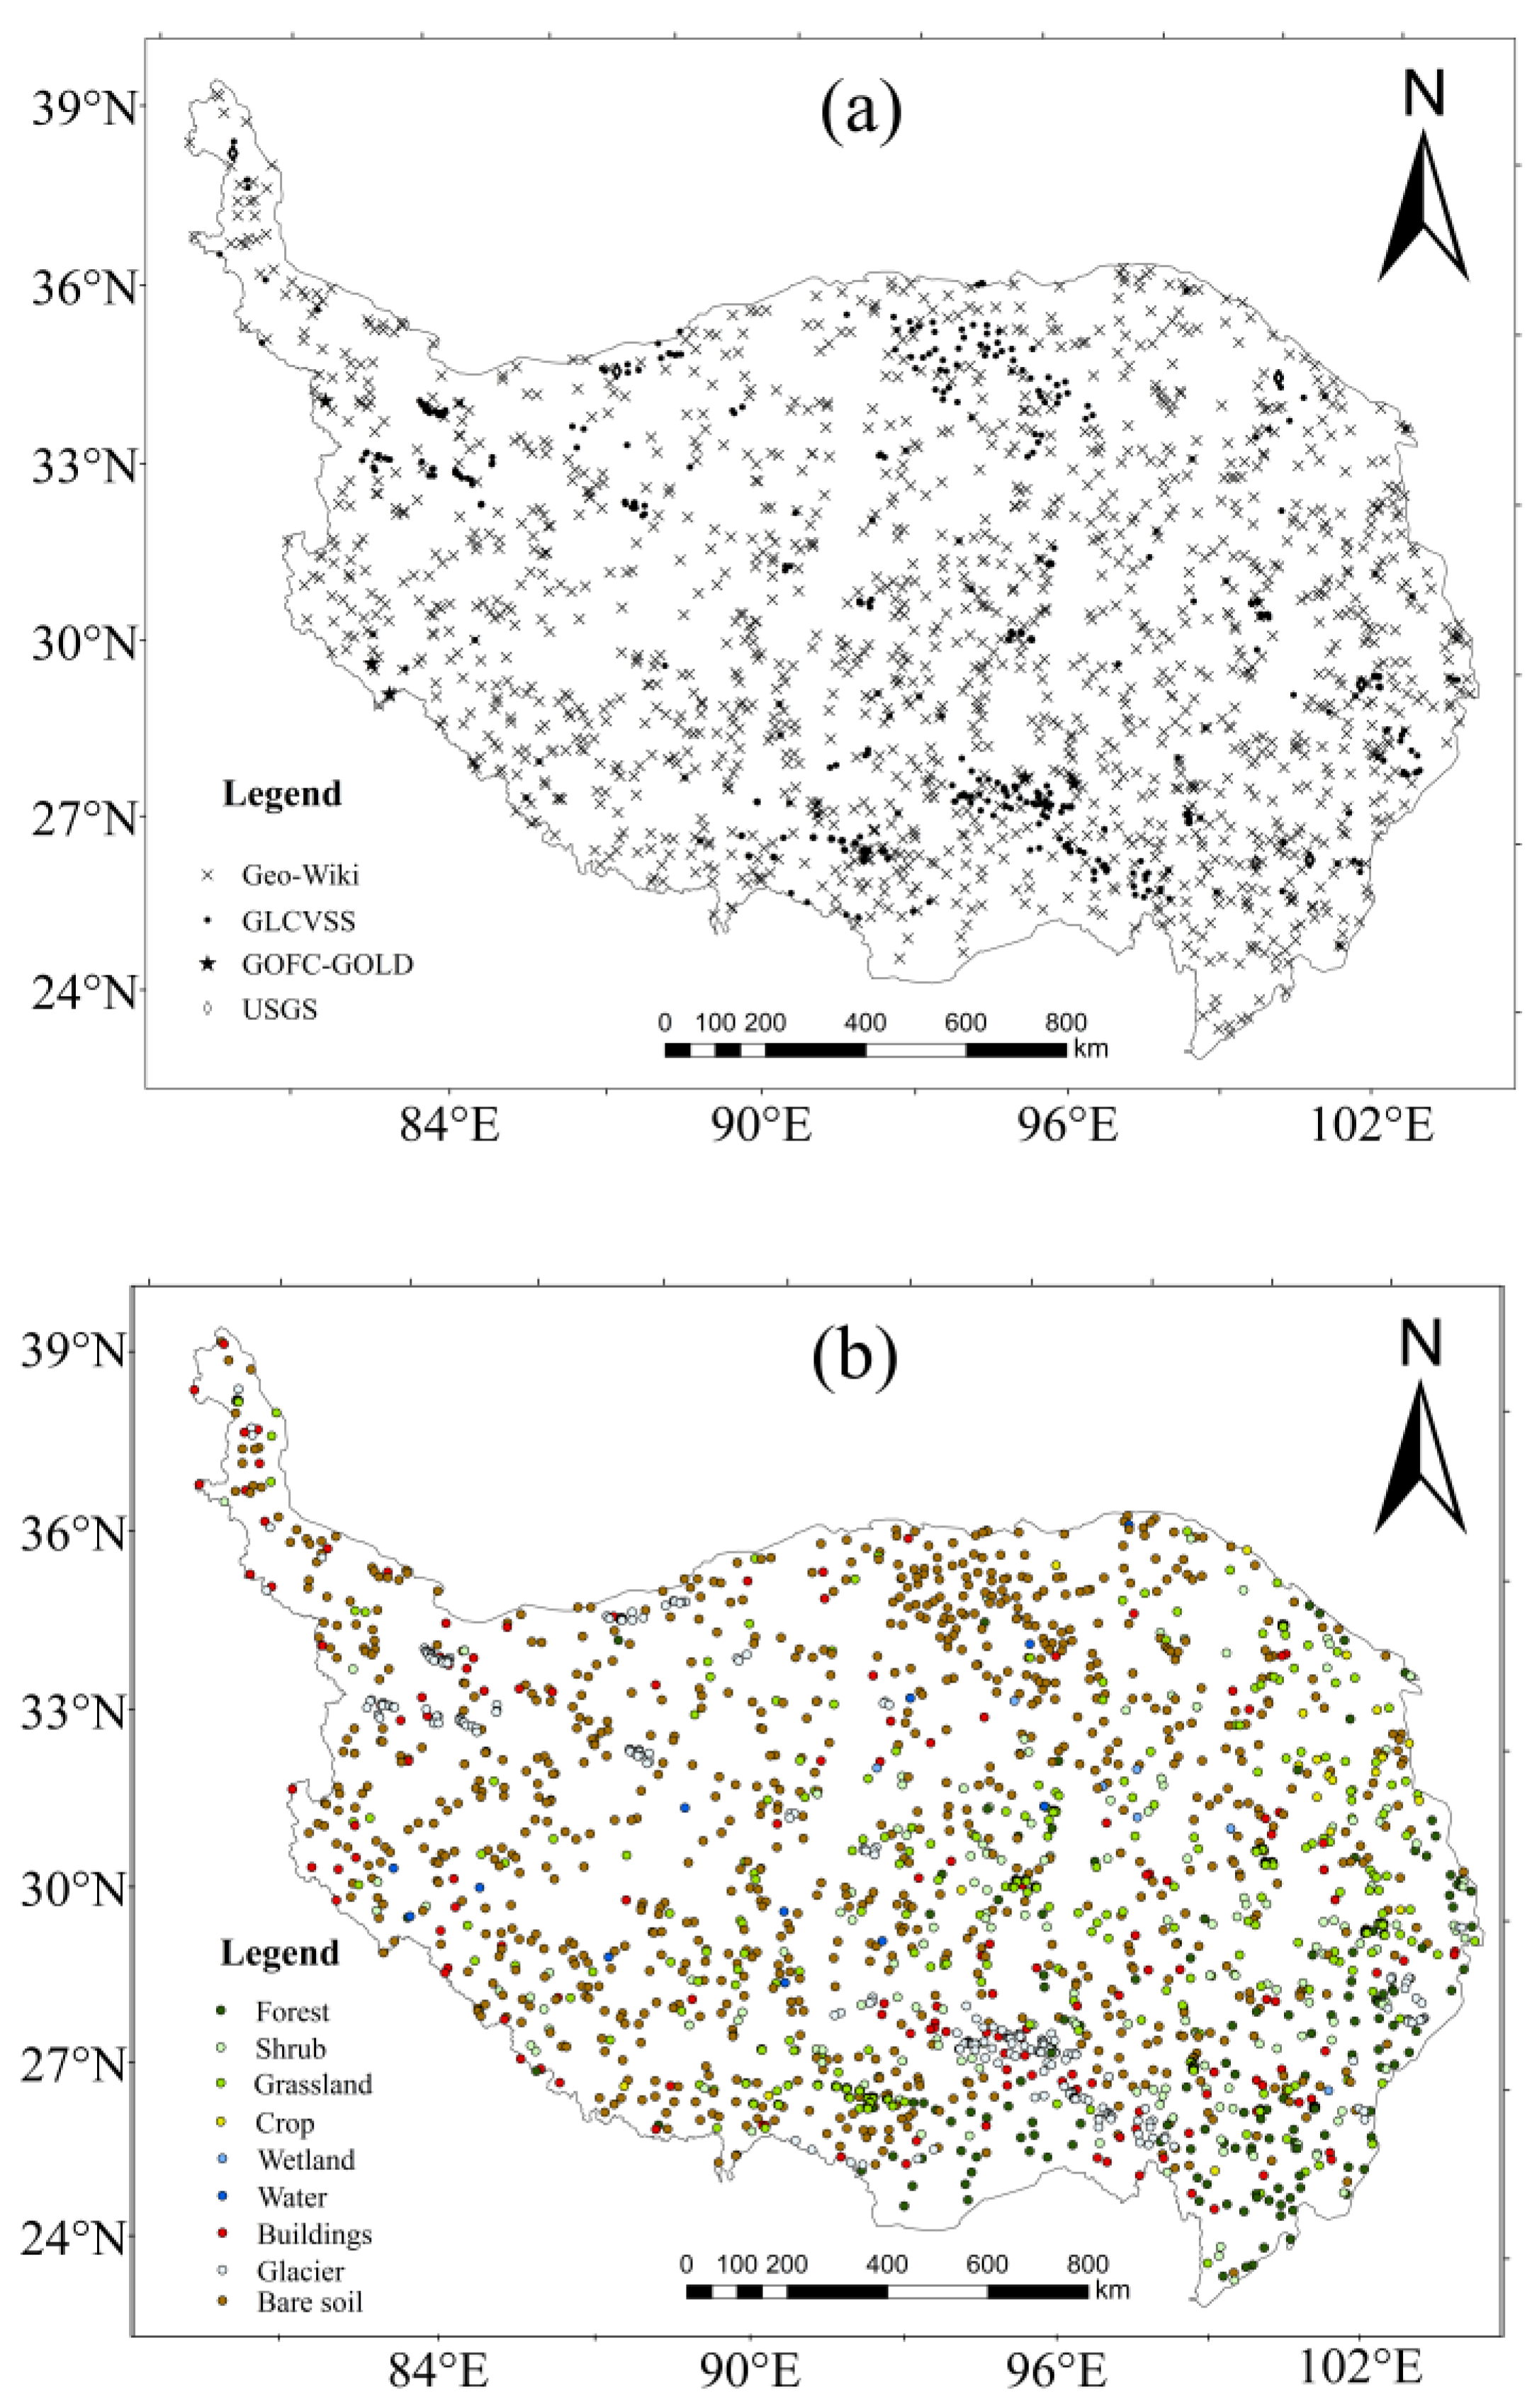
Table 3.
The initial categorization and identification codes of land cover reference datasets.
Table 3.
The initial categorization and identification codes of land cover reference datasets.
| Geo-Wiki | GLCVSS | GOFC-GOLD | USGS |
|---|---|---|---|
| Tree Cover (1) | Rainfed cropland (10) | Evergreen Needleleaf Trees (1) | Trees (1) |
| Shrub Cover (2) | Herbaceous cover (11) | Evergreen Broadleaf Trees (2) | Water (2) |
| Herbaceous Vegetation/Grassland (3) | Tree or shrub cover (Orchard) (12) | Deciduous Needleleaf Trees (3) | Barren (3) |
| Cultivated and Managed (4) | Irrigated cropland (20) | Deciduous Broadleaf Trees (4) | Other Vegetation (4) |
| Mosaic: Cultivated and Managed/Natural Vegetation (5) | Evergreen broad-leaved forest (50) | Mixed/Other Trees (5) | Cloud (5) |
| Regularly Flooded/Wetland (6) | Deciduous broad-leaved forest (60) | Shrubs (6) | Shadow (6) |
| Urban/Built up (7) | Evergreen needle-leaved forest (70) | Herbaceous vegetation (7) | No Data (7) |
| Snow and Ice (8) | Deciduous needle-leaved forest (80) | Cultivated and managed vegetation/agriculture (incl. mixtures) (8) | Ice and Snow (8) |
| Barren (9) | Mixed leaf forest (broad-leaved and needle-leaved) (90) | Other shrub/herbaceous vegetation (9) | |
| Open Water (10) | Shrubland/Evergreen shrubland/Deciduous shrubland (120/121/122) | Other Land (Urban, open Water, Snow and Ice) (10) | |
| Grassland (130) | Barren (11) | ||
| Wetlands (180) | |||
| Impervious surfaces (190) | |||
| Lichens and mosses (140) | |||
| Sparse vegetation/Sparse shrubland/Sparse herbaceous cover (150,152,153) | |||
| Bare areas/Consolidated bare areas/Unconsolidated bare areas (200/201/202) | |||
| Water body (210) | |||
| Permanent ice and snow (220) |
2.3. Land Cover Data Processing and Analysis Method
2.3.1. Preprocessing
Due to their different geographic systems and spatial resolutions, the original datasets were preprocessed before analysis and assessment. This preprocessing mainly included data splicing and clipping, projection transformation, spatial scale conversion, classification system unification among the different products, and error processing. The specific steps were as follows: (1) All datasets were uniformly spliced and clipped for the TP region to get LC datasets and reference datasets with consistent boundaries. (2) The geometric correction method was employed in the initial data processing stage. All datasets were unified into the coordinate system of WGS 1984 and Albers Equal-Area conical projection to prevent area distortion. After performing unified projection and re-interpolation processes, the Georeferencing function of ArcGIS was automatically applied to ensure grid alignment. (3) Since the five land cover products had different resolutions, the maximum area aggregation was used to convert all datasets to a resolution of 500 m. This method is also considered to be a reliable method for the aggregation of LC datasets [31,37]. (4) A standardized classification system is an essential prerequisite for the comparison of LC products from multiple sources, and simplified categories can mitigate uncertainties arising from the diversification of detailed LC types. The five LC products employ distinct classification systems. Given that the GlobeLand30 classification system consists of only one level, the classification systems were merged under the same classification benchmarks (the classification scheme of GlobeLand30) to comparatively evaluate the different LC products. According to a previous study, the individual classifications in different LC and reference datasets were reclassified into nine types [51] (Table 4 and Table 5). (5) When a missing raster was identified in a dataset, the corresponding raster in all LC datasets was excluded from analysis. According to our statistics, the total number of missing pixel points is 691, which represents a negligible proportion of only 6 out of 100,000 pixels.
Table 4.
Classification standardization of the five LC products. Refer to Table 2 for the original classification and code.
Table 5.
Classification standardization of the LC reference datasets. Refer to Table 3 for the original classification and code.
2.3.2. Areal Comparison Analysis
The deviation coefficient (D) can effectively measure the classification accuracy of different LC types in multiple sets of data products [52]. First, we counted the area of each LC type in LC products and calculated the deviation coefficient of different products for the same LC type by taking the mean area of the same LC type in all products as standard.
where x stands for multiple sets of data products; represents the area of x product of type k; various types of multiple sets of products; denotes the mean value of type k among multiple sets of products; and represents the coefficient of area variation for x product of k type.
In order to quantitatively assess the area similarity of LC types among products, we calculated the area of individual LC types for five products, and then calculated the coefficients of area correlation for the area series of LC between each dataset [13]. The formula is shown below:
where represents the coefficient of area correlation; i represents the LC type; represents the total number of pixels of LC type i in dataset X; represents the total number of type i in dataset Y; represents the mean of the total number of pixels of all types in dataset X; represents the mean number of pixels across all types in dataset Y; and n is the number of LC types.
2.3.3. Spatial Distribution Evaluation
In order to visualize the consistency of the spatial distributions, the spatial superposition method of the ArcGIS platform was used to summarize the results into five situations: (1) Complete Inconsistency: the five datasets exhibit completely different indication types within a given raster; (2) Low Consistency: two products have the same LC type in the given pixel; (3) Moderate Consistency: three products have the same LC type in the given pixel; (4) High Consistency: four products show the same type in the given pixel; and (5) Complete Consistency: the five datasets have the same LC type in a given raster.
2.3.4. Accuracy Assessment
The confusion matrix is an effective tool used to evaluate LC datasets. Based on this method, the overall accuracy (OA), producer’s accuracy (PA), user’s accuracy (UA), and Kappa coefficients were computed to express the LC data accuracy [53,54]. The formulas of these are as follows:
where n represents the number of pixels; m indicates the number of land cover types; stands for the number of correctly categorized pixels for class i; is the number of pixels for class i in the reference data; and is the number of pixels for class i in the LC datasets to be assessed.
3. Results
3.1. Comparison of Land Cover Composition
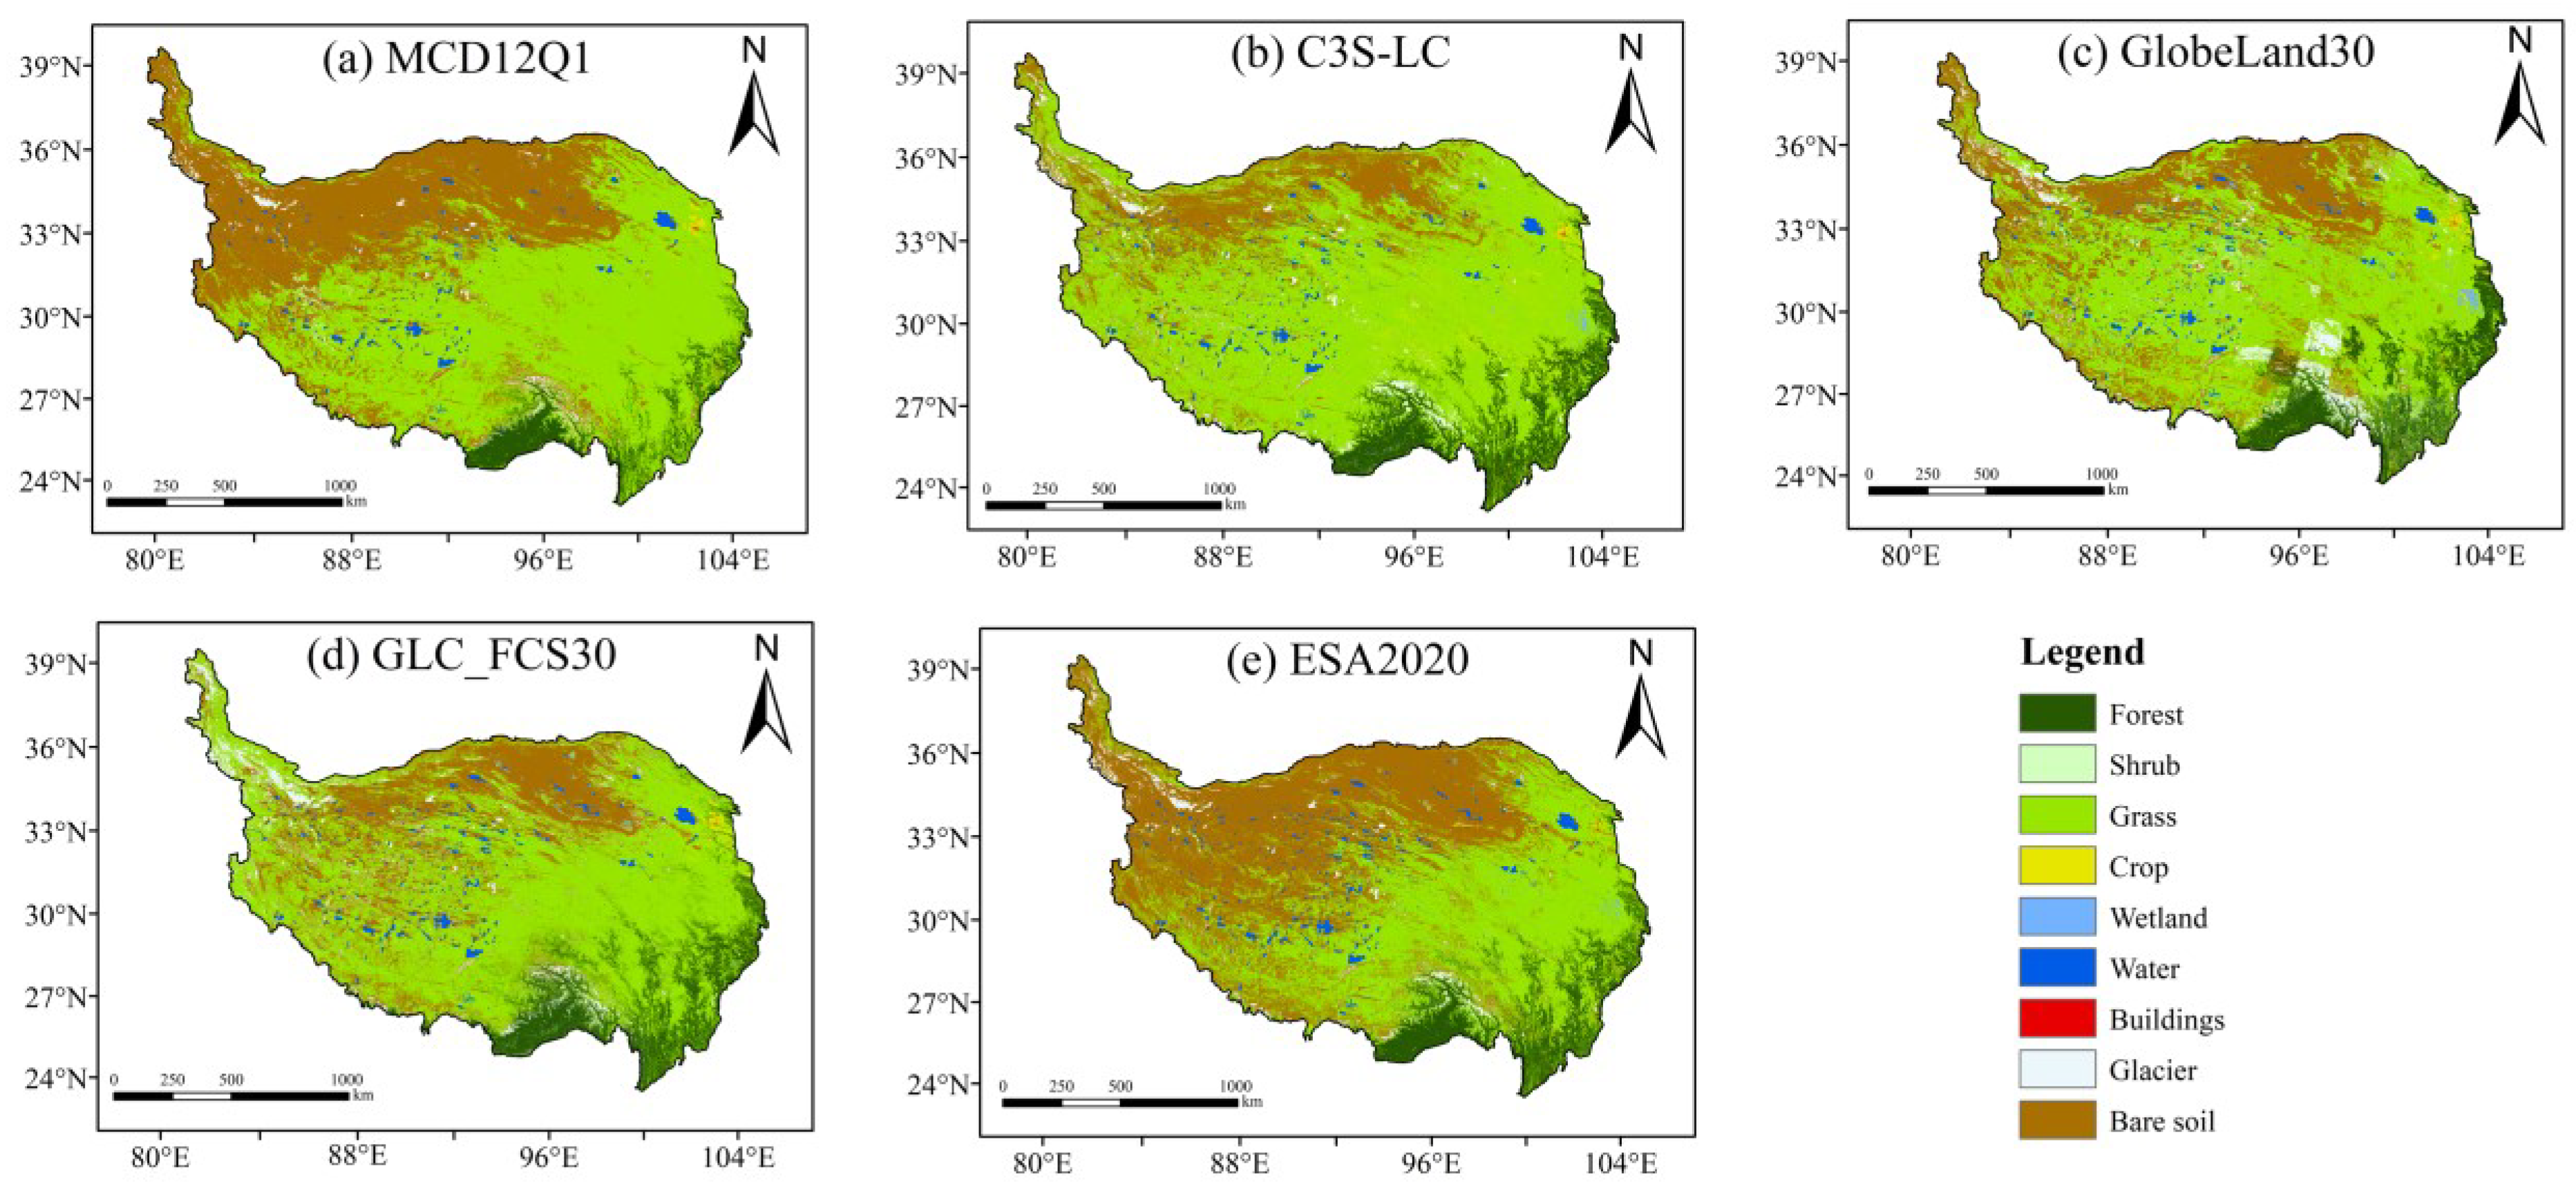
Figure 3 shows the spatial patterns of LC types for the five products in 2020. In summary, the spatial pattern over the TP is obvious at a regional level, with a clear transition from bare soil to grass and then to forest from northwest to southeast. Every LC dataset accurately represents the grass widely distributed in the central part of the country, forest heavily distributed in the eastern part of the country, and wetland or water scattered sporadically over the TP. However, the land coverage for each type displays remarkable discrepancies among the different maps based on visual comparison in several local regions. For example, C3S-LC has less bare soil in the northern part of the TP than MCD12Q1, GlobLand30, GLC-FCS30, and ESA2020, while ESA2020 has less grass in the central TP than MCD12Q1, C3S-LC, GlobeLand30, and GLC_FCS30. Furthermore, GlobeLand30 identifies additional glacier coverage at the mountain Nyenchen Tanglha.

Figure 3.
Spatial patterns for the five LC products on TP: (a) MCD12Q1, (b) C3S-LC, (c) GlobeLand30, (d) GLC_FCS30, and (e) ESA2020.
3.2. Evaluation of Areal Consistency
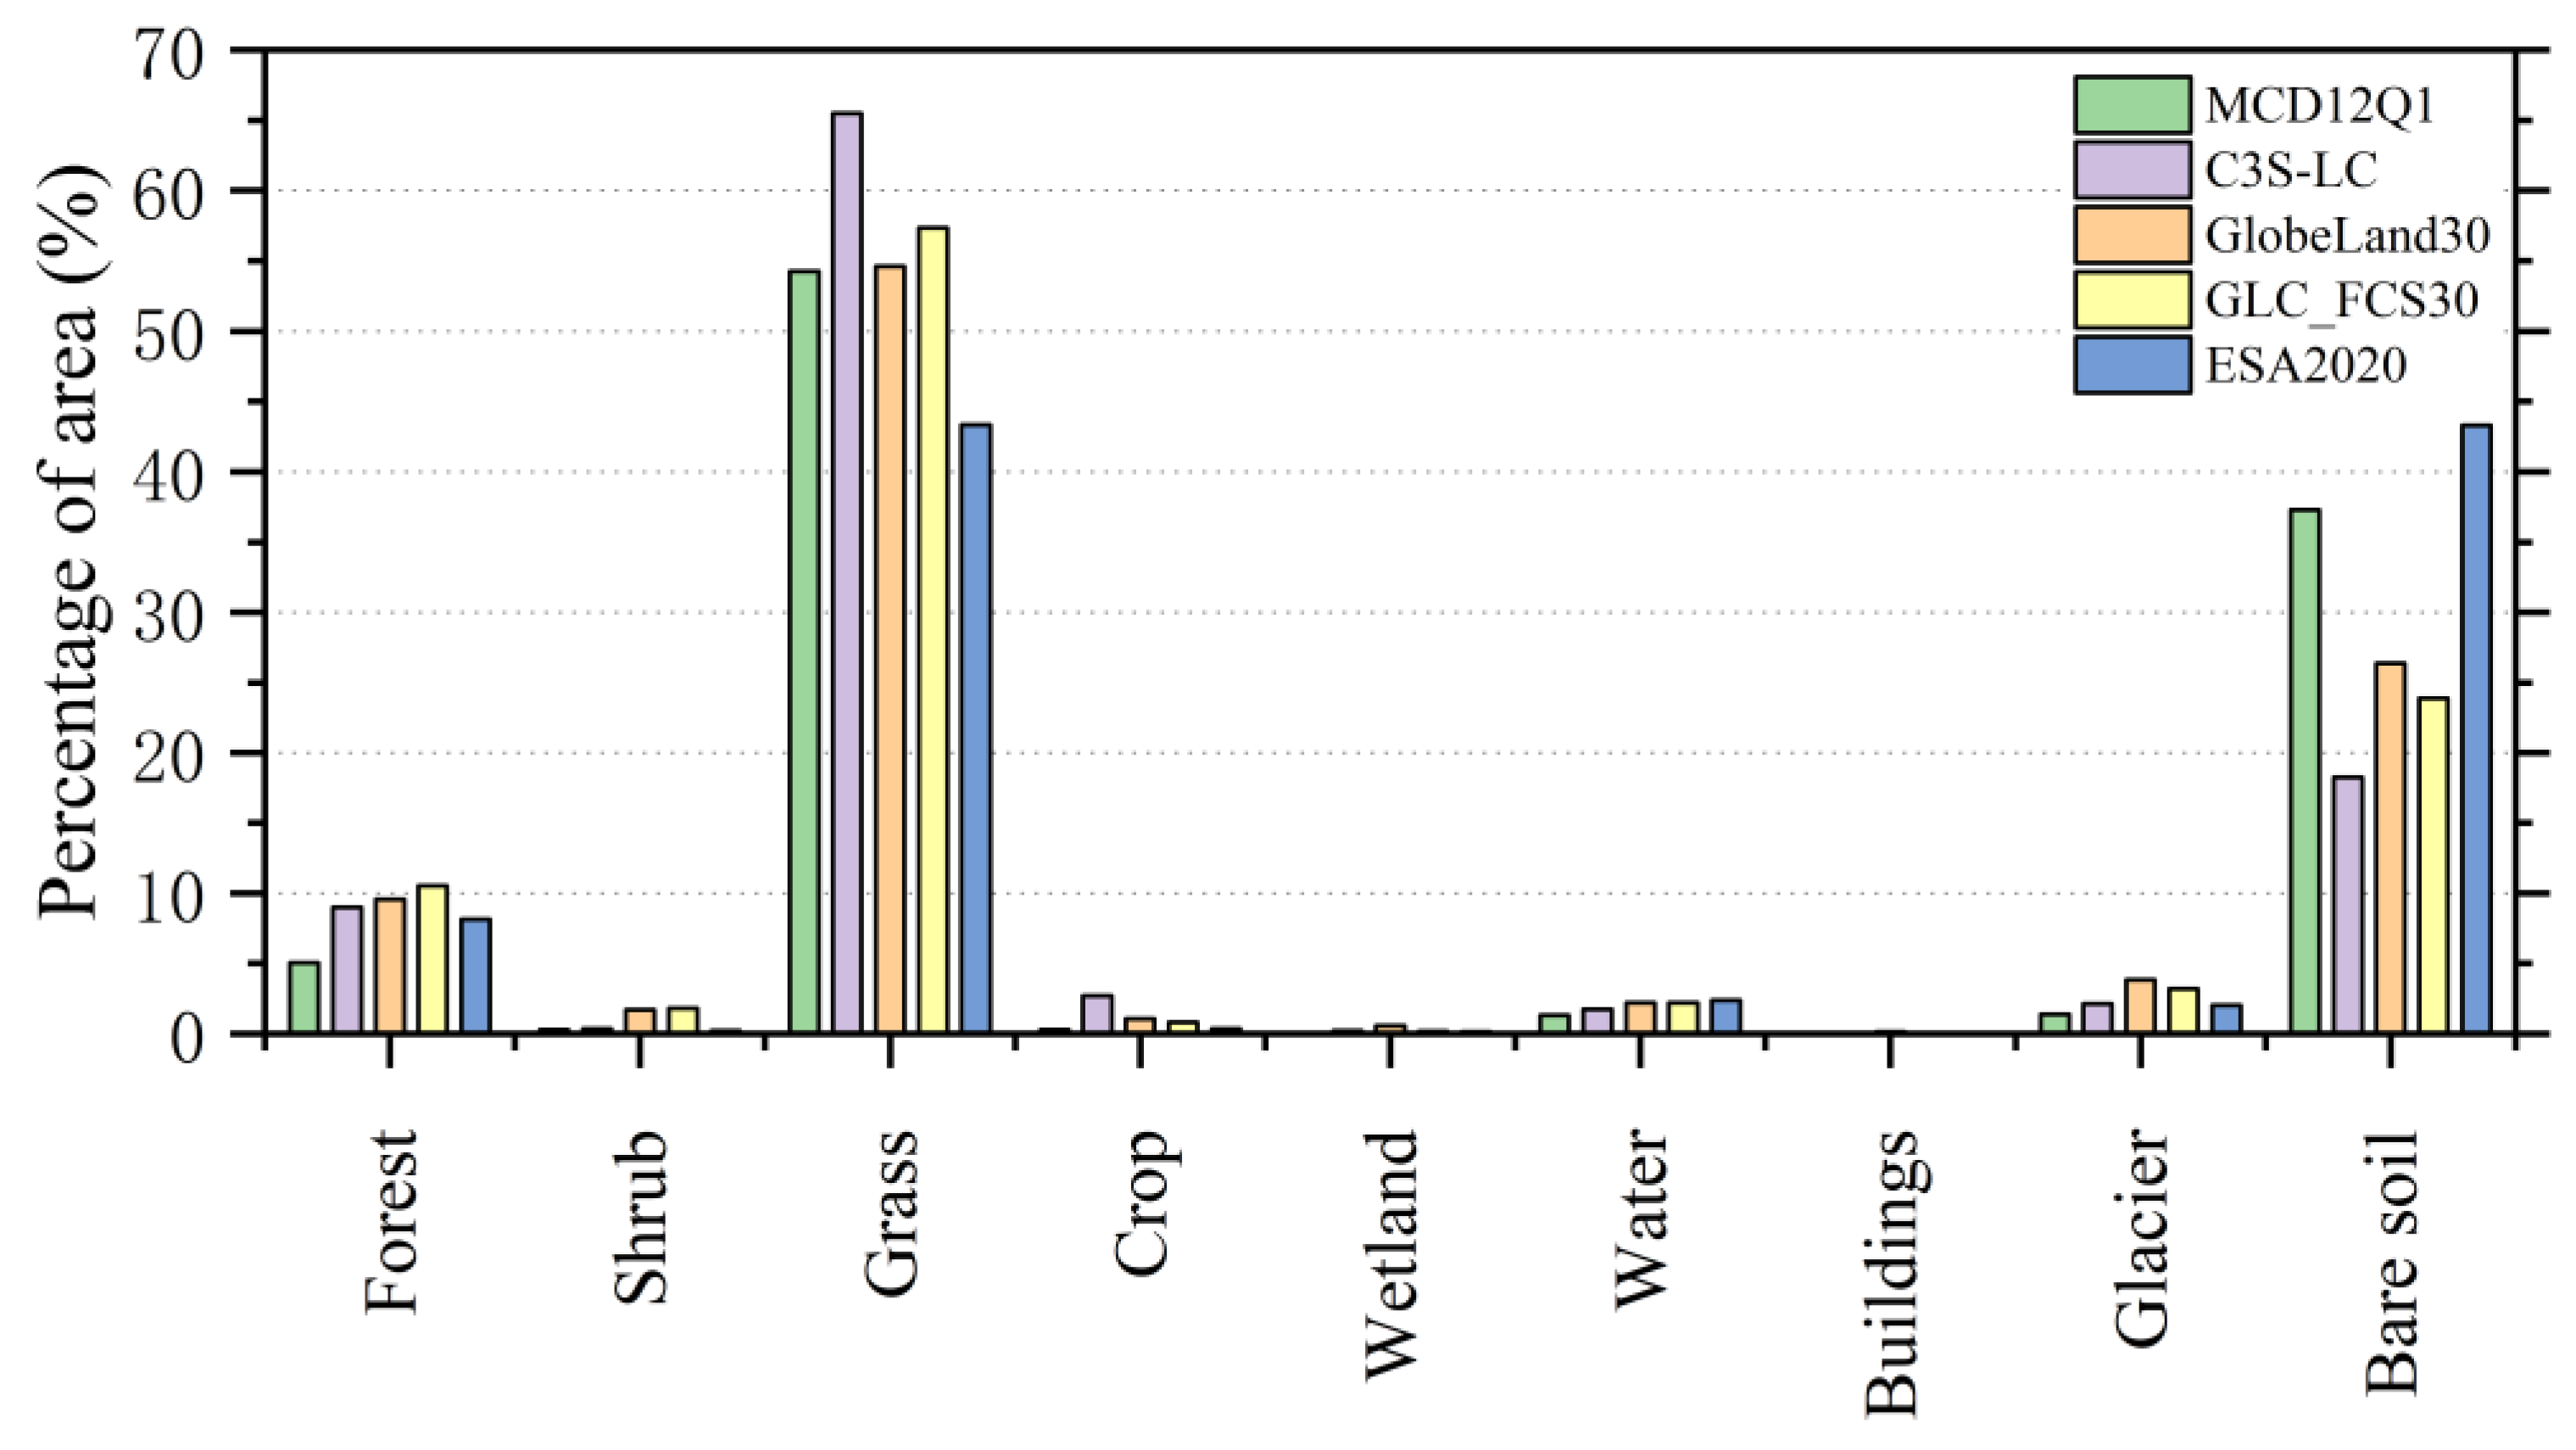
From the five LC datasets, the LC compositions of the TP are shown in Figure 4. In general, these five LC datasets are consistent in the LC characterization on the TP: it is principally dominated by grass, followed by bare soil, forest, glacier, water, crop, and shrub; wetland and buildings are very small.
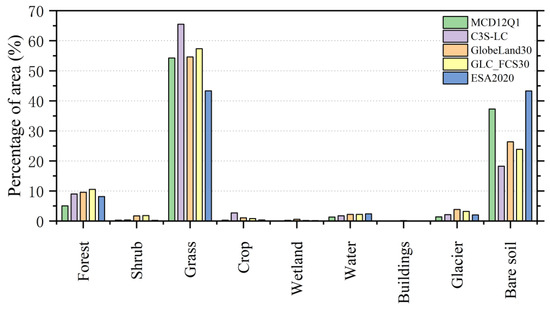
Figure 4.
Percentage of separate classes area for five LC products in 2020.
Furthermore, Table 6 presents the statistics of area percentage and deviation coefficient of LC types from five datasets. For grass, the area percent among MCD12Q1 (54.26%), GlobeLand30 (54.60%), and GLC_FCS30 (57.34%) are particularly similar, and their deviation coefficients are −1.36%, −0.74%, and 4.24%, respectively. In contrast, the area difference between C3S-LC (65.49%) and ESA2020 (43.35%) is quite large, and their deviation coefficients are 19.05% and −21.19%. For bare soil, large discrepancies in areas exist in the five datasets (18.29~43.30%). The area percentage of bare soil of GlobeLand30 (26.36%) is similar to GLC_FC30 (23.90%). ESA2020 has the largest bare soil area, accounting for 43.30%. For forest, the area percentage is the largest in GLC_FC30 (10.51%), which is higher than other LC datasets (5.04~9.58%). The percentages of glacier for the five datasets are between 1.39% to 3.83%. The shrub, crop, wetland, water, and building coverage for all LC datasets in this study are uniformly extremely low.
Table 6.
Area percentage (AP) and deviation coefficient (DC) of LC types of five datasets (%).
By computing the area correlation among the five products to quantitively measure the areal consistency (Table 7), we found that the correlation coefficients between different LC datasets are above 0.9, except for the coefficients between C3S-LC/GLC_FCS30 and ESA2020 (0.831/0.896). The correlation between GlobeLand30 and GLC_FC30 is the greatest (0.998), suggesting a high degree of similarity between the two products for the LC types of the study region. The correlation between C3S-LC and GLC_FCS30 is second greatest at 0.990; the correlations between MCD12Q1 and the other four products are all above 0.972; and the correlations between C3S-LC and GlobeLand30, and GlobeLand30 and ESA2020 are in the middle, ranging from 0.922 to 0.980.
Table 7.
Area correlation coefficients among the five LC products.
3.3. Consistency Analysis of Spatial Distribution
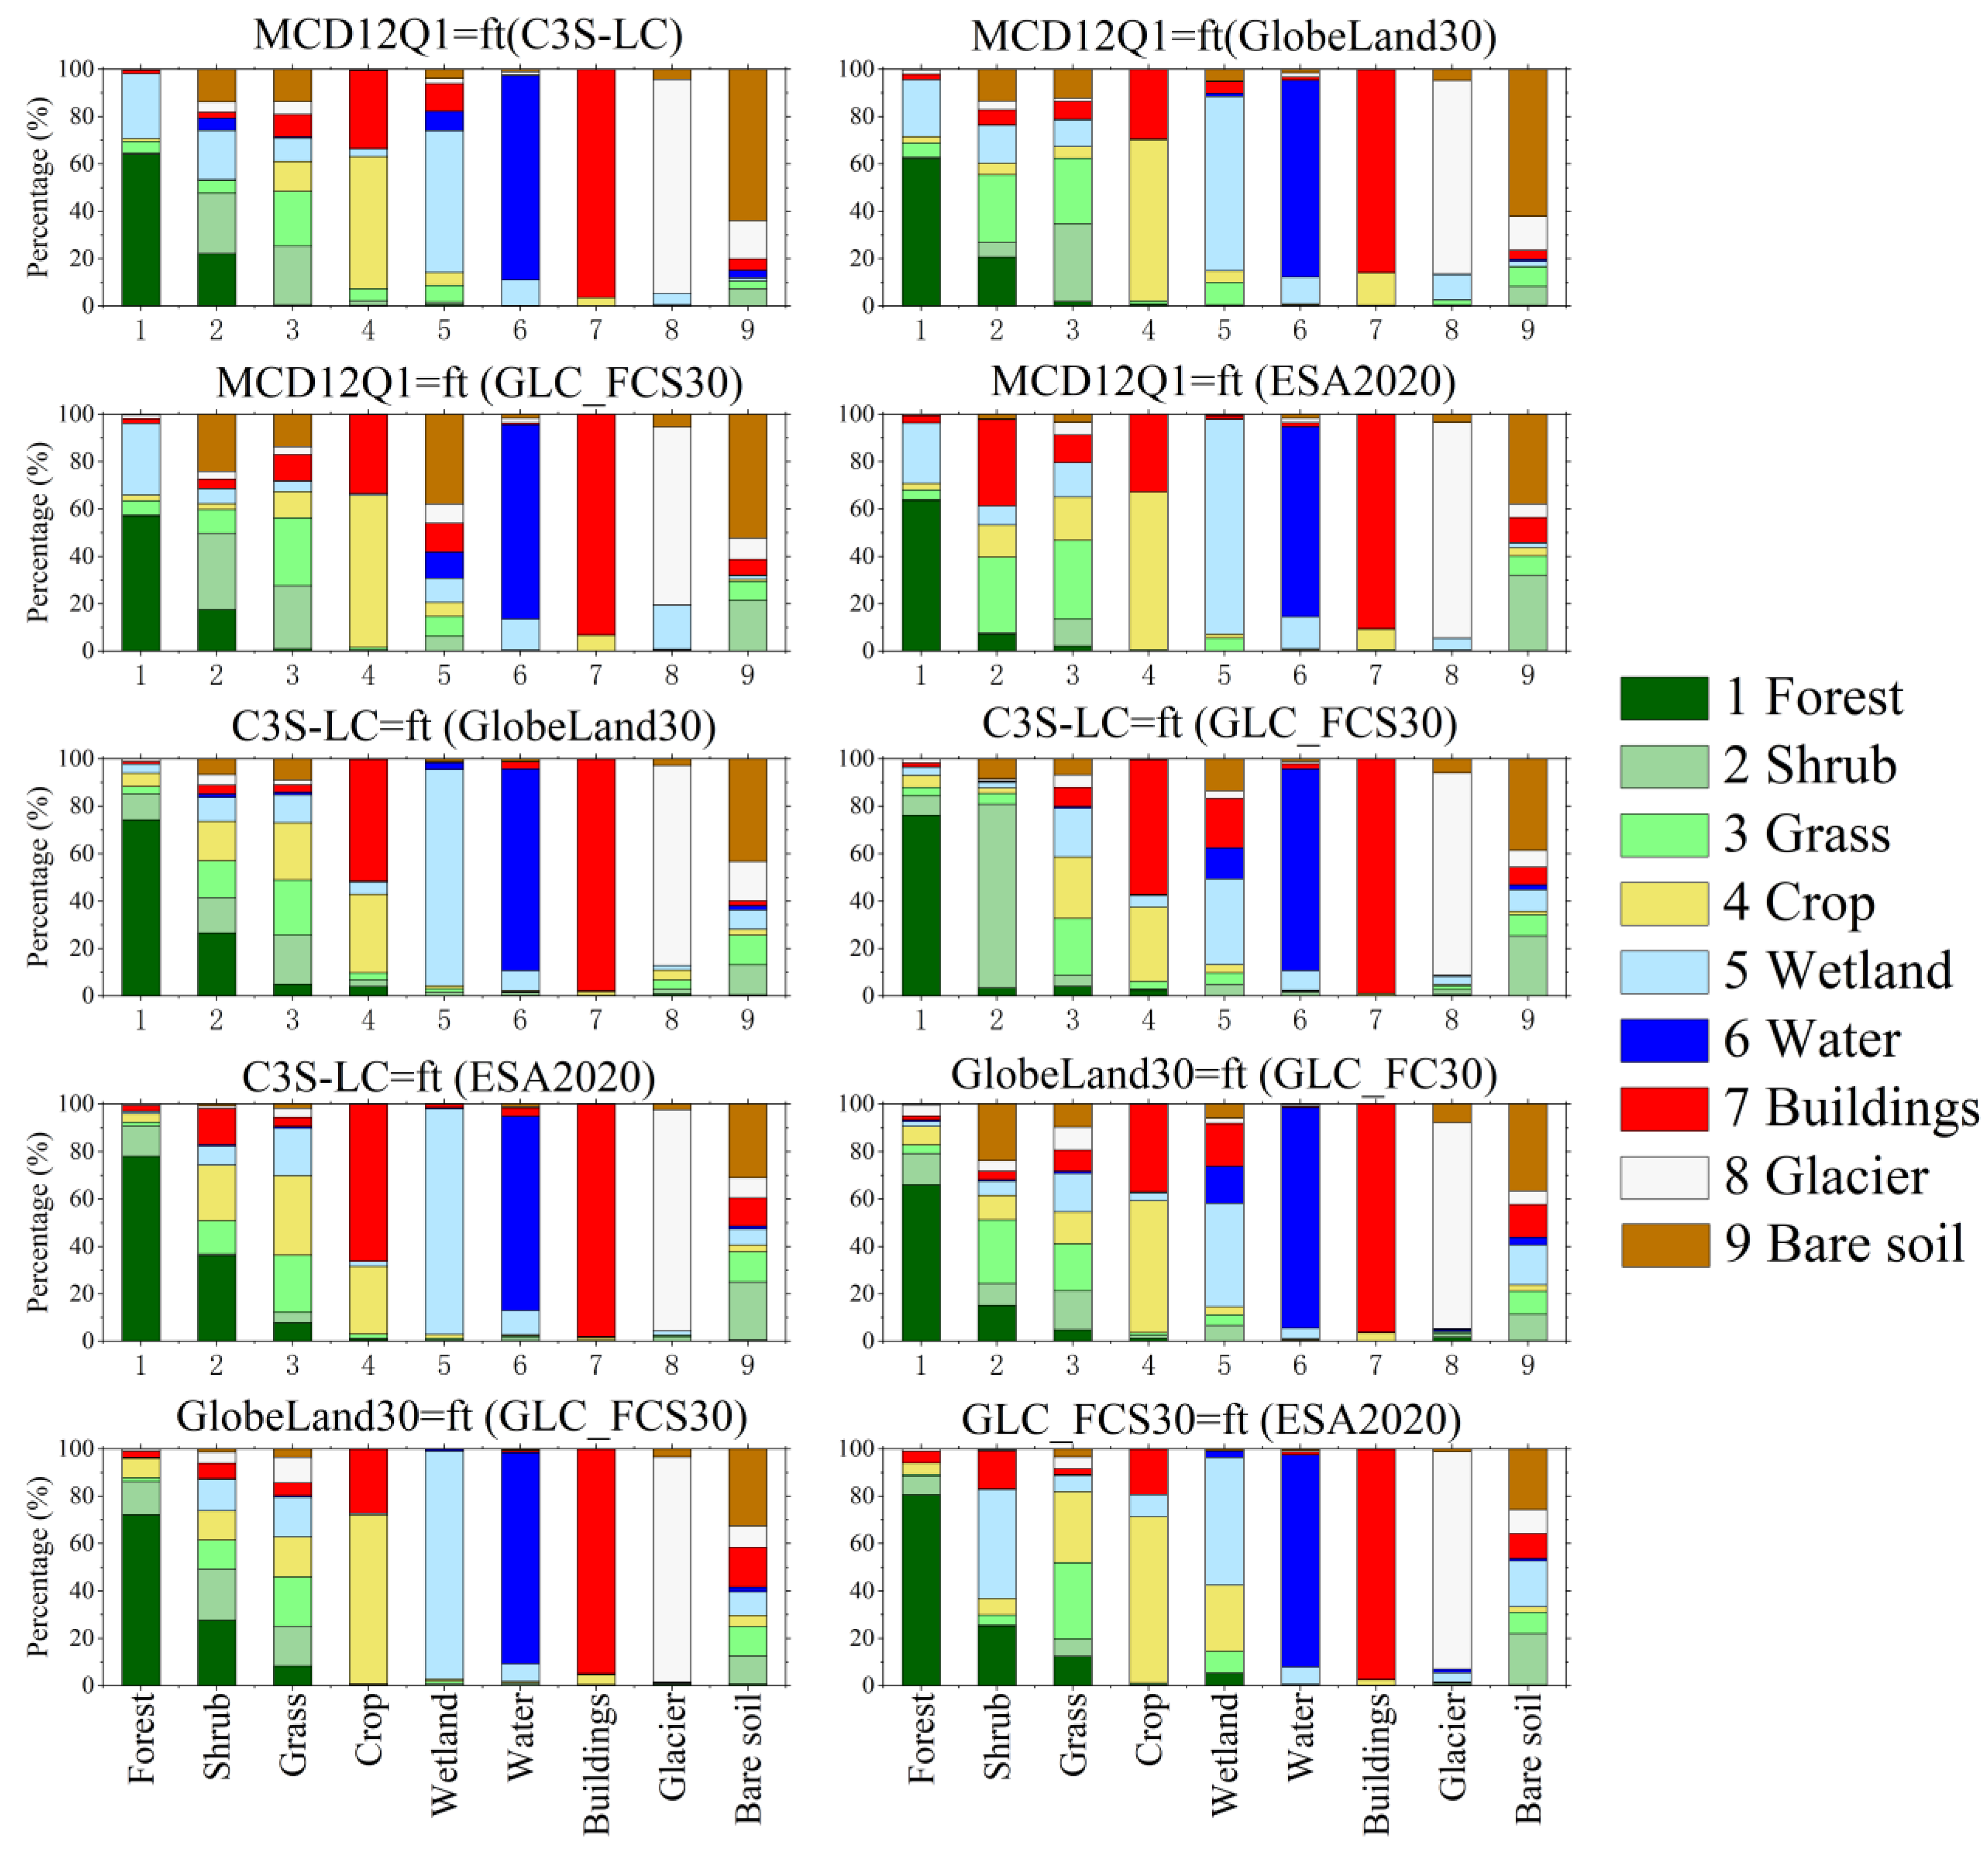
The level of confusion of land cover types in different LC products was analyzed, and the results are presented in Figure 5. Pure grids are those where the LC type on the abscissa matches the land type on the ordinate, while confused grids are those where they do not match. For instance, the x-coordinate represents the LC types of C3S-LC, and the y-coordinate denotes the percentages of multi-type pixels in MCD12Q1 within a type of C3S-LC.
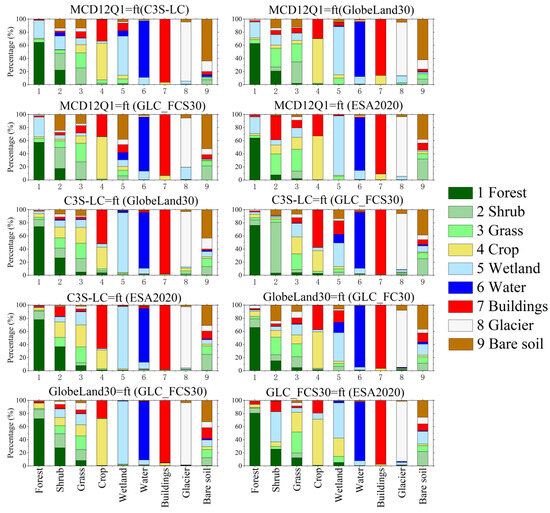
Figure 5.
Spatial confusion of LC types for each of two different products (ft stands for confounding relationships between two LC datasets).
In various dataset combinations, water, buildings, and glaciers are identified correctly on the grid and confusion is low with other LC types. Secondly, wetland, forest, crop, and bare soil have a medium degree of confusion, and shrub and grass have the poorest purity.
Specifically, the proportion of these LC types remains a huge discrepancy in the pair of comparison of the multiple LC products. Among them, buildings have the lowest confusion, and a minimal number of pixels are misinterpreted as crop. The purity of the water and glacier also is also high, and the confusion pixels are mainly identified as wetland. The degree of crop consistency is between 29% and 72%, and the GlobeLand30/GLC_FCS30 combination has the highest consistency while the C3S-LC/ESA2020 combination has the lowest consistency. The classification errors mainly arise from the misclassification of buildings. The range of the degree of consistency in wetland is spread over 10% to 96%, and the consistency degrees of the C3S-LC/GlobeLand30, the C3S-LC/ESA2020, and the GlobeLand30/GLC_FCS30 are greater than 90%. For forest, the combinations in the pairwise comparisons of the five LC datasets are more than 50%, and the GLC_FC30/ESA2020 combination has the highest degree of consistency for forest identification, exceeding 81%. For bare soil, the consistency degree is between 26% and 64%, and the MCD12Q1/C3S-LC and MCD12Q1/GlobeLand30 combinations have the highest bare soil identification accuracies, at 64% and 62%, respectively. For shrub, the C3S-LC/GLC_FCS30 combination has a high consistency at 77%, and the others have a low degree of consistency.
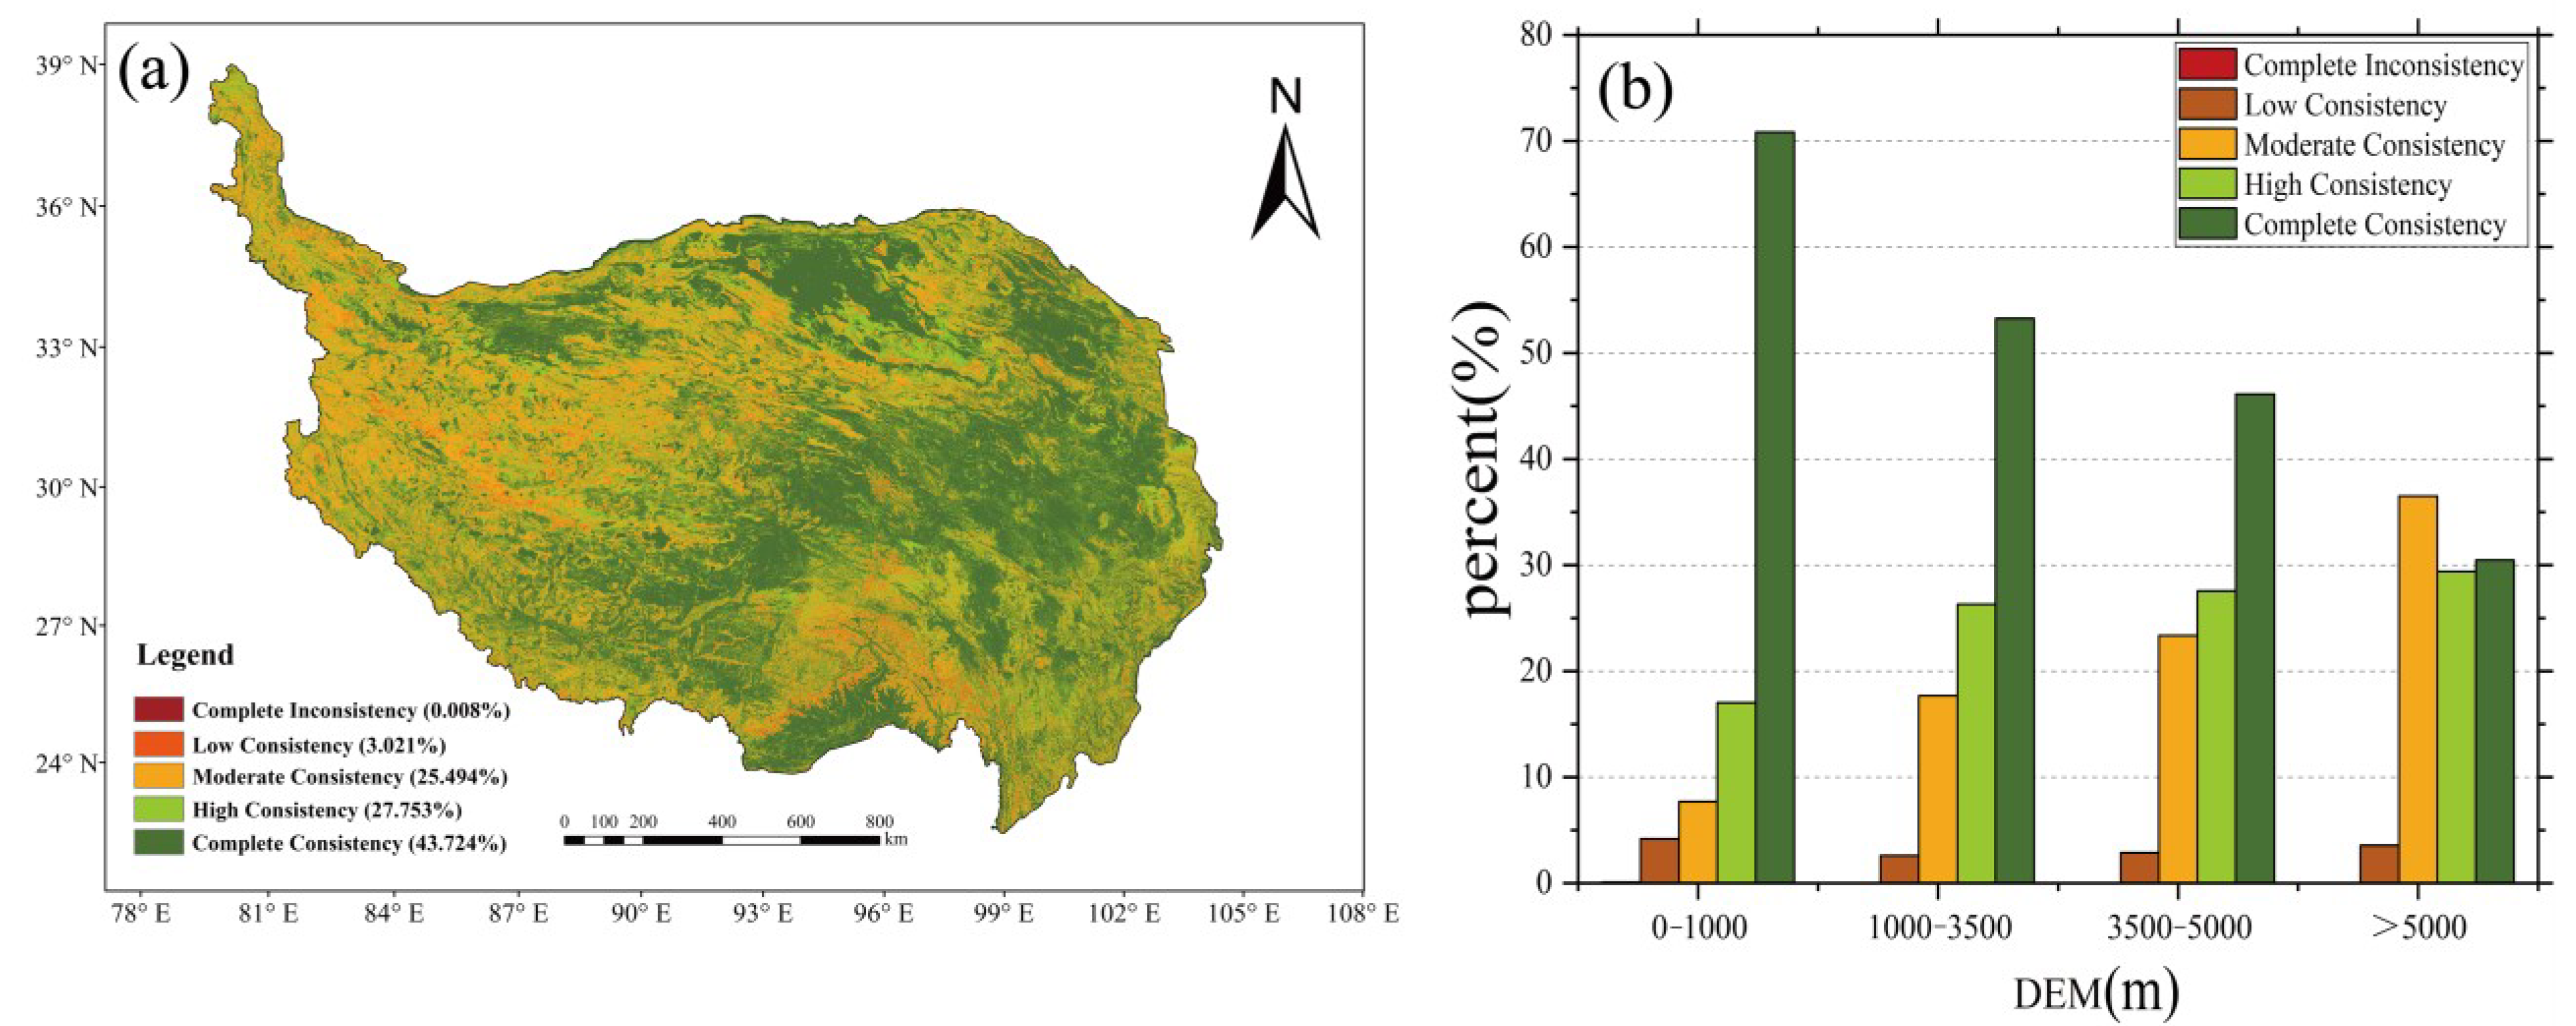
Figure 6a exhibits the consistency of the identification of various LC types among the five LC datasets acquired using the spatial overlay analysis. We found that the five datasets were highly consistent in the northern and the east-central areas of the TP, while they showed moderate to low consistency or complete inconsistency in the complex terrain areas in the western and southern areas. Figure 6b shows the proportion of LC consistency for different altitudes. It can be seen that the consistency is higher at areas below 1000 m, with an area proportion of more than 70%. From Figure 1, we can see that the low-altitude regions are largely found in the Yarlung Tsangpo River valley area in the southern part of the TP. This means that the data consistency in this river valley region is high. As altitude increases, the proportion of completely consistent areas decreases, while the proportion of low consistency areas gradually increases. In the areas with an altitude of more than 5000 m, which is mainly in the western areas of the TP, the proportion of moderate consistency areas is more than 36%, while the proportion of complete consistency areas decreases to about 30%.
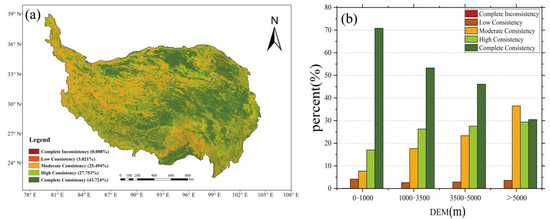
Figure 6.
(a) Distribution of consistency of five LC products on the TP, and (b) percentage of spatial consistency at different elevations.
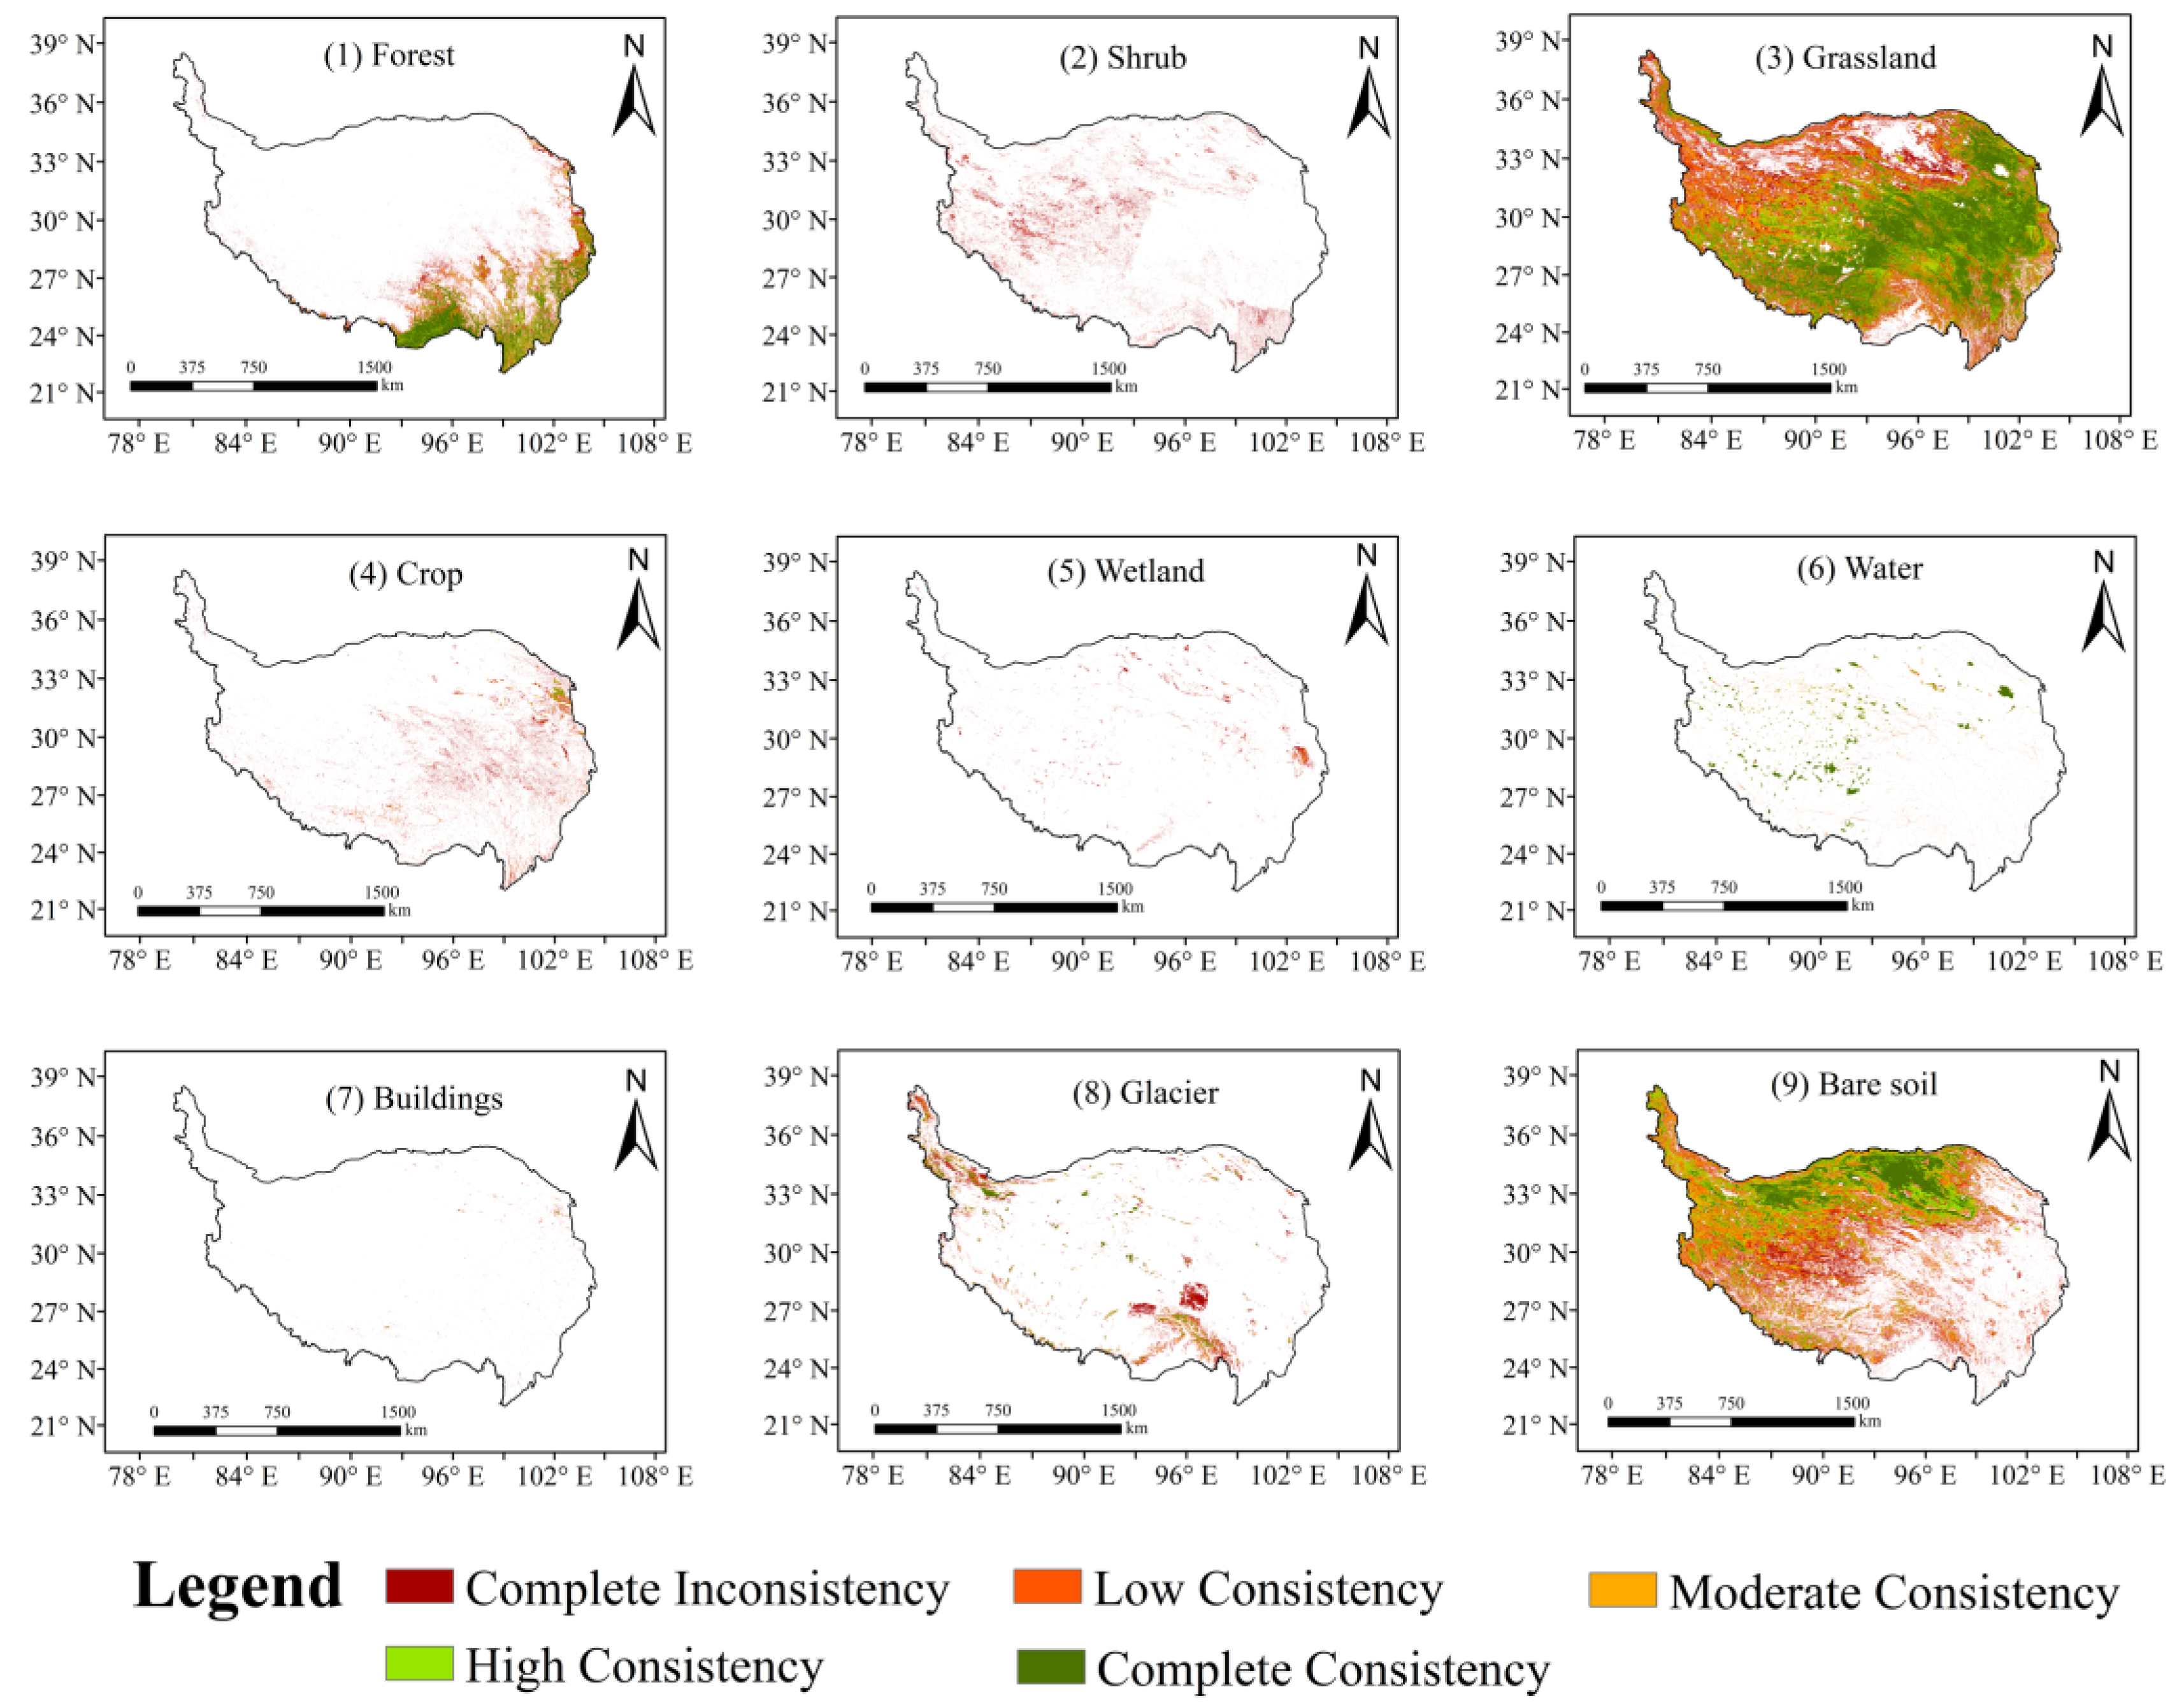
Statistically, 43.72% of the total area is completely consistent for the five LC products on the TP. The chief LCs are grass, bare soil, forest, and water in these areas (Figure 7). Highly consistent areas accounted for 27.753% of the total area, and the dominant LC types are grass, bare soil, forest, and water in these areas. The areas with moderate consistency account for 25.494% of the TP region, and are dominated by bare soil, grass, and buildings. The low-consistency areas only account for 3.021%, including bare soil, grass, buildings, and so on. There are scarcely any completely inconsistent of areas in all regions (0.008%), and those that do exist are mainly attributed to shrub, wetland, and crop (Table 8).

Figure 7.
Spatial consistency distribution with individual LC types in the TP.
Table 8.
The proportion of the degree of consistency in different LC datasets.
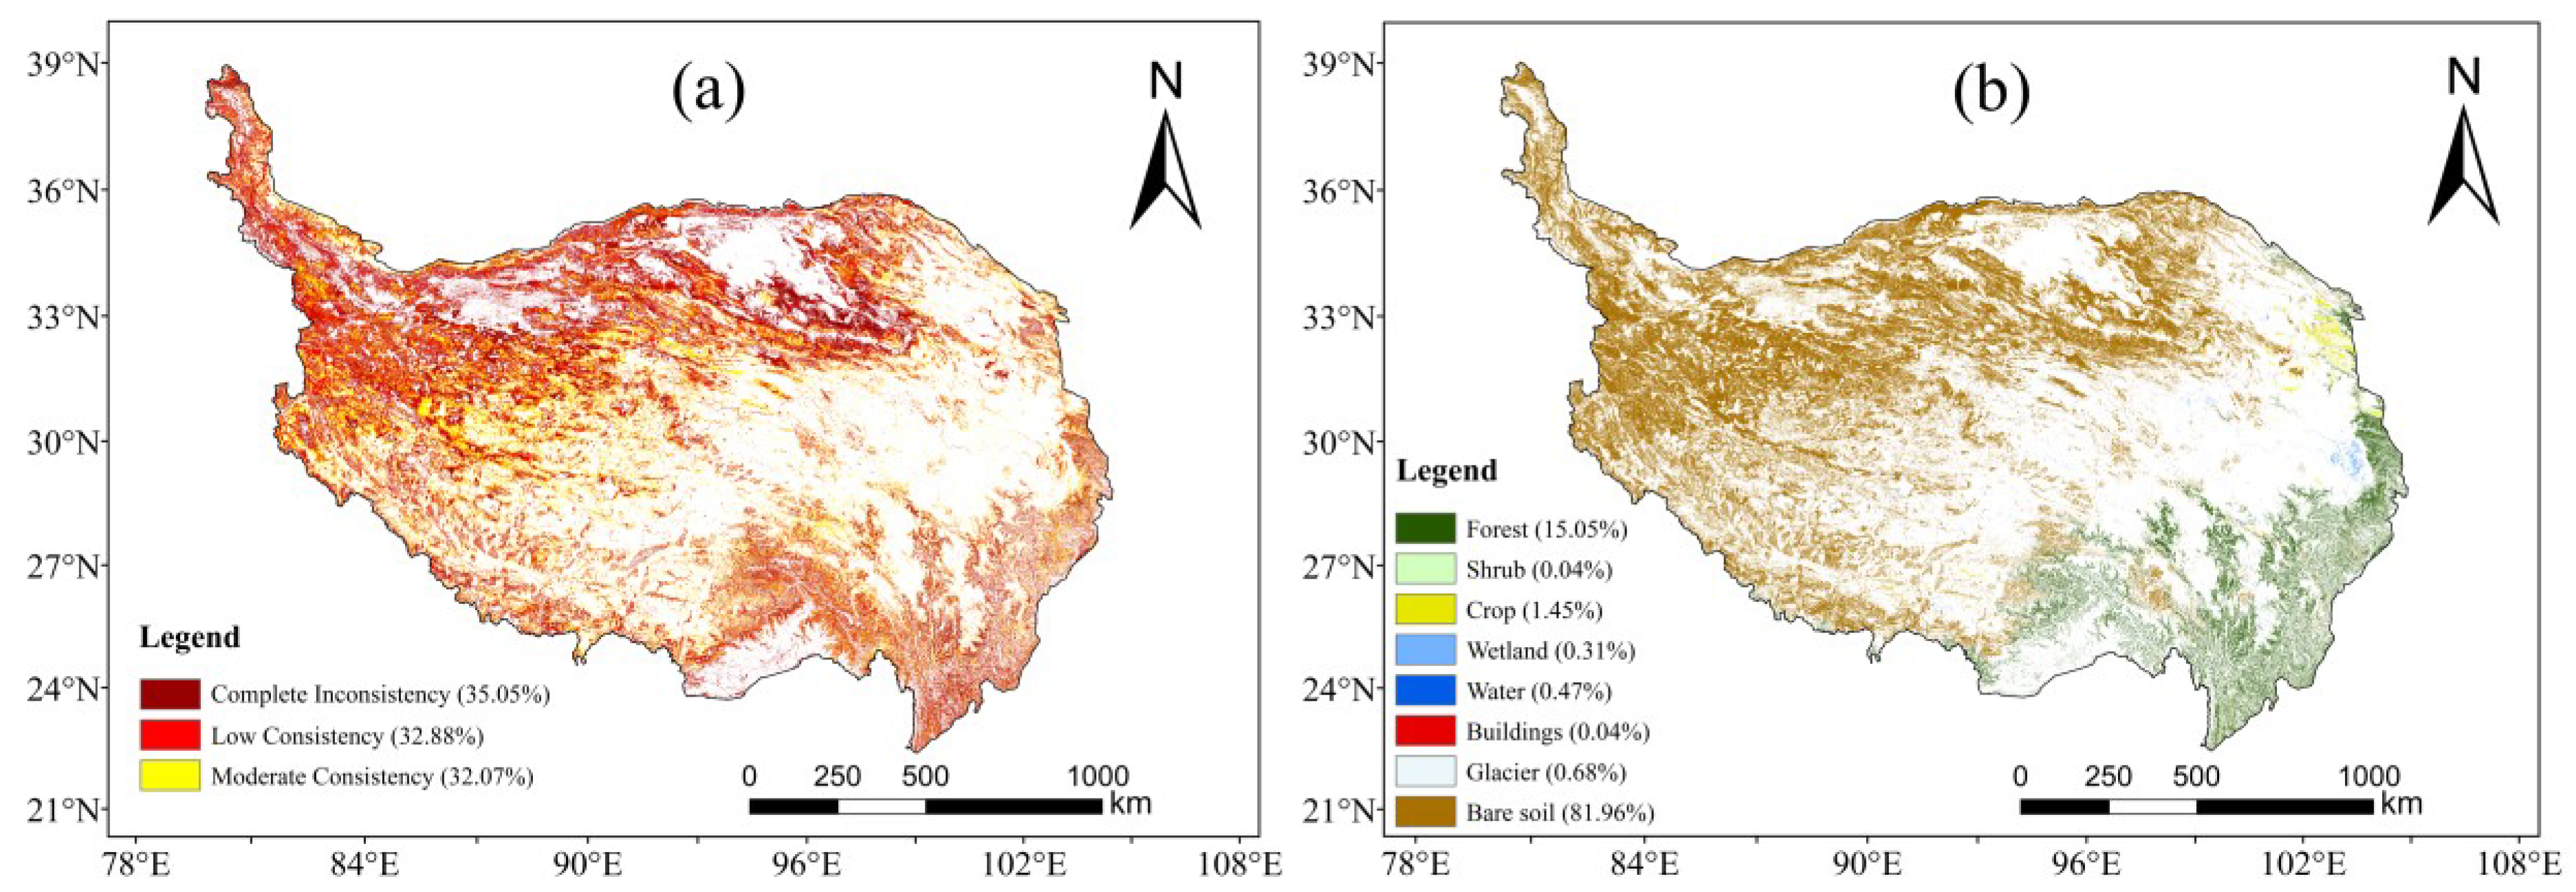
We specifically analyzed the spatial distribution of low-to-medium consistency areas of grass types, shown in in Figure 8. From Figure 8a and Table 8, the low- and medium-inconsistency regions in the TP account for a larger proportion of grass cover types, reaching 47.06%. Among the three types of regions of complete inconsistency, low consistency, and medium consistency, the region of complete inconsistency has the largest proportion. Areas of low to medium consistency are mainly found on the fringes of grass, at the interface with other land cover types. This suggests that there is still a large uncertainty in identifying grass for these five land cover products, particularly in the interface between grass and other types of LC. Figure 8b shows the land cover types other than grass counted in these areas of low to medium consistency. It can be seen that in most of the northern and western areas of the TP, the low to medium consistency of grass is mainly due to the five LC products identifying bare soil. In the southeastern part of the plateau, it is mainly due to the identification of forest.
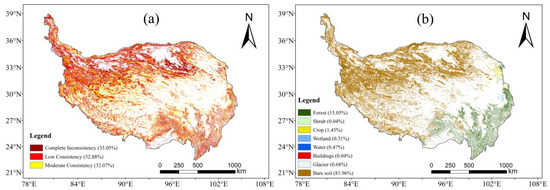
Figure 8.
Spatial distribution of low and moderate consistency in grass identified by five land cover products (a), and other land cover types besides grass (b).
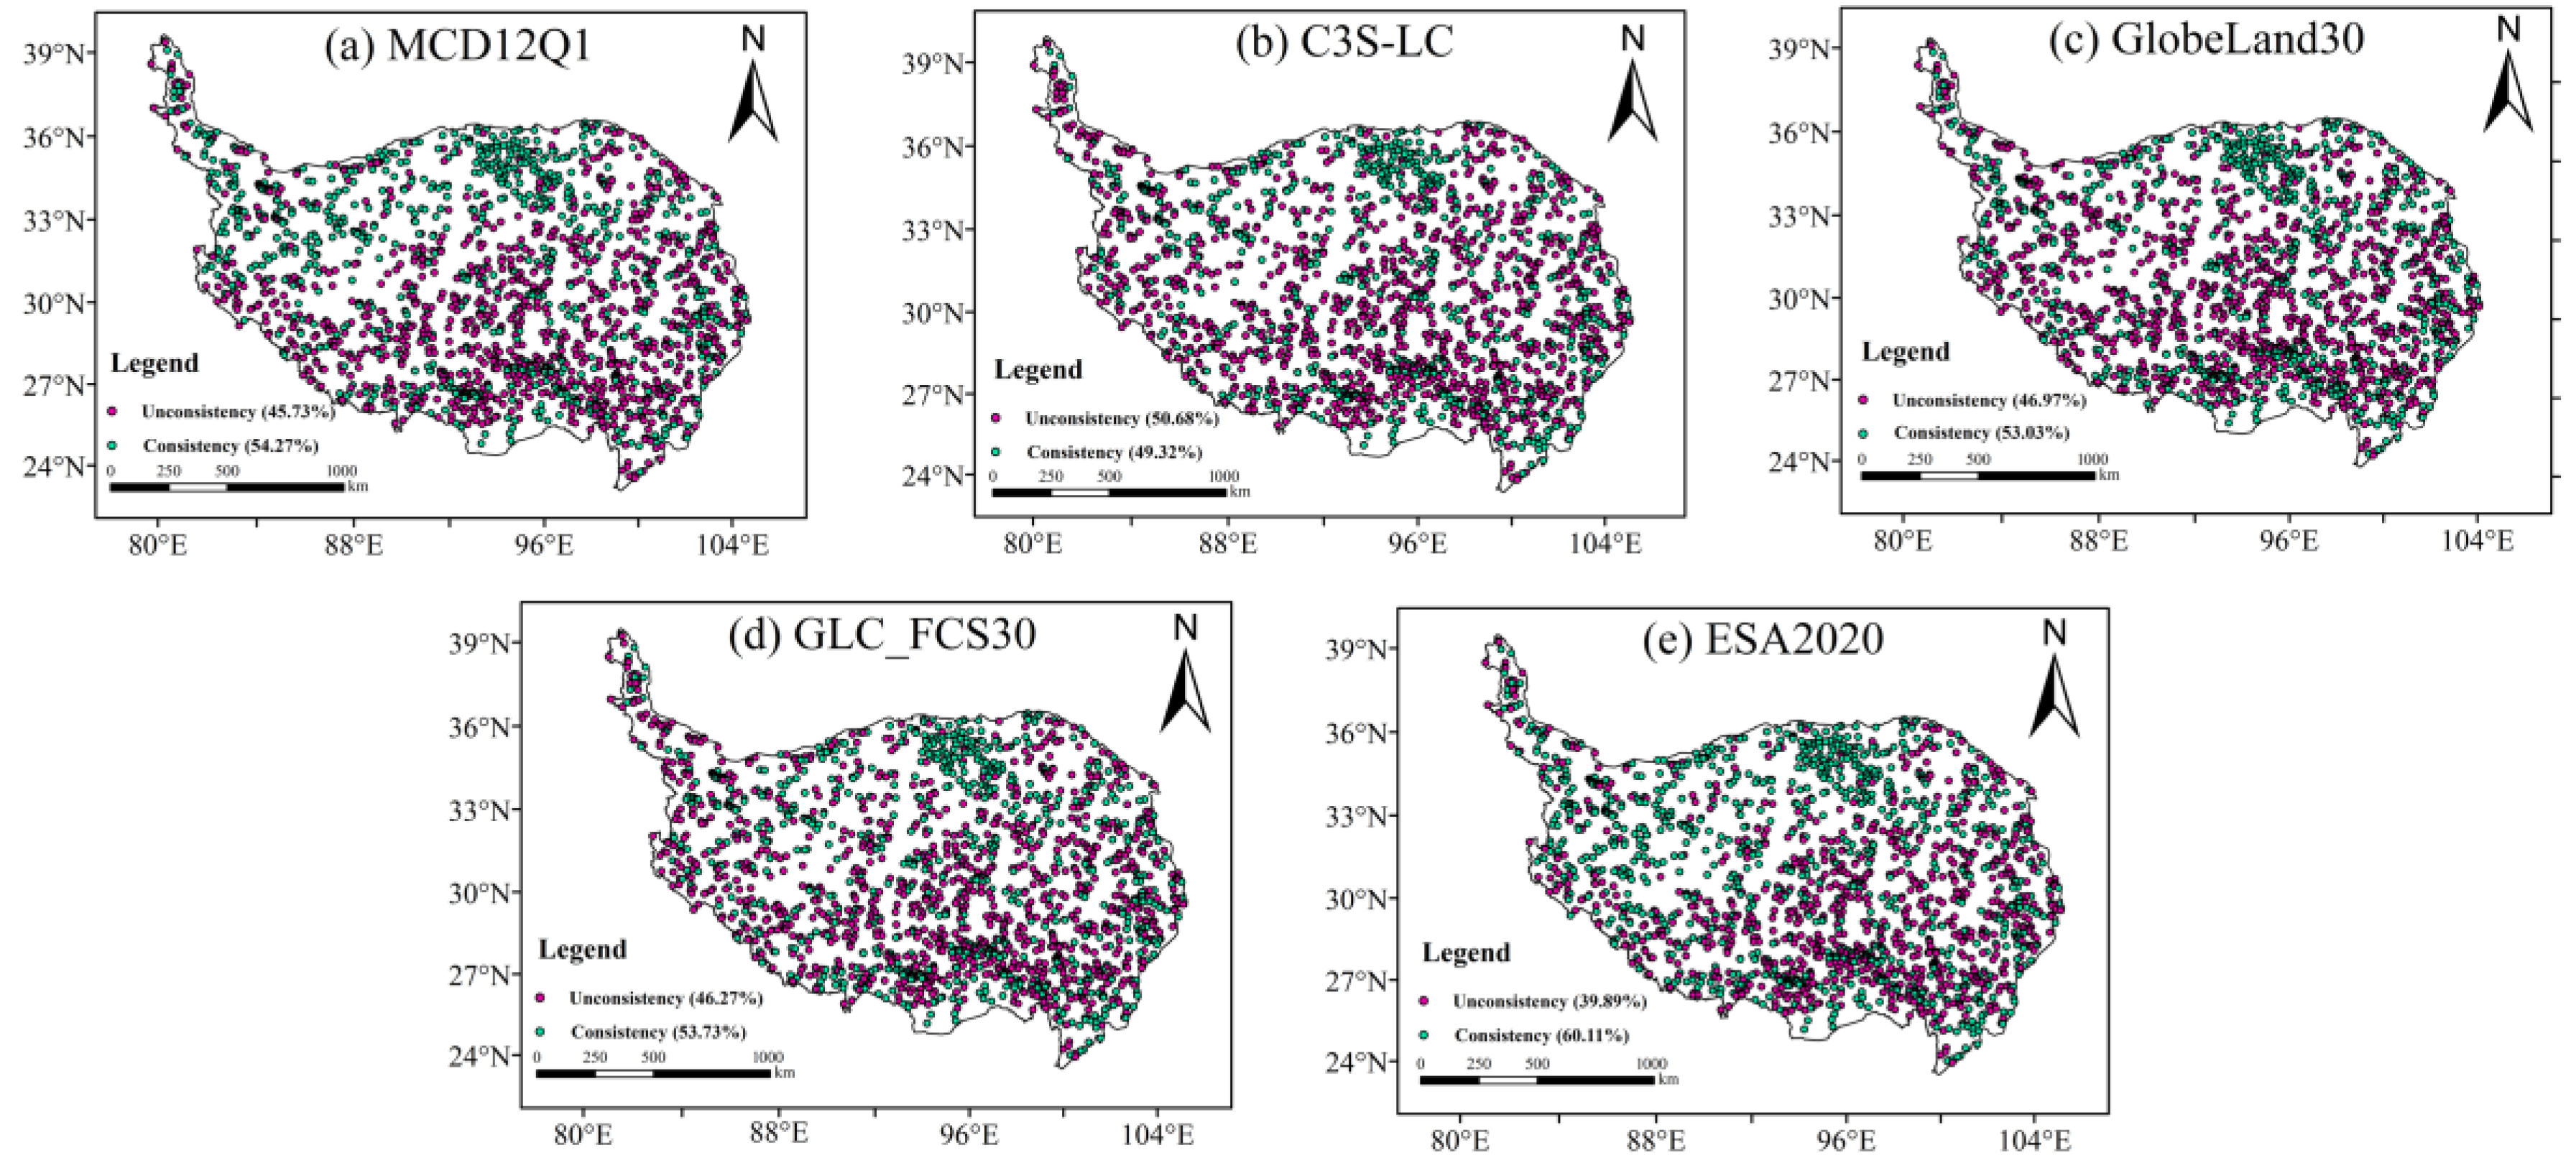
Furthermore, maps of consistency between each compared LC dataset and the reference data are shown in Figure 9. Among all map pairs, the ESA2020 dataset agrees best with the reference dataset in that the spatial consistency takes up about 60.11%, followed by MCD12Q1 (54.27%), GLC_FCS30 (53.73%), and GlobeLand30 (53.03%) in descending order of consistency; the C3S-LC shows the poorest agreement with reference dataset at about 49.32% consistency. Spatially, areas displaying consistency between these datasets are predominantly observed in the central-northern parts of the TP. From Figure 3, we can see that the main LC type in this region is continuous bare ground. This indicates that these LC datasets have a high accuracy in identifying continuous homogeneous bare soil.

Figure 9.
Spatial consistency distribution between different LC datasets and reference validation samples in the TP.
3.4. Consistency Analysis of Spatial Distribution
The accuracy of five LC products was evaluated against reference verification samples (Geo-Wiki, GLCVSS, GOFC-GOLD, USGS). Table 9 displays the results of the accuracy assessment. The OA and Kappa for ESA2020 are largest over the total LC datasets, at 60.11% and 0.45, respectively. Followed by the MCD12Q1 (54.29%/0.35), GLC_FCS30 (53.73%/0.38), and GlobeLand30 (53.03%/0.36) with the OA and Kappa coefficients. Among all LC datasets, C3S-LC had the worst OA and Kappa of 49.32% and 0.31, respectively.
Table 9.
The evaluation results for accuracy are based on reference validation.
Different LC products offer their own strengths within a single category. For the PA, grass has the highest PA in the individual LC dataset, reaching over 81.94%~88.52%. For forest, four LC products have a higher PA of 70.00%~74.74%, excepting MCD12Q1. For glacier, the five LC products each have a PA ranging from 59.80% to 77.45%. For bare soil, the five LC products each have a lower PA ranging from 28.11% to 56.85%. The PA of the shrub and the wetland products is lower than 1.86% and 14.29%, respectively. Moreover, the PA of the buildings is 0% for each LC product.
For each type of accuracy, the MCD12Q1 dataset has the highest UA of 100% for the crop, while UA is just 2.3%~34.78% for other products. For glacier, the five LC products each have a higher UA of 77.39%~90.15%. For bare soil, the five LC products each have a UA ranging from 62.97% to 77.80%. For forest, the UAs of all the products exceed 55%. Grass has the lower UA in the individual LC dataset, reaching 40.00%~48.51%. The UAs of the shrub and the wetland products with GlobeLand30 are 11.11% and 7.69%, respectively, while the UAs of the other four products are 0%. Additionally, the UA of buildings is 0% or a missing value for each LC product.
4. Discussion
Given that the TP is famous as “the roof of the world”, its land cover reflects the surface natural environment. The evaluation of remote sensing LC products can offer invaluable reference for relevant research works. In this article, we conducted a thorough analysis and evaluation of five accessible LC products.
4.1. Inconsistent Factors and Its Potential Reasons
The TP is a vital ecological safety barrier zone in China and a key region for global biodiversity conservation [55,56]. Therefore, the spatial extent, area, and distribution of grass, bare soil, forest, and water in the TP holds significant strategic importance for enhancing the stability of the plateau’s ecological security barrier functions. Comparing these results with a previous study, we agree that the LC types of the TP exhibit a comparable distribution across various products, and that the forest area is smaller compared to grass and bare soil [51]. The complete and high consistency of five distinct LC products accounted for 71.48% of the total area proportion. In terms of LC types, water, grass, and forest exhibited high levels of accuracy. However, significant deviations were observed among the other LC types. For example, the evaluation indicated that the shrub, wetland, crop, and glacier types displayed extremely poor consistency (with areas showing complete inconsistency and low consistency of these LC types accounting for 99.98%, 96.40%, 91.26%, 88.2%, and 68.86%, respectively). This discrepancy may arise from variances in satellite data sources, processing methods, definition of LC type, and classification schemes [27,32,57,58]. Over the past few decades, numerous sensors have been mounted on a series of satellites that are designed to detect and measure different forms of energy and signals emitted from the Earth’s surface. For example, the Aqua and Terra satellites are equipped with MODIS, while Landsat 4/5 has the Thematic Mapping sensor, Landsat 7 features the Enhanced Thematic Mapper Plus, and Landsat 8 is equipped with the Operational Land Imager. Additionally, the Sentinel-1 carries the SAR-C, the Sentinel-2 has the MultiSpectral Instrument, and the Ocean and Land Colour Instrument is installed on the Sentinel-3 [22,45,46]. This wide variety of sensors encompasses a diverse range of bands and resolutions. In addition, elevation heterogeneity may influence the consistency of different LC products. For example, some researchers have indicated that higher elevations pose greater challenges in monitoring and detecting LC inconsistencies [38,59]. The low-altitude areas are characterized by fairly flat terrain and homogeneous vegetation, while the high-altitude areas exhibit complex topography with heterogeneous features at various resolutions, which may result in increased inconsistency among different LC products.
At the same time, the five LC datasets utilized in this study have different resolutions, projected coordinates, and land classification schemes. For facilitating convenient interoperability and cross-comparison among the five different products, during the data preprocessing process, we used the maximum area aggregation to harmonize data of various resolutions to a 500 m resolution. The coordinate systems and projections of all products were unified. The classification schemes of all products were converted into nine standardized LC types [51]. Although all of these preprocessing processes are commonly used when making land cover comparisons [37,60], they may introduce some uncertainty. For instance, in MCD12Q1, shrub includes closed shrubs. In C3S-LC and GLC_FCS30, shrub is classified as evergreen shrub or deciduous shrub. In both GlobeLand30 and ESA2020, there is only a single classification of shrubs but with different definitions. Specifically, shrub in GlobeLand30 is defined as land covered by shrubs with an excess of 30% shrub cover, including mountain shrub, deciduous and evergreen shrub, and desert shrub with more than 10% coverage in desert areas. In contrast, the ESA2020 shrub classification pertains to geographical regions primarily characterized by the predominant presence of natural shrubs, with a minimum vegetation cover of 10% [25]. The LC classification schemes and type definitions on a global scale inevitably influence the application and analysis of LC products in local areas, particularly the unique plateau area of the TC. Moreover, the distinction between grass and shrub based on vegetation canopy thresholds could directly impact their classification, and bare soil, shrub, and various other forms of LC types exhibit a high degree of similarity [26]. Therefore, it is necessary to minimize the ambiguities and uncertainties in each LC type, specifically regarding the vegetation coverage and the threshold of vegetation canopy of forest, grass, and shrub.
4.2. Uncertainties of the Different Reference Validation Samples
A reliable and accessible validation database serves as the fundamental basis for comparing the accuracies of different LC products during a validation process. Furthermore, it is imperative to acknowledge that the assessment accuracy results are significantly influenced by both the reliability and number of reference verification samples [61]. The utilization of Geo-Wiki, GLCVSS, GOFC-GOLD, and USGS verification samples in this study was constrained by sample point number, and potential uncertainties associated with the samples themselves were not considered, resulting in certain inaccuracies in the evaluation results. Firstly, these samples used in this study have different classification schemes (as shown in Table 3); for example, the different verification reference datasets encompass 10, 24, 11, and 7 distinct land cover types, respectively. After the reclassification processing of these four global validation sample datasets for the study area, the various LC types were reclassified into nine types in accordance with the five unified LC products. Secondly, the samples from various reference datasets were collected in different years and with varying field sizes. For instance, the reference competitions of the Geo-Wiki platform were sampled in 2012, the dataset of GLCVSS was sampled in 2015, the GOFC-GOLD reference data portal was last updated in 2015, and a circa 2010 USGS reference dataset was released in 2022. A time mismatch between the land cover products and these reference datasets may affect the results of the evaluation. For example, for land cover types that are sensitive to climate change and human activities, such as glacier, crop and buildings, time mismatches can introduce uncertainty into the evaluation results. Considering that there is little human activity on the TP and that the land cover changes relatively slowly, we believe that the time mismatch has a limited impact on the evaluation results. Therefore, these reference data are reliable until new data become available. Furthermore, the integration of four reference datasets comprises a total of 2599 samples within the study area. Although this sample size may be adequate for accuracy assessment on a regional scale, it might prove insufficient for inevitable LC types. According to the statistics, the number of samples collected from grass and bare soil were 775 and 964, respectively. However, there was a significantly lower counts of samples for crop, wetland, and water, with only 23, 8, and 15 samples, respectively. It is worth mentioning that the validation points varied across diverse land cover types. Therefore, recognition of the value of renewing and increasing sample data should be emphasized. We strongly recommend using an adequate number of samples to validate the accurateness of individual LC types. Additionally, the use of integrated validation samples in this study may be subject to interpretation bias [49].
Overall, the details of the four reference sample datasets are substantially different, leading to uncertainties in the accuracy evaluation. To establish a precise and standardized reference database for the TP at a regional scale, more comprehensive and diverse samples need to be updated. In particular, it is crucial to establish more robust samples pertaining to wetland, crop, and buildings. In addition, reference points should be added for inconsistent areas in grassland, which can supply a reliable foundation for the protection of alpine grassland ecosystems.
4.3. Recommendations for Users and Suggestions for Future LC Mapping
From the results, we found that the OA of all LC products was less than 61%. Moreover, the PA and UA values were obtained from the confusion matrices and computed by comparison with reference samples. The accuracy of individual classes in the five LC products was summarized based on the validation results for individual classes, and recommendations were provided for the utilization of each individual class. Our validation criteria require 50% of both UA and PA for a single category. Forest, grass, water, glacier, and bare soil in the five LC products met our validation standards. Table 10 gives recommendations for the best data products that can be selected when studying different land use types on the TP. For instance, when studying types such as forest, crop, water, and glacier, we recommend choosing the MCD12Q1. When studying grass, we recommend EAS2020. In addition, GLC_FCS30 is excellent at delineating bare soil.
Table 10.
Recommendations for the best data products that can be selected for different land use types on the TP.
The five different LC datasets are all derived from global-scale sources, and their application in a regional area is inevitably influenced by these global LC products when applied to the study area. The accuracies for the LC types of five LC products covering the TP were relatively low, especially for shrub, wetland, and buildings. Hence, certain improvements are required, including the following: (1) The extensive areas of grass, bare soil, and forest can be easily distinguished, while the overlapping distributions of wetland and shrub raise the level of complexity in remote sensing and monitoring. Therefore, it is crucial to explicitly specify factors such as vegetation coverage and tree height in the uncertainty arising from the classification when establishing a classification system for extracting shrub and wetland areas. (2) Classification of buildings is a great challenge due to the limited dimensions of patches, the high aggregation, and high internal heterogeneity. Prior research has demonstrated the efficacy of utilizing night-time light data for the efficient identification and extraction of areas designated for construction purposes [62]. In future, night-time light data could thus be integrated into the development of universally applicable LC products.
5. Conclusions
To offer a reliable guide for LC data selection for ecological and climate change studies at the TP, the performance and consistency of five LC products from satellite remote sensing datasets, including MCD12Q1, C3S-LC, GlobeLand30, GLC_FCS30, and ESA2020 at a 500 m spatial resolution, were assessed through areal comparison, error matrix evaluation, and spatial confusion methods. The key conclusions are the following:
These multiple sets of LC products are largely consistent with the land cover type composition and spatial patterns in the TP, while some discrepancies exist in the details. The composition of each LC product is mainly grass, followed by bare soil, forest, and others. For areal consistency, the correlation coefficients between most of the different LC datasets are above 0.9, except for the coefficients between C3S-LC/GLC_FCS30 and ESA2020 (0.831/0.896).
Regarding the level of confusion in LC types over the different LC datasets, water, buildings, and glaciers have a low confusion with other LC types. Consistency analysis of the five LC products demonstrates the percentage of areas with complete and high consistency to be 43.724% and 27.753%, respectively, and these areas are primarily in regions characterized by limited surface heterogeneity and a greater prevalence of uniform land cover categories.
Based on aggregated reference verification samples (Geo-Wiki, GLCVSS, GOFC-GOLD, and USGS), the OA of ESA2020 is the highest over the total LC datasets, at 60.11%, followed by MCD12Q1 (54.29%), GLC_FCS30 (53.73%), and GlobeLand30 (53.03%), and the OA of C3S-LC is the lowest (49.32%). Based on the UA levels, we suggest using EAS2020 for grass studies, GLC_FC30 for bare soil studies, GlobeLand30 for wetland and shrub studies, and MCD12Q1 for other LC types.
Overall, the five land cover products are generally accurate in areas of continuous homogeneous land cover on the plateau, particularly in the largest grassland areas. However, their accuracy is lower in the transition areas, and additional reference points are needed to improve the accuracy in these areas. In addition, some studies have proven the impacts of topography on LC classification [63,64]. Under the combined effect of nature and human activities, LC types show a topographic gradient effect. Therefore, in future studies, LC types can be manually categorized according to topography as a means of generating more accurate land use data.
Author Contributions
Conceptualization, methodology, formal analysis, writing draft, Y.P. and D.W.; software, D.W.; review and editing, X.L., H.H. and Y.L.; funding support, Y.P. and D.W.; supervision, D.W. All authors have read and agreed to the published version of the manuscript.
Funding
This work was supported by the National Natural Science Foundation of China (42275092) and Open Research Fund Program of Plateau Atmosphere and Environment Key Laboratory of Sichuan Province (PAEKL-2023-K03).
Data Availability Statement
MCD12Q1 is from the National Aeronautics and Space Administration (NASA) (https://ladsweb.modaps.eosdis.nasa.gov, accessed on 8 January 2023); C3S-LC is from the European Space Agency (ESA) (https://www.esa-landcover-cci.org, accessed on 2 January 2023); GlobeLand30 is from the National Geomatics Center of China (NGCC) (http://www.globallandcover.com, accessed on 20 January 2023); GLC_FCS30 is from the Aerospace Information Research Institute, Chinese Academy of Sciences (AIR, CAS) (https://data.casearth.cn/sdo/detail/5fbc7904819aec1ea2dd7061, accessed on 25 January 2023); ESA World Cover 2020 (ESA2020) is from the European Space Agency (ESA) (https://esa-worldcover.org/en, accessed on 16 January 2023). The Geo-Wiki Global Validation Sample Set is from the Geo-Wiki crowdsourcing platform (https://zenodo.org/communities/geo-wiki, accessed on 6 February 2023), the Global Land Cover Validation Sample Set is from the Zendo (https://zenodo.org/record/3551995, accessed on 10 February 2023), the Global Observation for Forest Cover and Land Dynamics (GOFC-GOLD) is from the GOFC-GOLD land cover project office (http://www.gofcgold.wur.nl/sites/gofcgold_refdataportal.php, accessed on 15 February 2023), the US Geological Survey (USGS) Global Land Cover Reference Dataset is from the USGS ScienceBase platform (https://www.sciencebase.gov/catalog/item/6116c890d34e3267c611bfdd, accessed on 21 February 2023).
Acknowledgments
We thank the anonymous reviewers and editors for their valuable comments and suggestions, which significantly improved the quality of the paper.
Conflicts of Interest
The authors declare no conflicts of interest.
References
- Miehe, G.; Schleuss, P.-M.; Seeber, E.; Babel, W.; Biermann, T.; Braendle, M.; Chen, F.; Coners, H.; Foken, T.; Gerken, T.; et al. The Kobresia Pygmaea Ecosystem of the Tibetan Highlands—Origin, Functioning and Degradation of the World’s Largest Pastoral Alpine Ecosystem: Kobresia Pastures of Tibet. Sci. Total Environ. 2019, 648, 754–771. [Google Scholar] [CrossRef] [PubMed]
- Qin, Y.; Yi, S.; Ren, S.; Li, N.; Chen, J. Responses of Typical Grasslands in a Semi-Arid Basin on the Qinghai-Tibetan Plateau to Climate Change and Disturbances. Environ. Earth Sci. 2014, 71, 1421–1431. [Google Scholar] [CrossRef]
- Li, M.; Zhang, X.; He, Y.; Niu, B.; Wu, J. Assessment of the Vulnerability of Alpine Grasslands on the Qinghai-Tibetan Plateau. PeerJ 2020, 8, e8513. [Google Scholar] [CrossRef] [PubMed]
- Gong, P.; Liu, H.; Zhang, M.; Li, C.; Wang, J.; Huang, H.; Clinton, N.; Ji, L.; Li, W.; Bai, Y.; et al. Stable Classification with Limited Sample: Transferring a 30-m Resolution Sample Set Collected in 2015 to Mapping 10-m Resolution Global Land Cover in 2017. Sci. Bull. 2019, 64, 370–373. [Google Scholar] [CrossRef]
- Erb, K.H.; Luyssaert, S.; Meyfroidt, P.; Pongratz, J.; Don, A.; Kloster, S.; Kuemmerle, T.; Fetzel, T.; Fuchs, R.; Herold, M.; et al. Land Management: Data Availability and Process Understanding for Global Change Studies. Glob. Change Biol. 2017, 23, 512–533. [Google Scholar] [CrossRef]
- Liu, L.; Zhang, X.; Gao, Y.; Chen, X.; Shuai, X.; Mi, J. Finer-Resolution Mapping of Global Land Cover: Recent Developments, Consistency Analysis, and Prospects. J. Remote Sens. 2021, 2021, 5289697. [Google Scholar] [CrossRef]
- Li, H.; Zhang, H.; Mamtimin, A.; Fan, S.; Ju, C. A New Land-Use Dataset for the Weather Research and Forecasting (WRF) Model. Atmosphere 2020, 11, 350. [Google Scholar] [CrossRef]
- Li, D.; Tian, P.; Luo, H.; Hu, T.; Dong, B.; Cui, Y.; Khan, S.; Luo, Y. Impacts of Land Use and Land Cover Changes on Regional Climate in the Lhasa River Basin, Tibetan Plateau. Sci. Total Environ. 2020, 742, 140570. [Google Scholar] [CrossRef] [PubMed]
- Pan, Y.; Li, X.; Wang, D.; Li, S.; Wen, L. Impacts of Land Use/Land Cover Distributions on Permafrost Simulations on Tibetan Plateau. Remote Sens. 2023, 15, 5586. [Google Scholar] [CrossRef]
- Lal, P.; Shekhar, A.; Kumar, A. Quantifying Temperature and Precipitation Change Caused by Land Cover Change: A Case Study of India Using the WRF Model. Front. Environ. Sci. 2021, 9, 766328. [Google Scholar] [CrossRef]
- Turner, B.L.; Lambin, E.F.; Reenberg, A. The Emergence of Land Change Science for Global Environmental Change and Sustainability. Proc. Natl. Acad. Sci. USA 2007, 104, 20666–20671. [Google Scholar] [CrossRef]
- Haack, B.; English, R. National Land Cover Mapping by Remote Sensing. World Dev. 1996, 24, 845–855. [Google Scholar] [CrossRef]
- Hao, X.; Qiu, Y.; Jia, G.; Menenti, M.; Ma, J.; Jiang, Z. Evaluation of Global Land Use–Land Cover Data Products in Guangxi, China. Remote Sens. 2023, 15, 1291. [Google Scholar] [CrossRef]
- Yang, Y.; Xiao, P.; Feng, X.; Li, H. Accuracy Assessment of Seven Global Land Cover Datasets over China. ISPRS J. Photogramm. Remote Sens. 2017, 125, 156–173. [Google Scholar] [CrossRef]
- Ding, Y.; Yang, X.; Wang, Z.; Fu, D.; Li, H.; Meng, D.; Zeng, X.; Zhang, J. A Field-Data-Aided Comparison of Three 10 m Land Cover Products in Southeast Asia. Remote Sens. 2022, 14, 5053. [Google Scholar] [CrossRef]
- Loveland, T.R.; Reed, B.C.; Ohlen, D.O.; Brown, J.F.; Zhu, Z.; Yang, L.; Merchant, J.W. Development of a Global Land Cover Characteristics Database and IGBP DISCover from 1 Km AVHRR Data. Int. J. Remote Sens. 2000, 21, 1303–1330. [Google Scholar] [CrossRef]
- Hansen, M.C.; Sohlberg, R.; Defries, R.S.; Townshend, J.R.G. Global Land Cover Classification at 1 Km Spatial Resolution Using a Classification Tree Approach. Int. J. Remote Sens. 2000, 21, 1331–1364. [Google Scholar] [CrossRef]
- Bartholomé, E.; Belward, A.S. GLC2000: A New Approach to Global Land Cover Mapping from Earth Observation Data. Int. J. Remote Sens. 2005, 26, 1959–1977. [Google Scholar] [CrossRef]
- Friedl, M.A.; McIver, D.K.; Hodges, J.C.F.; Zhang, X.Y.; Muchoney, D.; Strahler, A.H.; Woodcock, C.E.; Gopal, S.; Schneider, A.; Cooper, A.; et al. Global Land Cover Mapping from MODIS: Algorithms and Early Results. Remote Sens. Environ. 2002, 83, 287–302. [Google Scholar] [CrossRef]
- Defourny, P.; Bontemps, S.; Lamarche, C.; Brockmann, C.; Boettcher, M.; Wevers, J.; Kirches, G.; Santoro, M. Land Cover CCI Product User Guide—Version 2.0; ESA: Paris, France, 2017. [Google Scholar]
- Bontemps, S.; Defourny, P.; Van Bogaert, E.; Kalogirou, V.; Perez, J.R. GLOBCOVER 2009 Products Description and Validation Report; MEDIAS-France: Toulouse, France, 2011; Volume 136. [Google Scholar]
- Chen, J.J.; Chen, J.J.; Liao, A.; Cao, X.; Chen, L.; Chen, X.; He, C.; Han, G.; Peng, S.; Lu, M.; et al. Global Land Cover Mapping at 30 m Resolution: A POK-Based Operational Approach. ISPRS J. Photogramm. Remote Sens. 2015, 103, 7–27. [Google Scholar] [CrossRef]
- Zhang, X.; Liu, L.; Chen, X.; Gao, Y.; Xie, S.; Mi, J. GLC_FCS30: Global Land-Cover Product with Fine Classification System at 30 m Using Time-Series Landsat Imagery. Earth Syst. Sci. Data 2021, 13, 2753–2776. [Google Scholar] [CrossRef]
- Gong, P.; Wang, J.; Yu, L.; Zhao, Y.Y.; Zhao, Y.Y.; Liang, L.; Niu, Z.; Huang, X.; Fu, H.; Liu, S.; et al. Finer Resolution Observation and Monitoring of Global Land Cover: First Mapping Results with Landsat TM and ETM+ Data. Int. J. Remote Sens. 2013, 34, 2607–2654. [Google Scholar] [CrossRef]
- Zanaga, D.; Van De Kerchove, R.; De Keersmaecker, W.; Souverijns, N.; Brockmann, C.; Quast, R.; Wevers, J.; Grosu, A.; Paccini, A.; Vergnaud, S.; et al. ESA WorldCover 10 m 2020 v100. Zenodo. 2021. Available online: https://zenodo.org/record/5571936#.YrV38HZByUk (accessed on 16 January 2023).
- Karra, K.; Kontgis, C.; Statman-Weil, Z.; Mazzariello, J.C.; Mathis, M.; Brumby, S.P. Global Land Use/Land Cover with Sentinel 2 and Deep Learning. In Proceedings of the International Geoscience and Remote Sensing Symposium (IGARSS), Brussels, Belgium, 11–16 July 2021; IEEE: Piscataway, NJ, USA, 2021; Volume 2021, pp. 4704–4707. [Google Scholar]
- Gao, Y.; Liu, L.; Zhang, X.; Chen, X.; Mi, J.; Xie, S. Consistency Analysis and Accuracy Assessment of Three Global 30-m Land-cover Products over the European Union Using the Lucas Dataset. Remote Sens. 2020, 12, 3479. [Google Scholar] [CrossRef]
- Wang, Z.; Mountrakis, G. Accuracy Assessment of Eleven Medium Resolution Global and Regional Land Cover Land Use Products: A Case Study over the Conterminous United States. Remote Sens. 2023, 15, 3186. [Google Scholar] [CrossRef]
- Hua, T.; Zhao, W.; Liu, Y.; Wang, S.; Yang, S. Spatial Consistency Assessments for Global Land-Cover Datasets: A Comparison among GLC2000, CCI LC, MCD12, GLOBCOVER and GLCNMO. Remote Sens. 2018, 10, 1846. [Google Scholar] [CrossRef]
- Quaife, T.; Quegan, S.; Disney, M.; Lewis, P.; Lomas, M.; Woodward, F.I. Impact of Land Cover Uncertainties on Estimates of Biospheric Carbon Fluxes. Global Biogeochem. Cycles 2008, 22, 4. [Google Scholar] [CrossRef]
- Wang, H.; Yan, H.; Hu, Y.; Xi, Y.; Yang, Y. Consistency and Accuracy of Four High-Resolution LULC Datasets—Indochina Peninsula Case Study. Land 2022, 11, 758. [Google Scholar] [CrossRef]
- Congalton, R.G.; Gu, J.; Yadav, K.; Thenkabail, P.; Ozdogan, M. Global Land Cover Mapping: A Review and Uncertainty Analysis. Remote Sens. 2014, 6, 12070–12093. [Google Scholar] [CrossRef]
- Wu, W.; Shibasaki, R.; Yang, P.; Ongaro, L.; Zhou, Q.; Tang, H. Validation and Comparison of 1 Km Global Land Cover Products in China. Int. J. Remote Sens. 2008, 29, 3769–3785. [Google Scholar] [CrossRef]
- Ran, Y.; Li, X.; Lu, L. Evaluation of Four Remote Sensing Based Land Cover Products over China. Int. J. Remote Sens. 2010, 31, 391–401. [Google Scholar] [CrossRef]
- Liu, S.; Xu, Z.; Guo, Y.; Yu, T.; Xu, F.; Wang, Y. Consistency Analysis of Multi-Source Remote Sensing Land Cover Products in Arid Regions—A Case Study of Xinjiang. Land 2023, 12, 2178. [Google Scholar] [CrossRef]
- Giri, C.; Zhu, Z.; Reed, B. A Comparative Analysis of the Global Land Cover 2000 and MODIS Land Cover Data Sets. Remote Sens. Environ. 2005, 94, 123–132. [Google Scholar] [CrossRef]
- Bai, Y.; Feng, M.; Jiang, H.; Wang, J.; Zhu, Y.; Liu, Y. Assessing Consistency of Five Global Land Cover Data Sets in China. Remote Sens. 2014, 6, 8739–8759. [Google Scholar] [CrossRef]
- Wang, L.; Jin, J. Uncertainty Analysis of Multisource Land Cover Products in China. Sustainability 2021, 13, 8857. [Google Scholar] [CrossRef]
- Xu, Y.; Yu, L.; Feng, D.; Peng, D.; Li, C.; Huang, X.; Lu, H.; Gong, P. Comparisons of Three Recent Moderate Resolution African Land Cover Datasets: CGLS-LC100, ESA-S2-LC20, and FROM-GLC-Africa30. Int. J. Remote Sens. 2019, 40, 6185–6202. [Google Scholar] [CrossRef]
- Kang, J.; Yang, X.; Wang, Z.; Cheng, H.; Wang, J.; Tang, H.; Li, Y.; Bian, Z.; Bai, Z. Comparison of Three Ten Meter Land Cover Products in a Drought Region: A Case Study in Northwestern China. Land 2022, 11, 427. [Google Scholar] [CrossRef]
- Laso Bayas, J.C.; Lesiv, M.; Waldner, F.; Schucknecht, A.; Duerauer, M.; See, L.; Fritz, S.; Fraisl, D.; Moorthy, I.; McCallum, I.; et al. A Global Reference Database of Crowdsourced Cropland Data Collected Using the Geo-Wiki Platform. Sci. Data 2017, 4, 170136. [Google Scholar] [CrossRef] [PubMed]
- Cui, X.; Graf, H.F. Recent Land Cover Changes on the Tibetan Plateau: A Review. Clim. Change 2009, 94, 47–61. [Google Scholar] [CrossRef]
- Yang, K.; Wu, H.; Qin, J.; Lin, C.; Tang, W.; Chen, Y. Recent Climate Changes over the Tibetan Plateau and Their Impacts on Energy and Water Cycle: A Review. Glob. Planet. Change 2014, 112, 79–91. [Google Scholar] [CrossRef]
- Sulla-Menashe, D.; Gray, J.M.; Abercrombie, S.P.; Friedl, M.A. Hierarchical Mapping of Annual Global Land Cover 2001 to Present: The MODIS Collection 6 Land Cover Product. Remote Sens. Environ. 2019, 222, 183–194. [Google Scholar] [CrossRef]
- Sulla-Menashe, D.; Friedl, M.A. User Guide to Collection 6 MODIS Land Cover Dynamics (MCD12Q2) Product; User Guides; NASA EOSDIS Land Processes DAAC: Missoula, MT, USA, 2018; Volume 6, pp. 1–8.
- Liu, L.; Zhang, X. Global Land Cover with Fine Classification System at 30m in 2020 (GLC_FCS30-2020) User Guides; Aerospace Information Research Institute, Chinese Academy of Sciences: Beijing, China, 2020; Volume 2020. [Google Scholar]
- See, L.; Fritz, S.; Perger, C.; Schill, C.; McCallum, I.; Schepaschenko, D.; Duerauer, M.; Sturn, T.; Karner, M.; Kraxner, F.; et al. Harnessing the Power of Volunteers, the Internet and Google Earth to Collect and Validate Global Spatial Information Using Geo-Wiki. Technol. Forecast. Soc. Change 2015, 98, 324–335. [Google Scholar] [CrossRef]
- Fritz, S.; McCallum, I.; Schill, C.; Perger, C.; See, L.; Schepaschenko, D.; van der Velde, M.; Kraxner, F.; Obersteiner, M. Geo-Wiki: An Online Platform for Improving Global Land Cover. Environ. Model. Softw. 2012, 31, 110–123. [Google Scholar] [CrossRef]
- Zhao, Y.; Gong, P.; Yu, L.; Hu, L.; Li, X.; Li, C.; Zhang, H.; Zheng, Y.; Wang, J.; Zhao, Y.; et al. Towards a Common Validation Sample Set for Global Land-Cover Mapping. Int. J. Remote Sens. 2014, 35, 4795–4814. [Google Scholar] [CrossRef]
- Pengra, B.W.; Long, J.; Dahal, D.; Stehman, S.V.; Loveland, T. A circa 2010 Global Land Cover Reference Dataset from Commercial High Resolution Satellite Data; U.S. Geological Survey Data Release; USGS: Reston, VI, USA, 2022.
- Cai, L.; Wang, S.; Jia, L.; Wang, Y.; Wang, H.; Fan, D.; Zhao, L. Consistency Assessments of the Land Cover Products on the Tibetan Plateau. IEEE J. Sel. Top. Appl. Earth Obs. Remote Sens. 2022, 15, 5652–5661. [Google Scholar] [CrossRef]
- Cai, Z.; Sawamoto, T.; Li, C.; Kang, G.; Boonjawat, J.; Mosier, A.; Wassmann, R.; Tsuruta, H.; Cai, C.; Sawamoto, T.; et al. Field Validation of the DNDC Model for Greenhouse Gas Emissions in East Asian Cropping Systems. Global Biogeochem. Cycles 2003, 17, 1107. [Google Scholar] [CrossRef]
- Fung, T.; Ledrew, E. The Determination of Optimal Threshold Levels for Change Detection Using Various Accuracy Indices. Photogramm. Eng. Remote Sens. 1988, 54, 1449–1454. [Google Scholar]
- Canters, F. Evaluating the Uncertainty of Area Estimates Derived from Fuzzy Land-Cover Classification. Photogramm. Eng. Remote Sens. 1997, 63, 403–414. [Google Scholar]
- Kuang, X.; Jiao, J.J. Review on Climate Change on the Tibetan Plateau during the Last Half Century. J. Geophys. Res. 2016, 121, 3979–4007. [Google Scholar] [CrossRef]
- Fu, B.; Ouyang, Z.; Shi, P.; Fan, J.; Wang, X.; Zheng, H.; Zhao, W.; Wu, F. Current Condition and Protection Strategies of Qinghai-Tibet Plateau Ecological Security Barrier. Bull. Chin. Acad. Sci. 2021, 36, 1298–1306. [Google Scholar] [CrossRef]
- Venter, Z.S.; Barton, D.N.; Chakraborty, T.; Simensen, T.; Singh, G. Global 10 m Land Use Land Cover Datasets: A Comparison of Dynamic World, World Cover and Esri Land Cover. Remote Sens. 2022, 14, 4101. [Google Scholar] [CrossRef]
- Gilani, H.; Shrestha, H.L.; Murthy, M.S.R.; Phuntso, P.; Pradhan, S.; Bajracharya, B.; Shrestha, B. Decadal Land Cover Change Dynamics in Bhutan. J. Environ. Manag. 2015, 148, 91–100. [Google Scholar] [CrossRef] [PubMed]
- Liang, L.; Liu, Q.; Liu, G.; Li, H.; Huang, C. Accuracy Evaluation and Consistency Analysis of Four Global Land Cover Products in the Arctic Region. Remote Sens. 2019, 11, 1396. [Google Scholar] [CrossRef]
- Wang, J.; Yang, X.; Wang, Z.; Cheng, H.; Kang, J.; Tang, H.; Li, Y.; Bian, Z.; Bai, Z. Consistency Analysis and Accuracy Assessment of Three Global Ten-Meter Land Cover Products in Rocky Desertification Region—A Case Study of Southwest China. ISPRS Int. J. Geo-Inf. 2022, 11, 202. [Google Scholar] [CrossRef]
- Foody, G.M. Assessing the Accuracy of Land Cover Change with Imperfect Ground Reference Data. Remote Sens. Environ. 2010, 114, 2271–2285. [Google Scholar] [CrossRef]
- Xiao, P.; Wang, X.; Feng, X.; Zhang, X.; Yang, Y. Detecting China’s Urban Expansion over the Past Three Decades Using Nighttime Light Data. IEEE J. Sel. Top. Appl. Earth Obs. Remote Sens. 2014, 7, 4095–4106. [Google Scholar] [CrossRef]
- Birhane, E.; Ashfare, H.; Fenta, A.A.; Hishe, H.; Gebremedhin, M.A.; Solomon, N. Land Use Land Cover Changes along Topographic Gradients in Hugumburda National Forest Priority Area, Northern Ethiopia. Remote Sens. Appl. Soc. Environ. 2019, 13, 61–68. [Google Scholar] [CrossRef]
- Wang, H.; Liu, C.; Zang, F.; Yang, J.; Li, N.; Rong, Z.; Zhao, C. Impacts of Topography on the Land Cover Classification in the Qilian Mountains, Northwest China. Can. J. Remote Sens. 2020, 46, 344–359. [Google Scholar] [CrossRef]

Disclaimer/Publisher’s Note: The statements, opinions and data contained in all publications are solely those of the individual author(s) and contributor(s) and not of MDPI and/or the editor(s). MDPI and/or the editor(s) disclaim responsibility for any injury to people or property resulting from any ideas, methods, instructions or products referred to in the content. |
© 2024 by the authors. Licensee MDPI, Basel, Switzerland. This article is an open access article distributed under the terms and conditions of the Creative Commons Attribution (CC BY) license (https://creativecommons.org/licenses/by/4.0/).