Abstract
With the rapid development of urbanization, China is facing problems, such as uncoordinated regional development, imbalanced land space development, and ecological environment pollution. This poses a huge threat to the sustainable development of China’s economy and society. Therefore, there is an urgent need to determine how to coordinate the relationship between the space exploitation, economic development, and ecological environment (SEE) of urban areas. In this study, taking the Henan Province as an example, long time-series data (2000–2020) were used, at a city scale. Then, we developed a logical framework to reveal the interrelationship and intrinsic mechanism between SEE. Next, we explored the spatiotemporal coupling characteristics of SEE using a linear weighting method and a coupling coordination analysis. We found that, from 2000 to 2020, the comprehensive level of SEE showed an obvious trend of change, and different cities have different coupling coordination degrees. However, the overall coupling coordination level is steadily developing and tending to improve. Furthermore, with the spatial autocorrelation method, we analyzed spatial correlation patterns and collaboration/trade-off relationships for SEE. Through the analysis, positive correlation types (HH, LL) cluster significantly and negative correlation types (HL, LH) have low clustering. Meanwhile, we found significant spatial differences in cooperation/trade-off relationships between different years. This research can serve as a reference and as methodological guidance for achieving coordination and sustainable development of the economy, space, and environment.
1. Introduction
Since the industrial revolution, the space of central cities around the world has been continuously expanding, and the speed of land expansion is faster than the rate of population growth. In the process of global urban spatial development, space exploitation, economic development, and ecological environment protection have become important propositions in development, and they are inseparable [1]. Space exploitation, economic development, and ecological environment (SEE) are important characteristics of regional development. These three aspects are both independent from and closely related to each other, and they have different characteristics and development laws [2]. Space exploitation mainly reflects the investment intensity of a region, including land development, population agglomeration, and investment in capital factors. It is an important indicator of whether a region is developing well [3]. Economic development represents the output characterization of regional development, primarily manifested in the speed, quality, scale, and output efficiency of economic development [4,5]. In short, space exploitation and economic development (SEcon) represent the development degree of a region, and the process of SEcon significantly affects the evolution of the ecological environment, which in turn constrains SEcon [6]. To a certain extent, the interaction of SEE reflects the synergy and rationality of regional development. Therefore, studying the interactive relationship and collaborative development model between the elements of SEE has significance for the healthy development of many countries.
Territorial space is a complex spatiotemporal system of human land linkages that is dynamic and multidimensional [7]. Unrestrained free market forces in the 1950s resulted in the emergence of urban spatial sprawl in the United States. On the one hand, the expansion and exploitation of space relieved living pressure in metropolitan areas, but it also brought challenges, such as traffic congestion, farmland occupancy, and major environmental harm [8,9]. In the 1960s, the problem of urban spatial sprawl was quite serious in European countries. For example, from 1800 to 2000, the built-up areas of London expanded 63 times, while the population only grew 10 times, which resulted in large-scale suburbanization [1,10]. In addition, there is also a widespread phenomenon of urban spatial expansion in Japan. Since the 1970s, urban production and living spaces in Japan have expanded rapidly, which threatened most of the ecological space at a huge cost and weakened Japan’s sustainable development capacity [11]. Spatial sprawl has brought numerous comforts to people’s lives as an unsustainable economic growth model, but we cannot ignore the fact that the imbalances in land spatial development and spatial pattern disorder have become bottlenecks that hinder the sustainable development of many countries around the world [8,12].
Furthermore, after realizing the importance of reasonable space exploitation, Chinese and foreign scholars began to investigate reasonable paths for land space development from perspectives such as optimization or rational layout of land space [13,14,15]. The sensible layout of land use in terms of quantity and space reflects the goal of optimizing land space. Meanwhile, the optimization results are mostly visible as land use spatial allocation plans [6,16,17]. Traditional land use optimization mainly focuses on achieving comprehensive social, economic, and ecological benefits, while land spatial optimization is conducive to identifying regional collaborative development characteristics from a spatial perspective [18,19,20]. According to Rahman and Szabo [17], the most prevalent goals in urban land use optimization are to maximize spatial compactness. To achieve a healthy balance of spatial production and biological conservation. Bourque [21] used the conservation planning software Marxan to boost agricultural production while maintaining biodiversity, emphasizing the importance of strategic and transparent land use decisions. Parry [22] optimized Indian urban service planning using the AHP model and land use appropriateness assessment approach. In addition, in order to explore the impact of spatial exploitation on the environment, many scholars have used nonlinear relationships to explore the relation between urbanization and environmental systems based on the “Environmental Kuznets Curve (EKC)” [23,24,25]. EKC reveals that, with the acceleration of urban development, environmental quality will begin to decline, and after the economy reaches a certain level, environmental quality will improve with the deepening of the development level [26,27]. As a result, the academic community continues to pay close attention to the synergy between space exploitation and the ecological environment (SEcol) [28].
As the world’s third largest country in terms of land area and population, China’s sensible use of land space and environmental impact issues have long been a focus in political and academic circles. Since the reform and opening up, the scale of construction zones in China has rapidly increased from 0.7 thousand km2 in 1981 to 6.2 thousand km2 in 2021. As a result, the rate of spatial development is rapid. In response to the current development status of space in China, scholars have discussed various aspects, such as changes in land use structure [29,30], spatial differentiation characteristics [31], and influencing factors [32,33]. Some scholars have also discussed the coupling and coordination relationship between SEcol from micro to macro perspectives [34,35]. In addition, research on the interaction between spatial development and resource environment is growing [36]. For example, spatial exploitation and ecological environment response [37], ecological environment pressure level [38], resource and environmental carrying capacity [39], and so on. At the same time, the resource consumption and environmental issues caused by economic development are also research directions that cannot be ignored. Long [40] observed that total consumption of China’s water resources continues to rise year after year and used the LMDI (Logarithmic Mean Divisia Index) approach to examine the impact of urban scale on water resource consumption. Zhang [41] investigated the important elements that contribute to changes in land space resource consumption using the structural path decomposition method. In addition, other countries have adopted different approaches to space development, economic development and ecological environment. Qayyum [42] used the EKC framework to examine the impact of urbanization and informal economy on the ecological footprint of selected South Asian countries. Elgin and Oztunali [43] analyzed the association between the size of the shadow economy and air pollution-causing factors. The results show that there is an inverse U-shaped relationship between shadow economy size and environmental degradation. Azam and Khan [44] have inspected the role of urban growth in CO2 emissions for SAARC countries.
In conclusion, research on topics related to space exploitation, economic development, and the environment is constantly deepening, and there have been many achievements [45,46]. However, existing research has focused on studies examining subjects such as changes in spatial structure, development and utilization of land space, optimization of land spatial layout, and the environmental impact of space exploitation [47]. Currently, the research on the relationship between SEE is limited. It is necessary to further focus on the research perspective and explore the coupling relationship, spatiotemporal evolution characteristics, and internal mechanisms of SEE. Based on this, this study selects Henan Province as the research area, expanding the research perspective to the coupling relationship between SEE while simultaneously introducing the concept of coordination and integration, exploring the evolution, spatiotemporal coupling characteristics, and collaboration/trade-off relationships of SEE in Henan Province from 2000 to 2020. Finally, providing theoretical support and practical experience for the coordinated development of cities, economy, and environment. The main objectives of this research include the following: (1) to analyze the evolution trend of SEE; (2) to explore the coupling coordination characteristics of spatiotemporal sequences of SEE; (3) to analyze the spatial correlation patterns and collaboration/trade-off relationships of SEE; and (4) to offer a methodological direction for high-quality collaborative development in various regions.
2. Materials and Methods
2.1. Theoretical Framework
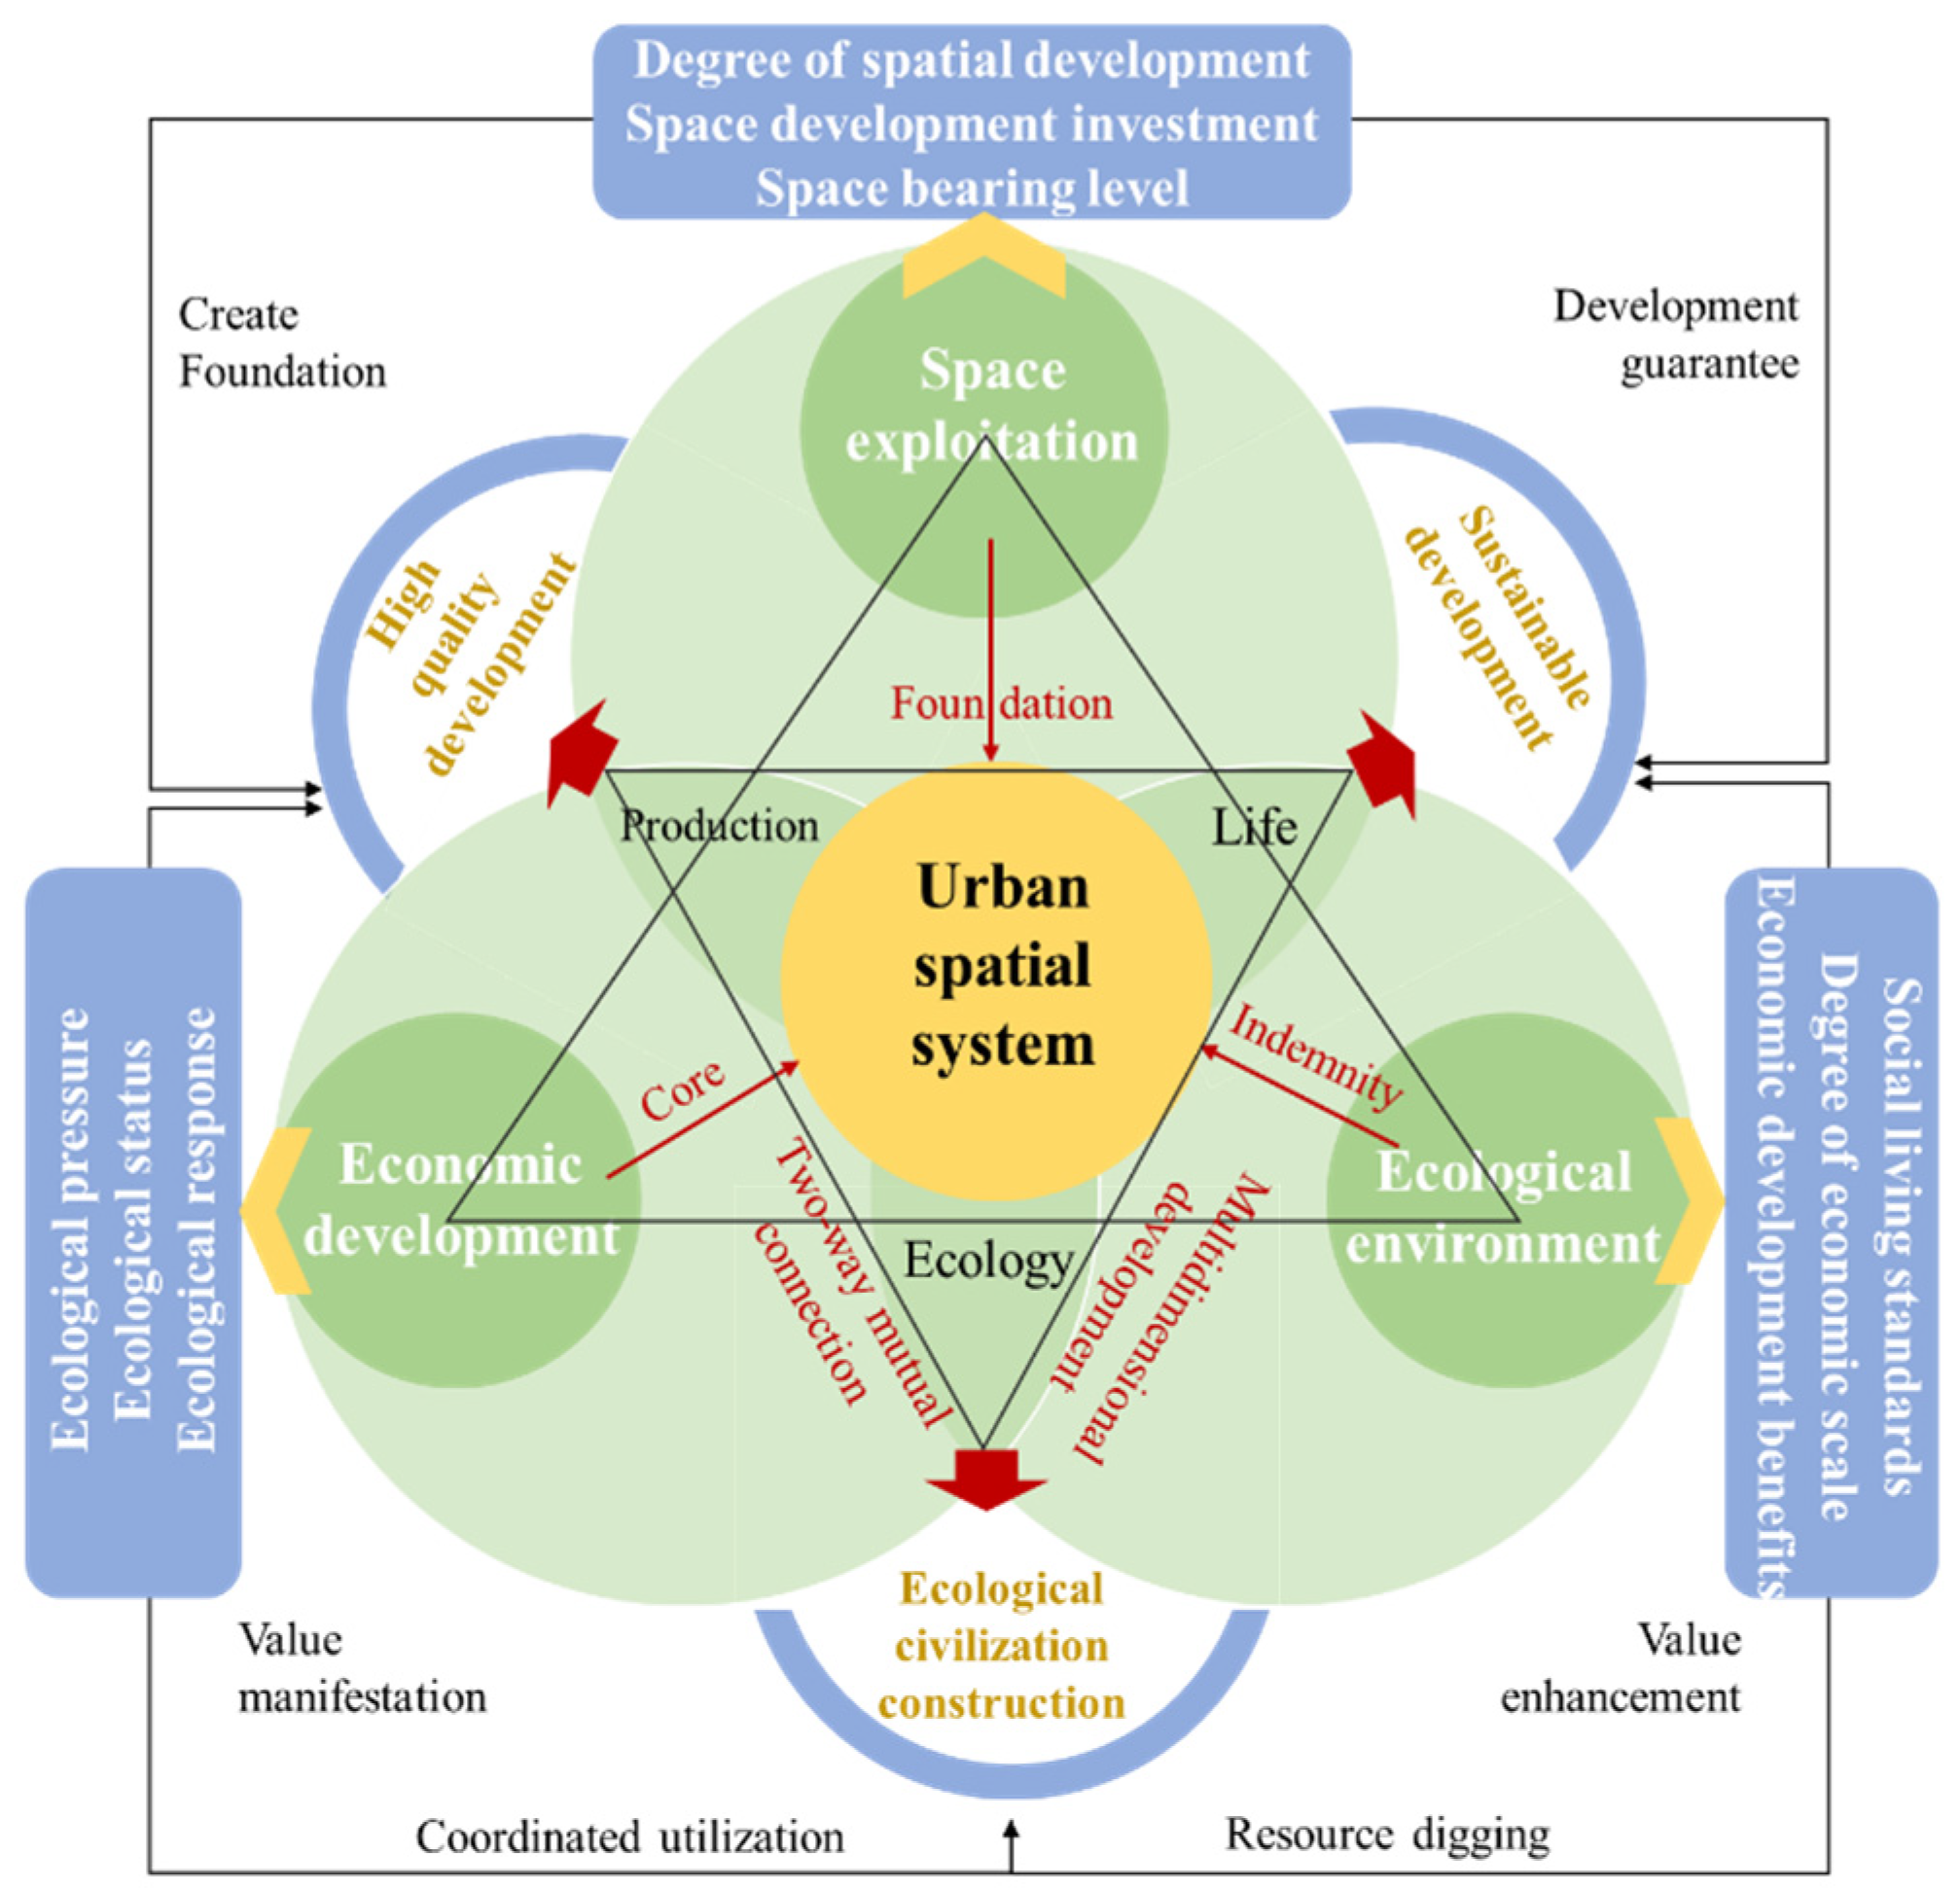
There is an objective symbiotic and coordinated relationship between SEE. On the one hand, by constructing a reasonable spatial pattern, it can promote the rational flow and efficient agglomeration of various elements within the land space. Furthermore, the resource consumption generated by economic growth will decrease, the ecological quality will be improved, and government departments will pay attention to ecological protection [48]. On the other hand, excessive development of space and rapid economic development can lead to frequent problems, such as environmental pollution, resource waste, and forest destruction [49,50]. The decline in ecological quality means that the carrying capacity of resources and environment and the land intensive level are weakened, which in turn restricts the development of high-quality spatial patterns (Figure 1).
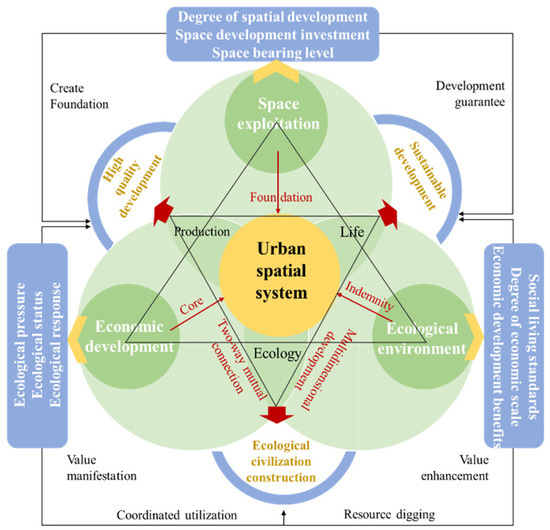
Figure 1.
Logical framework of urban system of space exploitation, economic development, and ecological environment (SEE).
This study defines the relationship between the SEE as a coupling coordination relationship and a trade-off relationship. Coupling coordination represents interdependence and collaboration among the SEE. Trade-off represents a balanced and undisturbed development state between SEE. By analyzing the coupling coordination and trade-off relationship between SEE, it can promote the formation of a spatial pattern of high-quality development and ecological civilization in the region.
2.2. Case Study
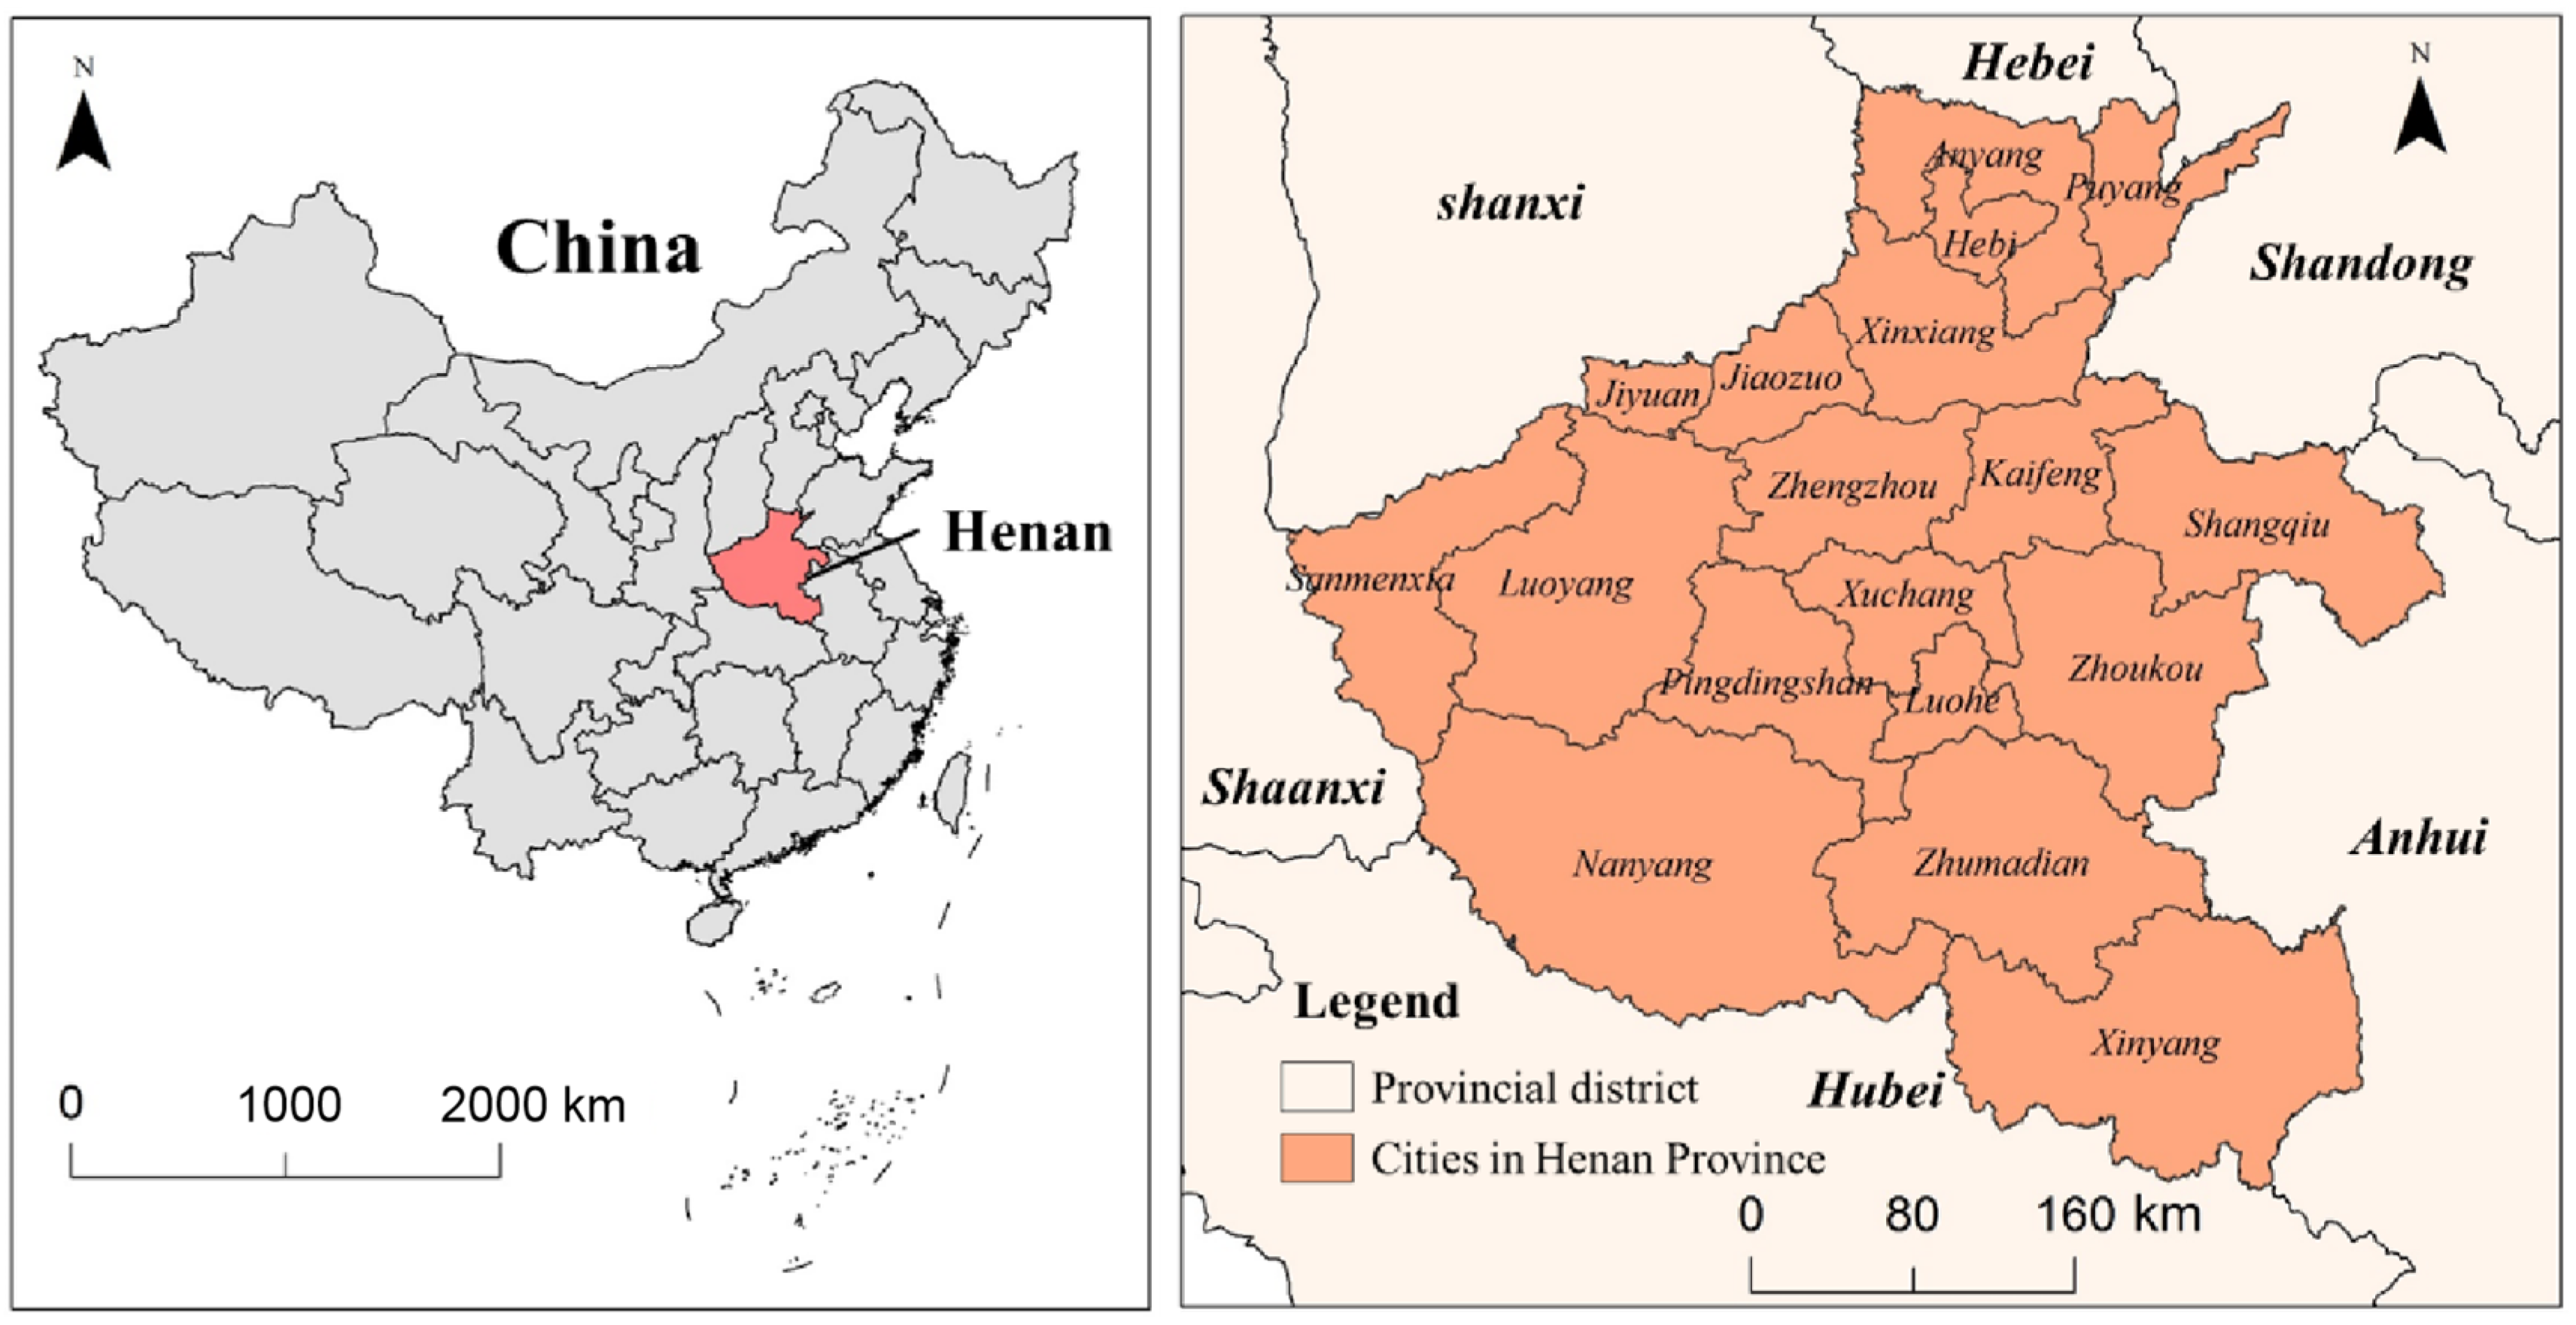
Henan Province is located in the middle of China near the lower reaches of the Yellow River. The total administrative area is 1.67 × 10⁵ km2 (Figure 2). The terrain of Henan Province is high in the west and low in the east, with complete types of landforms, such as mountains, hills, plains, and basins. Moreover, the land space’s natural endowment advantages are prominent [51]. As the core area of industrialization and urbanization development in central China, Henan Province has gathered a large number of factors and resources and has achieved rapid progress in urbanization and industrialization. The total GDP of Henan Province accounted for about 5.07% of the national economy in 2022, and the urbanization rate has reached 57.07% [52]. However, in recent years, the rapid development of economic construction activities, as well as the impact of the economic environment, industrial structure, industrial models, institutional mechanisms, etc., has led to a tightening of natural resource constraints and an increasing pressure on the ecological environment in Henan Province. Meeting the needs of urban construction and economic development, while also protecting the ecological environment, has become the key to achieving sustainable development. Therefore, in this situation, it is extremely important to study the interactive relationship and collaborative development direction between SEE of urban areas in Henan Province.

Figure 2.
Geographical location of Henan Province.
By the end of 2020, Henan Province contained 18 cities. Compared to county-level units, different urban units have certain differences in economic development level, industrial structure, and ecological resource endowment. Therefore, studying the interactive relationship between SEE in 18 cities in Henan Province is very important for the interconnection and collaborative development between cities.
2.3. Data Acquisition
The data employed in this study include the following. (1) Land use data and natural statistical data were derived from the Resource and Environmental Science Data Center (https://www.resdc.cn [accessed on 3 November 2023]). (2) Social data and economic data were obtained from statistical yearbooks of Henan Province and cities, as well as the statistical bulletin of the national economy and social development of Henan Province and cities. (3) Environmental data were provided by the environmental status bulletin and water resources bulletins of Henan Province and cities. The missing data of individual years in some cities are based on the data of adjacent years, supplemented by moving average and trend extrapolation methods.
2.4. Methodology
Firstly, an urban symbiotic system of SEE was constructed, as well as an evaluation index system. Secondly, a linear weighting method was applied to analyze the development trends of space exploitation, economic development, and ecological environment level. Afterwards, the coupling coordination degree model was introduced to measure the coupling and differentiation characteristics between SEE. Finally, using spatial autocorrelation analysis, the collaboration and trade-off relationships between SEE were explored (Figure 3).
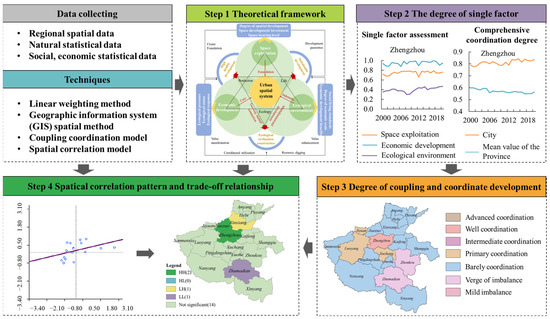
Figure 3.
Research process and framework.
2.4.1. Establishing Evaluation System
The main purpose of the index system is to clearly show the connotation and characteristics of the system. Considering the principles of systematicity, scientificity, data accessibility, and referring to existing research results [34,53], the comprehensive evaluation index system for SEE was constructed. The space exploitation system is composed of the spatial development degree, spatial development investment, and spatial carrying capacity level (Table 1). Spatial development degree represents the level of regional land development and population agglomeration. Spatial development investment represents the level of capital and factor investment on land, while spatial carrying capacity represents the degree of land development in a region [2].

Table 1.
The evaluation index system of space exploitation.
We attempted to construct an economic development evaluation system based on economic development benefits, economic scale degree, and social living standards (Table 2). Among these, economic development benefits represent benefit output, the economic scale degree represents the quality and quantity of regional economic development, and social living standards represent the social life development level [54].
Table 2.
The evaluation index system of economic development.
Ecological environment pressure, ecological environment status, and ecological environment response are all components of the ecological environment system (Table 3). Among these, ecological environment pressure reflects the resource consumption and pollution within the region, ecological environment status reflects the carrying level of the regional ecological environment, and ecological environment response represents the measures taken to respond to environmental pressure [55].
Table 3.
The evaluation index system of ecological development.
2.4.2. Data Processing
The attributes of multi-dimensional evaluation indicators are clearly different. In order to unify the comparison scale and increase the accuracy of the evaluation, the dimensionless method is employed to standardize the positive and negative indicator data [56].
where i is the indicator, j is the year, Xij is the standardized value, xij is the original value, and max (xij) and min (xij) represent the maximum and minimum value of the indicator i in all of the years studied.
After standardization, the entropy method is used to calculate the information entropy and information utility values of the indicators, and then calculate the weight of the indicators [56]. The effective amount of information provided by the data can be measured by entropy. If the evaluation object’s values differ significantly from the indicator, the entropy value will be small, and the weight of the indicator will be large. On the contrary, if the difference in values of a certain indicator is smaller and the entropy value is larger, it indicates that the weight of the indicator should be smaller. Therefore, the entropy method is an objective weighting method. The equation for calculation is as follows:
Further calculation to obtain indicator weights:
where hi represents the information entropy of the i evaluation index, wi represents the weight of the i evaluation index (0 ≤ wi ≤ 1), n represents the number of research units. The weight results of various indicators are shown in Table 1, Table 2 and Table 3.
2.4.3. Comprehensive Evaluation
Calculate the index values of each subsystem using the comprehensive index weighting method based on the values and corresponding weights of each indicator within the evaluation framework [57]. The equation for calculation is as follows:
where si represents the index of each indicator. SES, EDS, and EES, respectively, represent the level of space exploitation, economic development, and ecological environment. p and q represent the start and end sequence numbers of each indicator in the n subsystem.
2.4.4. Coupling Coordination Model
Introducing a coupling coordination model of SEE [58,59]. Then measure the degree of interaction between SEE and each other. The equation for calculation is as follows:
where D is the coupling degree of SEE. ki, ji, and si, respectively, represent the space exploitation level index, economic development level index, and ecological environment level index. α, β, and λ are the undetermined coefficient. Due to the fact that space exploitation is the foundation for economic development and ecological environment (EE), its changes will have a significant impact on the other two aspects. After taking this into account, set α = 0.4, β = λ = 0.3.
Next, the article establishes coupling coordination models between “SEcon”, “SEcol”, and “EconEcol”, respectively. The calculation formulas are as follows:
where Dkj is the coupling coordination degree between SEcon, Dks is the coupling coordination degree between SEcol, Djs is the coupling coordination degree between EconEcol. The undetermined coefficients of α, β, and λ are all assigned 1/2. Based on relevant research results, the coupling coordination degree among the three systems is divided into 3 major categories and 10 subcategories (Table 4).
Table 4.
Classification of coupling coordination types between SEE.
2.4.5. Spatial Autocorrelation Analysis
To further determine the spatial synergistic characteristics and trade-off relationship between SEE, the spatial autocorrelation analysis is introduced for measurement [47]. Spatial correlation analysis can reflect a certain geographical phenomenon on a regional unit or the correlation degree between an attribute value and the attribute value of adjacent regional units. Spatial autocorrelation analysis is generally divided into Global Moran’s I and Local Moran’s I. The calculation method as follows:
where GMI represents the Global Moran’s I index, and the value range of GMI is [−1,1]. LMIi represents the Local Moran’s I index. Yi and Yj represent the values of variables in adjacent paired space units. wij represents spatial weight matrix elements. S2 is the statistical variance.
3. Results and Analysis
3.1. Comprehensive Level Analysis of SEE
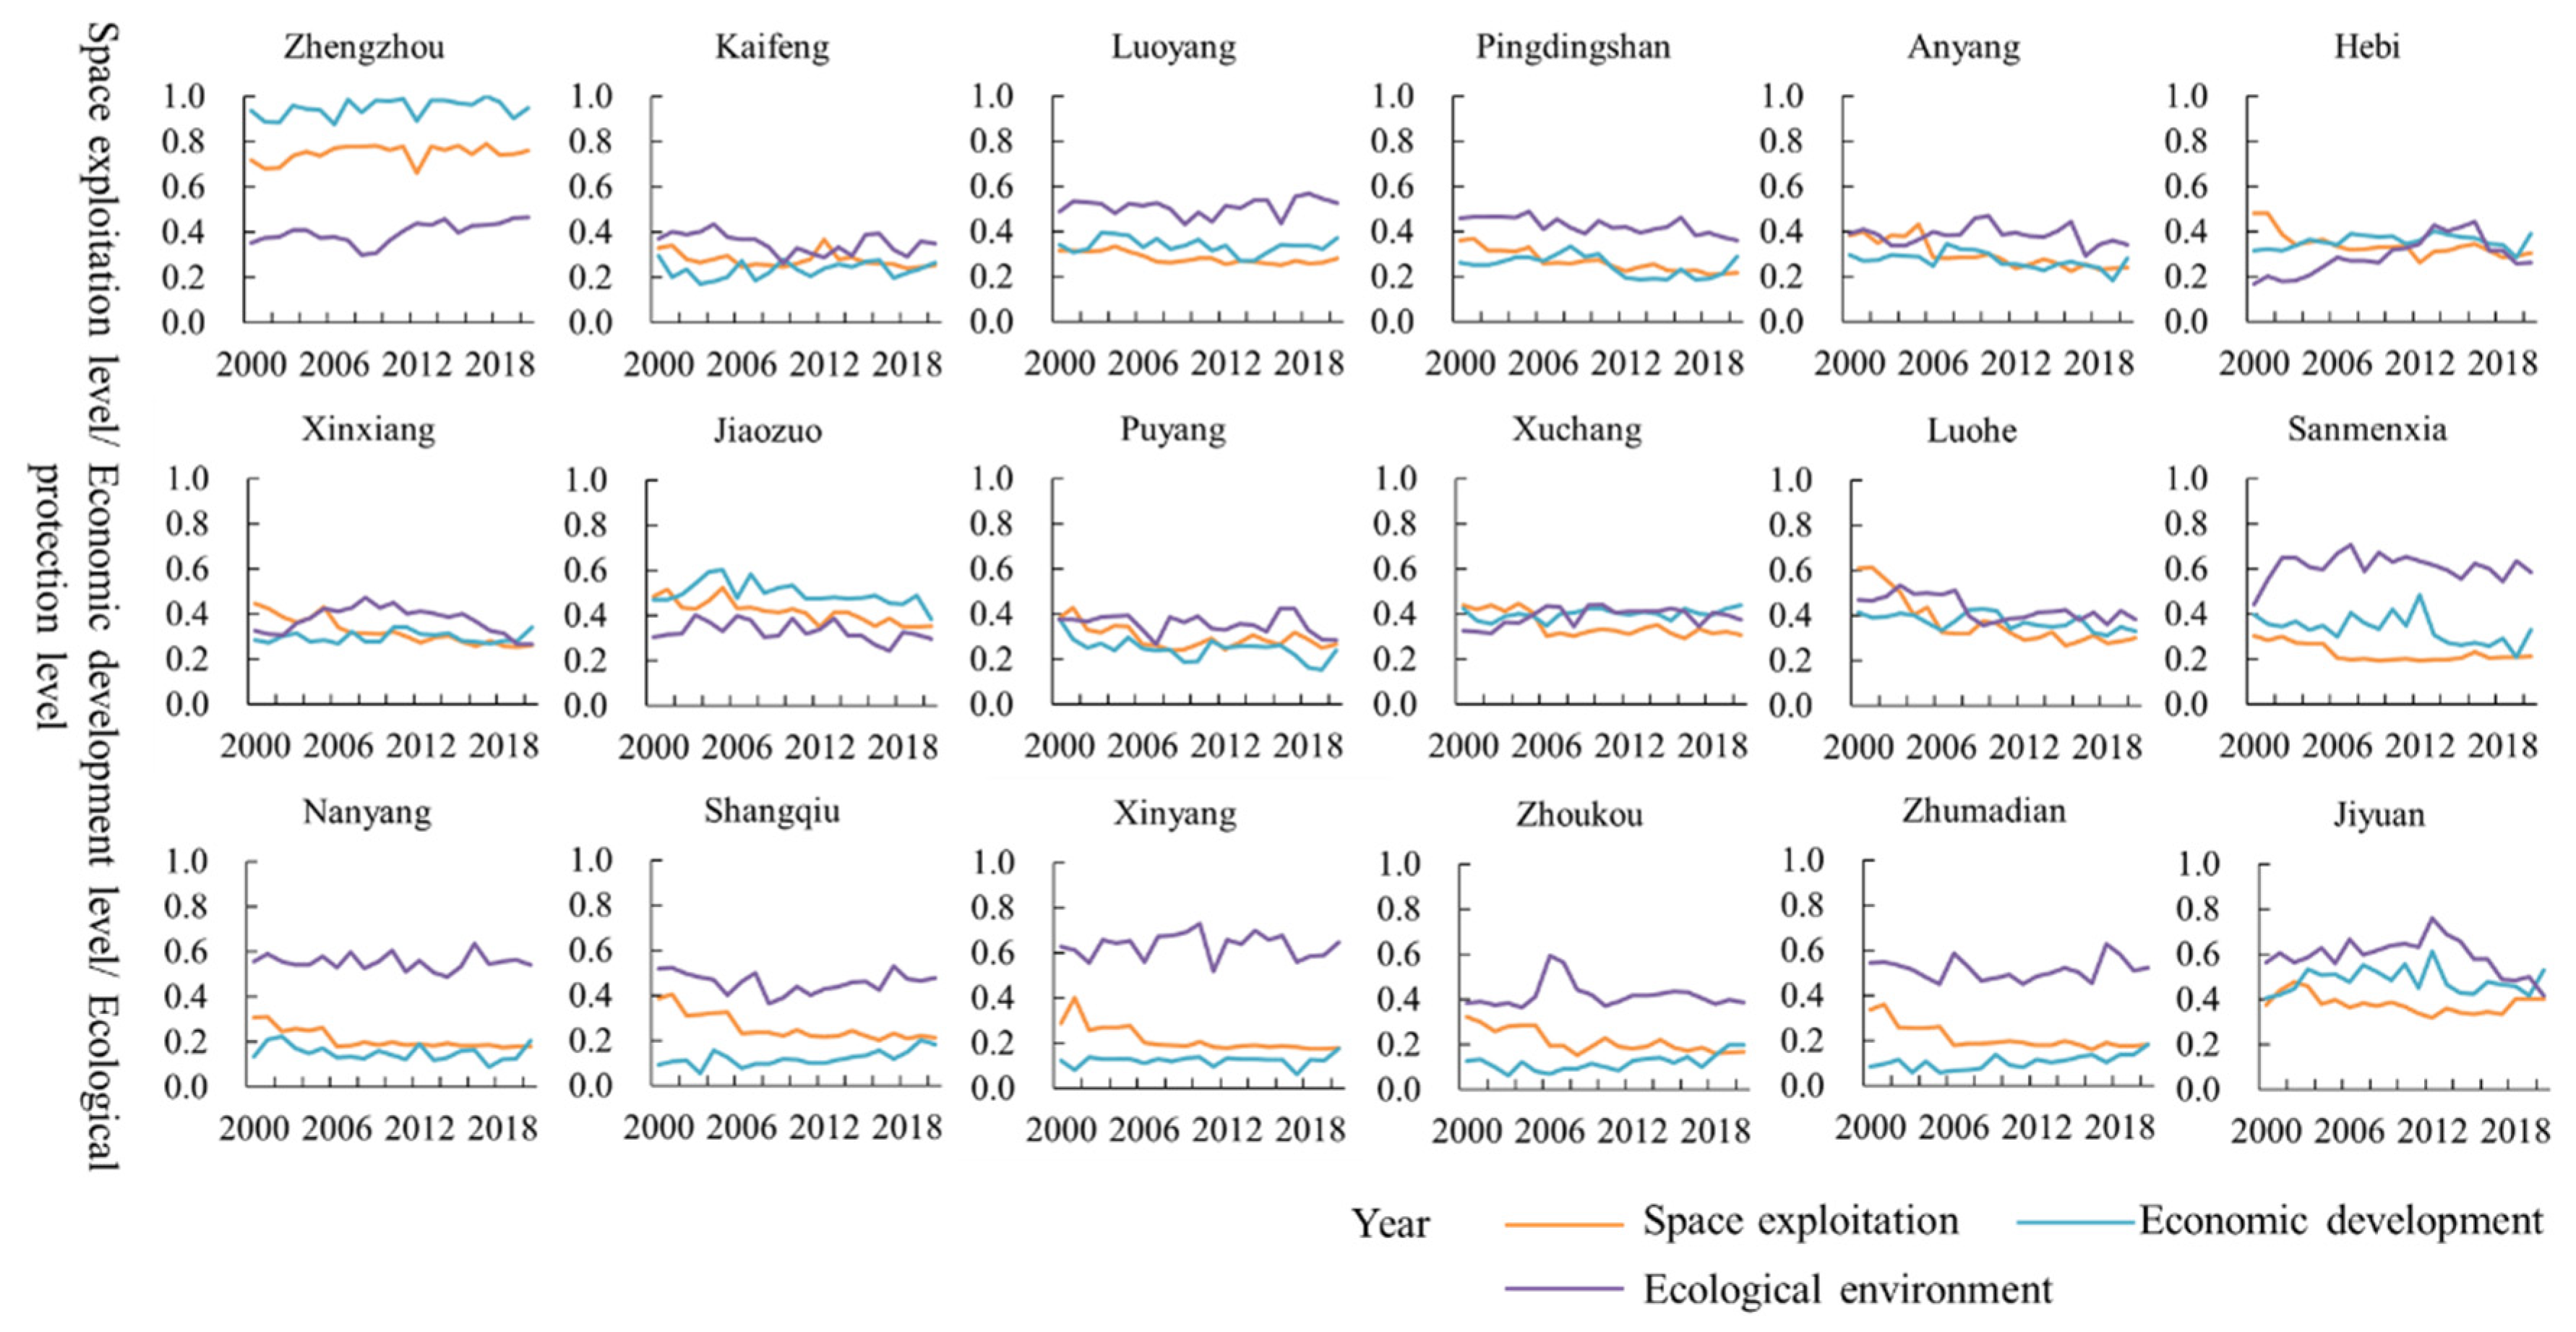
According to the constructed index system of SEE, apply the comprehensive evaluation method to analyze the trend of SEE in Henan Province from 2000 to 2020. As shown in Figure 4.
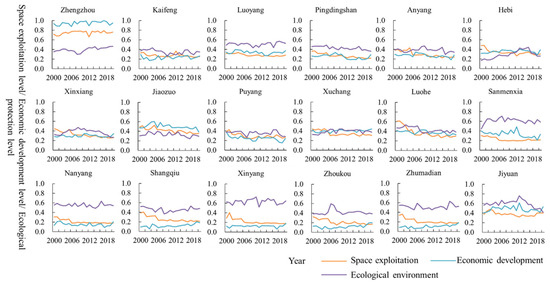
Figure 4.
Evolution trend of SEE during 2000–2020.
From 2000 to 2020, the space exploitation level of various cities in Henan Province showed three changes: increasing, decreasing, and relatively stable (Figure 4). Zhengzhou City and Jiyuan City are experiencing a fluctuating and increasing trend in the level of space exploitation. The level of space exploitation in Kaifeng City and Luoyang City has not changed significantly. The space exploitation level of other cities, such as Pingdingshan City, AnyangCity, Hebi City, and Luohe City is showing a fluctuating downward trend. Among the cities with significant improvement, Zhengzhou’s growth rate is relatively significant, increasing from 0.719 to 0.760. Among cities experiencing a downward trend, Luohe’s performance is particularly evident, dropping from 0.609 to 0.301. Overall, Zhengzhou City has the highest level of space exploitation. In terms of space exploitation, Hebi City, Xinxiang City, Jiaozuo City, and Jiyuan City are in second place. The level of space exploitation in Xinyang City is relatively low.
According to analysis from the perspective of their economic development level, various cities in Henan Province showed obvious differentiation characteristics from 2000 to 2020. Among them, cities such as Zhengzhou, Luoyang, Jiaozuo, Xuchang, and Jiyuan have high economic development levels and relatively stable fluctuation trends, which is related to the sound development of the social and economic environment in these regions. The economic development level of cities such as Nanyang, Shangqiu, Xinyang, Zhoukou, and Zhumadian ranks relatively low and shows a slow upward trend. The reason for this is that agriculture in these regions is the focus of development, so the economic advantages are relatively less obvious. Overall, the changes in economic development are closely related to the socio-economic and natural environment, as well as the support and inclination of regional governments.
In terms of ecological environment level, there was a slight difference in the overall ecological environment level of Henan Province from 2000 to 2020. Cities like Luoyang, Sanmenxia, Nanyang, and Xinyang have a high ecological environment level, which is mainly due to the situation of local resource endowment. In addition, cities with higher levels of economic development have relatively low levels of ecological environment due to energy consumption and environmental pollution. Such as Zhengzhou City, Jiaozuo City, Xuchang City.
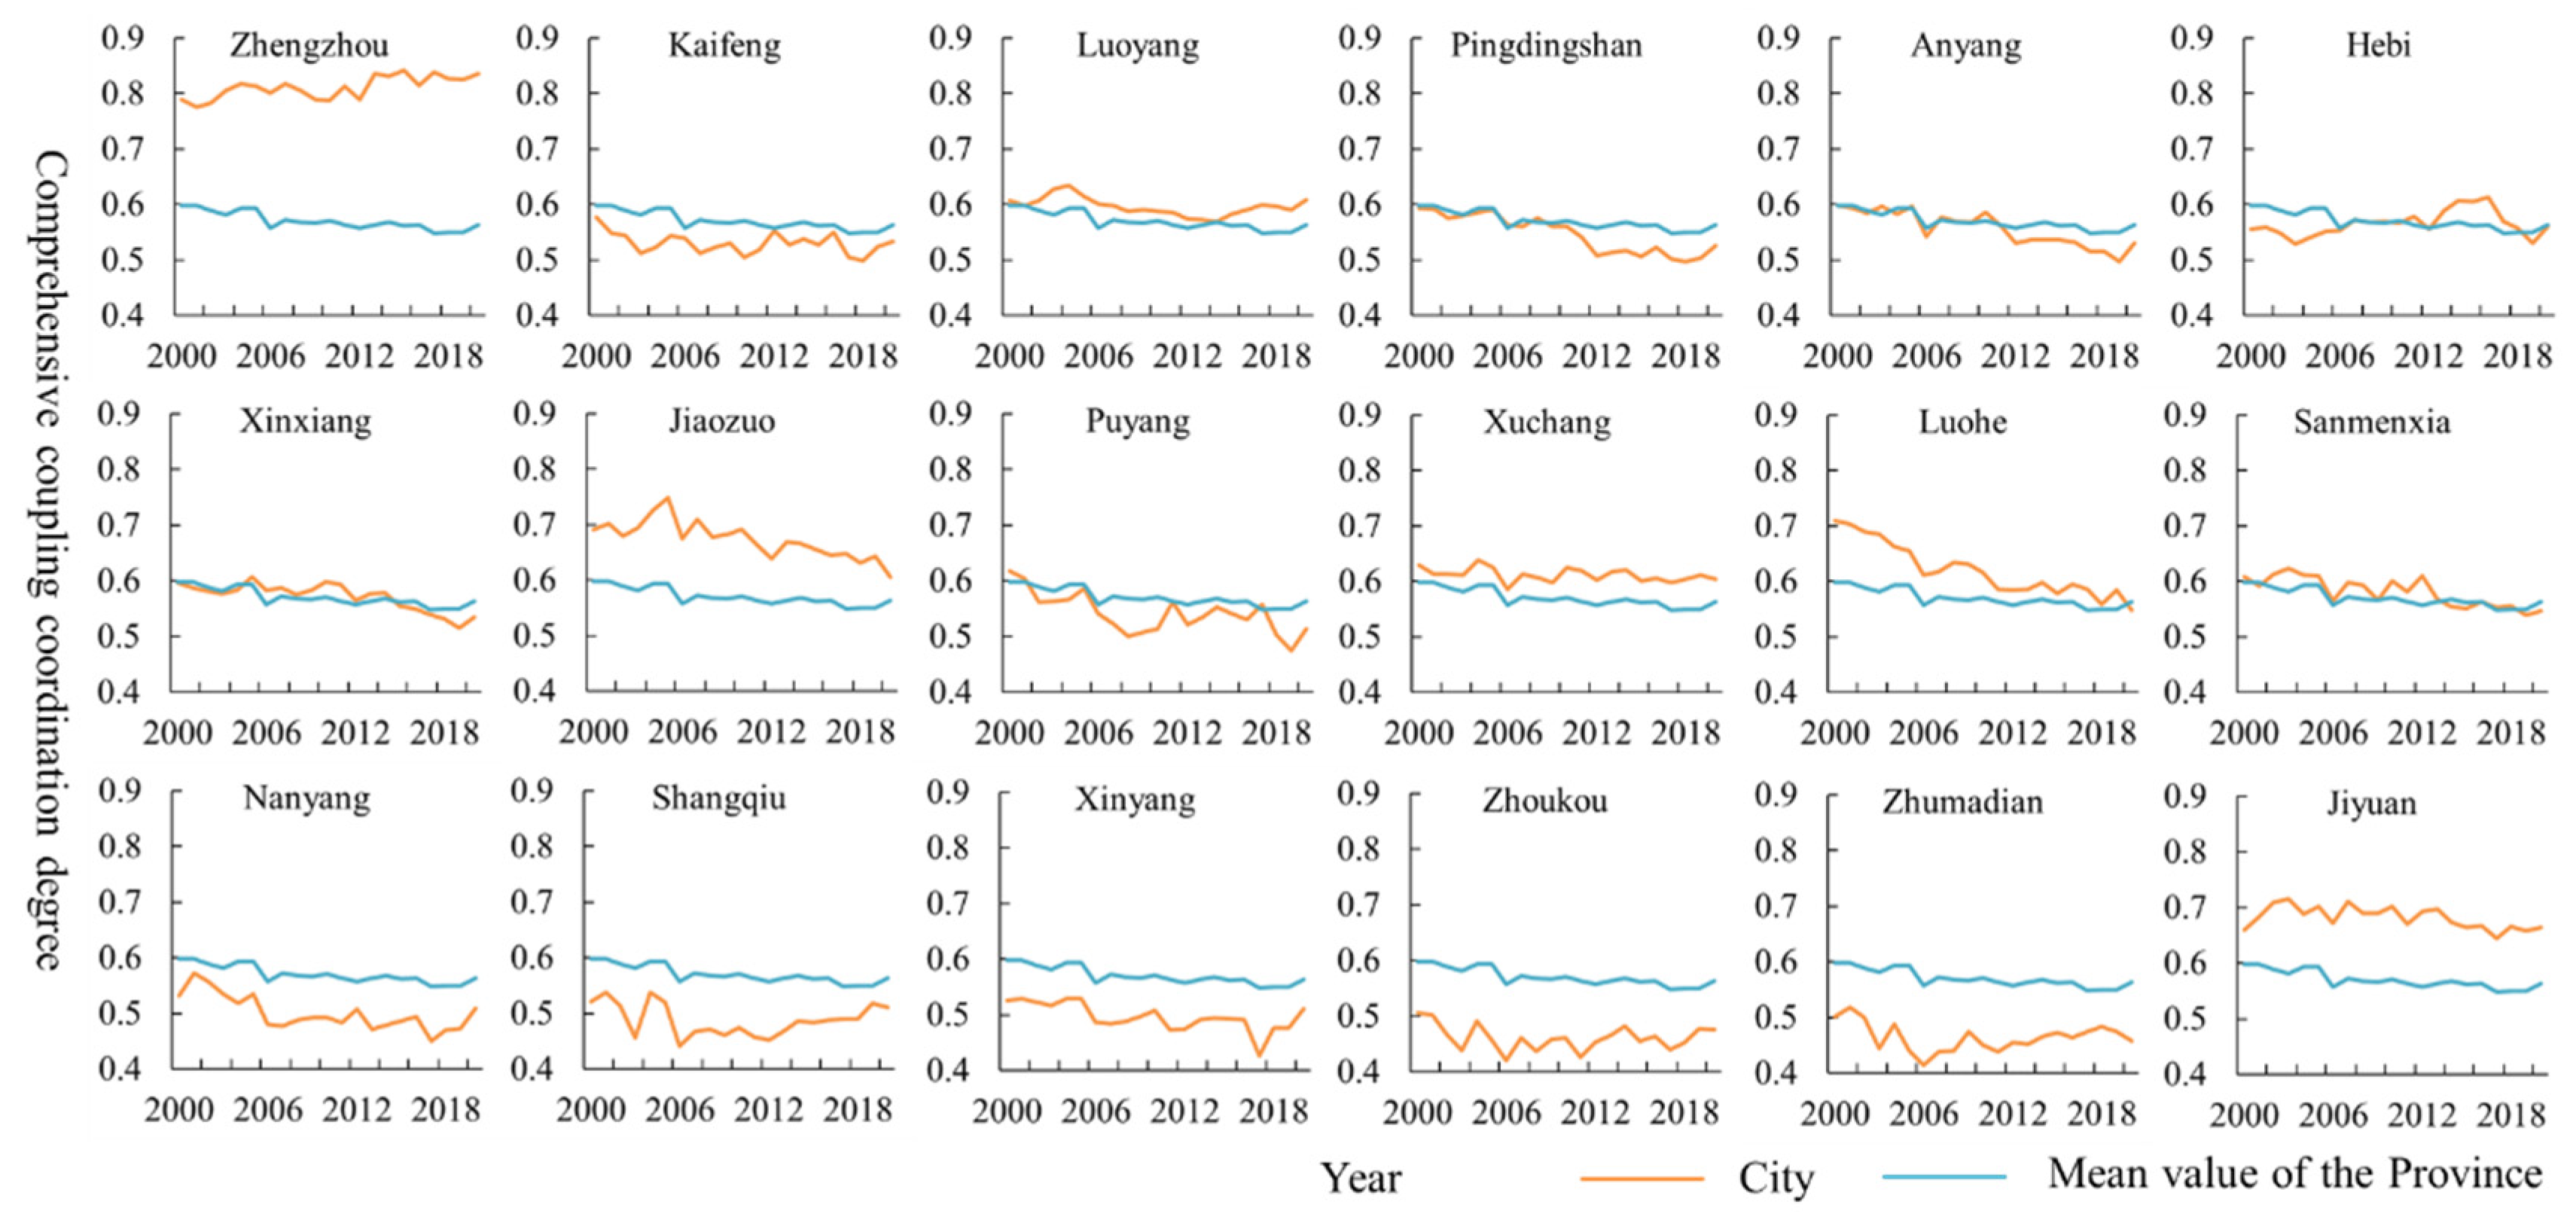
3.2. Spatiotemporal Characteristics in Coupling Coordination Degree of SEE
Using the coupling coordination model, analyze the spatiotemporal changes in the coupling coordination degree of SEE in Henan Province from 2000 to 2020. As shown in Figure 5 and Figure 6.
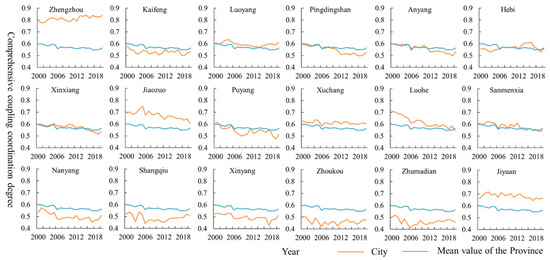
Figure 5.
Temporal variation in coupling coordination degree of SEE during 2000–2020.
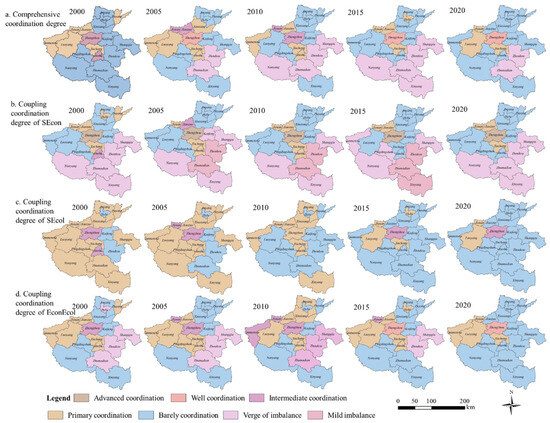
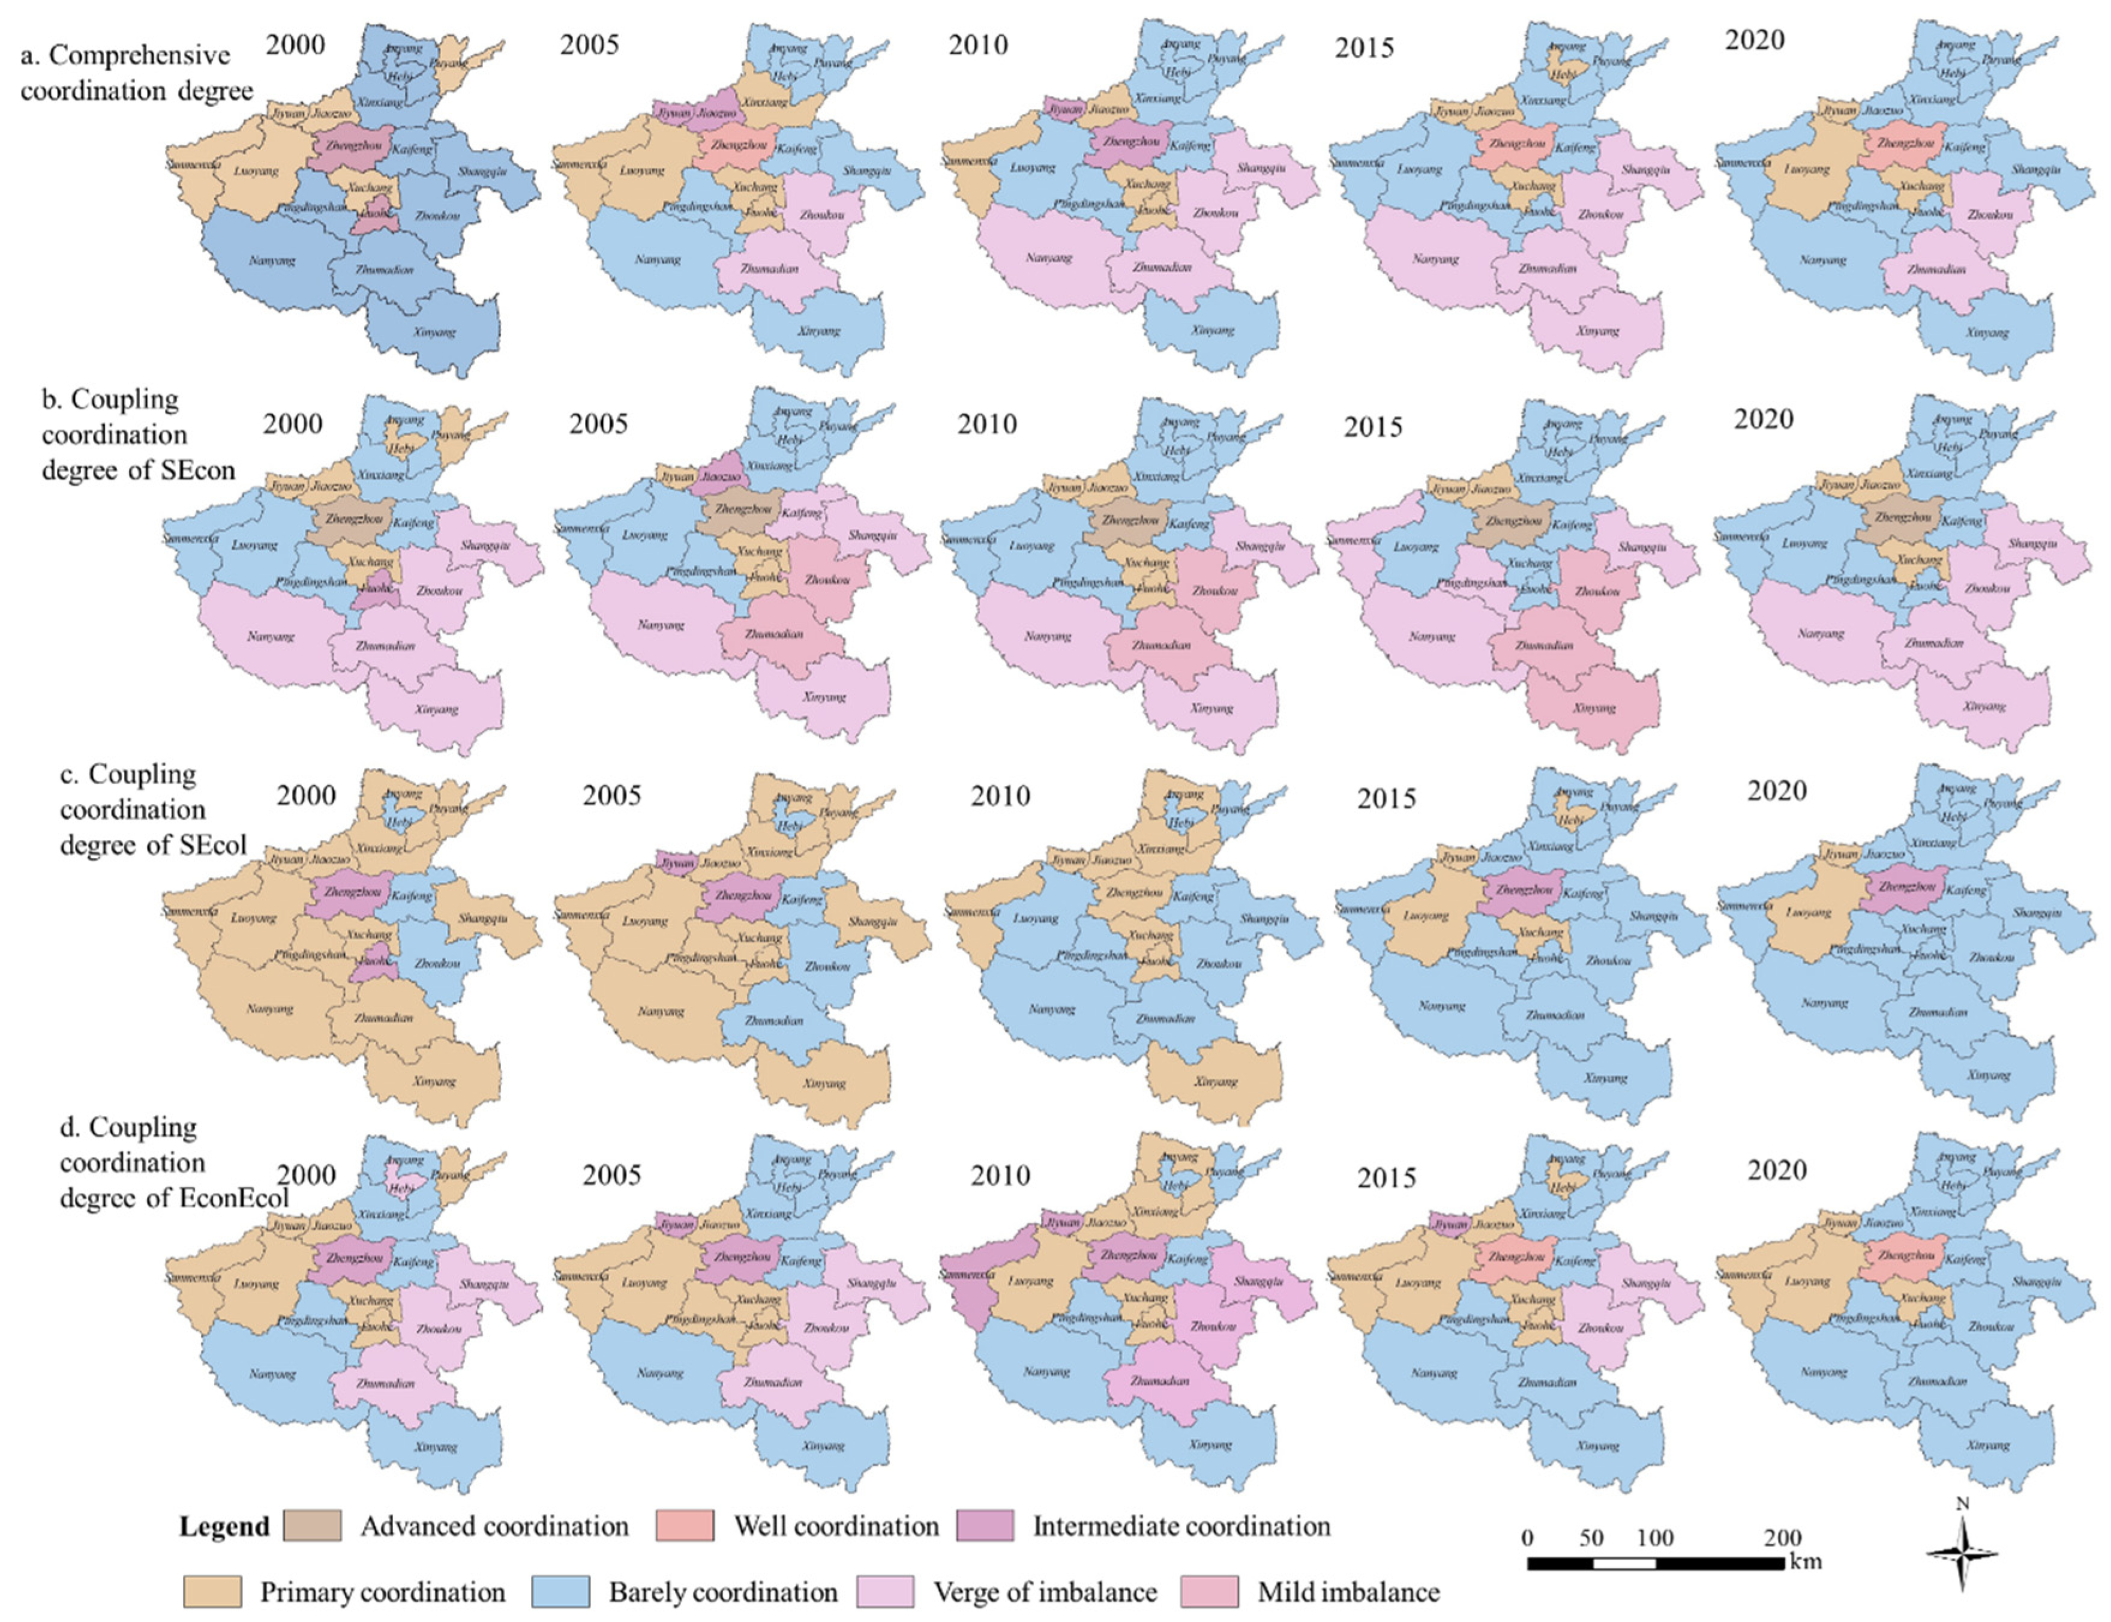
Figure 6.
Spatial variation in coupling coordination degree of SEE during 2000–2020. (a) Comprehensive coordination degree. (b) Coordination degree between space exploitation and economic development (SEcon). (c) Coordination degree between space exploitation and ecological environment (SEcol). (d) Coordination degree between economic development and ecological environment (EconEcol).
From a chronological perspective, the SEE of Henan Province were in different coordinated states from 2000 to 2020 (Figure 5). The majority of cities are in a barely coordinated state and are on the verge of imbalance. However, the coordination status in Zhengzhou City is good, constantly changing between good coordination and intermediate coordination. Among the 18 cities, Zhengzhou, Luoyang, Jiaozuo, Xuchang, and Jiyuan have a coupling coordination degree that is higher than the provincial average. According to the development trend, the coupling coordination in most cities has shown a downward trend but, overall, it remains at a coordinated level or is on the verge of imbalance. Small overall changes and slight improvements have been observed in certain cities, such as Zhengzhou’s growth from 0.790 to 0.836.
From a spatial perspective, the evolution of the coupling coordination degree between SEE in Henan Province has obvious regional differentiation characteristics (Figure 6)
- By analyzing the comprehensive coordination degree (Figure 6a), it was discovered that, in 2000, the comprehensive coordination degree of SEE was between 0.501 and 0.790. Except for Zhengzhou City and Luohe City, which are in intermediate coordination, other cities are in a primary and barely coordinated state. In 2005 and 2010, compared to 2000, there were some changes, and there were significantly fewer cities in a barely coordinated state. For example, cities such as Zhoukou, Zhumadian, Shangqiu, and Nanyang have begun to transition from barely coordinated to on the verge of imbalance. The overall situation in 2015 was similar to that in 2010, but the pattern of primary coordination changed. In 2020, the number of cities on the verge of imbalance decreased, while the number of cities in a barely coordinated state increased, and the overall coordination state gradually improved.
- From the perspective of coupling coordination between SEcon (Figure 6b), the overall pattern shows a high coordination degree in the central areas and a low coordination degree in the surrounding areas, but there are slight changes within the scope of the pattern. The majority of cities in 2000 were in a barely coordinated state and on the verge of imbalance, with significant overall differences. In 2005, the number of primary coordinated cities decreased and changed to intermediate or barely coordinated states. The overall pattern in 2010 was similar to that in 2005, with some cities experiencing slight changes. In 2015, the cities with mild imbalance added Xinyang, while the cities on the verge of imbalance added Sanmenxia and Pingdingshan. In 2020, the overall coupling state improved, with an increase in the cities at a barely coordinated state and on the verge of imbalance, and the state of primary coordination added Xuchang City.
- In 2000 and 2005, there were significant differences in the spatial pattern of the coupling coordination degree between SEcol (Figure 6c). Most cities in the central and western regions are in a primary and intermediate coordination state. The eastern cities of Kaifeng, Zhoukou, and Zhumadian are in a barely coordinated state. In 2010, there was a decrease in the number of cities in a state of primary coordination. As of 2020, there were only three cities in the primary and intermediate coordination states, while the barely coordinated cities significantly increased. Overall, the degree of coordination between SEcol is gradually decreasing. The reason is that the extensive development and occupation of land have led to imbalances between SEcol.
- By analyzing the coupling coordination degree between economic development and the ecological environment (EconEcol) (Figure 6d), it was found that the overall pattern changed significantly from 2000 to 2020. In 2000, cities on the verge of imbalance, in barely coordinated states, and in states of primary coordination showed a clear pattern of East–Central–West. In 2005, the pattern was similar to that of 2000, but there were changes in certain cities. In 2010, the number of cities in states of intermediate coordination increased, while the number of cities in states of primary coordination decreased. In 2020, the coordination status was mainly composed of well-coordinated cities, cities in a state of primary coordination, and barely coordinated cities, forming a pattern of low in the west and high in the middle and east, with an overall trend towards improvement.
3.3. Collaboration/Trade-Off Pattern of SEE
3.3.1. Spatial Correlation Pattern of SEE
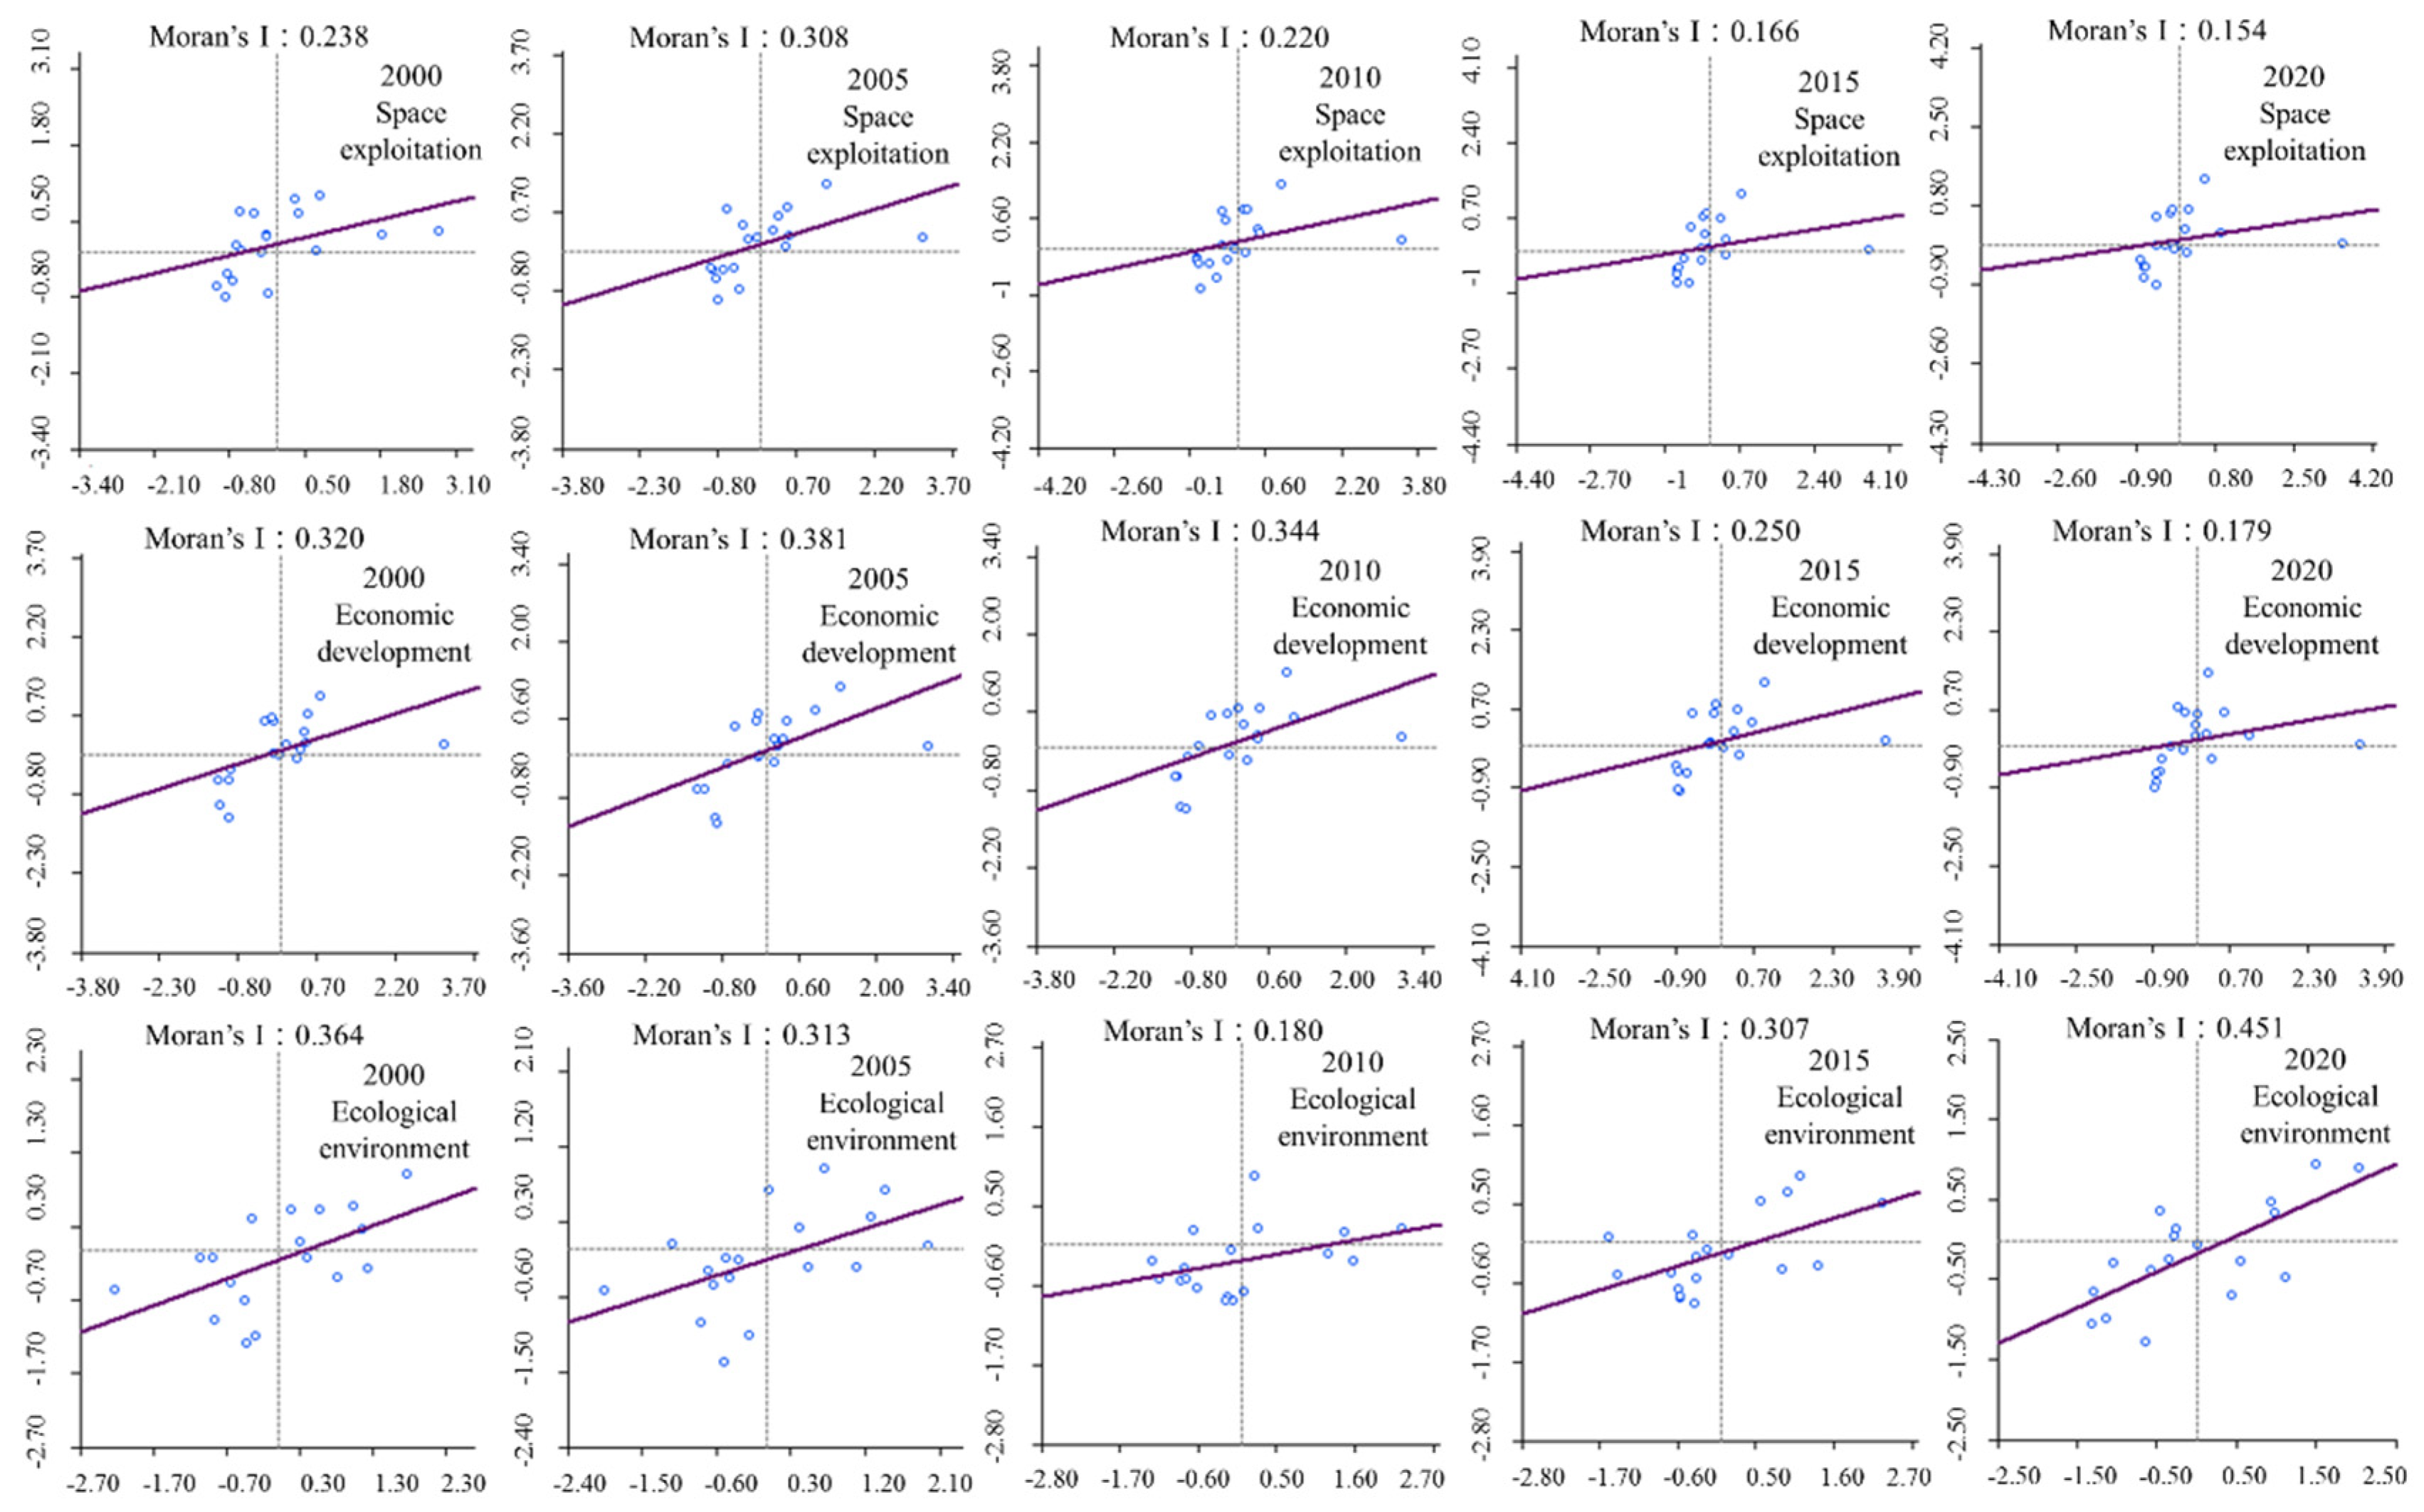
Using the spatial autocorrelation model, we analyzed the interrelationship and distinguished the spatial correlation of each individual system between SEE. As shown in Figure 7, the Global Moran’s I index calculation results confirm that the three systems have significant spatial positive correlation, namely the strong interaction between adjacent units and clustering spatial phenomena. Specifically, from 2000 to 2020, the agglomeration characteristics of the ecological environment system were relatively significant, while the space exploitation system and economic development system were relatively weak (Figure 7). The Moran’s I index for space exploitation and economic development systems generally fluctuates and decreases at intervals of 2010. The Moran’s I index of the ecological environment system drops first and then increases, with minimal overall variation. Overall, the Moran’s I index of space exploitation system ranges from 0.154 to 0.308. The Moran’s I index of economic development system varies from 0.179 to 0.381, whereas the ecological environment system’s Moran’s I index ranges from 0.180 to 0.451.
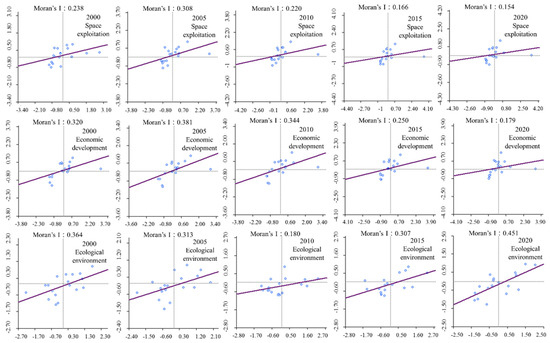
Figure 7.
Moran’s scatter plot of coupling coordination degree of SEE during 2000–2020.
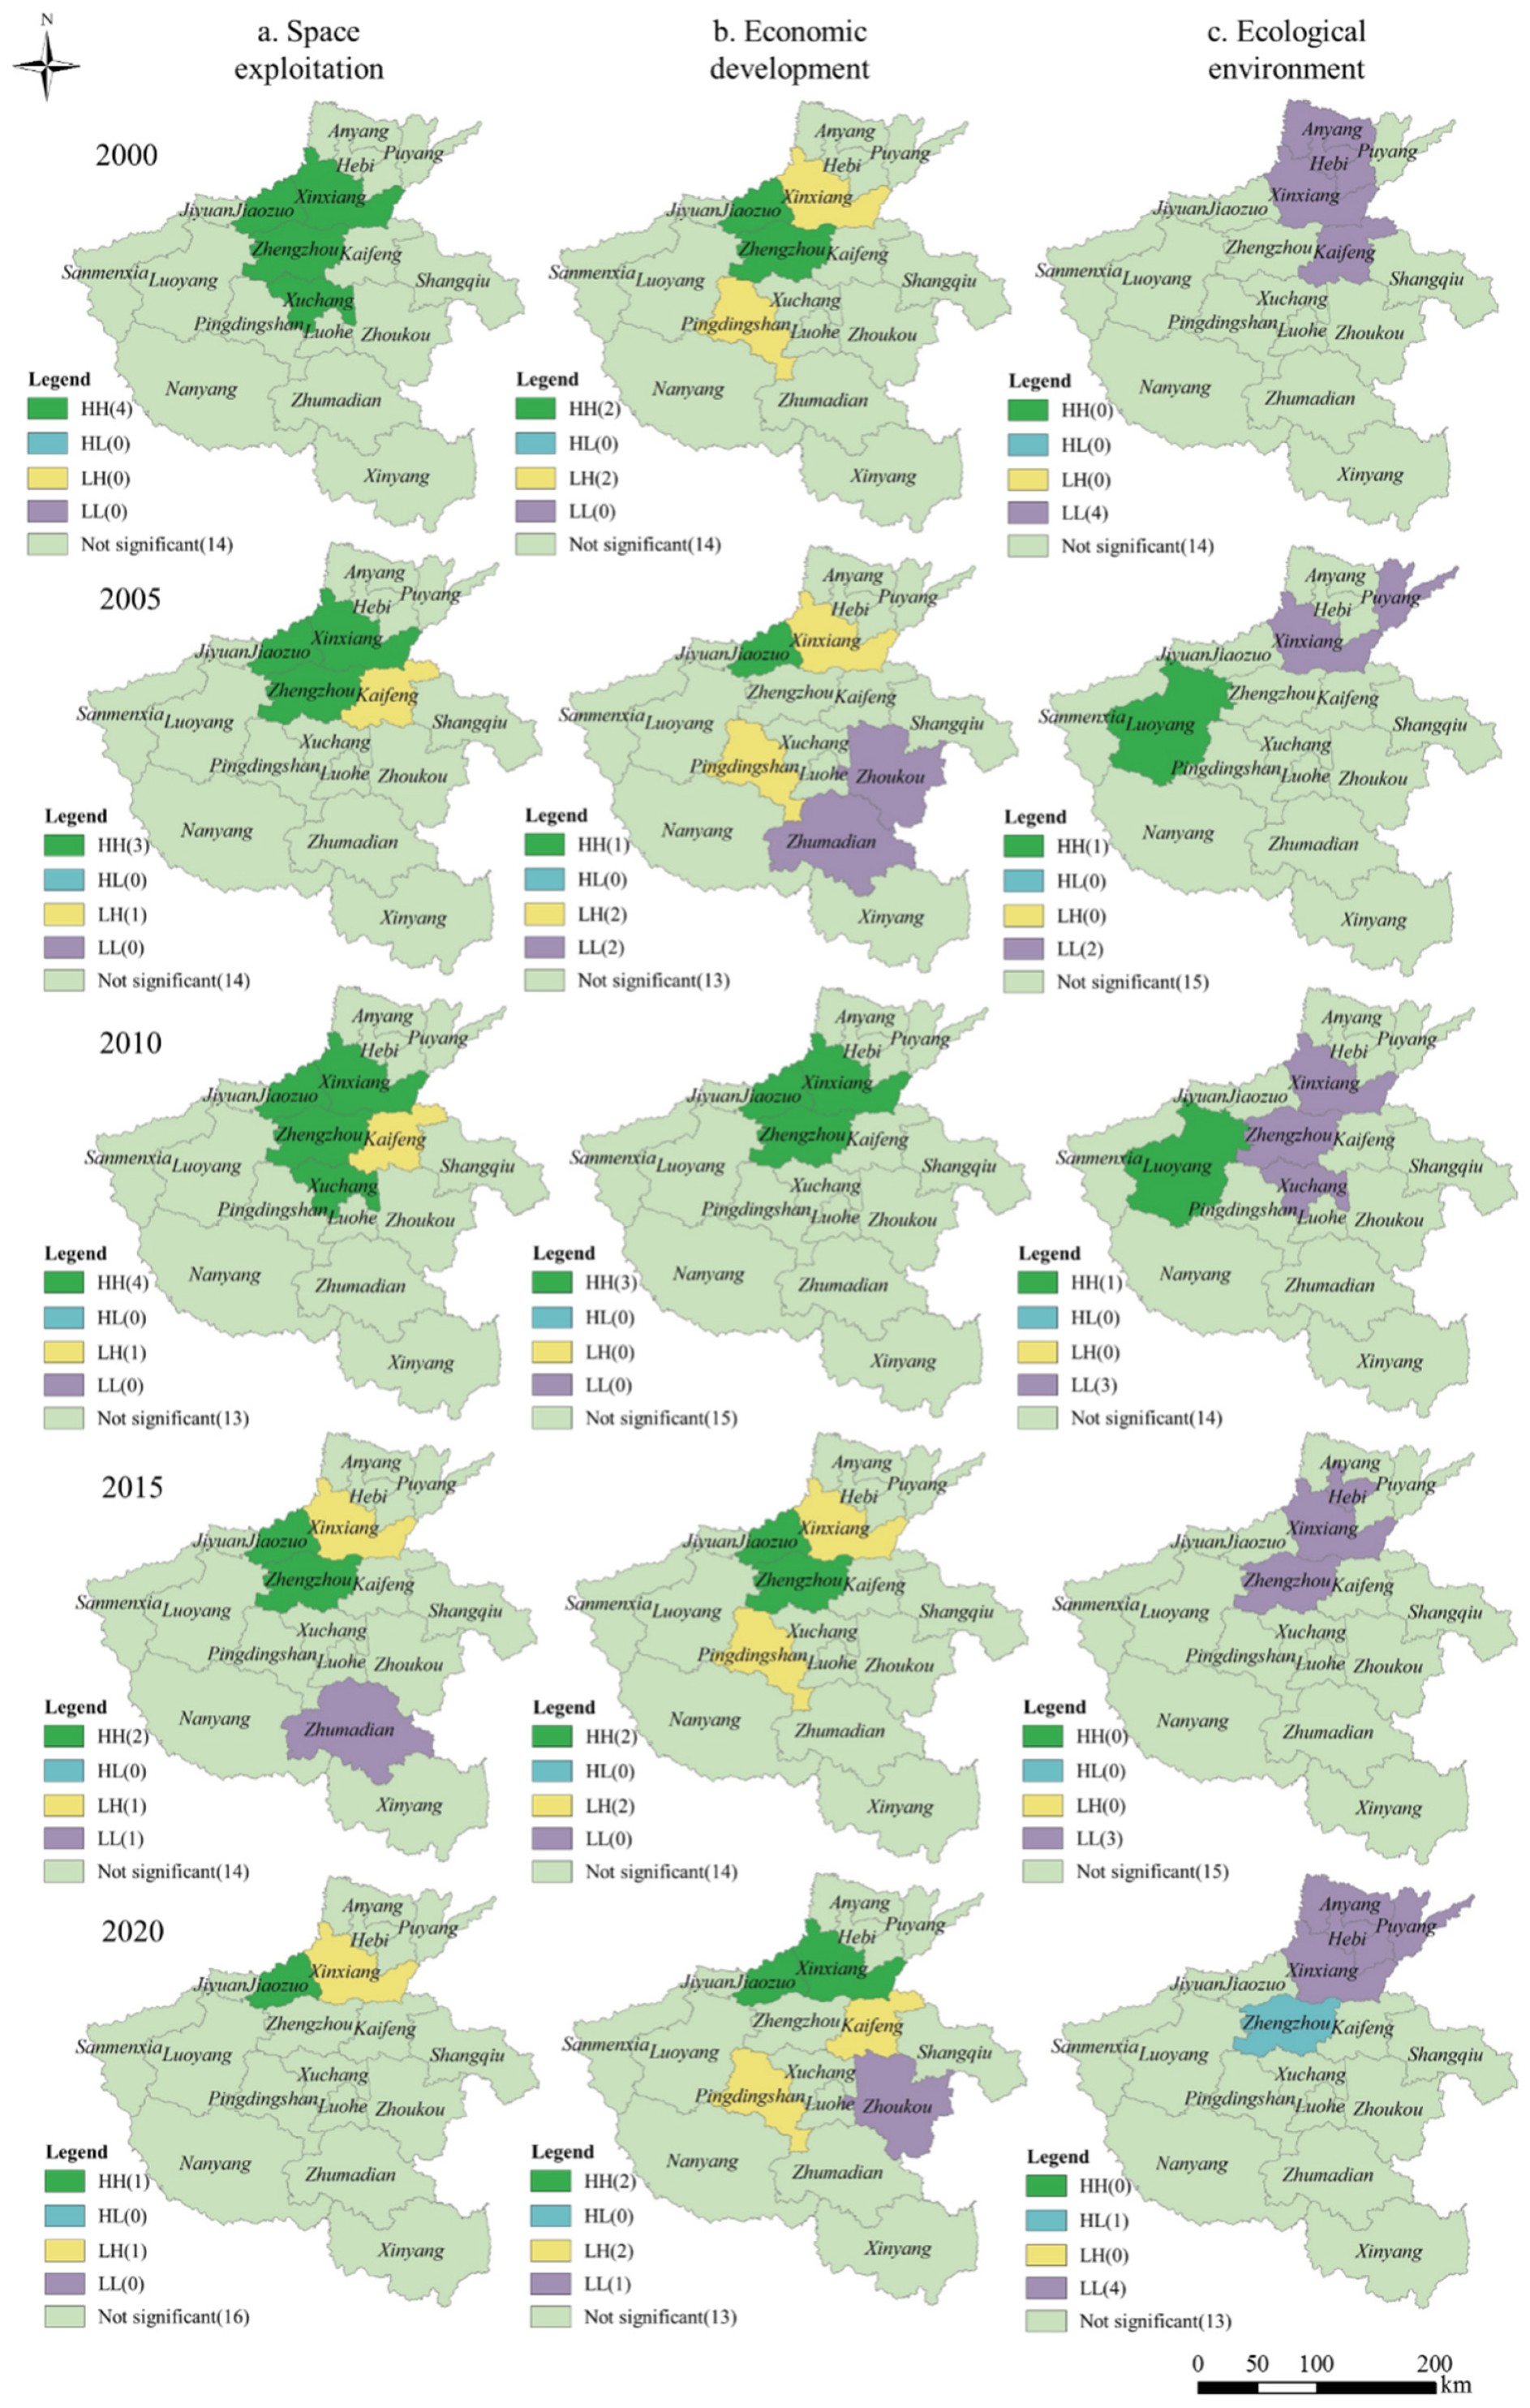
Based on the global autocorrelation of these three systems, we used the LISA diagram for local spatial autocorrelation analysis to explore the spatial heterogeneity of local regions (Figure 8). The findings show that the spatial differentiation characteristics of SEE are visible in Henan Province. Specifically, (1) in terms of space exploitation, changes have occurred in the past 20 years, with a decline in HH agglomeration units. Meanwhile, the concentration area shrank from the central north to the north. There is no major change in the quantity of the LH area, and the spatial position has been changed from Kaifeng City to Xinxiang City (Figure 8a). (2) In terms of economic development, the HH agglomeration unit did not reduce from 2000 to 2020, but its location moved northward. LL units were added in 2005 and reduced to one unit by 2020, but LH units have not changed significantly (Figure 8b). (3) In terms of ecological environment, the number of LL units did not change from 2000 to 2020, but there were differences in the clustering locations during different years (Figure 8c). In 2000 and 2020, LL units were concentrated in the Northeast region. In 2010 and 2015, LL units were transferred to Xinxiang City, Zhengzhou City, and Xuchang City in the north and central regions, respectively, while HL units were added in 2020.
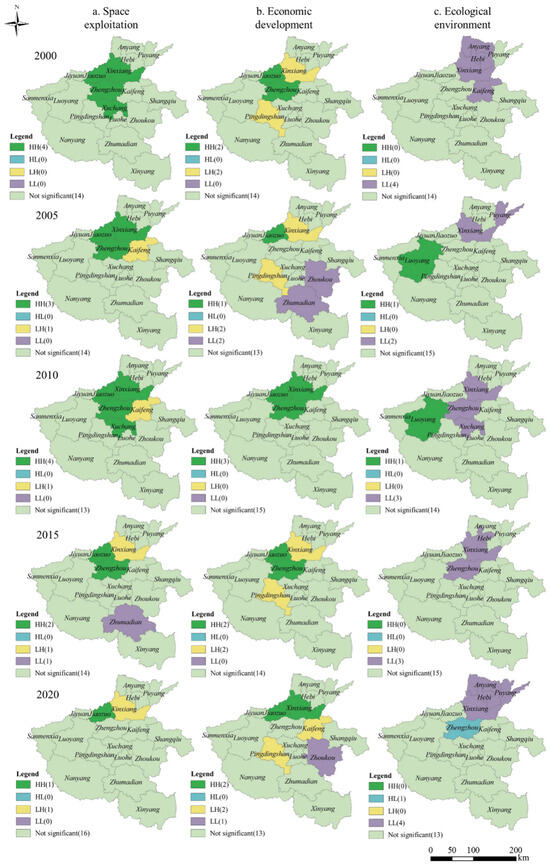
Figure 8.
Local spatial correlation of coupling coordination degree of SEE from 2000 to 2020. (a) Local spatial correlation of coupling coordination degree of space exploitation. (b) Local spatial correlation of coupling coordination degree of economic development. (c) Local spatial correlation of coupling coordination degree of ecological environment.
Overall, the SEE of Henan Province are constrained by regional differentiation regulations while also matching the stage of societal development. Over time, positive correlation types (HH, LL) cluster significantly and exhibit the “aggregated” distribution, whereas negative correlation types (HL, LH) exhibit low clustering and a “scattered” pattern.
3.3.2. Spatial Relationship of Collaboration/Trade-Off between SEE
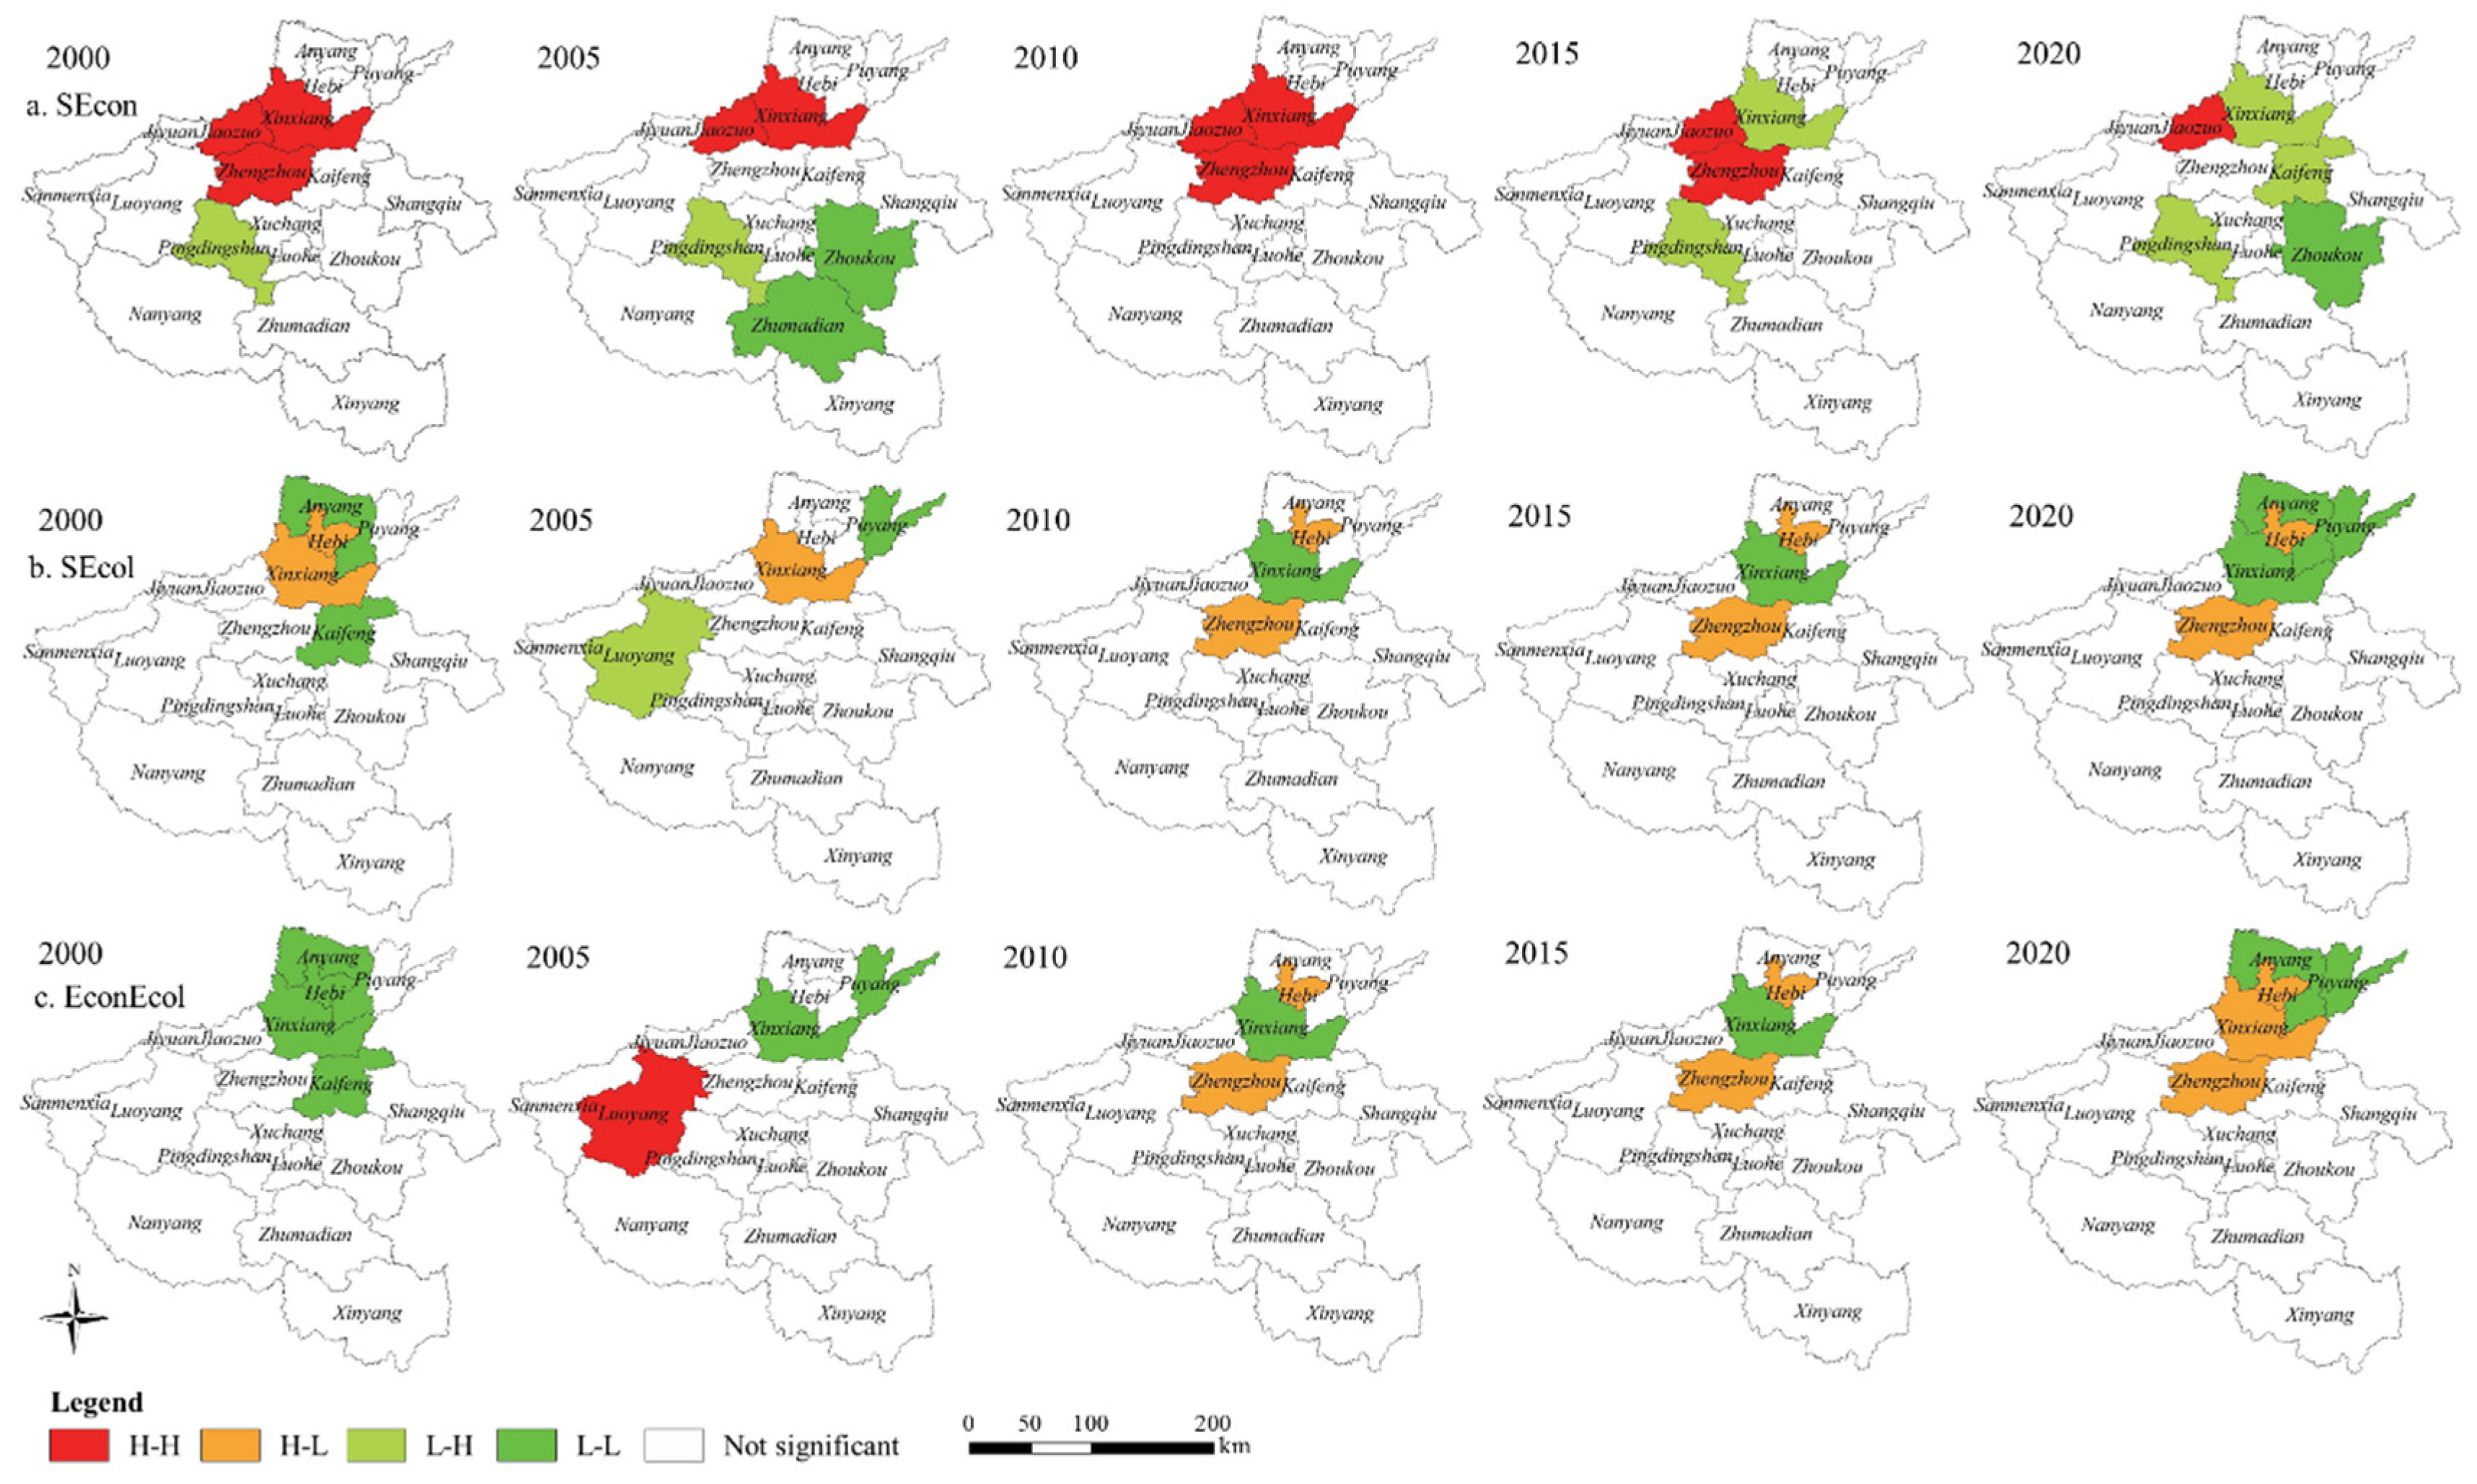
To make a quantitative analysis on spatial heterogeneity and correlation between SSE, it is necessary to diagnose the collaboration/trade-off relationship of SSE from a spatial perspective. Therefore, we used GeoDa software and a spatial autocorrelation model to calculate the bivariate LISA values of SEE from 2000 to 2020, based on 18 cities as basic units. The specific spatial relationship between collaboration and trade-off is as follows.
- As shown in Figure 9a, the collaborative relationship was concentrated in LL (Xinxiang City, Jiaozuo City, Zhengzhou City) in 2000, while the trade-off relationship was concentrated in Pingdingshan City. By 2005, Zhoukou City and Zhumadian City had been added to the trade-off relationship. In 2020, the regional distribution of collaboration/trade-off relationships was scattered. The collaborative relationship was mainly located in Jiaozuo City in the north and Zhoukou City in the east. In addition, the trade-off relationship area was scattered in Xinxiang City, Kaifeng City, and Pingdingshan City.
 Figure 9. Spatial relationship of collaboration/trade-off between SEE from 2000 to 2020. (a) Spatial relationship of collaboration/trade-off between SEcon. (b) Spatial relationship of collaboration/trade-off between SEcol. (c) Spatial relationship of collaboration/ trade-off between EconEcol.
 - As shown in Figure 9b, the collaborative relationship was concentrated in Xinxiang City and Hebi City in 2000, while the trade-off relationship was concentrated in Anyang City and Kaifeng City. In 2005, the distribution of trade-off relationship was scattered. The collaboration/trade-off pattern in 2010 and 2015 was similar, both concentrated in the central and northern regions. In 2020, the collaborative relationship expanded to the north, while the trade-off areas were scattered Hebi City and Zhengzhou City.
- As shown in Figure 9c, most of the collaborative relationships were in the northern regions in 2000. In 2005, collaborative relationships were mainly concentrated in HH (Luoyang City) and LL (Xinxiang City, Puyang City). In 2010 and 2015, the collaboration/trade-off pattern was similar, with the collaborative relationship mainly manifested as LL aggregation and trade-off relationship concentrated in Hebi City and Zhengzhou City. By 2020, the collaborative relationship areas were transferred to Anyang City and Puyang City.
4. Discussion
4.1. The Coupling Coordination Characteristics at Different Stages Are Obvious
This study found that there are significant trend changes in SEE in Henan Province within the research range. Especially in different stages of development, such as from 2000 to 2010, the degree of coupling coordination fluctuated significantly. After 2010, the degree of coupling coordination gradually stabilized, which is related to the government’s policy orientation. In addition, some cities with better economic development have better coupling coordination degrees, such as Zhengzhou City, Jiaozuo City, and Jiyuan City. This indicates that the coordination between SEE is also closely related to urban development. This conclusion is consistent with the research of many scholars [60,61,62]. Some scholars believe that the coordination between urban expansion and ecological environment depends not only on economic development, but also on policy preferences [63]. In addition, through analysis, this study further emphasizes the symbiotic characteristics between SEE. The research perspective and achievements enrich the existing exploration of the coordination level between urbanization development and ecological environment.
4.2. The Coupling Coordination Pattern between SEcol Has Undergone Significant Changes
As the foundation of urban development, land space often accompanies the instability of the ecological environment during the development process. Space exploitation is an important foundational activity to promote regional economic development [1]. Ecological environment is an important guarantee for social and economic development. The degree of coupling coordination between SEcol is crucial for urban development. This study measures the coupling coordination degree between SEcol and finds that, over time, the coordination degree between SEcol gradually weakens, transitioning from a primary coordination to a barely coordinated state. The reason is that 44.3% of the land space in Henan Province is mountainous and hilly, with strong ecological sensitivity, and the land suitable for cultivation and urban industrial construction is gradually decreasing [64]. More importantly, with the expansion of construction land, agricultural and ecological spaces are constantly being squeezed, leading to ecosystem imbalances [65,66]. This is similar to the research of Ren [67], who believed that socio-economic and policy factors are the key factors in determining whether the ecological quality of Henan Province is good or not. The research on the coupling and coordination relationship between SEcol in this study is also applicable to other countries. Scholars from other countries believe that the development of cities cannot be separated from a good ecological environment and adopt a series of methods to explore the relationship between urban development and ecological environment [68,69].
4.3. Rationality of the Collaboration/Trade-Off Relationship between SEE
Exploring the collaboration/trade-off relationship between SEE is the key to coordinating internal relationships within cities and improving regional competitiveness. Traditional methods for exploring collaborative relationships often use coupling coordination analysis and correlation analysis [70]. Regarding collaboration/trade-off relationship, some scholars have conducted research on ecosystem service, spatial function, urban development, and other aspects [71,72,73]. Zheng [74] believed that the trade-off index could be used to quantify the degree of collaboration between different ecosystem services. Kang [75] took the mechanical equilibrium model to measure the collaboration/trade-off relationship of the “production-living-ecological” functions. Compared to previous studies, this study explores the collaboration/trade-off relationship between SEE through autocorrelation analysis, providing a new perspective for clarifying the interactive relationship between SEE.
Research has shown that there is a clear spatial differentiation characteristic in the collaboration/trade-off between urban SEE in Henan Province. The alternating changes in the collaboration/trade-off relationship over time reflect the dynamic development process of SEE, which is consistent with the regional urbanization process. This is similar to the research of Li [76], who believed that the collaboration/trade-off relationship of cross changes in different functions follows the law of regional differentiation and socio-economic development status.
4.4. Policy Implications and Limitations
In order to achieve coordinated development of urban space, it is necessary to focus on the overall coordination of SEE in the future, and improving the driving capacity, production efficiency, and resource utilization level of cities. Furthermore, it is necessary to promote the transformation of cities with an imbalance in SEE towards coordinated development and, thus, achieve an overall improvement in urban quality. Meanwhile, the government should systematically increase regional capital and technology investment, promote industrial structure optimization, improve the quality of urbanization development, and accelerate the development of ecological and green industries. Afterwards, we need to consider the symbiotic benefits of space, strengthen institutional construction, refine industrial policy systems for different urbanization areas, and promote coordinated development of national spatial economy, society, and ecology. Finally, it is necessary to choose a spatial management mode and follow the path of spatial management transformation from a single, flat management style to a three-dimensional management style, that is based on the collaborative relationship between SEE, and design governance systems and innovative policies that are in line with the urban space of Henan Province. Then, with the help of big data platforms, it will be possible to improve the spatial management system through technological collaboration, institutional mechanism innovation, and other means, providing a basis for ensuring the high-quality development of urban space.
However, this study only measures the coupling coordination degree and trade-off relationship between SEE. Therefore, subsequent research needs to consider the interactive mechanisms and influencing factors between different dimensions. In addition, more case areas can be selected to enhance the operability of research experience promotion.
5. Conclusions
This study constructs an indicator system for SEE from three dimensions. At the same time, a linear weighting method, coupling coordination analysis, and spatial correlation analysis are applied to quantitatively analyze the coupling differentiation characteristics and collaboration/trade-off relationship between SEE in Henan Province from 2000 to 2020. The following conclusions can be obtained: (1) With the passage of time, the comprehensive level of SEE shows an obvious trend of change. From 2000 to 2020, there were significant spatial differences in the coupling coordination degree of SEE among different cities, all of which were in varying degrees of coordination or on the verge of imbalance. However, the overall of coupling coordination level is steadily developing and tends to improve. (2) From the perspective of spatial correlation, SEE are constrained by the regional differentiation laws and social development stages. Over time, positive correlation types (HH, LL) cluster significantly and exhibit an “aggregated” distribution, and negative correlation types (HL, LH) have low clustering and exhibit a “scattered” pattern. (3) There is a spatial collaborative relationship between SEE. From 2000 to 2020, there was a trend of collaboration/trade-off fluctuations, with significant spatial differences in collaboration/trade-off relationships during different years.
Author Contributions
Conceptualization, X.X. and X.L.; methodology, X.X.; software, X.X. and K.W.; validation, X.X.; formal analysis, X.X.; investigation, X.X.; resources, X.X.; data curation, Y.L.; writing—original draft preparation, X.X.; writing—review and editing, S.G. and K.W.; visualization, X.X.; supervision, X.L.; project administration, X.L; funding acquisition, X.L and Y.L. All authors have read and agreed to the published version of the manuscript.
Funding
This research was financed by the National Natural Science Foundation of China (Grant No. 42371314, 71874192), Henan Provincial Natural Science Foundation (Grant No. 222300420465), Research Funds of Henan Agricultural University (Grant No. 30501394), Scientific and Technological Research Project in Henan Province (Grant No. 242102320228), Henan Province Key Research Project Plan for Higher Education Institutions (Grant No. 24A630017).
Data Availability Statement
Data are contained within the article.
Acknowledgments
The authors would like to thank the anonymous reviewers for their comments and suggestions.
Conflicts of Interest
The authors declare no conflicts of interest.
References
- Angel, S. Urban Forms and Future Cities: A Commentary. Urban. Plan. 2017, 2, 1–5. [Google Scholar] [CrossRef]
- Liu, Y.; Liu, D.; Fu, Z.; Yu, H.; Zhu, L. The Differentiation Mechanism of Coupling Degree Among Space Exploitation, Economy Development and Environment Evolution in Harbin-Dalian Giant Urban Belt. Sci. Geogr. Sin. 2018, 38, 662–671. (In Chinese) [Google Scholar]
- Li, J.; Sun, W.; Li, M.; Meng, L. Coupling coordination degree of production, living and ecological spaces and its influencing factors in the Yellow River Basin. J. Clean. Prod. 2021, 298, 126803. [Google Scholar] [CrossRef]
- Menhas, R.; Mahmood, S.; Tanchangya, P.; Safdar, M.N.; Hussain, S. Sustainable Development under Belt and Road Initiative: A Case Study of China-Pakistan Economic Corridor’s Socio-Economic Impact on Pakistan. Sustainability 2019, 11, 6143. [Google Scholar] [CrossRef]
- Xing, Q.; He, Z.; Wei, L. Evaluation of linkage relationships between carbon emissions and economic development based on the decoupling model and the VAR model: A case study of Shanxi Province (China). Environ. Sci. Pollut. Res. 2023, 30, 66651–66664. [Google Scholar] [CrossRef] [PubMed]
- Zhu, C.; Yuan, S.; Yang, L. Evolution of territorial spatial pattern and associated eco-environmental effects from the perspective of major functional zones: A case study of Zhejiang Province. Acta Ecol. Sin. 2023, 43, 4488–4501. (In Chinese) [Google Scholar]
- Zhang, Y.; Chen, M. Spatial systematic cognition and ideas on spatial planning system reform. China Land. Sci. 2016, 30, 11–21. (In Chinese) [Google Scholar]
- Sutton, P.C. A scale-adjusted measure of “Urban sprawl” using nighttime satellite imagery. Remote Sens. Environ. 2003, 86, 353–369. [Google Scholar] [CrossRef]
- Zhang, X.; Li, C. Review on urban sprawl’s connotation and dynamic mechanism based on domestic and international comparison. Mod. Urban. Res. 2013, 2013, 29–35. (In Chinese) [Google Scholar]
- Jaeger, J.A.G.; Bertiller, R.; Schwick, C.; Kienast, F. Suitability criteria for measures of urban sprawl. Ecol. Indic. 2010, 10, 397–406. [Google Scholar] [CrossRef]
- Sorensen, A. Land Readjustment, Urban Planning and Urban Sprawl in the Tokyo Metropolitan Area. Urban. Stud. 1999, 36, 2333–2360. [Google Scholar] [CrossRef]
- Gao, B.; Huang, Q.; He, C.; Sun, Z.; Zhang, D. How does sprawl differ across cities in China ? A multi-scale investigation using nighttime light and census data. Landsc. Urban. Plan. 2016, 148, 89–98. [Google Scholar] [CrossRef]
- Shih, W.; Ahmad, S.; Chen, Y.; Lin, T.; Mabon, L. Spatial relationship between land development pattern and intra-urban thermal variations in Taipei. Sustain. Cities Soc. 2020, 62, 102415. [Google Scholar] [CrossRef] [PubMed]
- Yin, J.; Fu, P.; Cheshmehzangi, A.; Li, Z.; Dong, J. Investigating the Changes in Urban Green-Space Patterns with Urban Land-Use Changes: A Case Study in Hangzhou, China. Remote Sens. 2022, 14, 5410. [Google Scholar] [CrossRef]
- Ou, M.; Li, J.; Fan, X.; Gong, J. Compound Optimization of Territorial Spatial Structure and Layout at the City Scale from “Production—Living—Ecological” Perspectives. Int. J. Environ. Res. Public Health 2023, 20, 495. [Google Scholar] [CrossRef] [PubMed]
- Handayanto, R.T.; Tripathi, N.K.; Kim, S.M. Achieving a Sustainable Urban Form through Land Use Optimisation: Insights from Bekasi City’s Land-Use Plan (2010–2030). Suatainability 2017, 9, 221. [Google Scholar] [CrossRef]
- Rahman, M.M.; Szab’o, G. Multi-objective urban land use optimization using spatial data: A systematic review. Sustain. Cities Soc. 2021, 74, 103214. [Google Scholar] [CrossRef]
- Strauch, M.; Cord, A.F.; Pätzold, C.; Lautenbach, S.; Kaim, A.; Schweitzer, C.; Seppelt, R.; Volk, M. Constraints in multi-objective optimization of land use allocation–repair or penalize ? Environ. Model. Softw. 2019, 118, 241–251. [Google Scholar] [CrossRef]
- Tian, F.; Li, M.; Han, X.; Liu, H.; Mo, B. A Production—Living—Ecological Space Model for Land-Use Optimisation: A case study of the core Tumen River region in China. Ecol. Modell. 2020, 437, 109310. [Google Scholar] [CrossRef]
- Hu, Z.; Wu, Z.; Yuan, X.; Zhao, Z.; Liu, F. Spatial—Temporal evolution of production—Living—Ecological space and layout optimization strategy in eco-sensitive areas: A case study of typical area on the Qinghai-Tibetan Plateau, China. Environ. Sci. Pollut. Res. 2023, 30, 79807–79820. [Google Scholar] [CrossRef] [PubMed]
- Bourque, K.; Schiller, A.; Loyola, C.; Mcphail, L.; Bagnasco, W.; Ayres, A.; Larsen, A. Balancing agricultural production, groundwater management, and biodiversity goals: A multi-benefit optimization model of agriculture in Kern County, California. Sci. Total Environ. 2019, 670, 865–875. [Google Scholar] [CrossRef] [PubMed]
- Parry, J.A.; Ganaie, S.A.; Bhat, M.S. GIS based land suitability analysis using AHP model for urban services planning in Srinagar and Jammu urban centers of J & K, India. J. Urban. Manag. 2018, 7, 46–56. [Google Scholar] [CrossRef]
- Wang, L.; Zhou, D.; Wang, Y.; Zha, D. An empirical study of the environmental Kuznets curve for environmental quality in Gansu province. Ecol. Indic. 2015, 56, 96–105. [Google Scholar] [CrossRef]
- Simionescu, M. Revised environmental Kuznets Curve in CEE countries. Evidence from panel threshold models for economic sectors. Environ. Sci. Pollut. Res. 2021, 28, 60881–60899. [Google Scholar] [CrossRef] [PubMed]
- Leal, H.; Marques, C. The evolution of the environmental Kuznets curve hypothesis assessment: A literature review under a critical analysis perspective. Heliyon 2022, 8, e11521. [Google Scholar] [CrossRef] [PubMed]
- He, J.; Wang, S.; Liu, Y.; Ma, H.; Liu, Q. Examining the relationship between urbanization and the eco-environment using a coupling analysis: Case study of Shanghai, China. Ecol. Indic. 2017, 77, 185–193. [Google Scholar] [CrossRef]
- Lawson, L.A.; Martino, R.; Nguyen-van, P. Environmental convergence and environmental Kuznets curve: A unified empirical framework. Ecol. Modell. 2020, 437, 109289. [Google Scholar] [CrossRef]
- Zhao, H.; Jiang, X.; Gu, B.; Wang, K. Evaluation and Functional Zoning of the Ecological Environment in Urban Space—A Case Study of Taizhou, China. Sustainability 2022, 14, 6619. [Google Scholar] [CrossRef]
- Chen, W.; Zeng, J.; Li, N. Change in land-use structure due to urbanisation in China. J. Clean. Prod. 2021, 321, 128986. [Google Scholar] [CrossRef]
- Liang, X.; Guan, Q.; Clarke, K.C.; Chen, G.; Guo, S.; Yao, Y. Mixed-cell cellular automata: A new approach for simulating the spatio–temporal dynamics of mixed land use structures. Landsc. Urban. Plan. 2021, 205, 103960. [Google Scholar] [CrossRef]
- Wang, Y.; Zhao, L.; Sobkowiak, S.; Guan, X.; Wang, S. Impact of urban landscape and environmental externalities on spatial differentiation of housing prices in Yangzhou City. J. Geogr. Sci. 2015, 25, 1122–1136. (In Chinese) [Google Scholar] [CrossRef]
- Li, W.; Cai, Z.; Jin, L. Spatiotemporal characteristics and influencing factors of the coupling coordinated development of production-living-ecology system in China. Ecol. Indic. 2022, 145, 109738. [Google Scholar] [CrossRef]
- Kang, J.; Li, C.; Zhang, B.; Zhang, J.; Li, M.; Hu, Y. How do natural and human factors influence ecosystem services changing ? A case study in two most developed regions of China. Ecol. Indic. 2023, 146, 109891. [Google Scholar] [CrossRef]
- Feng, Y.; He, S.; Li, G. Interaction between urbanization and the eco-environment in the Pan-Third Pole region. Sci. Total Environ. 2021, 789, 148011. [Google Scholar] [CrossRef] [PubMed]
- Zou, C.; Zhu, J.; Lou, K.; Yang, L. Coupling coordination and spatiotemporal heterogeneity between urbanization and ecological environment in Shaanxi Province, China. Ecol. Indic. 2022, 141, 109152. [Google Scholar] [CrossRef]
- Tan, S.; Liu, Q.; Han, S. Spatial-temporal evolution of coupling relationship between land development intensity and resources environment carrying capacity in China. J. Environ. Manag. 2021, 301, 113778. [Google Scholar] [CrossRef] [PubMed]
- Chen, S.; Yao, S. Evaluation and dynamic prediction of ecological security from the perspective of sustainable development: A case study of Shaanxi Province, China. Environ. Sci. Pollut. Res. 2022, 29, 42331–42346. [Google Scholar] [CrossRef] [PubMed]
- Wu, S.; Tian, C.; Li, B.; Wang, J.; Wang, Z. Ecological environment health assessment of lake water ecosystem system based on simulated annealing-projection pursuit: A case study of plateau lake. Sustain. Cities Soc. 2022, 86, 104131. [Google Scholar] [CrossRef]
- Xie, X.; Li, X.; He, W. A land space development zoning method based on resource–environmental carrying capacity: A case study of henan, China. Int. J. Environ. Res. Public. Health 2020, 17, 900. [Google Scholar] [CrossRef] [PubMed]
- Long, H.; Lin, B.; Ou, Y.; Chen, Q. Spatio-temporal analysis of driving factors of water resources consumption in China. Sci. Total Environ. 2019, 690, 1321–1330. [Google Scholar] [CrossRef] [PubMed]
- Zhang, J.; Wang, H.; Ma, L.; Wang, J.; Wang, J.; Wang, Z. Structural path decomposition analysis of resource utilization in China, 1997–2017. J. Clean Prod. 2021, 322, 129006. [Google Scholar] [CrossRef]
- Qayyum, U.; Sabir, S.; Anjum, S. Urbanization, informal economy, and ecological footprint quality in South Asia. Environ. Sci. Pollut. Res. 2021, 28, 67011–67021. [Google Scholar] [CrossRef] [PubMed]
- Elgin, C.; Oztunali, O. Pollution and informal economy. Econ. Syst. 2014, 38, 333–349. [Google Scholar] [CrossRef]
- Azam, M.; Khan, A.Q. Urbanization and environmental degradation: Evidence from four SAARC countries—Bangladesh, India, Pakistan, and Sri Lanka. Environ. Prog. Sustain. Energy 2016, 35, 823–832. [Google Scholar] [CrossRef]
- Xu, M.; Hu, W. A research on coordination between economy, society and environment in China: A case study of Jiangsu. J. Clean. Prod. 2020, 258, 120641. [Google Scholar] [CrossRef]
- Weng, Q.; Lian, H.; Qin, Q. Spatial disparities of the coupling coordinated development among the economy, environment and society across China’s regions. Ecol. Indic. 2022, 143, 109364. [Google Scholar] [CrossRef]
- Xie, X.; Li, X.; Fan, H. Research on the Interactive Coupling Relationship between Land Space Development and Eco-Environment from the Perspective of Symbiosis: A Practical Analysis of Henan, China. Land 2022, 11, 1252. [Google Scholar] [CrossRef]
- Yan, X.; Chen, M.; Chen, M. Coupling and Coordination Development of Australian Energy, Economy, and Ecological Environment Systems from 2007 to 2016. Sustainability 2019, 11, 6568. [Google Scholar] [CrossRef]
- Ozcelik, M. Environmental pollution and its effect on water sources from marble quarries in western Turkey. Environ. Earth Sci. 2016, 75, 796. [Google Scholar] [CrossRef]
- Hou, H.; Su, L.; Guo, D.; Xu, H. Resource utilization of solid waste for the collaborative reduction of pollution and carbon emissions: Case study of fly ash. J. Clean. Prod. 2023, 383, 135449. [Google Scholar] [CrossRef]
- Henan Provincial People’s Government (In Chinese). Available online: https://www.henan.gov.cn/jchn/ (accessed on 27 March 2024).
- Henan Province Bureau of Statistics. Henan Statistical Yearbook; Chinese Statistics Press: Beijing, China, 2023. (In Chinese) [Google Scholar]
- Wang, Z.; Liang, L.; Sun, Z.; Wang, X. Spatiotemporal differentiation and the factors influencing urbanization and ecological environment synergistic effects within the Beijing-Tianjin-Hebei urban agglomeration. J. Environ. Manag. 2019, 243, 227–239. [Google Scholar] [CrossRef] [PubMed]
- Zha, Q.; Liu, Z.; Song, Z.; Wang, J. A study on dynamic evolution, regional differences and convergence of high-quality economic development in urban agglomerations: A case study of three major urban agglomerations in the Yangtze river economic belt. Front. Environ. Sci. 2022, 10, 1012304. [Google Scholar] [CrossRef]
- Jiang, L.; Liu, Y.; Wu, S.; Yang, C. Analyzing ecological environment change and associated driving factors in China based on NDVI time series data. Ecol. Indic. 2021, 129, 107933. [Google Scholar] [CrossRef]
- Xiao, Y.; Lan, G.; Ou, Y.; Zhang, L.; Xia, J. Impact of urbanization on the spatial and temporal evolution of the water system pattern: A study of the Wuhan metropolitan area in China. Ecol. Indic. 2023, 153, 110408. [Google Scholar] [CrossRef]
- Xie, X.; Li, X.; Fan, H.; He, W. Spatial analysis of production-living-ecological functions and zoning method under symbiosis theory of Henan, China. Environ. Sci. Pollut. Res. 2021, 28, 69093–69110. [Google Scholar] [CrossRef] [PubMed]
- Cai, J.; Li, X.; Liu, L.; Chen, Y.; Wang, X.; Lu, S. Coupling and coordinated development of new urbanization and agro-ecological environment in China. Sci. Total Environ. 2021, 776, 145837. [Google Scholar] [CrossRef] [PubMed]
- Wang, J.; Wang, C.; Yu, S.; Li, M.; Cheng, Y. Coupling Coordination and Spatiotemporal Evolution between Carbon Emissions, Industrial Structure, and Regional Innovation of Counties in Shandong Province. Sustainability 2022, 14, 7484. [Google Scholar] [CrossRef]
- Liang, L.; Wang, Z.; Fang, C.; Sun, Z. Spatiotemporal differentiation and coordinated development pattern of urbanization and the ecological environment of the Beijing-Tianjin-Hebei urban agglomeration. Acta Ecol. Sin. 2019, 39, 1212–1225. (In Chinese) [Google Scholar]
- Chen, J.; Zhang, W.; Song, L.; Wang, Y. The coupling effect between economic development and the urban ecological environment in Shanghai port. Sci. Total Environ. 2022, 841, 156734. [Google Scholar] [CrossRef] [PubMed]
- Zeng, P.; Wei, X.; Duan, Z. Coupling and coordination analysis in urban agglomerations of China: Urbanization and ecological security perspectives. J. Clean. Prod. 2022, 365, 132730. [Google Scholar] [CrossRef]
- Ju, X.; Li, W.; He, L.; Li, J.; Han, L.; Mao, J. Ecological redline policy may significantly alter urban expansion and affect surface runoff in the Beijing-Tianjin-Hebei megaregion of China. Environ. Res. Lett. 2020, 15, 1040b1. [Google Scholar] [CrossRef]
- Gao, C.; Wang, J.; Wang, M.; Zhang, Y. Simulating Urban Agglomeration Expansion in Henan Province, China: An Analysis of Driving Mechanisms Using the FLUS Model with Considerations for Urban Interactions and Ecological Constraints. Land 2023, 12, 1189. [Google Scholar] [CrossRef]
- Ye, Y.; Su, Y.; Zhang, H.; Liu, K.; Wu, Q. Construction of an ecological resistance surface model and its application in urban expansion simulations. J. Geogr. Sci. 2015, 25, 211–224. (In Chinese) [Google Scholar] [CrossRef]
- Yao, Y.; Ma, L.; Che, X.; Dou, H. Simulation study of urban expansion under ecological constraint—Taking Yuzhong County, China as an example. Urban. For. Urban. Green. 2021, 57, 126933. [Google Scholar] [CrossRef]
- Ren, X.; Zhang, M.; Qian, J.; Li, S.; Wang, J.; Du, J. Analyzing Spatio-Temporal Change in Ecosystem Quality and Its Driving Mechanism in Henan Province, China from 2010 to 2020. Sustainability 2022, 14, 11742. [Google Scholar] [CrossRef]
- Ahmad, M.; Ahmed, Z.; Gavurova, B.; Olah, J. Financial Risk, Renewable Energy Technology Budgets, and Environmental Sustainability: Is Going Green Possible? Front. Environ. Sci. 2022, 10, 909190. [Google Scholar] [CrossRef]
- Khan, M.Q.S.; Yan, Q.; Alvarado, R.; Ahmad, M. A novel EKC perspective: Do agricultural production, energy transition, and urban agglomeration achieve ecological sustainability? Environ. Sci. Pollut. Res. 2023, 30, 48471–48483. [Google Scholar] [CrossRef] [PubMed]
- Ma, Y.; Zheng, M.; Xu, F.; Qian, Y.; Liu, M.; Zheng, X.; Liu, J. Modeling and exploring the coordination relationship between green infrastructure and land use eco-efficiency: An urban agglomeration perspective. Environ. Sci. Pollut. Res. 2023, 30, 92537–92554. [Google Scholar] [CrossRef] [PubMed]
- Li, B.; Chen, N.; Wang, Y.; Wang, W. Spatio-temporal quantification of the trade-offs and synergies among ecosystem services based on grid-cells: A case study of Guanzhong Basin, NW China. Ecol. Indic. 2018, 94, 246–253. [Google Scholar] [CrossRef]
- Zhu, C.; Dong, B.; Li, S.; Lin, Y.; Shahtahmassebi, A.; You, S.; Zhang, J.; Gan, M.; Yang, L.; Wang, K. Identifying the trade-offs and synergies among land use functions and their influencing factors from a geospatial perspective: A case study in Hangzhou, China. J. Clean. Prod. 2021, 314, 128026. [Google Scholar] [CrossRef]
- Loiselle, A.; Proulx, R.; Larocque, M.; Pellerin, S. Synergies and trade-offs among ecosystems functions and services for three types of lake-edge wetlands. Ecol. Indic. 2023, 154, 110547. [Google Scholar] [CrossRef]
- Zheng, Z.; Fu, B.; Feng, X. GIS-based Analysis for Hotspot Identification of Tradeoff Between Ecosystem Services: A Case Study in Yanhe Basin, China. Chin. Geogra Sci. 2016, 26, 466–477. (In Chinese) [Google Scholar] [CrossRef]
- Kang, Q.; Guo, Q.; Ding, Y.; Zhang, Y. Tradeoffs/synergies analysis of “Production-Living-Ecological” functions in Shanxi Province. J. Nat. Resour. 2021, 36, 1195–1207. (In Chinese) [Google Scholar] [CrossRef]
- Li, X.; Fang, B.; Yin, R.; Rong, H. Spatial-temporal change and collaboration/trade-off relationship of “production-living-ecological” functions in county area of Jiangsu province. J. Nat. Resour. 2019, 34, 2363–2377. (In Chinese) [Google Scholar]

Disclaimer/Publisher’s Note: The statements, opinions and data contained in all publications are solely those of the individual author(s) and contributor(s) and not of MDPI and/or the editor(s). MDPI and/or the editor(s) disclaim responsibility for any injury to people or property resulting from any ideas, methods, instructions or products referred to in the content. |
© 2024 by the authors. Licensee MDPI, Basel, Switzerland. This article is an open access article distributed under the terms and conditions of the Creative Commons Attribution (CC BY) license (https://creativecommons.org/licenses/by/4.0/).