Article

Changes in Surface Runoff and Temporal Dispersion in a Restored Montane Watershed on the Qinghai–Tibetan Plateau

by
Xiaofeng Ren
1,2,3,*,
Erwen Xu
1,2,3,
C. Ken Smith
4,
Michael Vrahnakis
5,
Wenmao Jing
1,2,3,
Weijun Zhao
1,
Rongxin Wang
1,2,3,
Xin Jia
1,2,
Chunming Yan
1,2 and
Ruiming Liu
1
1
Gansu Qilian Mountain Water Conservation Forest Research Institute, Zhangye 734000, China
2
Qilian Mountain Eco-Environment Research Center of Gansu Province, Lanzhou 730000, China
3
Gansu Qilian Mountain Forest Ecosystem of the State Research Station, Zhangye 734000, China
4
Department of Environmental Sciences, University of Arizona, Tucson, AZ 85727, USA
5
Department of Forestry, Wood Sciences and Design, University of Thessaly, 43131 Karditsa, Greece
*
Author to whom correspondence should be addressed.
Land 2024, 13(5), 583; https://doi.org/10.3390/land13050583
Submission received: 5 March 2024 / Revised: 24 April 2024 / Accepted: 25 April 2024 / Published: 28 April 2024
(This article belongs to the Section Land Systems and Global Change)

Abstract

:
Surface runoff is a major component of the hydrological cycle, and it is essential for supporting the ecosystem services provided by grassland and forest ecosystems. It is of practical importance to understand the mechanisms and the dynamic processes of runoff in a river’s basin, and in this study, we focused on the restored montane Pailugou Basin in the Qilian Mountains, Gansu Province, China, since its water status is extremely important for the large arid area and local economies therein. Our purpose was to determine the annual variation in the surface runoff in the Pailugou Basin because it is important to understand the influence of climate fluctuations on surface water resources and the economy of the basin. In addition, little is known about the annual variations in precipitation and runoff in this region of the world. Daily atmospheric precipitation, air temperature and runoff data from 2000 to 2019 were analyzed by the calculation of the uneven annual distribution of surface runoff, the calculation of the complete adjustment coefficient, and the vector accumulation expressed by the concentration degree. We also used the cumulative anomaly approach to determine the interannual variation trend of runoff, while the change trend was quantified by the sliding average method. Finally, we used the Mann–Kendall mutation test method and regression analysis to establish the time-series trend for precipitation and runoff and to determine the period of abrupt runoff changes. The results indicated concentrated and positive distributions of surface runoff on an annual basis, with a small degree of dispersion, and an explicit concentration of extreme flows. The relative variation ranges exhibited a decreasing trend, and the distribution of the surface runoff gradually was uniform over the year. The runoff was highest from July to September (85% of the annual total). We also determined that annual surface runoff in the basin fluctuated over the 20-year period but showed an overall increasing trend, increasing by 3.94 × 10⁵ m3, with an average increase rate of 0.42 × 10⁵ m3 every ten years. From 2005 to 2014, the annual runoff and the proportion of runoff in the flood season (July to September) to the annual runoff fluctuated greatly. The correlation between the runoff and precipitation was significant (r = 0.839, p < 0.05), whereas the correlation between air temperature and surface runoff was low (r = 0.421, p < 0.05).

1. Introduction

Biophysical function and human wellbeing are essentially interlinked. Thus, there is a need to study in detail the ecohydrological processes and their role in delivering ecosystem services [1]. At high elevations, the hydrological functions are susceptible to the fluctuation in climate parameters, thus affecting human wellbeing and ecosystem functioning in the accompanying lowlands. Forage availability for livestock, land cultivation, forestry, and other economic activities are all affected by water availability or, in broader sense, by water runoff. Specifically, in high altitudes, changes in temperature, precipitation, and evaporation have important effects on runoff recharge and water consumption. Among them, the accelerated melting of glaciers caused by rising temperatures is the most active factor, and the change in rainfall and evaporation can directly affect the water balance [2,3,4].
The impact of the cryosphere shrinkage on water resources has been demonstrated in several regions, and in recent years, the focus has shifted to alpine regions [5,6,7,8]. The climate response in the region of Qilian Mountains in northern China is seen as more complicated due to its unique geomorphological formations [9]. The Qilian Mountains, located at the northeastern edge of the Qinghai–Tibet Plateau, play a very important role in breeding alpine glaciers and accumulating snow cover, and it is also the source of inland rivers, such as the Heihe [10,11]. In the past 60 years, the climate response in the Qilian Mountains has raised a new issue for the restoration and protection of the fragile regional ecology. The Heihe hydrological network is important to the ecological environment in the Gobi Desert, so it is urgent to study the response of the watersheds of this inland river to the climate change in Qilian Mountains [12,13]. The pastoral and farming economic activities of people living in Ejina County, which is seated in the lower reaches of the Heihe river, mainly depend on this water. The livestock husbandry in this arid county is mostly based on forage for camels and goats; thus, the contribution of water resources to sustain and support fresh forage is critical [14].
The correlation analysis of time series is a technique to determine the relationship between runoff and meteorological elements. Over the past several decades, a large amount of research examining climatologic time series for several environmental variables and the hydrologic time series of streamflow and surface water quality has been published [15]. Increasingly, the management of groundwater and surfacewater resources and the effects of climate change on these resources will rely on analyses derived from hydrological time series [16]. Relevant studies have established the relationship between runoff and meteorological elements in the high and cold areas and summarized various regression models developed using hydro-meteorological data [17,18]. For the Pailugou Basin, the Fifth Assessment Report of the IPCC, published in 2014, indicated that climate change made the global average temperature rise by 0.85 °C, and global warming had a significant impact on the hydrological cycle of the Basin. In turn, this has led to changes in the spatiotemporal distribution of water runoff [19,20].
Despite the large number of studies for alpine environments conducted elsewhere, the study of runoff characteristics of typical high and cold basins of the Qinghai–Tibet Plateau is somewhat limited [21]. With global warming, the melting speed of ice and snow is accelerated, and the water cycle is intensified [22,23,24] in the northwest arid and semi-arid regions of alpine China. For these areas, the seasonal snow meltwater, as an important supply source of river runoff, is the most determinative environmental indicator [25]. Therefore, under the background of global warming, it is of practical significance to study the characteristics of climate change and its impact on runoff in the alpine region of Qilian Mountains to provide a reference for the sustainable utilization and development of water resources in the Basin.
Using the monthly runoff, temperature, and precipitation data of Pailugou Basin from 2000 to 2019, we conducted an in-depth study on the dynamic characteristics of river runoff and its response to climate alterations in the Basin. The study is an effort to upscale surface runoff dispersion from the statistical to the physical and from annual to interannual levels, and these approaches are important for the future water economy of the Basin. Our study also presents a series of regression models, using runoff as the dependent variable and various meteorological elements as independent variables. These models are of importance for the extension of the runoff time series in order to provide a basis for revealing the mechanisms of the water cycle and climate change in the restored Pailugou Basin. Our primary research questions included: (1) Is the annual surface runoff distribution relatively concentrated, and what is its dispersion degree? (2) What is the form of the annual surface runoff distribution, and is its trend increasing during fluctuations? And (3) what is the correlation between the main climate variables (air temperature and atmospheric precipitation) with surface runoff, and which of them mostly controls it?

2. Materials and Methods

2.1. Study Area

The study area was the Pailugou Basin (2570–3804 m, asl, 100°17′~100°18′ E, 38°32′~38°33′ N, 2.53 km2) which is located in the upper reaches of the Heihe River (total length of 821 km, total watershed 128,283 km2) [26] in the central section of the northern region of the Qilian Mountains (highest point is 5808 m above sea level), which is in a typical continental semi-arid alpine climate, affected by the westerly circulation and polar cold air masses. The total area of the basin is 2.85 km2, the total length is 4.25 km, and the longitudinal slope ratio is 1:4.2. In terms of administration, the study area belongs to the Qilian Mountains Water Conservation Forest Ecosystem Research Station.
The ethnic groups of Hui, Han and Zang, Uygur, Yugur (the only nomadic minority), and Tibetan people inhabit the region of the Qilian Mountains and Hexi Corridor. From a total number of 1,260,000 of Yugurs, 260,000 are urban residents; the majority of them are herders, farmers, and hunters [27]. The Yugur have inhabited the northern foot of the Qilian Mountains and the middle part of the Hexi Corridor since the times of the Silk Road.
The terrain is steep and broken and forms a typical ‘V’-shaped terrain (Figure 1). The mean dominant slopes are 22–38°. The basin’s parent material is light metamorphic rocks, volcanic rocks, carbonates, and intermediate-acid igneous rocks, and the soil-forming material consists mainly of peat, conglomerate, and purple sand shale [28]. There are distinct dry (November–April) and wet (May–October) seasons, with elevational differentiation.
The Pailugou Basin was declared in 14 May of 2019, by the China National Forestry and Grassland Administration, as a protected area, under the name Qilian Mountain National Park, supervised by the Zhangye Branch of Gansu Provincial Administration. Under this status, human activity in the basin was totally forbidden. Thus, the study watershed has undergone passive restoration for over four years, but this restoration started at the end of our data collection. For land cover, grasslands occupy 32.81% of the land, forests 28.81%, and bare ground 16.20%, and the remainder is made up of inland waters and areas covered permanently by ice. The dominant forest vegetation formation in Qilian Mountains is Picea crassifolia forest, while (sub)alpine vegetation consists of alpine meadow—Kobresia mats (Leontopodio soulieiKobresietum humilis ass. nova), alpine grassland (winter pastures) (Morino chinensisElymetum nutans ass. nova), and (sub)alpine shrubland (Kobresia royleanaPotentilla parviflora community) [30,31].
The Qilian Mountains Ecological Station has established a national three-level standard Xishui Meteorological Station (10 m × 20 m, Figure 1) at the outlet of the basin (elevation of 2570 m) and on additional locations higher in the watershed (2700, 2900, 3300, and 3800 m, respectively). Records of air temperature, precipitation, solar radiation, evaporation, and other meteorological factors were obtained from the stations. In addition, a watershed weir was built at the outlet of Pailugou Basin to estimate the surface runoff of the whole basin (Figure 1), and the runoff was measured by a radar water level gauge with a current meter and buoy. The weir was located close to the meteorological station at 2570 m. The climate data in the recent period of 20 years (2000–2019, from the 2570 m station) indicated that the annual average air temperature was 0.83 °C, of which the highest and lowest temperatures were 22.73 °C and 26.40 °C, respectively. The average annual precipitation was 420.50 mm, and the relative humidity was 65%. The precipitation in the wet season accounted for 86% of the annual precipitation and 75% of the annual precipitation frequency.

2.2. Data

The continuous data of daily precipitation and temperature from 1 January 2000 to 31 December 2019 were obtained from the automatic weather station of the Qilian Mountain Forest Ecological Positioning Research Station (Campbell-CR1000) located at 2570 m. The daily surface runoff data for the same period came from the triangular cofferdam runoff observation point set up at the outlet of the Basin. The longest-term weather data set came from the 2570 m weather station, so we used these data in our analysis. The stations located at higher elevations had much more limited data collection timelines (1–8 years). One station at 2700 m is in grassland, the station at 3800 m is in shrublands, and the others are in a Picea forest. The collected data were classified and summarized, and statistical software SPSS, ver.13.0 and Origin ver. 10.0 were used for analysis. The data involved in this paper were compiled according to the forest ecosystem positioning observation index system of the Forestry Industry Standard of the People’s Republic of China (LY/T 1606-2003) [32], and the forest ecosystem service function evaluation accorded with the Forestry Industry Standard of the People’s Republic of China (LY/T 1721-2008) [33].

2.3. Research Methods

In this paper, the characteristics of annual runoff distribution in the Pailugou watershed of the Qilian Mountains are described by the annual uneven distribution coefficient (Cu) [34,35], complete adjustment coefficient (Cr) [34,35], and concentration degree (Cn) [36]. The interannual variation trend of runoff is described by the cumulative anomaly method and moving average method. The coupling relationship between runoff and climate change is described by the correlation analysis method. The specific research methods are as follows:
(1) Statistical characteristics of runoff series. The descriptive statistical characteristics of annual runoff include mean, variance, coefficient of variation, and skewness coefficient. The calculation methods of each coefficient are as follows:
Mean   value : R ¯ = 1 n i = 1 n R i
Variance :   δ = 1 n i = 1 1 ( R i R ¯ ) 2
Coefficient   of   variation :   C v = δ R ¯ = 1 n i = 1 n ( Κ i 1 ) 2
K i = R i R ¯
Skewness   coefficient :   C S = i = 1 n ( K i 1 ) 3 n C n 3
(2) Annual changes
(2.1) The uneven coefficient (Cu) reflects the non-uniformity of the annual distribution of river runoff, and the calculation formula is [34,35]:
C u = δ R ¯ = 1 12 i = 1 12 R i R ¯ 2 R ¯ , R ¯ = 1 12 i = 1 12 R i
where, Ri is the mean monthly runoff of the year.
The uneven coefficient is positively correlated with the difference between monthly runoff and mean runoff, i.e., an increase in the coefficient reflects the non-uniformity of the distribution of annual runoff.
(2.2) The complete adjustment coefficient (Cr) is the percentage of the sum of the periods of runoff greater than the annual average flow and the total annual runoff. The larger the coefficient, the more concentrated the annual distribution of runoff in the Basin. The calculation formula is as follows [34,35]:
C r = i = 1 12 ϑ i R i R ¯ i = 1 12 R i , ϑ i = 0 , R i < R ¯ 1 , R i R ¯
(2.3) The concentration degree (Cn) is a vector accumulation. The specific principle is to divide the monthly runoff into a certain angle, usually 360°, and then calculate the percentage of the combined amount to the annual runoff. The calculation formula is as follows:
C n = R i = 1 12 R i , R = R x 2 + R y 2 , R x = i = 1 12 R i c o s θ i , R y = i = 1 12 R i s i n θ i
In addition, we calculate the relative (Ck) and the absolute (δR) variation range that figure in the runoff variation range (ΔR). The calculation formulae are as follows:
Ck = Rmax/Rmin
δR = RmaxRmin
where Rmax and Rmin are the maximum and minimum monthly runoff, respectively.
(3) Interannual trend change. The cumulative anomaly (At) is used to determine the interannual variation trend of runoff. For runoff series, the cumulative anomaly of a certain period of time (t = 1, 2, 3, …, n) can be expressed as follows:
A t = i = 1 12 ( R i - R ¯ ) , t = 1 , 2 …… , n
A trend analysis can be carried out by calculating the cumulative value of anomalies in different periods. When the At value is in a rising trend, the runoff in this period is greater than the average, which is the wet season. On the contrary, when the At value decreases continuously, it indicates that the runoff in this period is less than the average value of the horizontal period, which is the dry season; when the At value is constant, it is the normal period.
(4) Sliding average method. The change trend is represented by the smooth value of the sequence. The specific calculation method is as follows:
R j = 1 k i = 1 j + 2 R i , j = ( k + 1 ) / 2 , 2 , n ( k + 1 ) / 2
(5) Mann–Kendall mutation test method. The sequential version of Mann–Kendall test [37,38,39] and regression analysis are used to establish the time-series trend for precipitation and runoff and to determine the period of abrupt runoff changes and identify the main driving factors of runoff decline in the study area [40]. The calculation method is as follows [41,42]:
For sample R of n subsequences, its rank sequence is:
R k = i = 1 k r i ,   k = 2 , 3 , , n
r i = 1 , x i > x j 0 , x i x j   j = 1 , 2 , , i
Order column Rk is the accumulate of the ith xi > xj sample. Under the premise of independent and random sample sequences, statistic UFk is defined as follows:
U F k = [ R k E ( R k ) ] var ( R k ) ,   k = 1 , 2 , , n
where UF1 = 0, and assuming X1, X2, …, Xn are independent of each other and the distribution is consistent, the following conclusion could be made:
E ( R k ) = n ( n + 1 ) 4 var ( R k ) = n ( n 1 ) ( 2 n + 5 ) 72
When UFk or the inverse sequence UBk appears outside the critical line (the critical value was ±1.96 for a 95% confidence level), this negates the null hypothesis, indicating a significant upward (downward) trend. The portion that exceeds the critical straight line is considered the time period when mutations take place. If the curve UFk intersects with UBk, and the intersection point is between the critical line, then the year corresponding to the intersection is the year when the mutation begins.
(6) Pearson correlation coefficient. We used this statistical test to examine the linear relationship between runoff and temperature and precipitation by each season (spring, summer, and fall). The Pearson correlation coefficient (r) is a common statistical test for measuring a linear correlation and is a number between −1 and 1, and it measures the strength and direction of the relationship (positive or negative) between two quantitative variables [43].

3. Results

3.1. Runoff Variation Characteristics of Pailugou Watershed

3.1.1. Statistical Characteristics of Runoff Series

The descriptive statistics of the monthly runoff series in the Pailugou Basin from 2000 to 2019 (Table 1) indicated that the average annual runoff of the basin was 2.637 × 10⁵ m3, the coefficient of variation was 0.381, and the skewness coefficient was 1.573, demonstrating a positively skewed runoff, small degree of dispersion, relatively concentrated distribution, and good concentration of extreme values.

3.1.2. Variation Characteristics of Monthly Average Runoff

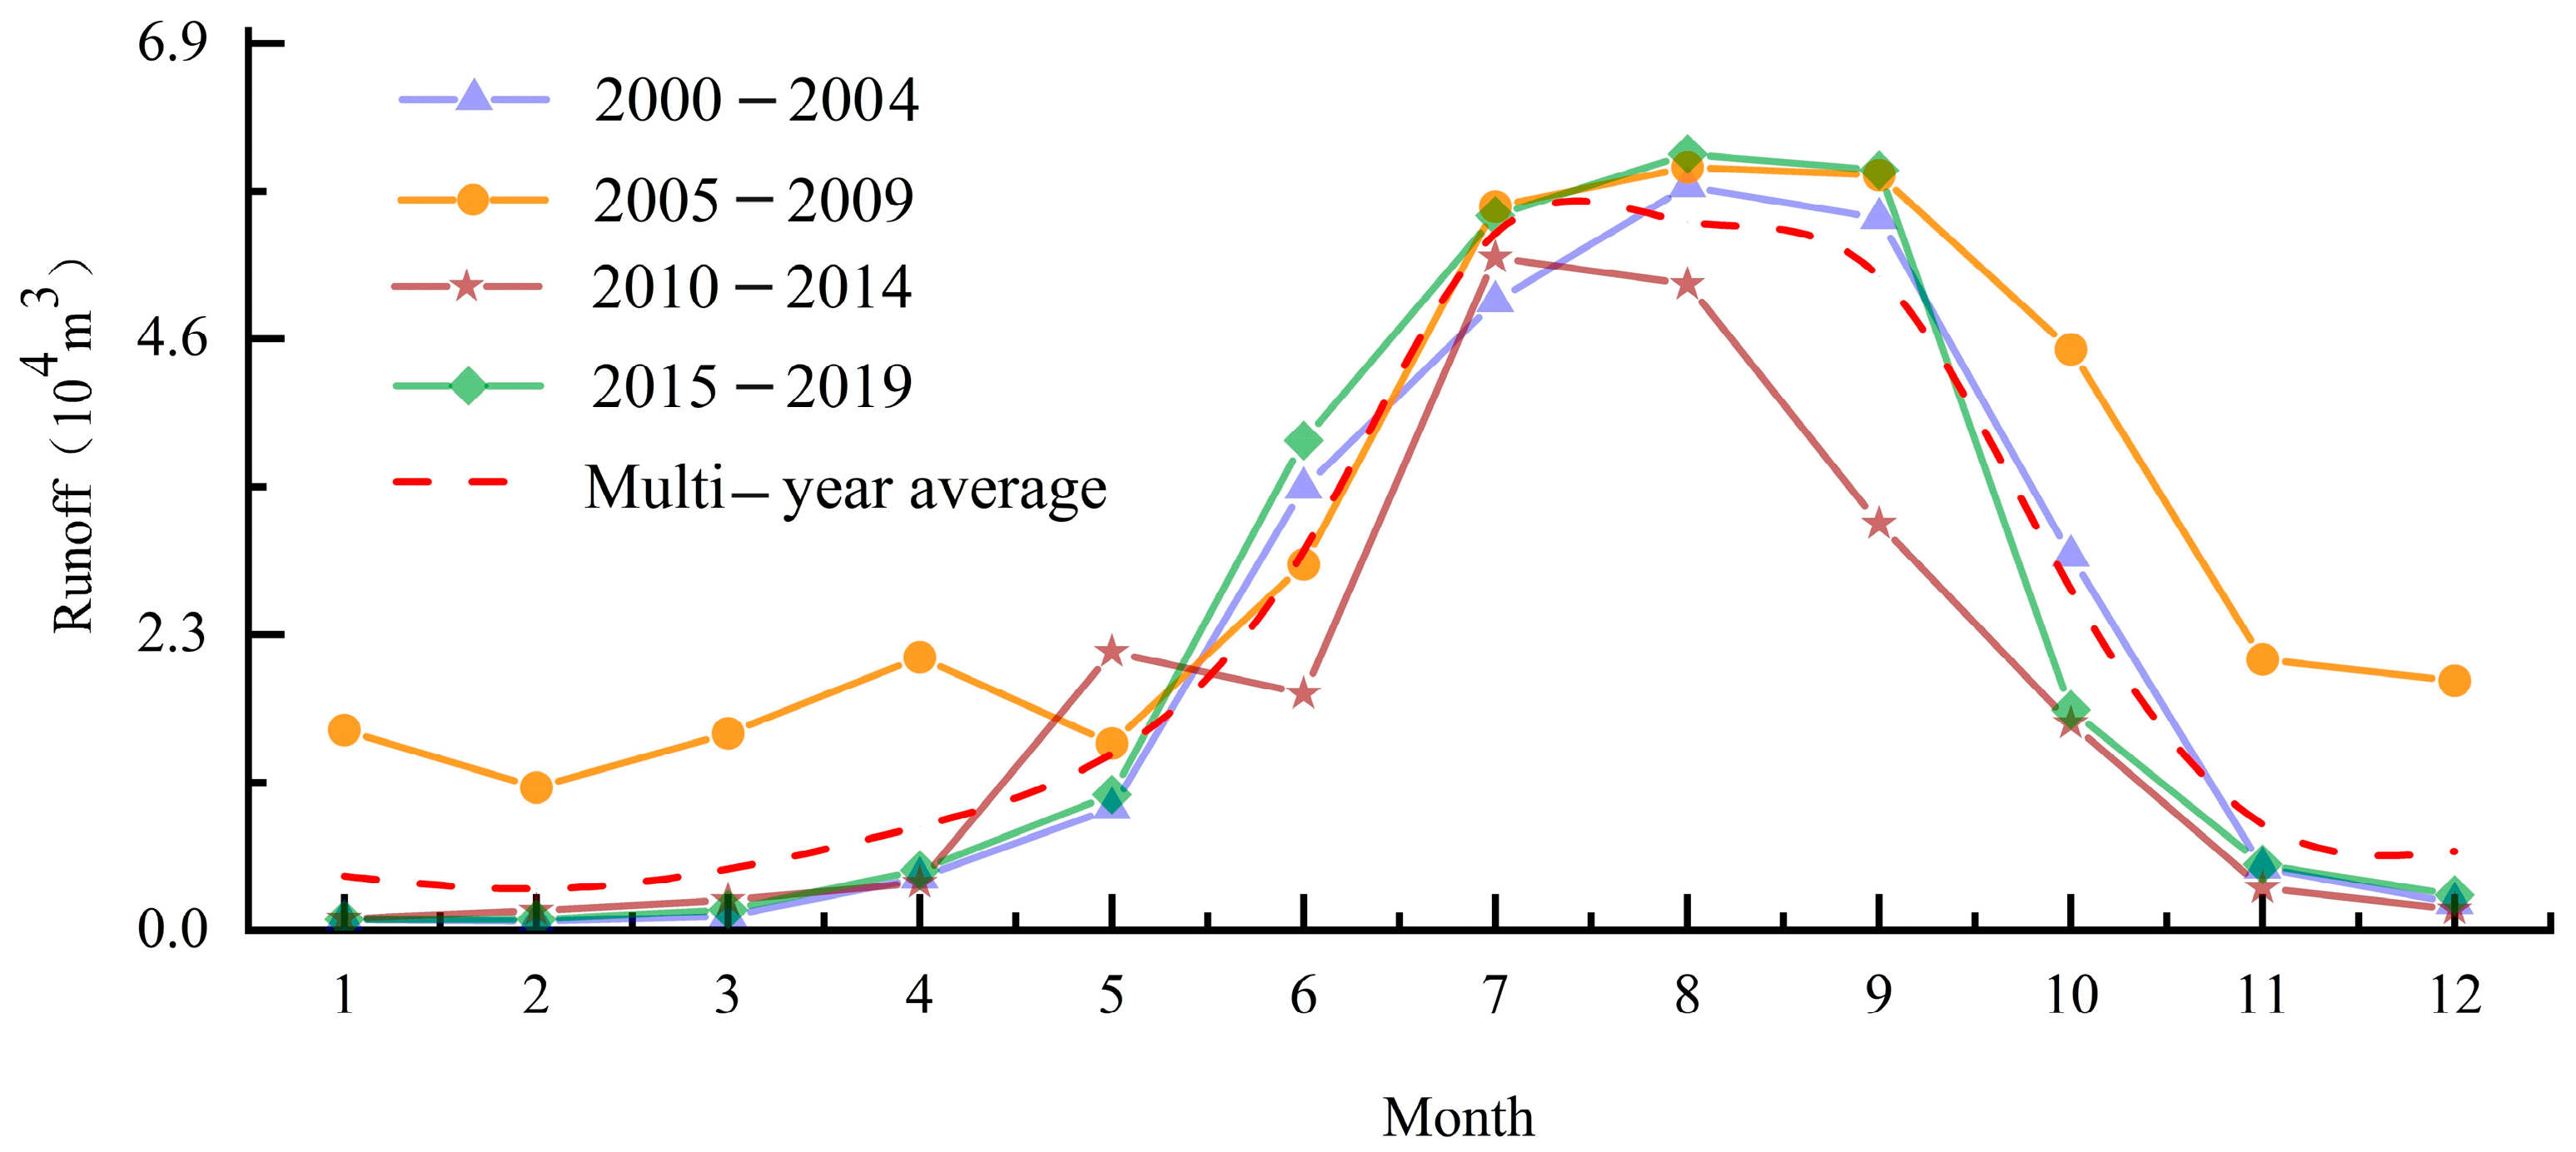
Water recharge in the Pailugou Basin was mainly from atmospheric precipitation and ice–snow meltwater. Water evaporation and atmospheric precipitation both are affected by the Tibetan Plateau, Southern Asian monsoonal flows, and Eastern Asian monsoonal flows, the latter having the strongest effect [44]. The annual surface runoff in the basin showed an overall upward trend, increasing by 3.94 × 10⁵ m3, with an average increase rate of 0.42 × 10⁵ m3 every ten years (10a). The distinct dry and wet seasons contributed to a very uneven distribution of runoff in the Pailugou watershed (Figure 2). The annual runoff distribution was ‘unimodal’, and the runoff from January to April and from November to December was significantly less. During summer, the monthly runoff increased significantly, and the runoff increased rapidly in the next two months, and the peak appeared from July to September. At this time, the runoff accounted for 85.36% of the yearly total. Upon the arrival of winter, the runoff decreased significantly. January had the smallest monthly average runoff, and the monthly cumulative runoff from January to April and from November to December accounted only for 10.81% of the yearly total.
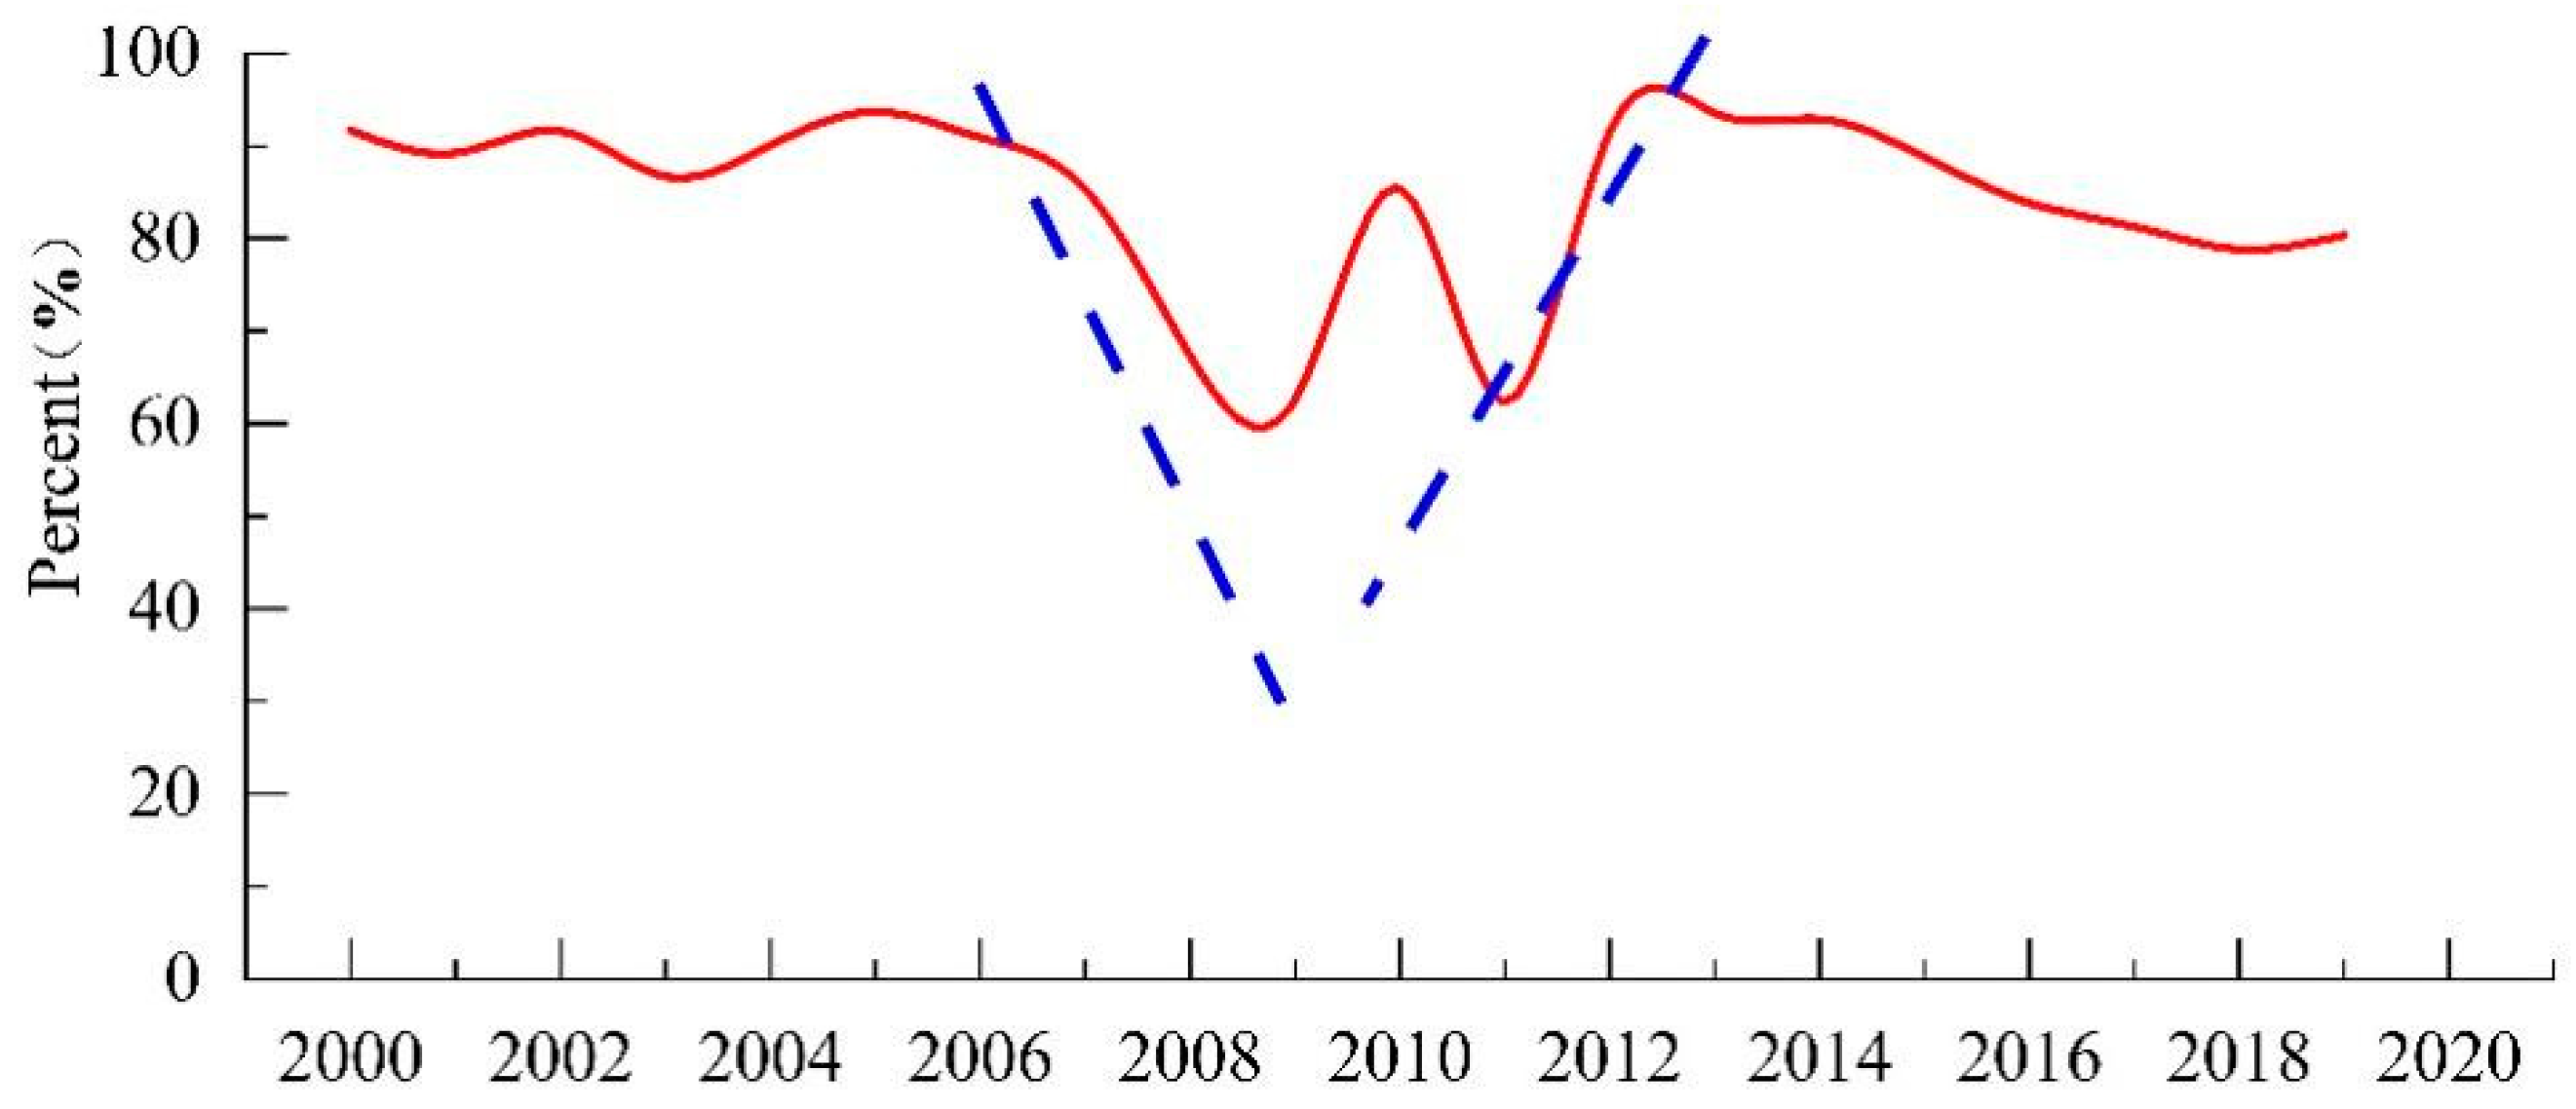
In general, the proportion of runoff in the flood season (July to September) to the annual runoff fluctuated greatly (Figure 3) and changed dramatically from 2005 to 2014. Before 2005, the percentage of runoff in the flood season compared to the annual runoff exhibited a steady trend. After 2005, it fell sharply downward to the minimum value. From 2009 to 2010, the percentage of runoff in the flood season compared to the annual runoff increased rapidly from 62.5% to 88.5% and then decreased rapidly to 61.2% in just two years. In 2005, 2010, and 2012, as the ‘peak’ of the ‘W’ type changed, the annual distribution became more and more uneven. After 2014, the percentage of runoff in the flood season compared to the whole year showed a gradual significant downward trend (Z = −0.18, passing the 95% significance test of confidence interval), i.e., the annual distribution of runoff gradually tended to be uniform after 2014.
In contrast, the percentage of runoff change in each season compared to the total runoff change in the Pailugou Basin for the period 2000–2009 was mainly concentrated in the summer and autumn, accounting for 52.87% and 32.49% of the annual runoff, respectively (Table 2). In this respect, spring accounted only for 10.15% of the yearly total and accounted for the smallest proportion (4.49%) of run-off. Combined with the distribution of the monthly average runoff (Figure 2), the runoff of the Pailugou watershed was concentrated in the second half of the year. The wet season is from June to October, and the dry season is from November to May. Therefore, the amount of summer runoff in the Pailugou Basin was the main factor for the change in annual runoff, and the influence of winter precipitation was relatively small.

3.1.3. Annual Runoff Variation Characteristics

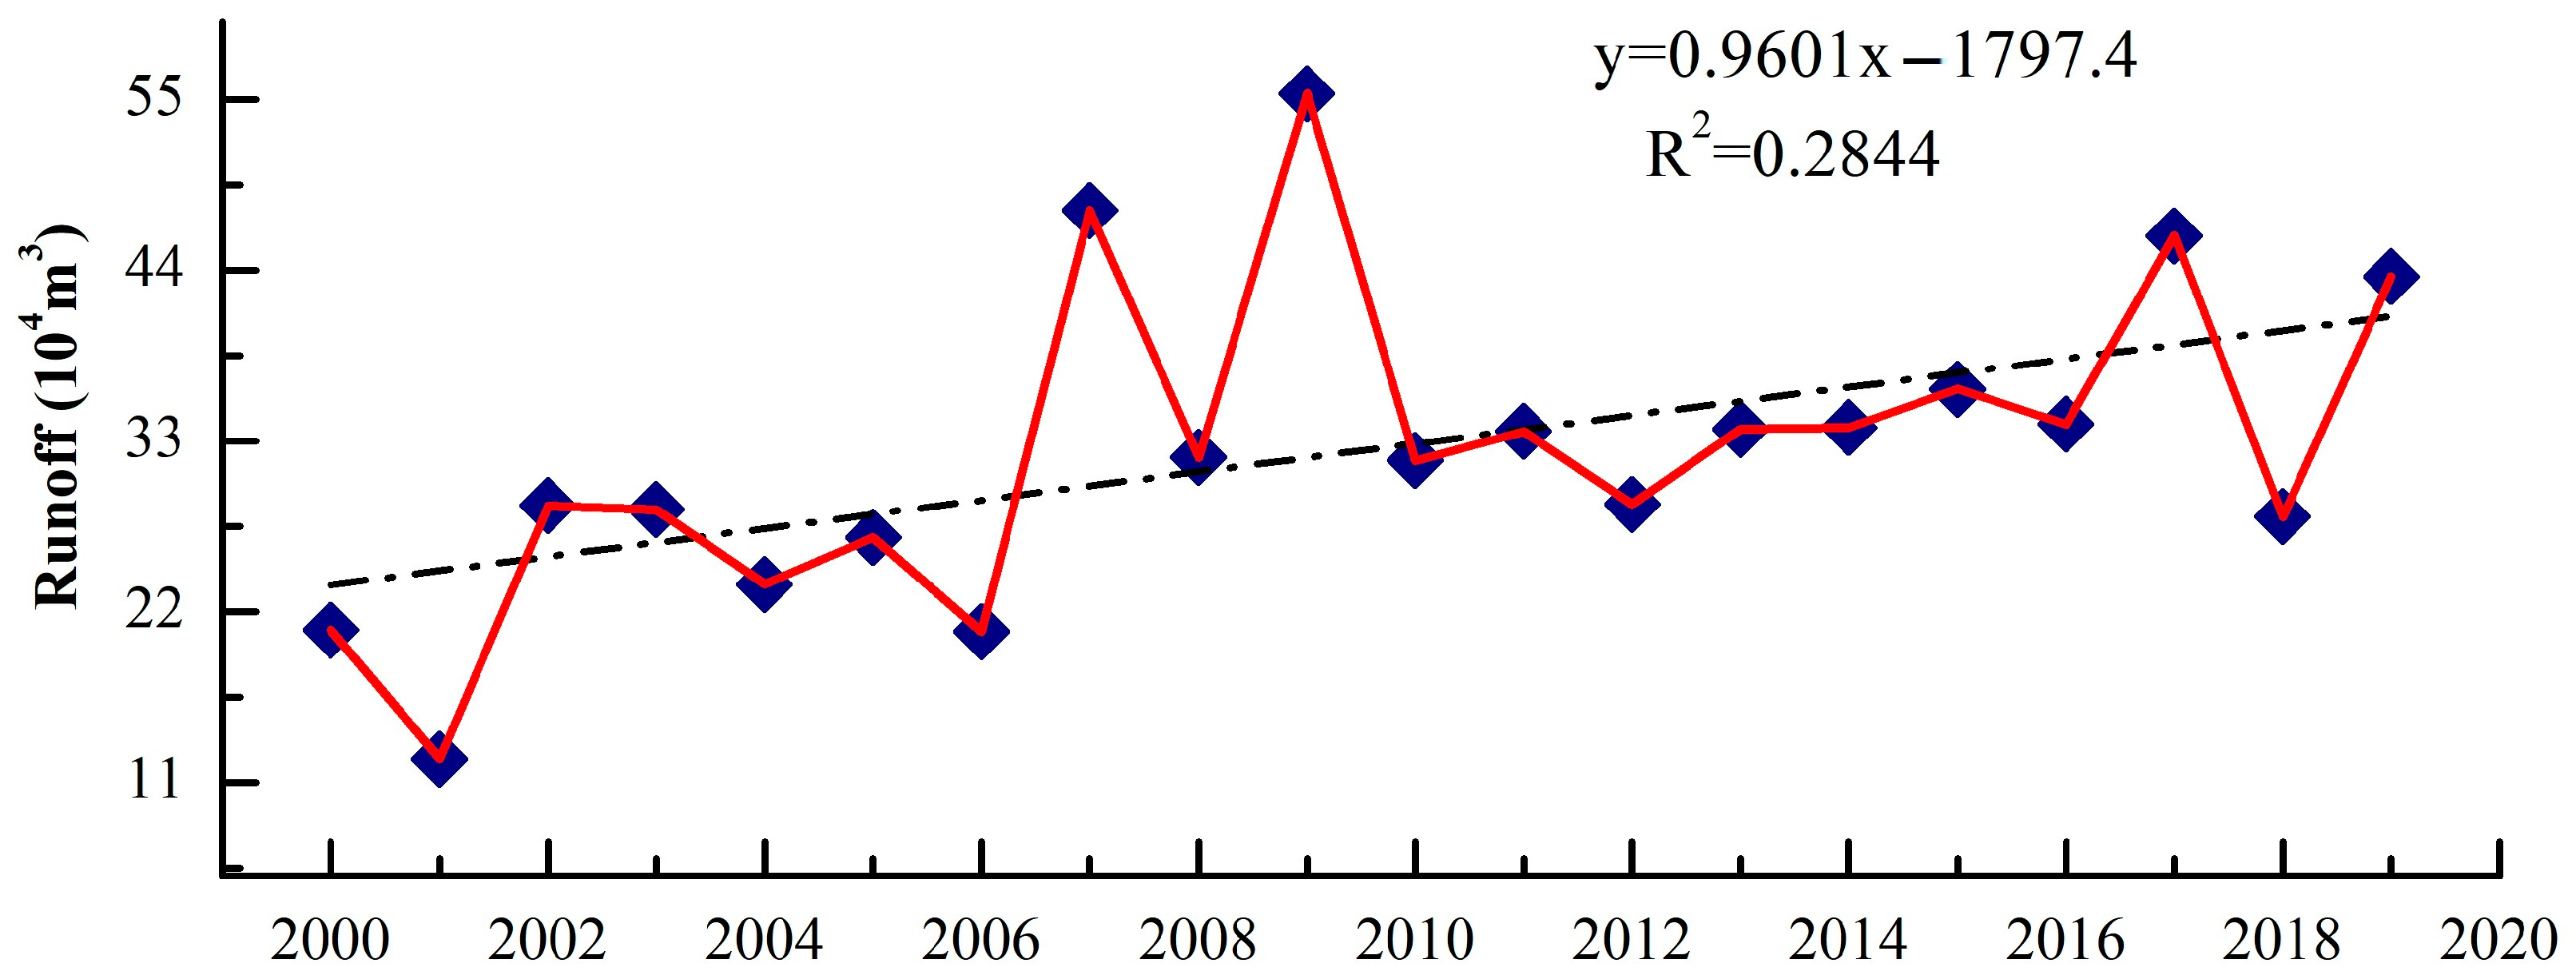
From 2000 to 2019, the annual runoff of the Pailugou Basin had a trend of partial fluctuation and an overall increase, with a coefficient of variation of the runoff of 0.381. The runoff of the Pailugou Basin steadily increased by an annual rate of 0.91 × 10⁴ m3/10a (Figure 4). However, runoff experienced three explicit periods of change in the past 20 years. The runoff of the period (2013–2019) was increased by 19.4 × 10⁴ m3 in respect to the period (2000–2006), with an average increase rate equal to 3.5×10⁴ m3/10a. The annual runoff changed slightly during 2000–2006, exhibiting a trend of slow fluctuation. During 2006 to 2010, the annual runoff increased significantly and fluctuated greatly, forming an ‘M’-type trend, with 2007 and 2009 as the peaks and 2008 as the valley. During the period from 2010 to 2019, the annual runoff decreased slowly after experiencing substantial changes, gradually stabilized, and then increased slightly.
Combined with the cumulative curve of runoff anomalies in the Pailugou Basin (Figure 5), the interannual variation in the runoff was large, presenting two explicit stages of runoff anomaly accumulation. The annual runoff showed a decreasing trend from 2000 to 2006, indicating a dry period.
With the passage of time, the concentration degree in the Pailugou drainage basin exhibited a decreasing trend (Table 3). The maximum value of the annual distribution concentration Ci of the runoff was 63.52%, corresponding to 231° in the vector direction, which appeared in 2000–2004, and the minimum value was 57.15%, corresponding to 227° in the vector direction, which appeared in 2015–2019, with an average value of 60.29%. The maximum value of the relative variation range of annual runoff distribution (Ck) was 25.87 (for 2000–2004), the minimum was 11.55 (2015–2019), and the average value for the whole period was 19.60 (Table 3). The maximum value of the absolute variation range of runoff distribution (δR) was 1.95 (for 2015–2019), the minimum was 1.02 (2005–2009), and the average value for the whole period was 1.48. Overall, the distribution of the annual runoff in the Pailugou watershed was relatively concentrated. Although the concentration degree decreased with time, the range was not very large. The relative change range of the basin fluctuated around 19.60, exhibiting a decreasing trend year by year, while the relative range of change gradually decreased after 2004 and then increased rapidly to the maximum after 2015, with large fluctuations.
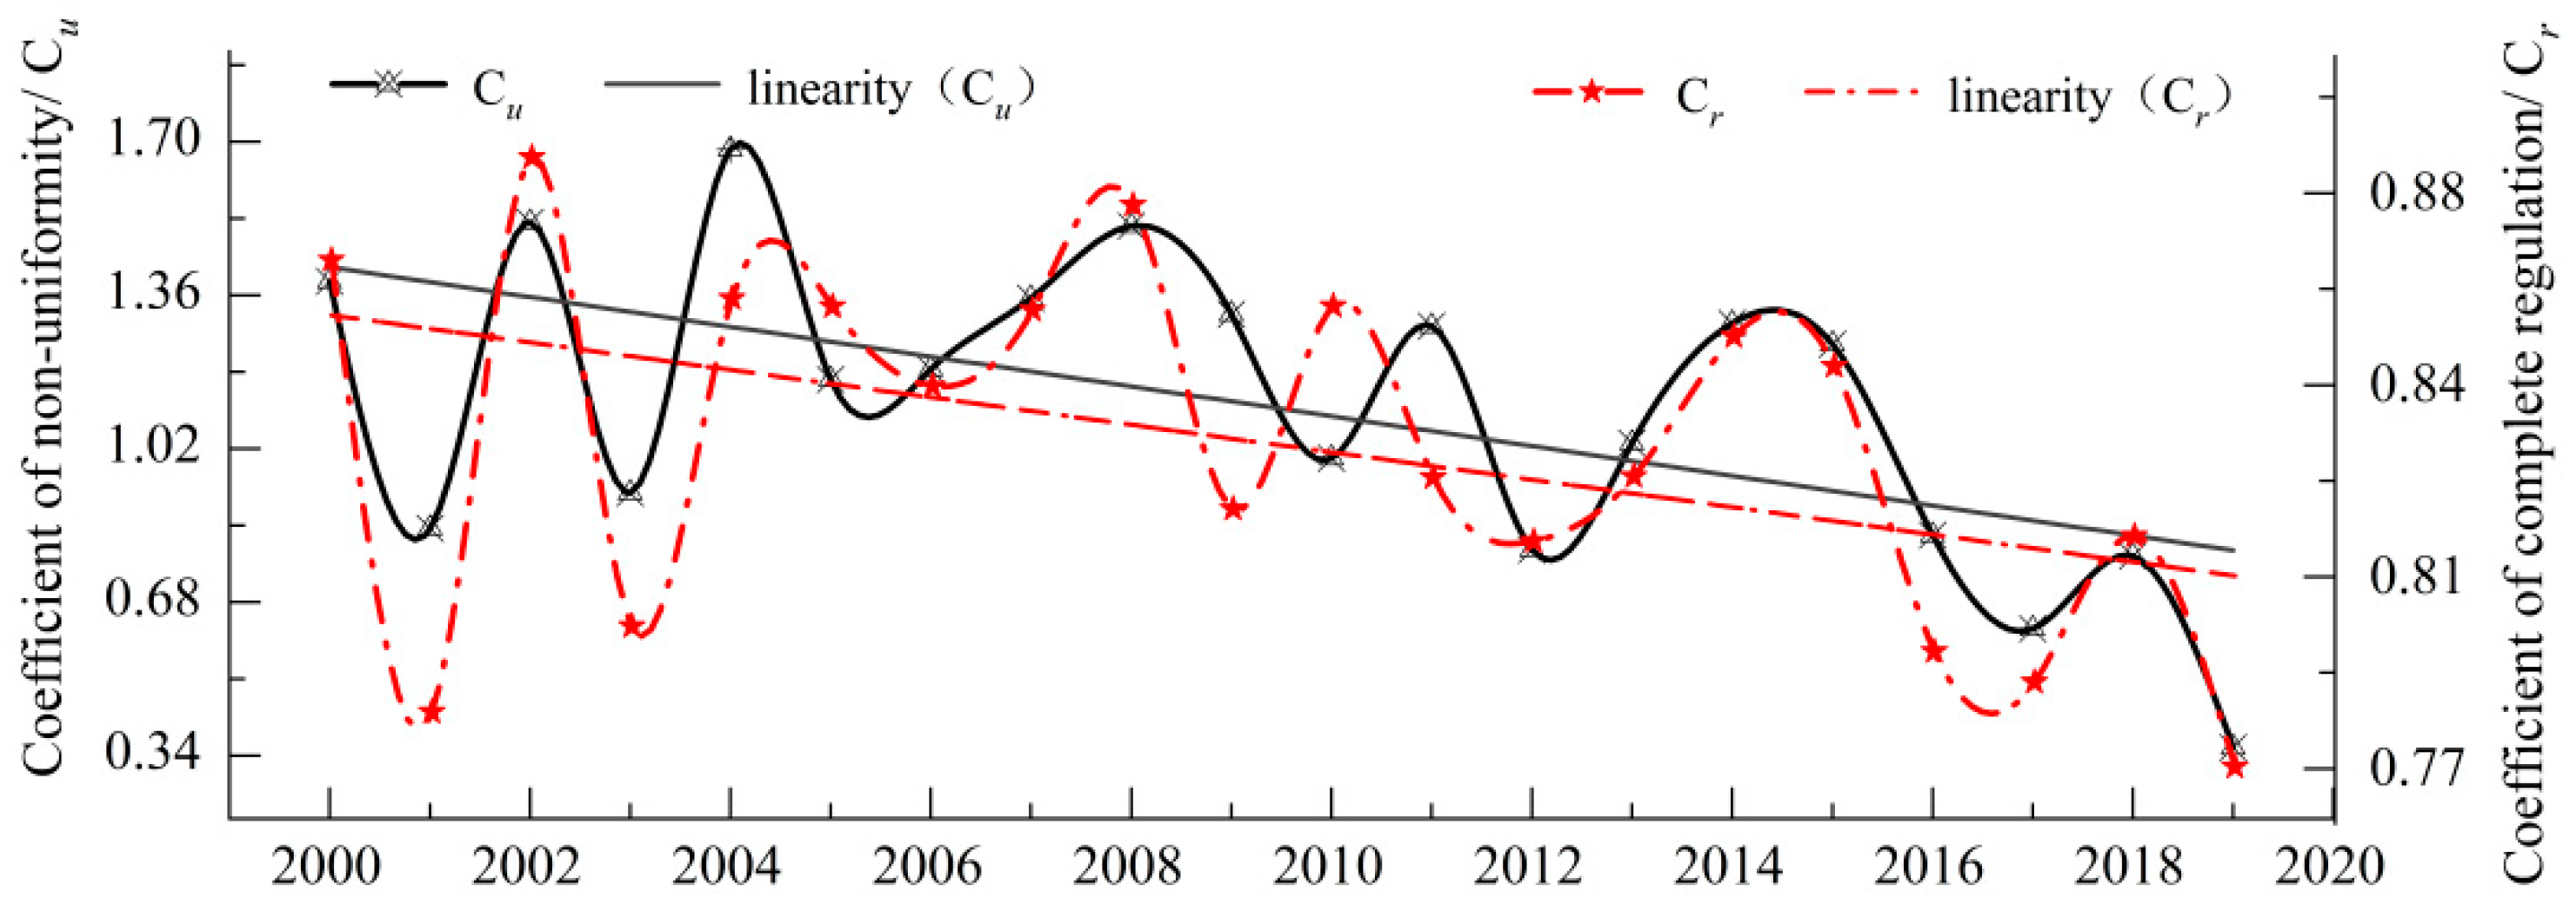
The distribution characteristics of the hydrological sequence of the river runoff in the Pailugou Basin are subject to changes due to climate change and human activities. In order to reveal the annual variation, we used the monthly river runoff data from 2000 to 2019 to calculate the uneven coefficient Cu and the annual complete adjustment coefficient Cr (Figure 6).
The uneven coefficient (Cu) of river runoff in the Pailugou Basin presented a continuous downward trend in the studied period (2000–2019), demonstrating that the annual distribution of river runoff in the basin tends to be uniform (Figure 6). At the same time, the complete adjustment coefficient (Cr) of the annual distribution was highly consistent with the uneven coefficient (Cu) over the same period, which indicated that there was a high positive correlation between the two coefficients (Figure 6). During the periods of 2000–2004 and 2012–2016, Cu and Cr showed relatively strong fluctuations, revealing that the annual distribution of runoff in the basin was extremely uneven and highly concentrated during these two periods. In 2006–2013 and 2017–2019, the two coefficients showed multi-peak and jagged fluctuations, and the trend continued to slowly decrease, indicating that the homogeneity of the annual runoff distribution in these two periods gradually weakened. In general, the fluctuation in the runoff in homogeneity in the Pailugou River Basin exhibits a gradual decreasing trend in the time series, which is in agreement with the annual distribution characteristic index value.
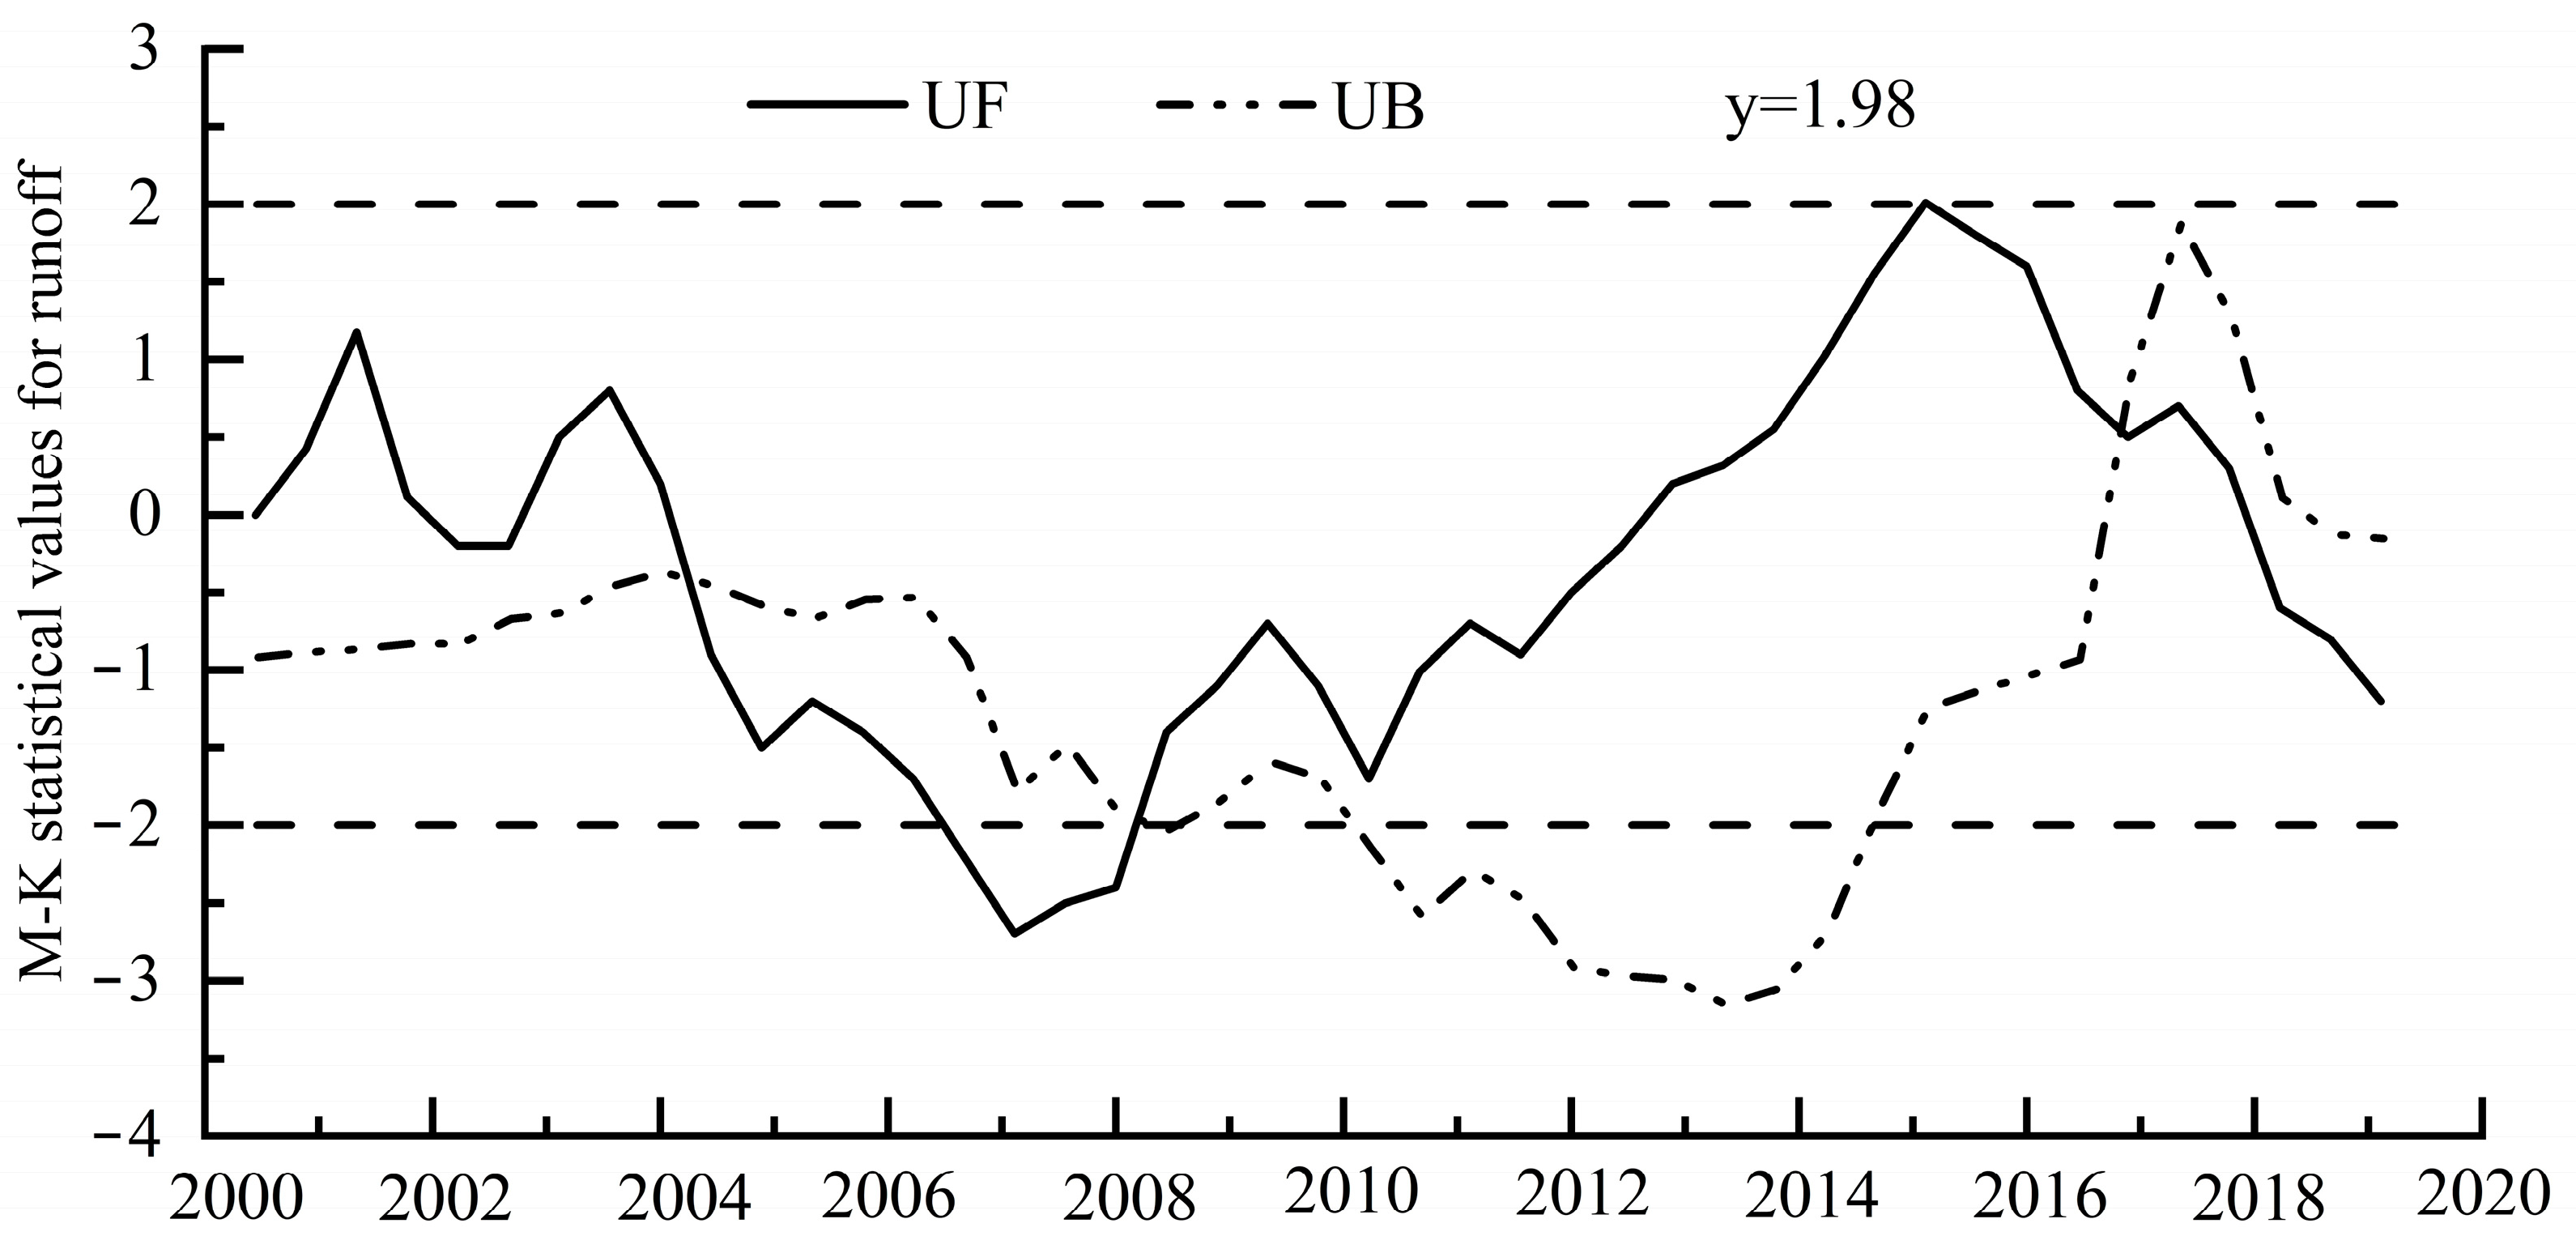
The calculated z-values of the non-parametric Mann–Kendall (M-K) test for monotonic trend of annual runoff was consistent with the change trend of each period shown in the annual runoff sliding curve (Figure 4), and neither passed the significance test (Table 4). According to the test results, in the past 20 years, the annual runoff of the basin changed significantly in 2006–2010 and 2014 (Figure 7). The runoff mutation time, i.e., the intersection of UF and UB lines (estimated in M-K test), occurred in 2004, 2008, and 2016. The mean z-value for the whole period of 20 years (z = 1.74) did not pass the significance test for α = 0.05 (z = 1.96), i.e., the annual runoff of the Pailugou Basin in the past 20 years showed an upward trend, but this trend was not statistically significant.

3.2. Climate Alteration in the Pailugou Basin

3.2.1. Air Temperature

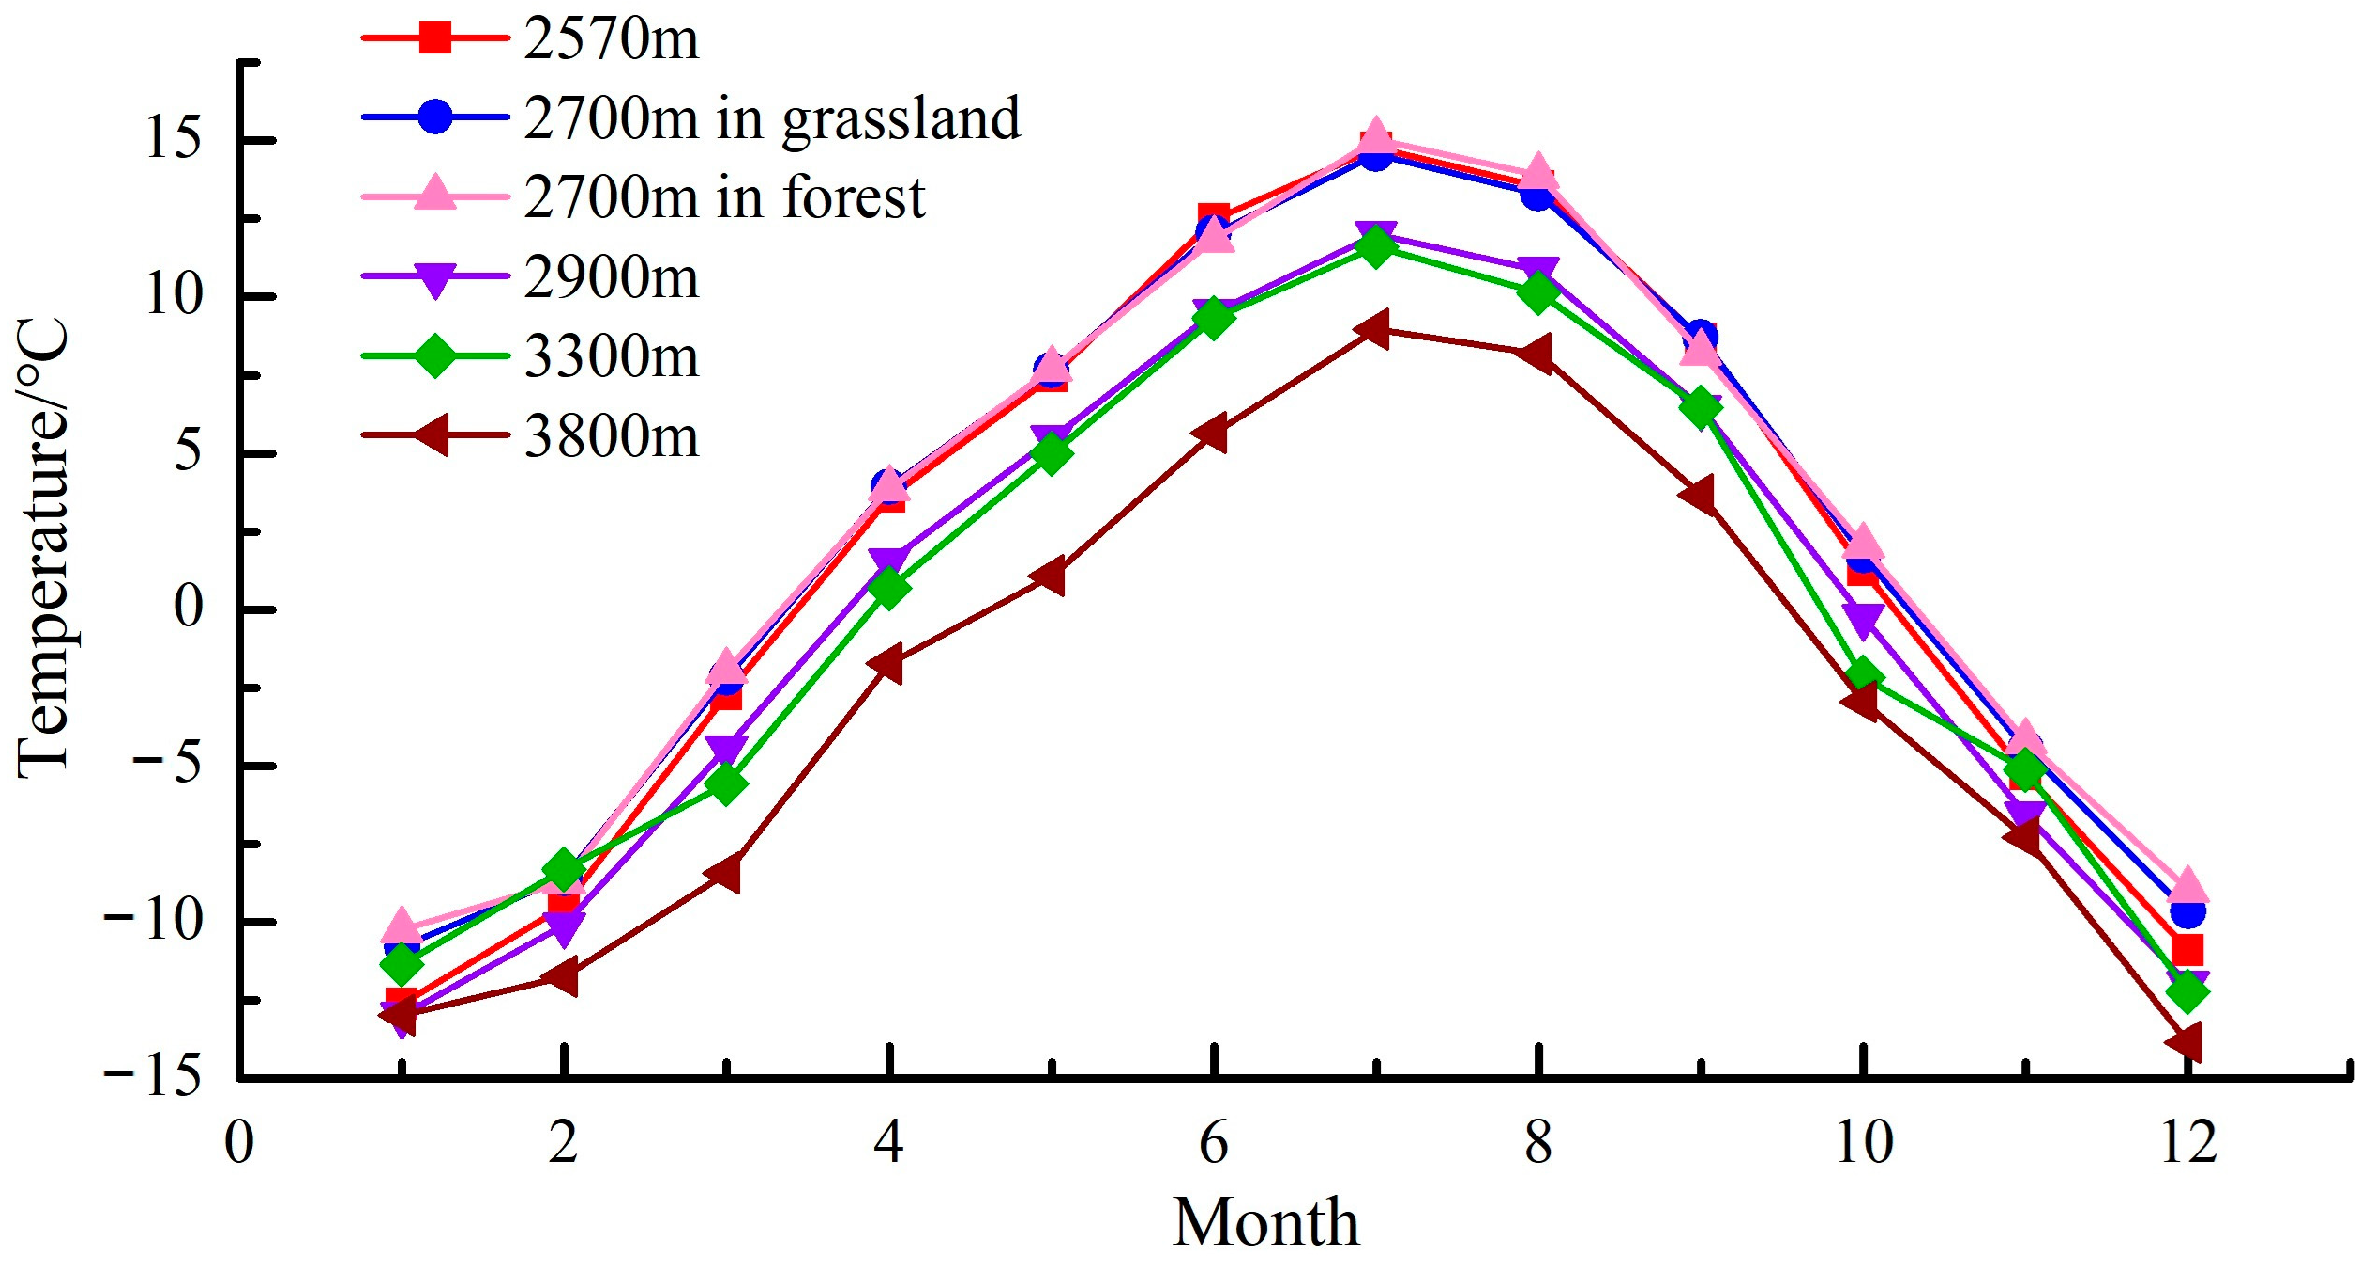
During 2000–2019, the average annual temperature in the basin was 1.45 °C, and the maximum temperature difference within the year was 26.09 °C (for the station at 2570 m). For the stations at all elevations, the highest temperature appeared in July and the lowest in December/January (Figure 8). For the station at 2570 m, the interdecadal variation in the monthly average temperature presented an upward trend with a step of 0.054 °C/10 a, with the most significant being in winter (Figure 8). The non-parametric M-K test for the monotonic trend of temperature was 5.425, which passed the significance test for α = 0.05 (z = 1.96), so it can be inferred that there was an air temperature rise in the Pailugou Basin in the past 20 years. On the interdecadal scale, the average annual temperature also showed a continuous upward trend. The results of the non-parametric M-K mutation test on the air temperature of the Pailugou Basin showed that the air temperature changed abruptly around 2008, and it continued to rise after that (Figure 9). In summary, the increasing trend of interannual air temperature in the Pailugou Basin from 2000 to 2019 was significant.

3.2.2. Atmospheric Precipitation

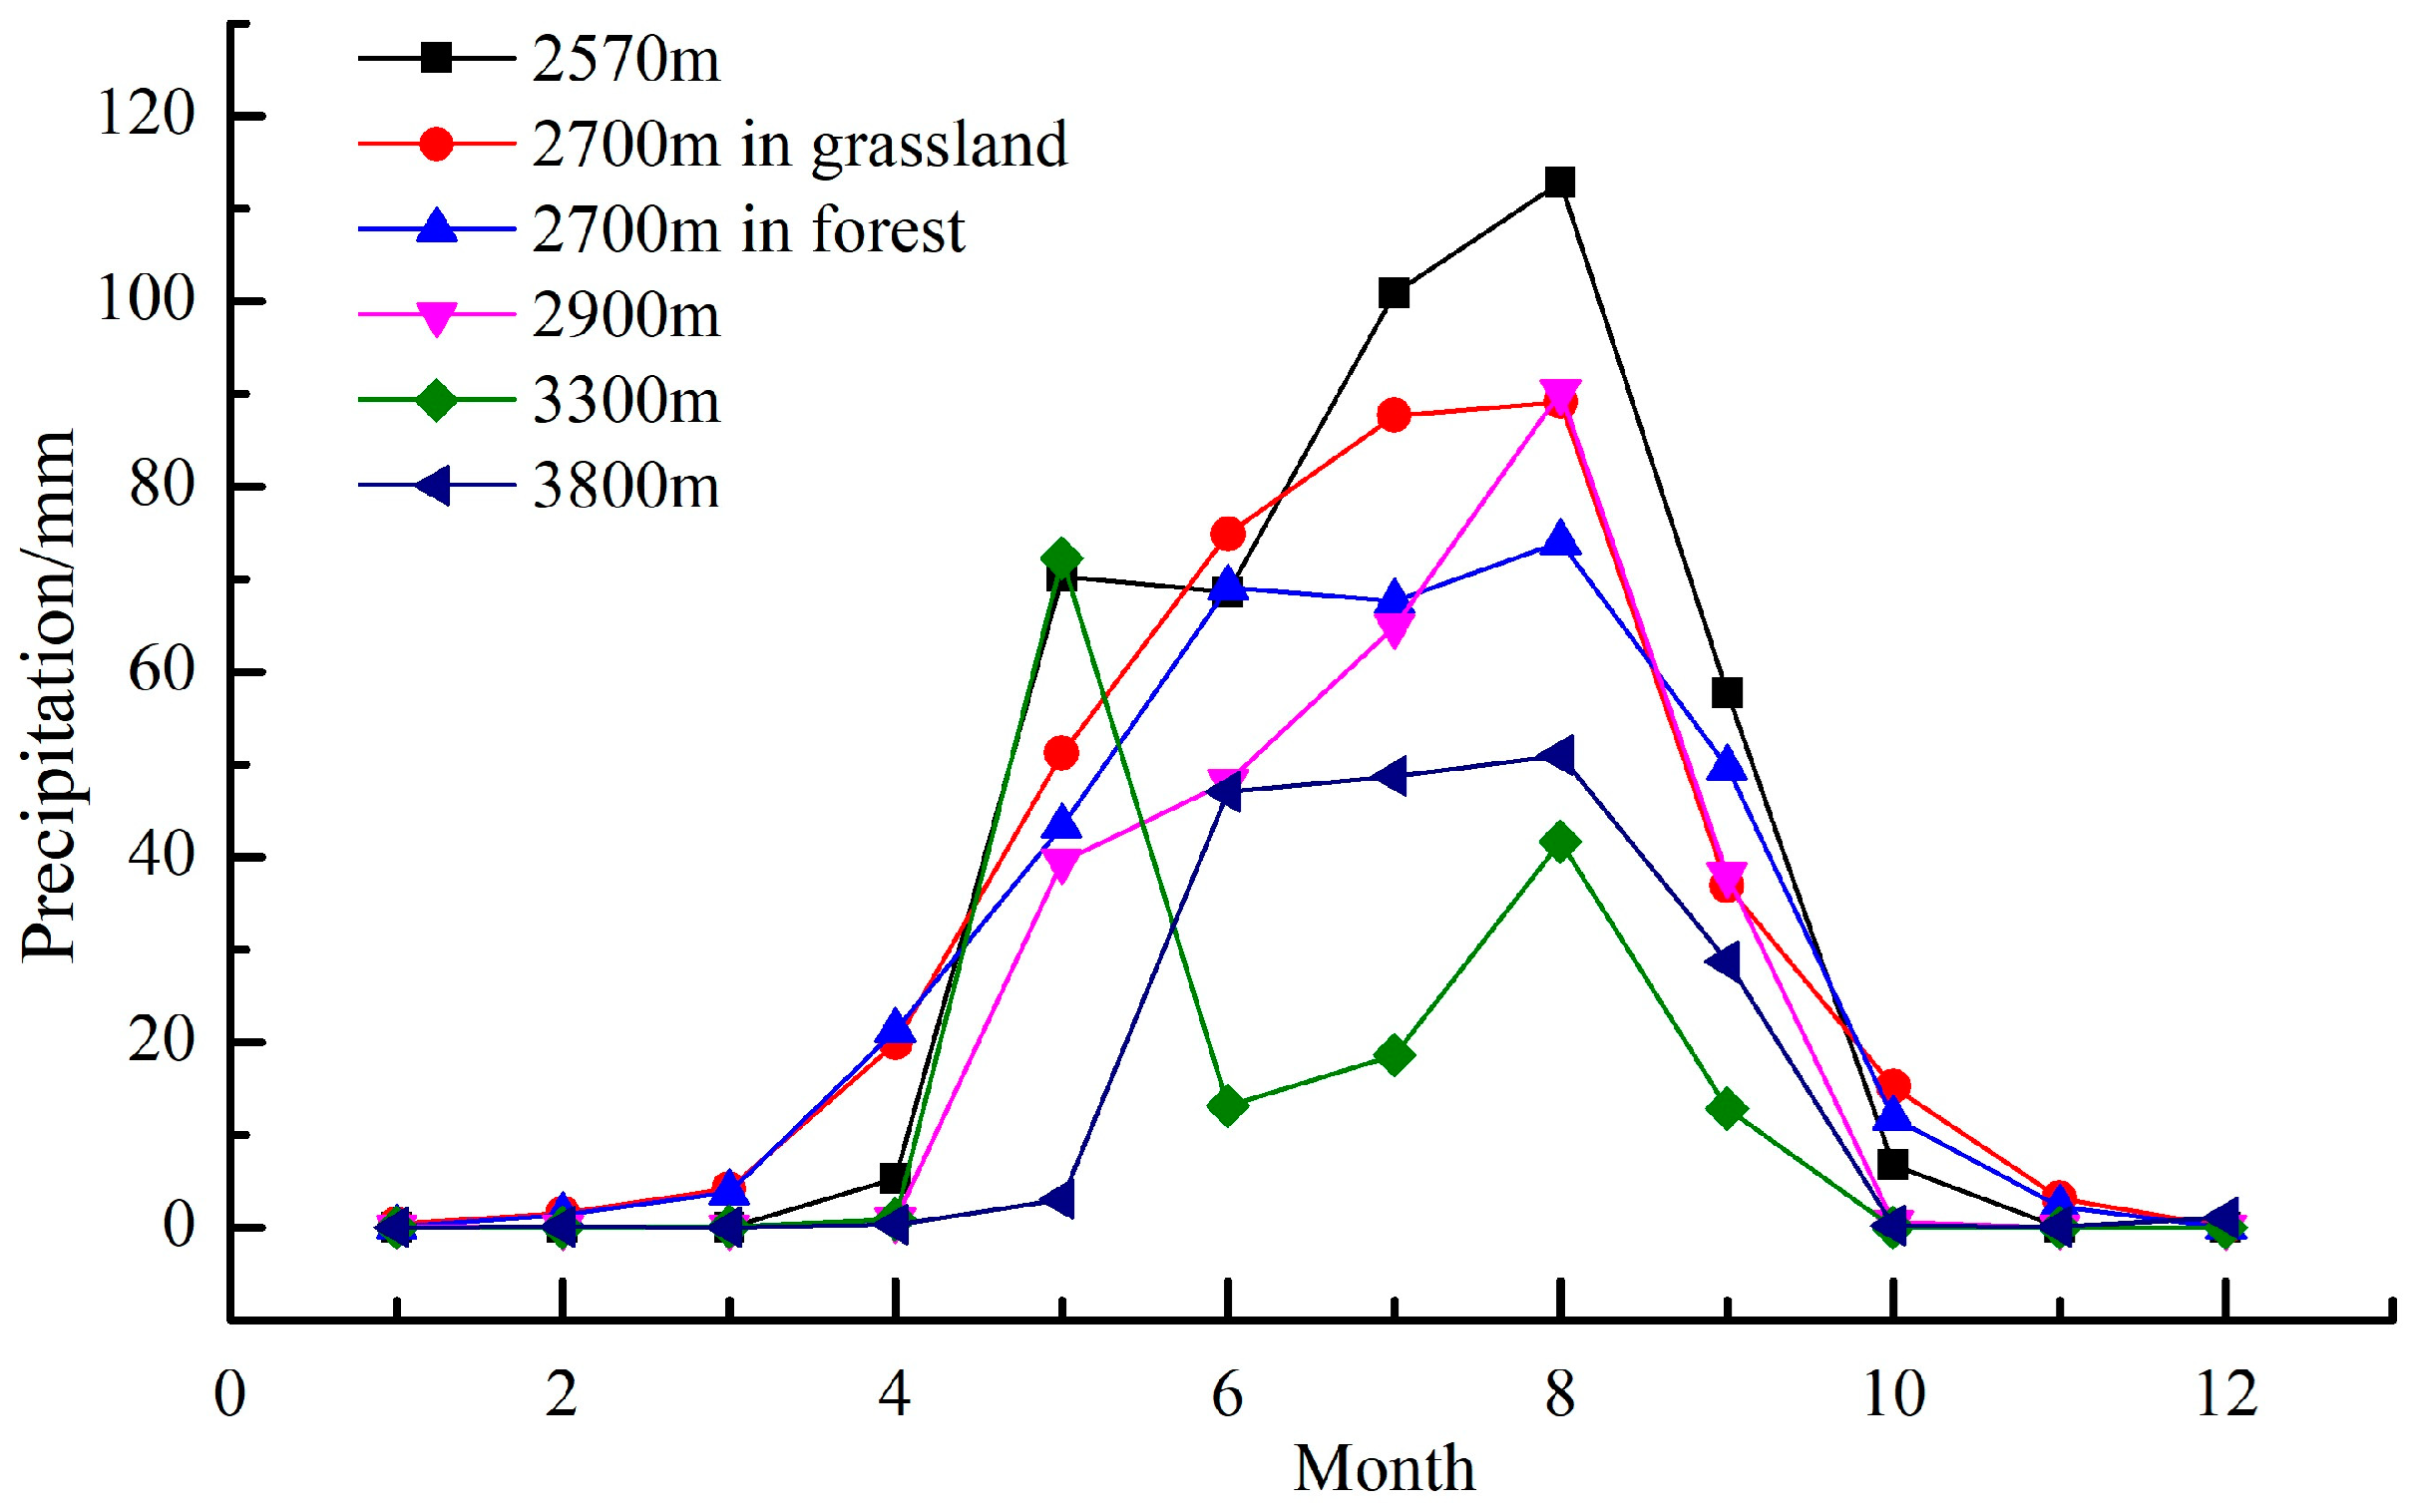
The maximum precipitation that appeared at all six stations occurred in August, and the annual distribution was generally ‘unimodal’ (Figure 10). The precipitation from January to April and from October to December was significantly lower than from May to September. Upon the arrival of summer, the monthly average precipitation increased significantly and reached its peak from July to August (Figure 10). This period is the runoff flood season of the Basin, and the ratio of flood season precipitation to annual precipitation was greater than 86.3%.
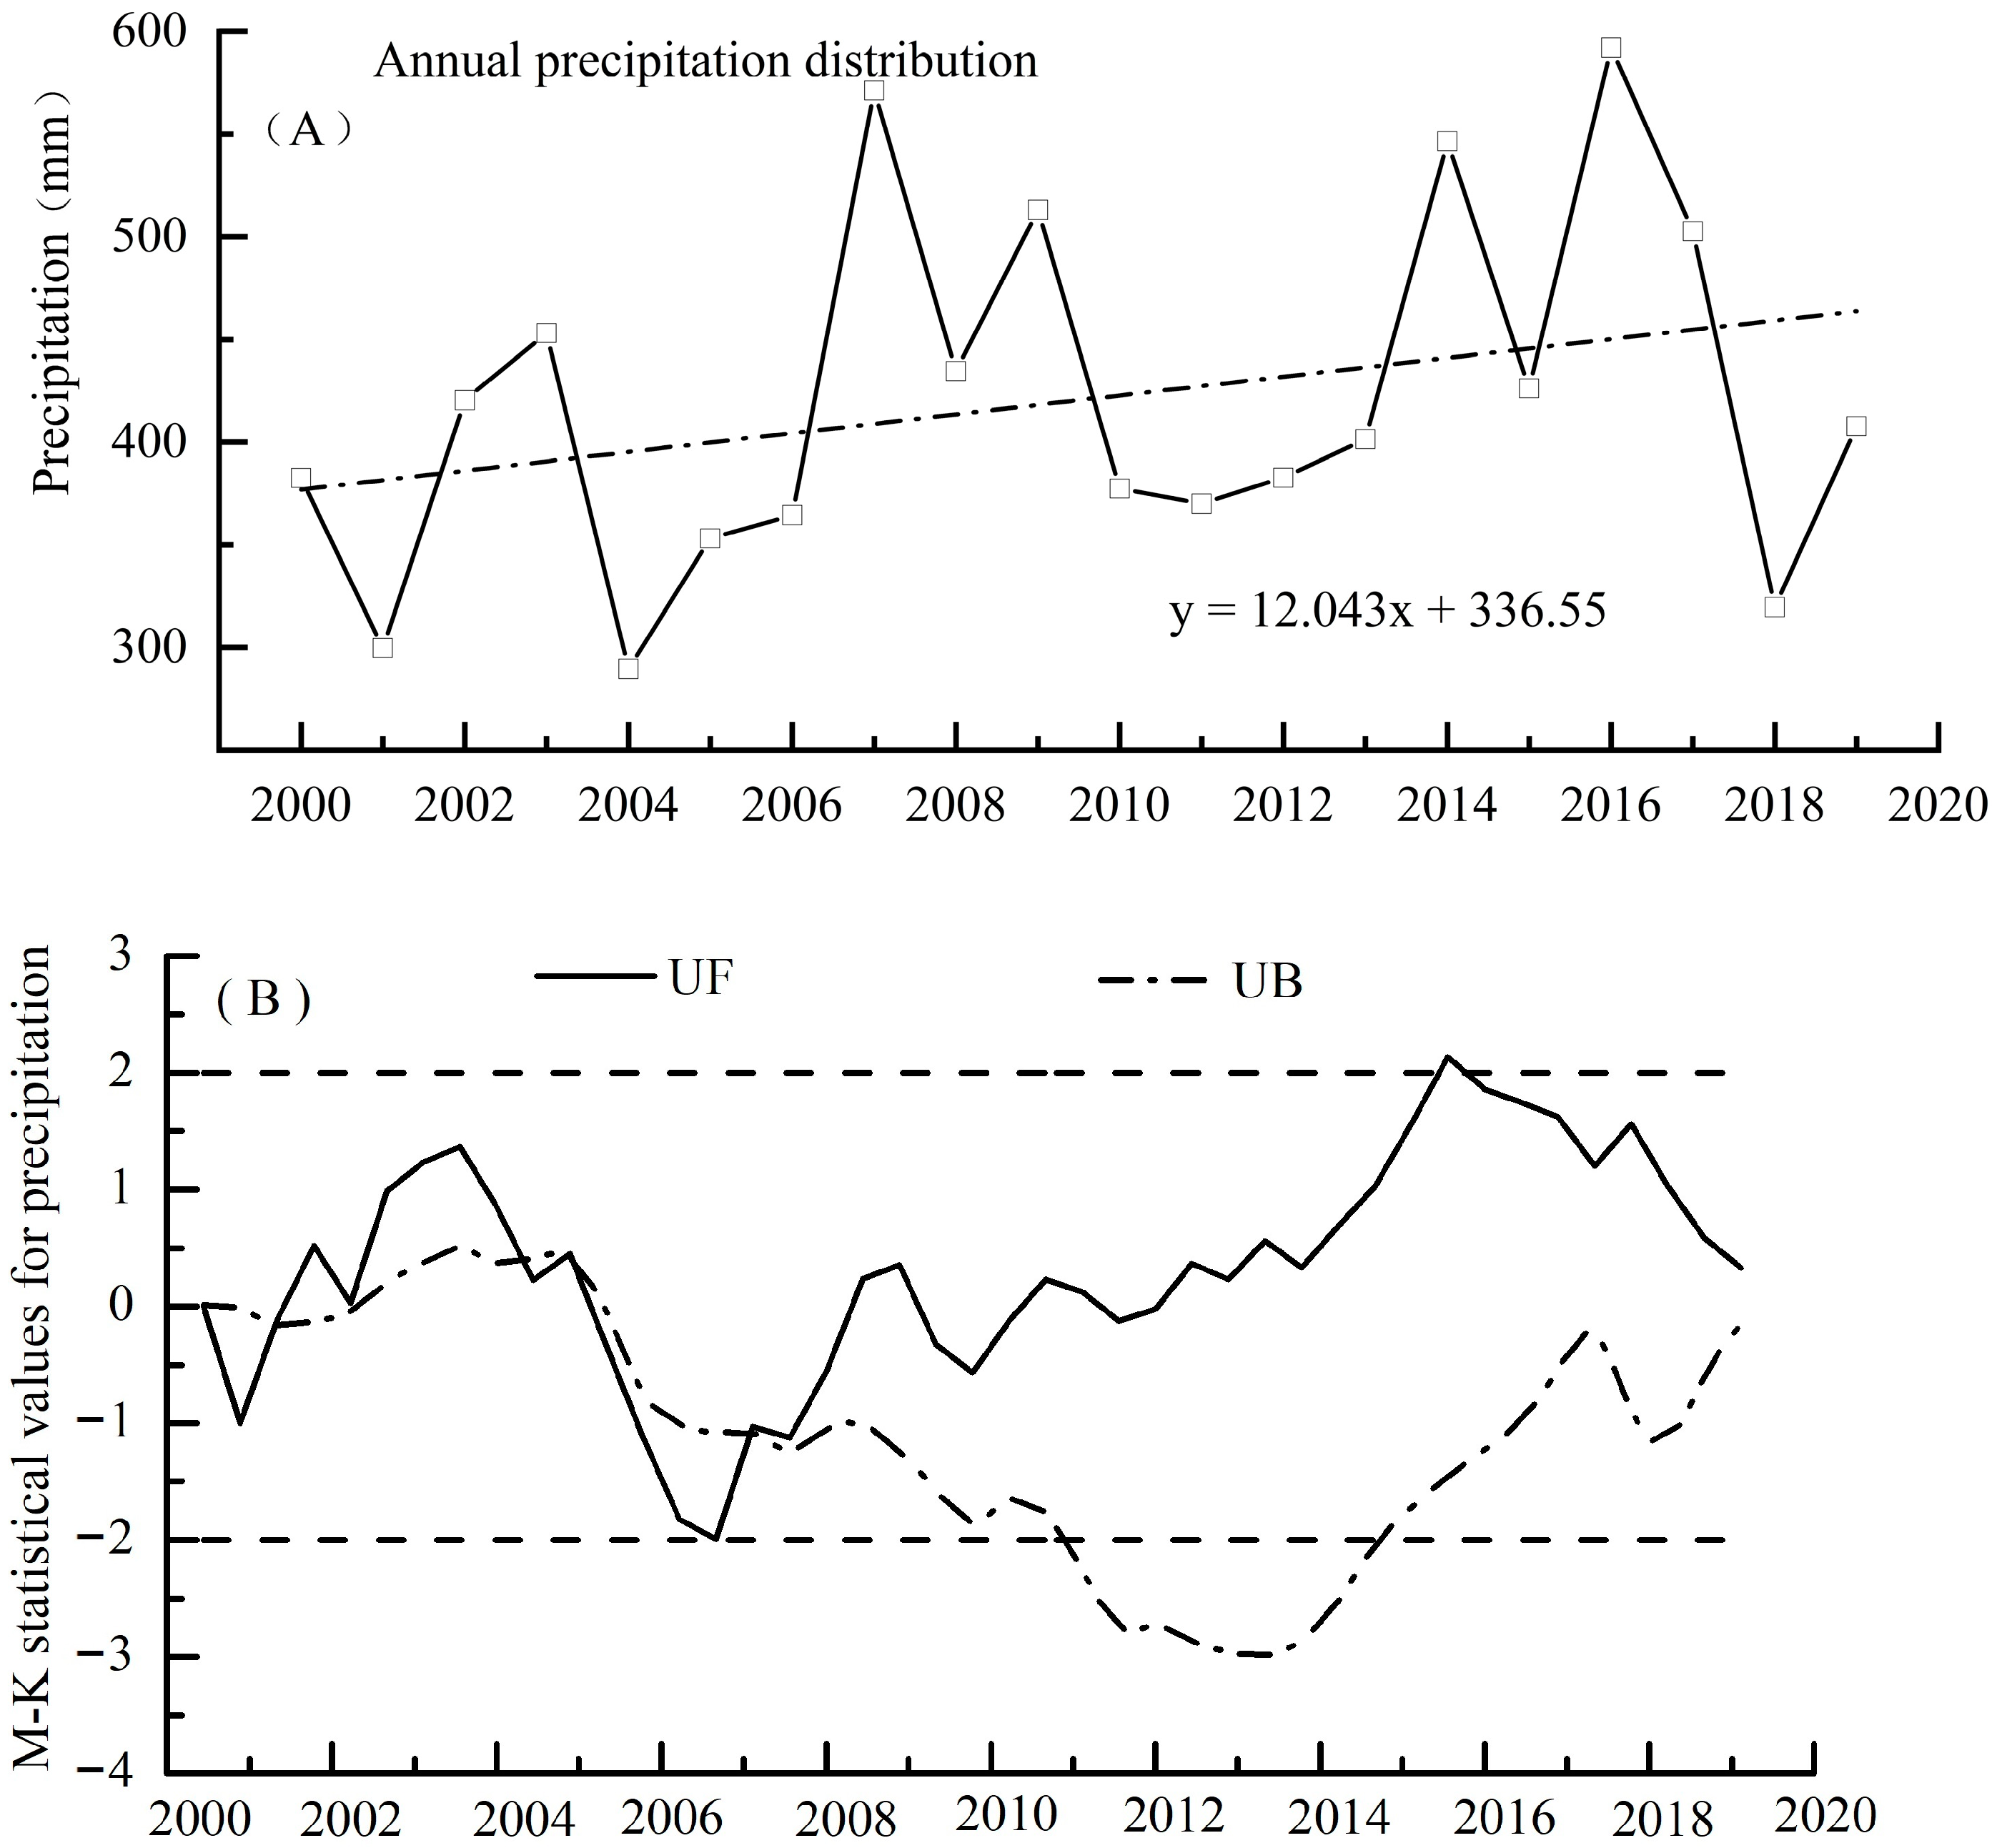
At the weather station at 2570 m, the interannual precipitation data in the Pailugou Basin exhibited a large fluctuation trend, with the maximum fluctuation value being 259 mm (Figure 11A). The trend line of precipitation over the past 20 years showed that the annual precipitation followed a slowly increasing trend, with an addition of 12.04 mm during every time step (year) (Figure 11A). In contrast, the non-parametric M-K test for the monotonic trend of precipitation suggested that the z value was 0, thus indicating that the interannual variation trend of annual precipitation during this period was not explicit. The annual precipitation changed in 2001, 2004, and 2008, with a significant change occurring in 2016 (Figure 11B).

3.3. Relationships between Runoff, Temperature, and Precipitation

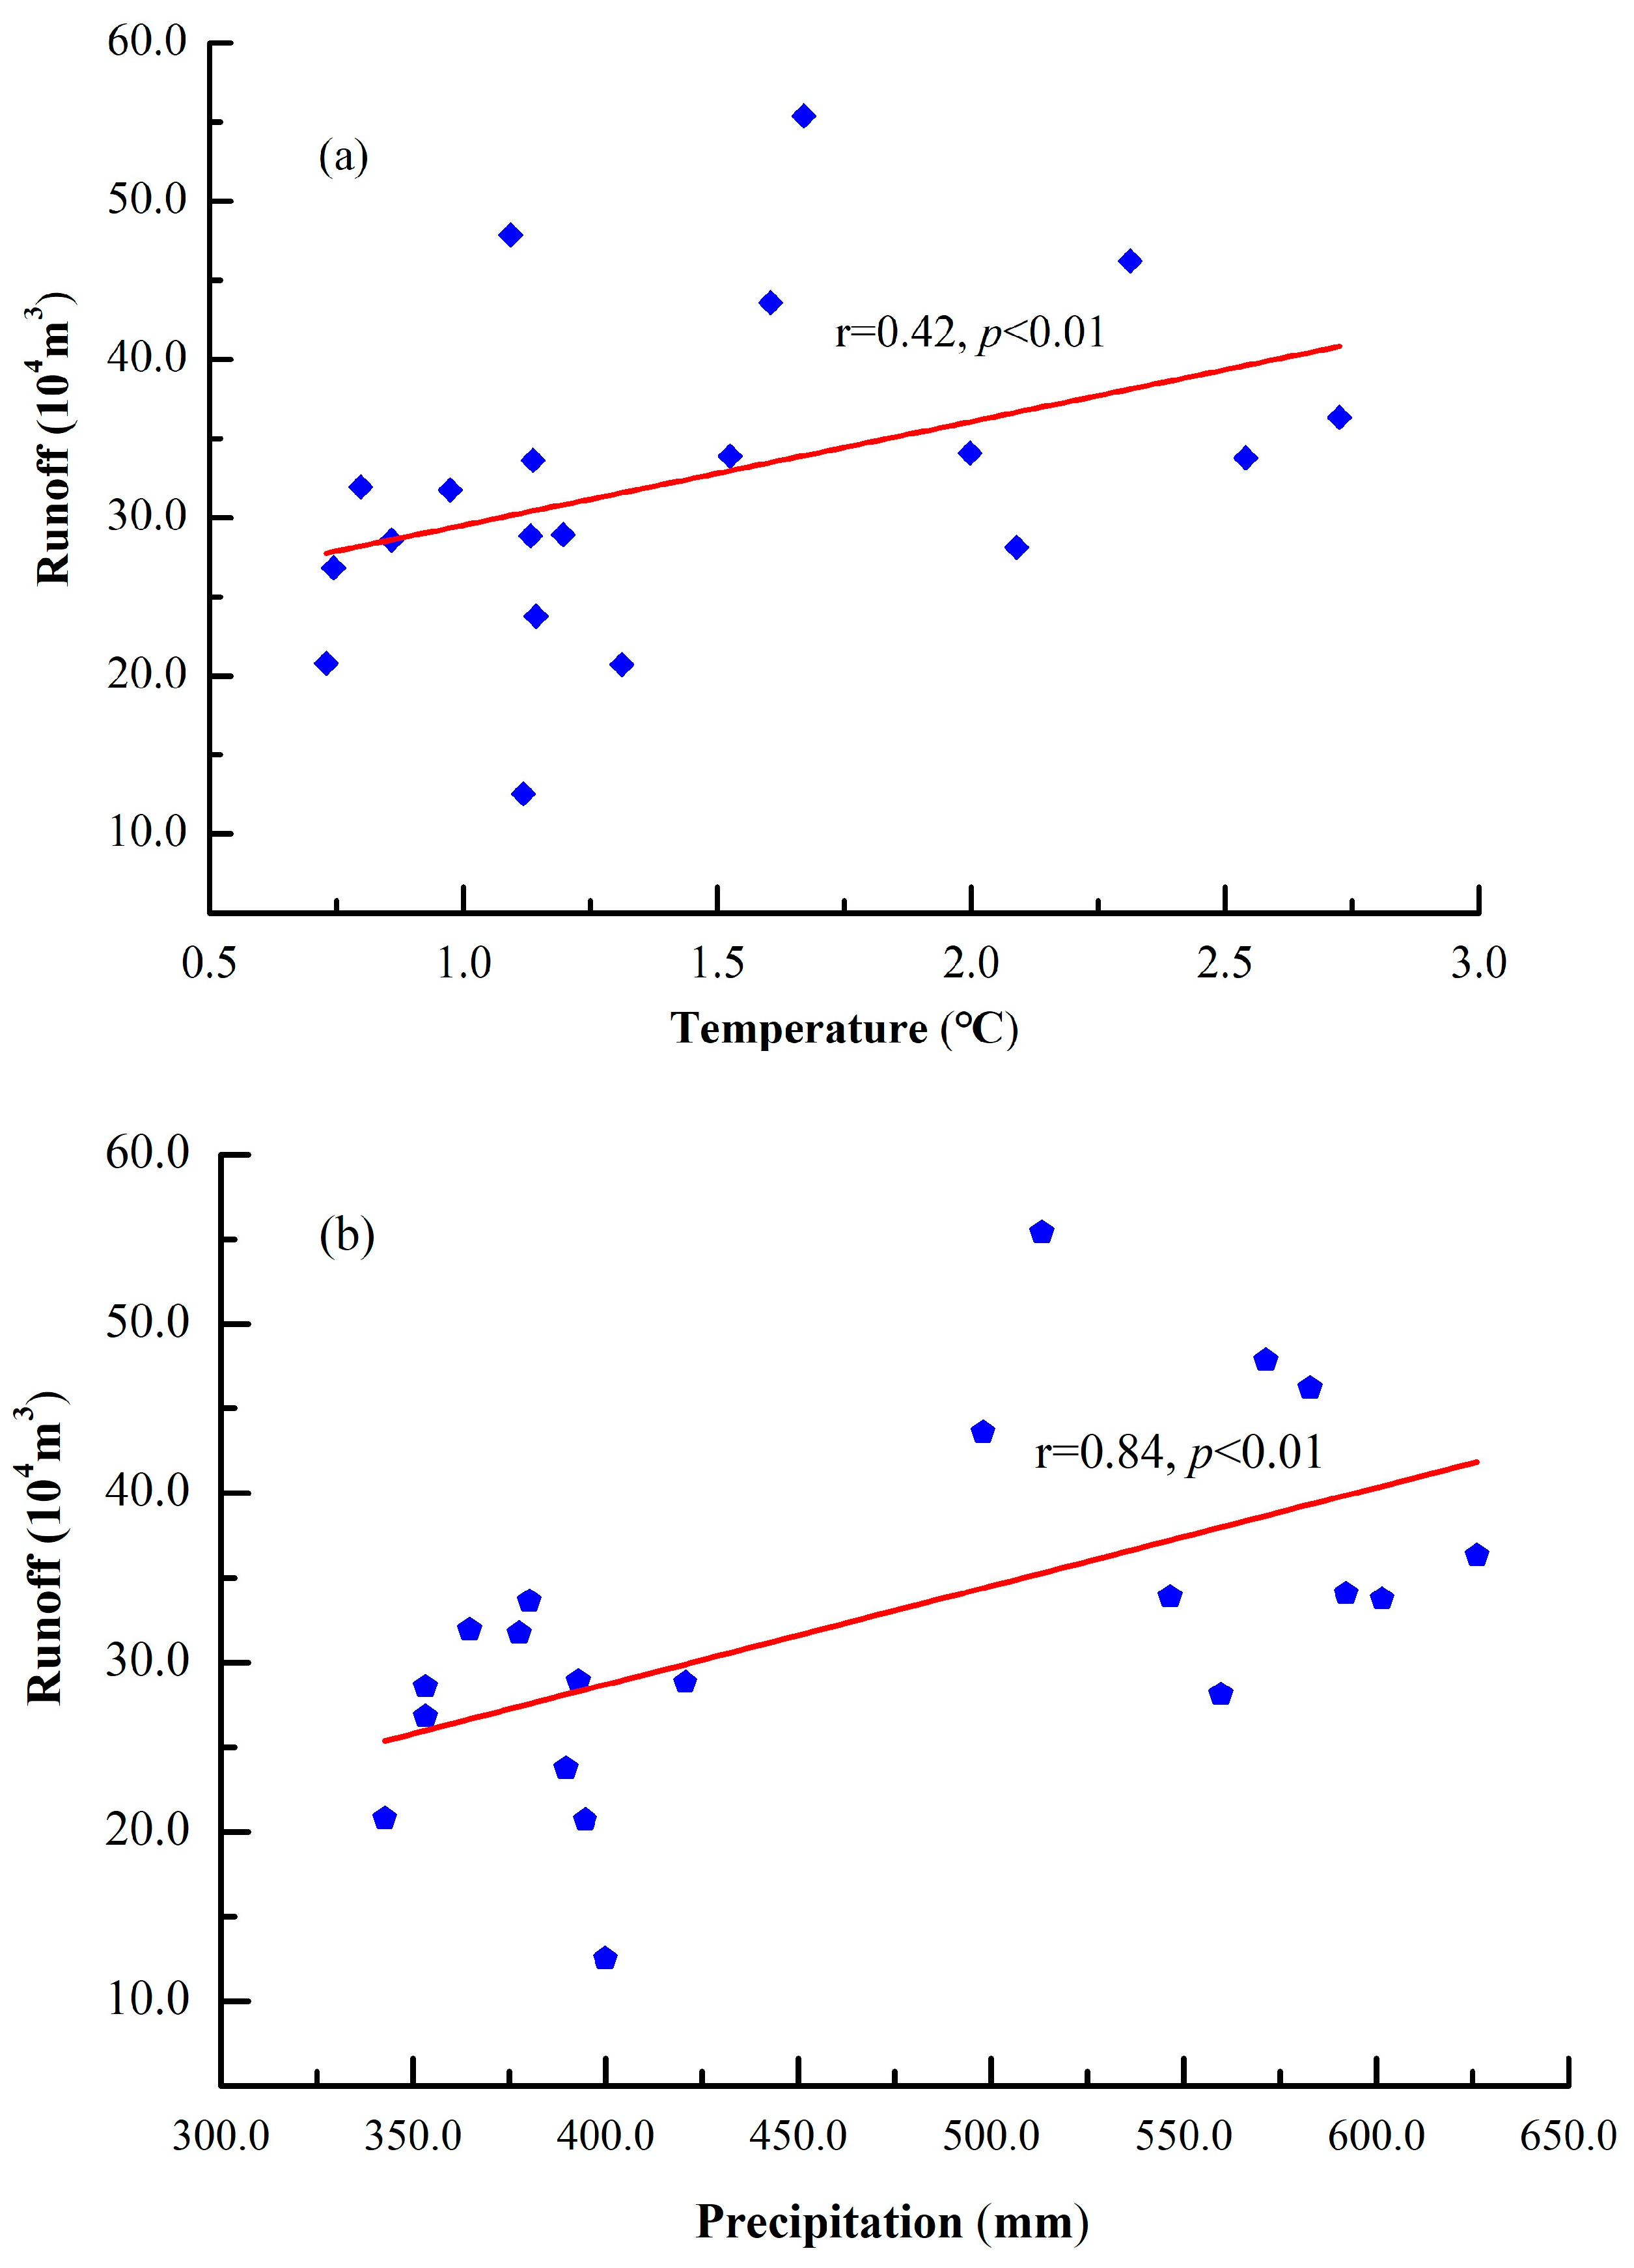
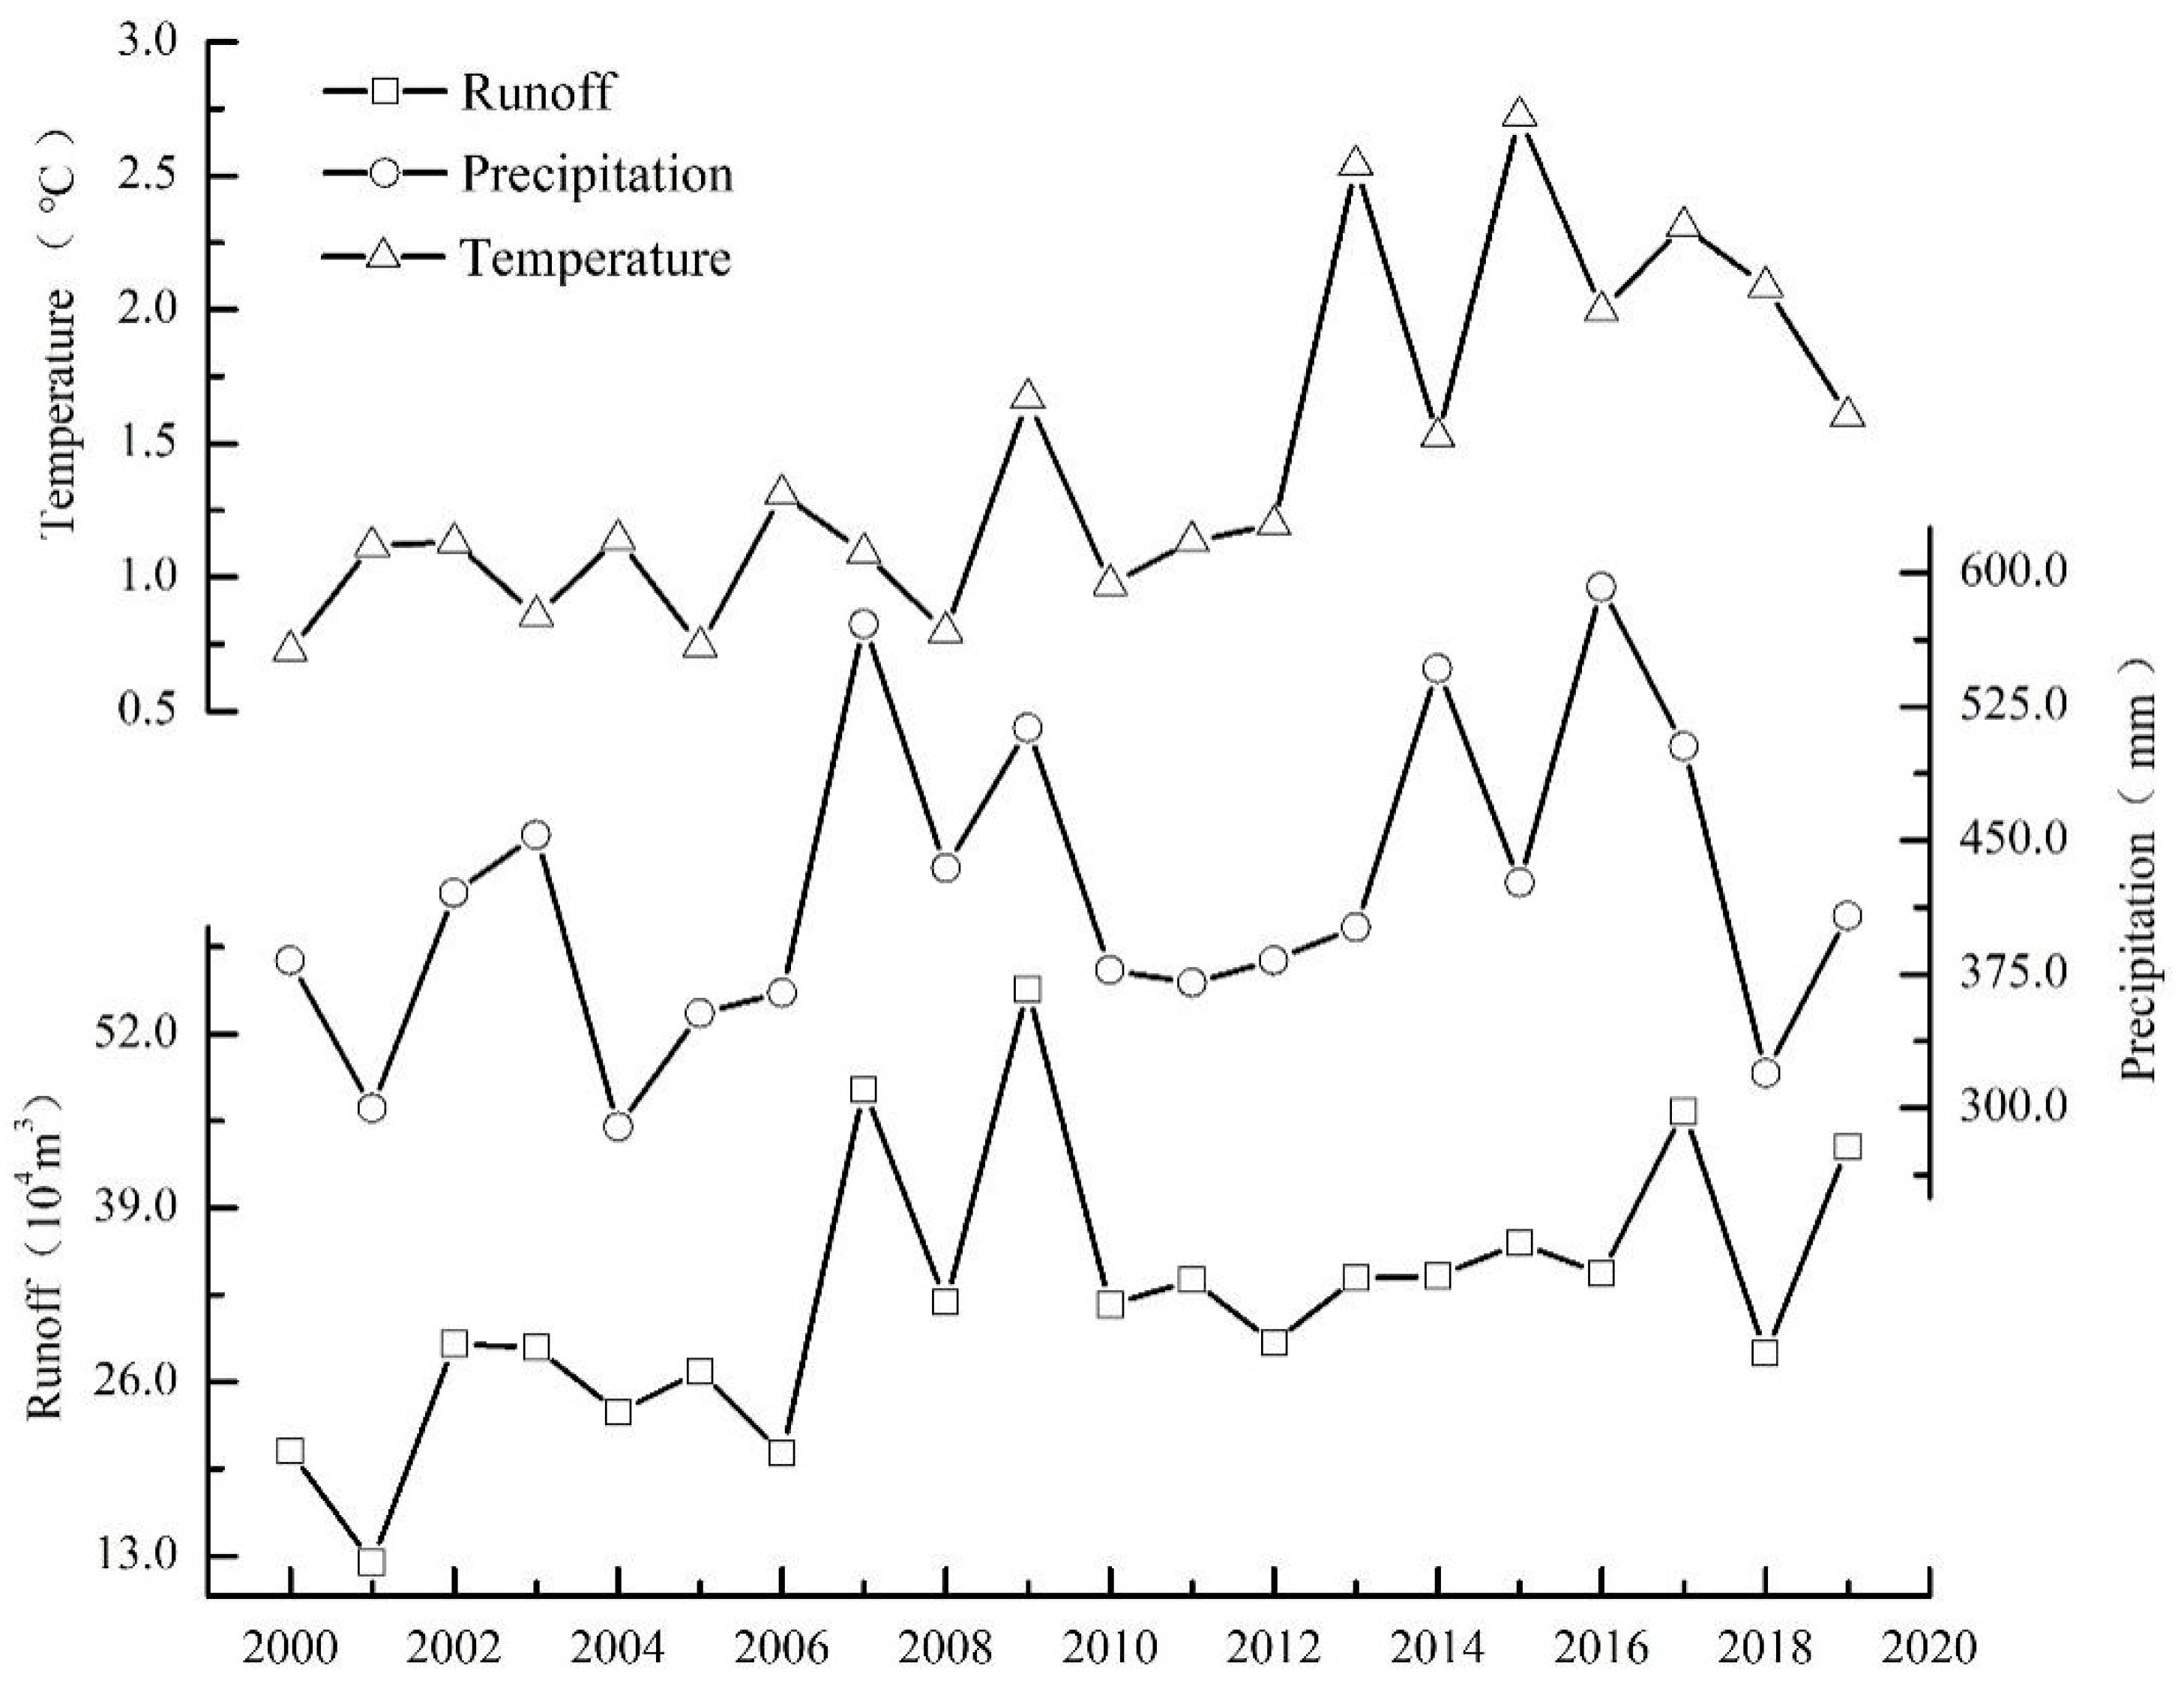
The Pearson’s r correlation coefficient between the runoff and annual average temperature was 0.421, indicating a positive correlation (Figure 12a). The annual distribution of both variables showed a unimodal shape (single peak curve), and the trend was roughly the same (Figure 2 and Figure 8). Comparing the maximum values, the maximum annual runoff was generated two months later than the time when the maximum of the monthly average temperature peak appeared within the year (Figure 2 and Figure 8, respectively). In 2000–2009, the annual average temperature and runoff showed a trend of a synchronous slow fluctuation and rise. In 2010–2019, the annual average temperature showed a trend of rising first and then falling, and the fluctuation was more intense (Figure 13). In contrast, the annual runoff increased steadily. Combined with the correlation analyses, we note that the annual average temperature and runoff had a positive correlation, but it was not significant (Figure 13).
The correlation coefficient between the annual precipitation and runoff was 0.839, exhibiting a significant positive correlation (Figure 12b). The annual runoff and precipitation in the Pailugou Basin had a single peak trend, and the peak was from June to October. The maximum values of precipitation and runoff were in July and August, respectively, i.e., the time delay difference between the two peaks was one month (Figure 2 and Figure 10, respectively). In addition to the opposite trend of precipitation and annual runoff in 2014 and 2015, the trend of annual runoff and annual precipitation in the most years was highly similar (Figure 13), i.e., the annual runoff of the Pailugou Basin changed with atmospheric precipitation in the region.

3.4. Response of Runoff to Climate

We compared the cumulative anomaly values of atmospheric precipitation, air precipitation, and river runoff in the basin and found that the trend of change in the annual runoff and annual precipitation was highly consistent (Figure 14). Moreover, the years shown in the M-K mutation test curve of the two were also consistent, and the correlation coefficient between the two was 0.839, so the annual precipitation in the Pailugou Basin dominated the changes in river runoff.
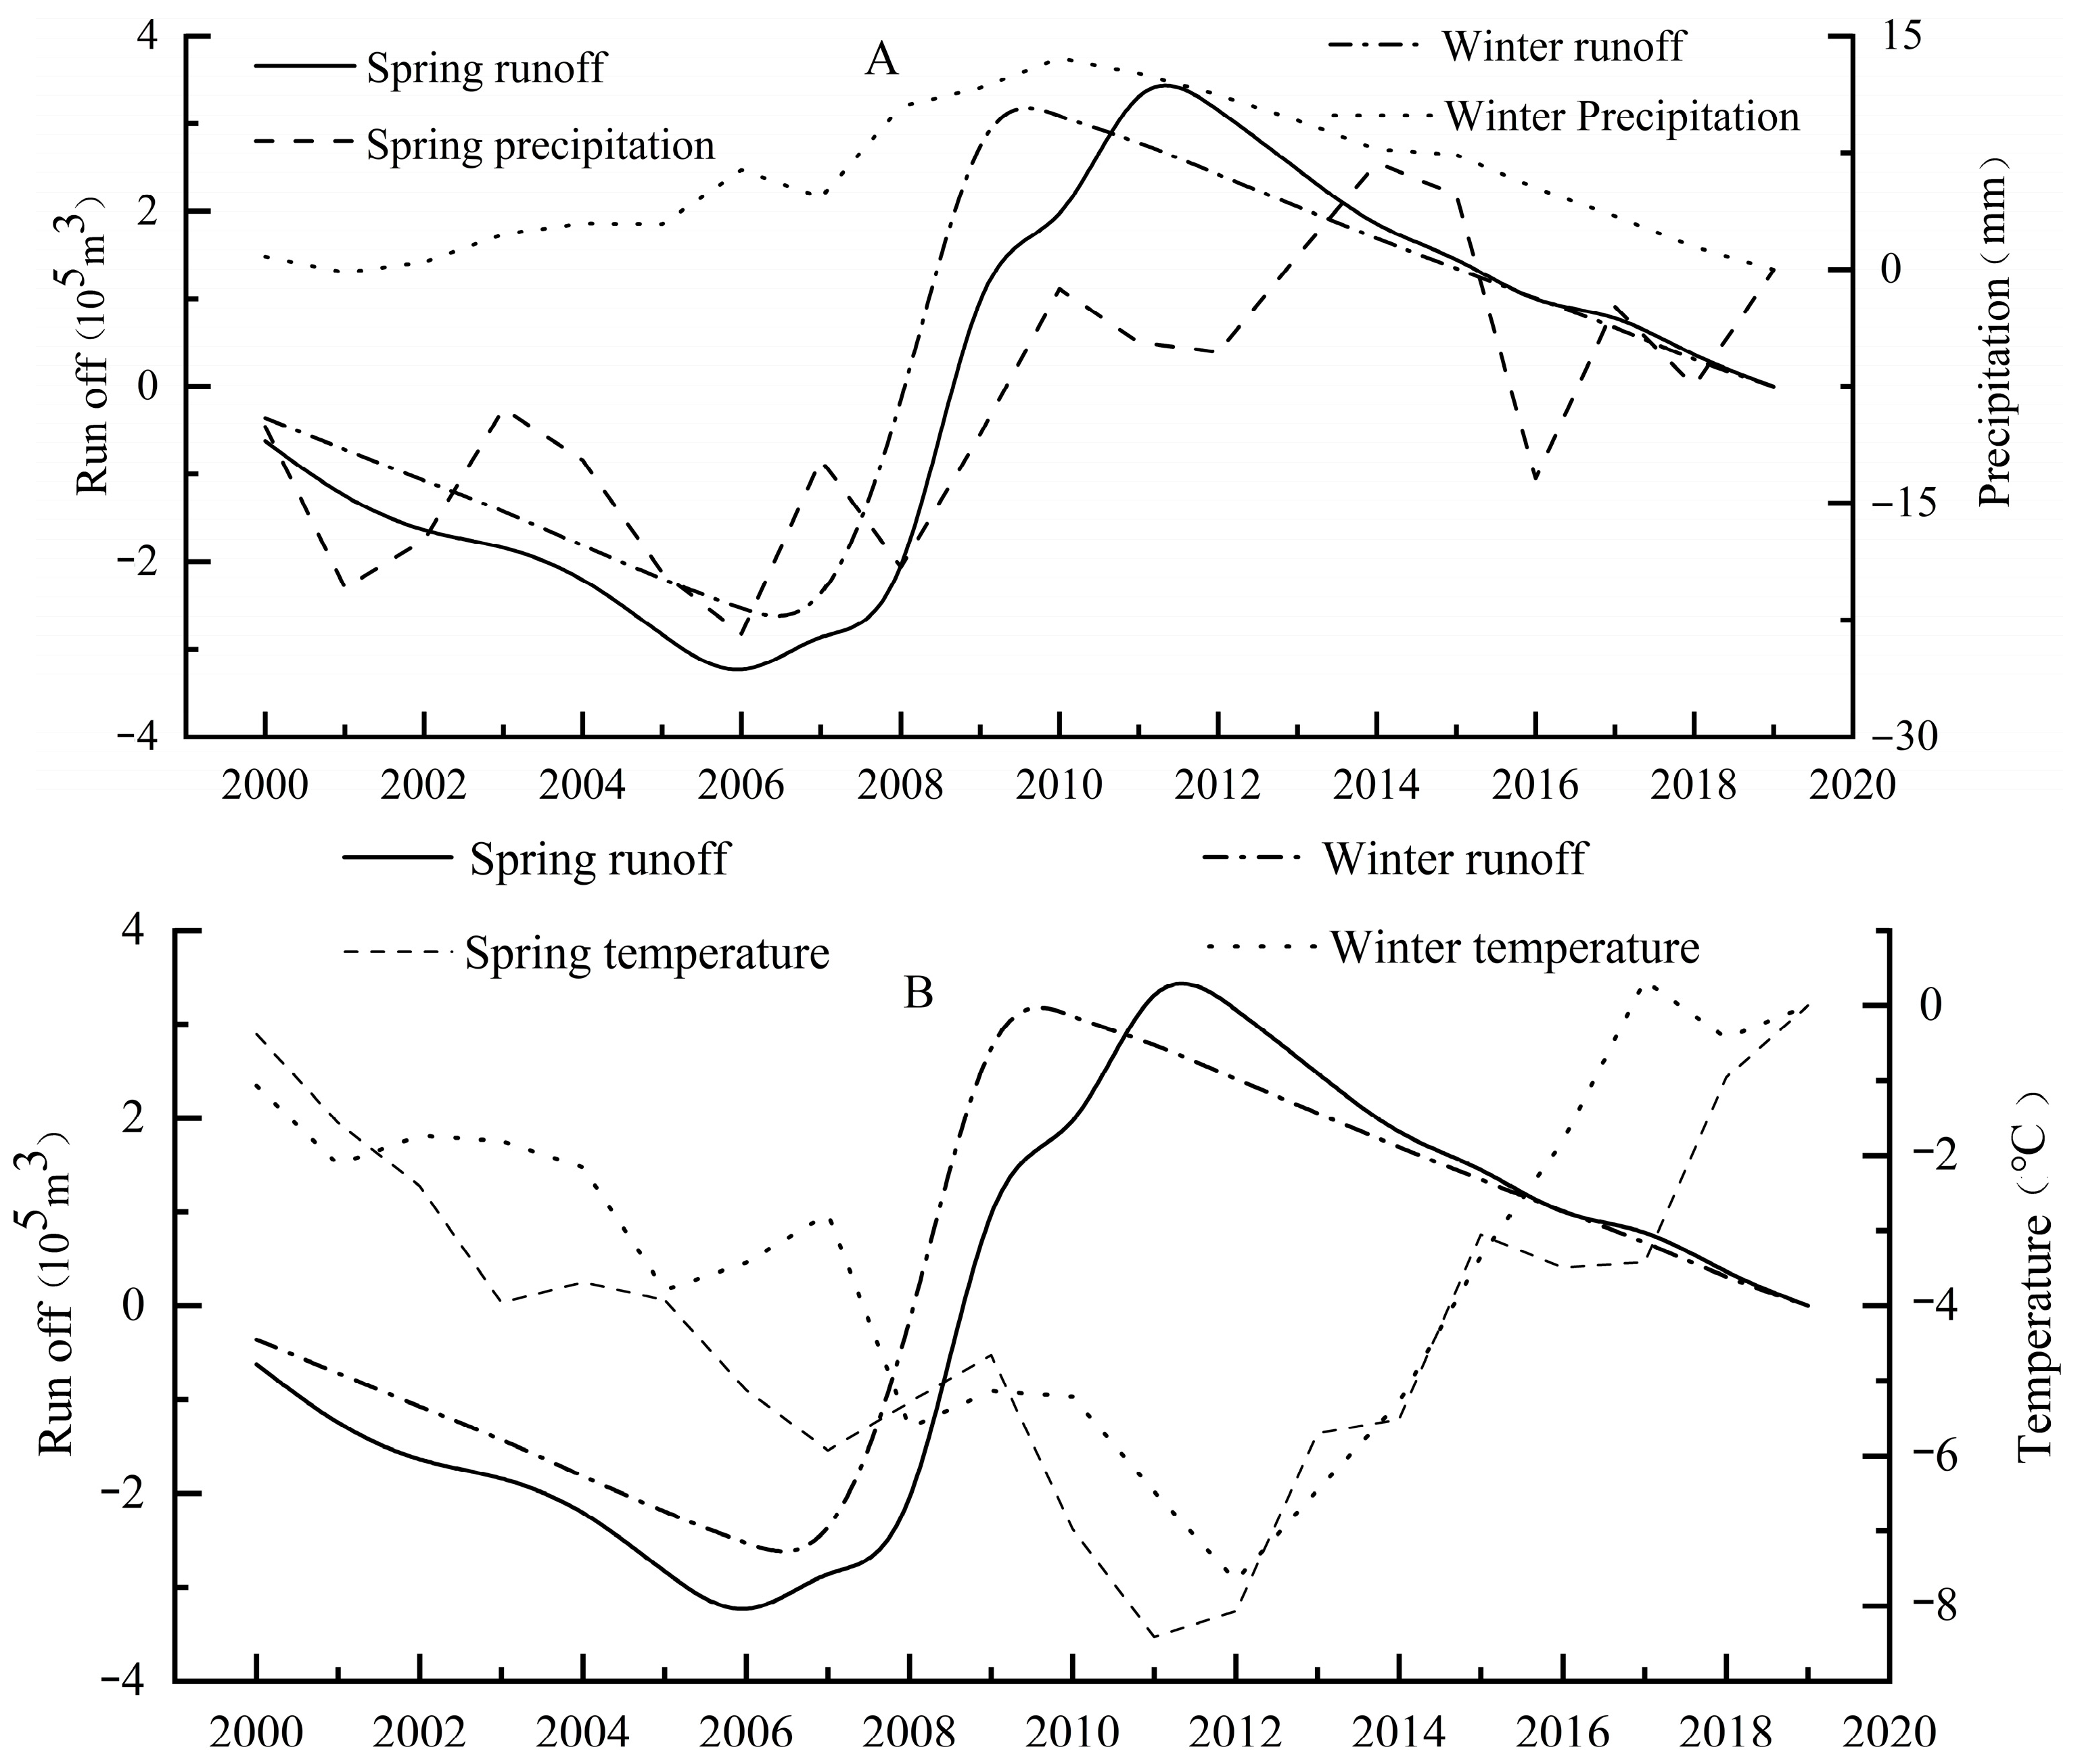
In terms of seasonal changes, the trends of river runoff and annual precipitation in spring, summer, and autumn are highly similar (Figure 15A and Figure 15C, respectively). The correlation coefficient between the two revealed that the runoff variation in the Pailugou Basin was more sensitive to the precipitation in spring, summer, and autumn, particularly in summer and autumn. In terms of the response of runoff to temperature (Figure 15B and Figure 15D, respectively), the trend of runoff and temperature in winter and spring, from 2000 to 2008, was basically the same, while the trend for the two from 2008 to 2019 was the opposite. The temperature change had little influence on the runoff in summer and autumn and had the least influence on the runoff in winter and spring.
The runoff in spring, summer, and autumn was positively correlated with precipitation in the same period as the correlation coefficients were 0.685, 0.875, and 0.714, respectively, and they all passed the 0.01 significance test (Table 5). The runoff was negatively correlated with temperature in the same period, and the correlation coefficients were −0.166, −0.332, and −0.007, respectively. In summary, the response of seasonal variations in runoff to climatic factors was also different. The runoff of the Pailugou Basin was greatly affected by rainfall in spring, summer, and autumn. The influence of precipitation and temperature on the change in summer runoff was explicit; the opposite was true for winter.

4. Discussion

Atmospheric precipitation and temperature are climate factors that are closely related and influence water runoff variation, and the variation in water runoff reflects the dynamic nature of these climate factors [45]. In this study, from 2000 to 2019, water runoff in the Pailugou Basin of the Qilian Mountains exhibited a trend of local fluctuation and an overall increase, and climate elements were the dominant factors affecting the runoff increase, although other factors (e.g., alterations in land surface) may also play a role in runoff variation [46]. In the short run, the increase in river runoff may have played a temporary role in alleviating the water shortage in the Pailugou Basin. However, in the long run, does this increase imply an accelerated melting of glaciers in the upper reaches of the Basin, thereby increasing the uncertainty and stochasticity of the impact of climate factors on runoff variation? In the context of global warming, the rising trend of air temperature in arid and semi-arid areas of northwest China is higher than the national average, particularly in the typical high and cold Qilian Mountains, in the northeastern escarpment of the Qinghai–Tibetan Plateau [47].
In addition to atmospheric precipitation, the runoff increase in the study area may also be related to temperature rises and the contribution of ice and snow ablation. Air temperature mainly contributes to the seasonal variation in runoff—but the influence of temperature has dual effects. On one hand, the temperature rise accelerates the melting of ice and snow, thus increasing the runoff supply in spring. On the other hand, rising temperatures help strengthen evapotranspiration demand, thus offsetting the replenishment of ice and snow melt. In addition, the influence of permafrost change caused by climate change on runoff should not be ignored. The rising temperature in the Qinghai–Tibet Plateau leads to the decrease in the position of the frozen soil layer and the shortening of thawing time, thus reducing the runoff [48]. In addition, the radiative heating effect of snow cover also has a certain regulatory effect on the surface hydrological process of the Qinghai–Tibetan Plateau [49].
In recent years (2000–2019), the precipitation in the watersheds of the Qilian Mountains showed a slowly increasing trend which is directly reflected by the steadily increasing runoff. At the same time, the interannual temperature rise trend was significant, and the resulting increase in runoff was probably due to the geographic position and orientation of the drainage area. Indeed, the Pailugou Basin is located at the northern end of the Qilian Mountains, and the dominant component of river runoff includes not only precipitation but also summer snowmelt runoff. The runoff in the drainage area has a “single-peak” curve and long runoff production time. This point has been already confirmed by the “Evaluation Report on the Effectiveness of Ecological Governance in Qilian Mountains” released by the Northwest Institute of Eco-Environment and Resources of the Chinese Academy of Sciences in 2018. In basins with a high contribution of meltwater recharges, like the Pailugou Basin, the long-term trend of river runoff under the background of climate warming has its own characteristics. As temperatures rise, the accelerated melting of glaciers increases the quantities of meltwater, which may contribute to increased river runoff in the short term. However, in the long term, with the continuous loss of glaciers, glacier reserves will gradually decrease, and glacier meltwater runoff will eventually dry up. The critical time (“turning point”) and the corresponding river runoff in the basin dominated by ice and snow meltwater supply is of great significance to water resource utilization and management. The “turning point” of river runoff is mostly determined by the accumulative result of the three components of the total runoff, the glacier meltwater runoff, the snow meltwater runoff, and the rainfall runoff; among them, the glacier meltwater runoff is of particular concern since it is mostly affected by the medium- and long-term increases in air temperature.
There is great uncertainty in the simulation of glacier meltwater runoff in the Basin, and the trends of glacier meltwater runoff predicted in current simulations largely depend on the meteorological input and hydrological model used. Due to the different hydrological models and meteorological driving data used in previous studies, the conclusions on the future trends of glacier meltwater runoff on the Heihe watershed are somewhat different (see [50] for a review on Heihe’s hydrological modeling), depending each time on the scope of the modelling. The high and cold region of the Qilian Mountains is a typical area with scarce data due to its remote location, complicated topography, and insufficient hydrometeorological observation. The data scarcity brings great uncertainty to the runoff forecast. In addition, glaciers, snow cover, and frozen soil are widely influenced by human activities in the Qilian Mountains [51], and the cryosphere changes are very sensitive to climate warming. Cryosphere changes not only affect the water cycle but also affect the hydrological process by affecting soil characteristics, geomorphology, vegetation growth, and finally regional climate. Thus, our research could help the application of modelling by improving our understanding of surface runoff temporal dispersion.
The impact of eco-hydrological responses due to climate change and how these responses are expected to affect the socio-economic dimension of the Pailugou Basin is profound. Although human activities are totally excluded in our experimental watershed after the designation of the area as protected in 2019, such effects are critical to the wider arid areas affected by the internal drainage system (endorheic) of the Heihe river. Our results are in accordance with previous research, which showed that climate warming led to greater precipitation, snowmelt, glacier melt, and runoff in the wider Heihe basin, which is in favor of alleviating water scarcity [52]. Also, it may affect the conversion of marginal arid lands to productive ones, which is the case in other areas [53]. While the natural wetland ecosystems lower in the greater watershed have been supported, the overuse of water in midstream and the water use for agriculture in downstream considerably increase water stress. The latter resulted in negative surface–ground water interactions and underpins the need to fairly allocate water resources.
Although much progress has been made in the study of hydrological effects in the high and cold regions of the Qilian Mountains, still many physical mechanisms are not well understood, and the models are not accurate enough to consider the complex processes and influencing mechanisms. This also brings great uncertainty to the simulation and prediction of river runoff in the region. The variations in river runoff in the Qilian Mountains affect all living elements of the natural environment and the social and economic development of the source area. In this sense, the lower reaches of the river serve as an indicator of the significant social and economic impact of environmental changes in the Qilian Mountains. However, current scientific observations and studies are not sufficient to effectively support scientific decision making to deal with the impact of runoff changes in the river’s headwaters. As previously mentioned, correlations and time series should be utilized to improve our understanding of stream flow, groundwater dynamics, and the overall hydrologic responses to climate change to improve policy decision making in our watersheds [16]. It is urgent to strengthen the monitoring and scientific observation activity for the Pailugou Basin and the “Mother River of Hexi Corridor” water source area and to strengthen the observation of river runoff, glacier, frozen soil, snow, groundwater, and other water cycle-related elements in the Qilian Mountain area. It is also urgent to strengthen the simulation and prediction ability of river runoff and to evaluate the comprehensive impact of changes in river runoff so as to provide scientific and technological support for decision makers.

5. Conclusions

The river runoff data of the Pailugou Basin in the Qilian Mountains was analyzed from 2000 to 2019. The temperature and precipitation data, the basic runoff characteristics statistical method, anomaly accumulation, uneven coefficient, correlation analysis, and other methods were used to analyze the characteristics of surface runoff, such as intra-annual changes, interannual changes, and trends. The following main conclusions were drawn:
  • The annual surface runoff in the basin fluctuated over the 20-year period, but showed an overall upward trend, increasing by 3.94 × 10⁵ m3, with an average increase rate of 0.42 × 10⁵ m3/10a. The annual runoff series distribution of the Pailugou Basin in the Qilian Mountains was consistent with the basic characteristics of typical ice and snow basins, that is, the annual surface runoff distribution was relatively concentrated and positively biased, with a small dispersion degree, and the frequency of maximum and minimum values were relatively concentrated. Under the comprehensive influence of precipitation, temperature, and summer snowmelt (ice), the annual runoff distribution in the Pailugou Basin presents a unique “unimodal” curve and long runoff production time. The concentration of the runoff distribution was large, and the relative change amplitude exhibited a decreasing trend year by year.
  • The runoff from July to September accounted for 85.36% of the total. It was also found that the annual surface runoff in the basin fluctuated over the 20-year period but had an overall upward trend, increasing by 3.94 × 10⁵ m3, with an average increase rate of 0.42 × 10⁵ m3/10a. During 2006 to 2010, the annual runoff increased significantly and fluctuated greatly, forming an ‘M’-type change trend, with 2007 and 2009 as the peaks and 2008 as the valley. The maximum value of the annual distribution concentration Ci of runoff was 63.52%, corresponding to 231° in the vector direction, which appeared in 2000–2004, and the minimum value was 57.15%, corresponding to 227° in the vector direction, which appeared in 2015–2019, with an average value of 60.29%. The correlation between the runoff and precipitation was significantly high (r = 0.839, p < 0.05), whereas the correlation between air temperature and surface runoff was low (r = 0.421, p > 0.05), showing that the runoff was controlled mostly by precipitation.
  • The annual runoff distribution in the Pailugou Basin gradually became smooth and uniform from the initial large fluctuation. Meanwhile, with the passage of time, the variation trend of the annual distribution uneven coefficient (Cu) of the runoff was highly consistent with the curve fluctuation of the complete regulation coefficient (Cr). The annual runoff of the Pailugou Basin exhibited an increasing trend during the fluctuation.
  • There was a correlation between surface runoff, air temperature, and precipitation in the Pailugou Basin. Among them, a highly significant positive correlation was observed between the runoff and precipitation, while the correlation between the runoff and temperature was insignificant, so we concluded that the runoff was mainly controlled by the atmospheric precipitation in the region.

Author Contributions

Conceptualization: X.R. and W.Z.; methodology: R.W.; software: W.J.; validation: X.J. and C.Y.; formal analysis: R.L.; investigation: E.X.; resources: X.R.; data curation: R.W.; writing—original draft preparation: X.J.; writing—review and editing: X.R., C.K.S. and M.V.; visualization: X.R.; supervision: X.J.; funding acquisition: X.R. All authors have read and agreed to the published version of the manuscript.

Funding

This research was funded by the National Natural Science Foundation of China (U21A20468, U22A20592, 32060247); the Gansu Youth Science and Technology Fund Project (20JR10RG824); the Gansu Haizhi Plan Demonstration Project (GSHZSF2023-02); and the Gansu Technology Plan Project (22JR10KA026).

Data Availability Statement

The data presented in this study are available on request from the corresponding author due to privacy restrictions.

Acknowledgments

The authors express their gratitude to anonymous reviewers for the significant improvement of the manuscript.

Conflicts of Interest

We declare that we have no financial and personal relationships with other people or organizations that can inappropriately influence our work. There is no professional or other personal interest of any nature or kind in any product, service, and/or company that could be construed as influencing the position presented in, or the review of, the manuscript entitled, “Changes in Long-term Surface Runoff and Temporal Dispersion in a Grassland and Forest Alpine Region in Northwest China”.

References

  1. Brauman, K.A. Hydrologic ecosystem services: Linking ecohydrologic processes to human well-being in water research and watershed management. WIREs Water 2015, 2, 345–358. [Google Scholar] [CrossRef]
  2. Swift, D.A.; Nienow, P.W.; Hoey, T.B. Basal sediment evacuation by subglacial meltwater: Suspended sediment transport from Haut Glacier d’Arolla, Switzerland. Earth Surf. Process. Landf. 2005, 30, 867–883. [Google Scholar] [CrossRef]
  3. Zhu, L.; Xie, M.; Wu, Y. Quantitative analysis of lake area variations and the influence factors from 1971 to 2004 in the Nam Co basin of the Tibetan Plateau. Chin. Sci. Bull. 2010, 55, 1294–1303. [Google Scholar] [CrossRef]
  4. Ersi, K. Relationship between runoff and meteorological factors and its simulation in a Tianshan glacierized basin. In Proceedings of the 20th General Assembly of the International Union of Geodesy and Geophysics, Vienna, Austia, 11–24 August 1991; pp. 189–202. [Google Scholar]
  5. Stern, N.H. The Economics of Climate Change: The Stern Review; Cambridge University Press: Cambridge, UK, 2007; p. 662. [Google Scholar]
  6. Peterson, B.J.; Holmes, R.M.; McClelland, J.W.; Vorosmarty, C.J.; Lammers, R.B.; Shiklomanov, A.I.; Rahmstorf, S. Increasing river discharge to the Arctic Ocean. Science 2002, 298, 2171–2173. [Google Scholar] [CrossRef] [PubMed]
  7. Nie, W.; Yuan, Y.; Kepner, W.; Nash, M.S.; Jackson, M.; Erickson, C. Assessing impacts of landuse and landcover changes on hydrology for the upper San Pedro watershed. J. Hydrol. 2011, 407, 105–114. [Google Scholar] [CrossRef]
  8. Ahl, R.S.; Woods, S.W.; Zuuring, H.R. Hydrologic calibration and validation of swat in a snow-dominated rocky mountain watershed, Montana, USA. JAWRA 2008, 44, 1411–1430. [Google Scholar]
  9. Wang, Y.-J.; Qin, D.-H. Influence of climate change and human activity on water resources in arid region of Northwest China: An overview. Adv. Clim. Chang. Res. 2017, 8, 268–278. [Google Scholar] [CrossRef]
  10. Li, D.; Liu, H. Responding of Heihe River runoff to decadal climate change in Qilian Mountain Area. J. Desert Res. 2004, 24, 385–391. [Google Scholar]
  11. Zhang, Q.; Zhang, J.; Song, G.W.; Di, X.H. Research on atmospheric water-vapor distribution over Qilianshan Mountains. Acta Meteorol. Sin. 2007, 65, 633–643. [Google Scholar]
  12. Liu, S.; Li, X.; Xu, Z.; Che, T.; Xiao, Q.; Ma, M.; Liu, Q.; Jin, R.; Guo, J.; Wang, L.; et al. The Heihe Integrated Observatory Network: A basin-scale land surface processes observatory in China. VZJ 2018, 17, 1–21. [Google Scholar] [CrossRef]
  13. Zhou, T.; Akiyama, T.; Horita, M.; Kharrazi, A.; Kraines, S.; Li, J.; Yoshikawa, K. The impact of ecological restoration projects in dry lands: Data-based assessment and human perceptions in the lower reaches of Heihe River Basin, China. Sustainability 2018, 10, 1471. [Google Scholar] [CrossRef]
  14. Wang, Y.; Feng, Q.; Chien, L.; Yu, T. Significance and effect of ecological rehabilitation project in inland river basins in Northwest China. Environ. Manag. 2013, 52, 209–220. [Google Scholar] [CrossRef] [PubMed]
  15. Machiwal, D.; Jha, M.K. Time series analysis of hydrologic data for water resources planning and management: A review. J. Hydrol. Hydromech. 2006, 54, 237–257. [Google Scholar]
  16. Hanson, R.T.; Newhouse, M.W.; Dettinger, M.D. A methodology to asess relations between climatic variability and variations in hydrologic time series in the southwestern United States. J. Hydrol. 2004, 287, 252–269. [Google Scholar] [CrossRef]
  17. Singh, P.; Kumar, A.; Kumar, N. Hydro-meteorological correlations and relationships for estimating streamflow for Gangotri Glacier basin in western Himalayas. Int. J. Water Res. Environ. Eng. 2010, 3, 60–69. [Google Scholar]
  18. Srivastava, D.; Kumar, A.; Verma, A.; Swaroop, S. Analysis of climate and melt-runoff in Dunagiri glacier of Garhwal Himalaya (India). Water Resour. Manag. 2014, 28, 3035–3055. [Google Scholar] [CrossRef]
  19. Bao, Z.; Zhang, J.; Liu, J.; Wang, G.; Yan, X.; Wang, X.; Zhang, L. Sensitivity of hydrological variables to climate change in the Haihe River basin, China. Hydrol. Process. 2012, 26, 2294–2306. [Google Scholar] [CrossRef]
  20. Li, D.; Lu, X.; Overeem, I.; Walling, D.E.; Syvitski, J.; Kettner, A.J.; Bookhagen, B.; Zhou, Y.; Zhang, T. Exceptional increases in fluvial sediment fluxes in a warmer and wetter High Mountain Asia. Science 2021, 374, 599–603. [Google Scholar] [CrossRef] [PubMed]
  21. Meng, F.; Su, F.; Li, Y.; Tong, K. Changes in terrestrial water storage during 2003-2014 and possible causes in Tibetan Plateau. J. Geophys. Res. Atmos. 2019, 124, 2909–2931. [Google Scholar] [CrossRef]
  22. Lutz, A.F.; Immerzeel, W.W.; Shrestha, A.B.; Bierkens, M.F.P. Consistent increase in High Asia’s runoff due to increasing glacier melt and precipitation. Nat. Clim. Chang. 2014, 4, 587–592. [Google Scholar] [CrossRef]
  23. Zhao, Q.; Ding, Y.; Wang, J.; Gao, H.; Zhang, S.; Zhao, C.; Xu, J.; Han, H.; Shangguan, D. Projecting climate change impacts on hydrological processes on the Tibetan Plateau with model calibration against the glacier inventory data and observed streamflow. J. Hydrol. 2019, 573, 60–81. [Google Scholar] [CrossRef]
  24. Gu, H.; Yu, Z.; Yang, C.; Ju, Q. Projected changes in hydrological extremes in the Yangtze River Basin with an ensemble of regional climate simulations. Water 2018, 10, 1279. [Google Scholar] [CrossRef]
  25. Barnett, T.P.; Adam, J.C.; Lettenmaier, D.P. Potential impacts of a warming climate on water availability in snow-dominated regions. Nature 2005, 438, 303–309. [Google Scholar] [CrossRef] [PubMed]
  26. Jin, X. Ecohydrology in Water-Limited Environments using Quantitative Remote Sensing—The Heihe river Basin China (Case). Ph.D. Thesis, Wageningen Universiteit, Wageningen, The Netherlands, 2009; 121p. [Google Scholar]
  27. Baranova, A.N. Grazing Impacts on Vegetation Patterns in the Qilian Mountains, HeiHe River Basin, NW China. Ph.D. Thesis, Faculty of Mathematic, Informatics and Natural Sciences, Department of Earth Sciences, Universität Hamburg, Hamburg, Germany, 2018; 141p. [Google Scholar]
  28. Wang, G.; Zhou, G.; Yang, L.; Li, Z. Distribution, species diversity and life-form spectra of plant communities along an altitudinal gradient in the northern slopes of Qilianshan Mountains, Gansu, China. Plant Ecol. 2002, 165, 169–181. [Google Scholar] [CrossRef]
  29. Yin, Z.; Feng, Q.; Wen, X.; Deo, R.C.; Yang, L.; Si, J.; He, Z. Design and evaluation of SVR, MARS and M5Tree models for 1, 2 and 3-day lead time forecasting of river flow data in a semiarid mountainous catchment. Stoch. Environ. Res. Risk Assess. 2018, 32, 2457–2476. [Google Scholar] [CrossRef]
  30. Hou, X. Vegetation Atlas of China. In Chinese and in English; KexueChubanshe: Beijing, China, 2001. [Google Scholar]
  31. Kürschner, H.; Herzschuh, U.; Wagner, D. Phytosociological studies in the north-eastern Tibetan Plateau (NW China): A first contribution to the subalpine scrub and alpine meadow vegetation. Bot. Jahrb. Syst. 2005, 126, 273–315. [Google Scholar] [CrossRef]
  32. LY/T 1606-2003; Indicators System for Long-Term Observation of Forest Ecosystem. Standards Press of China: Beijing, China, 2003.
  33. LY/T 1721-2008; Specifications for Assessment of Forest Ecosystem Services in China. Standards Press of China: Beijing, China, 2008.
  34. Guo, Q.L.; Yang, Y.S.; Chang, X.Y. Annual variation of Heihe River runoff during 1957–2008. Prog. Geogr. 2011, 30, 550–556. [Google Scholar]
  35. Xue, J.; Li, L.H.; Li, X.M. Annual distribution of precipitation and runoff and the synchronicity of their variations in the Kaidu river basin. J. Arid Land Res. Environ. 2014, 28, 99–104. [Google Scholar]
  36. Tian, L.; Qi, S.; Ma, J.; Zhang, P.; Zhao, Y.; Ning, N. Changes of annual runoff distribution in Upper Bailongjiang River. J. Chin. Hydrol. 2012, 32, 82–87. [Google Scholar]
  37. Mann, H.B. Nonparametric tests against trend. Econometrica 1945, 13, 245–259. [Google Scholar] [CrossRef]
  38. Kendall, M.G. Rank Correlation Methods; Griffin: London, UK, 1955; p. 160. [Google Scholar]
  39. Hamed, K.H.; Rao, A.R. A modified Mann-Kendall trend test for auto correlated data. J. Hydrol. 1998, 204, 182–196. [Google Scholar] [CrossRef]
  40. Yang, Y.; Tian, F. Abrupt change of runoff and its major driving factors in Haihe River Catchment, China. J. Hydrol. 2009, 74, 373–383. [Google Scholar] [CrossRef]
  41. Xing, L.; Huang, L.; Chi, G.; Yang, L.; Li, C.; Hou, X. A dynamic study of karst spring based on wavelet analysis and the Mann-Kendall trend test. Water 2018, 10, 698. [Google Scholar] [CrossRef]
  42. Guna, A.; Zhang, J.; Tong, S.; Bao, Y.; Han, A.; Li, K. Effect of climate change on maize yield in the growing season: A case study of the Songliao Palin maize belt. Water 2019, 11, 2108. [Google Scholar] [CrossRef]
  43. Turney, S. Pearson Correlation Coefficient (r)|Guide & Examples. Scribbr. 2024. Available online: https://www.scribbr.com/statistics/pearson-correlation-coefficient/ (accessed on 22 April 2024).
  44. Liang, Z.; Qiang, Z.; Jianying, F.; Zhihu, B.; Jianhua, Z.; Xiaohua, X. A study of atmospheric water cycle over the Qilian Mountains (I): Variation of annual water vapor transport. J. Glaciol. Geocryol. 2014, 36, 1079–1091. [Google Scholar]
  45. Ma, Z.; Yao, R.; Sun, P.; Zhuang, Z.; Ge, C.; Zou, Y.; Lv, Y. Quantitative evaluation of runoff simulation and its driving forces based on hydrological model and multisource precipitation fusion. Land 2023, 12, 636. [Google Scholar] [CrossRef]
  46. Yue, S.; Ji, G.; Huang, J.; Cheng, M.; Guo, Y.; Chen, W. Quantitative assessment of the contribution of climate and underlying surface change to multiscale runoff variation in the Jinsha river basin, China. Land 2023, 12, 1564. [Google Scholar] [CrossRef]
  47. Huang, H.; Pan, Y.; Wang, C.; Wang, X. Nonlinear flood responses to tide level and land cover changes in small watersheds. Land 2023, 12, 1743. [Google Scholar] [CrossRef]
  48. Engelhardt, M.; Ramanathan, A.L.; Eidhammer, T.; Kumar, P.; Landgren, O.; Mandal, A.; Rasmussen, R.O.Y. Modelling 60 years of glacier mass balance and runoff for Chhota Shigri Glacier, Western Himalaya, Northern India. J. Glaciol. 2017, 63, 618–628. [Google Scholar] [CrossRef]
  49. Liu, G.; Wang, G. Insight into runoff decline due to climate change in China ’s Water Tower. Water Supply 2012, 12, 352–361. [Google Scholar] [CrossRef]
  50. Zhou, J.; Li, Q.; Wang, L.; Lei, L.; Huang, M.; Xiang, J.; Feng, W.; Zhao, Y.; Xue, D.; Liu, C.; et al. Impact of climate change and land-use on the propagation from meteorological drought to hydrological drought in the Eastern Qilian Mountains. Water 2019, 11, 1602. [Google Scholar] [CrossRef]
  51. Gao, B.; Qin, Y.; Wang, Y.; Yang, D.; Zheng, Y. Modeling ecohydrological processes and spatial patterns in the upper Heihe basin in China. Forests 2016, 7, 10. [Google Scholar] [CrossRef]
  52. Qin, X.; Liu, W.; Mao, R.; Song, J.; Chen, Y.; Ma, C.; Li, M. Quantitative assessment of driving factors affecting human appropriation of Net Primary Production (HANPP) in the Qilian Mountains, China. Ecol. Indic. 2021, 121, 106997. [Google Scholar] [CrossRef]
  53. Zou, C.B.; Lambert, L.H.; Everett, J.; Will, R.E. Response of surface runoff and sediment to the conversion of a marginal grassland to a switchgrass (Panicum virgatum) bioenergy feedstock system. Land 2022, 11, 540. [Google Scholar] [CrossRef]
Figure 1. DEM of Pailugou Basin in the Qilian Mountains. Hydrography of the Heihe river, weather station and runoff monitoring points are also indicated [29].
Land 13 00583 g001
Figure 2. Linear trend line of runoff monthly variation in a 5-year time interval.
Land 13 00583 g002
Figure 3. Percentage of flood season runoff to annual river runoff in the Pailugou Basin (2000–2019). Blue dashed line is used for interpretation purposes.
Land 13 00583 g003
Figure 4. Annual runoff variation trend in the Pailugou Basin (2000–2019).
Land 13 00583 g004
Figure 5. Annual cumulative curve of runoff anomalies in the Pailugou Basin (2000–2019).
Land 13 00583 g005
Figure 6. Annual distribution of the uneven coefficient (Cu) and complete adjustment coefficient (Cr) of runoff for the Pailugou Basin (2000–2019).
Land 13 00583 g006
Figure 7. Annual changes in the calculated z-values of the non-parametric M-K test for the monotonic trend of annual runoff for the Pailugou Basin (2000–2009). The solid line represents annual changes in UF and dashed lines of UB (from M-K test). The horizontal band, determined by statistical z-values of 2 and −2, is also presented.
Land 13 00583 g007
Figure 8. Distribution of monthly average air temperature (°C) in the Pailugou Basin at six weather stations from 2000 to 2019.
Land 13 00583 g008
Figure 9. Annual changes in the calculated z-values of the non-parametric M-K test for the monotonic trend of air temperature for the Pailugou Basin (2000–2019). The solid line represents annual changes in UF and the dashed lines of UB (from M-K test). The horizontal band, determined by statistical z-values of 2 and −2, is also presented. These data came from the station located at 2570 m.
Land 13 00583 g009
Figure 10. Distribution of average monthly precipitation in the Pailugou Basin from the six weather stations from 2000 to 2019.
Land 13 00583 g010
Figure 11. (A) Distribution of annual precipitation in the Pailugou Basin (2000–2019). (B) Annual changes in the calculated z-values of the non-parametric M-K test for the monotonic trend of precipitation in the Pailugou Basin (2000–2019). The solid line represents annual changes in UF and the dashed lines of UB (from M-K test). The horizontal band, determined by statistical z-values of 2 and −2, is also presented. These data are from the station at 2570 m.
Land 13 00583 g011
Figure 12. Correlation between runoff and annual average temperature (a) and precipitation (b) in the Pailugou Basin (2000–2019).
Land 13 00583 g012
Figure 13. Interannual variation trends of runoff, temperature, and precipitation in the Pailugou Basin (2000–2019).
Land 13 00583 g013
Figure 14. Cumulative anomaly of annual runoff, annual average temperature, and annual precipitation in the Pailugou Basin (2000–2019).
Land 13 00583 g014
Figure 15. Cumulative anomaly of annual runoff and annual precipitation in spring/winter (A) and summer/autumn (C). Cumulative anomaly of annual runoff and annual average temperature in spring and winter (B) and summer and autumn (D) in the Pailugou Basin (2000–2019).
Land 13 00583 g015aLand 13 00583 g015b
Table 1. Basic statistical characteristic values of annual runoff series for the Pailugou Basin (2000 to 2019).
BasinLength of Runoff Series (Years)Mean Value
(105 m3)
Mean Squared Error ((105 m3)2)Coefficient of VariationSkewness
Pailugou202.6370.9440.3811.573
Table 2. Percentage (%) of seasonal runoff variation in total runoff variation (%).
Time (Years)SpringSummerAutumnWinter
2000–20046.4352.9239.041.61
2005–200913.9939.1734.2212.62
2011–201413.6059.3725.032.00
2015–20196.5760.0131.691.74
Mean Value10.15 52.87 32.49 4.49
Table 3. Distribution characteristic index values within the 3-year time interval for the Pailugou Basin (2000–2019).
PeriodConcentration RatioChange Amplitude
Concentration Degree Ci (%)Vector Direction (Degree, °)Relative Change Amplitude ck (%)Absolute Change Amplitude δr (%)
2000–200463.5223125.871.72
2005–200963.3423123.511.02
2011–201457.1622715.471.23
2015–201957.1522711.551.95
Mean Value60.2923119.601.48
Table 4. Values of the non-parametric M-K test for the monotonic trend of annual runoff in the Pailugou Basin for the whole period (2000–2019) and three time periods.
M-K Test for Monotonicity2000–20192000–20072007–20152015–2019
z1.741.031.44−0.64
Table 5. Pearson’s (r) correlation coefficients of seasonal runoff with precipitation and annual average temperature in the Pailugou Basin (ns: non-significant for 0.05 significance level).
RunoffContemporaneous PrecipitationAverage Temperature of the Same PeriodPrecedent PrecipitationPrecedent Average Temperature
Spring0.685 **−0.166−0.2240.033
Summer0.875 **−0.3320.599 **−0.236
Autumn0.714 **−0.0070.603 **0.012
Winter−0.112 ns−0.0850.192−0.063
** indicates that the 0.01 significance test was passed.
Disclaimer/Publisher’s Note: The statements, opinions and data contained in all publications are solely those of the individual author(s) and contributor(s) and not of MDPI and/or the editor(s). MDPI and/or the editor(s) disclaim responsibility for any injury to people or property resulting from any ideas, methods, instructions or products referred to in the content.