Article

A Calculation and Optimization Method for the Theoretical Reclamation Timing of Cropland

School of Environment and Spatial Informatics, China University of Mining and Technology, Xuzhou 221116, China
*
Author to whom correspondence should be addressed.
Land 2024, 13(5), 638; https://doi.org/10.3390/land13050638
Submission received: 28 February 2024 / Revised: 30 April 2024 / Accepted: 6 May 2024 / Published: 8 May 2024

Abstract

:
In mining areas with high groundwater tables, mining subsidence can lead to the inundation of cropland by water, causing damage to cropland and posing a threat to national food security. The implementation of concurrent mining and reclamation techniques can effectively enhance the reclamation rate of cropland. This technique requires engineers to initiate reclamation measures before cropland waterlogging occurs. Therefore, when mining a panel underground, an accurate calculation of the time when cropland becomes waterlogged, known as the theoretical reclamation timing, is crucial. To address this issue, this study proposes a computational method for the theoretical reclamation timing of cropland under the conditions of single-panel mining based on intelligent optimization algorithms. In addition, this paper also proposes an optimization method for the theoretical reclamation timing of cropland within a district based on an intelligent optimization algorithm. Utilizing this method makes optimizing the layout of multiple panels possible, thereby delaying the theoretical reclamation timing for cropland within a district. This approach aims to shorten the duration of reclamation projects and minimize their interference with agricultural activities. Through experimental validation, this paper demonstrates the reliability of these two methods. This study is beneficial for the rational planning of reclamation projects.

1. Introduction

China exhibits a considerable demand for coal [1,2]. In 2022, coal consumption constituted 56.2% of China’s total energy consumption [3]. Given its massive population, China also presents a substantial need for grain. The significance of cropland in ensuring food security cannot be overstated. Significant spatial overlap is observed between the coal mining and grain production bases in eastern China. This overlapping area is commonly called the coal–grain overlapping area [4,5]. However, underground mining can cause damage to the mining area environment, including the destruction of buildings and structures [6], reduction of agricultural output [7], soil contamination [8], surface ponding and pollution of surface waters [9,10], vegetation damage [11,12], and alteration of landscapes [13]. In coal–grain overlapping areas, mining subsidence destroys cultivated soil’s physical and chemical environments, ultimately reducing the grain yield [7,14,15,16,17]. In addition, mining subsidence-induced cropland ponding has flooded significant tracts of farmland, leading to irreversible damage [18,19,20,21,22].
In China, reclamation measures are typically implemented for damaged cropland in mining areas. The technique of deep digging and shallow filling is a commonly used method for cropland reclamation [23]. This technique involves digging the future deep subsidence area in advance to salvage more topsoil. The salvaged topsoil then fills the shallow subsidence area to restore more cropland. The digging areas will retain waterlogged areas, which can be transformed into vast fish ponds, thereby increasing the land’s value for utilization [18,24]. In addition, the creation of waterlogged areas can also positively affect the biodiversity of the landscape [25]. The traditional reclamation approach applies reclamation techniques to cropland where subsidence has already ceased. At this point, the cropland has already been severely damaged, making it difficult to protect the cropland, resulting in a low reclamation ratio [1,2,26]. To address the aforementioned concerns, Hu et al. proposed a concurrent mining and reclamation technology (CMR) [26]. This technology advocates using mining subsidence control technology to excavate coal resources underground and implement reclamation measures on the surface before or during mining [4,26]. Relevant studies have shown that this technology can improve the land reclamation rate [4,18,27,28,29]. This technique requires engineers to implement reclamation measures before cropland waterlogging occurs to salvage more soil. If the reclamation timing is set too early, the premature disturbance of cropland may ensue, adversely impacting farmers’ cultivation practices despite the potential for topsoil preservation. On the contrary, if the reclamation timing is delayed, farmland may be submerged in water, reducing the reclamation rate. The reclamation timing of cropland is subject to influence by a myriad of factors, including but not limited to geological and mining conditions as well as human-driven factors. The ideal reclamation timing for cropland is when the cropland reaches the critical ponding state. At this time, more topsoil can be protected to restore more cropland. Furthermore, conducting reclamation during this period also helps to minimize the disruption to agricultural activities. This ideal reclamation timing is defined as the theoretical reclamation timing (TRT) [4]. Thus, the precise computation of TRT for cropland is pivotal to the efficacious application of CMR technology in mining areas.
The hot research topics surrounding the “study of TRT for cropland” can be divided into two categories: (1) how to calculate the TRT for cropland when only a single longwall panel is mined [4,30,31,32,33] and (2) how to optimize the layout of panels within the entire district to optimize the reclamation timing for cropland. For mining areas with high groundwater tables, cropland is already submerged in water after mining a single, wide, longwall panel. Therefore, reclamation of the cropland is required during the mining of a single panel. There are multiple panels in a district. Consequently, the reclamation period for the entire district is longer, which affects farmers’ agricultural activities. Planning the layout of multiple panels within a district can effectively reduce the reclamation period for cropland. Hu et al. have proposed a “skip-mining” technique [23]. This technique commonly involves reducing the width of multiple panels and altering their extraction sequence to control cropland subsidence. Controlling cropland subsidence can delay the timing of cropland waterlogging, thereby postponing the overall reclamation timing for cropland within the entire district [23,27]. The detailed principles of the skip-mining technique will be described in Section 2.2. The objective of using the skip-mining technique is to delay the reclamation timing for cropland and shorten the overall reclamation period within a district. By reducing the duration of the reclamation period, the impact of reclamation projects on agricultural activities can be minimized. Optimizing the layout of panels within a district implies optimizing the TRT for cropland within this district as well. The optimization of the TRT for cropland within a district has emerged as a recent research focus [23].
However, calculating and optimizing the TRT is a deeply nonlinear problem with constraints. Currently, there is a lack of analytical expressions for solving the TRT. To address the two aforementioned issues, this study introduced, for the first time, the utilization of intelligent optimization algorithms to calculate and optimize the TRT for cropland. The method proposed in this study also applies to land reclamation projects in other coal-producing countries worldwide, such as Australia, the Czech Republic, and Poland. This study aims to establish a scientific foundation that could facilitate the effective implementation of CMR technology.

2. Calculation and Optimization Method for TRT

As shown in Figure 1, crop growth begins to be affected when the subsidence basin is at a certain height above the groundwater table, and the cropland is in a critical ponding state at this stage.
The ideal reclamation timing for cropland is when the cropland reaches the critical ponding state. At this time, more topsoil can be protected to restore more cropland. This ideal reclamation timing is defined as the theoretical reclamation timing (TRT). In other words, the moment the cropland subsidence Wmax meets the following condition (Equation (1)) is deemed as the TRT for the cropland:
W m a x = H w a t e r h b
where Hwater indicates the buried depth of the groundwater before cropland subsidence occurs; hb indicates the minimum soil thickness required for crop root growth.
This paper aims to address two issues: (1) how to determine the TRT for cropland when only a single panel is mined underground and (2) how to optimize the layout of panels within the entire district to optimize the reclamation timing for cropland. Optimizing the reclamation timing for cropland is beneficial for reducing the reclamation period within the entire district and minimizing the impact of reclamation projects on agricultural activities.

2.1. Calculation Methodology for TRT under Single-Panel Mining Conditions

As shown in Figure 1, within the context of single-panel mining, the cropland reaches a critical ponding state when the panel advances to a certain distance. This distance (μ) is called the starting distance of critical cropland ponding (SD). The moment when a panel advances to the SD is the TRT of the cropland under the condition of single-panel mining. Indeed, determining the SD is equivalent to determining the TRT.
The maximum subsidence of cropland, denoted as Wmax(μ), can be calculated by using a specific mining subsidence prediction equation with the advancement distance of the panel μ as an independent variable. When Wmax(μ) = Hwaterhb, μ is the SD. Wmax(μ) is a dynamic mining subsidence prediction equation. Taking the probability integration method based on the Knothe time function as an example, this equation is a transcendental equation that involves the Gaussian error function [34]. Due to the extremely nonlinear and complex nature of the Wmax(μ) equation, no analytical expression is available for accurately calculating the SD. The problem of calculating the SD can be considered a nonlinear engineering optimization problem with constraints. Intelligent optimization algorithms possess robust capabilities for inverting and resolving nonlinear model parameters. This section will propose a calculation method for the SD under the condition of single-panel mining based on intelligent optimization algorithms. The basic principle and calculation process of this method are as follows:

2.1.1. Fundamental Mathematical Model

The basic principle of using intelligent optimization algorithms to solve for the SD of a panel was as follows:
Initially, the computer program generated several random initial solutions, denoted as μ1, μ2, μ3μi. The program checked if these solutions satisfy the constraint condition Wmax(μi) ≤ Hwaterhb. The solutions that did not meet the constraint condition were eliminated during the algorithm’s iteration process. The solutions that satisfied the constraint condition underwent specific processing. The objective of the search was to find the maximum value of μi within the range [Llower, Lupper] that satisfied the constraint condition. This maximum value represents the SD. This method typically requires multiple iterations to achieve the desired result. The process of solving the SD is essentially solving equations.
To sum up, the fundamental mathematical model of the SD calculation method, which is based on an intelligent optimization algorithm, can be expressed as follows:
max μ i W m a x μ i H w a t e r h b   μ i L l o w e r , L u p p e r
where μi represents the advancing distance of the panel, [Llower, Lupper] denotes the search range of the SD, and Wmax(μi) ≤ Hwaterhb serves as a constraint in the calculation.
From Equation (2), the fundamental principle of the SD calculation method based on intelligent optimization algorithms is to use specific intelligent optimization algorithms to search for the maximum advancing distance of the panel that satisfies the constraint conditions. There are various types of intelligent optimization algorithms [35], which can be classified into swarm intelligence optimization algorithms, evolutionary algorithms, and so on, based on their principles. Readers can select the relevant intelligent optimization algorithm to calculate the SD as per their requirements. This section calculated the SD using the classic particle swarm optimization (PSO) algorithm. The PSO algorithm is an evolutionary algorithm that simulates the foraging behavior of birds. The foraging behavior of birds shares similarities with the process of finding the optimal solution to a specific problem. Consequently, this algorithm is frequently employed to address optimization problems. The PSO algorithm has few control parameters, is easy to implement, and runs quickly. For a detailed explanation of the PSO algorithm, refer to Reference [36].

2.1.2. Computational Process of the SD Based on the PSO Algorithm

The steps for solving the SD based on the PSO algorithm were as follows:
Step 1. Initialization of the algorithm’s parameters:
This step involves the initialization of the number of particles N, the maximum number of iterations G, inertia factor ω, particles’ velocities vi, and positions μi, learning factors c1 and c2, and constraint factor rp. The aforementioned parameters are fixed parameters in the PSO algorithm. Before starting the iterative computation of the algorithm, it is necessary to initialize these parameters.
First, the search range for the SD was determined, denoted as [Llower, Lupper]. Within this search range, N particles, denoted as μ1, μ2, μ3, μiμn, were randomly generated using a computer program. According to the definition of the PSO algorithm, μi represents the position of a particle and serves as the initial solution for SD. Secondly, each particle needed to be assigned an initial velocity. The velocity of each particle was randomly generated by the computer. Based on experience, the velocity range for each particle was [−(LupperLlower) × 0.1, (LupperLlower) × 0.1]. The maximum absolute value of the particle’s velocity, Vmax, was equal to (LupperLlower) × 0.1.
Step 2. Calculation of the fitness value:
According to the definition of the PSO algorithm, the fitness value f(μi) of a particle is the criterion used to evaluate whether it represents the optimal solution. First, assessing whether each particle satisfies the constraint conditions is necessary. The algorithm’s constraint condition is Wmax(μi) ≤ Hwaterhb. Wmax(μi) represents the maximum subsidence value of cropland when the panel advances to a certain length μi. The Wmax(μi) can be obtained by calculating it using a dynamic prediction equation for mining subsidence. There are many such equations, and readers can choose a dynamic prediction equation for mining subsidence that suits the research area. This section used the probability integration method based on the Knothe time function to calculate the Wmax(μi). This calculation method has been widely used in China. The basic principles of this method have been detailed in the literature [34]. Due to space limitations, this paper did not provide a detailed explanation of the calculation method for Wmax(μi).
For any arbitrary particle μi, its fitness value f was given by:
f μ i = μ i ,   W m a x μ i H w a t e r h b 0 ,   W m a x μ i > H w a t e r h b
From Equation (3), the fitness value of particles not satisfying the constraint condition was set to zero for easy elimination. This is because these particles cannot become the optimal solution for the SD. If a particle satisfied the constraint conditions, its fitness value was set as μi (which is also the position of the particle). A larger value of μi indicates that the particle is closer to the optimal solution for the SD.
Step 3. Comparison of the fitness value of each particle with its local best fitness value: The local best fitness value refers to the best fitness value achieved by this particle in history. If the fitness value of the particle was greater than its local best fitness value, its fitness value was set as this particle’s local best fitness. The position of the particle corresponding to the local best fitness value can be represented as pl.
Step 4. Comparison of the fitness value of each particle with the global best fitness value, which represents the maximum fitness value attained by the entire particle swarm: If the fitness value of a particle was greater than the global best fitness value, the particle’s current fitness value was set as the global best fitness value of the particle swarm. The position of the particle corresponding to the global optimal fitness value can be represented as pg.
Step 5. The velocity vi and position μi of each particle should be updated using Equation (4):
v i = ω v i + c 1 r 1 p l μ i + c 2 r 2 p g μ i μ i = μ i + r p v i
where r1 and r2 are two random numbers with a range of [0, 1].
Step 6. As shown in Equation (5), the updated particle velocity and position must be constrained within the ranges of [−Vmax, Vmax] and [Llower, Lupper], respectively. The value of Vmax was usually set to 0.1 × (LupperLlower).
μ i = L l o w e r μ i < L l o w e r μ i = L u p p e r μ i > L u p p e r v i = v max v i < v max v i = v max v i > v max
Step 7. If the maximum number, G, of iterations was reached, the algorithm was terminated. Then, the position of the particle corresponding to the global best fitness was outputted. This particle’s position represents the optimal solution for the SD. Otherwise, Step 2 is repeated, and from there, the process continues.
By following the above steps, relevant computer programs can be developed to calculate the SD. The flowchart for the program design is shown in Figure 2.
The moment when the advancing distance of the longwall panel reaches the SD is considered the TRT for cropland.
The aforementioned content described a computational method for the TRT of cropland under the conditions of single-panel mining based on the intelligent optimization algorithm.

2.2. Optimization of the TRT of Cropland within a Certain District

In mining areas with high groundwater levels, cropland ponding can be induced when excavating the first panel. Therefore, when a single panel is extracted, the cropland must be reclaimed. A district typically comprises multiple longwall panels. Therefore, the reclamation timing of cropland in the entire district is generally longer. However, a longer reclamation timing affects farmers’ cultivation. To tackle this problem, some studies have suggested optimizing the dimensions of multiple panels in a district and formulating a continuation plan for panel excavation to postpone the reclamation timing by delaying surface ponding [4,23,27]. This measure is conducive to shortening the cycle of land reclamation projects and reducing their impact on farmers’ farming activities. Hu et al. adopted the skip-mining method to postpone the reclamation timing (see Figure 3) [4]. This technique segregates the mining duration of a district into two phases, namely skip mining and back mining. The panels mined during the skip-mining and back-mining periods are, respectively, defined as the skip-panel and back-panel. Firstly, the skip-panel is excavated, followed by the back-panel. The sequential excavation was conducted on panel Nos. 1, 3, 5, and 7 during the skip-mining period, while panel Nos. 2, 4, and 6 were excavated sequentially during the back-mining period (see Figure 3). During the skip-mining period, the surface subsidence was controlled within the critical subsidence value by optimizing the mining width. As a result, the cropland ponding was postponed to the back-mining period, thereby postponing the reclamation timing, which is beneficial for mitigating the impact of land reclamation on farmers’ agricultural operations. The purpose of using this mining technique is to optimize the TRT of cropland within a certain district.
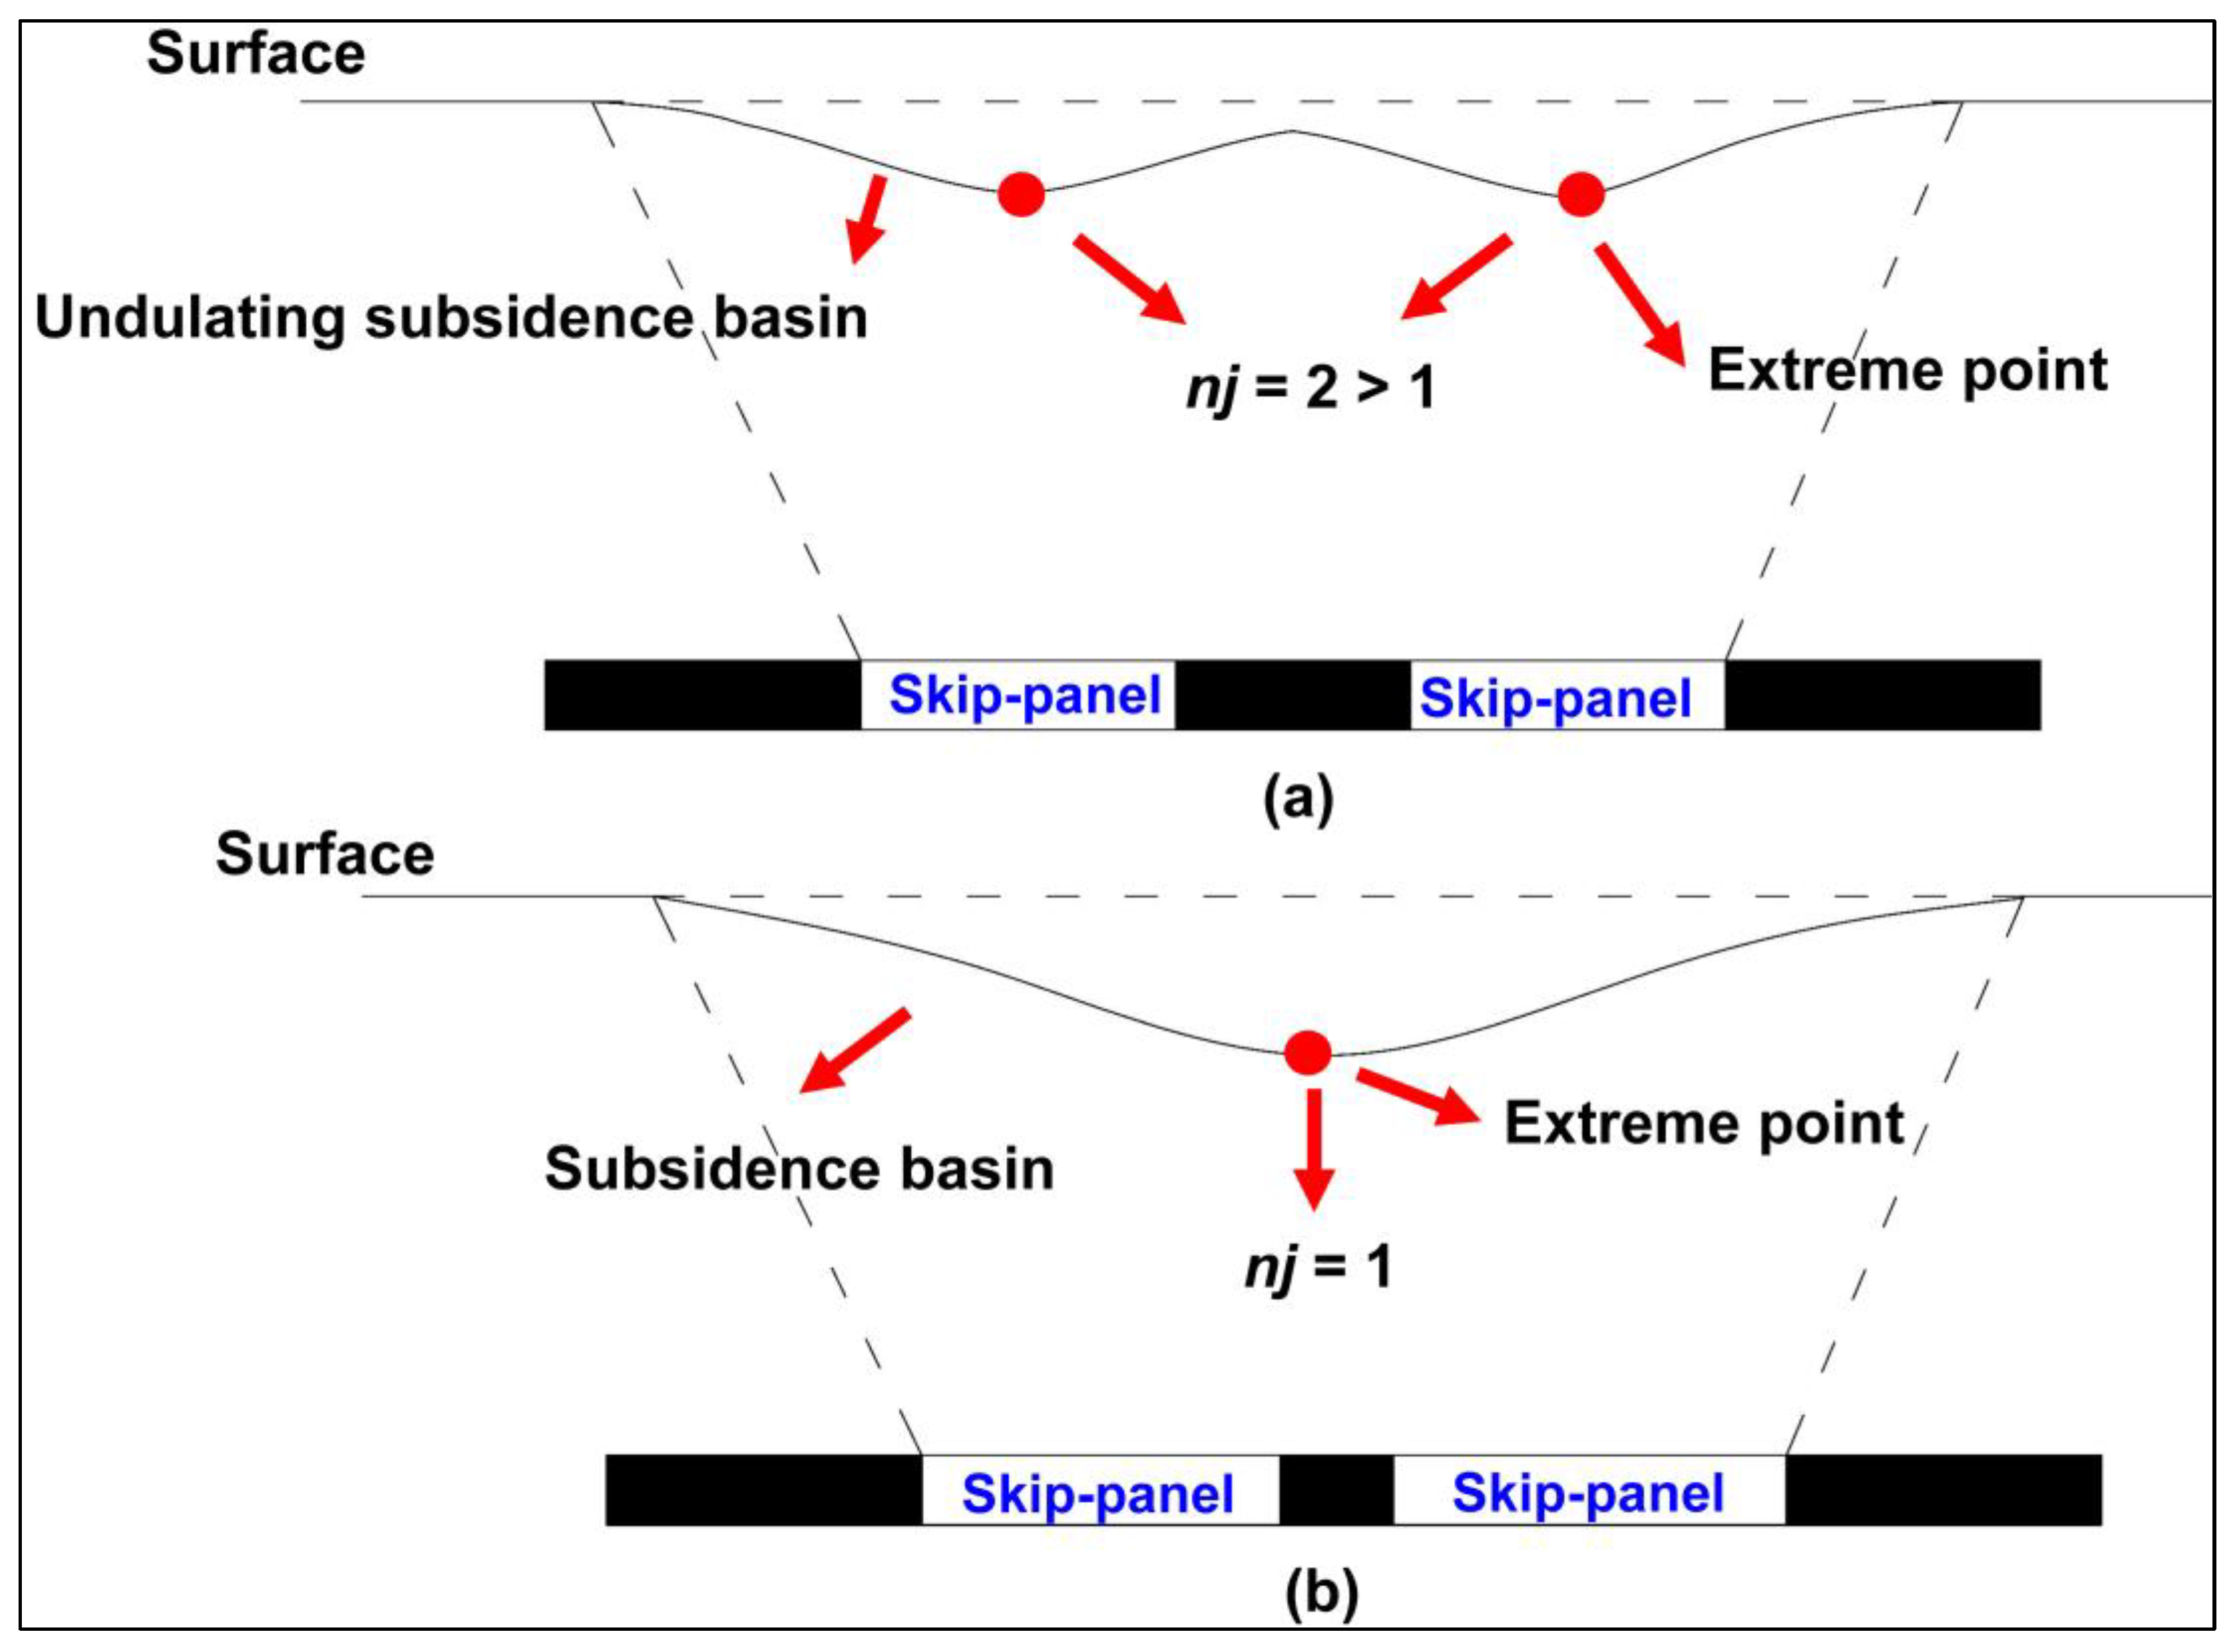
The key to successfully implementing the skip-mining method is to design skip-panel and coal pillar widths between adjacent skip-panels (back-panel widths). If the width of the skip-panel is large or the coal pillar widths between adjacent skip-panels are small, significant surface subsidence values will still occur, leading to surface ponding. On the other hand, if the coal pillar width is overly large, pronounced undulating subsidence may occur in the cropland, thus adversely affecting agricultural operations (see Figure 4a).
Considering that the design of the panel width is a nonlinear engineering optimization problem, this section proposed an intelligent optimization algorithm-based design method for skip-panel/back-panel widths.

2.2.1. Basic Principles

As shown in Figure 3, b represents the width of the skip-panel, while a denotes the spacing width between two adjacent skip-panels (the width of the back-panel is a). The optimal design values for a and b must possess the following characteristics:
(1) Search range:
The design values for a and b should not exceed the range restricted by the coal mining technology. For example, the maximum value for the panel width is typically not more than 400 m. This range can be shown as [Dlower, Dupper]. The design values for a and b must fall within this range.
(2) Constraint conditions:
After mining according to the designed panel width, ensuring that the cropland is not in a critical ponding state is vital after completing the skip-mining phase. This condition imposes a constraint on the subsidence of the cropland. The constraint for cropland subsidence during the skip-mining phase can be expressed as Wmax(a,b) ≤ Hwaterhb (see Figure 3).
Another constraint is preventing the occurrence of undulating subsidence basins in cropland after the completion of excavation for each skip-panel, which is imperative to avoid disrupting agricultural activities.
As shown in Figure 4a, the undulating subsidence basin refers to the bottom of the surface subsidence basin exhibiting an obvious undulating waveform. The number of extreme points nj in an undulating subsidence basin is greater than one. Preventing the occurrence of undulating subsidence basins in cropland after the completion of excavation for each skip-panel is imperative to avoid disrupting agricultural activities. Thus, another constraint on this method can also be expressed as nj = 1 (as shown in Figure 4b). However, not all undulating subsidence basins will affect agricultural activities. Only when the height difference between the wave crest and trough exceeds a certain threshold can the surface subsidence basin be considered an undulating subsidence basin. In this study, the threshold was set to 10 mm. Suppose the surface subsidence basin still exhibits an undulating waveform during the skip-mining phase, but the height difference between the wave crest and trough is less than 10 mm. In this case, the number of extreme points nj in the surface subsidence basin is still considered to be one.
(3) Objective function:
If the width of the skip-panel is overly small, the duration of the skip mining will be longer, which can negatively impact the efficiency of underground mining. The design aims to maximize the width of the skip-panel. The mathematical expression for this condition was max b. This condition represents the optimization objective for this design optimization.
The mathematical principle of the design method for the width of the skip-panel and back-panel based on an intelligent optimization algorithm can be expressed by Equation (6).
max b g i W m a x a , b H w a t e r h b n j = 1 a , b D l o w e r , D u p p e r
In Equation (6), max b indicates the objective function; gi represents the constraints. nj represents the number of extreme points in the surface subsidence basin.
From Equation (6), the general process for designing the width of the skip-panel and the back-panel based on intelligent optimization algorithms is as follows:
Firstly, the computer randomly generates several initial solutions, represented as [ai, bi]. The first component of each solution represents the width of the back-panel, while the second component represents the width of the skip-panel. Both components must take values within the range [Dlower, Dupper]. Then, each set of solutions is assessed to determine if it satisfies the two constraint conditions simultaneously. The fitness value of the solutions that meet the constraints is set to bi. The solutions that do not satisfy the constraints simultaneously are assigned a fitness value of 0 to eliminate them. Subsequently, a specific method is used to update the initial solutions. The updating methods vary depending on the different intelligent optimization algorithms. The solutions are then re-evaluated for compliance with the constraint conditions. At this stage, engineers are required to carry out several iterations of the calculation. The optimal design result is output when the termination condition for the iterative calculation is met. In summary, the basic principle of the design method for skip-panel/back-panel width based on intelligent optimization algorithms is to use specific intelligent optimization algorithms to design the widths of the skip-panel and back-panel to meet the given constraints.
There are many types of intelligent optimization algorithms, and readers can choose any specific algorithm to design panel widths [35]. This section presented an instance of using the chicken swarm optimization (CSO) algorithm to design panel widths. The CSO algorithm was proposed by Meng in 2014 [37]. This algorithm simulates the hierarchical mechanism and competitive behavior observed in a flock of chickens during foraging. The foraging behavior of the chickens is analogous to the process of finding optimal solutions to engineering problems. As a result, this algorithm is commonly employed to solve various engineering optimization problems.

2.2.2. Design Process of Skip-Panel and Back-Panel Widths Based on the CSO Algorithm

The basic flow of designing the panel widths for the skip-panel and back-panel based on the CSO algorithm can be outlined as follows:
Step 1. Initializing the parameters of the algorithm:
To begin, a group of chickens with a population size of “pop” is randomly generated. The variable “pop” represents the total number of chickens in a population. A flock consists of roosters, hens, and chicks. The number of roosters, hens, chicks, and mother hens with offspring in the chicken swarm are denoted as NR, NH, NC, and NM, respectively. The maximum number of iterations of the algorithm is set to GT.
The position of each chicken is represented as [ai, bi]. The first component of the position represents the width of the back-panel, while the second component represents the width of the skip-panel. Then, their respective fitness values are calculated based on the given criteria. The fitness of each chicken was computed as follows:
First, it was necessary to determine whether each chicken satisfied the constraint condition. The first constraint condition of the algorithm is Wmax(a, b) ≤ Hwaterhb, where Wmax(a, b) refers to the maximum subsidence value in the reclamation area after completing the skip-mining phase. Usually, the subsidence value of each point in the reclamation area is calculated using the mining subsidence prediction equation, and the maximum subsidence value is then determined by aggregating these values. Various equations are available for mining subsidence prediction, and readers may choose the one that suits their study area. In this paper, the subsidence value of cropland was calculated using the probability integration method. The calculation formula for the probability integration method can be found in Reference [38].
The subsidence factor, q0, is a parameter in the probability integration method. The subsidence factor q0 corresponding to different panel dimensions is not the same. We can assume that the width of a skip-panel is b, and its length is L. The calculation method for q0 can be found in Equation (7) [30]:
q 0 = 0.97 n 2 0.07 n + 0.39 q ,   0.1 < n 0.83   q ,   n > 0.83
n = n 1 n 2
n 1 = b / 2 r ,   n 1 < 1 1 ,   n 1 1 n 2 = L / 2 r ,   n 2 < 1 1 ,   n 2 1
where r represents the main influence radius. r = H/tanβ. H represents the mining depth of the panel m. The tangent of the main influence angle, tanβ, is a fixed parameter in the probability integration method. q represents the subsidence factor under the condition of critical mining.
The second constraint condition of the algorithm aims to avoid the occurrence of conspicuous undulating subsidence patterns at the bottom of the surface subsidence basin after the completion of excavation on each skip-panel (see Figure 4a). This is achieved by requiring that the number of extreme points, nj, in the subsidence basin equal 1 (see Figure 4b). It is generally sufficient to compute the number of extreme points, nj, on the subsidence curve of the major section of the subsidence basin to facilitate the programmatic determination of whether the subsidence basin exhibits undulating subsidence patterns.
The fitness value of chickens that do not satisfy the constraints should be set to 0, leading to their gradual elimination during evolution. In the previous section, we introduced the objective function of this design method as max bi. Under the premise of satisfying the constraints, a larger skip-panel width corresponds closer to the optimal design value. Therefore, if the position of each chicken satisfies the constraints, its fitness value is bi.
Step 2. Updating the relationships between the chickens in the flock every G generation:
Based on the descending order of fitness values, each chicken was assigned as a rooster, hen, or chick. The chicken population was divided into several subgroups. Each subgroup consists of one rooster, several hens, and chicks. Once the hierarchy system of the chicken population is established, it remains unchanged until every Gth generation, when it is updated.
Step 3. Updating the position of the roosters using the following formula:
We can suppose that the position of the i-th rooster at iteration tg is xi,t(tg); the updated formula for the rooster’s position is as follows:
x i , t t g + 1 = x i , t t g · 1 + r a n d n 0 , σ 2 σ 2 =   1 ,   f i f k e x p f k f i f i + ϵ ,   f i > f k
where randn (0, σ2) represents a random number that follows a normal distribution, with an expectation of 0 and a variance of σ2. fi and fk represent the fitness values of the i-th rooster and k-th randomly selected rooster from the rooster group, respectively, where ki. ε denotes a tiny value close to zero to avoid having a denominator of 0.
Step 4. Updating the position of the hens using the following formula:
The updated formula for the hen’s position is as follows:
x i , t t g + 1 = x i , t t g + S 1 · rand · x r r 1 , t t g x i , t t g +   S 2 · rand · x r r 2 , t t g x i , t t g   S 1 = exp f i f r r 1 f i + ϵ   S 2 = exp f r r 2 f i
where rr1 represents the rooster within the same sub-flock as the i-th hen. rr2 indicates any other rooster or hen in the flock, excluding the i-th hen and the rooster rr1 from the same sub-flock as the i-th hen.
Step 5. Updating the position of the chicks using the following formula:
x i , t t g + 1 = x i , t t g + F L · x m c , t t g x i , t t g
where mc indicates the hen corresponding to the i-th chick. FL is a random number in the interval [0, 2].
After each update, each component of the new position must be restricted within the range [Dlower, Dupper].
Step 6. Calculating the fitness values corresponding to the updated positions: If the updated fitness value was greater than the current best fitness value, then the position and fitness value of the individual needed to be replaced. Otherwise, there was no need to replace the position of the individual.
Step 7. Searching for the global maximum fitness value and its corresponding spatial position:
If the current iteration number was greater than the maximum iteration number GT, the global best fitness value and its corresponding position were outputted. This position represents the optimal design value for the working width. Otherwise, Steps 2 to 7 are repeated.
Based on the aforementioned process, a relevant computer program can be developed to design the widths of the skip-panel and back-panel. The process of optimizing the design of panel width based on the CSO algorithm is shown in Figure 5.
Theoretically, if the panel is excavated according to the width of the panel designed by this method, the cropland will not be ponding during the skip-mining period. As a result, the TRT for cropland can be postponed to the back-mining stage, which shortens the cycle of cropland reclamation projects and reduces their impact on farmers.
The aforementioned content described an optimization method for the TRT of cropland within a certain district.

3. Method Validation

3.1. Calculation Result of TRT for Cropland with Single Panel Simulated Mining in the Nantun Mining Area

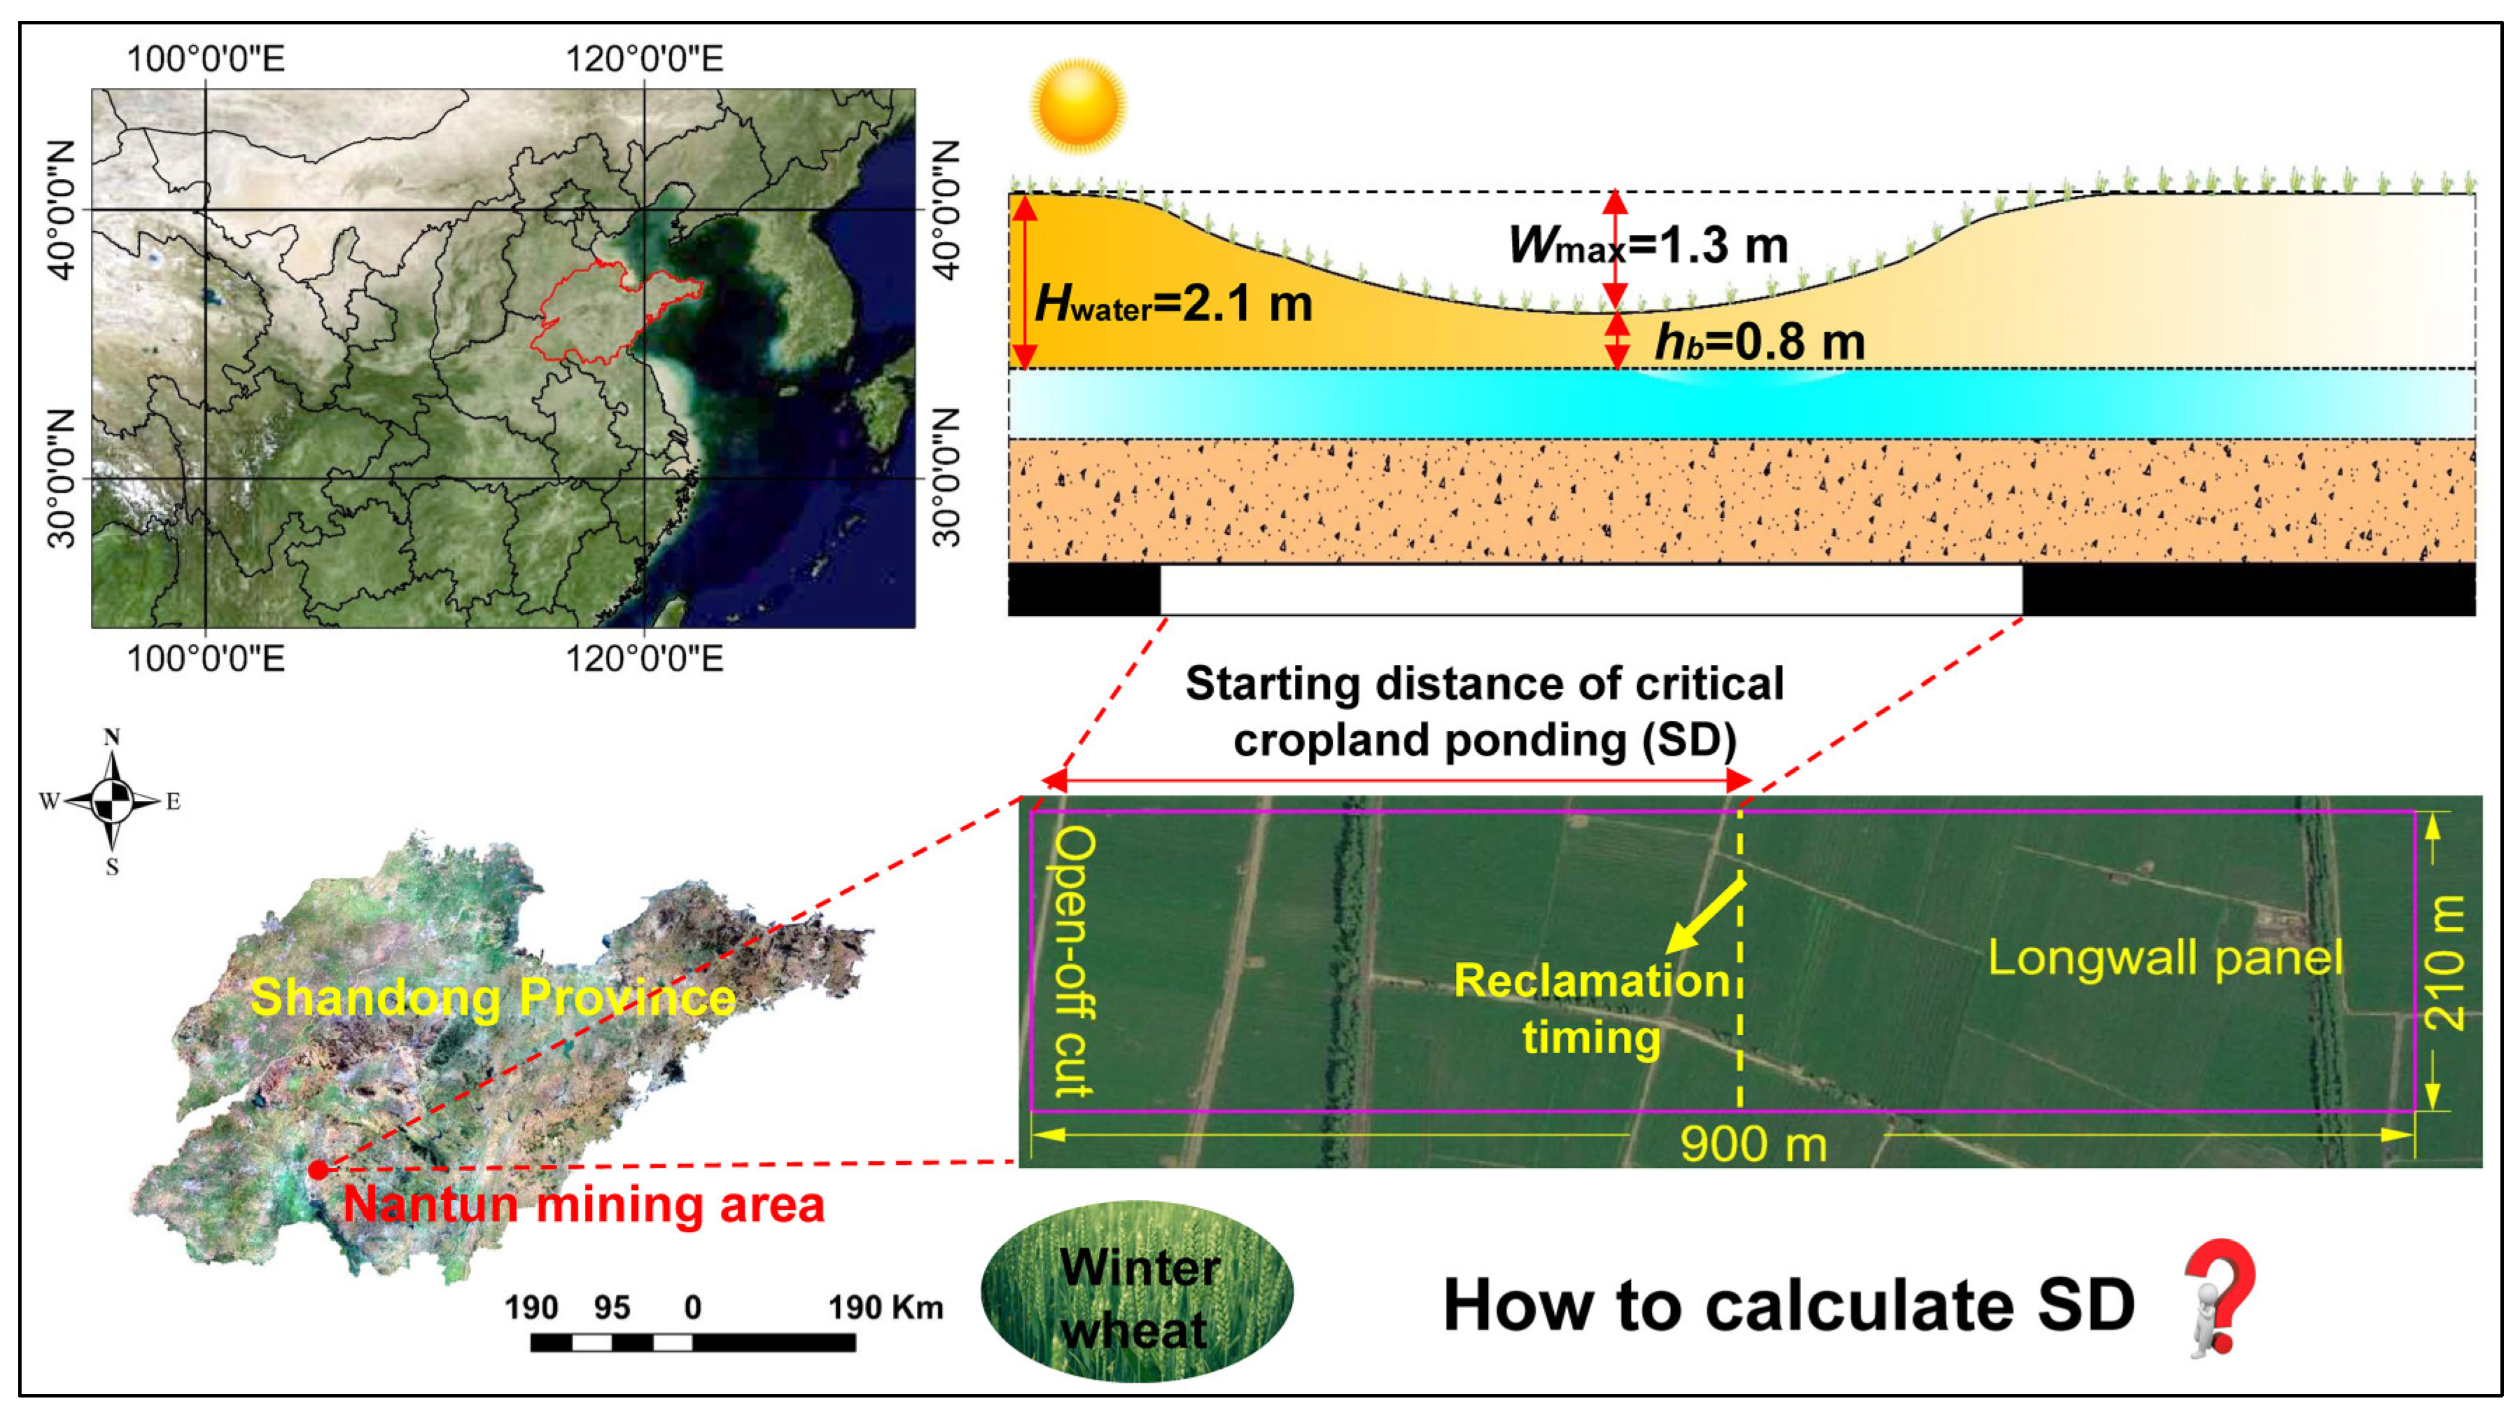
Taking the geological and mining conditions of the Nantun mining area in Shandong Province, China, as an example, we simulated the extraction of a longwall panel (see Figure 6). The area above the panel is cropland. The geological and mining conditions of this panel are listed in Table 1.
When the cropland reached a critical ponding state, the subsidence was 1300 mm (Hwater − hb = 1300 mm). Thus, the critical subsidence of the cropland was 1300 mm. Cropland subsidence reaches this critical value when this panel advances to a specific distance. At this point, reclamation is required for the cropland. Calculating this distance also implies calculating the TRT of the cropland. This section will use the method provided in Section 2.1 to calculate the TRT. A computation program was developed using Matlab (R2021a) software for this purpose.
In Step 2 of Section 2.1.2, the probability integration method based on the Knothe time function was used to calculate the dynamic maximum subsidence value Wmax(μi) of cropland. The values of the parameters in this equation, including the subsidence factor q0, tangent of main influence angle tanβ, deviation of inflection point S, influence transference angle θ0, and time influence coefficient c, are listed in Table 2. In addition, the relevant parameters for the PSO algorithm are listed in Table 2.
Based on the computed results, the change curve of the fitness value is shown in Figure 7.
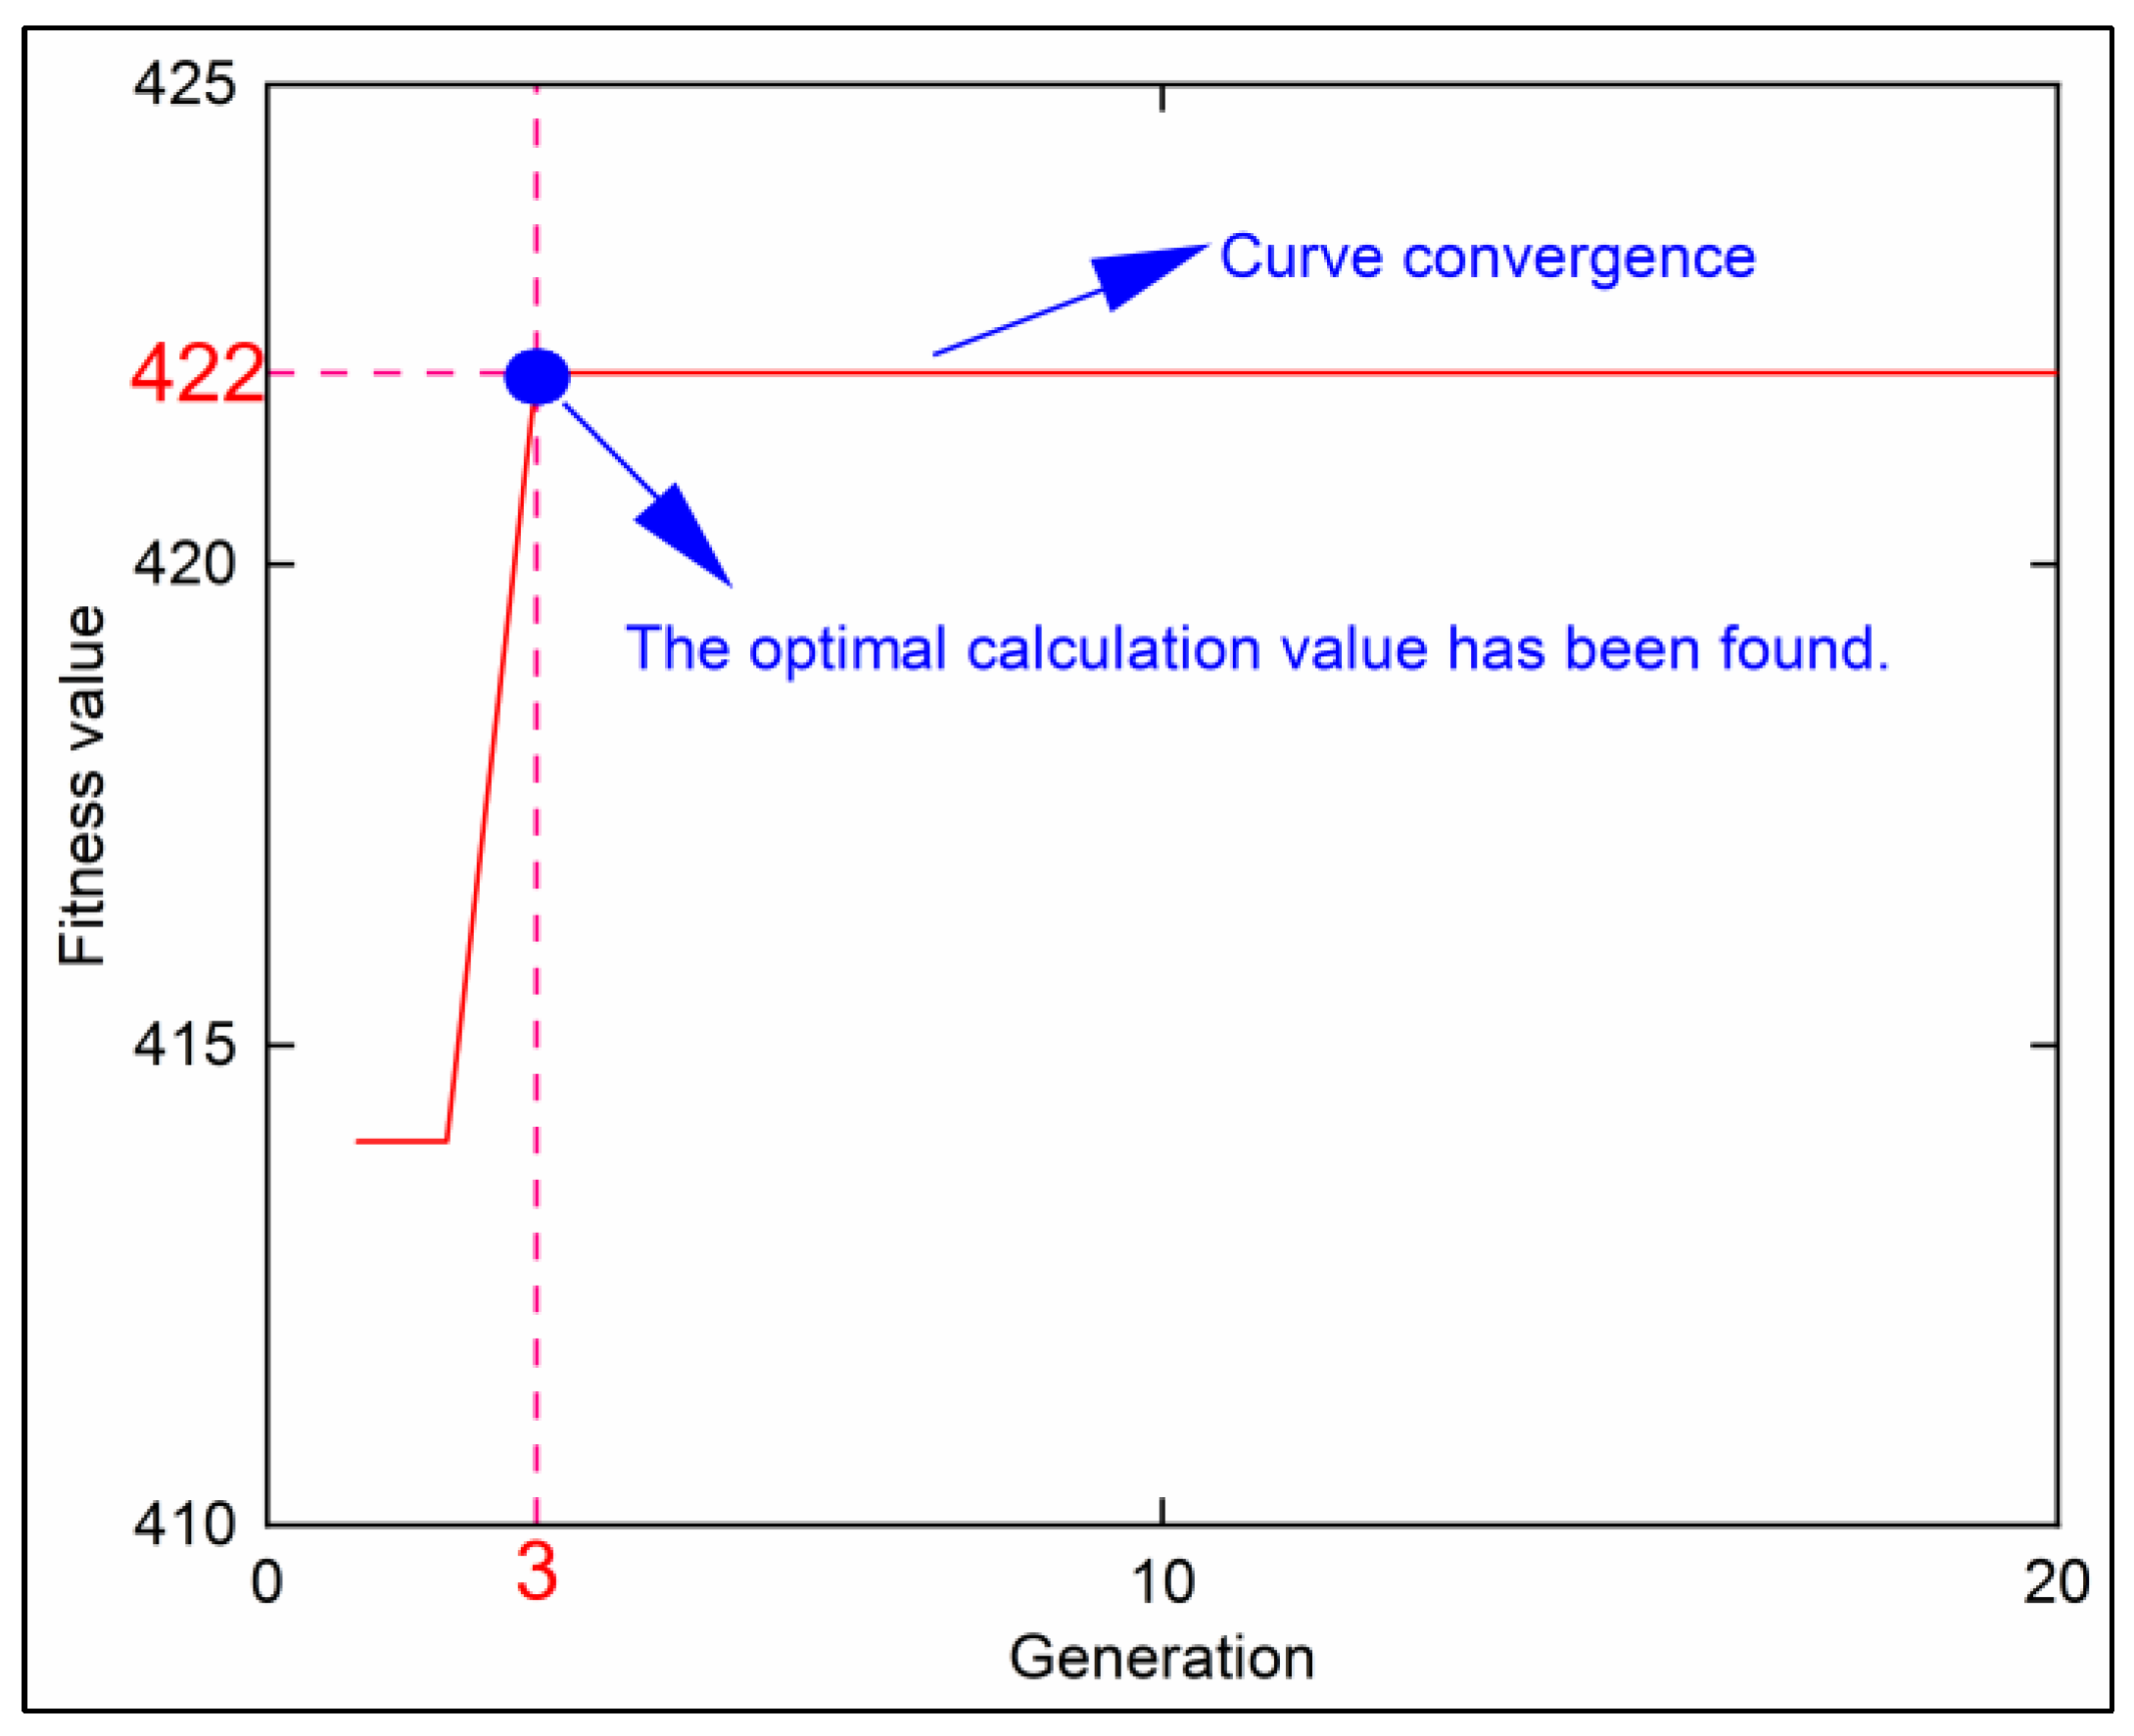
As shown in Figure 7, the curve converged when the algorithm was iterated to the third generation, which means that when the number of iterations was three, the algorithm found the optimal calculation result. Based on the algorithm output, the SD was 422 m; at this point, the maximum cropland subsidence was 1300 mm, which had not yet exceeded its critical subsidence threshold. To validate the accuracy of the computed results, this study calculated the maximum dynamic subsidence of the cropland when the panel advanced by 423 m. The obtained value was 1303 mm, surpassing the critical subsidence threshold. This indicated that 422 m was the optimum solution for SD. This indicated that the method proposed in this paper accurately calculated the SD. When the panel advanced to a distance of 422 m, it was the theoretical reclamation timing for cropland.

3.2. Optimization of the TRT of Cropland within a District in Nantun Mining Area

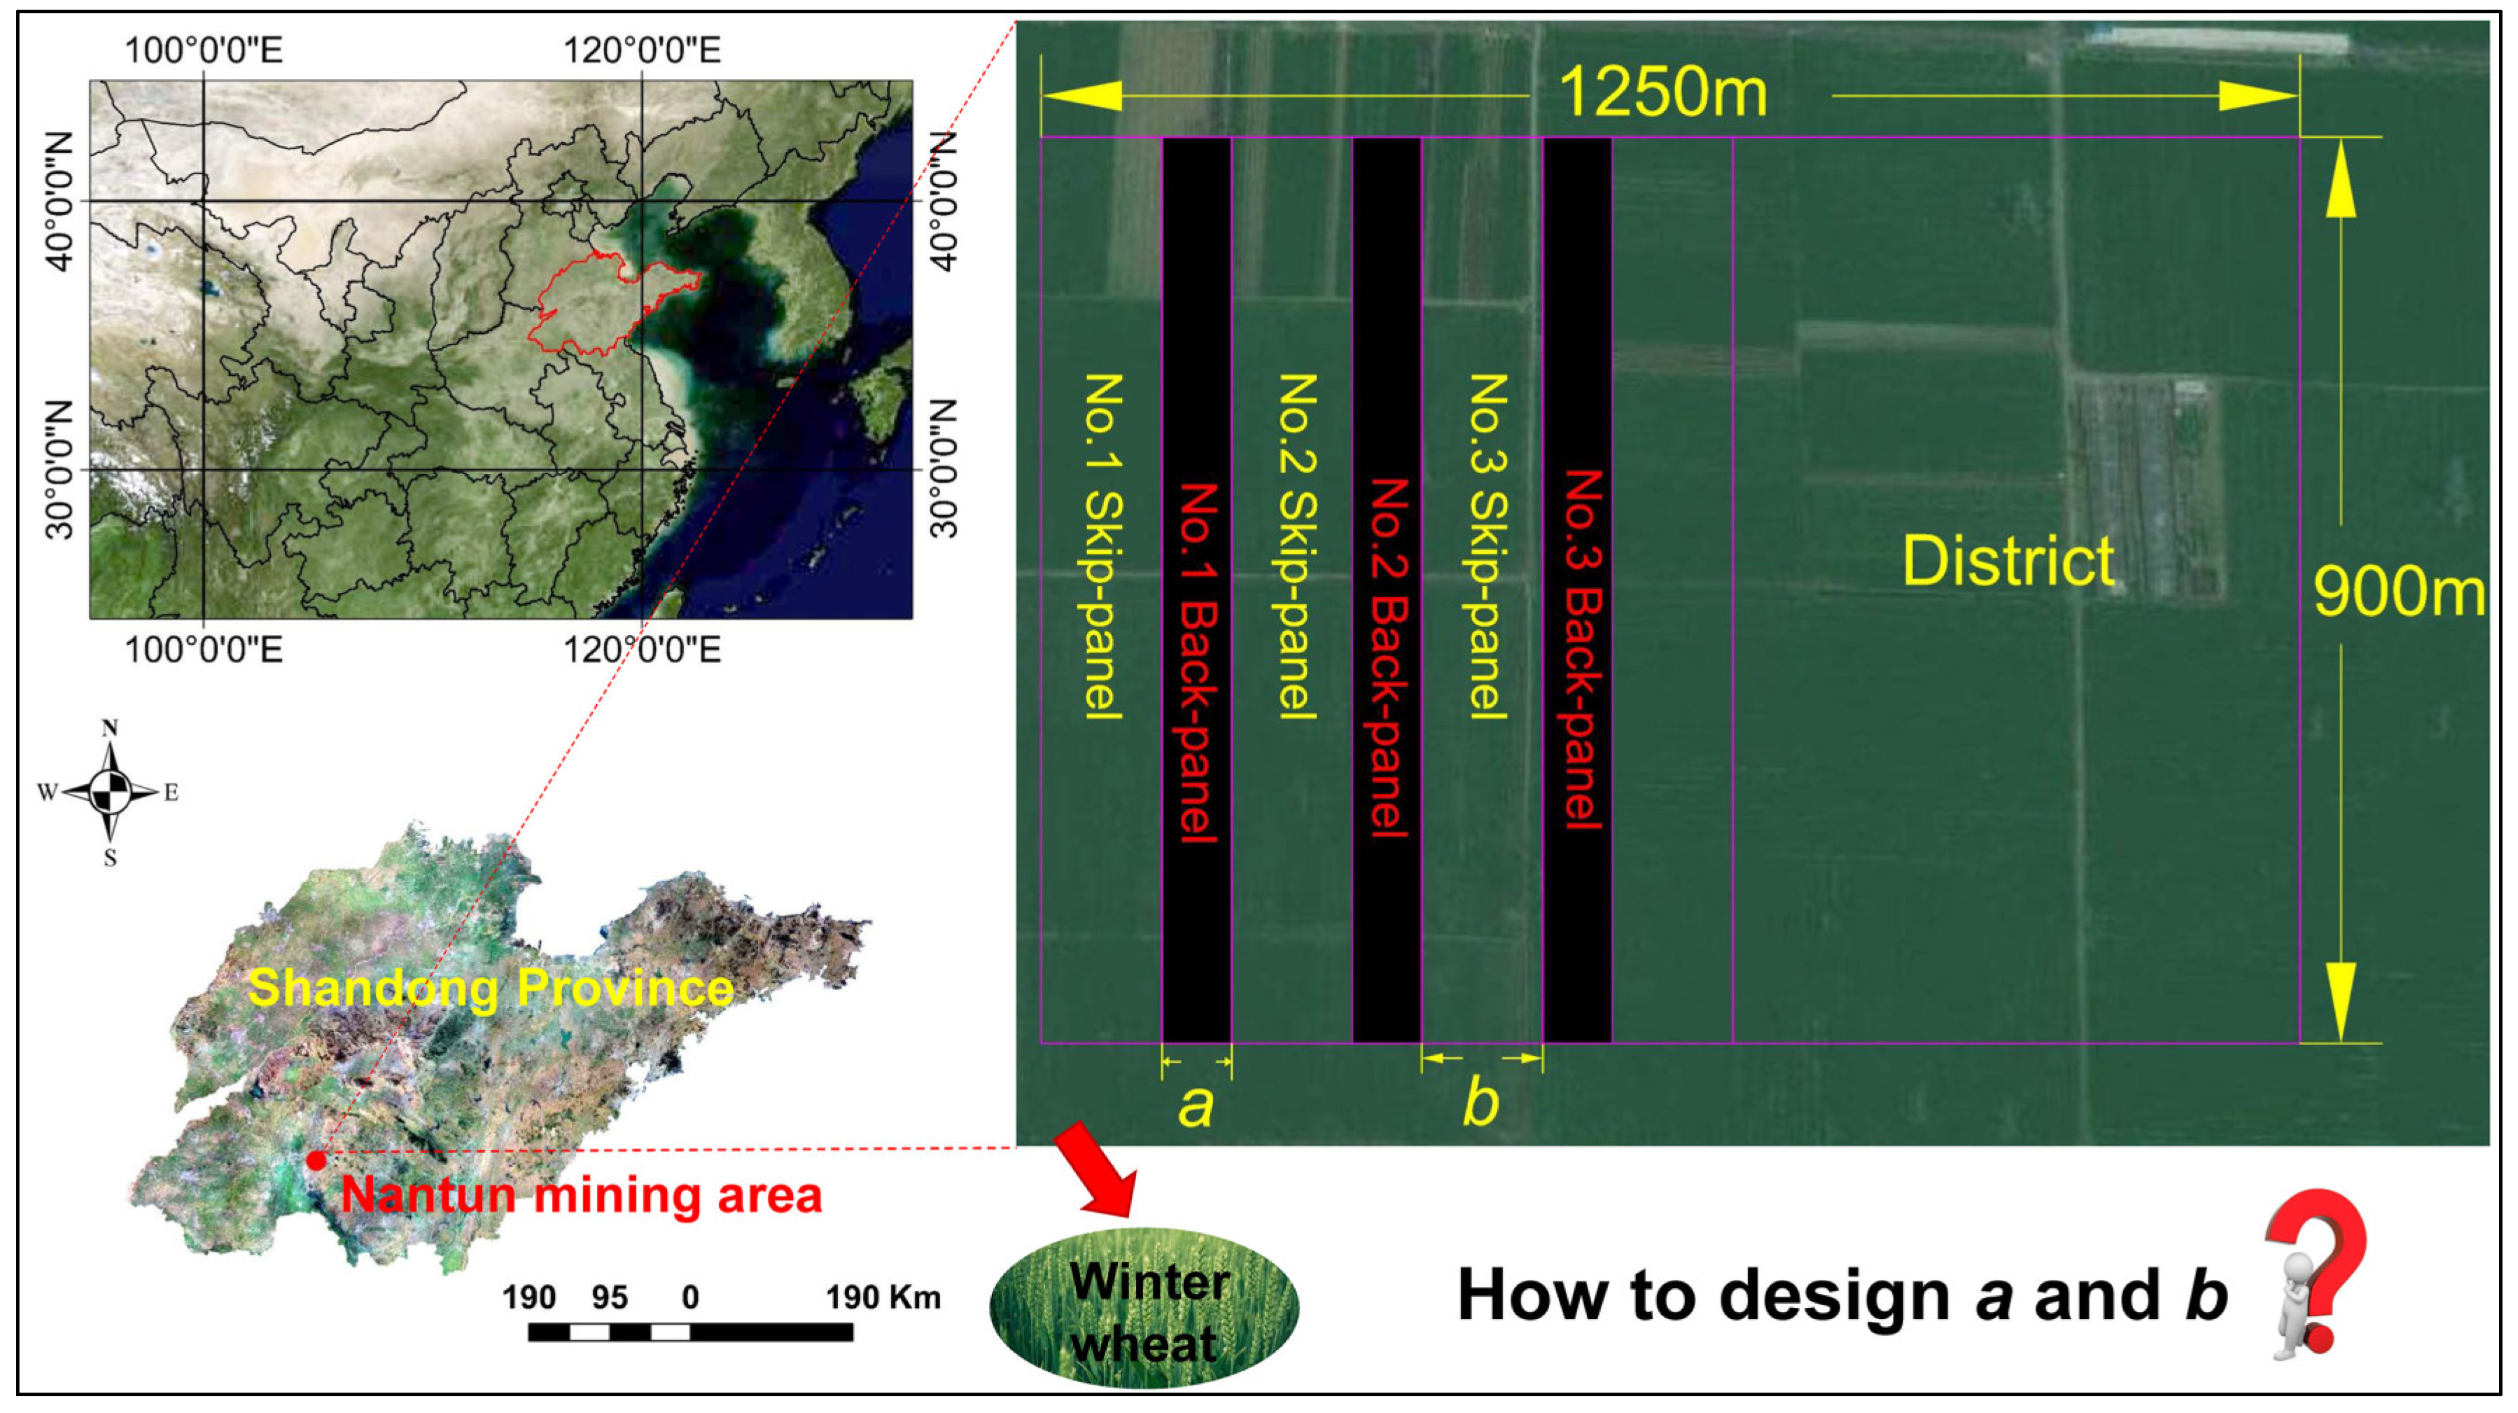
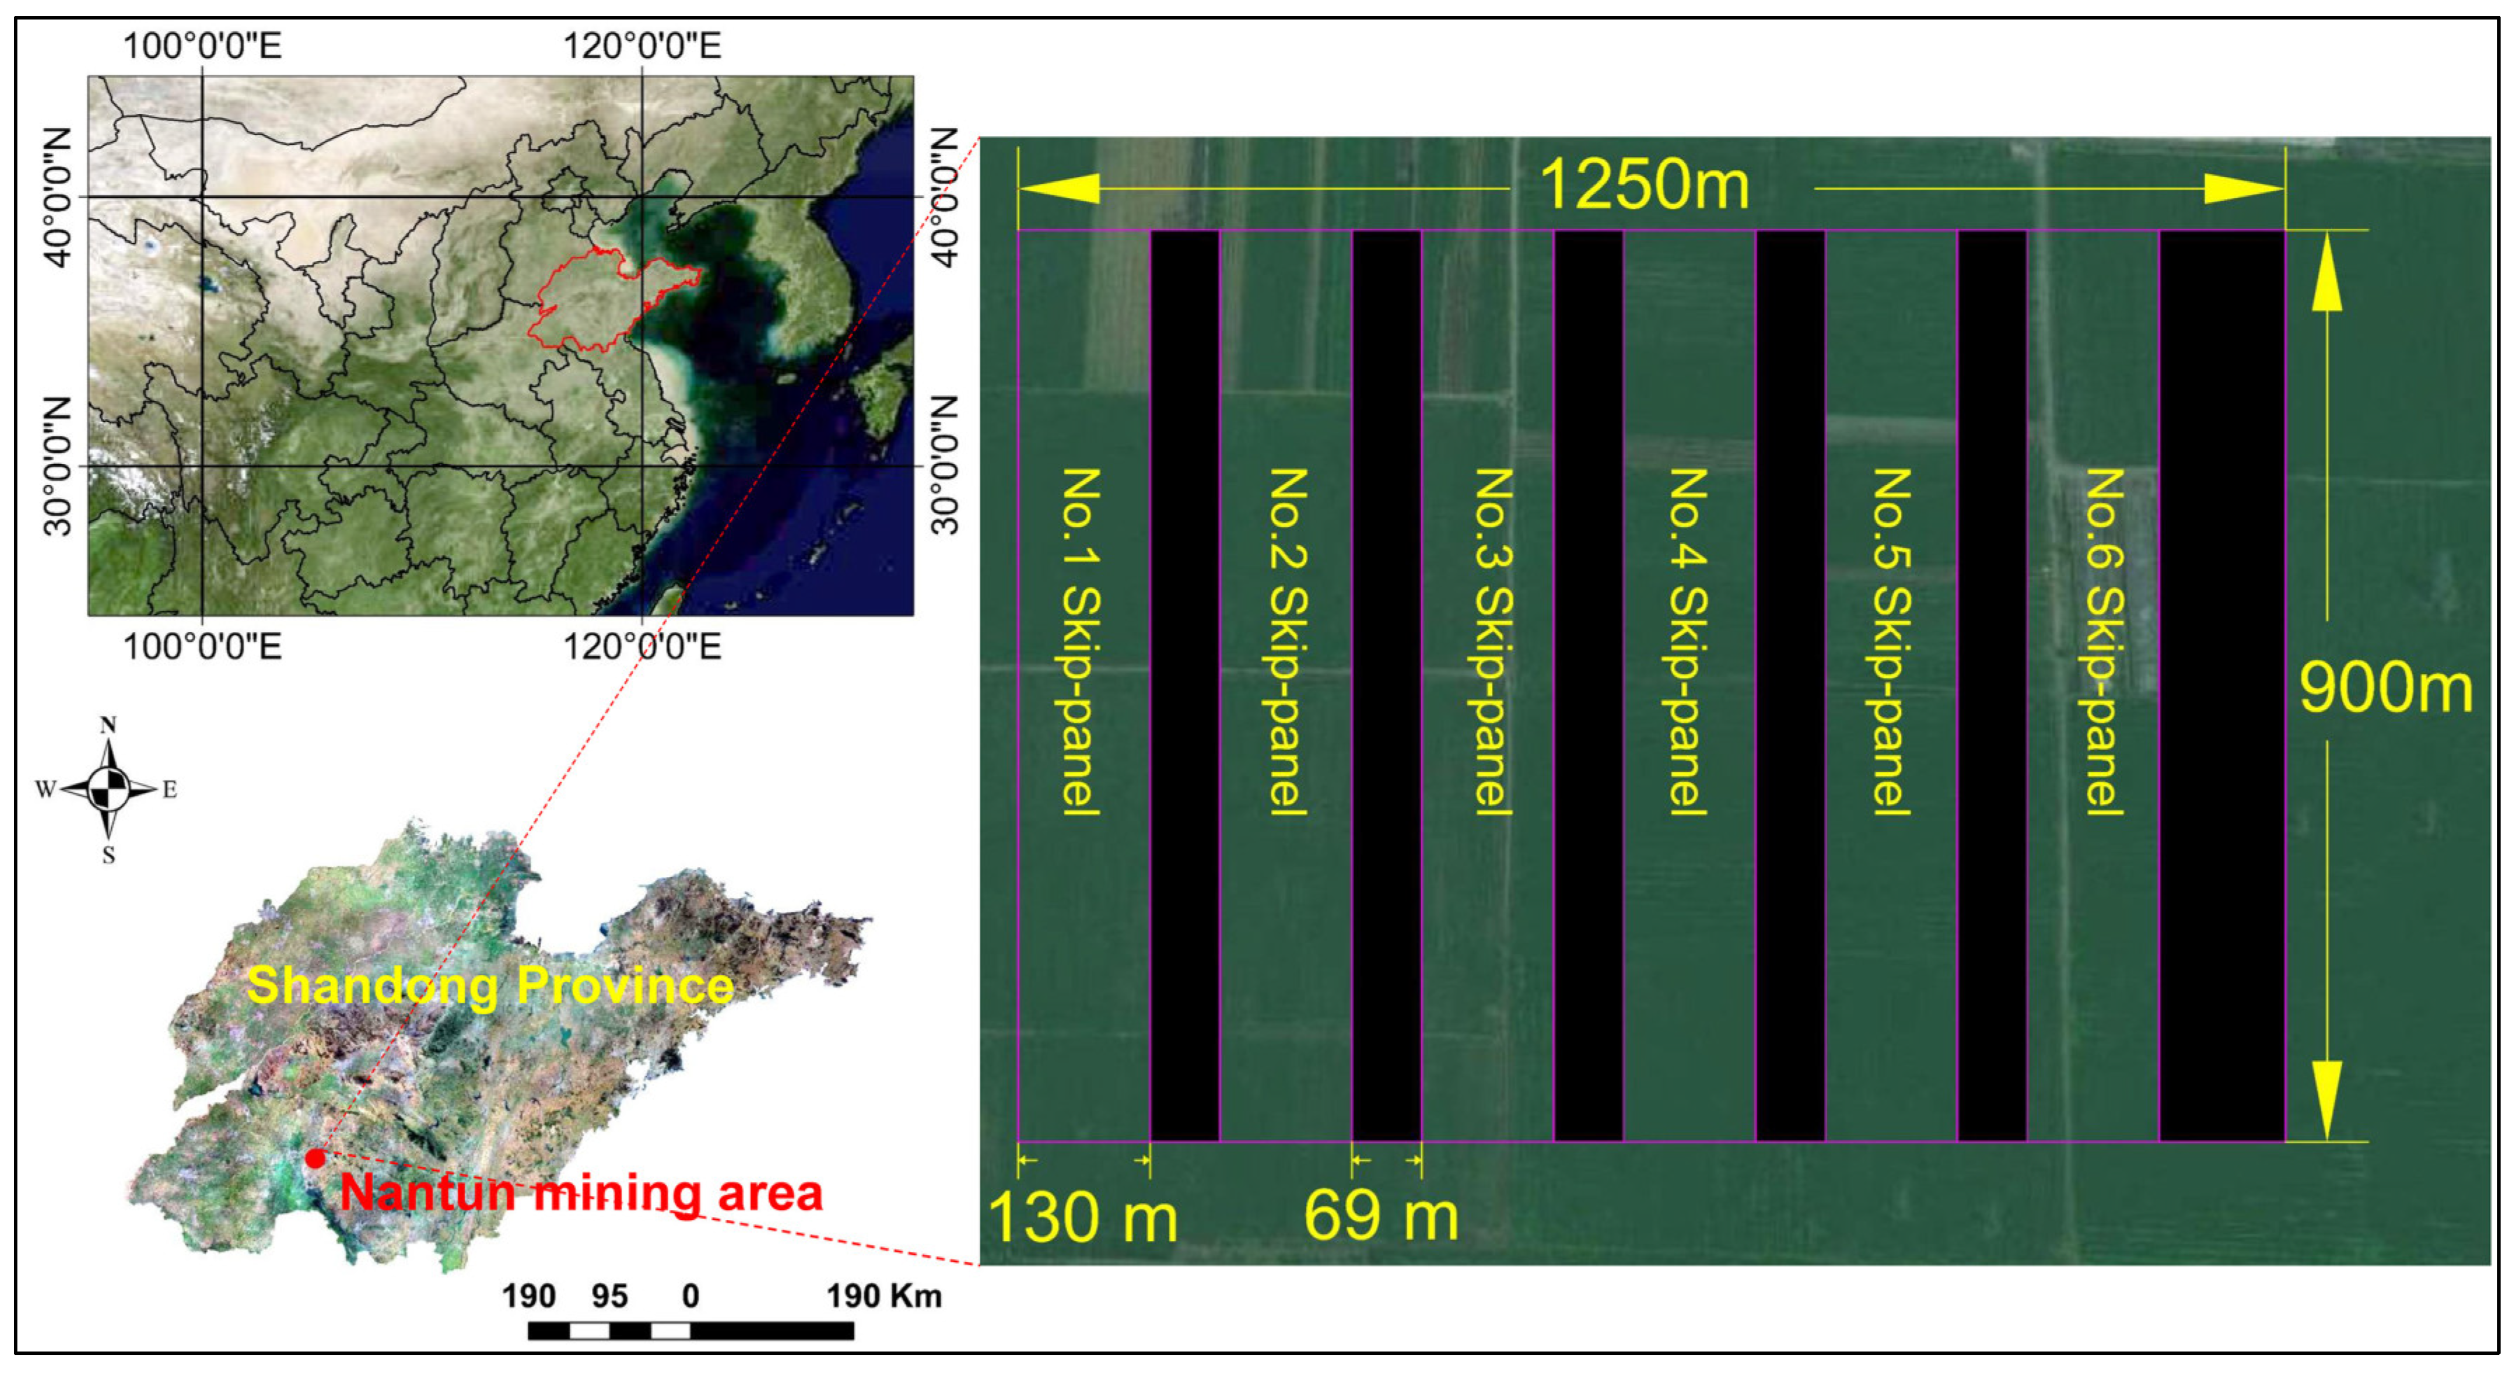
The geological and mining conditions of the Nantun mining area were used as a basis for simulating the extraction of a district, as shown in Figure 8. The district’s dimensions were 1250 m in length and 900 m in width. The geological conditions of this district are the same as those stated in the case study of Section 3.1 (refer to Table 3).
The critical subsidence value for cropland was calculated to be 1300 mm using Equation (1). Multiple panels could be arranged within this district. To postpone the TRT, the skip-mining method was adopted to extract the coal resources in this district. As shown in Figure 8, several skip-panels were planned to be arranged in this district (No. 1 skip-panel; No. 2 skip-panel…). The advancement length of each panel was set to a fixed value of 900 m. The optimization of the width b of the skip-panel and the width a of the back-panel was necessary to avoid ponding on cropland during the skip-mining period. This section designed the width of the skip-panel and back-panel using the method presented in Section 2.2. A computation program was developed using Matlab (R2021a) software for this purpose.
In Step 1 of Section 2.2.2, the maximum subsidence of cropland, Wmax(a, b), was calculated using the probability integration method. The subsidence factor q under critical mining conditions in this mining area was 0.9. Due to the relatively small width of the skip-panel, the subsidence factor q0 for each skip-panel should be adjusted according to its dimensions. The subsidence factor q0 of each skip-panel should be corrected according to Equations (7)–(9). The values of other parameters (tanβ, θ0, and S) for the probability integration method are listed in Table 4. The relevant parameters of the CSO algorithm are listed in Table 4.
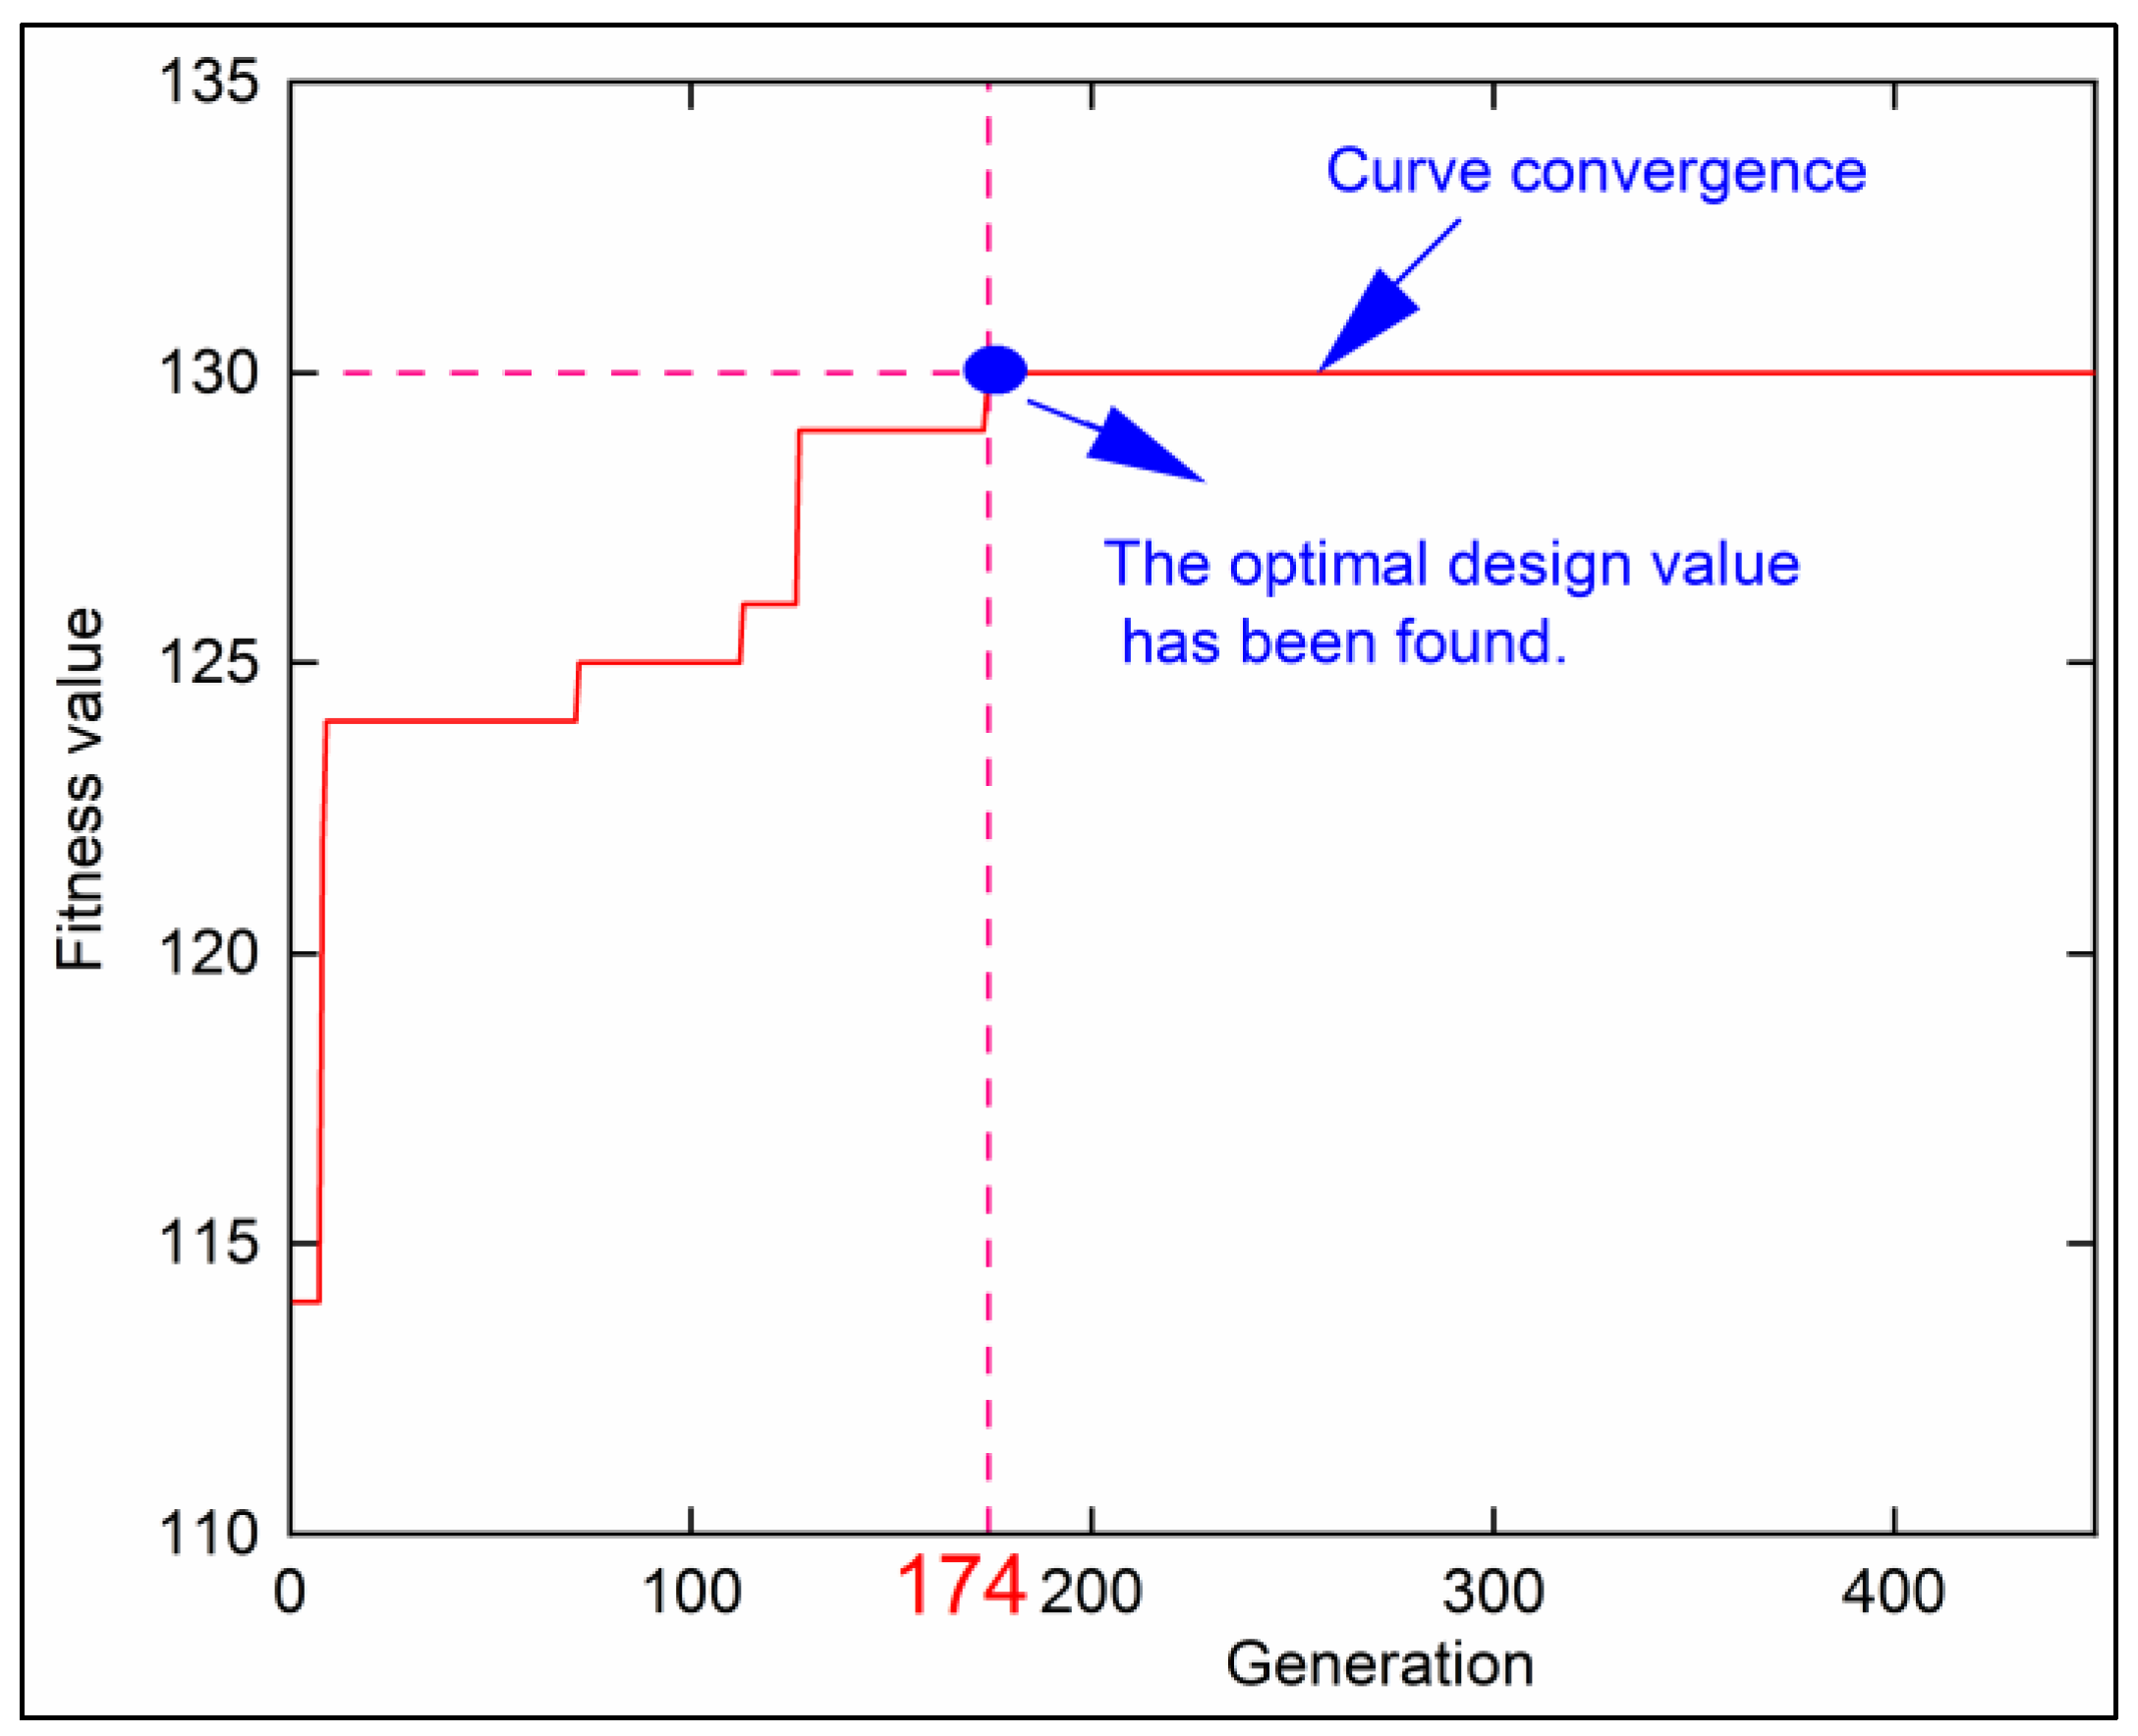
Based on the computed results, the change curve of fitness value is shown in Figure 9.
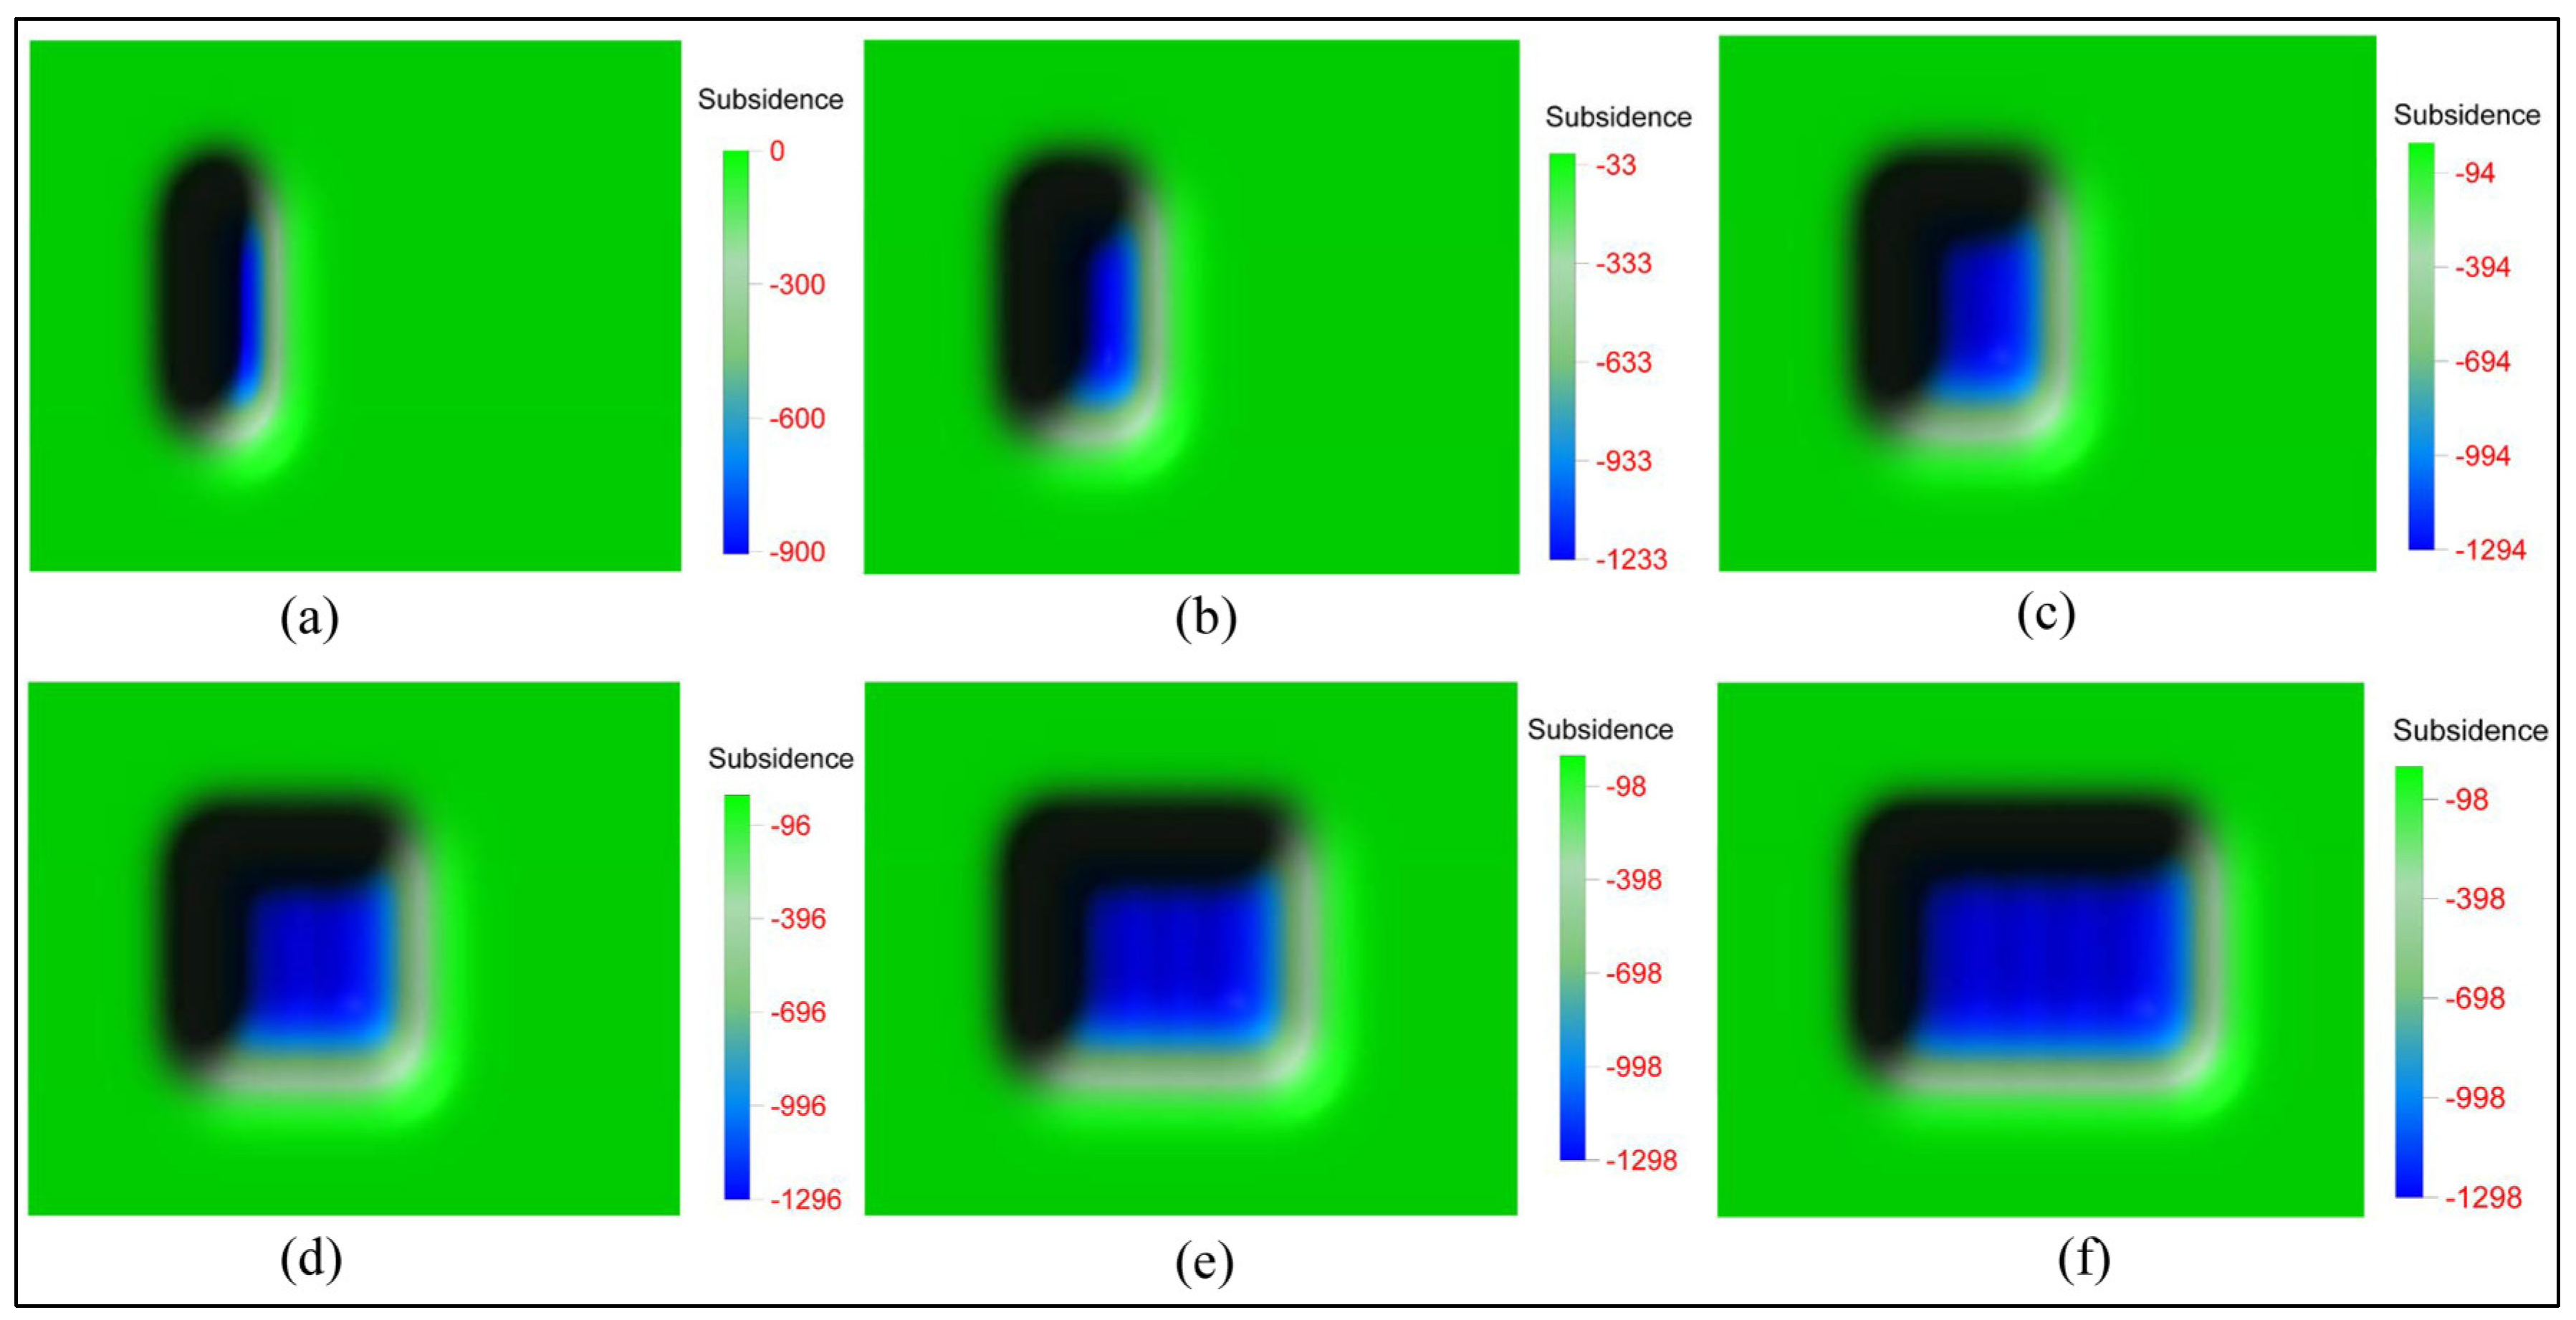
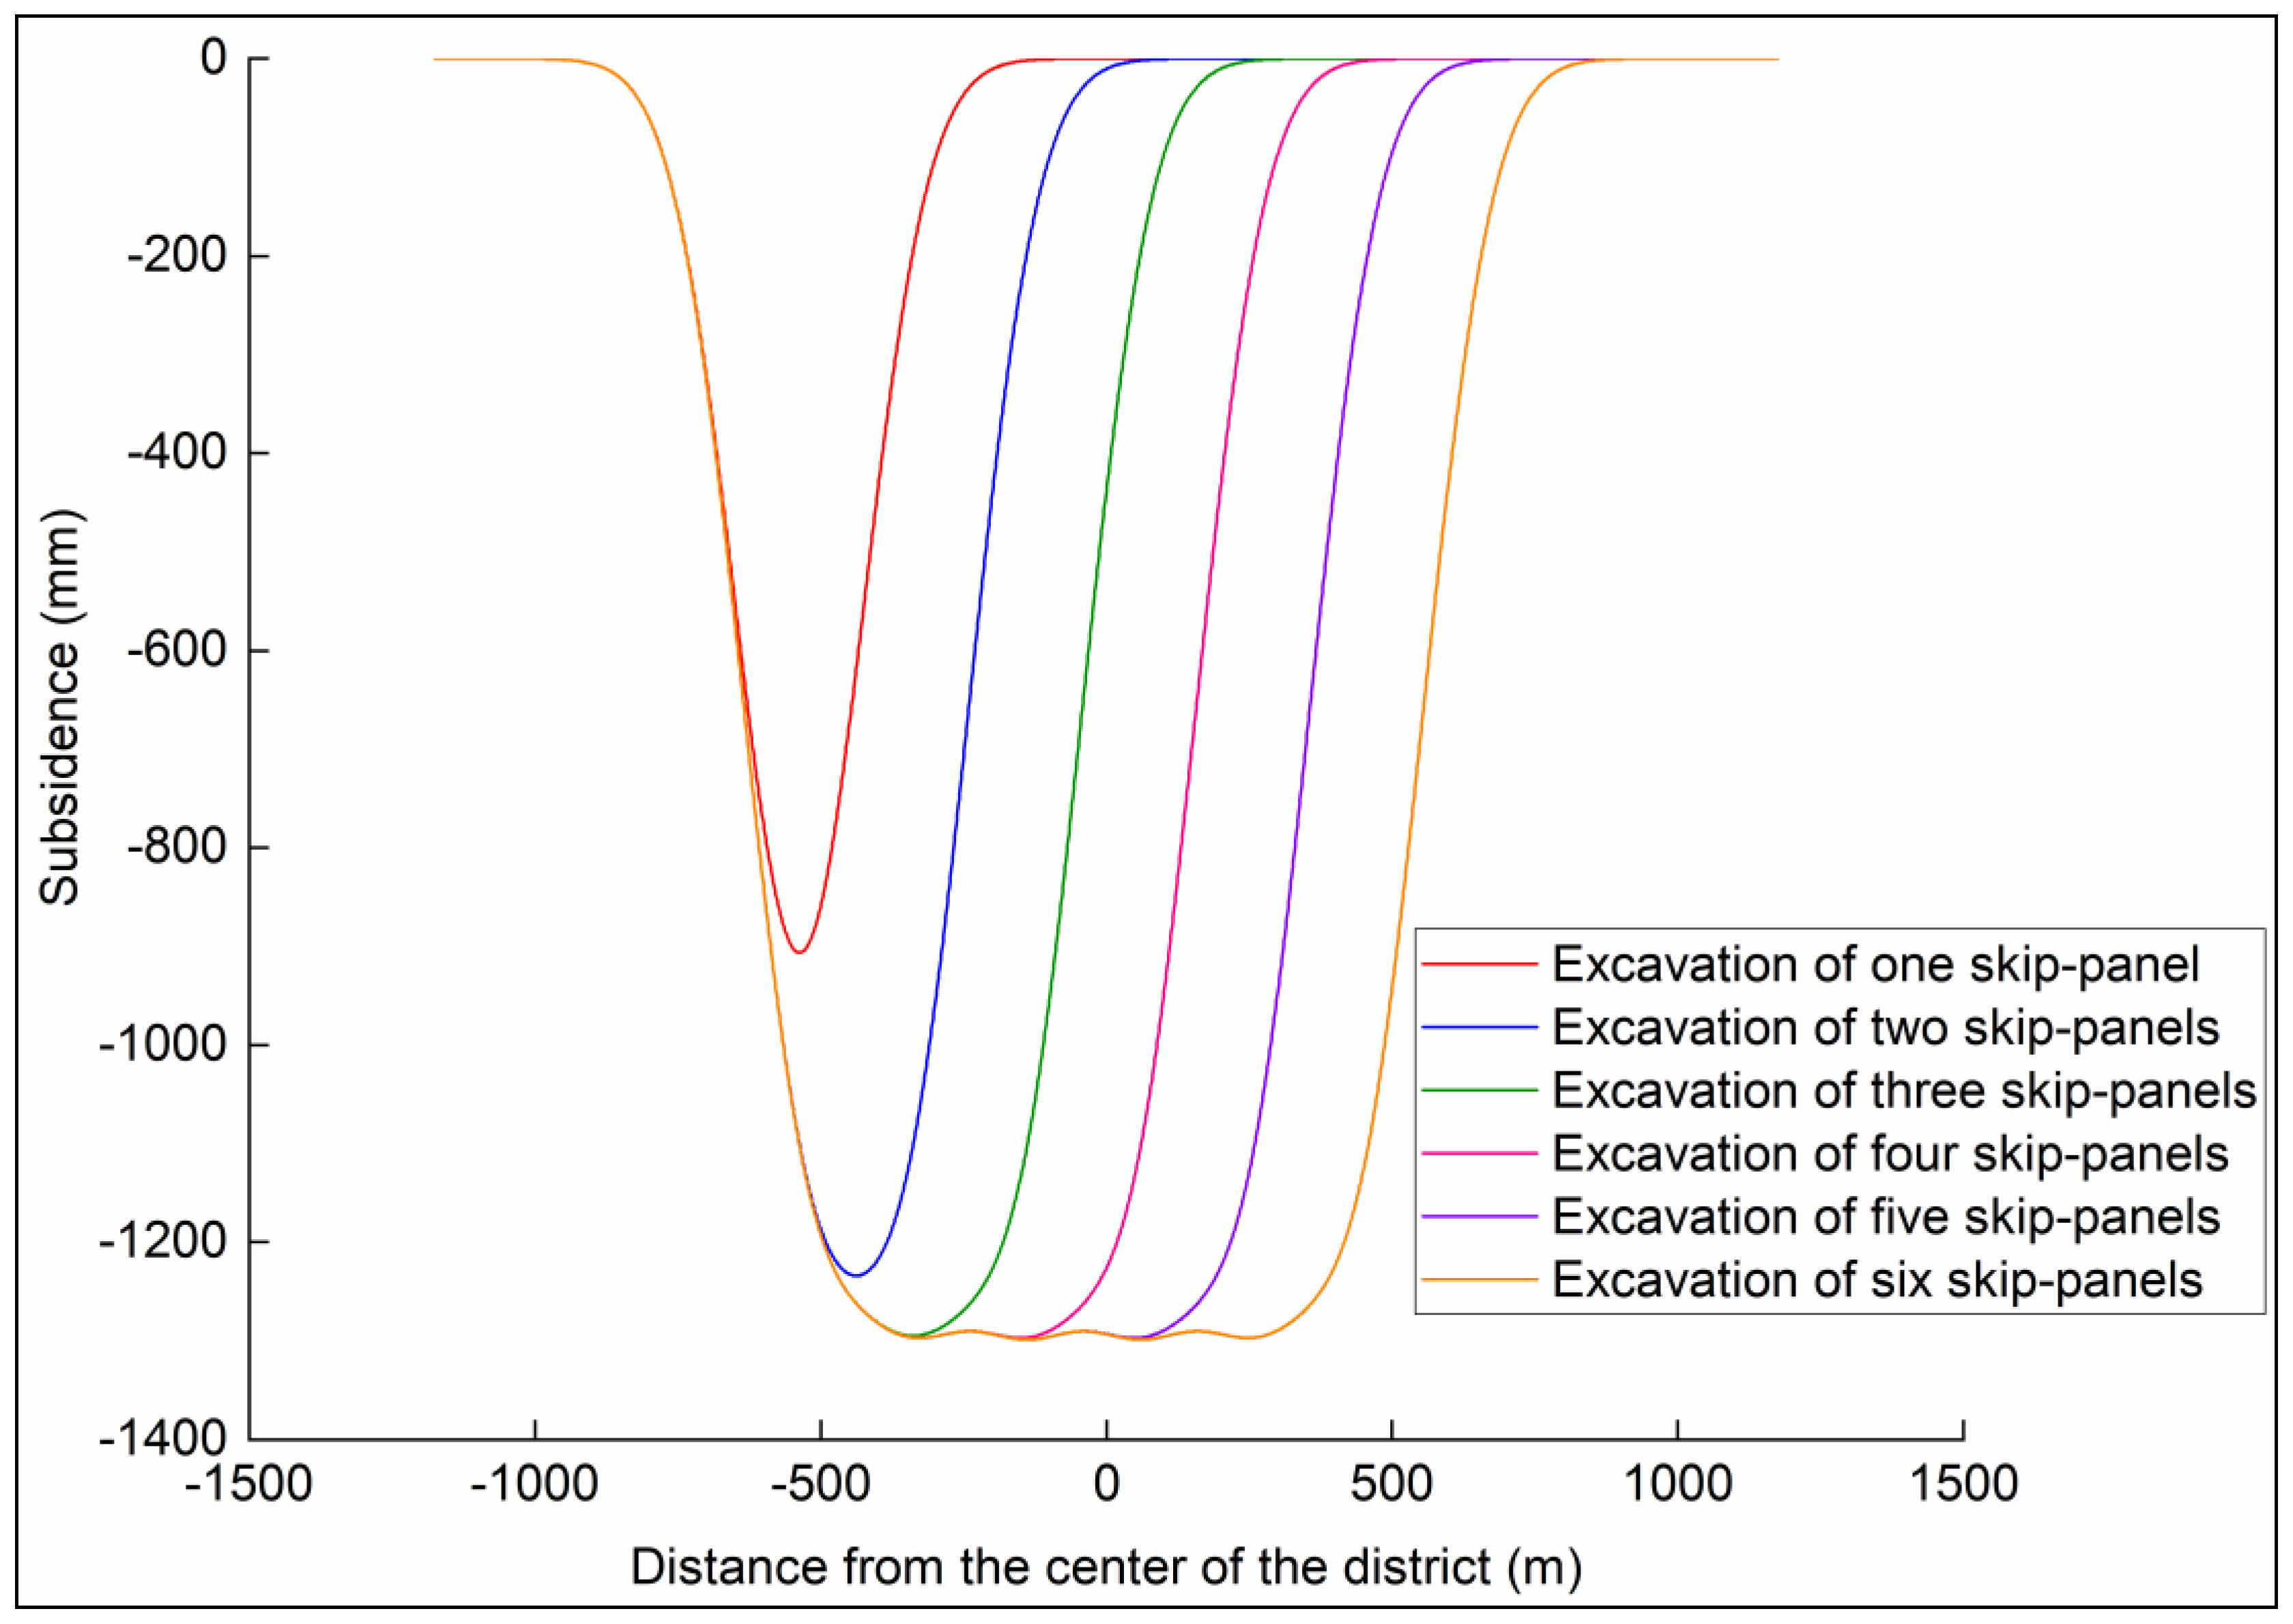
As shown in Figure 9, when the algorithm was iterated to the 174th generation, the algorithm found the optimal design result. The algorithm results showed that the optimal width of each skip-panel was 130 m, with a distance of 69 m between adjacent panels (the optimal width of back-panel). As shown in Figure 10, based on the calculation results, a total of six skip-panels were arranged within the entire district. Figure 11 shows the subsidence basin after the extraction of each skip-panel. The subsidence curve on the major section of the subsidence basin along the dip direction is shown in Figure 12.
As shown in Figure 11 and Figure 12, after each skip-mining panel’s extraction was completed, no noticeable undulating surface subsidence was observed within the subsidence basin. After the extraction of all six skip-mining panels, the maximum subsidence of cropland was 1299 mm, which remained below the critical subsidence threshold. Therefore, mining was carried out according to the width of the skip-panel designed by this method, and the TRT of cultivated land was successfully postponed to the back-mining stage, which is beneficial for mitigating the impact of land reclamation on farmers’ agricultural operations.

4. Discussion

4.1. Influence of Panel Size on the Subsidence of Cropland

According to the general rules of mining subsidence, the subsidence of the cropland depends on the mining degree along the direction of the panel’s advancement and the mining degree along the direction of the panel width [39]. The advancement distance of the panel is generally quite long, which easily results in reaching a state of critical mining. However, along the direction of the panel width, the cropland is generally in subcritical mining. Therefore, in the context of longwall mining, the subsidence of the cropland primarily depends on the panel width. When the panel width is small, some key strata in the overburden do not reach their limit spans and will not fracture, thus controlling surface subsidence. Engineers have utilized this principle to develop a strip-mining technology to control surface subsidence [39]. The subsidence control principle of the skip-mining method is similar to that of the strip-mining technology, which involves controlling surface subsidence by reducing the panel width.
The cases in Section 3.1 and Section 3.2 are examples of simulated mining, with identical geological conditions for both cases. In the case study of Section 3.1, the panel width is 210 m. When this panel has advanced 422 m, the surface subsidence has already reached the critical subsidence value for cropland (1300 mm). In the case study of Section 3.2, the width of the skip-panel is only 130 m, and even when the panel has advanced 900 m, the cropland subsidence does not exceed its critical subsidence value. This is because the width of the skip-panel is smaller, resulting in a lower mining degree along the direction of its width. The coal pillars on both sides of the skip-panel can provide stable support for the overburden, preventing the large-scale destruction of some key strata, hence keeping the subsidence of the cropland relatively low. Additionally, the phenomenon of smaller cropland subsidence during the skip-mining stage can also be explained from the perspective of subsidence prediction. When employing the probability integration method to predict cropland subsidence, the subsidence factors corresponding to panels with different widths are different under a subcritical mining state. In the case study of Section 3.1, with a panel width of 210 m, the resulting subsidence factor q0 is approximately 0.65, determined by applying the calculation methods from Equations (7)–(9). In comparison, in the case study of Section 3.2, with a panel width of 130 m, the subsidence factor q0 is about 0.53. The lower the value of the subsidence factor, the less the predicted surface subsidence. This further explains why reducing the panel width to 130 m does not cause the subsidence of cropland to exceed its critical value, even when multiple skip-panels are arranged. Therefore, optimizing the width of a skip-panel for controlling subsidence and delaying the TRT of cropland is of great importance.
The width of coal pillars (the back-panel width) also affects the subsidence of cropland. This is because the cropland subsidence caused by the extraction of two skip-panels on either side of a coal pillar will superimpose. In the case study of Section 3.2, when mining the first skip-panel, the maximum subsidence value of the cropland is 907 mm; when mining the second skip-panel, the maximum surface subsidence increases to 1234 mm (see Figure 12). The increase in the maximum surface subsidence is due to the cumulative effect of subsidence caused by the extraction of the two skip-panels. When mining the fifth and sixth skip-panels, the maximum subsidence value of the surface remains at 1299 mm, no longer significantly increasing and not exceeding the critical subsidence value for cropland. Therefore, if the width of the coal pillars is small, the cumulative cropland subsidence value can easily exceed the critical subsidence threshold of the cropland. Conversely, when the width of the coal pillars is large, it can easily lead to the formation of undulating subsidence basins in farmland, affecting the farmers’ cultivation. Therefore, optimizing the width of the coal pillars between skip-panels is also very important.

4.2. Outlook and Limitations of the Study

Calculating and optimizing the TRT of cropland is a relatively complex engineering optimization problem that lacks reliable analytical expressions to solve for the TRT. To address this issue, this study introduced, for the first time, the use of intelligent optimization algorithms to solve the planning and design problems in concurrent mining and reclamation projects. The experiments in Section 3 also demonstrate the reliability of this method. Certainly, this study encourages readers to explore more efficient intelligent optimization algorithms for calculating and optimizing the TRT. The utilization of intelligent optimization algorithms is not limited to the PSO and CSO algorithms employed in this study. Additionally, this study encourages readers to select prediction methods with a higher accuracy for predicting cropland subsidence, and there is no need to be confined to the probability integration method used in this study. In summary, this study merely provides engineers with a fresh perspective for calculating and optimizing the TRT.
The TRT studied in this paper is an idealized timing for cropland reclamation. Nevertheless, the influence of variables such as precipitation and anthropogenic factors on the reclamation timing has not been accounted for, which is a limitation of our research.

5. Conclusions

This study introduced, for the first time, the application of intelligent optimization algorithms in the context of concurrent mining and reclamation engineering. A computational method based on the PSO algorithm was developed to determine the TRT for cropland under the condition of single panel extraction. The reliability of this method was demonstrated through simulation experiments. Furthermore, this study employed the CSO algorithm to optimize the layout of multiple panels within a district. The experimental results showed that the mining operations carried out according to the layout designed by this method can delay the TRT for cropland within the district. Moreover, the duration of reclamation projects can be shortened, reducing the disturbance caused to agricultural operations by reclamation activities. In summary, this study contributes to the implementation of concurrent mining and reclamation techniques in the coal–grain overlapping area.

Author Contributions

Conceptualization, H.Y. and G.G.; Methodology, H.Y.; Validation, H.Y.; Writing—Original Draft, H.Y.; Visualization, H.Y. and G.G.; Writing—Review and Editing, G.G., H.L., and T.W.; Supervision, G.G. and H.L.; Funding acquisition, G.G. All authors have read and agreed to the published version of the manuscript.

Funding

This study was funded by the National Natural Science Foundation of China (U21A20109).

Data Availability Statement

The original contributions presented in the study are included in the article, further inquiries can be directed to the corresponding author.

Conflicts of Interest

The authors declare no conflicts of interest.

References

  1. Li, G.; Hu, Z.; Li, P.; Yuan, D.; Wang, W.; Yang, K. The optimal framework and model to balance underground coal mining and cropland protection in Jining, eastern China. Resour. Policy 2021, 74, 102307. [Google Scholar] [CrossRef]
  2. Li, G.; Hu, Z.; Li, P.; Yuan, D.; Feng, Z.; Wang, W.; Fu, Y. Innovation for sustainable mining: Integrated planning of underground coal mining and mine reclamation. J. Clean. Prod. 2022, 351, 131522. [Google Scholar] [CrossRef]
  3. National Bureau of Statistics. Statistical Bulletin on National Economic and Social Development of the People’s Republic of China in 2022. China Stat. 2023, 3, 12–29. [Google Scholar]
  4. Hu, Z.; Li, G.; Yuan, D. Timing of concurrent mining and reclamation in coal-grain overlapping areas with mining-induced subsidence, Easter China. J. China Coal Soc. 2023, 48, 373–387. [Google Scholar]
  5. Chen, Y.; Hu, Z.; Li, P.; Li, G.; Yuan, D.; Guo, J. Assessment and effect of mining subsidence on farmland in coal–crop overlapped areas: A case of shandong Province, China. Agriculture 2022, 12, 1235. [Google Scholar] [CrossRef]
  6. Bell, F.; Stacey, T.; Genske, D. Mining subsidence and its effect on the environment: Some differing examples. Environ. Geol. 2000, 40, 135–152. [Google Scholar] [CrossRef]
  7. Darmody, R.; Bauer, R.; Barkley, D.; Clarke, S.; Hamilton, D. Agricultural impacts of longwall mine subsidence: The experience in Illinois, USA and Queensland, Australia. Int. J. Coal Sci. Technol. 2014, 1, 207–212. [Google Scholar] [CrossRef]
  8. Han, J.; Hu, Z.; Wang, P.; Yan, Z.; Li, G.; Zhang, Y.; Zhou, T. Spatio-temporal evolution and optimization analysis of ecosystem service value—A case study of coal resource-based city group in Shandong, China. J. Clean. Prod. 2022, 363, 132602. [Google Scholar] [CrossRef]
  9. Morrison, K.; Reynolds, J.; Wright, I. Subsidence Fracturing of Stream Channel from Longwall coal mining causing upwelling saline groundwater and metal-Enriched contamination of surface waterway. Water Air Soil Pollut. 2019, 230, 37. [Google Scholar] [CrossRef]
  10. Ignacy, D. Relative elevations of the surface of artificially drained mine subsidence areas as significant aspects in formulating environmental policy. J. Hydrol. 2019, 575, 1087–1098. [Google Scholar] [CrossRef]
  11. Tichavský, R.; Jiránková, E.; Fabiánová, A. Dating of mining-induced subsidence based on a combination of dendrogeomorphic methods and in situ monitoring. Eng. Geol. 2020, 272, 105650. [Google Scholar] [CrossRef]
  12. Vishwakarma, A.; Agnihotri, A.; Rai, R.; Shrivastva, B.; Mishra, S. Impact assessment of a mine subsidence on native vegetation of South Eastern Coalfields, India. Int. Arch. Photogramm. Remote Sens. Spat. Inf. Sci. 2018, 5, 487–490. [Google Scholar] [CrossRef]
  13. Hendrychova’, M.; Svobodova, K.; Kabrna, M. Mine reclamation planning and management: Integrating natural habitats into post-mining land use. Resour. Policy 2020, 69, 101882. [Google Scholar] [CrossRef]
  14. Bhuiyan, M.; Parvez, L.; Islam, M.; Dampare, S.; Suzuki, S. Heavy metal pollution of coal mine-affected agricultural soils in the northern part of Bangladesh. J. Hazard. Mater. 2010, 173, 384–392. [Google Scholar] [CrossRef] [PubMed]
  15. Lechner, A.; Baumgartl, T.; Matthew, P.; Glenn, V. The Impact of Underground Longwall Mining on Prime Agricultural Land: A Review and Research Agenda. Land Degrad. Dev. 2016, 27, 1650–1663. [Google Scholar] [CrossRef]
  16. Xiao, W.; Zheng, W.; Zhao, Y.; Chen, J.; Hu, Z. Examining the relationship between coal mining subsidence and crop failure in plains with a high underground water table. J. Soils Sediments 2021, 21, 2908–2921. [Google Scholar] [CrossRef]
  17. Xiao, W.; Wang, Z.; Zhang, R.; Li, S. The “golden ten years”: Underground coal mining and its impacts on land use and subsequent social problems: A case study on the Jining city region, China. Int. J. Min. Miner. Eng. 2017, 8, 19–34. [Google Scholar] [CrossRef]
  18. Chugh, Y. Concurrent mining and reclamation for underground coal mining subsidence impacts in China. Int. J. Coal Sci. Technol. 2018, 5, 18–35. [Google Scholar] [CrossRef]
  19. He, T.; Xiao, W.; Zhao, Y.; Deng, X.; Hu, Z. Identification of waterlogging in Eastern China induced by mining subsidence: A case study of Google Earth Engine time-series analysis applied to the Huainan coal field. Remote Sens. Environ. 2020, 242, 111742. [Google Scholar] [CrossRef]
  20. He, T.; Xiao, W.; Zhao, Y.; Chen, W.; Deng, X.; Zhang, J. Continues monitoring of subsidence water in mining area from the eastern plain in China from 1986 to 2018 using Landsat imagery and Google Earth Engine. J. Clean. Prod. 2021, 279, 123610. [Google Scholar] [CrossRef]
  21. Ren, H.; Xiao, W.; Zhao, Y.; Hu, Z. Land damage assessment using maize aboveground biomass estimated from unmanned aerial vehicle in high groundwater level regions affected by underground coal mining. Environ. Sci. Pollut. Res. 2020, 27, 21666–21679. [Google Scholar] [CrossRef] [PubMed]
  22. Li, S.; Zhao, Y.; Xiao, W.; Yellishetty, M.; Yang, D. Identifying ecosystem service bundles and the spatiotemporal characteristics of trade-offs and synergies in coal mining areas with a high groundwater table. Sci. Total Environ. 2022, 807, 151036. [Google Scholar] [CrossRef] [PubMed]
  23. Hu, Z.; Li, G.; Xia, J.; Feng, Z.; Han, J.; Chen, Z.; Wang, W.; Li, G. Coupling of underground coal mining and mine reclamation for farmland protection and sustainable mining. Resour. Policy 2023, 84, 103756. [Google Scholar] [CrossRef]
  24. Li, G.; Hu, Z.; Yuan, D.; Li, P.; Feng, Z.; He, Y.; Wang, W. A new approach to increased land reclamation rate in a coal mining subsidence area: A case-study of Guqiao Coal Mine, China. Land Degrad. Dev. 2021, 33, 866–880. [Google Scholar] [CrossRef]
  25. Mojses, M.; Petrovič, F.; Bugár, G. Evaluation of Land-Use Changes as a Result of Underground Coal Mining—A Case Study on the Upper Nitra Basin, West Slovakia. Water 2022, 14, 989. [Google Scholar] [CrossRef]
  26. Hu, Z.; Xiao, W.; Wang, P.; Zhao, Y. Concurrent mining and reclamation for underground coal mining. J. China Coal Soc. 2013, 38, 301–307. [Google Scholar]
  27. Feng, Z.; Hu, Z.; Li, G.; Zhang, Y.; Zhang, X.; Zhang, H. Improving mine reclamation efficiency for farmland sustainable use: Insights from optimizing mining scheme. J. Clean. Prod. 2022, 379, 134615. [Google Scholar] [CrossRef]
  28. Hu, Z.; Xiao, W.; Zhao, Y. Re-discussion on coal mine eco-environment concurrent mining and reclamation. J. China Coal Soc. 2020, 45, 351–359. [Google Scholar]
  29. Feng, Z.; Hu, Z.; Zhang, X.; Zhang, Y.; Cui, R.; Lu, L. Integrated Mining and Reclamation Practices Enhance Sustainable Land Use: A Case Study in Huainan Coalfield, China. Land 2023, 12, 1994. [Google Scholar] [CrossRef]
  30. Zhao, Y.; Hu, Z. Proper time model for pre-reclamation of unstable subsidence. J. China Coal Soc. 2008, 30, 157–161. [Google Scholar]
  31. Sun, Y.; Hu, Z.; Yuan, D.; Zhao, H.; Cao, Y. Timing research of concurrent mining and reclamation for single coal face with different mining depths. China Min. Mag. 2019, 28, 89–93. [Google Scholar] [CrossRef]
  32. Chen, J.; Hu, Z.; Liu, W.; Yuan, D.; Zhang, R. Simulation of concurrent mining and reclamation for single coal facewith different coal mining thickness. Coal Eng. 2018, 50, 145–149. [Google Scholar]
  33. Xiao, W.; Hu, Z.; Gao, Y.; Zhang, R.; Wang, T. Building and application of topsoil stripping time model in concurrent mining and reclamation technology in underground coal mines. Mine Surv. 2013, 167, 84–89. [Google Scholar] [CrossRef]
  34. Cui, X.; Che, Y.; Malinowska, A. Method and problem for subsidence prediction in entire process induced by underground mining. J. China Coal Soc. 2022, 47, 2170–2181. [Google Scholar]
  35. Li, S.; Li, Y.; Lin, Y. Intelligent Optimization Algorithms and Emergent Computation, 1st ed.; Tsinghua University Press: Beijing, China, 2019; pp. 175–354. [Google Scholar]
  36. Kennedy, J.; Eberhart, R. Particle Swarm Optimization. In Proceedings of the ICNN’95—International Conference on Neural Networks, Perth, WA, Australia, 27 November–1 December 1995. [Google Scholar] [CrossRef]
  37. Meng, X.; Liu, Y.; Gao, X.; Zhang, H. A New Bio-inspired Algorithm: Chicken Swarm Optimization. Lecture Notes in Artificial Intelligence. In Proceedings of the 5th International Conference on Swarm Intelligence, Hefei, China, 17–20 October 2014. [Google Scholar] [CrossRef]
  38. Yin, H.; Guo, G.; Li, H.; Wang, T.; Yuan, Y. Prediction method and research on characteristics of surface subsidence due to mining deeply buried Jurassic coal seams. Bull. Eng. Geol. Environ. 2022, 81, 449. [Google Scholar] [CrossRef]
  39. Deng, K.; Tan, Z.; Jiang, Y.; Dai, H.; Shi, Y.; Xu, L. Deformation Monitoring and Subsidence Engineering, 1st ed.; China University of Mining and Technology Press: Xuzhou, China, 2014; pp. 178–179+290. [Google Scholar]
Figure 1. Critical ponding state for cropland.
Land 13 00638 g001
Figure 2. Calculation method for SD based on PSO algorithm.
Land 13 00638 g002
Figure 3. Schematic diagram of skip-mining technology.
Land 13 00638 g003
Figure 4. Morphology of subsidence basins during the skip-mining phase: (a) undulating subsidence, (b) non-undulating subsidence.
Land 13 00638 g004
Figure 5. Optimization process for widths of the skip-panel and back-panel based on the CSO algorithm.
Land 13 00638 g005
Figure 6. The position and size of the panel.
Land 13 00638 g006
Figure 7. The change curve of the fitness value based on the PSO algorithm.
Land 13 00638 g007
Figure 8. Schematic diagram of a layout of skip-panel and back-panel within the district.
Land 13 00638 g008
Figure 9. The change curve of the fitness value based on the CSO algorithm.
Land 13 00638 g009
Figure 10. Optimized layout of the skip-panel and back-panel.
Land 13 00638 g010
Figure 11. Subsidence basin of cropland formed during the skip-mining period: (a) excavation of No. 1 skip-panel, (b) excavation of No. 1–No. 2 skip-panels, (c) excavation of No. 1–No. 3 skip-panels, (d) excavation of No. 1–No. 4 skip-panels, (e) excavation of No. 1–No. 5 skip-panels, and (f) excavation of No. 1–No. 6 skip-panels.
Land 13 00638 g011
Figure 12. Subsidence curve on the major section of the subsidence basin along the dip direction.
Land 13 00638 g012
Table 1. The geological and mining conditions.
Panel Width
m
Panel
Length
m
Mining Height
m
Dip Angle of the Coal Seam
°
Mining
Depth
m
Advance Speed
m/day
Hwater
m
hb
m
2109005455042.10.8
Table 2. Parameters for subsidence prediction equation and PSO algorithm.
q0tanβθ0
°
S
m
cNGc1, c2[Llower, Lupper]rpVmaxω
0.652.087.6160.02688675630202[37, 900]186.30.7
Table 3. The geological conditions of the district.
Mining Height
m
Dip Angle of the Coal Seam
°
Mining
Depth
m
Hwater
m
hb
m
545502.10.8
Table 4. Parameters for probability integration method and CSO algorithm.
tanβθ0
°
S
m
popGTGNRNHNCNM[Dlower, Dupper]
2.087.616120450102472247[60, 250]
Disclaimer/Publisher’s Note: The statements, opinions and data contained in all publications are solely those of the individual author(s) and contributor(s) and not of MDPI and/or the editor(s). MDPI and/or the editor(s) disclaim responsibility for any injury to people or property resulting from any ideas, methods, instructions or products referred to in the content.