Abstract
Achieving the goal of integrated urban–rural development is to achieve a spatially balanced development of the constituent elements of urban–rural relations in China. Rural populations and land dedicated to construction are the main components of the countryside in traditional agricultural areas; they play an important role in the development of the countryside itself in terms of urban and rural land use and in the formation of urban and rural development patterns. This study analyzes the spatial and temporal changes in rural populations and construction land at the township level, alongside assessing various forms and the extent of coupled development. Herein, we consider the role of urban–rural attractiveness and propose a framework for relationships between urban and rural development based on different forms of coupled development; a model of urban–rural forces is constructed to determine spatial patterns of urban–rural development at the township level that may transpire in the future. Our study shows that the rural population and construction land in the study area are characterized by significant spatial and temporal dynamics, indicating that traditional rural areas are in a process of rapid development and change. The results of our measurements of township-level coupling indicate that there exist four development patterns within urban–rural development: the A-type is most likely to produce new cities or satellite towns in the future and form new urban areas; the B-type is the area most likely to cease and be annexed to other villages or cities to meet building targets; the C-type comprises areas to be focused on in the future to attract populations and strictly control the growth of rural construction land areas (to avoid land transforming into the B-type); and the D-type refers to lands upon which regional township centers may develop in the future, becoming an area devoted to rural revitalization. The A-type and D-type are prioritized for the allocation of construction land, which can be contracted from types B and C. The results of this study have provided important reference for the formulation of population and construction land control policies in accordance with local conditions and the realization of integrated urban and rural development strategies.
1. Introduction
The UN–Habitat World Cities Report 2022 mentions that “with rising birth rates, the existing urban population continues to grow naturally, especially in low-income countries. In 2021, the urban population accounted for 56 per cent of the world’s total population”. This statement indicates that urbanization is taking place in many countries around the world [1]. During this process, rural–urban relations have undergone dramatic and complex changes. On the one hand, rapid urbanization has had certain effects on rural areas, causing some of them to decline rapidly [2,3]. On the other hand, ever-expanding cities, through the radiation effect, have brought development opportunities to rural areas, causing some villages to develop rapidly [4,5]. This phenomenon has manifested most significantly in urban–rural population flows and changes in construction land.
Since China’s reform and opening up in 1978, urban–rural relations have moved from an “urban–rural dual structure” to “integrated urban–rural development” [6]. The report of the 20th National Congress of the Communist Party of China (CPC) proposes to “insist on the priority development of agriculture and rural areas, the integrated development of urban and rural areas, and the unimpeded flow of urban and rural factors”; in doing so, they proposed new requirements for the development of urban–rural relations. In traditional villages, urban–rural population flows and the distribution of rural demand for construction land are the core elements that constitute the development of urban–rural relations [7,8]. In terms of the mobility of the urban–rural population, rural areas must achieve rural revitalization through their own socio-economic development and improvements to the living and ecological environment [9]; this will attract populations to move to them. At the same time, urban areas attract populations because of their ability to provide better employment, living standards, and an appealing ecological environment. Regarding the indices of rural construction land’s development, the countryside has shifted from relying on traditional cultivation to modern agriculture [10] and other industries, meaning township and village enterprises’ demand for construction land is even greater [11]. However, China, as a country with a large population, has implemented a strict arable land protection system. In rural areas, land used for industrial production and other non-agricultural industries is limited in rural areas to acting as construction land; thus, it is particularly important to deploy construction land according to demand. Changes in the rural population should be linked to changes in their use of construction land, which should theoretically increase or decrease at the same time. However, in reality, there is often a mismatch between the two [12]. The current practice is to take the city as the administrative center, meaning the government can meet new rural construction land targets through land planning and use policies. The one of most important indicators used for the creation of policy is the movement of the urban–rural population. Therefore, the mobility of the rural population and construction land use have a coupled-action relationship, and this relationship is influenced by the surrounding cities; their combined effect creates the future pattern of urban and rural development.
Extensive research has been carried out on the coupling of population and construction land [13,14]. Most of these studies have been conducted at the macro scale, including cities, provinces, and countries as study units; fewer studies have been conducted at the township scale [15,16]. Existing studies have focused on the coupling or decoupling state of population and construction land, being mostly static studies, and less on analyzing changing trends (taking into account the theory of system element coupling). These coupled change trends indicate the strength of the interaction between the system elements and allow us to visualize trends in the system’s evolution rather than only predicting quantitative changes [17]. Some classical economic theories, such as growth pole theory [18] and diffusion theory [19], discuss the formation of urban–rural development patterns, using the important context of urban–rural population mobility and reconfiguration of urban–rural construction land, which provide an important theoretical basis for research. However, our knowledge of how these theories guide the construction of the modern urban–rural relationship needs to be further supplemented with studies that apply these theories empirically [20]. In terms of research methodology, most relevant studies have used remote sensing (RS) interpretation methods to determine the characteristics of dynamic change in urban and rural construction land and population distribution characteristics [21,22,23]; in addition, geographic information technology (GIS) has been used to carry out spatial characterization and quantitative research [24,25], including spatial distribution characteristics, spatial agglomeration characteristics, spatial change trends, etc., and this has provided a technical method for representing the abstract relationship of urban–rural development in a spatially intuitive manner.
Heilongjiang Province is an important food production base in China [26], and villages in the region have long been dominated by planting, which is in line with the characteristics of traditional villages. This study describes spatio-temporal change patterns and the form that coupled development of the rural population and construction land take at the township scale in Heilongjiang Province from 2016 to 2021, intending thereby to show the development trends in villages. Considering the way that 12 prefecture-level cities in the study area can attract populations and influence mobility and also considering the impact of regulatory land use policies on the construction of new areas, the development of the contemporary urban–rural relationship is analyzed, and a model framework is formed. The concept of urban–rural development power and a quantitative measurement model are proposed to analyze the spatial patterns of urban–rural development at the township level that may transpire in the future; a visual representation of these patterns is produced, with a view to identifying new urban and rural populations and economic agglomerations and more accurately matching changing construction land use targets so as to optimize the future of urban and rural development.
2. Materials and Methods
2.1. Study Area
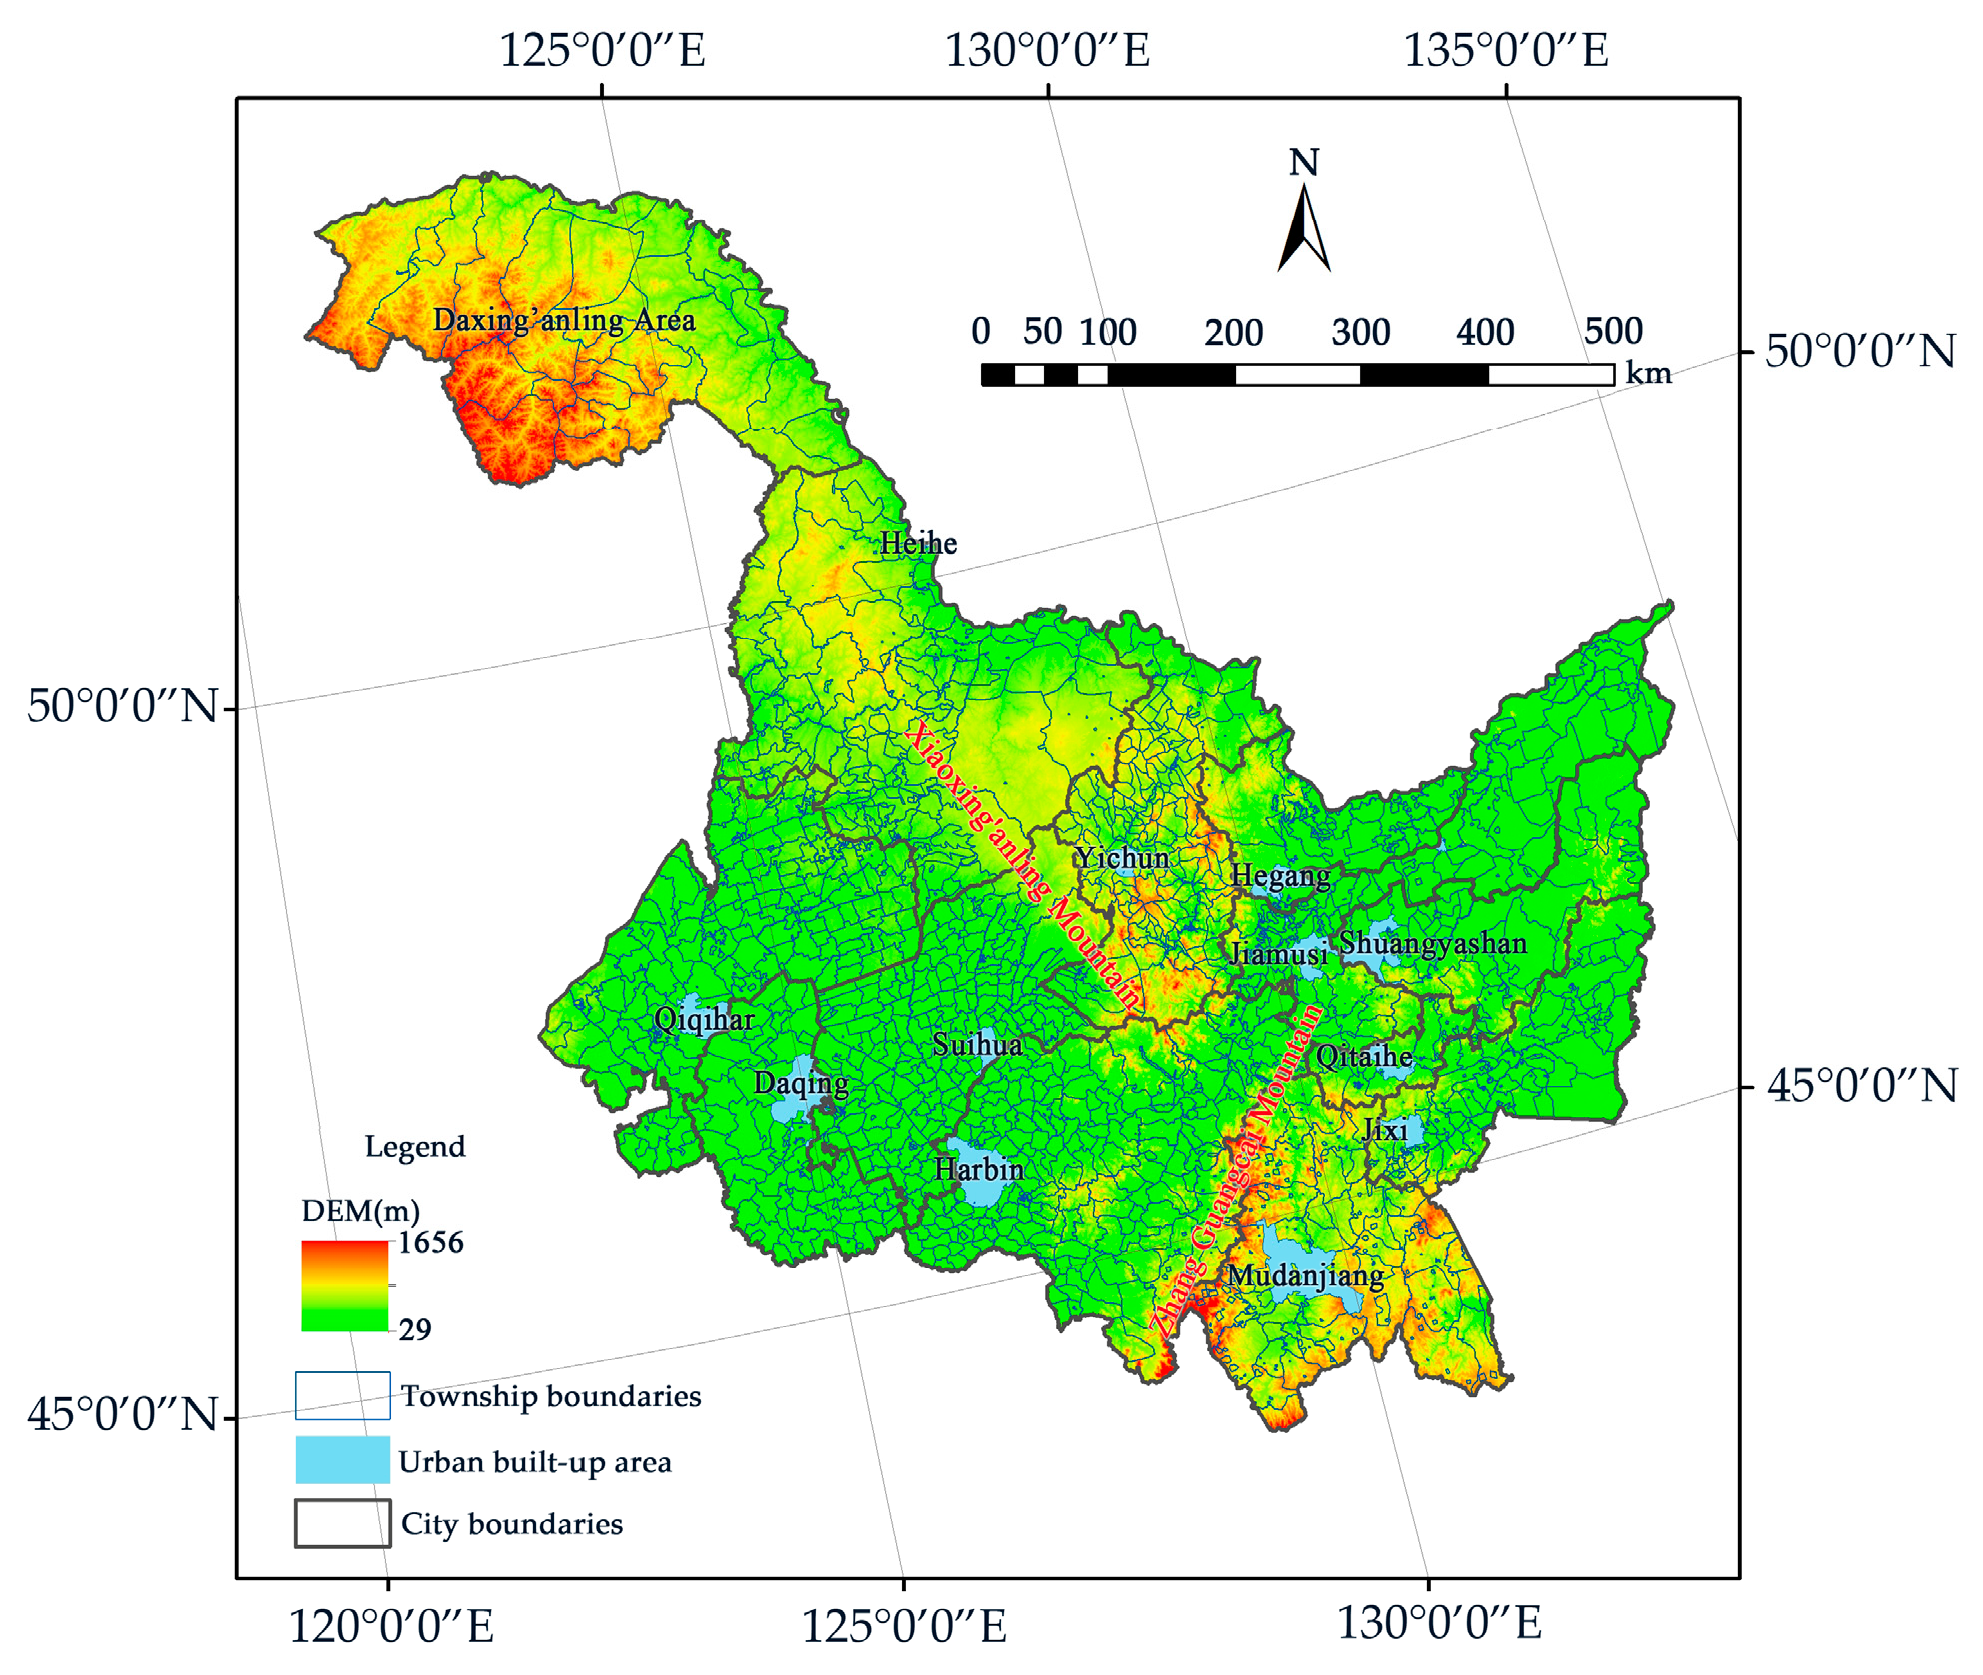
Heilongjiang Province is located in northeastern China (E 121°11′–135°05′, N 43°26′–53°33′), bordering Russia to the north and east, China’s Inner Mongolia Province to the west, and Jilin Province to the south. The study area includes 12 prefecture-level cities and the Daxing’anling district (excluding the Gaghdach district) (Table 1), among which are 875 townships, wherein the rural population is concentrated, and 709 county-level streets and farms. The total study area is 455,145.84 km2. Each prefecture-level city has a built-up area wherein the urban population is concentrated. The study area is part of the Daxing’anling Mountains in the west, with the northwest–southeast-trending Xiaoxing’anling Mountains connected to it, and the Zhangguancai Mountains in the east. To the south of the Xiaoxing’anling Range is the Songnen Plain, and to the northeast of the Zhangguancai Ridge is the Sanjiang Plain, with most of the towns and villages located in these two major plains. Heilongjiang Province is an important food-producing region in China with vast rural areas. The townships in this study account for 98.07 per cent of the total area of the study area. Due to their location in the borderland, the cities within them are more closely related to the neighboring townships (Figure 1).

Table 1.
Basic overview of the 12 prefecture-level cities in the study area.
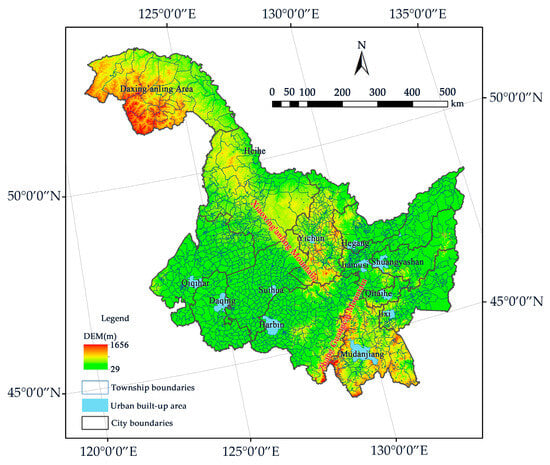
Figure 1.
Overview of the study area.
2.2. Data Sources and Preprocessing
The timespan of this study is 2016–2021. Among these years, 2016 was the start of China’s 13th Five-Year Plan, which is China’s major national economic program; 2021 is known as the first year of China’s rural revitalization, which is of great significance for the development of urban–rural relations, and it is also known as the starting year of the latest iteration of the Heilongjiang Provincial Land Plan (2021–2035). The data used in this study include the spatial distribution of the population data, rural construction land data, urban built-up area data, administrative division data, and urban attractiveness data.
The data on the spatial distribution of the population (LandScan) were developed by the U.S. Department of Energy’s Oak Ridge National Laboratory (ORNL) and was downloaded from https://landscan.ornl.gov/ (accessed on 20 September 2023) at a spatial resolution of 1 km; the dataset includes data for both 2016 and 2021. It uses an innovative approach that combines geographic information system (GIS) and remote sensing (RS) imagery [28]. In contrast, the national census data conducted in China are non-dynamic and based on household registration surveys. Additionally, considering that the average area of the township scale (including townships, county-level streets, and farms) in this study area is 287 km2 and that only the change in the total population of each township over time is to be calculated, the chosen research method needs to standardize the degree of change to a value between 0 and 1. The real quantitative value of the demographic variable will have little impact on the subsequent calculations. Therefore, these data can be used to meet the requirements of this study.
The rural construction land data were obtained by interpreting Landsat remote sensing images (https://www.gscloud.cn/sources/index?pid=263 (accessed on 17 September 2023)) with a spatial resolution of 30 m, from two periods of data collection in 2016 and 2021. This study established a remote sensing code for interpreting construction land, using a combination of supervised and unsupervised classification methods to interpret Landsat TM remote sensing images [29]. We referred to the remote sensing classification tool within ENVI 5.7 software for the application of specific remote sensing image interpretation tools. The population change data (2016–2021) and rural construction land use change data (2016–2021) were thusly obtained. The outline of the municipal administrative districts in Heilongjiang Province were obtained from the Resource and Environment Science and Data Center of the Chinese Academy of Sciences (https://www.resdc.cn/Datalist1.aspx?FieldTyepID=20,0 (accessed on 10 September 2023)). The spatial extent of townships in Heilongjiang Province was obtained from the Geographic Remote Sensing Ecological Network Platform (http://www.gisrs.cn/ (accessed on 10 September 2023)). The data on urban built-up areas refer to the administrative area of the main urban area of the city and came from the Ministry of Civil Affairs of the People’s Republic of China (http://xzqh.mca.gov.cn/map (accessed on 11 September 2023)); these were overlaid with the township data of Heilongjiang Province to obtain the urban built-up area data. The comprehensive urban attractiveness dataset consists of three parts—employment environment, living environment, and ecosystems—including 19 indicators [30,31,32,33] (Table 2), and the data were all obtained from the “Heilongjiang Statistical Yearbook 2022” (https://kns.cnki.net/knavi/yearbooks/YHLTN/detail?uniplatform=NZKPT (accessed on 3 November 2023)).

Table 2.
Evaluation table of the overall attractiveness of the city.
2.3. Methodology
2.3.1. Patterns of Spatial and Temporal Changes in Population Size and Construction Land Use in Rural Areas
We aimed to study the spatial and temporal changes in population and construction land use at the township scale. The township scale includes townships, streets, and farms. The raster data of the spatial distribution of population in 2016 and 2021 were converted into point datasets Pt1 and Pt2, respectively. Each commune consists of the sum (Pitn) of the population numbers of two different years of point data, respectively. The sum changes () in the differences in population size (Pit2–Pit1) within each township in the study area were counted separately to obtain the population change in terms of townships. The same method was used to obtain the total change () in the township-scale area of rural construction land in the study area from 2016 to 2021.
Further analysis of the spatio-temporal separate pattern was based on Anselin Local Moran’s I model [34]. Please refer to ArcGIS 10.8 software for details about this tool.
2.3.2. Modeling the Coupling of Population Mobility and Construction Land Use in Rural Areas
From the perspective of system theory, the coupling of two systems means that they have mutual influence and interaction and show a dynamic correlating relationship. In traditional rural areas, the rural population changes over time, and the use of construction land is constantly being planned and adjusted. At the same time, the growth of construction land due to the expansion of production and improvements in quality of life cause the agglomeration of the population; and the simultaneous changes in the two indicate a coupled relationship [12,13,14,15,16,35]. This study describes trends in the development of different types of villages based on the degree of coupling between the two in the process of dynamic change [35,36]. This coupling can express a homogeneous relationship between the development of population and construction land, but it can also express a contrary relationship. This means it can reflect future development trends in different types of villages in a more comprehensive way and lay the foundation for further analyses of the relationship between forms of development in urban and rural areas.
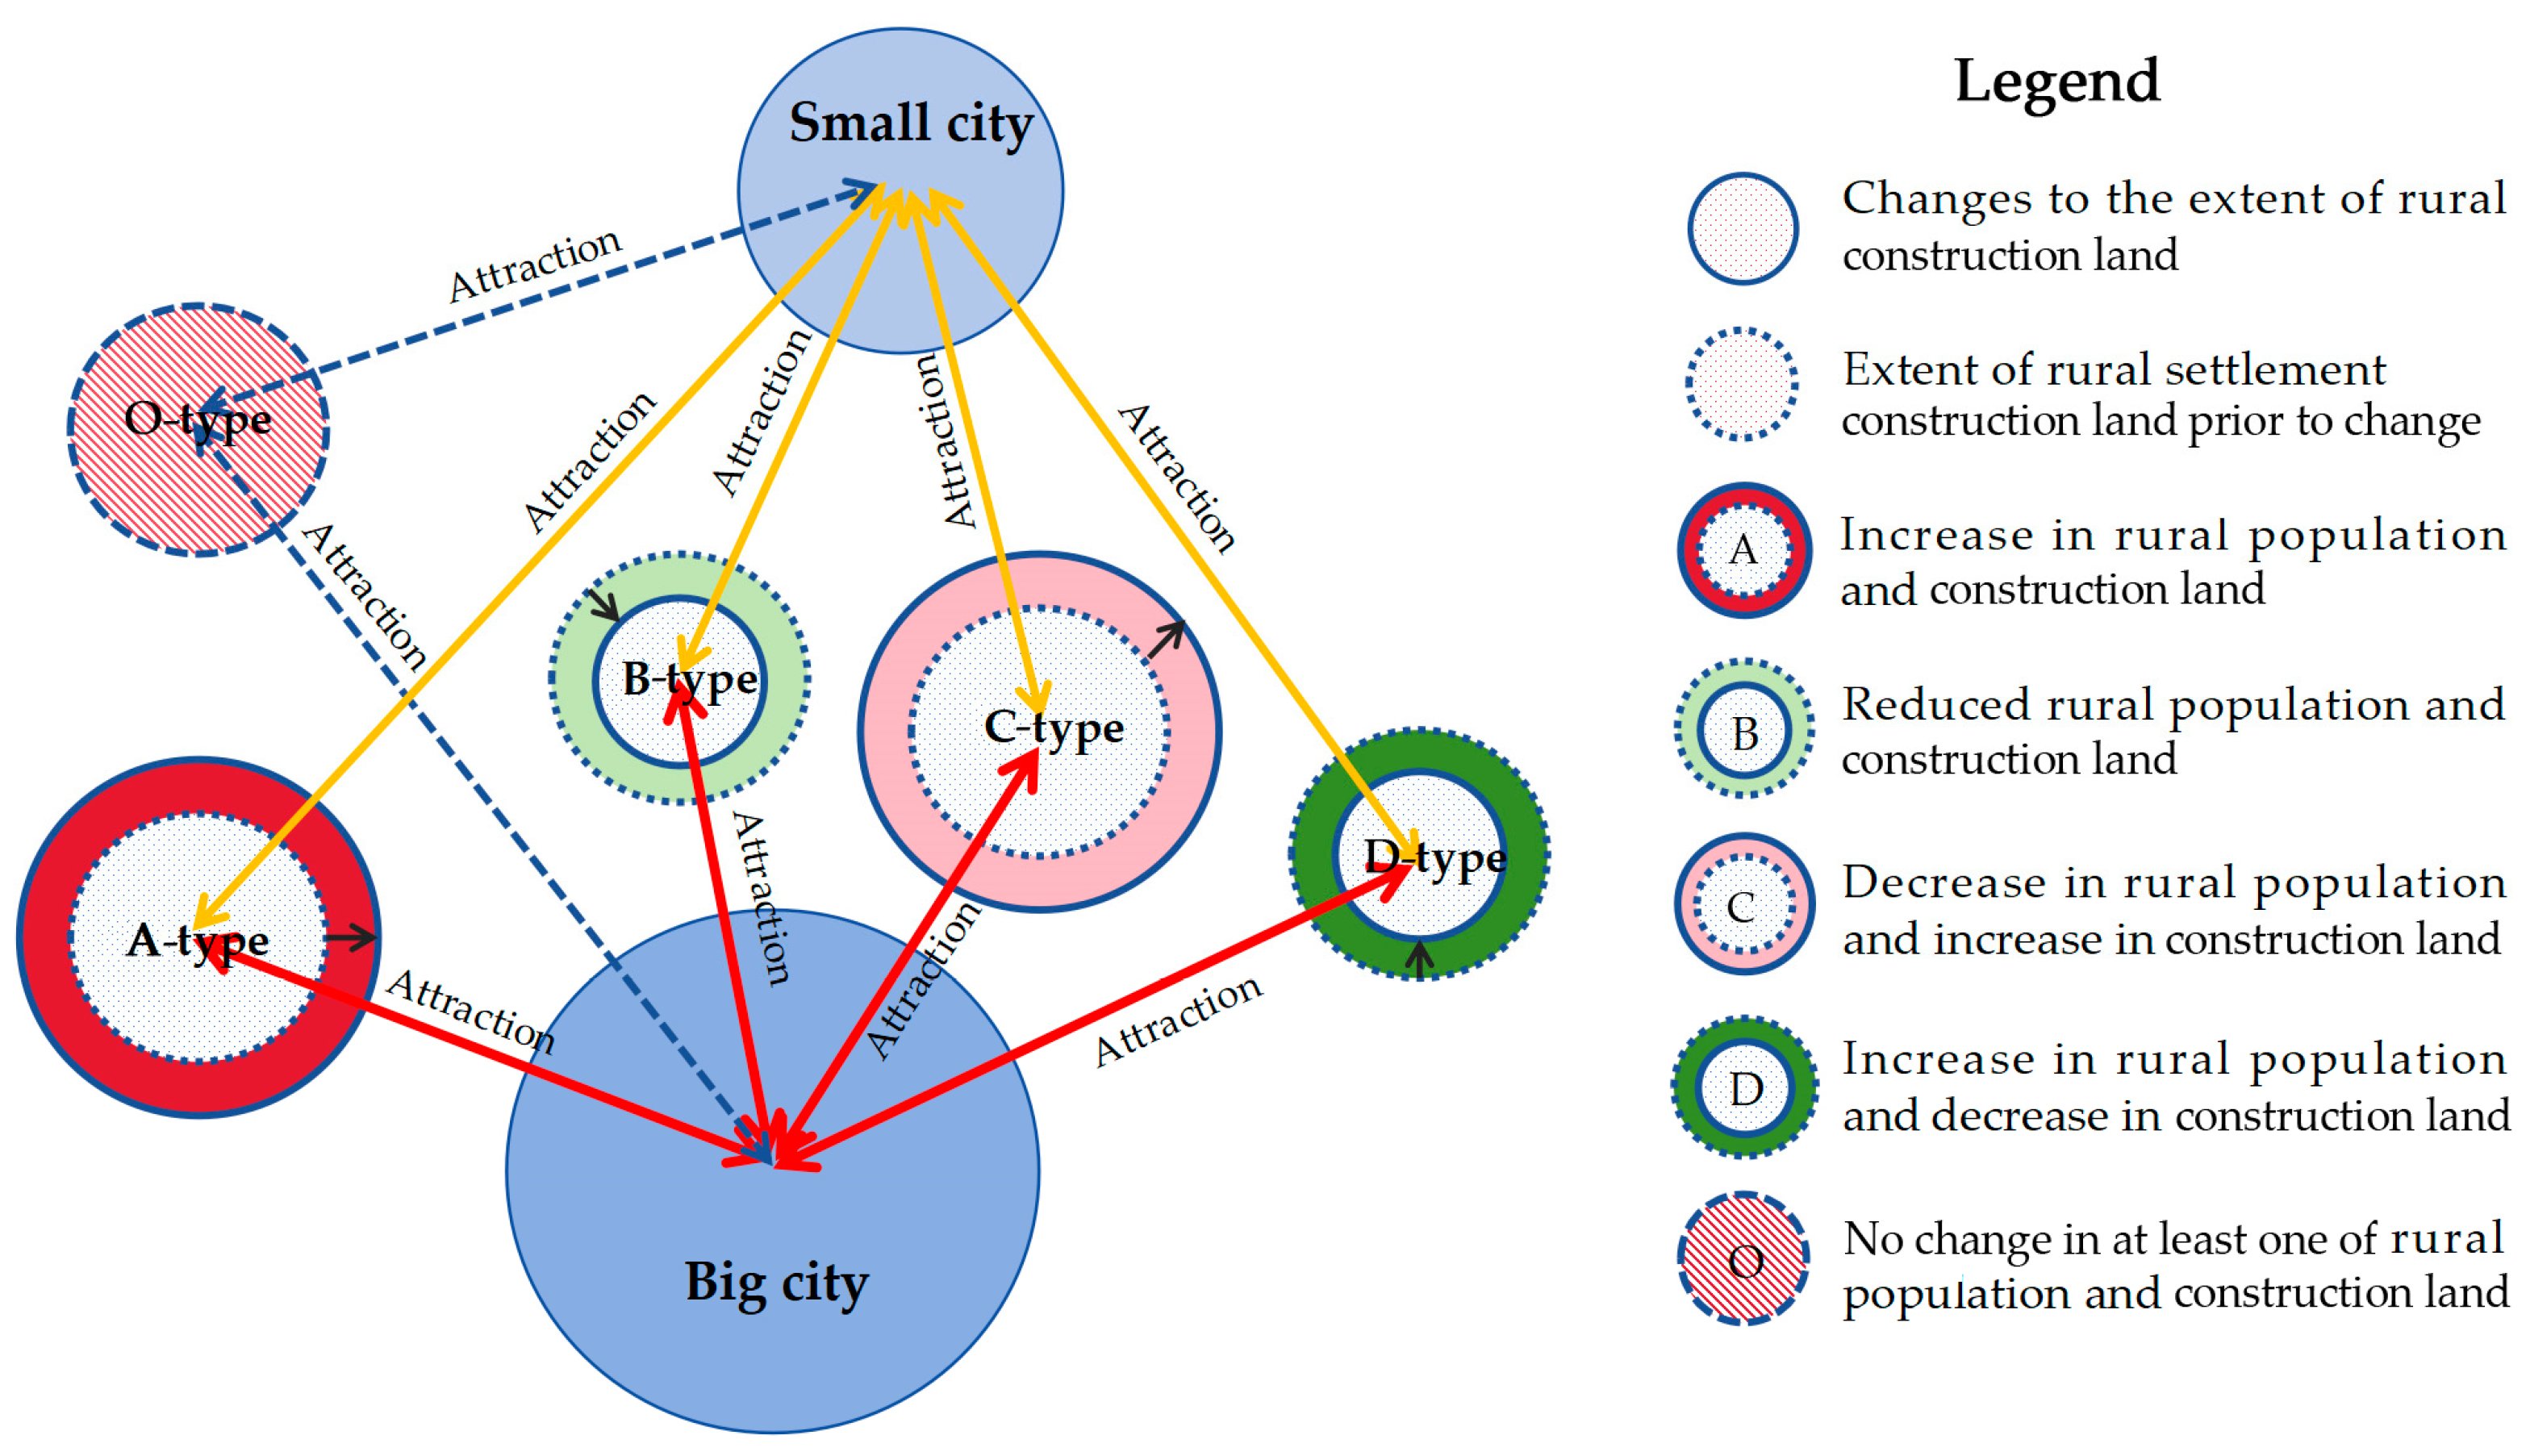
There are several types of coupling relationships in a given time period, depending on the trends in population and construction land use in the countryside (Table 3): the A-type refers to a simultaneous increase in the rural population and construction land area; the B-type refers to a simultaneous decrease in both the rural population and construction land area; the C-type refers to a decrease in the rural population and an increase in construction land area; and the D-type is an increase in the rural population and a decrease in construction land area. The other types (i.e., the O-type) could involve several situations, as follows. A: There is no change in the population, and construction land has formed in the middle of the population (Oa); thus, there is an inability to measure the coupling of change. Therefore, it is excluded from the scope of the study. B: The population changes, and the construction land area remains unchanged (Ob). C: The population remains unchanged while the construction land area changes (Oc). Since this study investigated the change trends in rural population and its construction land use and their coupling, cases B and C do not meet the requirements of this study and are not discussed (Figure 2).

Table 3.
Types of coupling relationships.
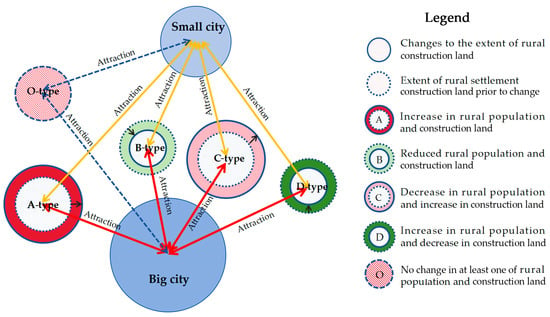
Figure 2.
Types of coupled relationship between population and construction land changes in the countryside.
If rural construction land is considered as a whole, the opposite of it is urban construction land. Each rural agglomeration is attracted to other urban agglomerations of different sizes and spatial locations, further generating the following coupling development types (TCD): A-type villages are likely to develop further into small towns in the future due to the simultaneous increase in both the population and construction land area, indicating that they have an advantage in terms of demographic attractiveness and land use plans and belong to the “agglomeration enhancement type”. B-type villages, due to their simultaneous decrease in both population and construction land area, indicate that their demographic attractiveness is declining, and their construction land use plans are in a state of austerity; therefore, they may gradually shrink or even disappear in the future, belonging to the “gradual extinction type”. C-type villages, whose populations are decreasing, have advantageous construction land schemes, so the efficiency of rural construction land use is low. These areas currently need to take the most measures to adjust and have the greatest potential to accommodate the population; thus, they should adopt active population and land use policies. They belong to the “hollowness aggravated type”. D-type villages have a growing population, but their construction land use programs are in a contractionary state. The efficiency of construction land use in the countryside is increasing, and it is not easy for them to accommodate an increasing population in the short term; thus, it is most important for them to focus on the maintenance and improvement in the living environment. They belong to the “internal intensification type”.
In this study, the coupling degree model was used to analyze the interactive dependence of the two elements, namely, the degree of population change, and the number of construction land changes in rural areas; the higher the degree of coupling, the more frequent the interaction between the two, and the higher the degree of their mutual influence and dependence. Under the coupling effect, the four types of TCD will have different impacts according to their coupling degree. Overall, with a higher degree of coupling, a change in one of the two factors will promote change in the other factor, which in turn produces an expansion effect, making the performance characteristics of the type more significant. With a rise in the degree of coupling in A-type villages, the rural area becomes more functionally capable of agglomeration and enhancement, and in the future, it may become a newly emerging small city or a satellite city of a large city. With a rise in the degree of coupling in B-type and C-type villages, the villages of the area die out more quickly, and may be annexed in the future. As the coupling degree rises in C-type villages, the rate of utilization of rural construction land in the area declines further, and the hollowing-out characteristics become more significant, thus requiring more attention and governance in the future. As the degree of coupling rises in D-type villages, the efficiency of the rural construction land in the area rises further, and the area is more likely to become the center of a regional township in the future.
We identified statistically significant hot spots and cold spots utilizing the hot spot analysis tool. We analyzed the spatial clustering characteristics of areas with high and low coupling values in the TCD. Then, we created standard deviational ellipses to summarize the spatial characteristics of H–VAE, utilizing the standard deviational ellipse tool. Please refer to ArcGIS 10.8 software for details about these two tools.
The coupling degree model is calculated through the following steps [37]:
- (1)
- Indicators are standardized in this study using the extreme variance method.The formula for the positive indicator is as follows:The formula for the negative indicator is as follows:
- (2)
- Indicator weights: Since only the coupling of two factors, population and land change, is considered (and both are of equal importance), the weight is set to 0.5.The 2016–2021 composite indicator of rural population change is as follows:U1 = 0.5 × n1The composite indicator of change in rural construction land use for 2016–2021 is as follows:U2 = 0.5 × n2
- (3)
- The relationship between the coupled effect of the amount of population change and the amount of construction land change in rural areas from 2016 to 2021 is calculated using the coupling degree (Cj), which is given by the following formula:
2.3.3. Modeling The Spatial Relationship between Urban and Rural Development
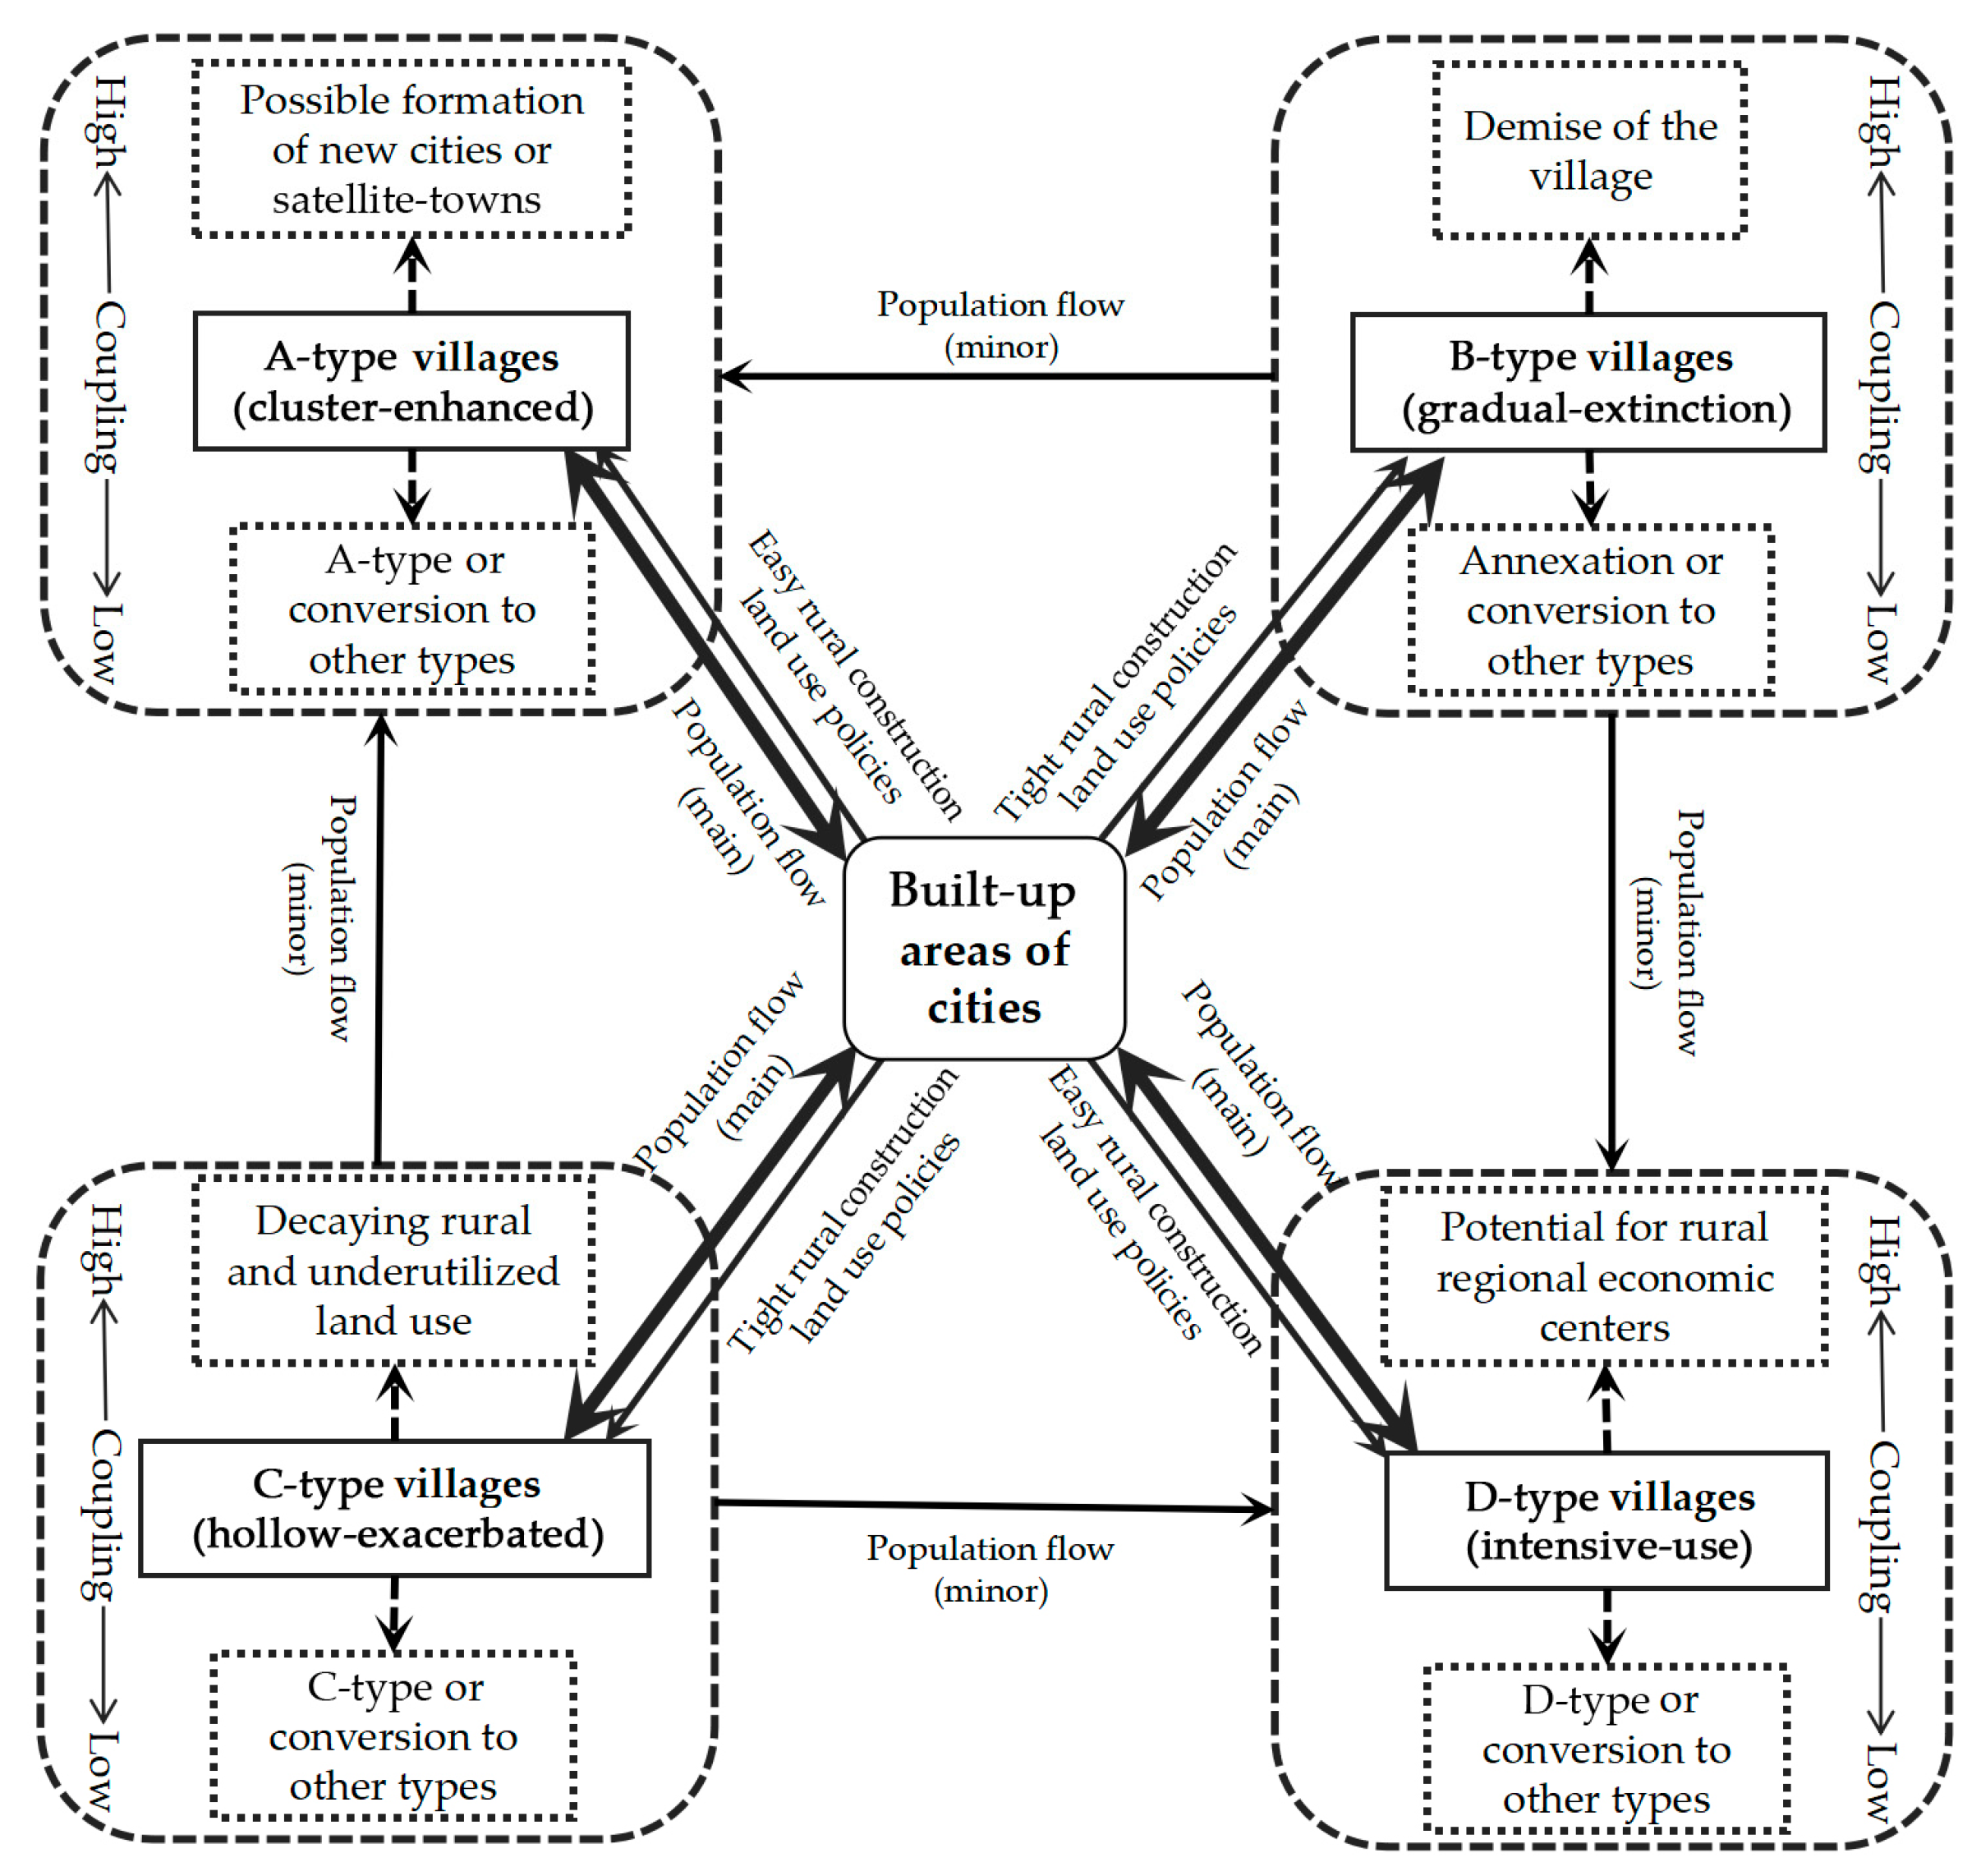
The interaction between the countryside and the city is manifested in the mutual attraction of urban and rural populations and the implementation of planning and utilization policies targeting rural construction land use indicators, including the adoption of loose or tight rural construction land use planning policies, which increase or decrease the amount of land available for building in the countryside, and land planning and utilization policies; these in turn use the agglomeration or dispersion of the population as an important reference. Therefore, cities have different attracting effects on villages in different states of development and are positively correlated with the overall attracting capacity of the city itself, while the closer the construction land is spatially to the city and the stronger the overall attraction of the city itself, the more likely it is to attract populations. Based on the TCD analysis, the framework of the future urban–rural development relationship model is further explored in the context of urban attraction and the characteristics of coupled changes in rural population and construction land use (Figure 3).
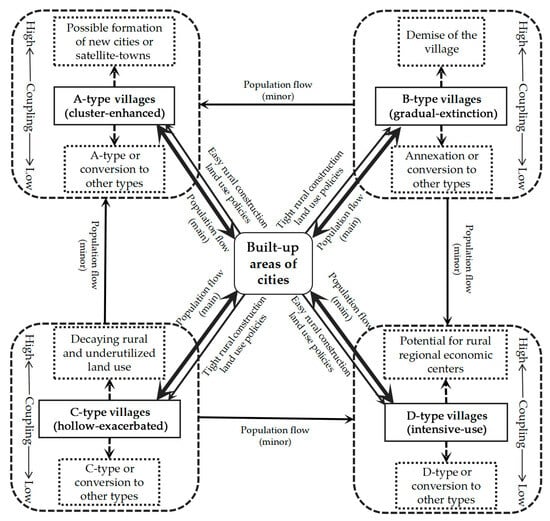
Figure 3.
Model of the relationship between urban and rural development based on the coupled characteristics of the rural population and construction land framework.
The comprehensive attractiveness of a city is a characteristic exhibited by the city over a certain period of time. In this research, we selected 19 indicators Qij (Table 1) to evaluate the comprehensive attractiveness of each prefecture-level city in Heilongjiang Province in 2021. Combined with the characteristics of the coupled changes in rural population and residential use from 2016 to 2021, the model for determining the attractiveness of urban and rural development is based on the gravity model [38].
The calculation steps and specific formulae are as follows:
- (1)
- Calculating the combined attractiveness of cities (Cj):
- a.
- Indicator assimilation and standardization: a total of 19 indicators are assimilated and standardized in this study using Equations (1) and (2).
- b.
- Calculation of indicator weights wj [39]: in this study, the entropy value method is used to calculate the indicator weights.and m is the number of prefecture-level citiesand n is the number of indicators
- c.
- The weighted normalization matrix, Zij, is obtained:
- d.
- The composite index for each evaluation object is obtained:
- (2)
- Modeling Rural–Urban Development Force
Urban–rural development force (URD) is used to measure the size of the force needed to form a new pattern of urban–rural development under the coupling effect of urban attraction Cj and rural population and construction land Ci. The spatial distances considered by this force are distinguished from the actual distances that a person travels through and from a geographical surface and can be understood as the attracting effect of the destination of a population movement on the behavior of the population movement. When the attractiveness of the destination is sufficient, people will adopt appropriate travel, settlement, work, and other behaviors to achieve this.
In this research, we constructed the attraction model of URD based on the gravitational formula of Newtonian mechanics and with reference to the spatial network relation model [38]. rij is proportional to Ci and Cj and inversely proportional to the spatial distance between urban and rural areas, dij.
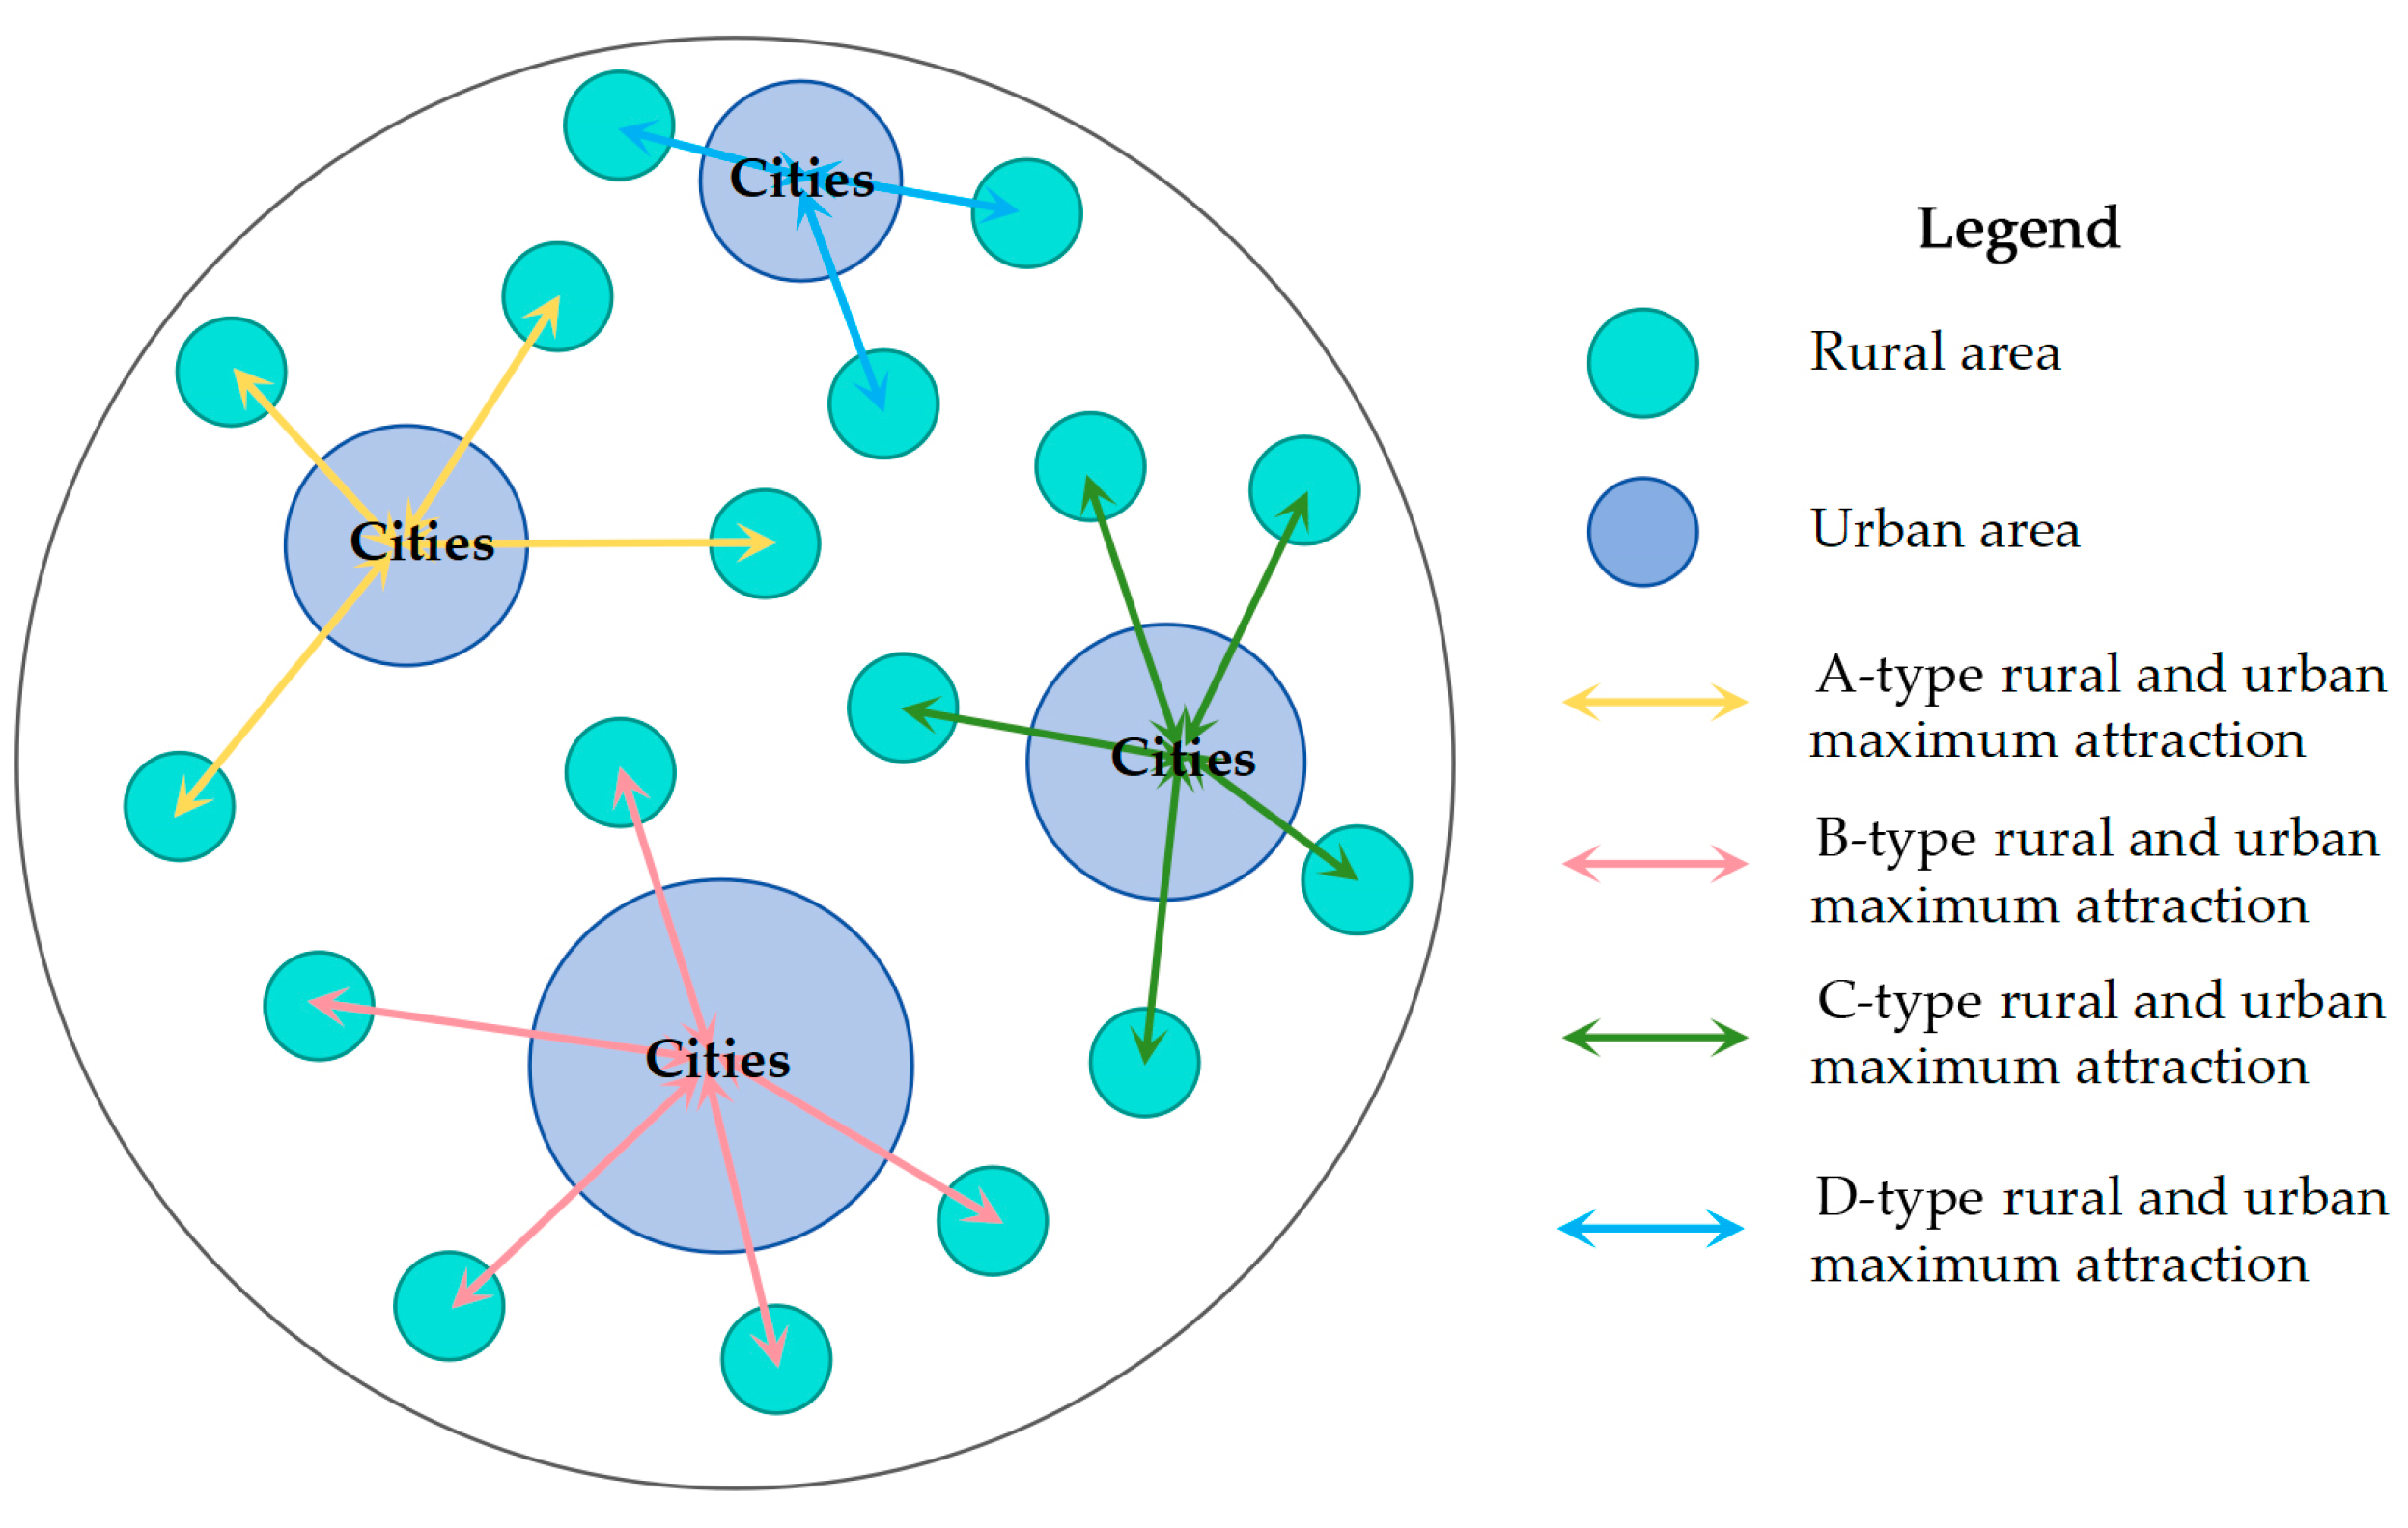
The attraction of urban–rural development exists in each township and each city, but the largest force (maxRj) has the most important effect on the formation of the spatial pattern of future urban–rural development (Figure 4).
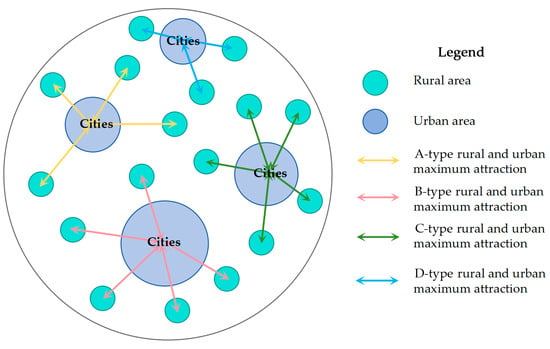
Figure 4.
TCR spatial relationship model for urban–rural development.
3. Results
3.1. Patterns of Spatial and Temporal Changes in Population Size and Construction Land Use in Rural Areas
3.1.1. Spatial and Temporal Patterns of Population Change in Rural Areas
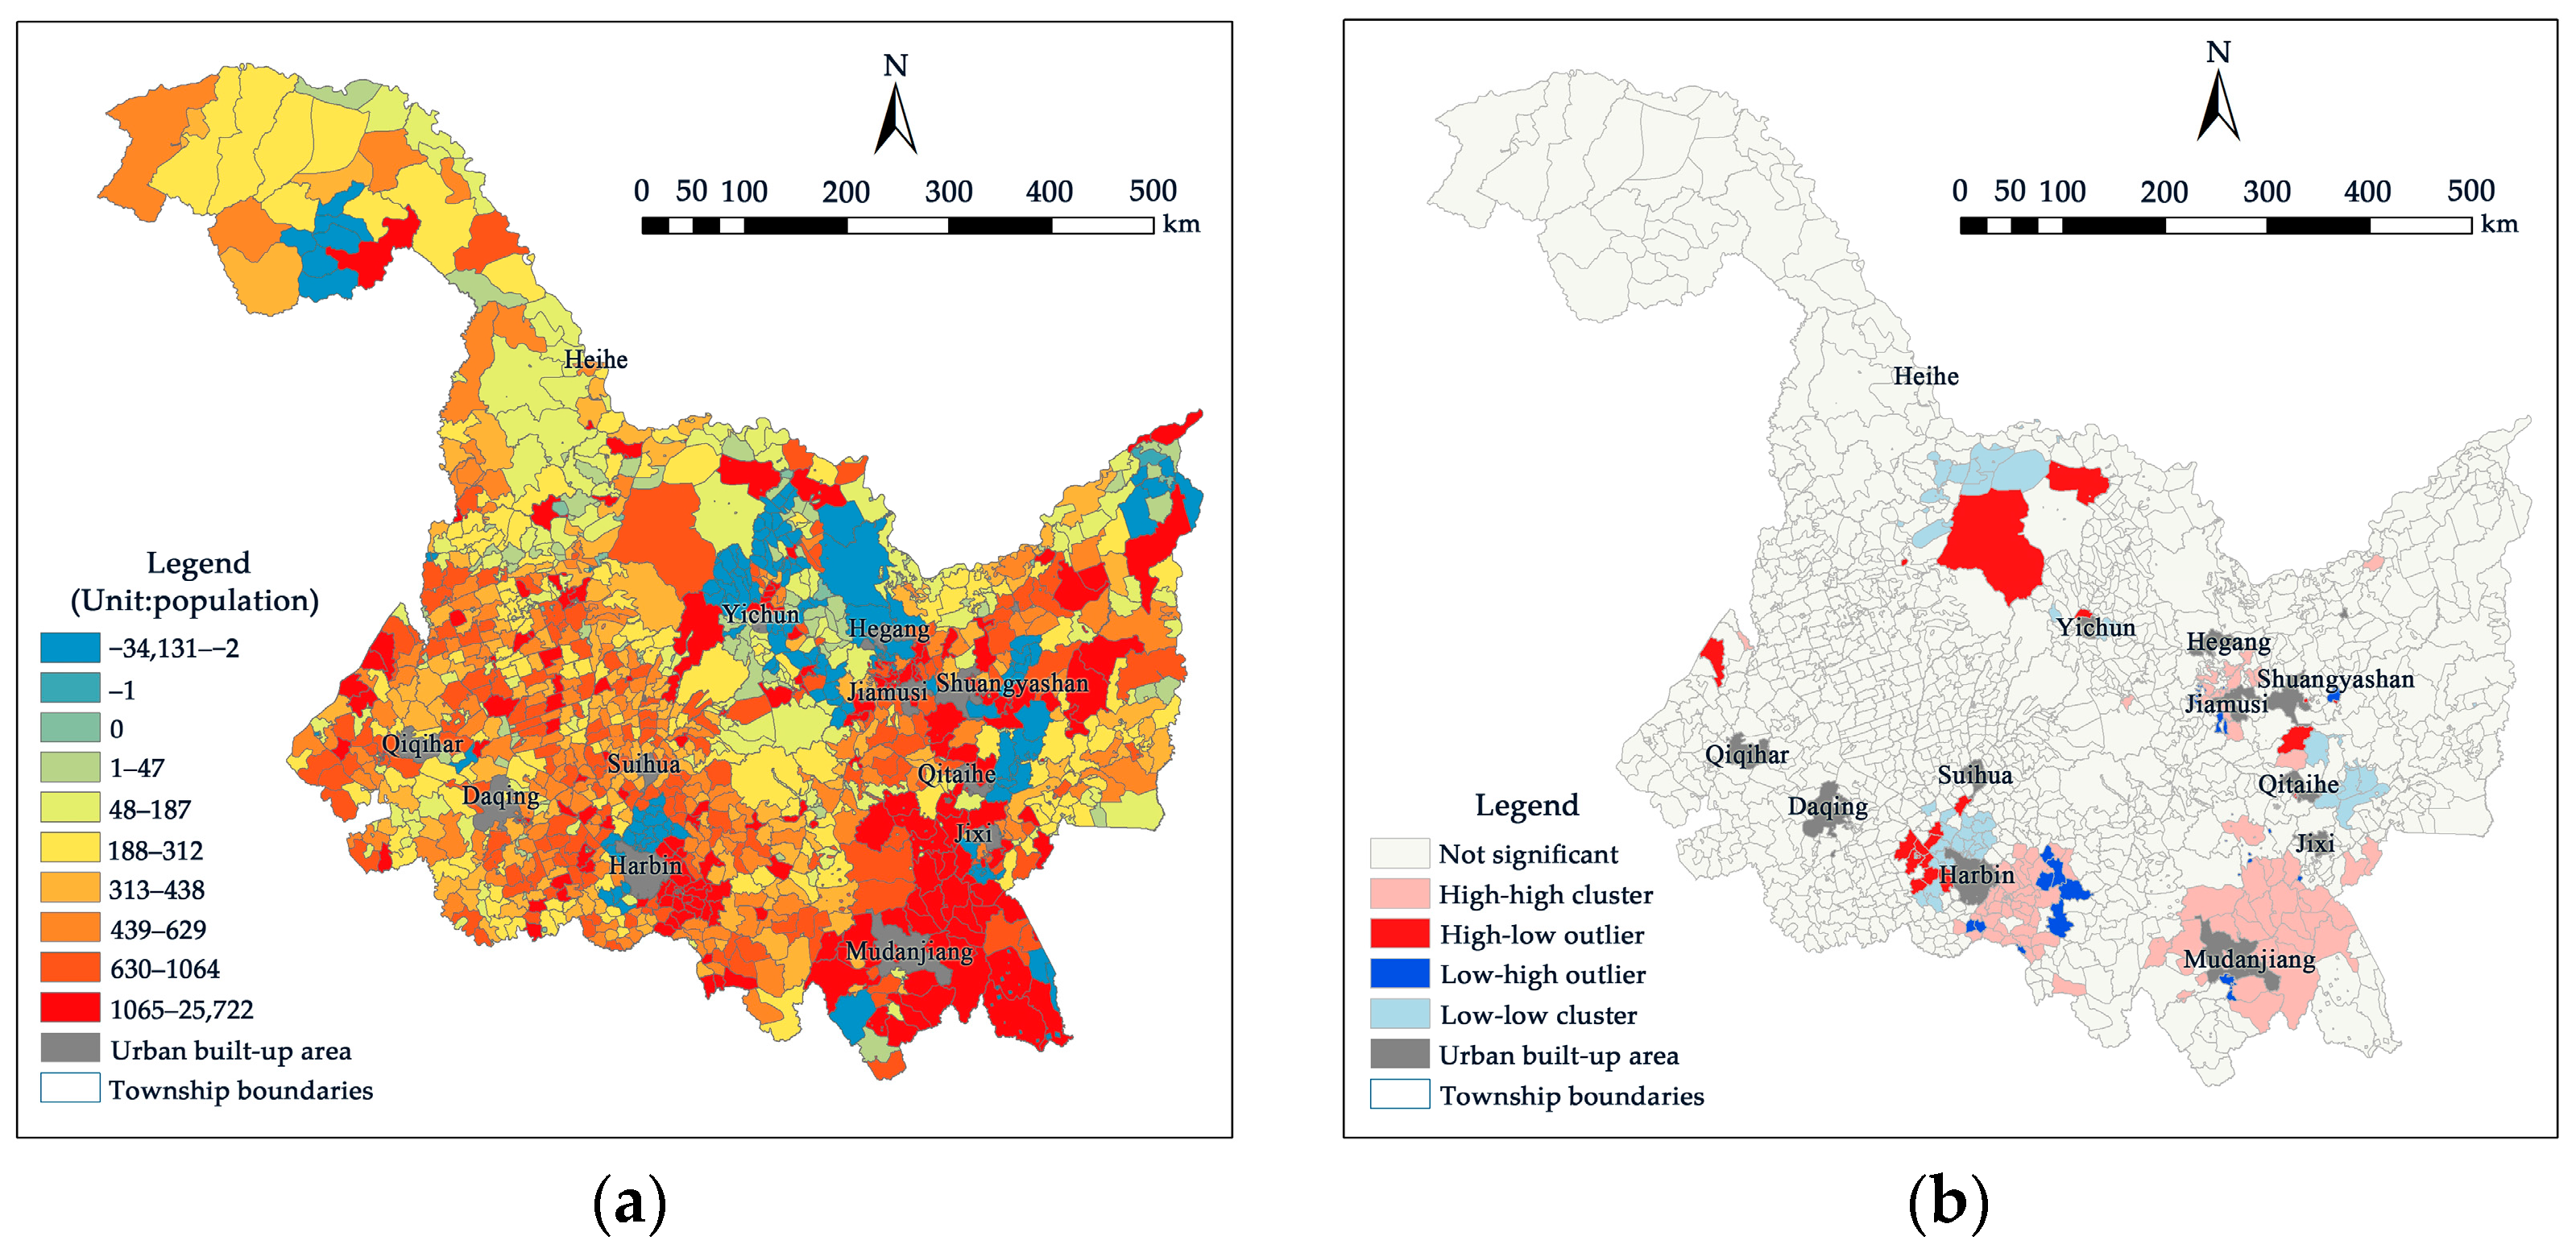
In 2016–2021, 1137 out of 1465 townships in the study area underwent an increase in total population. This accounts for 77.61 per cent of the total number of townships, with a total increase of 880,006 people. There were 153 townships in a state of decline, accounting for 13.46 per cent of the total number of townships, with a total decline of 291,192 people. The township with the largest increase in population had an increase of 25,722, and the township with the largest decrease in population had a decrease of 34,131.
In terms of spatial clustering characteristics, high-value zones were mainly distributed in the southeastern part of the study area, specifically in the southeastern part of Harbin City, as well as in the northwestern part of Mudanjiang City. Low-value areas are mainly distributed in the northern part of the study area, the northwestern part of Harbin City, as well as in Qitaihe and Shuangyashan. High–low outliers (high-value areas surrounded by low-value areas) are mainly distributed in the northwestern part of Yichun, in the Zhanhe Forestry Bureau and Xiangyang Township, as well as in the western part of Harbin City in the areas of Haicheng Township, Jiangjia Township, and Kangrong Township. Low–high outliers (low-value areas surrounded by high-value areas) are mainly distributed in the eastern part of Harbin City, in Sanbaosi Township. Low-value zones are mainly distributed in Sanbao Township and Capeshan Township in the eastern part of Harbin City. Overall, the areas showing agglomeration characteristics are mainly distributed in the areas of Xiaoxing’anling and Zhangguangcailing in a ring-like distribution (Figure 5).
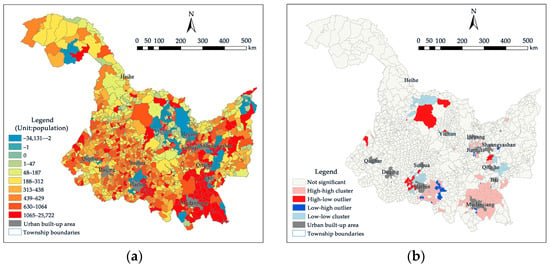
Figure 5.
(a) Rural population dynamics, 2016–2021; (b) cluster characteristics of rural population change, 2016–2021.
The results indicate that during the period of 2016–2021, the population activities in the rural areas of the study area generally showed an increase, indicating great potential economic value for the population. The future development of rural construction land is particularly important, as population activities concentrate in these areas.
3.1.2. Spatial and Temporal Patterns of Construction Land in Rural Areas
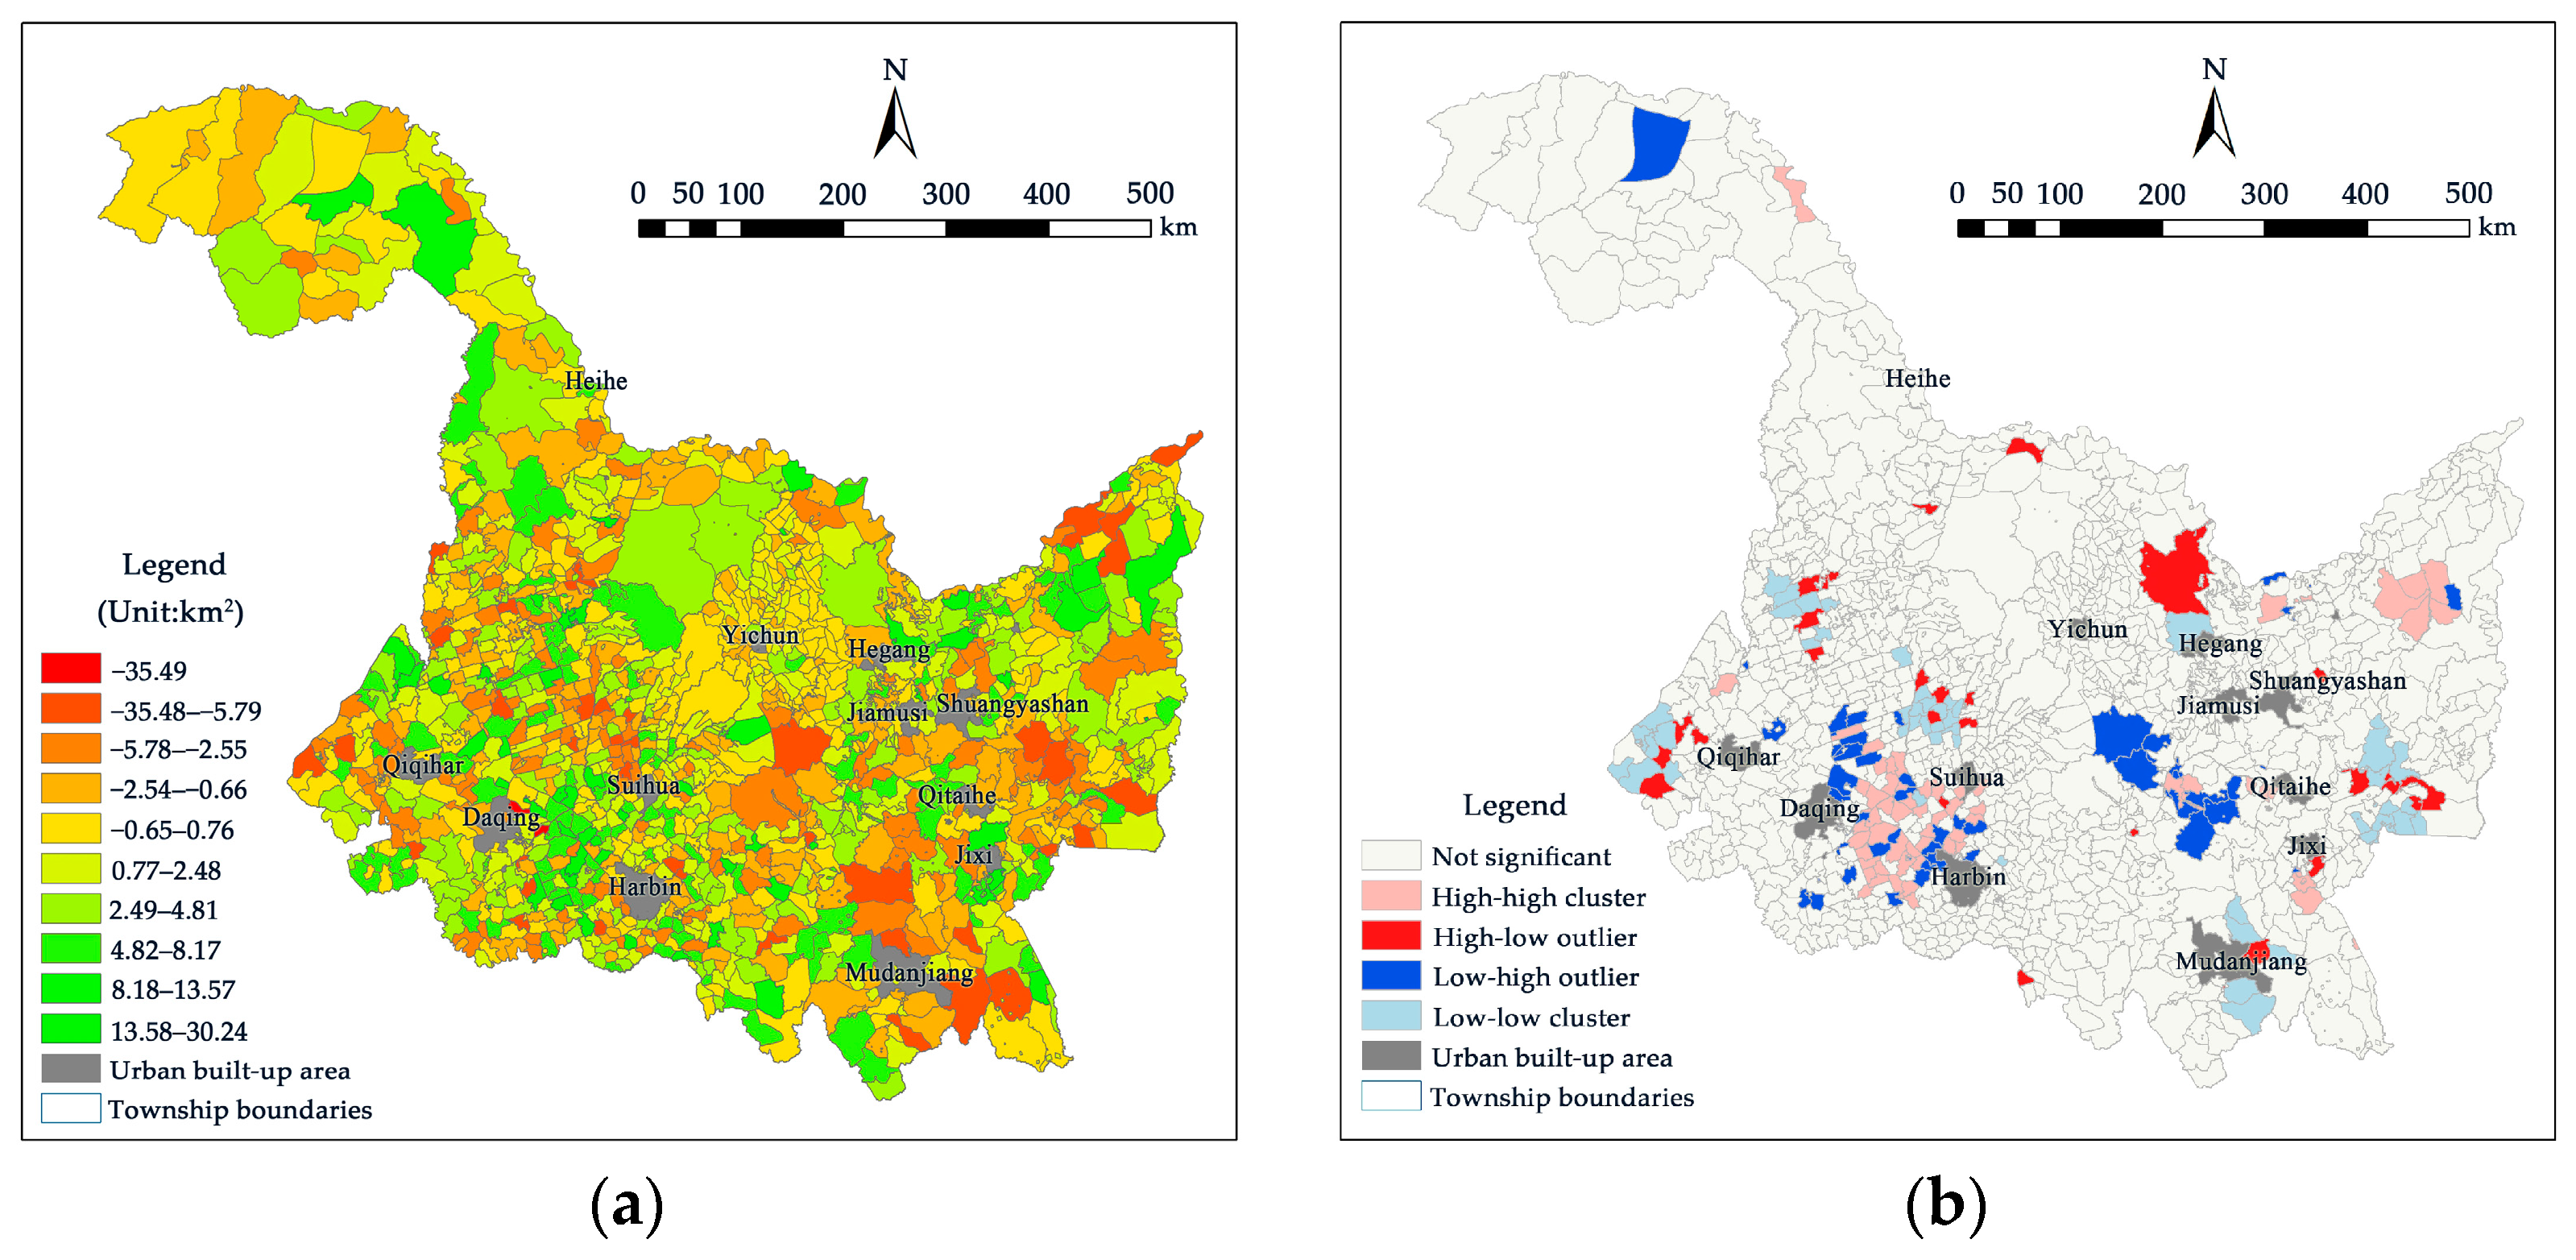
From 2016 to 2021, 848 out of 1465 townships in the study area showed an increase in construction land area, accounting for 57.88% of the total number of townships, with a total increase of 2285.23 km2. There were 533 townships in a state of decline, accounting for 36.38% of the total number of townships, with a total decline of 1039.57 km2, indicating a growing trend in the area of construction land.
In terms of spatial clustering characteristics, the high-value areas are mainly distributed in the southeastern and northwestern regions of the study area, specifically in the area surrounded by Harbin City, Daqing City, Suihua City, and the northwestern part of Shuangyashan City. Low-value areas are scattered mainly in the western and northern parts of Qiqihar, northern Suihua, northern Hegang, eastern Qitaihe, and around Mudanjiang. High–low outliers (high-value areas surrounded by low-value areas) are mainly in the northern part of Hegang. Low–high outliers (low-value areas surrounded by high-value areas) are mainly in the Daxing’anling region of Walagan Township and the forest areas of Xiaoxing’anling and Zhangguangcailing in the western part of Qitaihe City (Figure 6), suggesting that changes in construction land are characterized by spatial clustering.
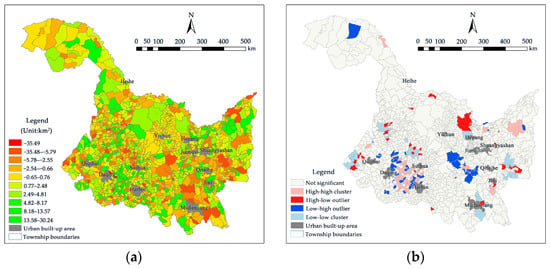
Figure 6.
(a) Change in rural construction land use, 2016–2021; (b) cluster characteristics of rural construction land changes, 2016–2021.
3.2. Characteristics of the Coupled Development of the Population and Construction Land Use in Rural Areas
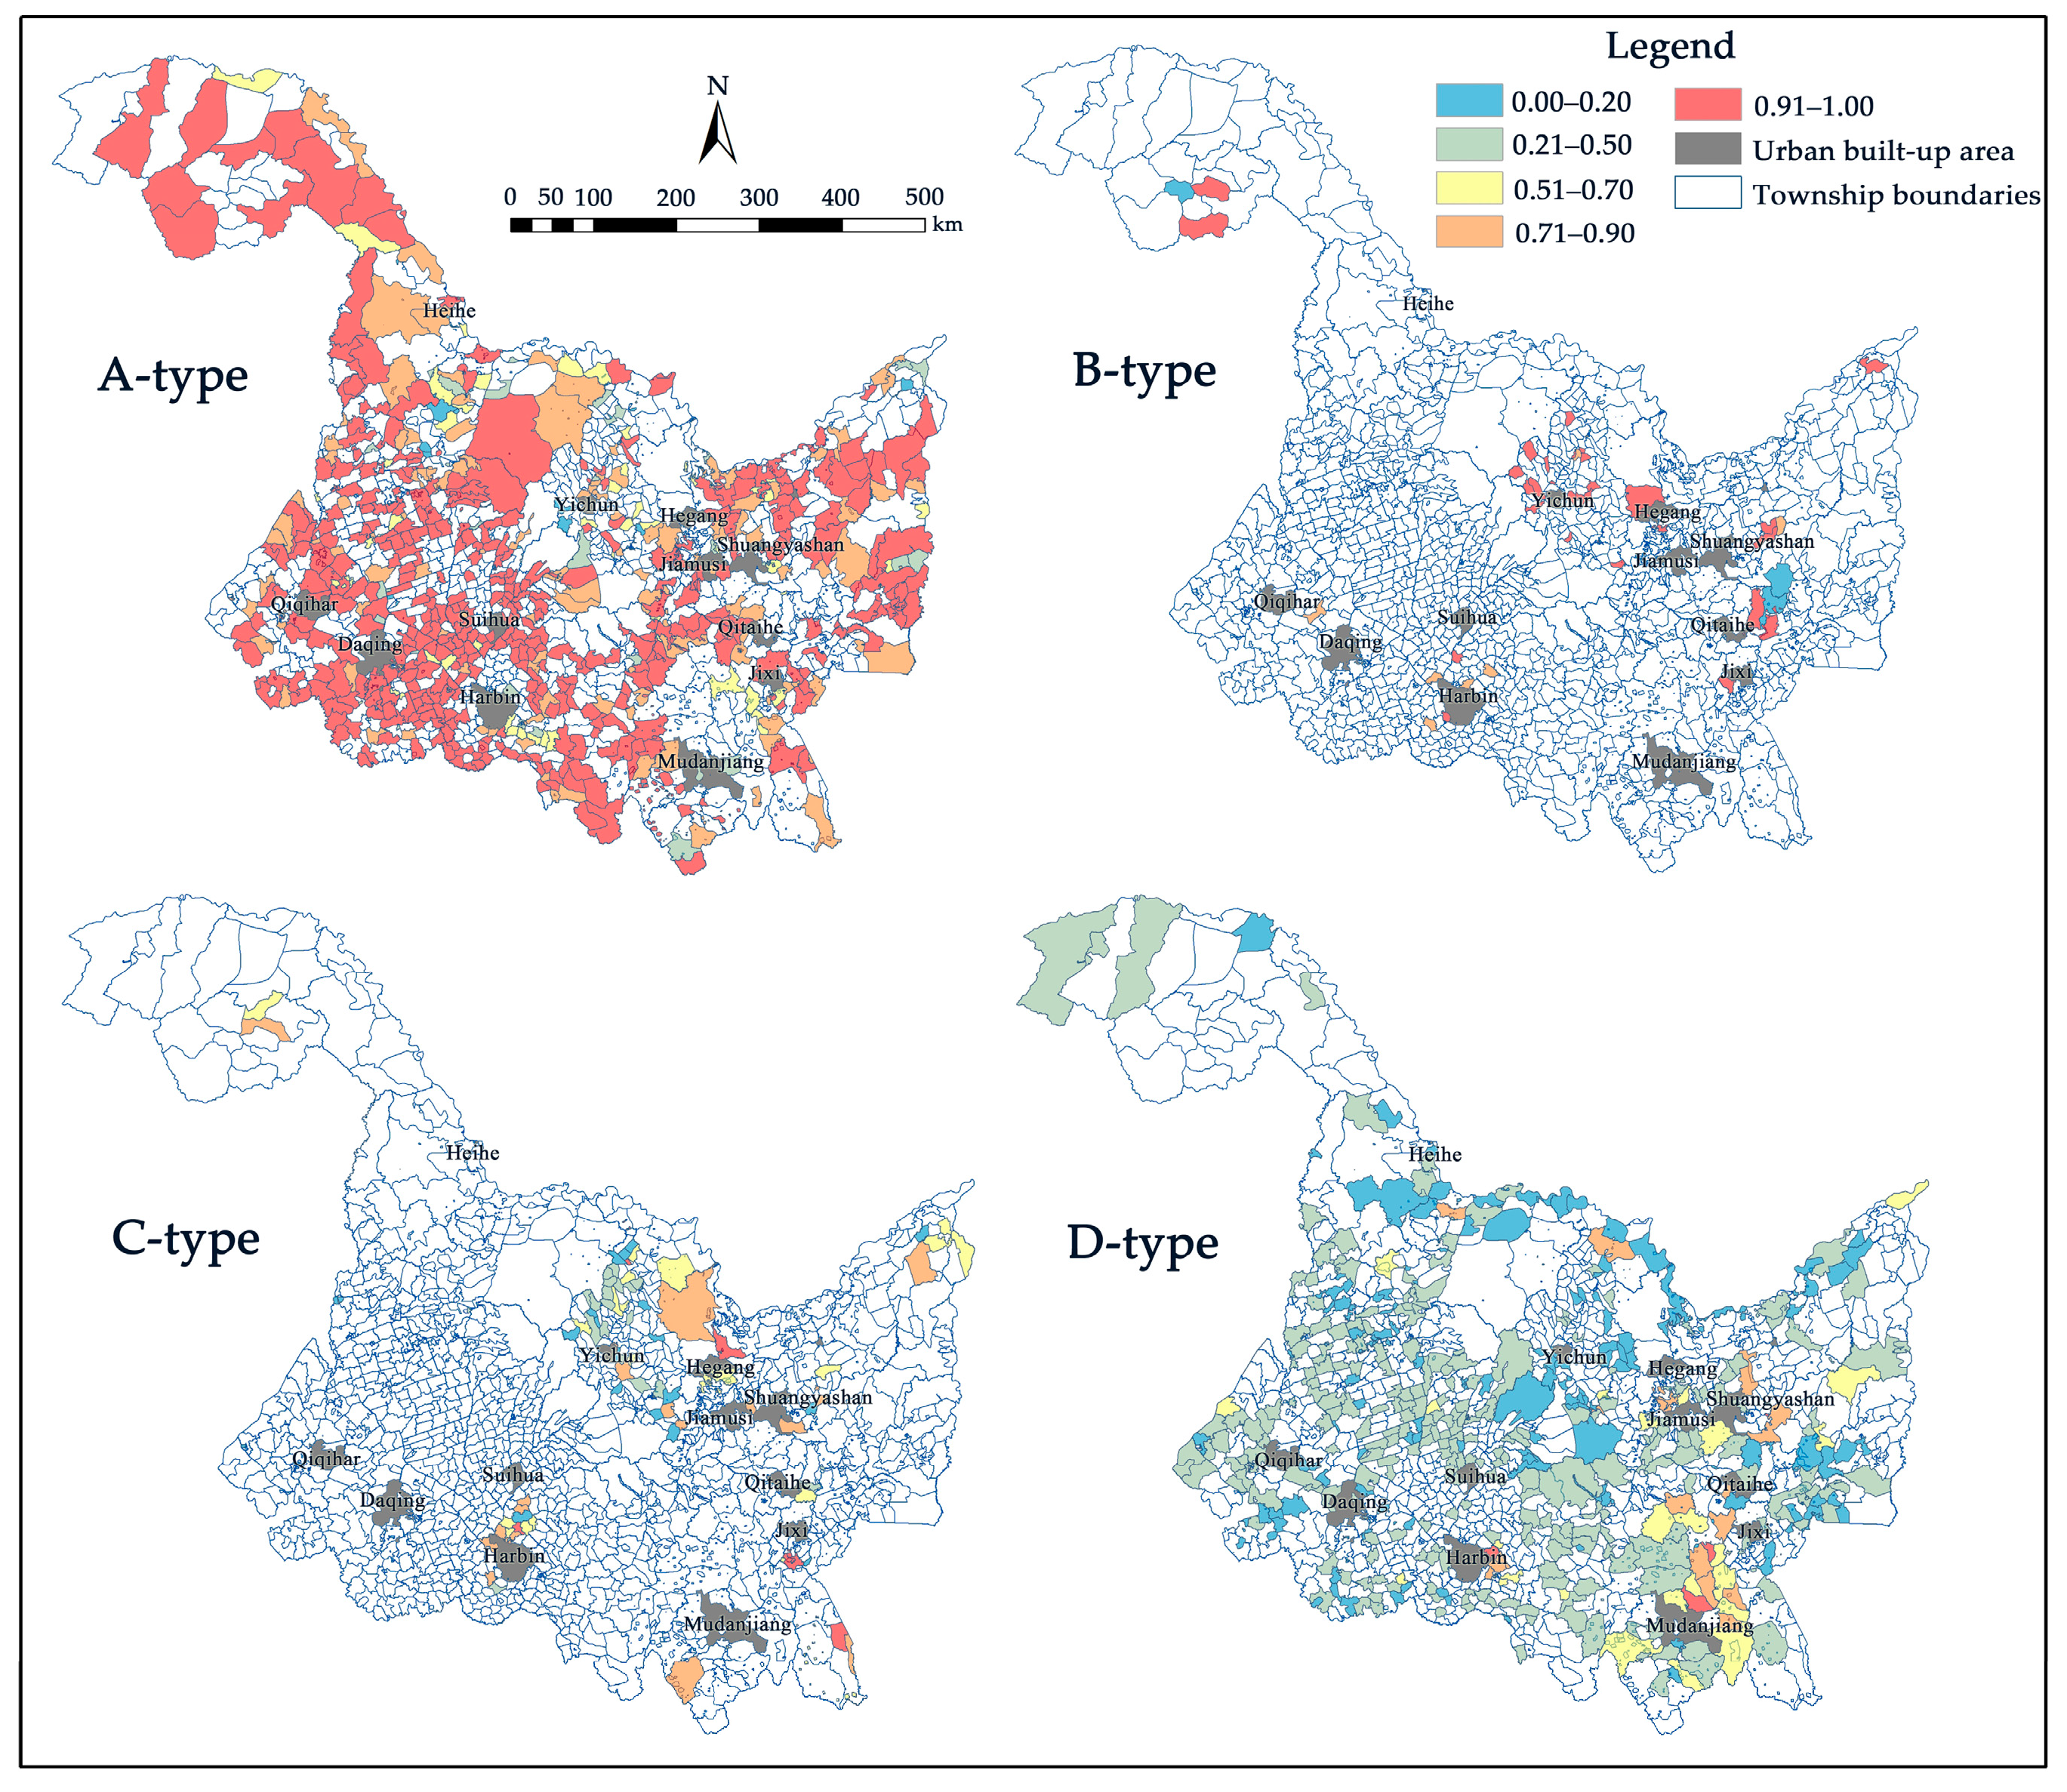
According to the TCD results based on the spatial and temporal changes in the rural population and construction land in the study area from 2016 to 2021, there are 658 A-type townships, 47 B-type townships, 100 C-type townships, and 447 D-type townships. This indicates that the “agglomeration and upgrading type” and “internal intensification type” are the main types of rural human construction land development in the study area, and they are also the main relationships in urban–rural development that will transpire in the future.
The calculation of the degree of coupling between different types of development showed that the coupling value of A-type villages is generally high, and the proportion of townships with a coupling degree greater than 0.8 is 72.95%; meanwhile, the proportion of townships with a coupling degree lower than 0.2 is only 6.84%, indicating that this type of township has a stronger ability to develop in the future. The B-type coupling value had the highest proportion of all the types, and the proportion of townships with a coupling degree greater than 0.8 was 93.627%, which indicates that the future development trend appearing in this type of township is one of rapid decline. C-type coupling values are more evenly distributed, with 16% of townships larger than 0.8, 26% of townships in [0.8, 0.6), 28% of townships in [0.6, 0.4), and 23% of townships smaller than 0.2. This indicates that C-type townships are less likely to intensify and will instead hollow out in the future, being more likely to shift to other types. The D-type coupling value is generally low, with 84.12% of townships having a coupling degree of less than 0.4 and only 2.01% of townships having a coupling degree of more than 0.8. This indicates that it is more difficult for D-type townships to continue to increase the intensity of their use of construction land in the future (Figure 7).
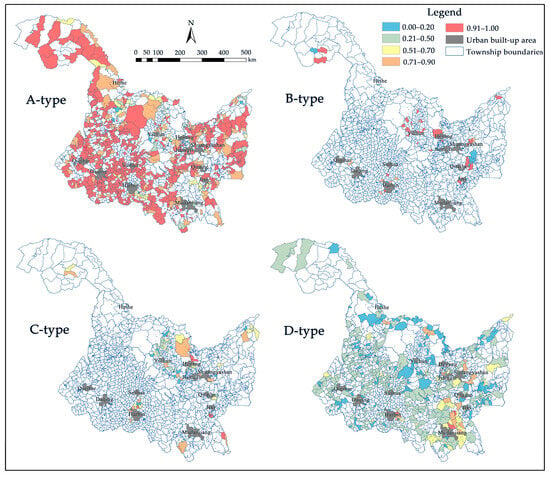
Figure 7.
Characteristics of spatial distributions of TCD coupling degrees.
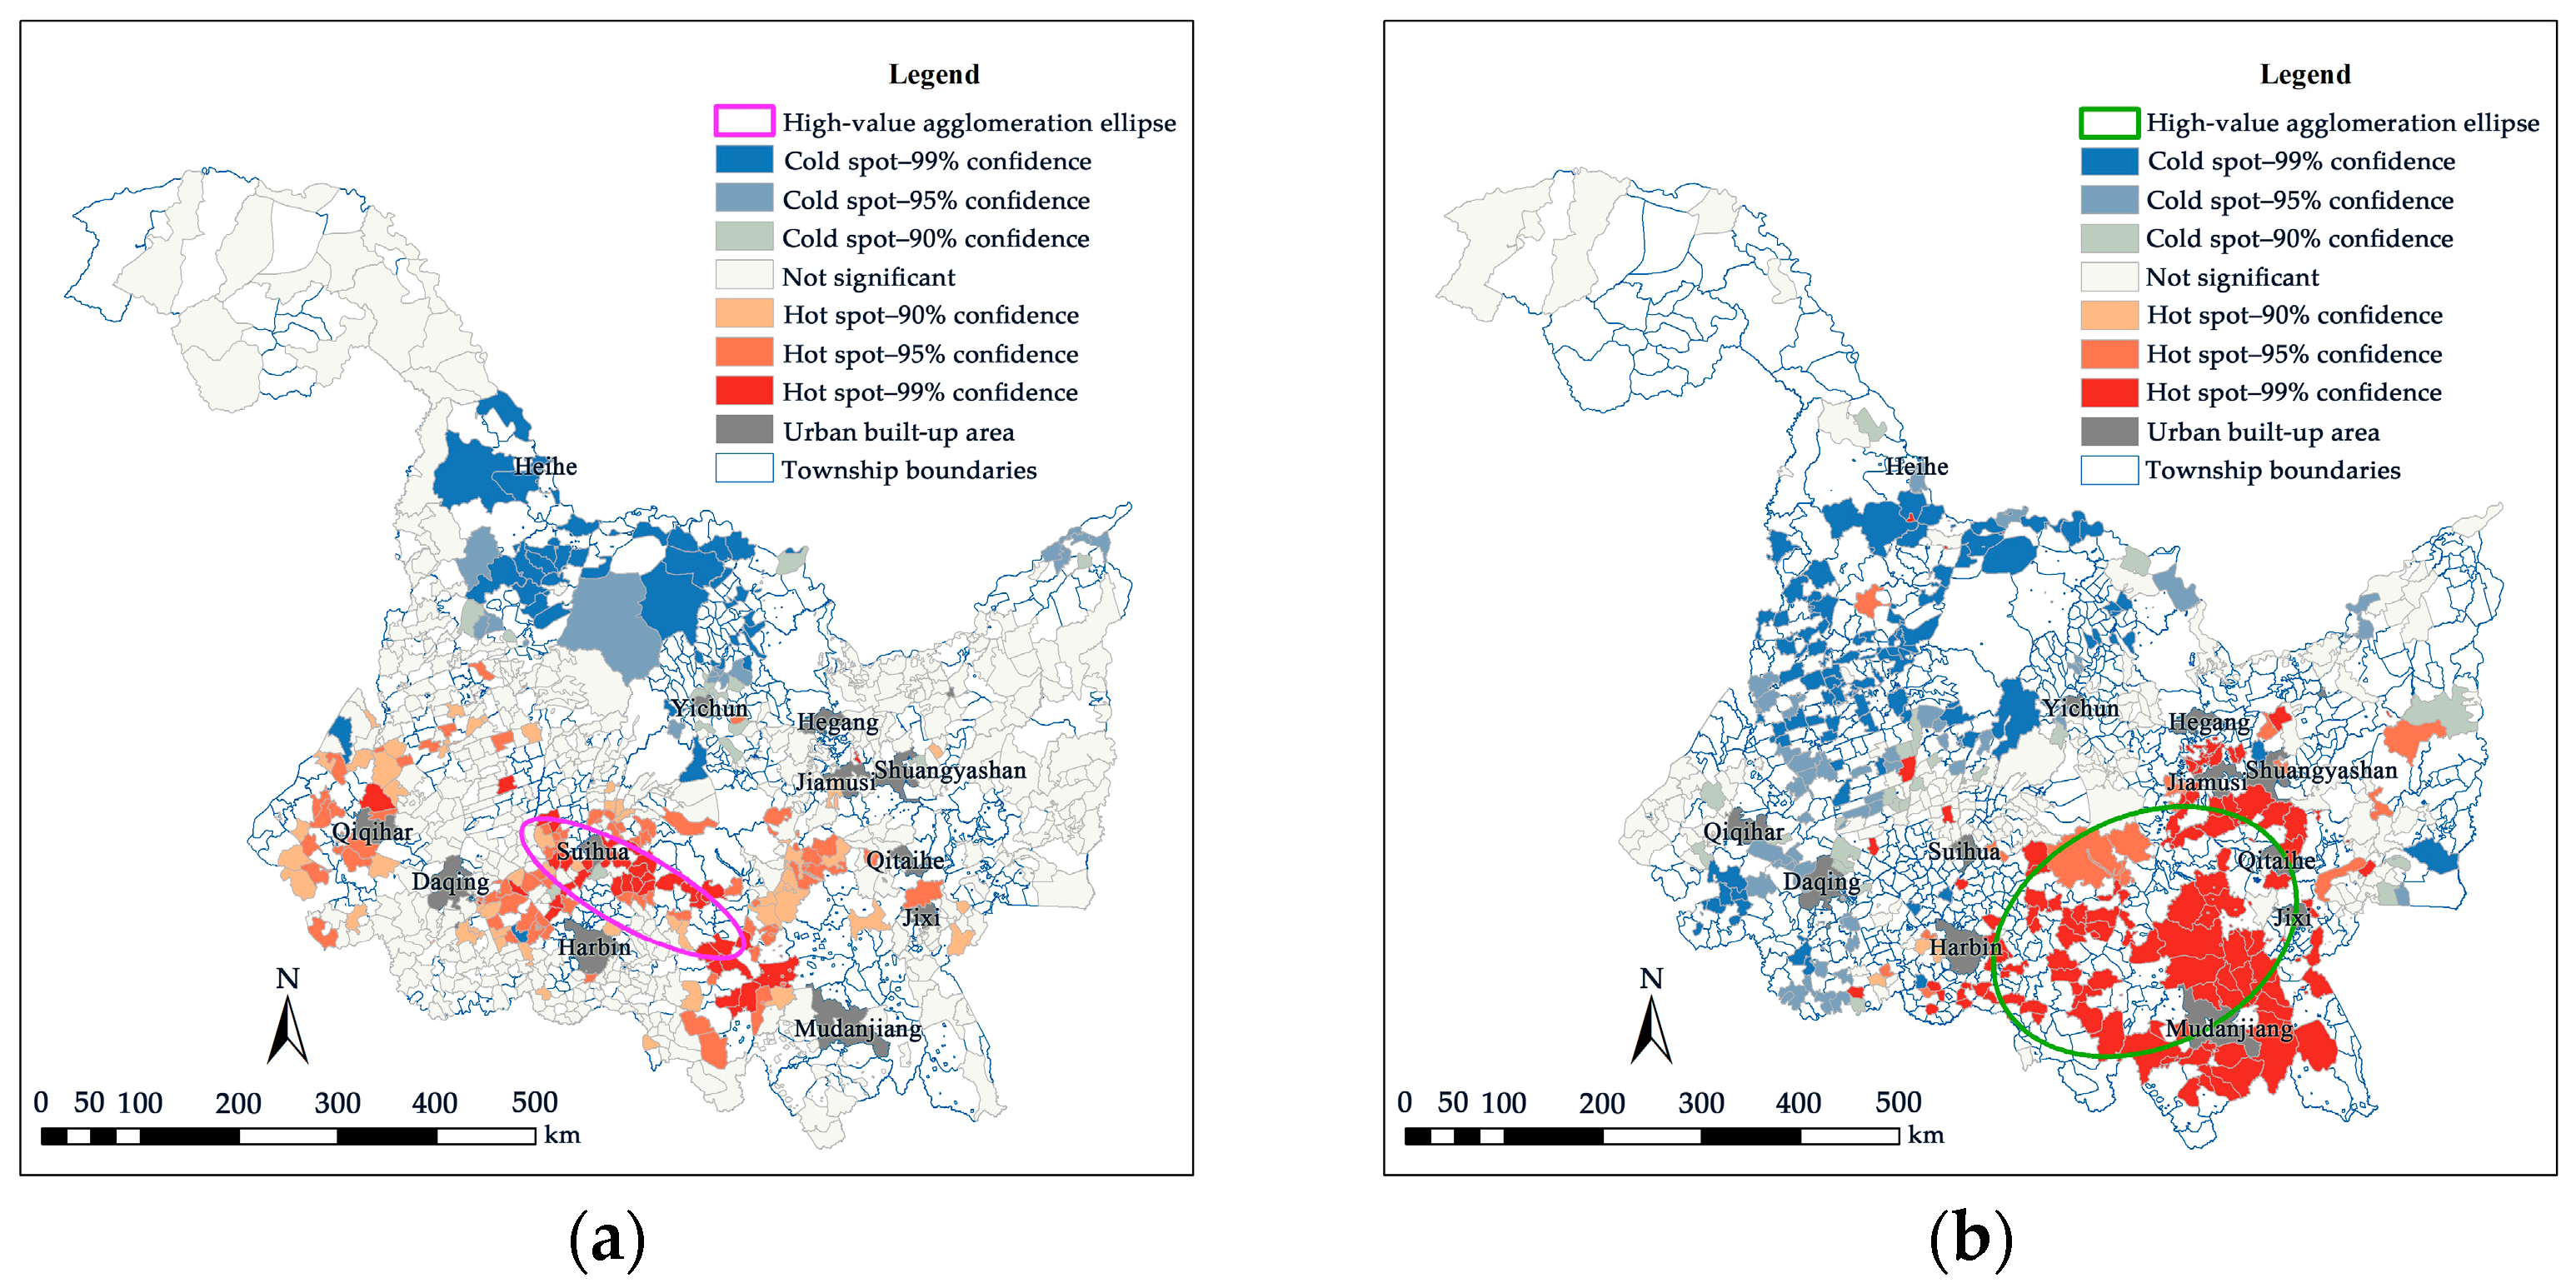
The A-type and D-type couplings are characterized by significant spatial agglomeration, with low values in the north and high values in the south. The highest value for the A-type is concentrated in the area surrounded by “Harbin–Suihua–Mudanjiang”, which is the area that is most likely to produce new cities or satellite cities in the future. The standard deviation ellipse shows a “northwest–southeast” distribution, which is the development axis of emerging cities. According to the standard deviation ellipse, the highest value of the D-type coupling is concentrated in the area surrounded by “Harbin–Mudanjiang–Jixi–Qitaihe” and has a “northeast–southwest” distribution. This area represents the development belt of the core of the township (Figure 8).
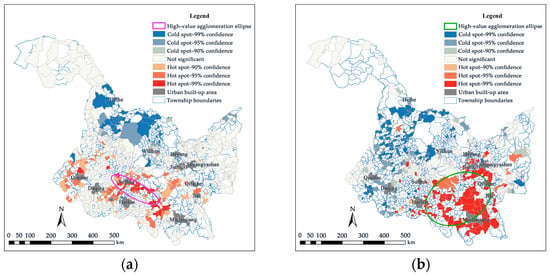
Figure 8.
(a) A-type agglomeration characteristics; (b) D-type agglomeration characteristics.
3.3. The Spatial Patterns of Urban–Rural Development
3.3.1. Calculation of the Comprehensive Urban Attractiveness of the Study Area
The results of the calculation of the comprehensive attractiveness of the 12 prefecture-level cities in the study area show that Harbin is the most attractive city, with a value of 0.7498. The second most attractive city is Daqing, with an attractiveness value of 0.5812. The third most attractive city is Mudanjiang, with an attractiveness value of 0.3204; this is similar to Qiqihar, which had an attractiveness value of 0.3050 (Table 4). This is an indication of the ability of the built-up areas of the 12 prefectural cities in the study area to attract populations to the study area as a whole, reflecting their ability to influence regional urban–rural relations.

Table 4.
Combined urban attractiveness values for the study area.
3.3.2. Calculation of Rural–Urban Development Forces in the Study Area
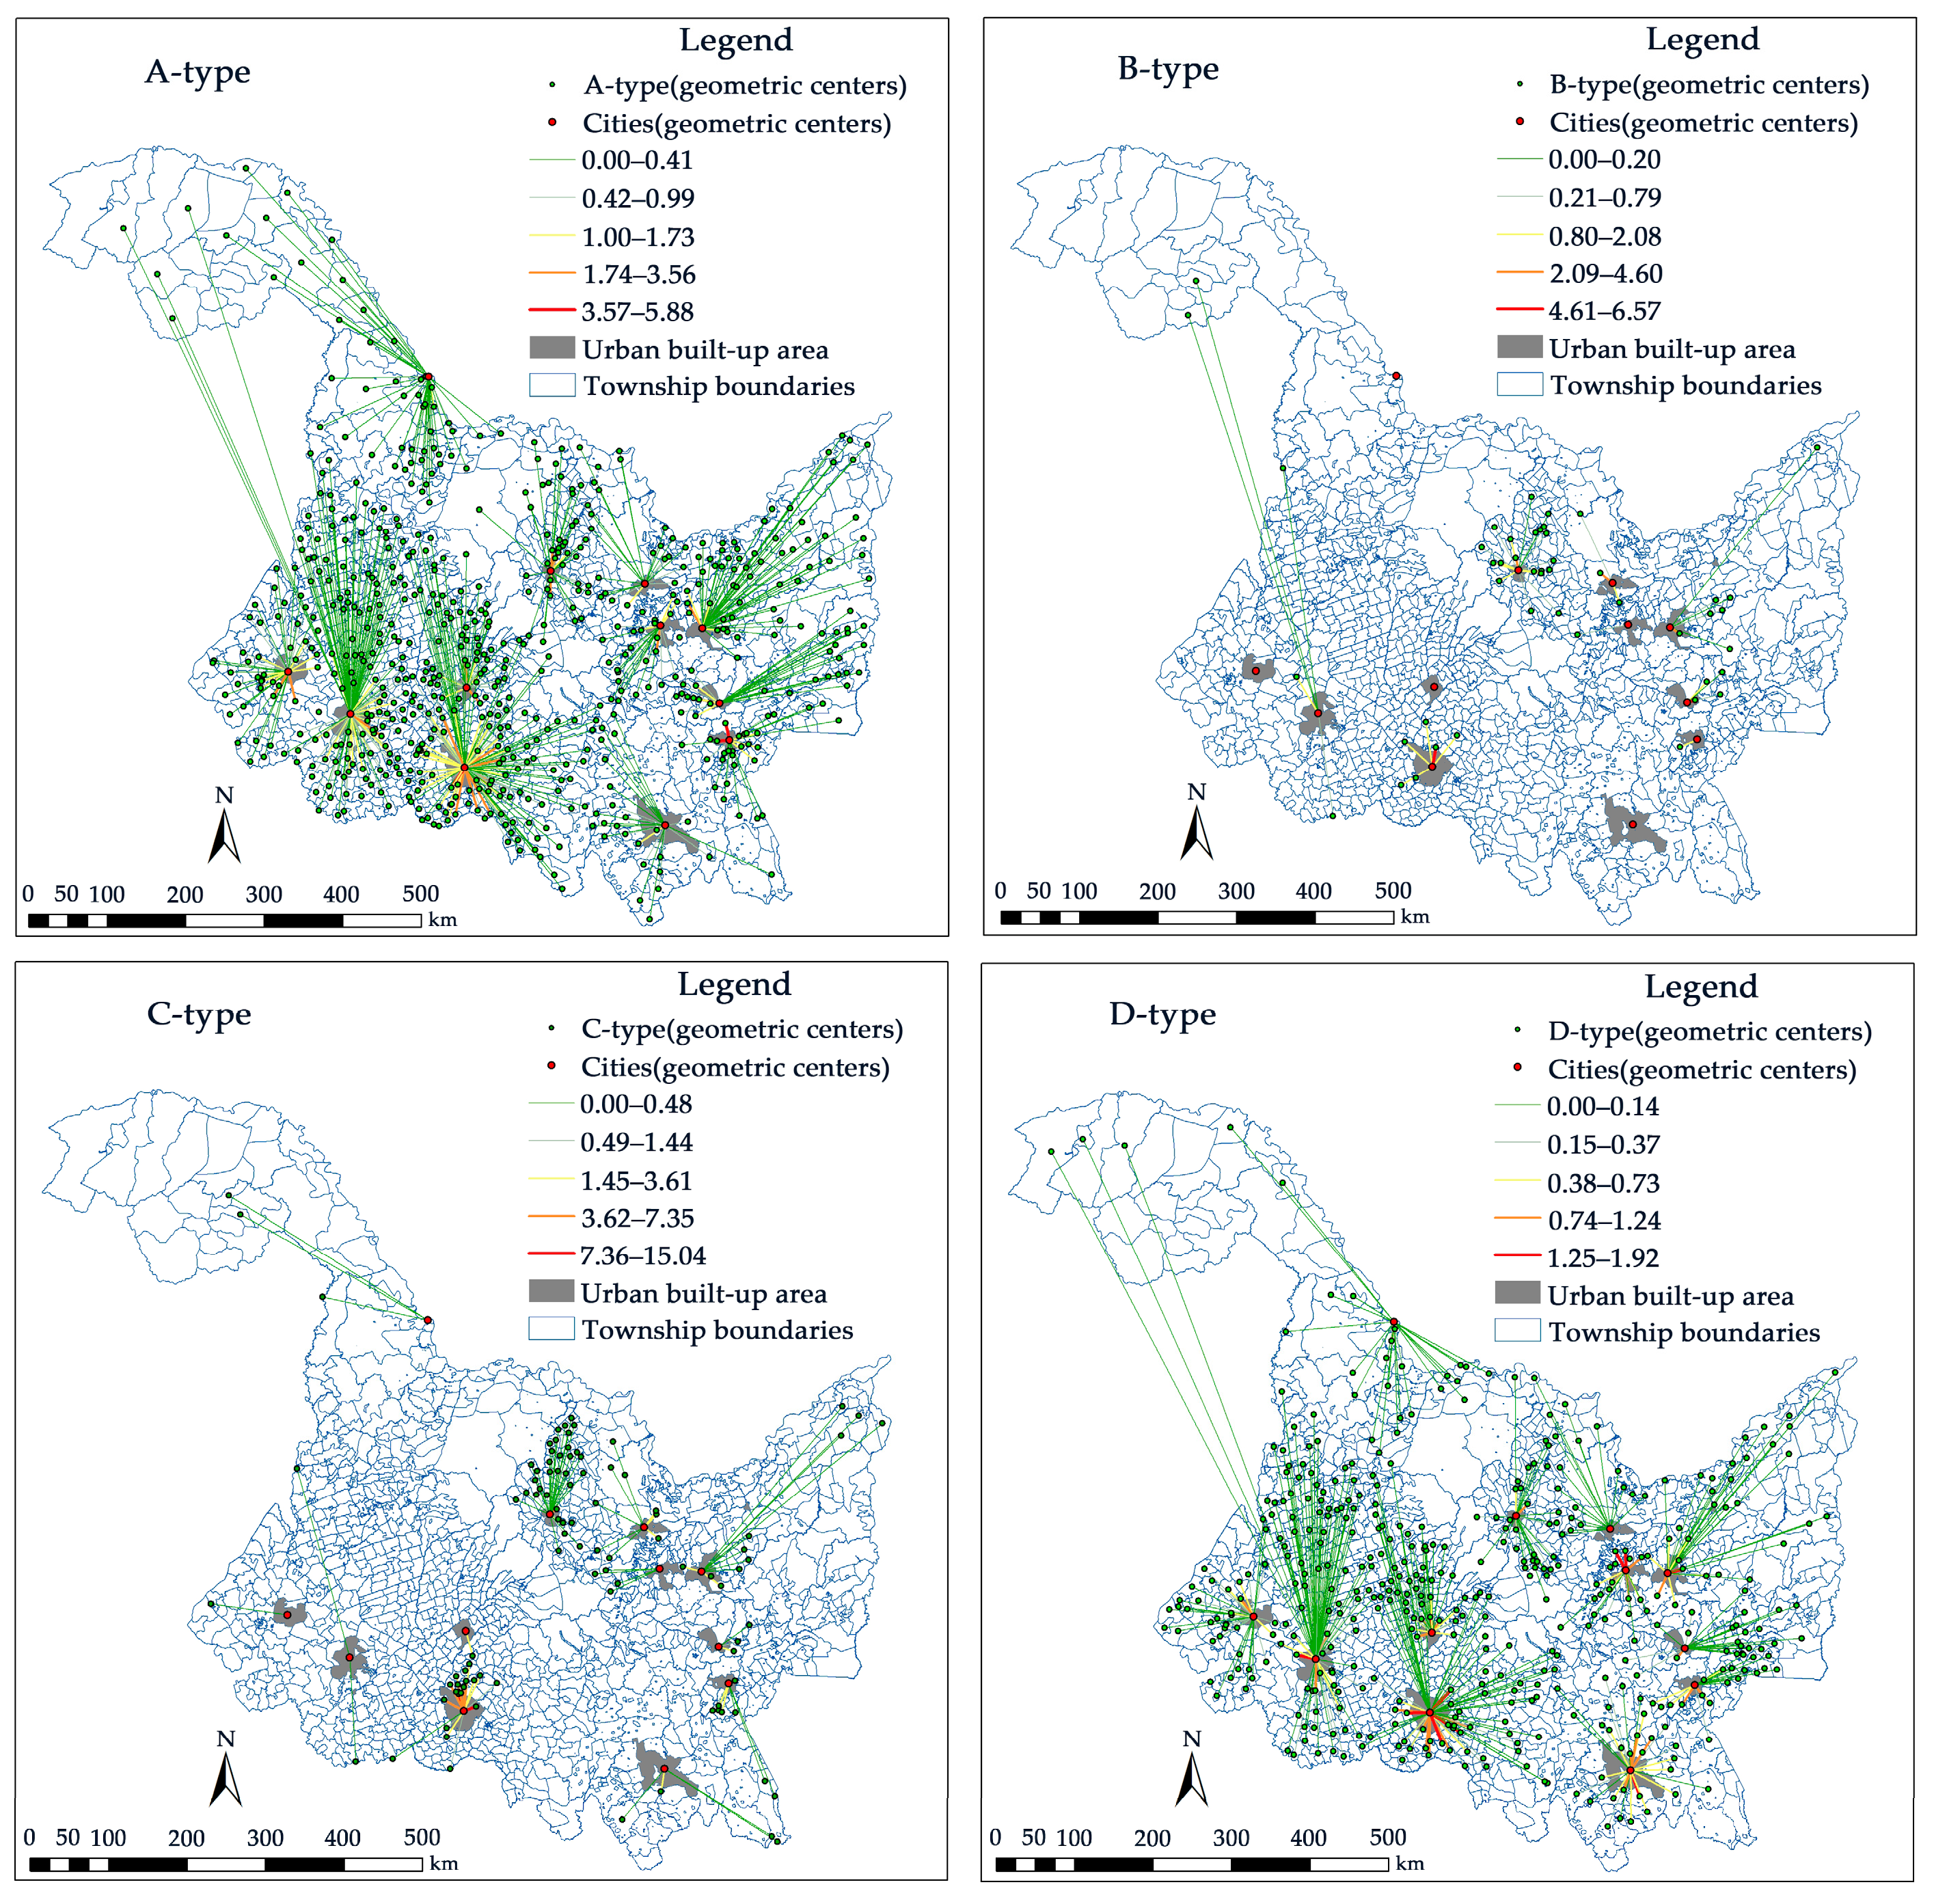
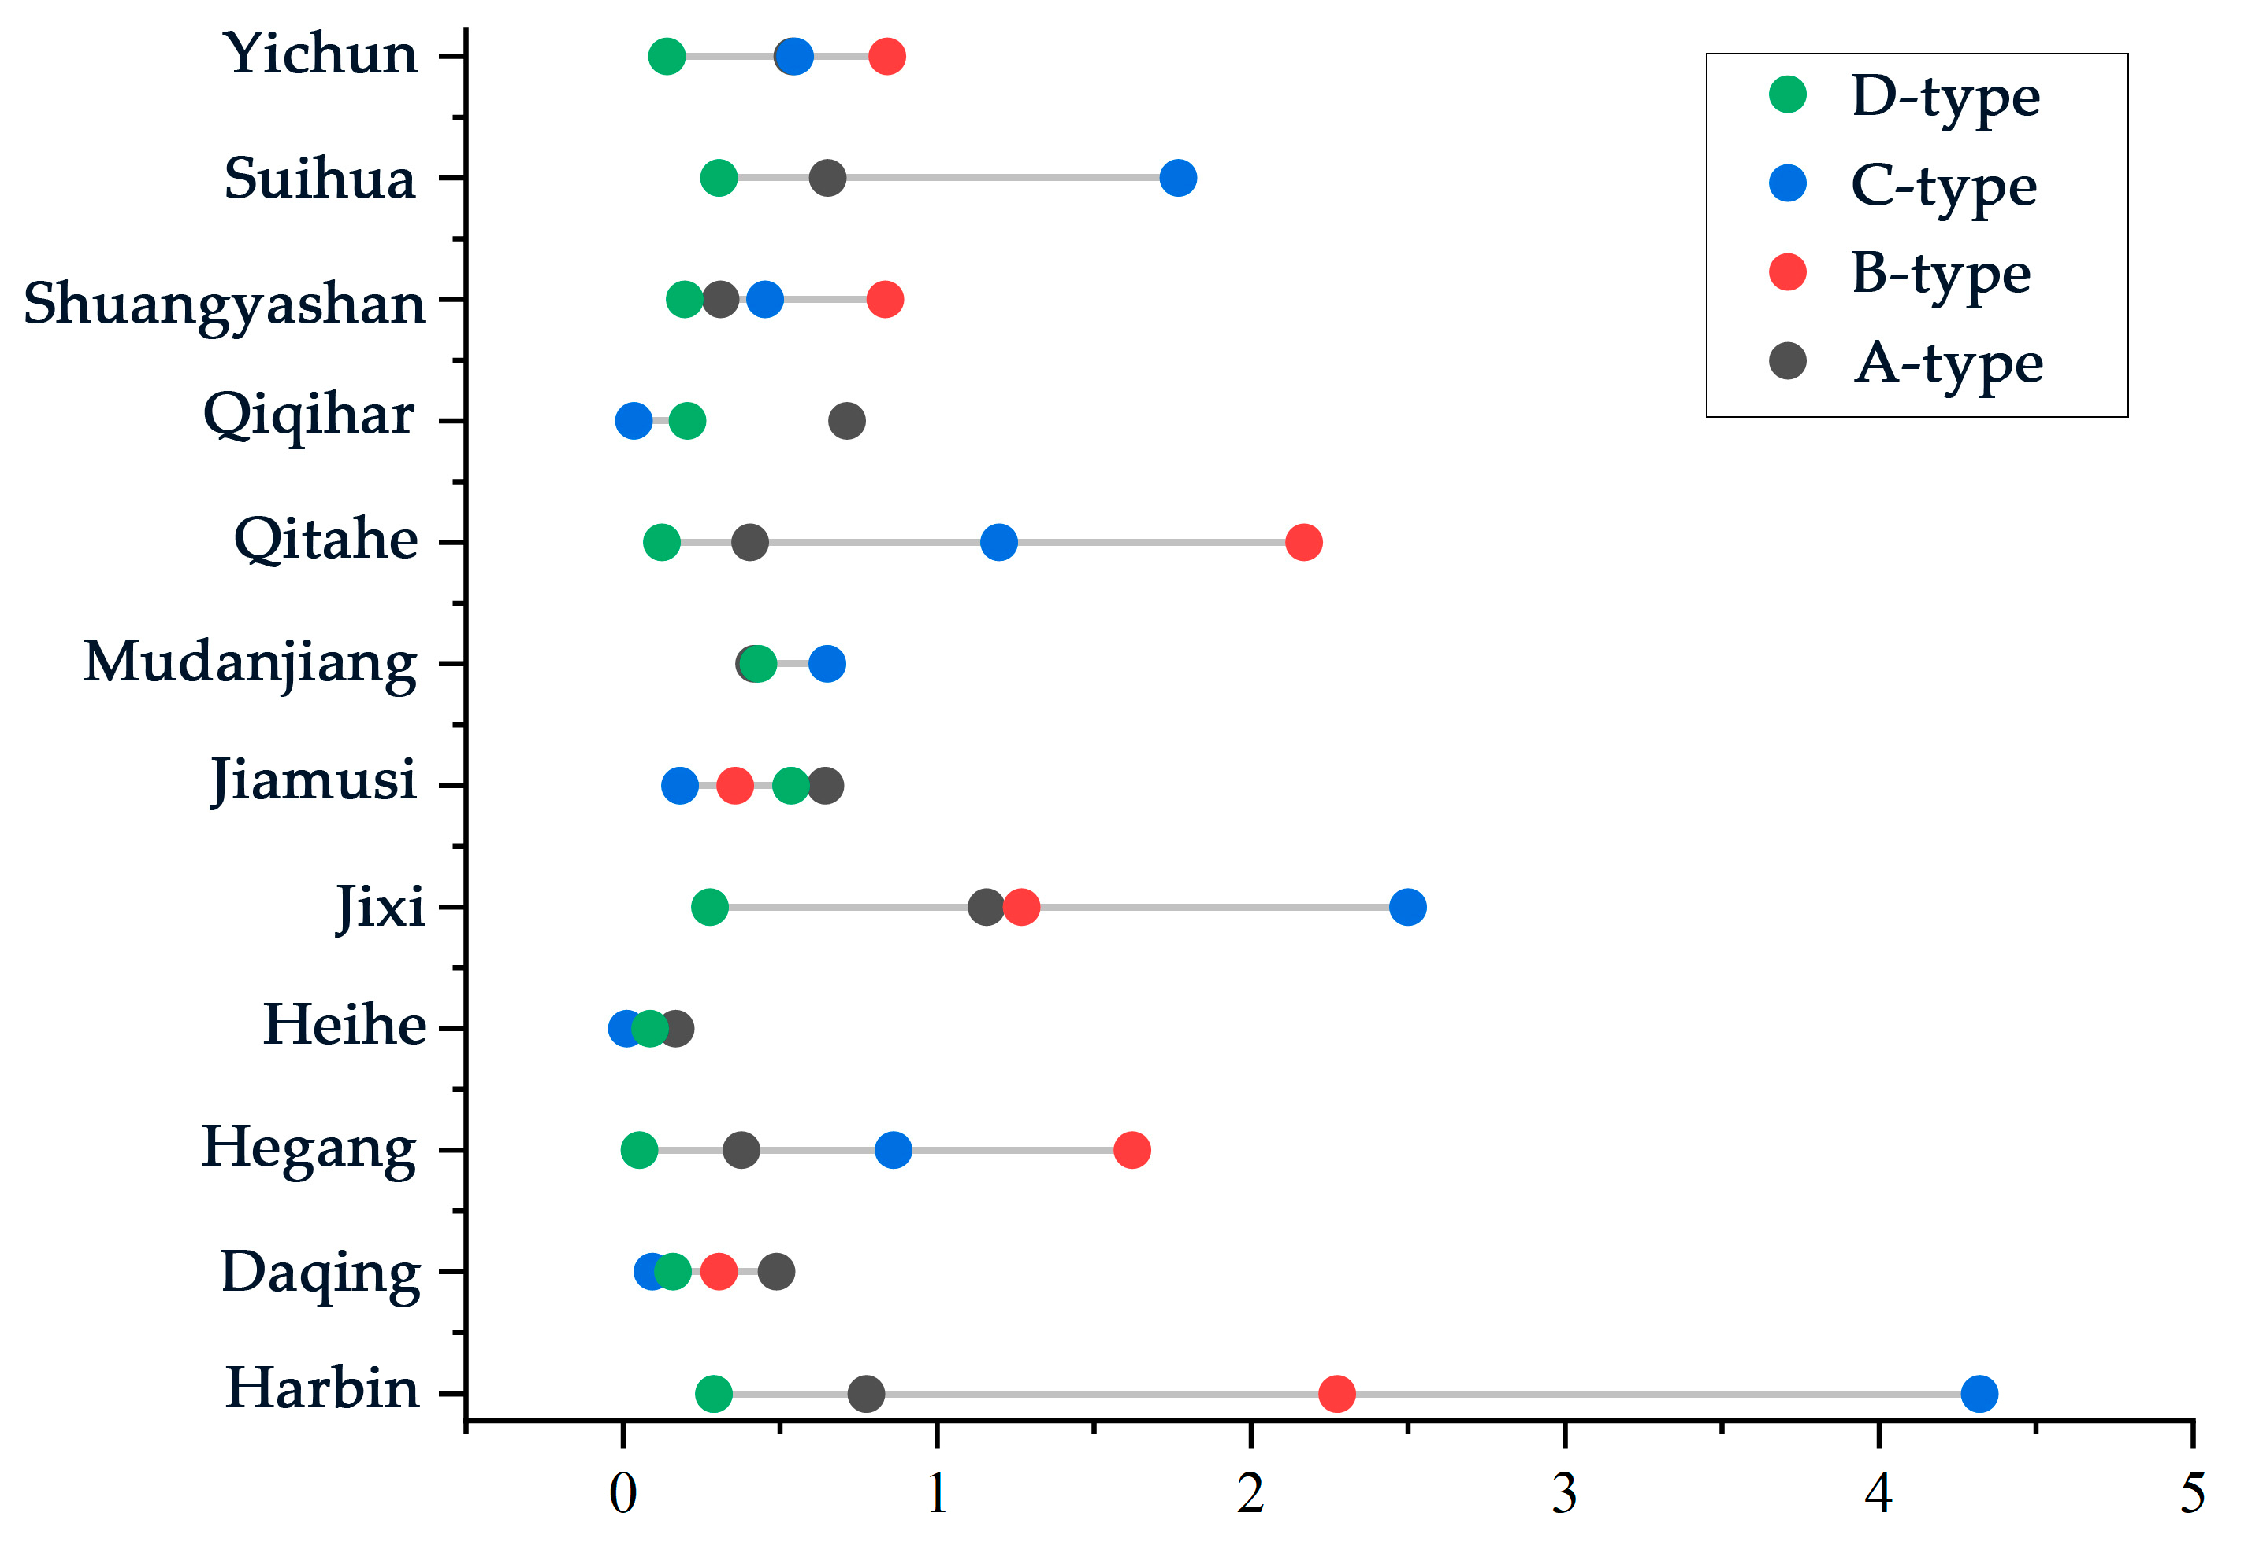
Each township has a maximum urban–rural development force that points to the one city that is most attractive to it. Under this force, bundles of radial clusters are formed that are centered on a particular city (Figure 9). According to the average value of the maximum attractiveness of the 12 prefecture-level cities and townships of different types, it can be concluded that in terms of A-type attractiveness, the city of Jixi is ranked first, at 1.16; this is followed by Harbin and Qiqihar, at 0.77 and 0.71, respectively. In terms of B-type attractiveness, the city of Harbin is ranked first, with 2.27; this is similar to the city of Qitaihe, with 2.17. For C-type attractiveness, ranked first is the city of Harbin, and its attractiveness is the highest value of all of the types at 4.32. D-type attractiveness values are more similar and at a lower level, with all values being below 1. Jiamusi has an attractiveness of 0.54, Mudanjiang 0.43, and Suihua 0.31 (Figure 10). This is the basis for the formation of a distribution pattern of different types of urban–rural relations.
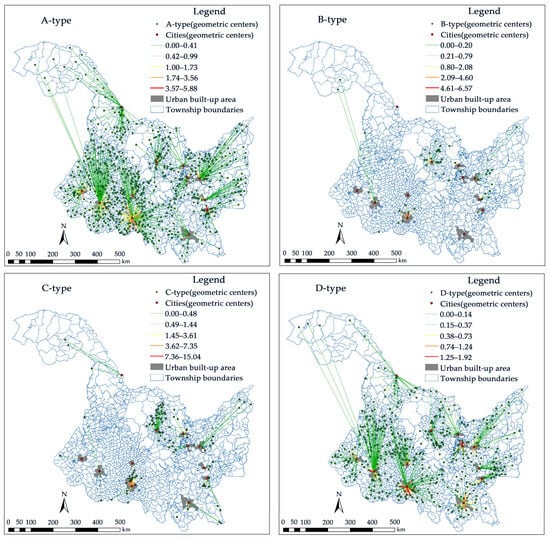
Figure 9.
TCD urban and rural maximum attractiveness results.
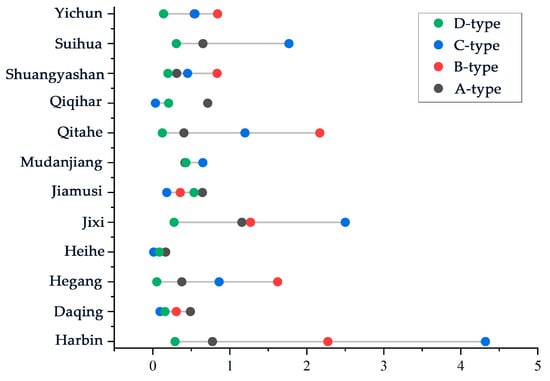
Figure 10.
Average of the maximum attractiveness of the 12 prefectural cities and towns in the different categories.
3.3.3. New Spatial Patterns of Urban–Rural Development under the Urban–Rural Development Dynamic
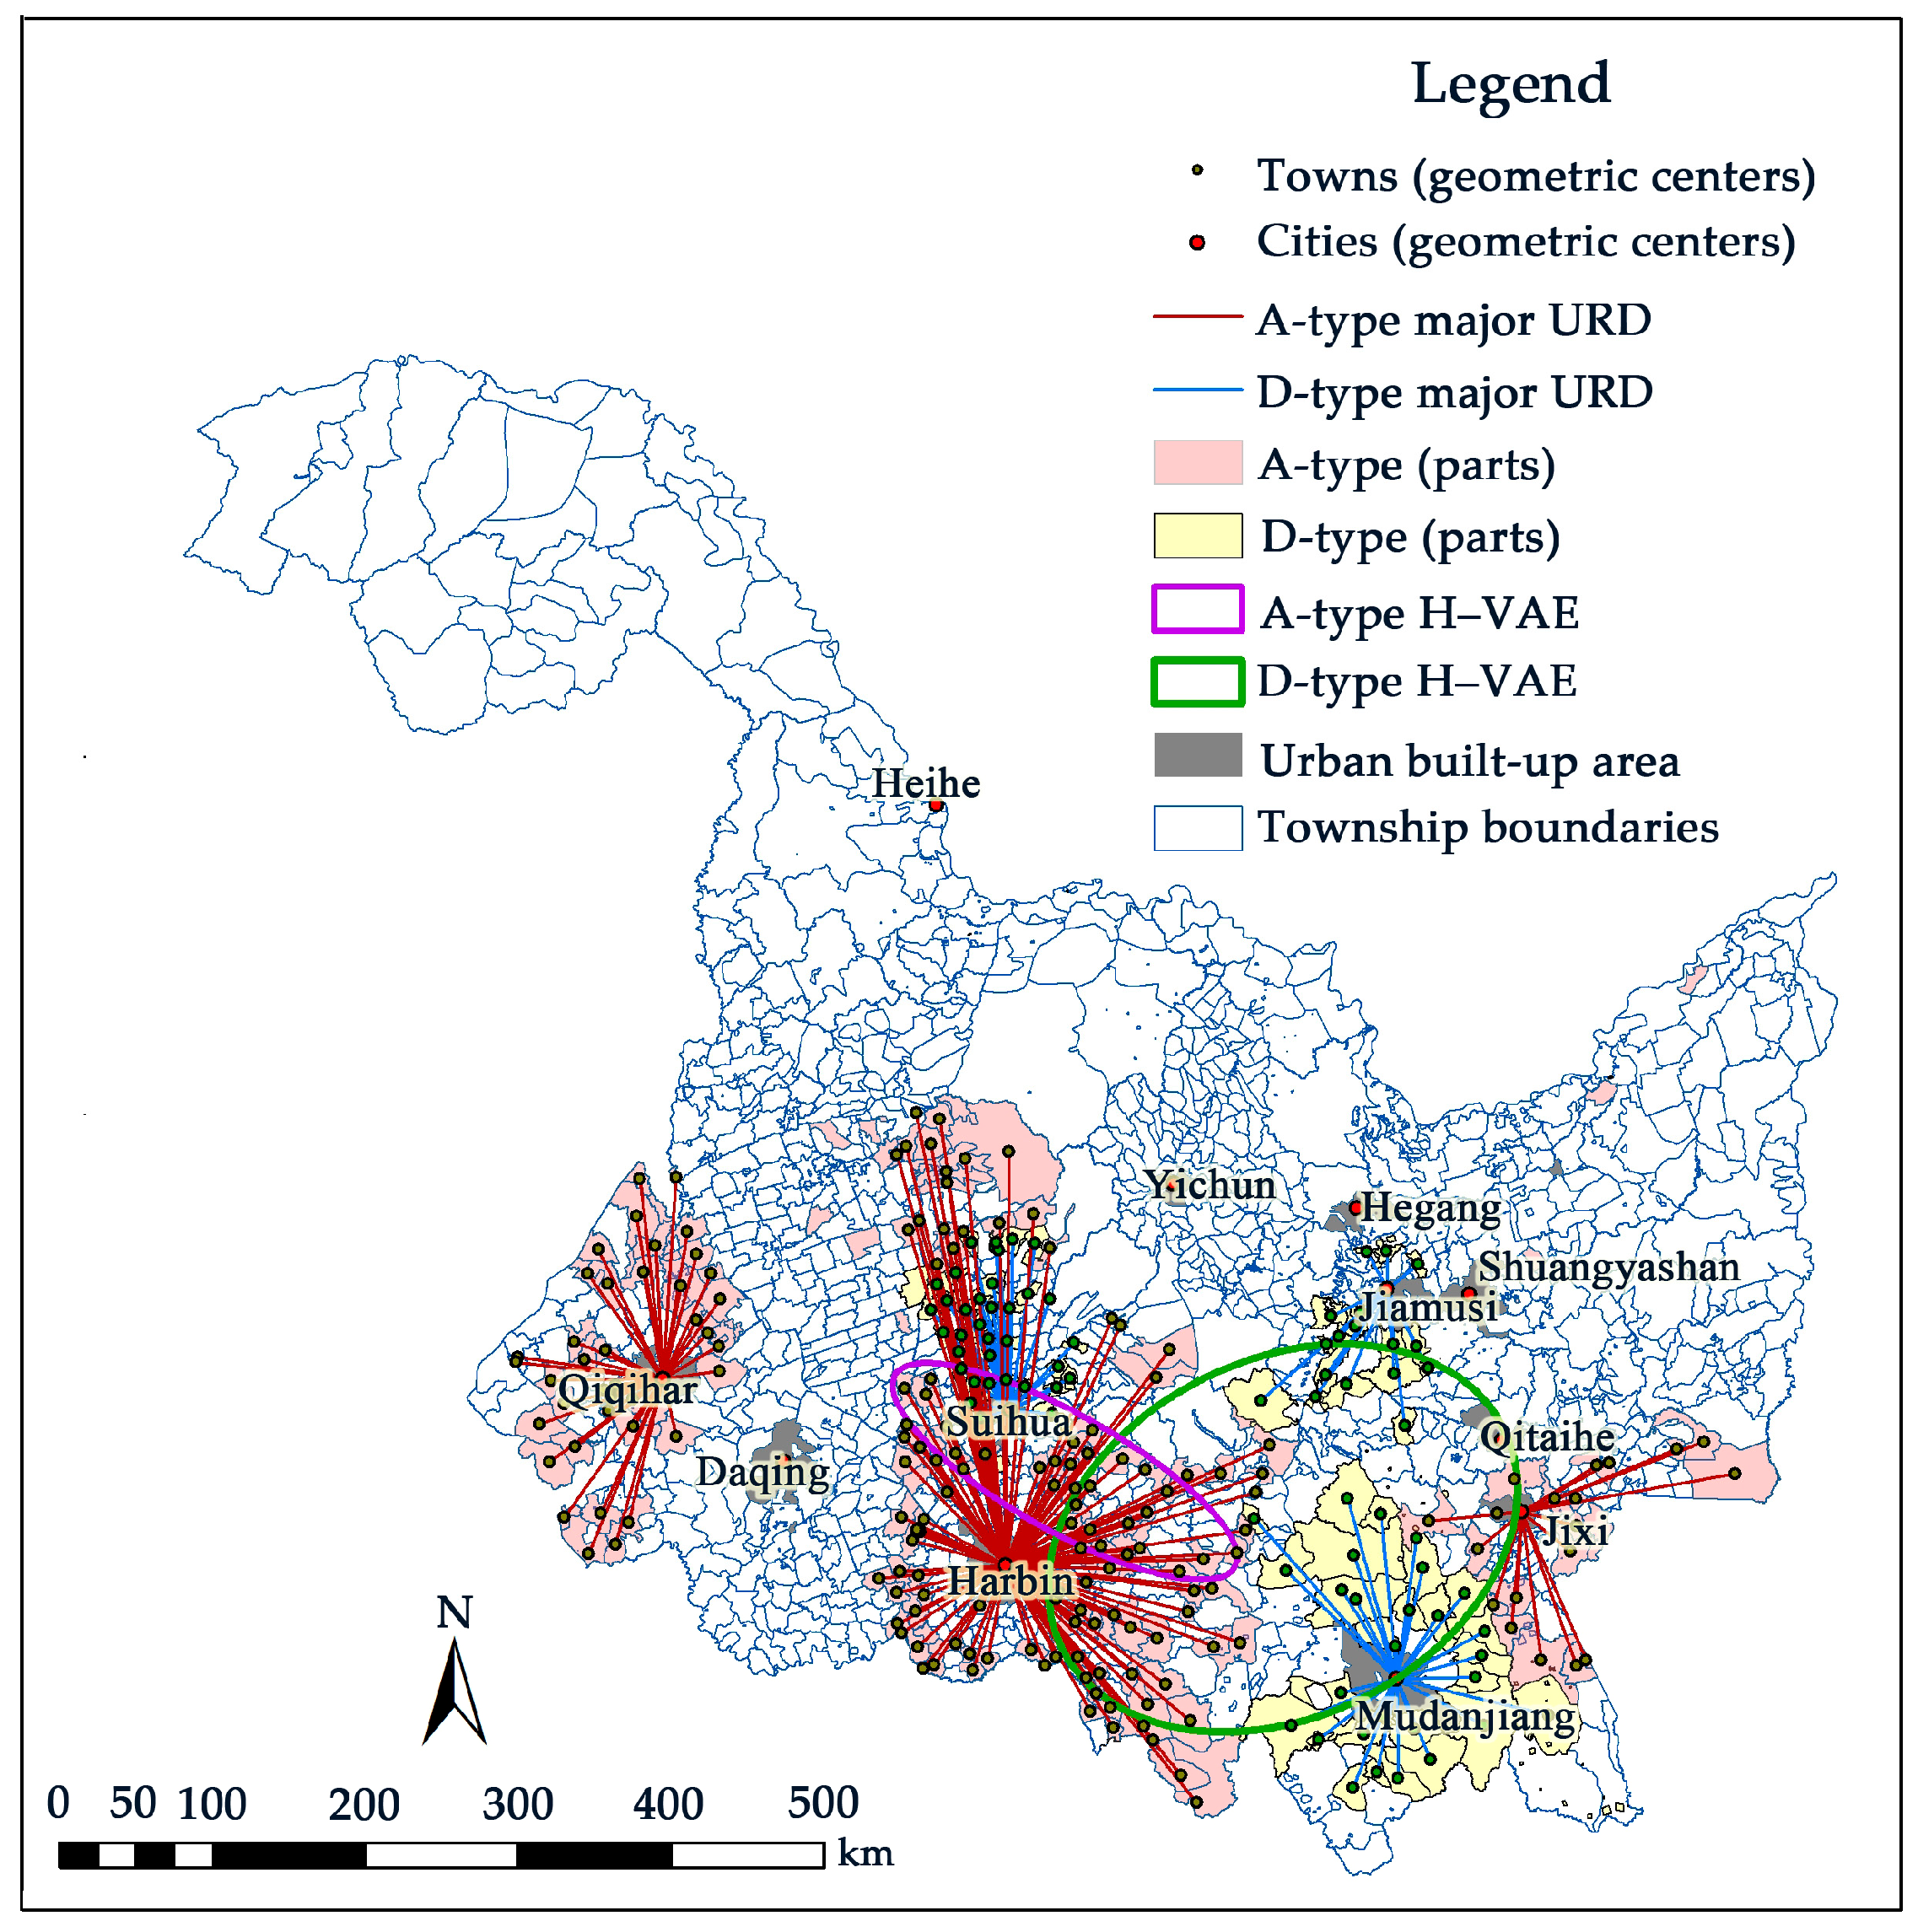
The A-type presents a spatial development pattern of urban and rural areas with “one center, two parts”. The “one center” is located in the Harbin and Suihua areas and combined with the calculated hotspots of A-type coupling values; there are 29 pairs of urban–rural spatial development relationships within its core ellipse. The Qiqihar cluster in the west of the “two parts” includes 40 pairs of urban–rural spatial development relationships, and the Jixi cluster in the east includes 19 pairs of urban–rural spatial development relationships. The Jixi–Harbin–Qiqihar cluster as a whole shows an east–west development axis in space. When combined with the results of the calculations of the maximum urban–rural attractiveness values, this shows that the townships most likely to become emerging small cities or satellite towns in the future are Changgang Township and Manjing Township. These areas should be prioritized for land use planning and the provision of construction land indicators (Figure 11).
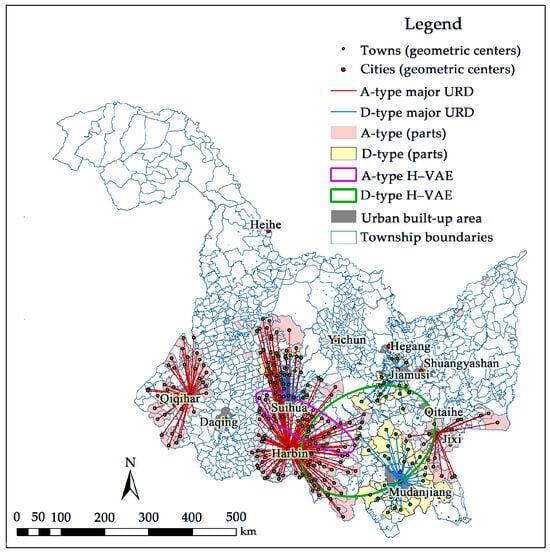
Figure 11.
A-type and D-type patterns in major urban–rural development.
The nine B-type villages that will disappear the fastest in the future are located in the Harbin and Qitaihe clusters. Jiehe Township has the highest value of 6.5657 with the Qitaihe rural–urban development (RUD) forces, suggesting that it is likely to be annexed by the city of Qitaihe. Waibu Street has a value of 6.2688 with the Harbin rural–urban development forces, suggesting that the township is likely to be annexed by the city of Harbin. The remaining seven townships have relatively low values of developmental force with the city; therefore, in addition to annexation by the city, they may also be annexed by other types of townships in the neighborhoods. Among them, A-type townships around Harbin City also exhibit strong attraction (Table 5). These areas will be the target of future construction land initiatives.

Table 5.
Forces within urban–rural development relationships in categories B and C.
C-type areas will need to be prioritized for treatment in the future. The current management strategy is to strictly control increases in rural construction land, while attracting greater populations; otherwise, these areas may be converted to the B-type. The areas with the greatest force of the 19 urban and rural pairs are all in the Harbin cluster, where the value of the force of road and street construction and Harbin’s urban and rural development is 7.5187, which indicates that the possibility of interactive flow between Harbin and its population is greater and also that it can provide more residential space for the population of Harbin City. The indicator of control over the growth of construction land in the township can be used to subsidize the growth of urban construction land in Harbin to achieve a virtuous circle. The remaining townships could follow this practice or exchange population and land use indicators with other neighboring townships (Table 5).
The urban–rural spatial development D-type pattern is characterized by a “triangular” distribution with the three cities of Jiamusi, Suihua, and Mudanjiang as the apex. Combined with the calculated D-type coupling value hotspots, there are a total of 20 pairs of urban–rural spatial development relationships within its core ellipse. Among them, the township that is most likely to become the center of the Mudanjiang region is Zhujia Township, and the center township of the Jiamusi region is Tulipa Township. Among them, the township that is most likely to become the center of the Mudanjiang region is Zhujia Township, and the central township in the future of the Jiamusi region is Tulongshan Township. Increasing this area’s construction land should be prioritized through land planning and utilization policies (Figure 11).
4. Discussion
4.1. The Coupling of Rural Population and Construction Land Use Reflects Dynamic Development Trends in the Countryside
The coupling of population and construction land use obtained in this study reflects the degree of interaction between dynamic changes. How can these dynamic processes be understood? In addition to traditional living and residential functions, rural construction land may also play host to the processing industry, service industry, and other functional land types. Therefore, the increase in its size reflects the level of development of a given village. Additionally, with the development of urbanization, the population inevitably moves to the city, which involves both the re-organization of functional rural construction land [40] and the process of coupling.
The system coupling theory [41,42] has been applied to a variety of disciplines such as social sciences, economics and geomatics, and some scholars have also used this theory to study the coupling synergy of “population–land–industry” [42]. Although this study only analyzes the coupling of population and construction land for the countryside, the population represents the main component of agricultural activities, while construction land is the area in which other industries are concentrated. Therefore, the element of “industry” is implicit in the rural population and construction land, which simplifies the results of the coupling analysis. In subsequent research, this implied factor can be analyzed as an explicitly influential factor through which to achieve a richer form of rural coupled development.
Currently, China attaches equal importance to achieving urbanization and rural revitalization and development; therefore, as a pertinent research issue, the four different types of coupling proposed in this study have been addressed by scholars in different studies [12,13,17,41]. In this research, the four types were studied simultaneously and used to reflect development levels and dynamic development trends in different villages. Combining them with the role of urban attractiveness provides a direction for the future agglomeration of various types of functional land in different types of villages and also reflects the direction that future rural revitalization will take.
4.2. The New Spatial Pattern of Urban–Rural Development Factors Integrated into Urban–Rural Development
The urban–rural development relationship model integrating the coupled characteristics of rural population and construction land use proposed in this study is easy to combine with empirical cases to obtain the new urban–rural development patterns that may emerge in the future in villages, featuring different development types, taking into account their interaction with urban attractiveness. The results have a clear spatial orientation and will be of significance in efforts to guide the rational allocation of land resources and the improvement in land use efficiency in the future.
The spatial pattern of urban–rural development in this study reflects the spatial expression of the relationship between urban and rural development, emphasizing the impact of the economic role of population. The problem of siting village construction land, on the other hand, is influenced by the distribution of topographical features and natural resources (in addition to the urban–rural development relationship). This is determined by the basic natural conditions of the formation of rural construction land and cities and is therefore a potentially fixed influential factor. However, this study can provide a reference for subsequent research on construction land use site selection. This study found that 86.67% of A-type townships are located 100 m–400 m above sea level, and 85.19% of D-type townships are located 200 m–500 m above sea level, which suggests that these townships and cities are concentrated in areas with flat topography. Therefore, the townships that have developed from A-type townships into small towns or satellite towns are located in flat areas, as are the D-type townships that form the centers. This is conducive to the reduction of transport costs, which in turn is conducive to the two-way free flow of production factors between urban and rural areas and the rational allocation of public resources, thus promoting the integrated development of urban and rural areas. At the same time, the decline of B-type townships can induce the reorganization of population and land resources, thereby becoming a reserve resource for promoting integrated urban–rural development. C-type townships can then focus on combating the hollowing-out problem, and their residential space can become a potential target for the clustering of functional land use.
According to the theory of echo and diffusion effects, there will be a cyclical accumulation between urban and rural areas affected by these two effects. The echo effect will widen the urban–rural gap, and the diffusion effect will narrow it [43]. The new urban–rural development pattern proposed in this study promotes integrated urban–rural development by spatially adjusting different types of urban–rural relationships, enhancing the diffusion effect of rural areas with development advantages (the A-type and D-type) and reducing the echo effect of rural areas with development disadvantages (the B-type and C-type). The realization of integrated urban–rural development is an important goal for China at this stage and also represents an important direction for future scientific research.
4.3. Land Use Policies Should Be Adjusted in Line with Urban–Rural Development Patterns
A new pattern of urban and rural development can only be achieved if it is accompanied by a land use policy. China places great emphasis on land planning and utilization, with “building a new township system” being one of the key elements of the latest iteration of Heilongjiang Provincial Land Planning (2021–2035). The current planning is centered around towns, and policies on how townships can become new towns are not yet well developed. The development of A-type townships, as outlined in this study, needs to be supplemented by corresponding land planning policies that prioritize land planning and development, optimizing their industrial layout with the city clusters they belong to and giving priority to the complementary functions and coordinated development of the paired cities that have the greatest urban–rural attractiveness. At the same time, the D-type townships identified in this study can play the role of cities to a certain extent and should also be optimized in terms of land planning policies, especially given their insufficient areas of construction land, which should be prioritized and adjusted in line with the new industrial development plans.
Heilongjiang Province is located in a remote region of China, and most of its villages still exist within the primary stage of agriculturally based economic development relative to the developed coastal regions of China. These villages play an important role in maintaining the country’s food security, and the strictest policies for the protection of arable land are being implemented. Priority is given to increasing rural construction land use, while at the same time ensuring that high-quality farmland is not damaged and that the total area of arable land is not reduced. Therefore, B-type township construction land can be reasonably reduced to supplement areas of arable land occupied by other types of townships. On the other hand, C-type townships require the implementation of land planning initiatives to control reductions in their construction land on the one hand, but on the other hand, they need to guide the return of and increase in the population through industrial planning and economic policies that will promote the development of the agricultural industry and its transformation into other industries.
Land policies that can be adopted by all levels of government in Heilongjiang Province at present include the establishment of a new township system in the next phase of territorial spatial planning in order to control the scale of construction land at different levels and guide the migration of urban and rural populations. On the basis of the existing “balance of occupation and compensation” policy [44], a mechanism has been established for the transfer of indicators between different townships following the annexation of villages. Targeted efforts have been made to increase the revitalization of villages with potential for economic development, including policy support in the form of infrastructure construction and industrial funding as priorities. The results of this study have implications for all of these policies.
5. Conclusions
This study analyzes the characteristics of population and construction land changes at the township scale in traditional rural areas, measures the degree of coupling between the two using the coupling coordination degree model, and classifies their development trends into four types. This study comprehensively analyzes the attractiveness of the built-up areas of 12 prefecture-level cities to the broader population, proposes a new type of urban–rural development pattern that may be formed in the study area in the future, and predicts the forms that construction land-related policies will take in the future. This study draws the following main conclusions:
Firstly, it was found that during the study period, rural population and construction land in the study area underwent significant spatial dynamic changes, and the two were significantly coupled. From a systemic perspective, the magnitude of coupling can contribute to dynamic development trends in different types of villages. The townships in the study area are divided into four types of coupling: A-type townships have generally high coupling values and are the areas most likely to produce new towns or satellite towns in the future; B-type townships have the highest proportion of high coupling values of all types, and trends indicate that their demise will accelerate in the future; C-type townships have a relatively even distribution of coupling values, and the possibility of increased hollowing out in the future is unlikely to be high (the same is true of the possibility of a shift to another type); D-type townships generally have low coupling values, and it is more difficult to continue to increase the intensity of growth in construction land. However, these areas can be developed into regional centers.
Secondly, this study found that under the maximum urban–rural development force, each township is “paired” with a city, forming a spatial cluster of bundles of radial lines centered in a particular city. Different types of rural coupled development and their corresponding paired cities form different spatial linkage patterns made up of bundled radial clusters. The average values of the maximum attractiveness of different types of townships to the 12 prefecture-level cities indicate that the groups of urban–rural development relationships that generate the main interactions are not the same in each type. These main urban–rural development relationship clusters, together with the townships’ own coupled characteristics of interaction and agglomeration, constitute the urban–rural development patterns of the future.
Thirdly, the new urban–rural development pattern is a combination of many elements, including natural ecology and socioeconomics; this is in line with the objective laws of development and is scientific in nature. Combined with the theory of echo and diffusion effects, it enhances the diffusion effect of rural areas with development advantages (A-type and D-type) and reduces the echo effect of rural areas with development disadvantages (B-type and C-type), thereby promoting integrated urban–rural development and realizing economic development in the region. At the same time, the pattern can guide future changes in land planning policies by optimizing the relationship between urban and rural development and more rationally allocating land resources for township construction (this may manifest as improving the efficiency of construction land use and protecting arable land).
The coupled change in population and construction land will bring about industrial and economic development, and the linked development trends of the three are the focus of a subsequent study. The urban–rural development pattern determined in this study is a spatial reflection of the relationship between urban and rural development, which can provide a spatial-extent of reference for policies related to population and construction land control at the township scale. When selecting specific sites within construction land in rural areas, it will be necessary to deepen our understanding by considering the comprehensive influence of more contributing factors. However, the results of this study can help the balanced development of urban and rural elements and the formation of a new township system.
Author Contributions
Conceptualization, J.L. and G.D.; methodology, Y.Z.; validation, J.L., Y.Z. and G.D.; formal analysis, J.L.; data curation, J.L. and X.Y.; writing—original draft preparation, J.L. and Y.Z.; writing—review and editing, J.L., G.D. and Y.Z.; visualization, Y.Z.; supervision, J.L. All authors have read and agreed to the published version of the manuscript.
Funding
This research was supported by the Strategic Priority Research Program of the Chinese Academy of Sciences (grant no. XDA28130400), the Social Science Foundation Project of Liaoning (grant no. L21AGL010), postdoctoral start-up funding for Northeast Agricultural University (grant no. 88639208), and the Youth Talent Project of the Northeast Agricultural University of China (grant no. 54970112).
Data Availability Statement
The data presented in this study are available on request from the corresponding author. The data are not publicly available due to the data are part of an on-going study.
Conflicts of Interest
The authors declare no conflicts of interest.
References
- Elshof, H.; Haartsen, T.; Van Wissen, L.J.G.; Mulder, C.H. The influence of village attractiveness on flows of movers in a declining rural region. J. Rural Stud. 2017, 56, 39–52. [Google Scholar] [CrossRef]
- Wang, C.; Gao, B.; Weng, Z.; Tian, Y. Primary causes of total hamlet abandonment for different types of hamlets in remote mountain areas of China: A case study of Shouning county, Fujian province. Land Use Policy 2020, 95, 104627. [Google Scholar] [CrossRef]
- Yakubu, I. From a cluster of villages to a city: Housing politics and the dilemmas of spatial planning in tamale, Ghana. Land Use Policy 2021, 109, 105668. [Google Scholar] [CrossRef]
- Yanan, L.; Smail, M.A.; Aminuddin, A. How has rural tourism influenced the sustainable development of traditional villages? A systematic literature review. Heliyon 2024, 10, e25627. [Google Scholar] [CrossRef]
- Liu, Y.; Li, Y. Revitalize the world’s countryside. Nature 2017, 548, 275–277. [Google Scholar] [CrossRef]
- Liu, Y.; Zang, Y.; Yang, Y. China’s rural revitalization and development: Theory, technology and management. J. Geogr. Sci. 2020, 30, 1923–1942. [Google Scholar] [CrossRef]
- Zhu, J.; Zhu, M.; Xiao, Y. Urbanization for rural development: Spatial paradigm shifts toward inclusive urban–rural integrated development in China. J. Rural Stud. 2019, 71, 94–103. [Google Scholar] [CrossRef]
- Zhan, L.; Wang, S.; Xie, S.; Zhang, Q.; Qu, Y. Spatial path to achieve urban–rural integration development–analytical framework for coupling the linkage and coordination of urban–rural system functions. Habitat Int. 2023, 142, 102953. [Google Scholar] [CrossRef]
- Du, G.; Zhang, R.; Li, Y.; Zhang, M.; Faye, B. How different land systems lead to discrepancy of rural population–land relationships: Case study of Heilongjiang province, China. Land 2024, 13, 38. [Google Scholar] [CrossRef]
- Zou, B.; Mishra, A.K. Modernizing smallholder agriculture and achieving food security: An exploration in machinery services and labor reallocation in China. Appl. Econ. Perspect. Policy 2024, 1–30. [Google Scholar] [CrossRef]
- Gu, H.; Ling, Y.; Shen, T.; Yang, L. How does rural homestead influence the hukou transfer intention of rural–urban migrants in China? Habitat Int. 2020, 105, 102267. [Google Scholar] [CrossRef]
- Zhang, X.; Wang, J.; Song, W.; Wang, F.; Gao, X.; Liu, L.; Dong, K.; Yang, D. Decoupling analysis between rural population change and rural construction land changes in China. Land 2022, 11, 231. [Google Scholar] [CrossRef]
- Cai1, E.; Chen, W.; Wei, H.; Li, J.; Wang, H.; Guo, Y.; Feng, X. The coupling characteristics of population and residential land in rural areas of China and its implications for sustainable land use. Sustain. Dev. 2019, 4, 646–656. [Google Scholar] [CrossRef]
- Zhu, C.; Zhang, X.; Wang, K.; Yuan, S.; Yang, L.; Skitmore, M. Urban–rural construction land transition and its coupling relationship with population flow in China’s urban agglomeration region. Cities 2020, 101, 102701. [Google Scholar] [CrossRef]
- Zhang, H.; He, R.; Li, J. Coupling coordination status of urban and rural population and construction land in Henan province from the perspective of decoupling. Geogr. Geo–Inf. Sci. 2020, 36, 83–92. [Google Scholar]
- Wang, C.; Liu, Y.; Kong, X.; Li, J. Spatiotemporal decoupling between population and construction land in urban and rural Hubei province. Sustainability 2017, 9, 1258. [Google Scholar] [CrossRef]
- Zhao, Z.; Fan, B.; Zhou, Q.; Xu, S. Simulating the coupling of rural settlement expansion and population growth in Deqing, Zhejiang province, based on MCCA modeling. Land 2022, 11, 1975. [Google Scholar] [CrossRef]
- Ionela, G.; Ioan, B. Developing a growth pole: Theory and reality. Manag. Organ. Soc. 2017, 1, 209–215. [Google Scholar]
- Chatman, E.A. Diffusion theory: A review and test of a conceptual model in information diffusion. J. Am. Soc. Inf. Sci. 2010, 37, 377–386. [Google Scholar] [CrossRef]
- Drobnjakovi’c, M.; Steinführer, A. Re–thinking rurality: Towards a new research approach and rural–urban spatial gradient establishment in Serbia. Appl. Geogr. 2024, 163, 103195. [Google Scholar] [CrossRef]
- Yang, Y.; Bao, W.; Wang, Y.; Liu, Y. Measurement of urban–rural integration level and its spatial differentiation in China in the new century. Habitat Int. 2021, 117, 102420. [Google Scholar] [CrossRef]
- Hu, Z.; Li, Y.; Long, H.; Kang, C. The evolution of China’s rural depopulation pattern and its influencing factors from 2000 to 2020. Appl. Geogr. 2023, 159, 103089. [Google Scholar] [CrossRef]
- Wang, M.; Yang, Y.; Guo, T. Measurement of urban–rural integration level in suburbs and exurbs of big cities based on land–use change in inland China: Chengdu. Land 2021, 10, 474. [Google Scholar] [CrossRef]
- Juan, R.C. Population imbalances in Europe. Urban concentration versus rural depopulation. Reg. Sci. Policy Pract. 2023, 15, 713–716. [Google Scholar]
- Chen, L.; Huang, Y.; Qin, X.; Xu, W.; Qin, Y.; Li, X. Return migration and in–situ urbanization of 79 migrant sending counties in China: Characteristic and driving factors. J. Rural Stud. 2023, 104, 103155. [Google Scholar] [CrossRef]
- Ministry of Agriculture and Rural Affairs of the People’s Republic of China. Available online: http://www.moa.gov.cn/xw/qg/202312/t20231212_6442624.htm (accessed on 12 December 2023).
- Liu, Y.; Du, G. Heilongjiang Provincial Statistical Yearbook 2022; China Statistics Press: Beijing, China, 2003; pp. 3–85. [Google Scholar]
- Li, F.; Yao, C.; Fu, J.; Yang, X. Uncertainty analysis of potential population exposure within the coastal lowlands of mainland China. Environ. Res. Lett. 2023, 18, 124003. [Google Scholar] [CrossRef]
- Lin, J.; Song, G.; Song, S. Research on dynamic changes of landscape structure and land use eco–security: A case study of Jiansanjiang land reclamation area. Acta Ecol. Sin. 2011, 31, 5918–5927. [Google Scholar]
- Liu, S.; Huang, G.; Wei, Y.; Qu, Z. Monitoring and assessing land use/cover change and ecosystem service value using multi-resolution remote sensing data at urban ecological zone. Sustainability 2022, 14, 11187. [Google Scholar] [CrossRef]
- Kourtit, K.; Nijkamp, P.; Wahlström, M.H. How to make cities the home of people–a ‘soul and body’ analysis of urban attractiveness. Land Use Policy 2021, 111, 104734. [Google Scholar] [CrossRef]
- Lenormand, M.; Samaniego, H.; Chaves, J.C.; da Fonseca Vieira, V.; da Silva, M.A.H.B.; Evsukoff, A.G. Entropy as a measure of attractiveness and socioeconomic complexity in Rio de Janeiro metropolitan area. Entropy 2020, 22, 368. [Google Scholar] [CrossRef]
- Wang, Y.; Liu, Y.; Li, Y.; Li, T. The spatio–temporal patterns of urbanerural development transformation in China since 1990. Habitat Int. 2016, 53, 178–187. [Google Scholar] [CrossRef]
- Guerri, G.; Crisci, A.; Congedo, L.; Munafò, M.; Morabito, M. A functional seasonal thermal hot–spot classification: Focus on industrial sites. Sci. Total Environ. 2022, 806, 151383. [Google Scholar] [CrossRef] [PubMed]
- Wang, S.; Kong, W.; Ren, L.; Zhi, D.; Dai, B. Research on misuses and modification of coupling coordination degree model in China. J. Nat. Resour. 2021, 36, 793–810. [Google Scholar] [CrossRef]
- Tang, S.; Zhu, Y.; Wang, F.; Shen, N. Can marketization improve sustainable development in northeastern China? evidence from the perspective of coupling coordination degree model. Discret. Dyn. Nat. Soc. 2022, 2022, 7419430. [Google Scholar] [CrossRef]
- Lin, J.; Song, G.; Zhang, Y. Regionalization planning for prevention and control of saline–alkali land based on a landscape ecology risk pattern theory: A case study in Lindian County, Heilongjiang Province. Acta Ecol. Sinica. 2018, 38, 5509–5518. [Google Scholar]
- Wang, C.; Tao, Z.; Ren, M. Driving spatial network connections in rural settlements: The role of e–commerce. Appl. Geogr. 2023, 159, 103067. [Google Scholar] [CrossRef]
- Lin, J.; Song, G. Research on dynamic changes of landscape structure and land use eco-security spatiotemporal variation in Jian Sanjiang land reclamation area. Res. Soil Water Conserv. 2016, 23, 48–54. [Google Scholar]
- Liu, S.; Ye, Y.; Lin, Y. Evolution characteristics and decomposition of driving factors on rural settlements based on decoupling theory and LMDI mode. Trans. Chin. Soc. Agric. Eng. 2019, 35, 272–280. [Google Scholar]
- Yu, W.; Yu, W. Analysis of the Coupling Coordination between the ecosystem service value and urbanization in the Circum-Bohai-Sea region and its obstacle factors. Sustainability 2024, 16, 3776. [Google Scholar] [CrossRef]
- Lin, J.; Song, G.; Zhang, Y. Synergistic evolution mechanism of “production-living-ecology” functions in spatial planning system: A Case Study of Fuxin City. China Land Sci. 2019, 33, 9–13. [Google Scholar]
- Hirschman, A.O. The Strategy of Economic Development; Yale University Press: New Haven, CT, USA, 1958; pp. 5–26. [Google Scholar]
- Liu, C.; Song, C.; Ye, S.; Cheng, F.; Zhang, L.; Li, C. Estimate provincial–level effectiveness of the arable land requisition–compensation balance policy in mainland China in the last 20 years. Land Use Policy 2023, 131, 106733. [Google Scholar] [CrossRef]
Disclaimer/Publisher’s Note: The statements, opinions and data contained in all publications are solely those of the individual author(s) and contributor(s) and not of MDPI and/or the editor(s). MDPI and/or the editor(s) disclaim responsibility for any injury to people or property resulting from any ideas, methods, instructions or products referred to in the content. |
© 2024 by the authors. Licensee MDPI, Basel, Switzerland. This article is an open access article distributed under the terms and conditions of the Creative Commons Attribution (CC BY) license (https://creativecommons.org/licenses/by/4.0/).

