Article

The Temporal and Spatial Evolution Characteristics and Driving Factors of Ecosystem Service Bundles in Anhui Province, China

1
School of Architecture and Design, China University of Mining and Technology, Xuzhou 221116, China
2
School of Geography, Geomatics and Planning, Jiangsu Normal University, Xuzhou 221116, China
3
Belt & Road Institute, Jiangsu Normal University, Xuzhou 221009, China
*
Author to whom correspondence should be addressed.
Land 2024, 13(6), 736; https://doi.org/10.3390/land13060736
Submission received: 27 March 2024 / Revised: 10 May 2024 / Accepted: 21 May 2024 / Published: 23 May 2024

Abstract

:
Identifying ecosystem service bundles and their long-term evolutionary characteristics is essential for the overall enhancement of regional ecosystem services, as well as the division and management of functional areas, providing a basis for decision-making in formulating ecological and environmental protection policies, as well as regional development planning. Based on land use, remote sensing, and meteorological data obtained from Anhui Province, this study assessed six important ecosystem service functions, including food production (FP), water yield (WY), carbon sequestration (CS), soil conservation (SC), habitat quality (HQ), and landscape aesthetics (LA), at the township scale in 2000, 2010, and 2020. On this basis, the k-means clustering method was used to identify ecosystem service bundles, analyze the spatio-temporal evolution trajectory of service bundles, and explore the driving factors of the spatio-temporal evolution of ecosystem service bundles using GeoDetector 2015 The results indicate the following: (1) At the spatial level, diverse ecosystem services demonstrate pronounced spatial differentiation. The distribution pattern of HQ, carbon fixation, and SC services is generally lower in the north and higher in the south, with areas of high value predominantly located in the western Dabie Mountains and the mountains of Southern Anhui. Conversely, FP services exhibit the reverse pattern, and WY services display a gradual increase from north to south, while cultural services are more dispersed, with areas of high value primarily located in the western Dabie Mountains, the Yangtze River Basin, and other locations. On the temporal scale, WY, SC, and FP services mainly exhibit an increasing trend, marked by a significant increase, whereas other services tend to present a decreasing trend. (2) Anhui Province can be categorized into four distinct types of service bundles: the grain production bundle (GPB), mountain ecological conservation bundle (MECB), urban living bundle (ULB), and core protection bundle (CPB). Ecosystem service bundles exhibit clear spatial differentiation, and identical service bundles demonstrate substantial clustering in space. Between 2000 and 2020, ecosystem service bundles displayed a marked spatio-temporal evolution, with the prevalence of GPBs diminishing, whereas the share of ULBs progressively increased, and the number of MECBs and CPBs remained largely stable. (3) In the spatio-temporal evolution process, the average annual precipitation, the proportion of forest land, and slope constitute the principal natural factors influencing the spatio-temporal evolution of ecosystem service bundles, while the proportion of construction land represents the primary socio-economic factor, with natural factors exerting a more significant influence than socio-economic factors.

1. Introduction

Ecosystem services are defined as the products and services that humans obtain directly or indirectly from ecosystems [1], including food production, raw material acquisition, life support systems, and leisure and aesthetic enjoyment, that collectively form the environmental support for human life [2,3]. Humanity’s unsustainable development and exploitative behaviors have led to a series of ecological and environmental problems, resulting in land resource depletion and severely threatening the continuous improvement of human well-being; this situation is more serious in most parts of China, especially in Anhui Province. The ecosystem services perspective is critical in planning processes [4,5].
The assessment of ecosystem services has influenced the terms of discussions on nature conservation, natural resource management, and other relevant areas of public policy [6]. To effectively allocate and manage the national territorial space based on its functions, it is imperative to begin by examining the composition of various ecosystem services, identify the dominant ecosystem services in the region and their driving factors, and implement ecological functional zoning practices. Specific measures should be taken to enhance the stability and service capacity of ecosystems in each area, thus improving human welfare.
The concept of ecosystem service bundles offers a feasible quantitative perspective. Kareiva et al. first introduced the concept of “ecosystem service bundles”, which posits that nature can be observed as a collection of diverse ecosystem services [7]. The utilization of ecosystem service bundles enables the identification of the dominant ecosystem services within a region, thus allowing for the analysis of the spatial interconnections among various ecosystem services [8]. Given their advantages for examining the relationships between multiple ecosystem services, numerous scholars have utilized ecosystem service bundles to conduct research on ecological function zoning [9,10,11], trade-offs and synergies [12,13,14], spatio-temporal evolution [15], and driving factors [16], among other topics. The identification methods for service bundles mainly include k-means clustering analysis [17], self-organizing network analysis [18], hierarchical clustering [19], principal component analysis (PCA) [20], multiple correspondence analysis (MCA) [21], and random forest methods [22]. The k-means clustering algorithm, noted for its distinct clustering structure and straightforward process, has become a widely used clustering method for analyzing geographical spatial patterns. Regarding the temporal scale, the existing research conducted on ecosystem service bundles primarily involves static analysis [23,24,25], with a paucity of studies on the spatio-temporal evolution trajectory of ecosystem service bundles over long time series. In clustering-scale terms, the related research is frequently conducted at large and medium scales, such as national [26], provincial [27], county [28], and watershed [29,30], or at smaller scales, such as grids [23] and village [10], and less emphasis is placed on the spatio-temporal patterns and evolution at the township scale. Finer spatial scales are more advantageous for realizing the goals of refined land management, and discerning the spatio-temporal patterns of service bundles at the village and town scales holds considerable significance for the holistic management of various ecosystem services in terms of policy implementation.
Elucidating the natural and socio-economic factors driving the evolution of ecosystem service bundles is crucial for regional ecological restoration and spatial planning projects [31]. Several scholars primarily focus on the impact of natural environmental factors, whilst overlooking the human economic factors [32,33,34]. Examining the relationship between service bundles and the natural socio-economic system can guarantee the effective management of ecosystems. Contemporary research predominantly focuses on the division of service bundles and the study of driving factors forming spatial patterns, with a lack of research on the driving factors of the spatio-temporal evolution of ecosystem service bundles. Renard et al. [8] categorized seven types of ecosystem service bundles for nine kinds of ecosystem services at the municipal scale in Canada, while Yang Wanqing et al. [35] employed GeoDetector to analyze the main influencing factors forming the spatial pattern of ecosystem service bundles in Beijing in 2020. GeoDetector uses a commonly used spatial statistical method that can effectively analyze regional variable fluctuations and quantitatively analyze the explanatory power of each driving factor regarding the dependent variable [36,37], facilitating a quantitative analysis of the impact of each driving factor on the evolution of ecosystem service bundles.
Accompanied by the accelerated processes of industrialization and urbanization, the contradiction between population and economic growth and ecological protection in Anhui Province has become increasingly prominent, with major changes in local ecosystem structure and intensified ecological risks, leading to a reduction in and imbalances in a variety of ecosystem services, and affecting the sustainable development of society. Anhui Province boasts a complex and diverse ecosystem. The Dabie Mountains water conservation and Wanjiang wetland flood storage areas have been designated as national key ecological function zones. This study quantitatively assessed six key ecosystem services—FP, WY, CS, SC, HQ, and LA—for the years 2000, 2010, and 2020. The study identified the ecosystem service bundles and revealed their spatio-temporal evolution characteristics using the k-means clustering method. Using GeoDetector 2015, this study explored the principal driving factors behind the evolution of ecosystem service bundles. The results aid in scientifically delineating ecological function zones according to their regional characteristics, implementing ecological protection and restoration measures tailored to the local conditions, and providing decision-making bases for the regional high-quality development and efficient management of ecosystem services. The objectives of this study were to (1) assess the spatial and temporal characteristics of the six ecosystem services in Anhui Province; (2) identify the ecosystem service clusters in Anhui Province and reveal their spatial and temporal evolution characteristics; (3) explore the driving factors affecting the changes occurring in the spatial and temporal patterns of the ecosystem service clusters in Anhui Province, and propose the corresponding strategies for their development and protection.

2. Materials and Methods

2.1. Study Area

As shown in Figure 1, Anhui Province, situated in the eastern part of China and spanning longitudes 114°54′ to 119°37′ (east) and latitudes 29°41′ to 34°38′ (north), lies in the core area of the Yangtze River Delta, encompassing a total area of 140,100 square kilometers, comprising 1.45% of the country’s total area. This study utilized the township-level divisions of Anhui Province as the fundamental unit of analysis, incorporating 16 districts and cities in addition to 1363 township-level administrative units. The region has abundant water resources, boasting numerous rivers and lakes, including Chaohu Lake, one of China’s five largest freshwater lakes. The land features an average elevation of 119.3 m, and is characterized by a diverse and complex topography, partitioned into five natural regions: the Huaibei Plain, the Jianghuai Hills, the Western Dabie Mountain area, the Along-the-River Plain, and the mountains in Southern Anhui. Anhui Province experiences a transitional climate between the warm temperate and subtropical zones, marked by a significant monsoon climate. As of the end of 2022, the permanent population stood at 61.27 million, featuring a population density approximately three times the national average; the gross regional product amounted to CNY 4.5 trillion, and the urbanization rate of the population increased from 17.94% in 1990 to 60.15% in 2022. Amidst the acceleration of industrialization and urbanization processes, the dichotomy between population and economic growth and ecological protection in Anhui Province has become increasingly evident. The strain on the region’s ecosystem is intensifying, manifested in serious trends such as arable land degradation, water environmental pollution, and biodiversity decline, gravely impacting the sustainable development of human society. Presently, areas such as the Dabie Mountains water conservation region and the Wanjiang wetland flood storage area in Anhui Province have been listed as national key ecological function zones, and ecological environmental protection has emerged as an important regional development goal.

2.2. Data Source

The data used in this study for Anhui Province mainly include land use, meteorological, elevation, NDVI, soil, and socio-economic data. All the raster data had a uniform resolution of 30 m × 30 m, with a coordinate system reprojection of WGS_1984_World_Mercator: ① Land use data: The land use data for Anhui Province in 2000, 2010, and 2020 consist of the Chinese land use-status remote-sensing monitoring data interpreted by the Institute of Geographic Sciences and Natural Resources Research, Chinese Academy of Sciences (https://igsnrr.cas.cn/kxyj/, accessed on 10 April 2023), with a spatial resolution of 30 m. ② Meteorological data: Including the monthly precipitation and potential evapotranspiration data of Anhui Province in 2000, 2010, and 2020, obtained from National Earth System Science Data (http://www.geodata.cn/, accessed on 10 April 2023), with a resolution of 30 m. ③ DEM data: Obtained from the Geospatial Data Cloud (https://www.gscloud.cn/, accessed on 15 April 2023), with a resolution of 30 m. ④ Soil data: Obtained from (https://westgis.ac.cn/, accessed on 17 April 2023), with a resolution of 1000 m × 1000 m, resampled using ArcGIS to 30 m. ⑤ NDVI data: Obtained from the Ecological Science Data Center of the Chinese Academy of Sciences (http://www.nesdc.org.cn/, accessed on 20 July 2023), with a resolution of 30 m. ⑥ Socio-economic data: The total grain output of Anhui Province in 2000, 2010, and 2020, collected from the Anhui Statistical Yearbook (http://tjj.ah.gov.cn/public/6981/147903191.html, accessed on 28 July 2023).

2.3. Ecosystem Service Assessment

2.3.1. Carbon Sequestration (CS)

The CS function of the ecosystem refers to the process of plants absorbing carbon dioxide from the atmosphere through photosynthesis, synthesizing organic matter, and fixing carbon in plants or soil. The InVEST 3.11.0 “Carbon Storage and Sequestration” module is used to estimate the carbon storage of the study area based on land use types and separately count the four basic carbon pools of aboveground biomass, belowground biomass, soil, and dead organic matter [38,39,40,41]:
C t o t a l x = ( C a b o v e x + C b e l o e x + C s o i l x + C d e a d x ) × A x
where C t o t a l x refers to the total carbon density (t/hm2) for the xth type of LULC, C a b o v e x is the biogenic carbon density above ground (t/hm2) for the xth type of LULC, C b e l o e x represents the underground biocarbon density (t/hm2) for the xth type of LULC, C s o i l x denotes the soil carbon density (t/hm2) for the xth type of LULC, and C d e a d x represents the dead organic matter (t/hm2) for the xth type of LULC, while A x is the area (hm2) for the xth type of LULC.

2.3.2. Habitat Quality (HQ)

Biodiversity is closely related to the production of ecosystem services. Biodiversity includes spatial characteristics; therefore, it can be calculated by analyzing the land use and land cover (LULC) map and its degree of threat to biodiversity [20]. The InVEST 3.11.0 “Habitat Quality” module is used to estimate the HQ of the study area, combining the information of land use types and biodiversity threat factors. The core calculation is as follows:
Q i = H i × 1 D i z D i Z + k z
where Q i is the HQ of the i-th pixel from 0 to 1. Generally, a higher Q i denotes a better HQ. Moreover, H i denotes the habitat adaptability; D i is the habitat degradation degree, which is correlated with threatening factors, the threat intensity, and the sensitivity of land uses to threats. In addition, k is the half-saturation constant, denoting half of the habitat deterioration degree. Moreover, z is used to represent the normalization constant in the model [42].

2.3.3. Soil Conservation (SC)

The SC function represents the ecological system (such as forest and grassland) through the canopy layer, fallen leaves, and roots, and how, at different levels, they reduce the erosive energy of rainwater invasion, increase soil erosion resistance, reduce soil erosion and soil loss, and maintain soil function [43,44]. This study adopted the “Sediment Delivery Ratio” module of InVEST 3.11.0 to estimate the SC volume in the research area, based on the corrected general soil loss equation [45], and comprehensively considered the blocking ability of land blocks for upstream sediment accumulation. The calculation formula is:
E S x , s s = R K L S x U S L E x = R x × K x × L S x × 1 C x × P x
where E S x , s s is the total soil retention amount (t/hm2) of the xth grid in Anhui; R K L S x and U S L E x are the potential soil erosion and actual soil erosion of the xth grid; and R x , K x , L S x , C x , and P x are the precipitation erosivity factor, soil erodibility, slope length gradient, crop management factor, and erosion control practice factor of the xth grid, respectively.

2.3.4. Water Yield (WY)

WY represents the ecological system through the canopy layer, fallen leaves layer, and roots, and how they intercept and store rainfall. It satisfies the internal needs of different ecological components in the ecological system and continuously provides water sources to the external environment in the dry season (when the ratio of the monthly average flow to annual flow is less than 5%). This study adopted the “Annual Water Yield” module to estimate the water source capacity in the research area, based on the water balance principle, and used the difference between rainfall amount and evapotranspiration total amount to calculate the WY. It also quantitatively evaluated different land block WYs by using grid as a unit [46]. The specific calculation formula is as follows:
Y x = ( 1 A E T x P x ) × P x
A E T x P x = 1 + P E T x P x 1 + A E T x P x ω 1 ω
W x = Z A E T x P x + 1.25
A W C x = min max s o i l   d e p t h x , r o o t   d e p t h x × P A W C x
where Y x is the WY of the xth grid in Anhui (mm); A E T x and P x are the actual annual evapotranspiration (mm) and average annual precipitation (mm) of the xth grid, respectively; P E T x is the annual potential evapotranspiration of the xth grid (mm); ω is the ratio of plant available water content to rainfall amount; W x is a non-physical parameter with no dimension; Z is the Zhang coefficient, which is a seasonal constant, and takes the reference model user manual and research area actual situation as values; A W C x is the water available in the xth grid (mm); soil depth is the depth of the soil (mm); root depth is the depth of the root (mm); and P A W C x is plant available water content in the xth grid (mm).

2.3.5. Food Production (FP)

This study combines the research relevant to this topic, incorporates the strong linear relationship between NDVI data and crops [47], and calculates the grain crop yield in Anhui Province according to the multiple cropping index of different cultivated land types:
S G P = G P s u m N D V I s u m × N D V I i
where S G P is the estimated value of the grain yield of the grid (t/hm2), G P s u m is the large-scale statistical data of grain yield (t), N D V I i is the NDVI value of the cultivated land pixel in the grid, and N D V I s u m is the sum of NDVI values of all cultivated land pixels at the corresponding scale.

2.3.6. Landscape Aesthetics (LA)

This paper quantifies LA as a cultural service. LA refers to the pleasure that humans derive from observing landscapes, and landscape quality is an important factor that affects aesthetics. The Shannon diversity index (SHDI) and contagion index (CONTAG) were used to characterize the landscape quality. The SHDI is used to measure the diversity and evenness of distribution of different patch types in a landscape; it takes into account the relative abundance and evenness of the patch types in the landscape, and in LAs, it can be used to assess the visual complexity and diversity of landscapes, with a high value usually implying that the landscape consists of many different patch types, which may increase the visual attractiveness and aesthetic value of the landscape. CONTAG measures the degree of agglomeration or extension tendency of different patch types in the landscape, and in LAs, it can be used to measure the spatial continuity and consistency of landscape elements; a high value may indicate that a certain patch type forms good connectivity in the landscape, which may create a sense of visual fluency and unity and thus enhance the aesthetic quality of the landscape. As shown in Table 1, the two indices were used to illustrate the effect of the spatial configuration of the landscape on the species richness in the landscape, and the index calculation was realized using the Fragstats 4.2 moving window method. Then, the two indicators were partitioned based on townships and weighted equally to generate the spatial distribution of township landscape aesthetic services [48]:

2.4. Ecosystem Service Bundle Identification

The k-means algorithm is an unsupervised clustering method, which can output k categories with the highest similarity within the same cluster and the lowest similarity between different categories after inputting the given number of bundles k and the dataset containing n data objects. This study employed the k-means clustering method to categorize ecosystem service bundles following the evaluation of six types of ecosystem services in Anhui Province on a grid basis, and derived the service values at the township level using partitioned statistics. To achieve more stable clustering outcomes, this study utilized IBM SPSS Modeler 18.0 to conduct the k-means cluster analysis, setting the number of iterations at 300, and executing 2–20 classes of stepwise iterative clustering, yielding an optimal cluster count of 4.

2.5. Driving Factor Analysis

Based on the existing research [36] and the characteristics of the ecological environment and socio-economic background of Anhui Province, this study selected nine indicators of two types, socio-economic factors and natural factors, for the driving factor analysis. As shown in Table 2, socio-economic factors include the proportion of construction land, gross domestic product, and population density; natural factors include the normalized difference vegetation index (NDVI), slope, elevation, forest cover ratio, annual average precipitation, and annual average temperature. The factor detection module of GeoDetector was used to detect the influence degree of each influencing factor on the spatio-temporal pattern of ecosystem service bundles, and the formula is as follows:
q = 1 1 N σ 2 i L N i σ i 2
In the formula, N is the total number of regional samples; σ is the variance of the supply–demand ratio; q is the explanatory power of the impact factor of the supply–demand ratio differentiation; and the range of q is [0, 1]. The larger the q, the stronger the spatial heterogeneity of the ecosystem service supply–demand relationship in the study area, and, vice versa, the stronger the randomness of the spatial distribution.

3. Results

3.1. Spatial and Temporal Distribution of Ecosystem Services

This study conducted a quantitative evaluation of six typical ecosystem services located in Anhui Province for the years 2000, 2010, and 2020. Influenced by diverse geographical and environmental factors, various ecosystem services exhibit significant spatial differentiation patterns. As shown in Figure 2, the spatial distribution patterns for HQ, CS, and SC services remained consistent from 2000 to 2020, demonstrating a trend of lower values in the north and higher values in the south. High-value areas were predominantly clustered in the western Dabie Mountains and the mountains in Southern Anhui, where forest resources were abundant, vegetation coverage was extensive, the intensity of land use was minimal, and the ecological environment was minimally impacted by urban construction. Consequently, these areas exhibited robust capabilities in HQ, CS, and SC services and constituted the core regions of Anhui Province’s ecosystem. The spatial distribution of the FP service contrasted with that of HQ, displaying a pattern of higher values in the north and lower values in the south. High-value areas for FP were localized in the Huaibei Plain, the Jianghuai Hills, and the Yangtze River coast, endowing them with a robust FP capacity. Regarding the WY, the overall pattern gradually increased from north to south, potentially attributable to variations in the precipitation levels. The spatial distribution of cultural services was dispersed, with high-value areas mainly located in the western Dabie Mountains, the Yangtze River basin, and regions boasting diverse landscapes.
Table 3 illustrates that the change trends for various ecosystem services are characterized by the following factors: The annual average values of WY, SC, and FP mainly increased from 2000 to 2020 by 98.99%, 62.21%, and 62.64%, respectively, suggesting significant enhancements in WY service and SC capacity. This may be closely related to the policy of returning farmland to forest and grassland; the cultivated land area in the study area decreased, but the FP still increased, correlating with advancements in the productivity of cultivated land. HQ, CS, and LA exhibited a declining trend, with HQ decreasing by 3.45%, and the CS and LA services by 0.57% and 0.8%, respectively.

3.2. Ecosystem Service Bundles and Their Dynamic Evolution

Based on the assessment results of six ecosystem services in Anhui Province, four types of ecosystem service bundles were identified at the township scale using k-means cluster analysis. The composition structure of each ecosystem service bundle presented obvious differences, and they were named according to the characteristics of their ecosystem services: GPBs, MECBs, ULBs, and CPBs (Figure 3). Figure 4 shows the spatial distribution of the ecosystem service bundles in Anhui Province, and the ecosystem service bundles exhibited obvious spatial aggregation. The dominant ecosystem services of the GPB were FP and CS. The numbers of townships occupied by GPBs in 2000, 2010, and 2020 were 805, 694, and 571, respectively, mainly distributed in the northern Huaibei Plain and Jianghuai Hills in the study area, and the spatial location remained basically unchanged. The dominant land use type in the region was cropland, which was the main grain supply area in Anhui Province. The dominant ecosystem services of the MECB were CS and HQ, and they provided a certain amount of WY, SC, and LA, but FP was extremely scarce. The numbers of townships occupied by MECBs in 2000, 2010, and 2020 were 215, 139, and 207, respectively, mainly distributed in the western Dabie Mountains and mountains in Southern Anhui. The decrease in the number of MECB townships in 2010 may be related to the environmental damage caused by the rapid economic development at that time. The dominant land use type in the region was forest land, with high vegetation coverage, strong CS capacity, and diverse ecosystem types. ULBs had a balanced provision of ecosystem services, except for the scarcity of HQ and SC. The numbers of townships occupied by ULBs in 2000, 2010, and 2020 were 114, 354, and 398, respectively, mainly distributed in the southern Jianghuai Hills and the Yangtze River Basin, and they gradually expanded outward. The land use in the region was dominated by cropland, water area, and construction land, with high proportions of water area and construction land. The water area accounted for more than half of the water area in the entire study area, and the proportion of construction land increased from 6.11% in 2000 to 34.39% in 2020. The region had a flat terrain, abundant grain production, widespread water distribution, and well-developed infrastructure, and was the main urban living area in Anhui Province. The dominant ecosystem services of CPBs were CS and LA, and they provided a certain amount of WY, FP, and HQ, but FP was extremely scarce. The numbers of townships occupied by CPBs in 2000, 2010, and 2020 were 229, 176, and 187, respectively, and the spatial locations were relatively dispersed, mainly distributed in the western Dabie Mountains, the Yangtze River Basin, and the mountains in Southern Anhui. The land use in the region was mainly cropland, forest land, and grassland, but it was adjacent to the ULB and GPB and was vulnerable to damage.
Based on the clustering results, the evolution characteristics of the ecosystem service bundle in Anhui Province were explored further (Figure 5). GPB was always the most abundant among the four ecosystem service bundles, but the specific coverage number of the service bundles presented obvious differences over time. In 2000, GPBs, MECBs, and CPBs covered 805, 215, and 229 townships, respectively, accounting for about 91.6% of the total number of townships in the region. During this period, the urbanization development in Anhui Province was slow, and the economic activities were mainly based on agriculture. With the rapid development of urbanization, some GPBs and CPBs changed to ULBs. By 2010, the ULBs had increased rapidly from 114 townships in 2000 to 354, and GPBs still continued to change to ULBs.
At the same time, with the intensification of human development activities on natural ecosystems, the total number of townships distributed by the GPB, MECB, and CPB all decreased to varying degrees, indicating that ULBs extended from the urban–rural construction area where human activities were concentrated to the cropland and surrounding forest land. Between 2010 and 2020, some ULBs changed to CPBs, and some CPBs changed to MECBs, indicating that various ecological protection policies and sustainable development strategies in Anhui Province achieved certain results during this period.

3.3. Driving Factors of Ecosystem Service Bundle Changes

This study explored the driving factors of ecosystem service bundle evolution using GeoDetector (Table 4). The results show that the influence of different factor variables on the spatial and temporal differentiation of ecosystem service bundles exhibits significant differences in different stages. Among the socio-economic factors, the proportion of construction land has a prominent explanatory power for the spatial differentiation of ecosystem service bundles in the selected region. The explanatory powers of construction land for the spatial and temporal differentiation of ecosystem service bundles in 2000, 2010, and 2020 were 0.381, 0.466, and 0.280, respectively, while the explanatory power of gross domestic product and population density were low and showed a downward trend. Natural factors include annual average precipitation > forest land proportion > slope > elevation > annual average temperature > normalized vegetation index, among which the average explanatory powers of the remaining factors were higher than 0.2, except for the NDVI, and the explanatory power was outstanding; the explanatory power of annual precipitation was the highest, and the average explanatory power was 0.518. The explanatory power of the other influencing factors decreased to varying degrees, except for the NDVI, annual precipitation, and annual temperature values; the annual precipitation and annual temperature changed the most, indicating that, with the passage of time, the annual average precipitation and annual average temperature presented a significant increase in the explanatory power of the spatial and temporal differentiation of ecosystem service bundles. Generally speaking, the spatial and temporal differentiation and evolution of ecosystem service bundles were affected by both natural and socio-economic development factors, among which the expansion of cities was the main driving factor in the socio-economic sphere, but natural factors presented a more decisive influence.

4. Discussion

4.1. Spatial and Temporal Distribution Patterns of Ecosystem Service Bundles

The spatial and temporal distribution patterns of ecosystem services are affected by different land use types, intensities, and patterns, and the ecosystem service bundles manifest as the recurrent presence of various ecosystem services in a specific region across space and time [9]. This study employed the k-means cluster analysis method to identify the ecosystem service bundles in Anhui Province, and the results indicate that the service bundles in Anhui Province can be categorized into four types; they are affected by land use types and human activities and show obvious heterogeneity in their spatial and temporal distributions. GPB presented the widest distribution range, and the spatial distribution proportion was much larger than that for other service bundles, mainly because its distribution location was in the center of the Huaihe River Basin, the soil in the Huaihe River Basin was fertile, the proportion of cropland area exceeded 70%, and it was an important grain production base in China [49]. Therefore, the service bundle dominated by grain supply service would have a much larger area than other types of service bundles. However, during the research period, the area occupied by the GPB decreased as a result of the change in land use type, but the grain supply service increased continuously with the change in cultivation conditions [47]. The GPB had high WY and FP services, but because the WY in the region was mainly used for FP, it affected the HQ to a certain extent. Therefore, in this region, it is necessary to effectively protect basic farmland, improve the quality of cropland, and enhance ecosystem regulation services, such as SC and biodiversity maintenance, by taking measures, such as building shelterbelts, to achieve the multifunctional development of ecosystem services.
The ULB distribution was primarily located in the southern Jianghuai Hills and the Yangtze River Basin. The regions boasted high proportions of cropland, water area, and construction land with a flat terrain; grain production flourished, and the water distribution was extensive, providing various ecosystem services. Thus, it served as the main urban living area. In the future, the urban development boundary should be delimited, and an ecological source area and ecological–economic corridor should be built, including structural green space, a water body, and a small amount of farmland around the city, to achieve the connection of blue–green spaces inside and outside the city and ensure that the regional development boundary and ecological protection red line do not overlap or conflict. At the same time, ecological restoration measures should be implemented to address the land and maintain the stability and service capacity of the regional ecosystem.
The MECB and CPB distributions were primarily located in the western Dabie Mountains and mountains in Southern Anhui, characterized by high-altitude mountainous areas; they featured high forest coverage, minimal human activity interference, and robust ecosystem maintenance capabilities. Between 2000 and 2010, the pace of urbanization intensified, leading to an outward expansion of the urban development area; CPBs transitioned to ULBs, which led to a contraction of the ecological red line. MECBs gradually changed to CPBs and, during this period, the cropland adjacent to ULBs was damaged, resulting in GPBs changing to ULBs. From 2010 to 2020, as an important province in the Yangtze River Delta Economic Zone, Anhui Province was still experiencing rapid urbanization development, and the GPBs continued to change to ULBs. However, during this development process, the government gradually recognized the importance of ecological resources, leading to some ULBs transitioning to CPBs and some CPBs to MECBs, thereby continuously improving the ecological environment. An MECB was situated in the core area of the ecological protection zone. This region should optimize the scope of the ecological protection red line in the future, prohibit further developments, and focus on protecting the existing forest resources in the protection zone, reducing the impact of human activities. A CPB was located at the urban development boundary, serving as the transition zone between ecological protection and urban development. The ecological environment is fragile and easily affected by human activities. In future development processes, it is imperative to establish comprehensive ecological monitoring and early warning systems for fragile zones, utilizing scientific monitoring, reasonable evaluation, and early warning services as tools to strengthen “environmental access” and guide ecological conservation and industrial development activities in these fragile zones, thus promoting ecological restoration in these areas.

4.2. Ecosystem Service Bundles and Their Driving Factors

The accurate identification of the impact of socio-ecological and other drivers on the alterations in the spatial and temporal patterns of ecosystem service bundles holds significant importance for enhancing the multifunctionality of national land space in the future [50]. The research indicates that the explanatory power of natural factors is significantly greater than that of socio-economic factors, consistent with the results obtained for the Four Lakes Basin and other regions in the area [51]. Anhui Province, a major grain-producing region, exhibits a larger spatial distribution of GPBs than other service bundles. This could be explained by the fact that agricultural activities are profoundly influenced by natural elements, such as annual precipitation, slope, elevation, and forest cover ratio. This is in agreement with the results of Lamarque et al. [52] and Feng et al. [53], who observed that mean annual precipitation, slope, and elevation are important drivers of ecosystem service bundles. Different amounts of precipitation may lead to different vegetation types and productivity, affecting ecosystem services, such as FP and biodiversity conservation. Slope affects the speed and direction of water flow, which in turn affects soil erosion and deposition processes and has a direct impact on SC; slope may also limit certain human activities, such as agricultural cultivation, which in turn affects FP. Forests can provide CS and also act as a migration corridor for wildlife, increasing landscape connectivity and influencing HQ. Anhui Province also harbors numerous natural reserves endowed with rich ecological resources, and the study area’s high proportion of MECBs and CPBs reflects reduced human interference and disturbance, high vegetation coverage, and the critical roles of elevation, slope, and precipitation in vegetation growth and development. Consequently, natural drivers are predominant in the region, necessitating stringent restrictions on agricultural production or infrastructure construction activities in these areas to mitigate environmental damage and bolster the construction and management of natural reserves. Among the socio-economic factors, the proportion of construction land exerts the greatest effect on the spatial and temporal distributions of ecosystem service bundles, which is consistent with the results obtained by Pan et al. [54] and Yan et al. [55], which show the change in the area of construction land is the main factor contributing to the spatial–temporal changes in habitat bundles. In the urbanization process, the expansion of urban area has led to a transformation of a large amount of arable and forest land into construction land. This transformation has not only resulted in a loss of vegetation cover, but also in a decline in ecosystem functions. These changes have further affected the spatial and temporal distribution patterns of ecosystem service bundles located in Anhui Province. Ecological conservation measures must be considered in regional planning and management in order to maintain a sustainable supply of ecosystem services. Gross domestic product, as a measure of economic activity, exhibited low explanatory power when accounting for the changes in ecosystem service bundles. This result is consistent with the results previously obtained by Yan [55]. China recently experienced a win–win outcome regarding economic development and ecological practices. Economic development cannot be achieved at the expense of a decline in ecological function. If the government chooses to focus on green development and high-level protection of the ecological environment, this can result in the GDP having a relatively low impact on ecosystem services.

4.3. Limitations and Prospects

This study integrated difficult-to-quantify cultural services into an ecosystem service value assessment, examined the multiple scales of current land and space planning projects in China, adopted the use of the township scale that is conducive to the implementation of land refinement management practices, extended its investigation beyond the study of a single time point in the past, thoroughly evaluated the spatio-temporal dynamic evolution of ecosystem service bundles from multiple time periods, and delineated their driving factors, offering a scientific basis for the development of reasonable ecosystem management policies in Anhui Province. However, there are still some issues that deserve further attention.
(1)
The township scale was consistent with the basic unit of ecosystem management policy implementation, which was conducive to the transformation of the research results into something more practical. However, the identification of ecosystem service bundles was affected by the evaluation methods and scales of ecosystem service capacity [31], which resulted in uncertainty in the analysis results. A comprehensive comparison of the evaluation results achieved for multiple scales and coupling them with real-life situations can ensure the scientificity and rigor of this study’s results.
(2)
Urban ecosystem services and their integrated management are greatly influenced by economic development and social demands [56]. This study only evaluated these factors from the supply perspective, then identified the service bundles. In the future, ecosystem services and service bundles can be comprehensively analyzed from both supply and demand perspectives.
(3)
As ecosystem services are provided through multiple correlated ecological processes, complex relationships usually exist among them, i.e., trade-off and synergy [57,58]. Thus, a managment decision aiming to improve an ecosystem service usually results in an improvement or degradation of another. More attention must be paid to the trade-offs and synergies in ecosystem service bundles to provide more comprehensive theoretical support for ecosystem service management.

5. Conclusions

This study employed the Invest model to quantitatively evaluate six important ecosystem services located in Anhui Province in 2000, 2010, and 2020, delineated the relevant ecosystem service bundles, and elucidated the spatio-temporal evolution characteristics of these bundles. Furthermore, we utilized GeoDetector to investigate the main driving factors that influenced the spatio-temporal changes in the ecosystem service bundles, leading to the following conclusions.
(1)
On the spatial scale, various ecosystem services exhibited significant spatial differentiation characteristics. HQ, CS, and SC services tended to be lower in the north and higher in the south, with high-value areas primarily located in the western Dabie Mountains and Southern Anhui Mountains. Conversely, FP services showed an opposite trend, while WY services displayed a gradually increasing pattern from north to south. Cultural services were spatially distributed, with high-value areas mainly located in the western Dabie Mountains and Yangtze River Basin. Temporally, from 2000 to 2020, the annual average values of WY, SC, and FP services generally presented an upward trend, with significant increases, whereas HQ, CS services, and cultural services exhibited a downward trend, albeit with minor fluctuations.
(2)
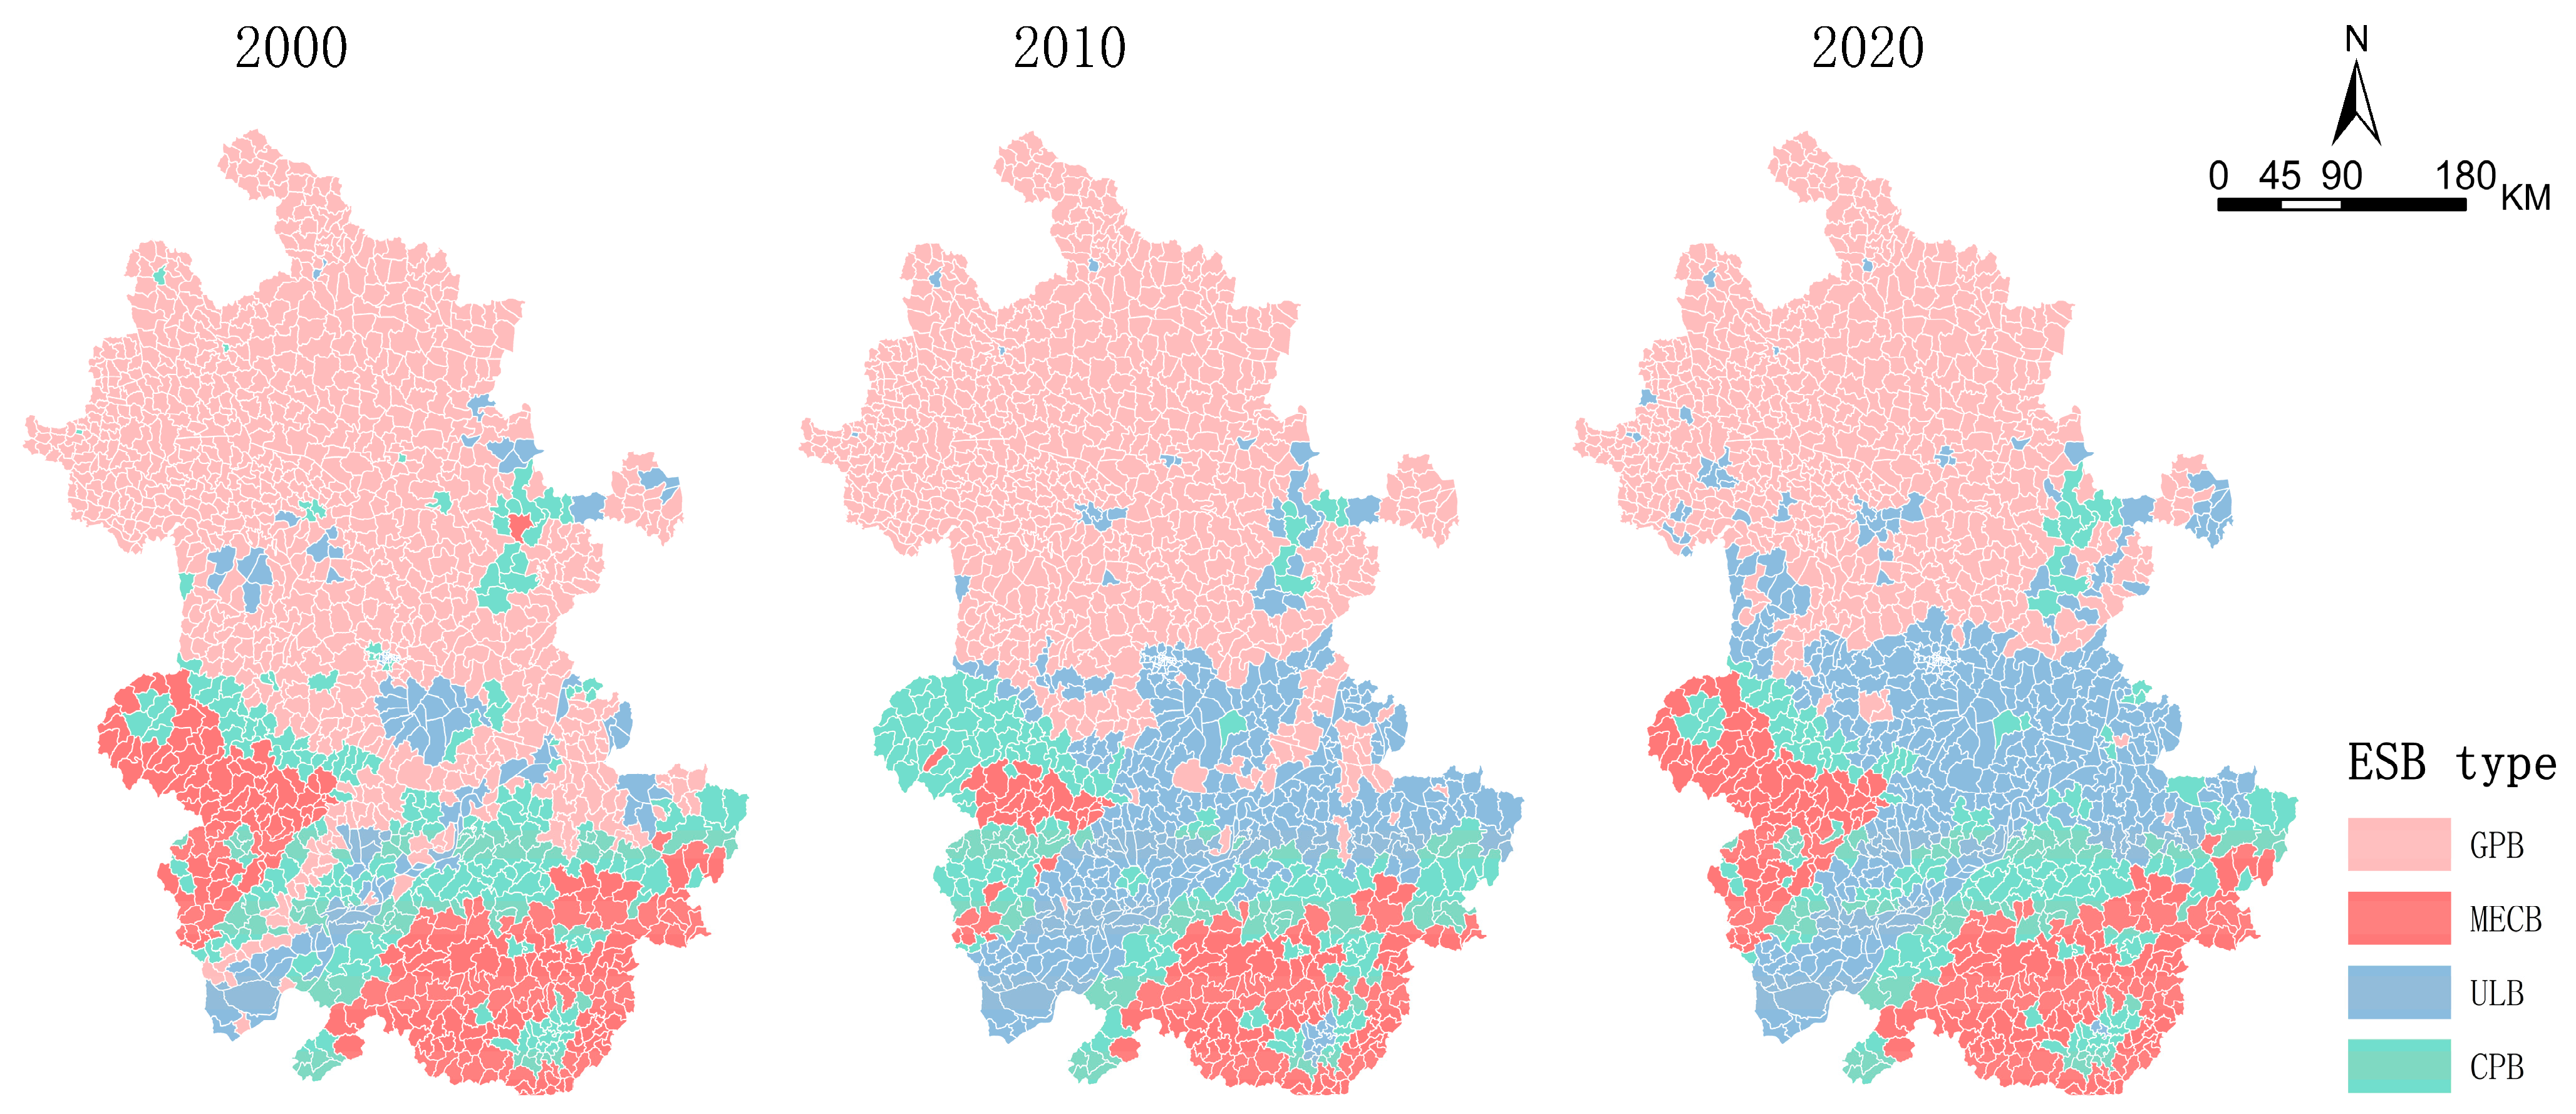
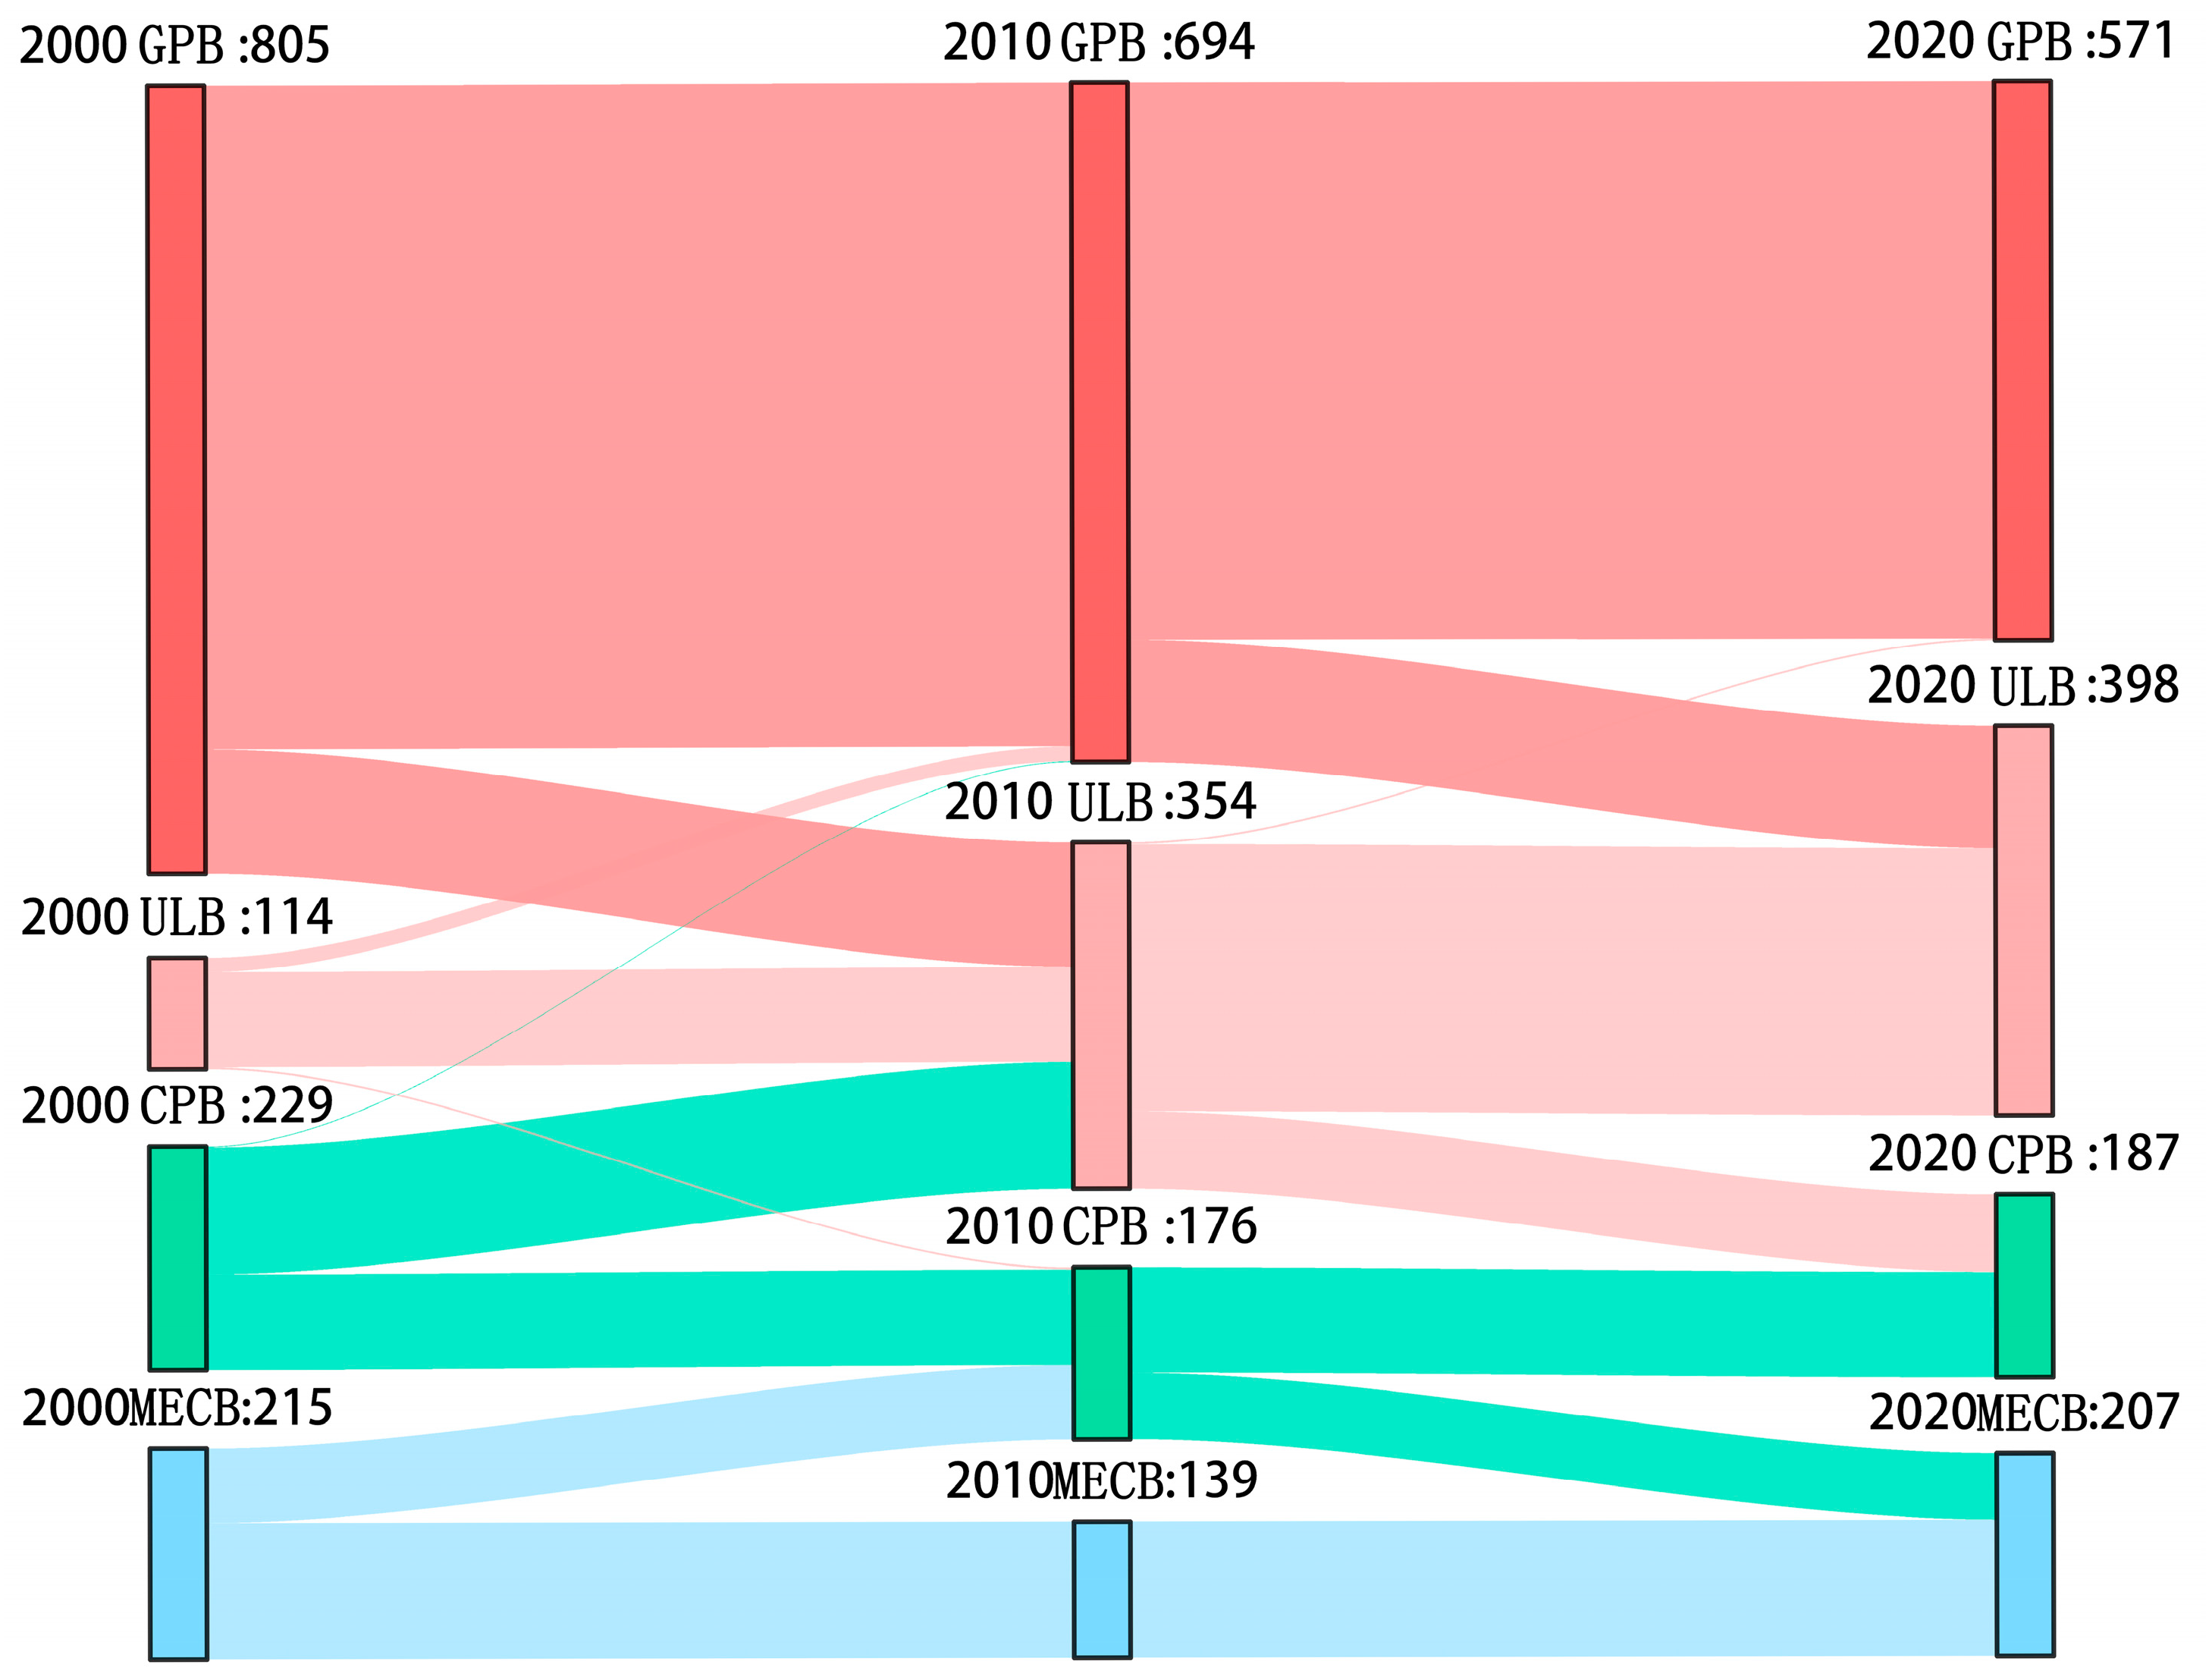
Anhui Province can be categorized into four types of service bundles: the GPB, MECB, ULB, and CPB. Each type of service bundle demonstrates distinct spatial differentiation, with similar bundles exhibiting a pronounced clustering effect in space. From 2000 to 2020, there were notable changes in quantity and spatial distribution. The GPB was the predominant local service bundle, though its dominance diminished while the proportion of the ULBs gradually increased. The numbers of MECBs and CPBs remained relatively stable.
(3)
In the spatio-temporal evolution of ecosystem service bundles, natural factors exerted a more decisive influence than socio-economic factors. Annual precipitation, forest land proportion, and slope were the primary natural factors affecting the spatio-temporal evolution of ecosystem service bundles, while the proportion of construction land was the dominant socio-economic factor.

Author Contributions

Conceptualization, Z.M. and C.L.; methodology, Z.M., J.Z., Z.L. and C.L.; software, Z.M.; validation, C.L. and J.Z.; formal analysis, Z.M.; investigation, Z.M.; resources, Z.M.; data curation, Z.M., C.L. and Z.L.; writing—original draft preparation, Z.M. and C.L.; writing—review and editing, Z.M., Z.Z., K.C. and X.H.; visualization, Z.M.; supervision, C.L.; project administration, C.L.; funding acquisition, C.L. and J.Z. All authors have read and agreed to the published version of the manuscript.

Funding

The National Natural Science Foundation of China (grant number 42371307); Natural Science Foundation of the Jiangsu Higher Institutions of China (grant number 22KJB170011); Basic Research Program of Xuzhou (grant number KC22045); and Project of Social Science Foundation of Jiangsu Province, China (grant number 20SHD010).

Data Availability Statement

Data are contained within the article.

Conflicts of Interest

The authors declare no conflicts of interest.

References

  1. Jiang, W.; Wu, T.; Fu, B. The Value of Ecosystem Services in China: A Systematic Review for Twenty Years. Ecosyst. Serv. 2021, 52, 101365. [Google Scholar] [CrossRef]
  2. Daily, G.C. Nature’s Services: Societal Dependence on Natural Ecosystems (1997). In Nature’s Services: Societal Dependence on Natural Ecosystems (1997); Yale University Press: New Haven, CT, USA, 2013. [Google Scholar]
  3. Dai, E.; Wang, X.; Zhu, J.; Zhao, D. Methods, tools and research framework of ecosystem service trade-offs. Geogr. Res. 2016, 35, 1005–1016. [Google Scholar]
  4. Roque Guerrero, J.V.; Teixeira Gomes, A.A.; de Lollo, J.A.; Moschini, L.E. Mapping Potential Zones for Ecotourism Ecosystem Services as a Tool to Promote Landscape Resilience and Development in a Brazilian Municipality. Sustainability 2020, 12, 10345. [Google Scholar] [CrossRef]
  5. Egoh, B.; Reyers, B.; Rouget, M.; Richardson, D.M.; Le Maitre, D.C.; van Jaarsveld, A.S. Mapping Ecosystem Services for Planning and Management. Agric. Ecosyst. Environ. 2008, 127, 135–140. [Google Scholar] [CrossRef]
  6. de Groot, R.S.; Alkemade, R.; Braat, L.; Hein, L.; Willemen, L. Challenges in Integrating the Concept of Ecosystem Services and Values in Landscape Planning, Management and Decision Making. Ecol. Complex. 2010, 7, 260–272. [Google Scholar] [CrossRef]
  7. Kareiva, P.; Watts, S.; McDonald, R.; Boucher, T. Domesticated Nature: Shaping Landscapes and Ecosystems for Human Welfare. Science 2007, 316, 1866–1869. [Google Scholar] [CrossRef]
  8. Renard, D.; Rhemtulla, J.M.; Bennett, E.M. Historical Dynamics in Ecosystem Service Bundles. Proc. Natl. Acad. Sci. USA 2015, 112, 13411–13416. [Google Scholar] [CrossRef] [PubMed]
  9. Li, H.; Peng, J.; Hu, Y.; Wu, W. Ecological function zoning in Inner Mongolia Autonomous Region based on ecosystem service bundles. Chin. J. Appl. Ecol. 2017, 28, 2657–2666. [Google Scholar] [CrossRef]
  10. Liu, S.; Zhang, H.; Pei, X.; Wang, Y. Ecological Function Zoning Based on Spatiotemporal Change of Ecosystem Service Bundles: A Case Study of Wuhu City in Anhui Province. Chin. Landsc. Archit. 2023, 39, 121–125. [Google Scholar] [CrossRef]
  11. Queiroz, C.; Meacham, M.; Richter, K.; Norström, A.V.; Andersson, E.; Norberg, J.; Peterson, G. Mapping Bundles of Ecosystem Services Reveals Distinct Types of Multifunctionality within a Swedish Landscape. AMBIO 2015, 44, 89–101. [Google Scholar] [CrossRef]
  12. Shen, J.; Liang, Z.; Liu, L.; Li, D.; Zhang, Y.; Li, S. Trade-offs and synergies of ecosystem service bundles in Xiong’an New Area. Geogr. Res. 2020, 39, 79–91. [Google Scholar]
  13. Bai, Y.; Ochuodho, T.O.; Yang, J.; Agyeman, D.A. Bundles and Hotspots of Multiple Ecosystem Services for Optimized Land Management in Kentucky, United States. Land 2021, 10, 69. [Google Scholar] [CrossRef]
  14. Feurer, M.; Heinimann, A.; Schneider, F.; Jurt, C.; Myint, W.; Zaehringer, J.G. Local Perspectives on Ecosystem Service Trade-Offs in a Forest Frontier Landscape in Myanmar. Land 2019, 8, 45. [Google Scholar] [CrossRef]
  15. Feng, Z.; Peng, J.; Wu, J. Ecosystem service bundles based approach to exploring the trajectories of ecosystem service spatiotemporal change: A case study of Shenzhen City. Acta Ecol. Sin. 2020, 40, 2545–2554. [Google Scholar]
  16. Liu, Y.; Lü, Y.; Fu, B.; Harris, P.; Wu, L. Quantifying the Spatio-Temporal Drivers of Planned Vegetation Restoration on Ecosystem Services at a Regional Scale. Sci. Total Environ. 2019, 650, 1029–1040. [Google Scholar] [CrossRef] [PubMed]
  17. Sasaki, K.; Hotes, S.; Ichinose, T.; Doko, T.; Wolters, V. Hotspots of Agricultural Ecosystem Services and Farmland Biodiversity Overlap with Areas at Risk of Land Abandonment in Japan. Land 2021, 10, 1031. [Google Scholar] [CrossRef]
  18. Lyu, R.; Clarke, K.C.; Zhang, J.; Feng, J.; Jia, X.; Li, J. Spatial Correlations among Ecosystem Services and Their Socio-Ecological Driving Factors: A Case Study in the City Belt along the Yellow River in Ningxia, China. Appl. Geogr. 2019, 108, 64–73. [Google Scholar] [CrossRef]
  19. Yang, G.; Ge, Y.; Xue, H.; Yang, W.; Shi, Y.; Peng, C.; Du, Y.; Fan, X.; Ren, Y.; Chang, J. Using Ecosystem Service Bundles to Detect Trade-Offs and Synergies across Urban–Rural Complexes. Landsc. Urban Plan. 2015, 136, 110–121. [Google Scholar] [CrossRef]
  20. Maes, J.; Paracchini, M.L.; Zulian, G.; Dunbar, M.B.; Alkemade, R. Synergies and Trade-Offs between Ecosystem Service Supply, Biodiversity, and Habitat Conservation Status in Europe. Biol. Conserv. 2012, 155, 1–12. [Google Scholar] [CrossRef]
  21. Jaung, W.; Bull, G.Q.; Putzel, L.; Kozak, R.; Elliott, C. Bundling Forest Ecosystem Services for FSC Certification: An Analysis of Stakeholder Adaptability. Int. Forest. Rev. 2016, 18, 452–465. [Google Scholar] [CrossRef]
  22. Gan, S.; Xiao, Y.; Qin, K.; Liu, J.; Xu, J.; Wang, Y.; Niu, Y.; Huang, M.; Xie, G. Analyzing the Interrelationships among Various Ecosystem Services from the Perspective of Ecosystem Service Bundles in Shenyang, China. Land 2022, 11, 515. [Google Scholar] [CrossRef]
  23. Chen, T.; Feng, Z.; Zhao, H.; Wu, K. Identification of Ecosystem Service Bundles and Driving Factors in Beijing and Its Surrounding Areas. Sci. Total Environ. 2020, 711, 134687. [Google Scholar] [CrossRef] [PubMed]
  24. Xu, J.; Wang, S.; Xiao, Y.; Xie, G.; Wang, Y.; Zhang, C.; Li, P.; Lei, G. Mapping the Spatiotemporal Heterogeneity of Ecosystem Service Relationships and Bundles in Ningxia, China. J. Clean. Prod. 2021, 294, 126216. [Google Scholar] [CrossRef]
  25. Liu, S.; Chen, N.; Dong, Y. A Study on the Zoning of Ecological Functions and Control Strategies Based on the Perspective of Ecosystem Service Bundles: Case Study in Jiaxing. Landsc. Archit. 2022, 39, 21–29. [Google Scholar]
  26. Dittrich, A.; Seppelt, R.; Václavík, T.; Cord, A.F. Integrating Ecosystem Service Bundles and Socio-Environmental Conditions–A National Scale Analysis from Germany. Ecosyst. Serv. 2017, 28, 273–282. [Google Scholar] [CrossRef]
  27. Raudsepp-Hearne, C.; Peterson, G.D.; Bennett, E.M. Ecosystem Service Bundles for Analyzing Tradeoffs in Diverse Landscapes. Proc. Natl. Acad. Sci. USA 2010, 107, 5242–5247. [Google Scholar] [CrossRef] [PubMed]
  28. Li, T.; Lü, Y.; Fu, B.; Hu, W.; Comber, A.J. Bundling Ecosystem Services for Detecting Their Interactions Driven by Large-Scale Vegetation Restoration: Enhanced Services While Depressed Synergies. Ecol. Indic. 2019, 99, 332–342. [Google Scholar] [CrossRef]
  29. Liu, Y.; Li, T.; Zhao, W.; Wang, S.; Fu, B. Landscape Functional Zoning at a County Level Based on Ecosystem Services Bundle: Methods Comparison and Management Indication. J. Environ. Manag. 2019, 249, 109315. [Google Scholar] [CrossRef]
  30. Gou, M.; Li, L.; Ouyang, S.; Wang, N.; La, L.; Liu, C.; Xiao, W. Identifying and Analyzing Ecosystem Service Bundles and Their Socioecological Drivers in the Three Gorges Reservoir Area. J. Clean. Prod. 2021, 307, 127208. [Google Scholar] [CrossRef]
  31. Madrigal-Martínez, S.; Miralles I García, J.L. Assessment Method and Scale of Observation Influence Ecosystem Service Bundles. Land 2020, 9, 392. [Google Scholar] [CrossRef]
  32. Liu, J.; Li, J.; Qin, K.; Zhou, Z.; Yang, X.; Li, T. Changes in Land-Uses and Ecosystem Services under Multi-Scenarios Simulation. Sci. Total Environ. 2017, 586, 522–526. [Google Scholar] [CrossRef]
  33. Hamann, M.; Biggs, R.; Reyers, B. Mapping Social–Ecological Systems: Identifying ‘Green-Loop’ and ‘Red-Loop’ Dynamics Based on Characteristic Bundles of Ecosystem Service Use. Glob. Environ. Change 2015, 34, 218–226. [Google Scholar] [CrossRef]
  34. Baró, F.; Gómez-Baggethun, E.; Haase, D. Ecosystem Service Bundles along the Urban-Rural Gradient: Insights for Landscape Planning and Management. Ecosyst. Serv. 2017, 24, 147–159. [Google Scholar] [CrossRef]
  35. Yang, W.; Wang, C.; Sun, X.; Yang, P.; Wang, Y. Impacts of landscape pattern on ecosystem and the spatial optimization of agricultural production region-A case of Beijing. Chin. J. Agric. Resour. Reg. Plan. 2024, 45, 116–128. [Google Scholar]
  36. Wang, J.; Xu, C. Geodetector: Principle and prospective. Acta Geogr. Sin. 2017, 72, 116–134. [Google Scholar]
  37. Su, Y.; Li, T.; Cheng, S.; Wang, X. Spatial Distribution Exploration and Driving Factor Identification for Soil Salinisation Based on Geodetector Models in Coastal Area. Ecol. Eng. 2020, 156, 105961. [Google Scholar] [CrossRef]
  38. Cao, Y.; Sun, Y.; Chen, Z.; Yan, H.; Qian, S. Dynamic Changes of Vegetation Ecological Quality in the Yellow River Basin and Its Response to Extreme Climate during 2000–2020. Acta Ecol. Sin. 2022, 42, 4524–4535. [Google Scholar] [CrossRef]
  39. Liu, Y.; Zhang, J.; Zhou, D.; Ma, J.; Dang, R.; Ma, J.; Zhu, X. Temporal and Spatial Variation of Carbon Storage in the Shule River Basin Based on InVEST Model. Acta Ecol. Sin. 2021, 41, 4052–4065. [Google Scholar] [CrossRef]
  40. Sun, F.; Fang, F.; Hong, W.; Luo, H.; Yu, J.; Fang, L.; Miao, Y. Evolution Analysis and Prediction of Carbon Storage in Anhui Province Based on PLUS and InVEST Model. J. Soil Water Conserv. 2023, 37, 151–158. [Google Scholar] [CrossRef]
  41. Sharp, R.; Tallis, H.T.; Ricketts, T. InVEST Version 3.2.0 User’s Guide; The Natural Capital Project: Stanford, CA, USA, 2015. [Google Scholar]
  42. Wen, X.; Wang, J.; Han, X.; Ma, L. Where Are the Trade-Offs in Multiple Ecosystem Services in the Process of Ecological Restoration? A Case Study on the Vegetation Restoration Area in the Loess Plateau, Northern Shaanxi. Land 2024, 13, 70. [Google Scholar] [CrossRef]
  43. Wall, D.H.; Six, J. Give Soils Their Due. Science 2015, 347, 695. [Google Scholar] [CrossRef] [PubMed]
  44. Zhao, G.; Mu, X.; Wen, Z.; Wang, F.; Gao, P. Soil erosion, conservation, and eco-environment changes in the loess plateau of China. Land Degrad. Dev. 2013, 24, 499–510. [Google Scholar] [CrossRef]
  45. Yue, W.; Hou, L.; Xia, H.; Wei, J.; Lu, Y. Territorially Ecological Restoration Zoning and Optimization Strategy in Guyuan City of Ningxia, China: Based on the Balance of Ecosystem Service Supply and Demand. Ying Yong Sheng Tai Xue Bao = J. Appl. Ecol. 2022, 33, 149–158. [Google Scholar]
  46. Tao, P.; Wu, S.-h.; Dai, E.-f.; Liu, Y.-j. Spatiotemporal Variation of Water Source Supply Service in Three Rivers Source Area of China Based on InVEST Model. Chin. J. Appl. Ecol. 2013, 24, 183. [Google Scholar]
  47. Peng, L.; Deng, W.; Huang, P.; Liu, Y. Evaluation of multiple ecosystem services landscape index and identification ofecosystem services bundles in Sichuan Basin. Acta Ecol. Sin. 2021, 41, 9328–9340. [Google Scholar]
  48. Liu, D.; Chen, H.; Li, T.; Zhang, H.; Geng, Y. Spatiotemporal differentiation of village ecosystem service bundles in the loess hilly and gully region and terrain gradient analysis. Prog. Geogr. 2022, 41, 670–681. [Google Scholar] [CrossRef]
  49. Qiao, X.; Yang, Z.; Yang, Y. Trade-off and Synergy of Ecosystem Services and Their Scale Effects in the Huaihe River Basin from 1995 to 2020. Areal Res. Dev. 2023, 42, 150–154+166. [Google Scholar]
  50. Kong, L.; Zheng, H.; Xiao, Y.; Ouyang, Z.; Li, C.; Zhang, J.; Huang, B. Mapping Ecosystem Service Bundles to Detect Distinct Types of Multifunctionality within the Diverse Landscape of the Yangtze River Basin, China. Sustainability 2018, 10, 857. [Google Scholar] [CrossRef]
  51. Wang, B.; Wang, L.; Chen, J.; Qi, Q.; He, S.; Yang, X.; Li, Z.; Li, H. Identification of ecological functional zoning and its influencing factors in the Sihu Lake Basin, China. Chin. J. Appl. Ecol. 2023, 34, 2757–2766. [Google Scholar] [CrossRef]
  52. Lamarque, P.; Lavorel, S.; Mouchet, M.; Quetier, F. Plant Trait-Based Models Identify Direct and Indirect Effects of Climate Change on Bundles of Grassland Ecosystem Services. Proc. Natl. Acad. Sci. USA 2014, 111, 13751–13756. [Google Scholar] [CrossRef]
  53. Feng, Q.; Zhao, W.; Fu, B.; Ding, J.; Wang, S. Ecosystemservice Trade-Offs and Their Influencing Factors: A Case Study in the Loess Plateau of China. Sci. Total Environ. 2017, 607, 1250–1263. [Google Scholar] [CrossRef] [PubMed]
  54. Pan, Y.; Zheng, H.; Yi, Q.; Li, R. The change and driving factors of ecosystem service bundles: A case study of Daqing River Basin. Acta Ecol. Sin. 2021, 41, 5204–5213. [Google Scholar]
  55. Yan, X.; Li, X.; Liu, C.; Li, J.; Zhong, J. Spatial evolution trajectory of ecosystem service bundles and its social-ecological driven by geographical exploration: A case study of Dalian. Acta Ecol. Sin. 2022, 42, 5734–5747. [Google Scholar]
  56. Meng, X.; Wu, Y. Supply-demand bundles and ecological function management of urban ecosystem services: Taking central urban area of Oigihar as an example. Chin. J. Appl. Ecol. 2023, 34, 3393–3403. [Google Scholar] [CrossRef] [PubMed]
  57. Cord, A.F.; Bartkowski, B.; Beckmann, M.; Dittrich, A.; Hermans-Neumann, K.; Kaim, A.; Lienhoop, N.; Locher-Krause, K.; Priess, J.; Schroeter-Schlaack, C.; et al. Towards Systematic Analyses of Ecosystem Service Trade-Offs and Synergies: Main Concepts, Methods and the Road Ahead. Ecosyst. Serv. 2017, 28, 264–272. [Google Scholar] [CrossRef]
  58. Zheng, H.; Wang, L.; Wu, T. Coordinating Ecosystem Service Trade-Offs to Achieve Win-Win Outcomes: A Review of the Approaches. J. Environ. Sci. 2019, 82, 103–112. [Google Scholar] [CrossRef]
Figure 1. Location of Anhui Province.
Land 13 00736 g001
Figure 2. Spatial distribution of six typical ecosystem services in Anhui Province from 2000 to 2020.
Land 13 00736 g002
Figure 3. Functional structure of ecosystem service bundles in Anhui Province from 2000 to 2020.
Land 13 00736 g003
Figure 4. Spatial distribution of ecosystem service bundles in Anhui Province from 2000 to 2020.
Land 13 00736 g004
Figure 5. Change process for ecosystem service bundles in Anhui Province from 2000 to 2020.
Land 13 00736 g005
Table 1. LA indicators.
Element LayerIndicator LayerWeight
LASHDI0.5
CONTAG0.5
Table 2. Ecosystem service bundle impact factors.
Element LayerIndicator Layer
Socio-Economic Factors Proportion of Construction Land
Gross Domestic Product
Population Density
Natural FactorsNormalized Difference Vegetation Index
Slope
Elevation
Forest Cover Ratio
Annual Average Precipitation
Annual Average Temperature
Table 3. Annual averages of and changes in six ecosystem services in Anhui Province from 2000 to 2020.
YearWY (mm)HQCS (t/hm2)SC (t/hm2)FP (t/hm2)LA
2000306.3610.23286.6924326.3901.7640.144
2010504.8530.22986.5356804.2172.1990.144
2020609.6280.22486.2017017.9882.8690.143
Change from 2000 to 2010198.492−0.003−0.1572477.8270.4350
Change from 2010 to 2020104.775−0.005−0.334213.7710.67−0.001
Change from 2000 to 2020303.267−0.008−0.4912691.5981.105−0.001
Table 4. Detection of ecosystem service bundle impact factors in Anhui Province from 2000 to 2020.
Element LayerIndicator Layer200020102020Mean
Socio-Economic Factors Proportion of Construction Land0.3810.4660.2800.376
Gross Domestic Product0.0750.0790.0450.066
Population Density0.1480.1410.0900.126
Natural FactorsNormalized Difference Vegetation Index0.1080.0990.1420.116
Slope0.4560.4820.3230.420
Elevation0.3290.3390.2110.293
Forest Cover Ratio0.4410.4990.3620.434
Annual Average Precipitation0.3290.6040.6230.518
Annual Average Temperature0.1330.2770.4590.289
Disclaimer/Publisher’s Note: The statements, opinions and data contained in all publications are solely those of the individual author(s) and contributor(s) and not of MDPI and/or the editor(s). MDPI and/or the editor(s) disclaim responsibility for any injury to people or property resulting from any ideas, methods, instructions or products referred to in the content.

