Abstract
As a world-class urban agglomeration, the Yangtze River Delta urban agglomeration is significant for China’s carbon neutrality strategy when calculating the carbon budget and dividing carbon compensation zones. This paper focused on 129 county-level cities in the core area of the Yangtze River Delta urban agglomeration, calculating the carbon budget for 2000–2020 using night-time light data and analyzing the evolution of spatiotemporal patterns. On this basis, a carbon compensation zoning model was constructed using the K-means algorithm; 129 cities were divided into different carbon compensation zones after combining this model with the main functional zones. The results showed that (1) the carbon emissions increased, with overall stabilization after 2012. The distribution of high carbon emission areas evolved from a “core-periphery” pattern into a “Z-shaped” pattern. Ecological carbon sinks showed a continuous decline, with the southern sinks performing better than the northern ones. (2) The carbon budget of the study area showed a deficit, gradually widening and exhibiting an unbalanced spatial distribution characterized by a “high in the south and low in the north” pattern. (3) Eleven types of carbon compensation zones were designated after overlaying the main functional zones. Low-carbon development suggestions were proposed for each zone type.
1. Introduction
Carbon emissions from human activities are contributing to global warming, leading to heightened climate extremes, rising sea levels, and food and water shortages, which present substantial threats to human life. Sea levels will rise by 0.6–3 m in 2030 under a high carbon emissions situation [1], and at least 50 major cities will be at risk of inundation globally, mainly in Asia [2]. The probability of extreme events increases by 340% every 20 years (under 2 °C warming) [3]. Countries accounting for more than 70% of the world’s population and global GDP will be exposed to more than 500% of the risk of flooding (under conditions of a 4 °C rise in temperatures) [4], and the frequency of category 4 and 5 hurricanes in the Atlantic will double [5]. These changes not only seriously threaten the safety of human life and property but also threaten the global ecological balance. Warming also poses a huge potential threat to China, where the frequency of heavy precipitation and droughts continues to increase [6], as do flood losses [7]. China is the largest developing country and the largest emitter of carbon dioxide. In response to the climate crisis, China has committed to reaching the peak of carbon emissions around 2030 and striving to achieve “carbon neutrality” by 2060. Achieving carbon peaking and carbon neutrality is an important strategic decision for China.
Carbon budget is a measure of the balance between carbon emissions and carbon sinks, often expressed as the difference between the two. The traditional methods for calculating carbon emissions include the IPCC emission factor method [8], the actual measurement method [9], the input–output method [10,11], life cycle analysis [12,13], the material balance approach [14], etc., which often require a large amount of energy consumption data and a complicated calculation process. Terrestrial ecosystems are capable of absorbing atmospheric carbon dioxide and mitigating atmospheric warming. Terrestrial ecosystems absorbed a net 31% of the carbon dioxide released by human activities over the same period from 2010 to 2019 [15]. The methods for calculating carbon sinks include the sample site inventory method [16], the eddy covariance method [17], the ecosystem process modeling method [18], the atmospheric inversion method [19]. With the rapid development of remote sensing in recent years, scholars often utilize land use data to estimate carbon sinks at different scales. Sleeter et al. calculated the carbon budget of terrestrial ecosystems in the U.S. using land use data, and the study found a large-scale decline in net terrestrial carbon sinks [20]. Scholars use parameters such as forest stock volume [21], grain yield, and moisture content of grains [22] to estimate carbon sinks, and they also frequently use carbon sequestration coefficients and land use area [23].
Reasonable calculation of the carbon budget is an essential foundation for achieving the “dual carbon” target and for local governments to formulate rational low-carbon development plans. The research mainly focuses on carbon budget calculation, spatiotemporal patterns and evolution [24], driving factor analysis [25], carbon budget projection [26], etc. Research on the spatial distribution and evolution of carbon budget is mainly focused on administrative division [27]. In addition, there are also relevant studies in areas such as agriculture [28], industry [29], marine industries [30], forests [31], grasslands [32], and others.
Carbon compensation serves as a crucial means of attaining balanced carbon rights and obligations across regions, promoting fair and sustainable development [33]. Scholars’ current research focuses on carbon compensation mechanisms [34], carbon compensation value estimation [35], and carbon compensation zoning [36]. The implementation of carbon compensation needs to be based on reasonable zoning. Due to China’s vast territory, different regions have different development bases and resource characteristics. The National Development and Reform Commission (NDRC) divides the national territory into four spatial categories, namely the optimized development zone, the key development zone, the restricted development zone (including agricultural products’ main production zone and key ecological functional zone), and the prohibited development zone, based on the development level, potential, ecological carrying capacity, and the division of labor in different regions. Scholars have often combined the main functional zones in joint analyses and provided reasonable low-carbon development recommendations for each type of carbon compensation zone [36].
Accompanied by rapid industrialization and urbanization, China’s carbon emissions increased rapidly. The total carbon emissions of China’s 286 cities increased by 152% from 2000 to 2010, with a high spatial distribution in the east and low in the west and an expanding trend in high carbon emission regions [37]. There is a large gap between carbon emissions and carbon sinks in China [38], and the regions with higher carbon budget deficits are located along the eastern coast, concentrated in Beijing, Shandong, Jiangsu, Liaoning, and Guangdong [38]. These places contain three major urban agglomerations in China: the Yangtze River Delta urban agglomeration (YRDUA), the Beijing–Tianjin–Hebei urban agglomeration, and the Guangdong–Hong Kong–Macao Greater Bay Area urban agglomeration. These urban agglomerations account for nearly 40% of China’s total GDP [39], and their carbon budget greatly affects China’s carbon budget. As the largest urban agglomeration in China, the YRDUA, its carbon emissions and carbon sinks have been the focus of scholars’ attention. Han et al. found that the carbon sinks in the Zhejiang region are three times higher than those in Shanghai and Jiangsu [40]. Zhu et al. argued that the YRDUA will realize the carbon emissions in 2030 under the low-carbon model [41].
The YRDUA, with its dense concentration of cities and a clear division of labor, is known as one of the world’s six major urban agglomerations, together with the Atlantic Coast urban agglomerations of northeastern United States, the Great Lakes urban agglomerations of North America, the Pacific Coast urban agglomerations of Japan, the British urban agglomerations, and Northwest Europe urban agglomeration. The core area of the Yangtze River Delta urban agglomeration (CAYRDUA) is an area with a high concentration of the economy, population, industry, and carbon emissions within the YRDUA, along with strong economic radiation capability. It is an important engine of the YRDUA. The region accounted for 31.78% of the land area of the YRDUA, 52.23% of the total population, and 53.49% of the GDP of the YRDUA in 2020. It boasts a high urbanization rate of 79.17% and accounts for 63.96% of the total electricity consumption in the YRDUA. County-level cities in the CAYRDUA are actively developing, with significant differences in the economic base, functional positioning, and industrial structure. For example, the Chongming District in Shanghai is currently developing as a carbon-neutral demonstration area, while Kunshan City in Suzhou has a concentrated manufacturing industry, a highly developed economy, a solid industrial base, and a substantial energy demand, with its GDP surpassing that of three provincial-level administrative divisions in 2020. Therefore, the study of carbon budget in the CAYRDUA must be conducted at the county level to better reflect the actual situation and development pattern of the study area. Such studies are important in identifying low-carbon development pathways in both global and Chinese contexts.
Calculating carbon emissions often relies on energy consumption data, which are generally unavailable at the municipal and county levels in China and are not conducive to long-time-series carbon emission studies. Carbon emission calculation methods based on night-time light data can remedy this problem. Night-time light data have been shown to have a linear relationship with carbon emissions [42,43] and can explain 96% of the variation in carbon dioxide emissions among Chinese provinces [44]. In this paper, based on two types of night-time light data (DMSP/OLS and NPP/VIIRS), land use data, energy consumption data, and other socio-economic data, we calculate the carbon budget of county-level cities in the CAYDRUA from 2000 to 2020 and analyze their spatiotemporal distribution and evolutionary patterns. The normalized revealed comparative advantage (NRCA) index is used to quantify the three attributes of socio-economy, ecology, and the scale of carbon emissions. Additionally, the K-means algorithm is used to classify the carbon compensation zones in the CAYRDUA, and reasonable low-carbon development suggestions are proposed for each zone in combination with the main functional zones.
The structure of this paper is as follows. Section 2 describes the study area, the data used, and the research framework. Section 3 presents the results of carbon emissions, carbon sinks, and carbon budget calculations for CAYDRUA and analyzes the temporal evolution and spatial evolution of the carbon budget. In addition, the result of carbon compensation zoning is shown, and low-carbon development recommendations are given for each zoning. Section 4 discusses the differences between the results of similar research and similar studies with similar urbanization patterns, as well as the trend of carbon budget development in CAYDRUA. Finally, Section 5 exhibits the conclusions of the research.
2. Materials and Methods
2.1. Study Area
The Yangtze River Delta region features a flat terrain, with the northern part comprising plains below ten meters above sea level and the southern part consisting of hilly and mountainous areas. The region has a subtropical monsoon climate with forest coverage of 32.93%, dense river networks, great development potential, and abundant natural resources [45]. The CAYRDUA (118°22′–123°25′ E, 28°01′–33°25′ N) is an urban agglomeration consisting of 8 prefecture-level cities in Jiangsu Province, 7 prefecture-level cities in Zhejiang Province, and Shanghai Municipality, including 129 county-level cities (Figure 1). Forestland in the CAYRDUA is mainly distributed in the south, while arable land is mainly distributed in Jiangsu Province in the north, and the proportion of construction land in Shanghai is higher than in other areas [46]. The region accounts for less than 2% of the national territory area, with a population of 122.95 million, contributing to a GDP of CNY 13.08 trillion, with a large population density of 1080 people per km² (Table S1).
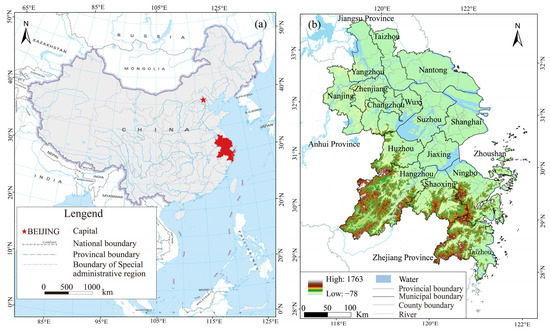
Figure 1.
Study area: (a) The location of the CAYRDUA; (b) The CAYRDUA consisting of 16 prefecture-level cities.
With the rapid urban expansion and economic development, on the one hand, the region’s demand for fossil energy has led to a rapid increase in carbon emissions, with per capita carbon emissions 1.6 times higher than the national average [40]. On the other hand, the loss of carbon sinks due to the conversion of cropland and forestland into construction land has posed a huge challenge to the ecological carrying capacity of the region. In the context of the “dual carbon” target strategy, an analysis of this region’s carbon budget can provide a reference for formulating carbon reduction plans and green development policies in the developed areas of China.
2.2. Data
In this study, the remote-sensing data used include DMSP/OLS night-time light data from 2000 to 2013 (https://ngdc.noaa.gov/, accessed on 17 July 2022) and monthly NPP/VIIRS night-time light data from 2012 to 2020 (https://eogdata.mines.edu/, accessed on 17 July 2022). Administrative division data were downloaded from the National Catalogue Service For Geographic Information (https://www.webmap.cn/, accessed on 9 September 2022). Land use data from 2000 to 2020 were obtained from the CLCD land use dataset (https://zenodo.org/records/5816591, accessed on 27 September 2023). Energy consumption data at the provincial level from 2000 to 2020 were taken from the China Energy Statistical Yearbook. Other socio-economic data were obtained from statistical yearbooks, government-issued data, and statistical bulletins of the cities in the study area. The main functional zoning came from the planning documents issued by the governments of Jiangsu Province, Zhejiang Province, and Shanghai Municipality.
2.3. Method
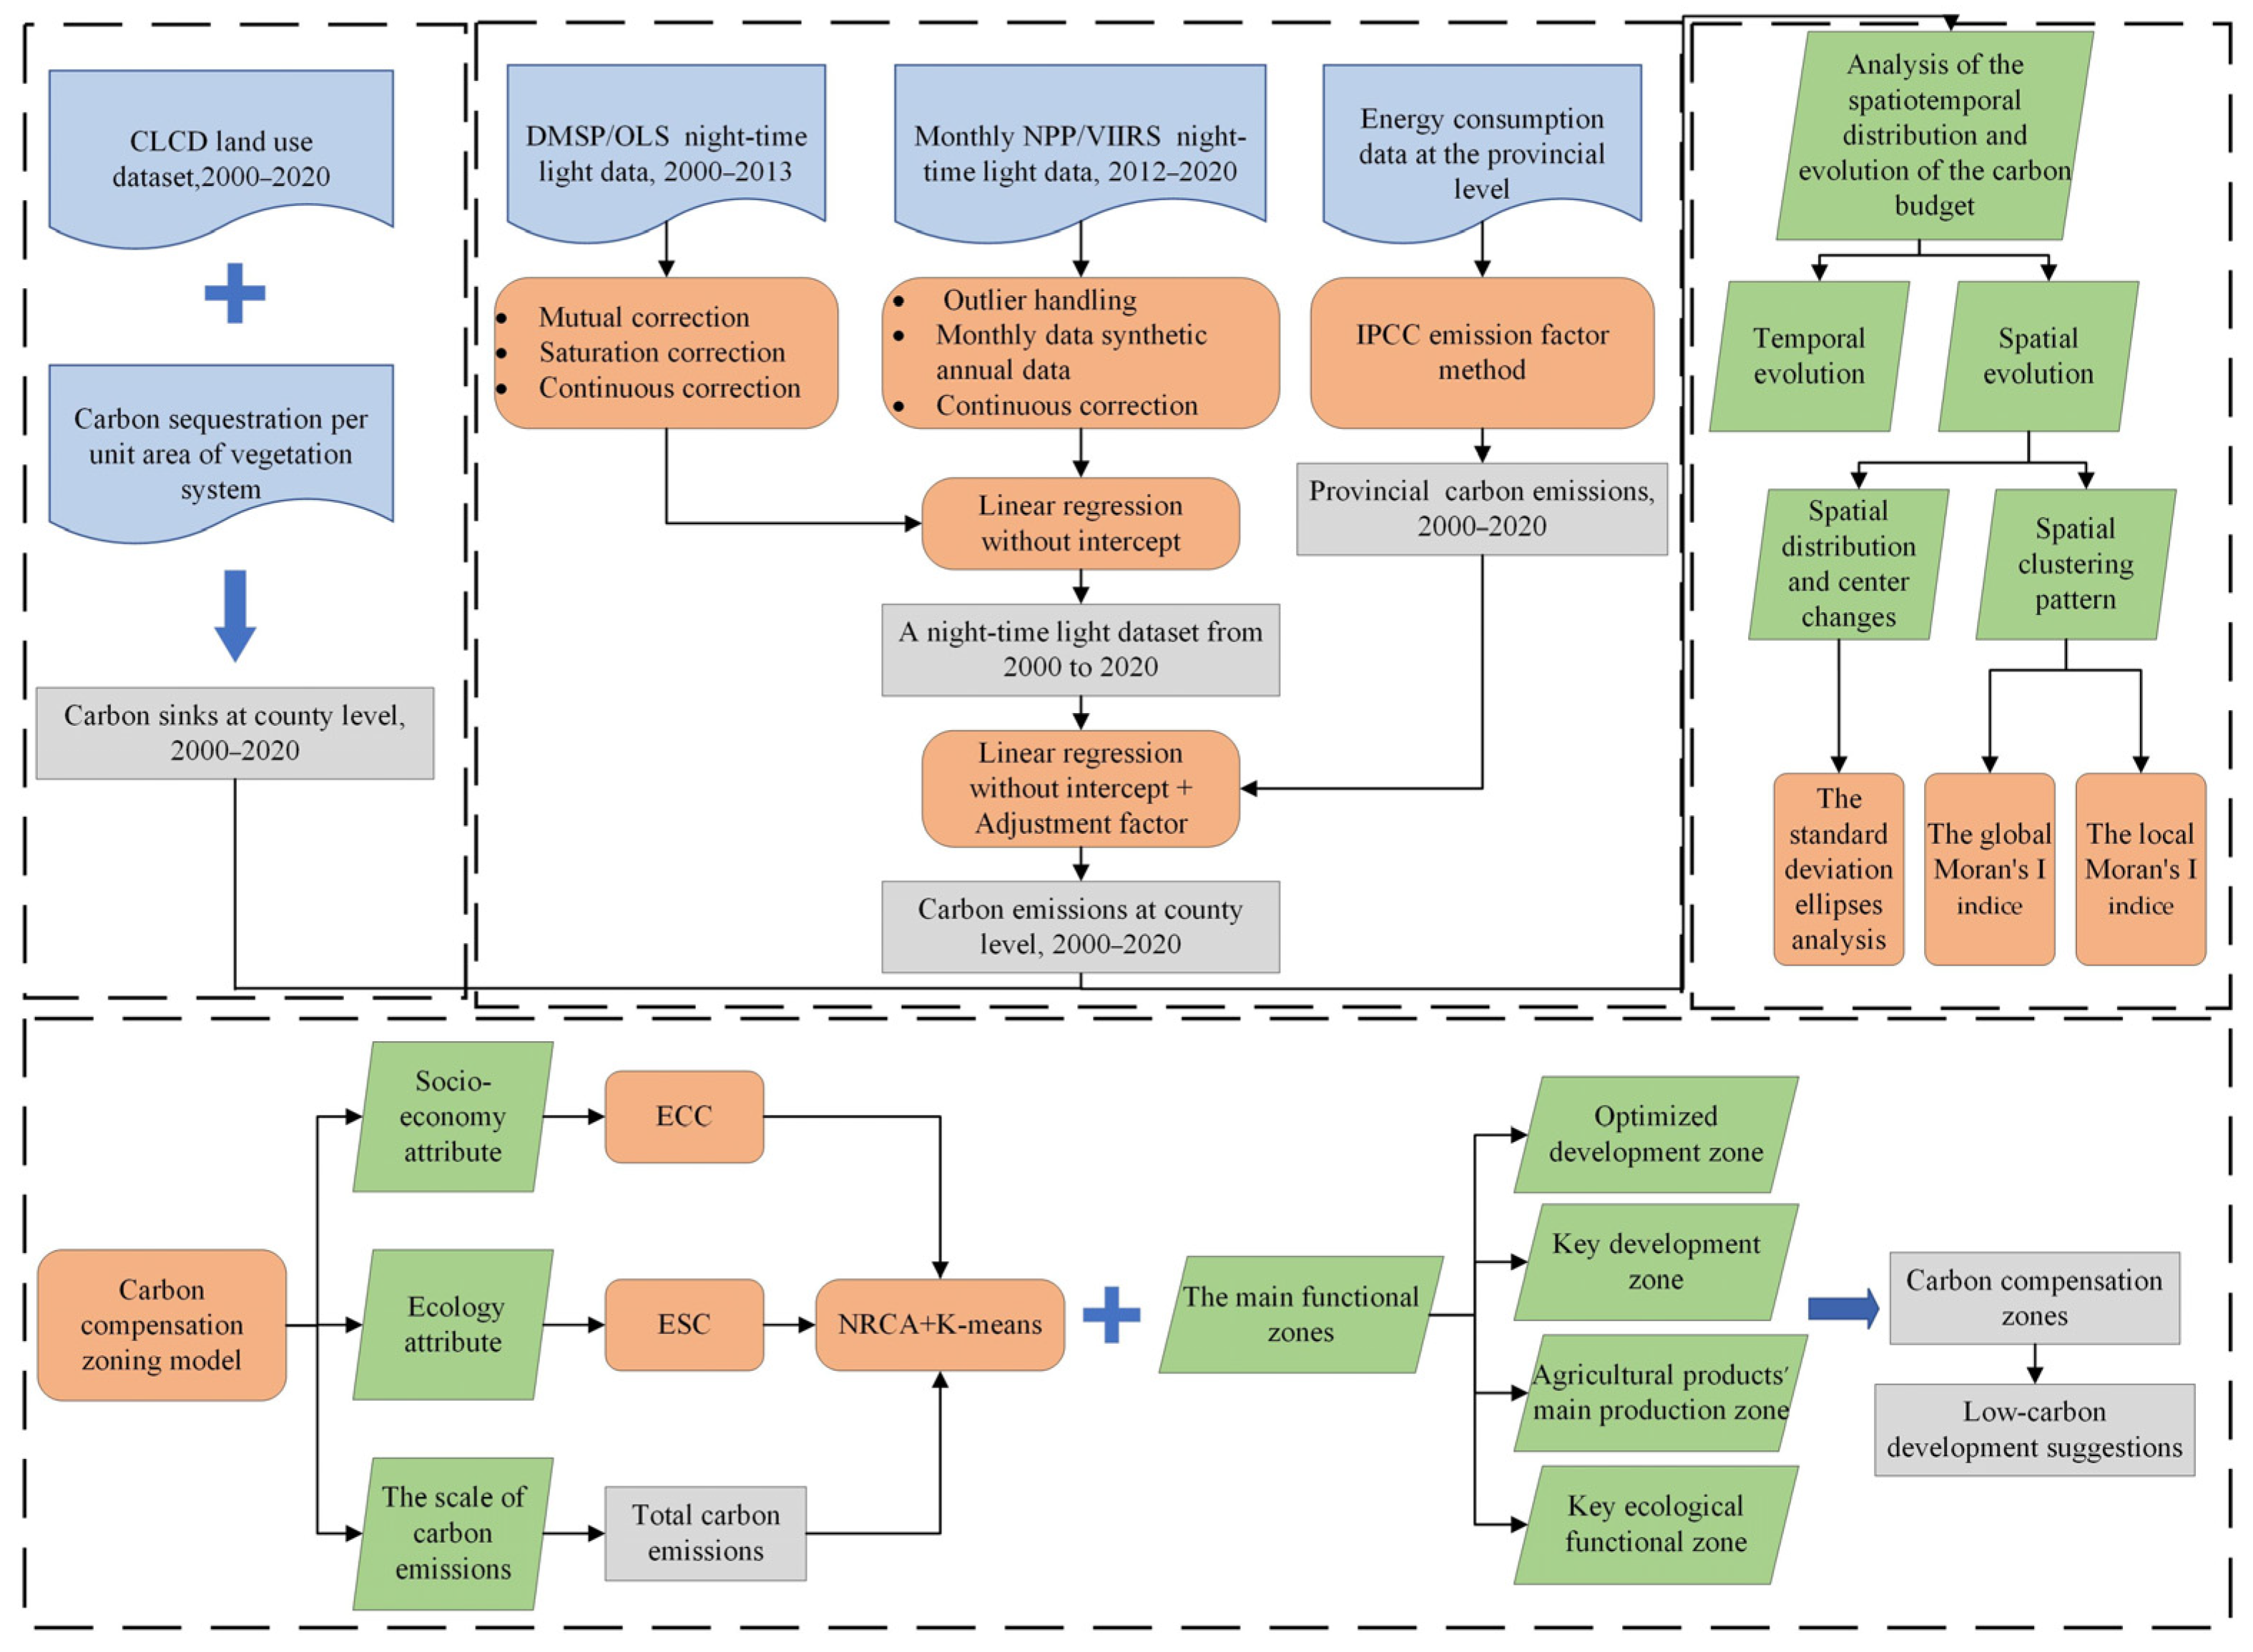
The research process of this paper is shown in Figure 2.
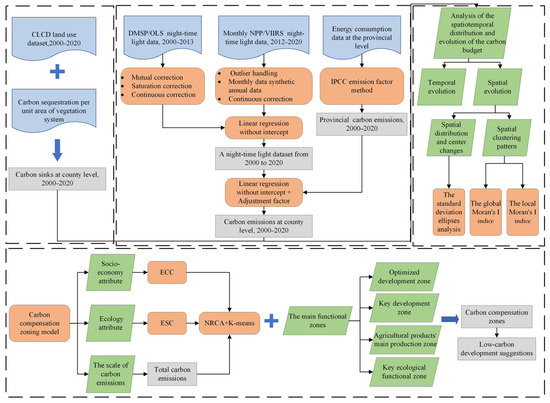
Figure 2.
Study process.
2.3.1. Calculation of Carbon Emissions
In this paper, night-time light data were used in combination with the IPCC method to calculate county-level carbon emissions [47]. Eight fossil fuels, including raw coal, coke, crude oil, gasoline, kerosene, diesel oil, fuel oil, and natural gas, were selected to calculate the provincial carbon emissions, and then, the carbon emissions at the county level were estimated based on the correlation between night-time light data and carbon emissions. The calculation formula is as follows:
where CO2 represents the carbon emissions from eight fossil fuels; Ei represents the consumption of the type of ith fossil energy converted to standard coal consumption (SCE); Ki represents the carbon emission factor of the type of ith fossil energy. The coefficients of conversion coefficients of the consumption of different energy sources to SCE, the percentage of usage for the eight fossil fuels, as well as the coefficients of the carbon emission factors, are shown in Table 1.

Table 1.
The SCE conversion factors, the percentage of usage, and carbon emission factors [48].
The processing of night-time light data consisted of three parts: the correction of DMSP/OLS data, the correction of NPP/VIIRS data, and the integration of the two night-time light data.
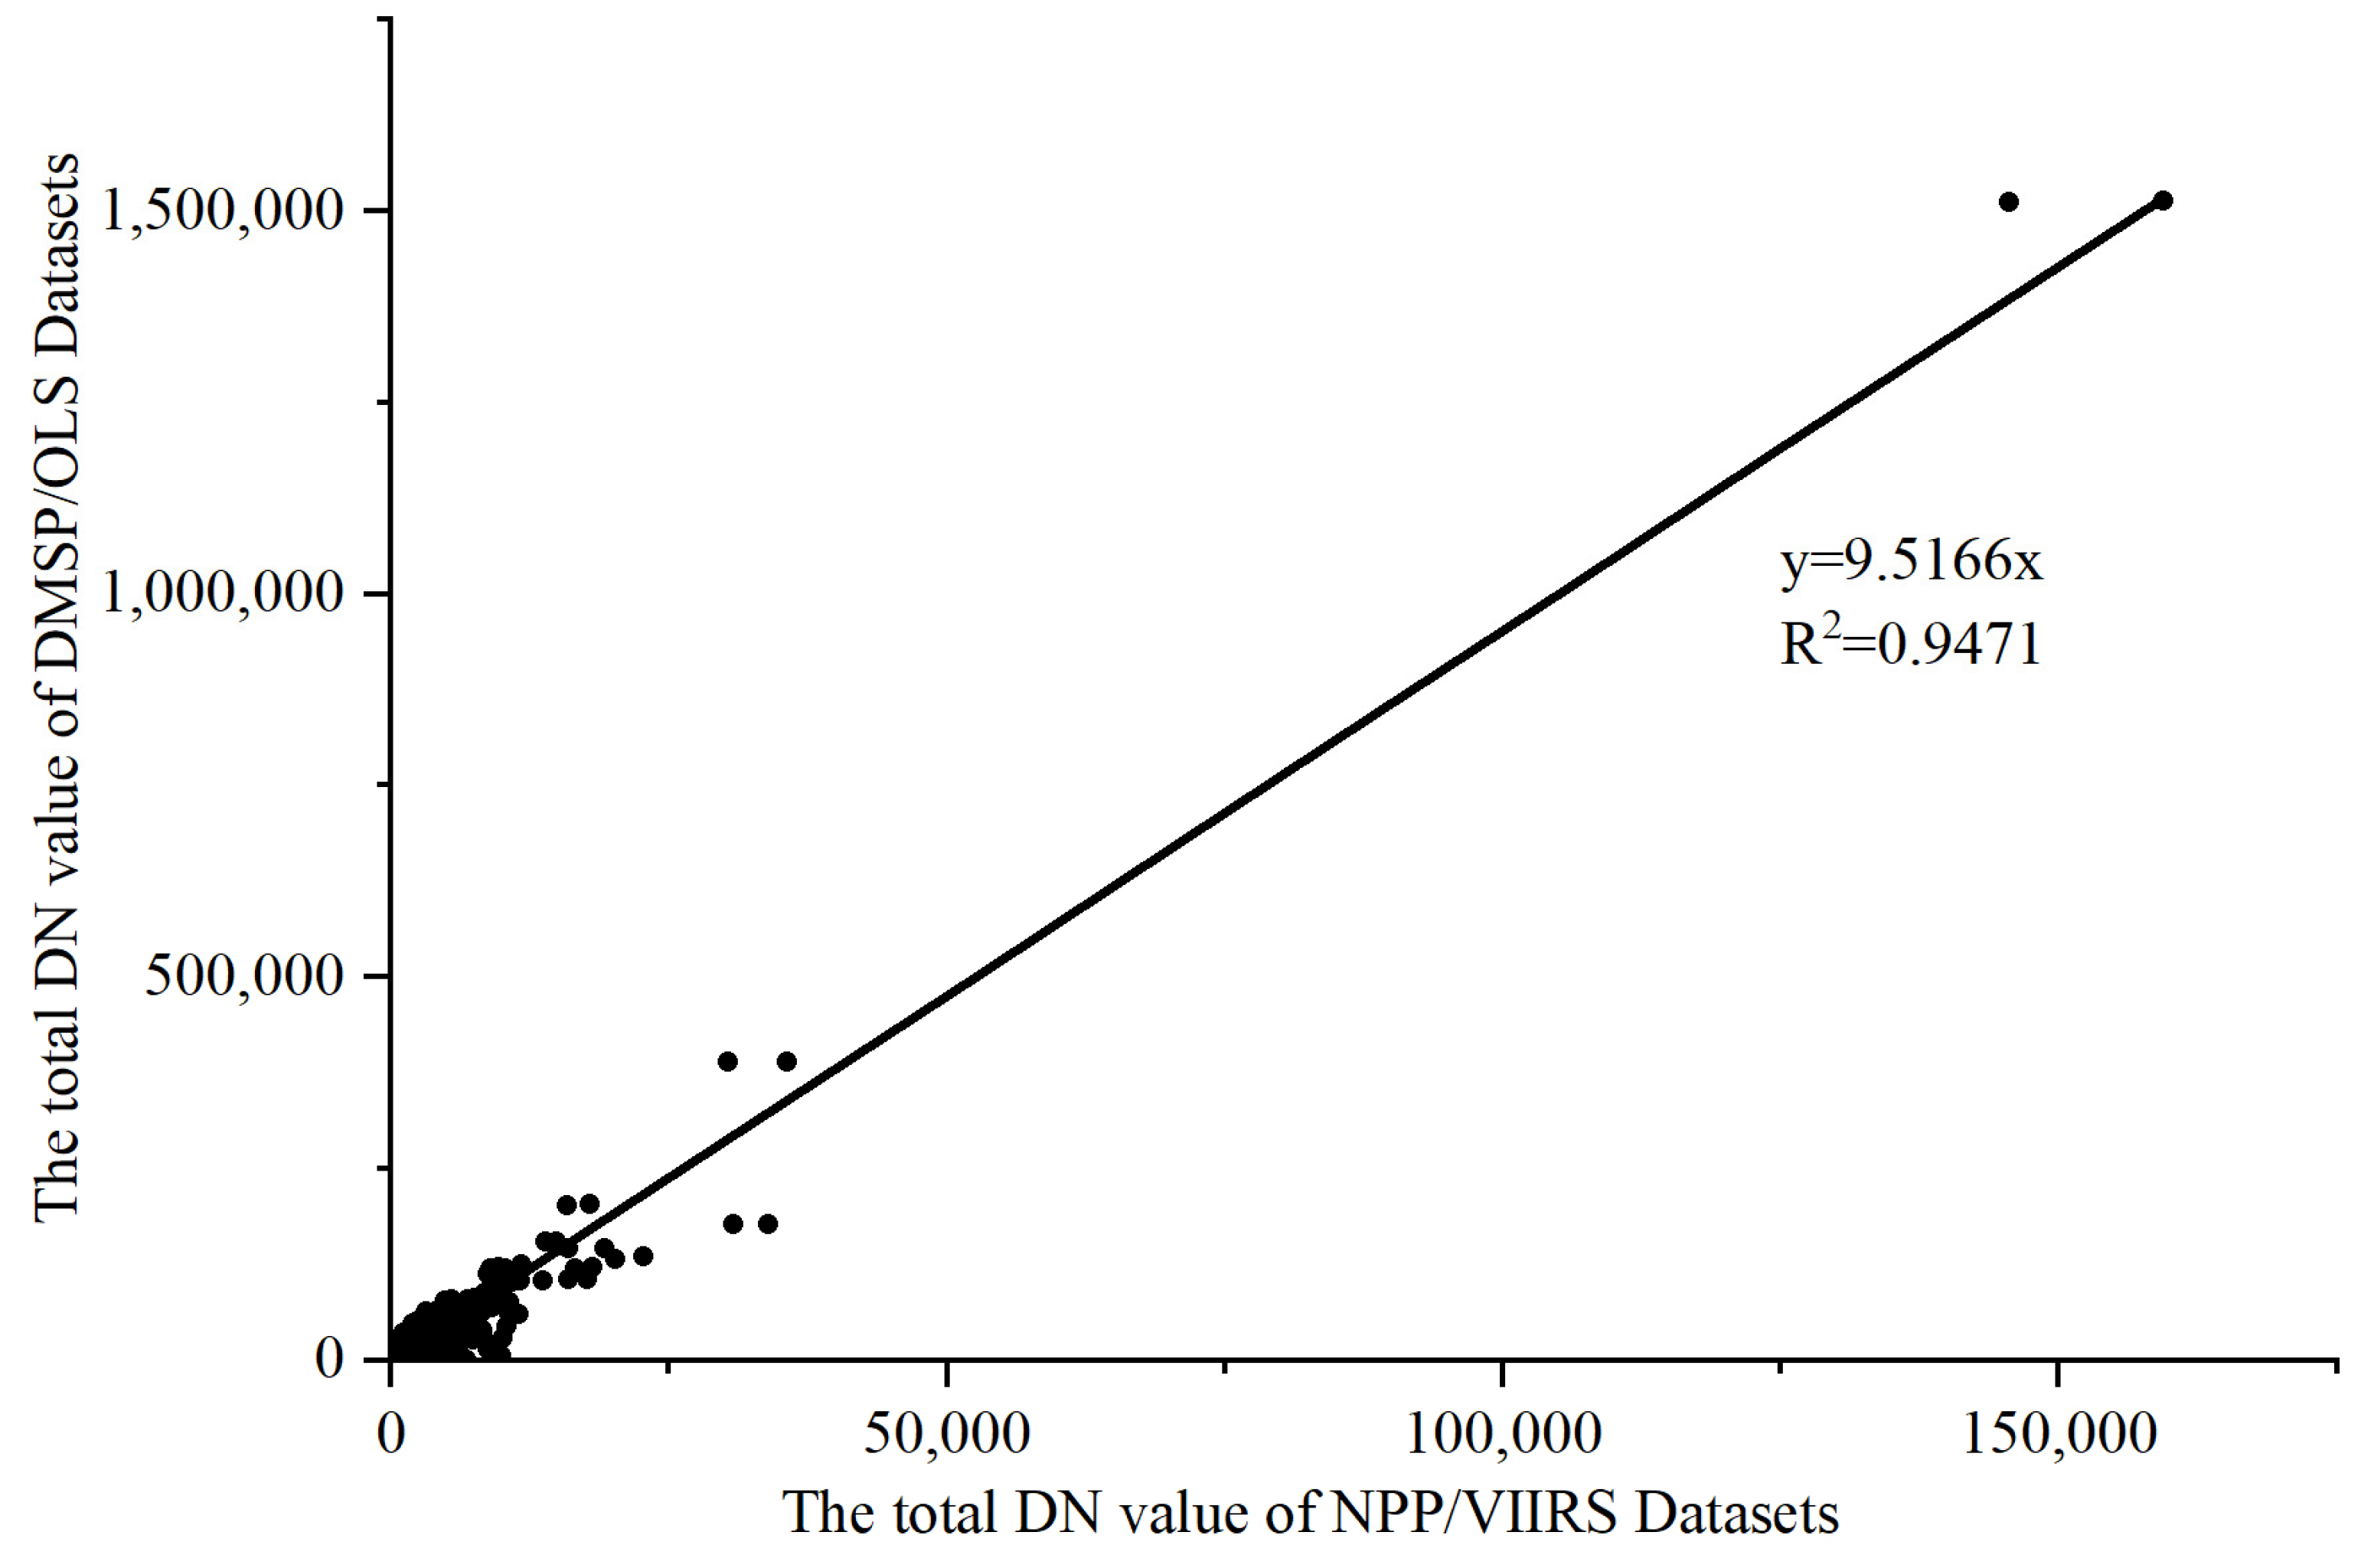
(1) The correction of DMSP/OLS night-time light data referred to the results of Lv et al., including mutual correction, saturation correction, and continuous correction [49]. (2) The correction of NPP/VIIRS data used the method of processing monthly data into annual data. The reference maximum for outlier removal was determined by selecting the brightest pixel among those of Beijing, Shanghai, and Guangzhou. Any outliers lighter than the brightest pixel were adjusted to the highest pixel value, while pixel values below 0.3 × 10⁻⁹ W·cm−2·SR−1 were identified as background noise [50]. (3) A linear regression without intercept was chosen to integrate the two night-time light data [51], and a correlation between DMSP/OLS and NPP/VIIRS county-level total DN (TDN) in 2012 and 2013 was constructed. The integrated results are shown in Figure 3, with an R2 value of 0.9471. Based on this, a night-time light dataset was constructed for 2000–2020.
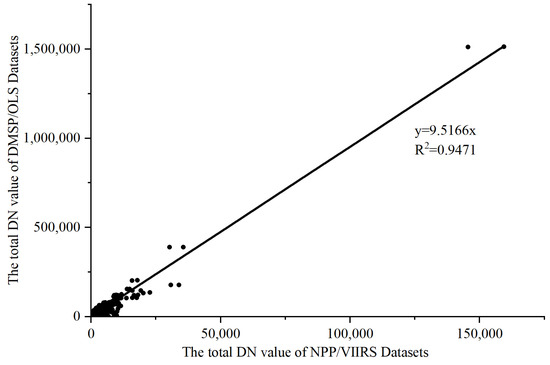
Figure 3.
The relationship between county-level TDN of two datasets in 2012 and 2013.
A linear regression without intercept was established between TDN and carbon emissions at the provincial level (e.g., Table 2) [52].
Table 2.
The linear regression model of carbon emissions.
The carbon emissions at the county level were calculated based on the linear relationship between provincial TDN and carbon emissions [53], and an adjustment factor [52] was added to the formula as follows:
where represents the county-level carbon emissions calculated using linear regression without the intercept model; represents the regression coefficient; represents TDN at the county level; represents the carbon emissions at the provincial level calculated using the IPCC method; represents the provincial-level carbon emissions calculated using linear regression without the intercept model; represents the adjustment factor; represents the results of carbon emissions at the county level.
2.3.2. Calculation of Carbon Sink
The calculation of carbon sequestration by vegetation in the aboveground portion was performed by multiplying the area of different vegetation types in the CAYRDUA by the amount of carbon sequestered per unit area. The amount of carbon sequestered per unit area by different vegetation types was derived from previous studies [54] (Table 3). The land use types and areas from 2000 to 2020 were obtained from the CLCD dataset [55].
where represents carbon sequestration by the aboveground vegetation systems in the ith county-level city; j represents the jth vegetation type; represents the area of the jth vegetation type in the ith county-level city; represents the carbon sequestration coefficient per unit area of the vegetation system.
Table 3.
Carbon sequestration per unit area of vegetation system in CAYRDUA (t·hm−2 a−1) [54].
Belowground carbon sequestration only considered plant roots and litter, and according to Li et al., the ratio of belowground–aboveground biomass (root–top ratio) was used to calculate belowground carbon sequestration per year [24]. We referred to the results of root–top ratio of different vegetation types estimated by Huang et al. [56], as shown in Table 4. The vegetation in some areas south of the Huaihe River is dominated by broad-leaved forests and coniferous forests, with root–top ratios ranging from 0.2 to 0.4 [56]. In this paper, the root–top ratio of the forest was taken as 0.2.
where represents carbon sequestration by belowground vegetation systems in the ith county-level city; represents the mean root–top ratio of the jth vegetation type; represents carbon sequestration of the ith county-level city.
Table 4.
Mean root–top ratio of various vegetation types [56].
The relationship between the amount of carbon sequestered and the mass of carbon dioxide absorbed was established through the equation of the process of photosynthesis, from which the carbon dioxide absorbed by the vegetation in the CAYRDUA was calculated annually.
2.3.3. Standard Deviation Ellipse Analysis
The standard deviation ellipse (SDE) was employed to analyze the spatial distribution of attribute values. In this study, the method of SDE analysis was utilized to examine the spatiotemporal patterns of carbon budget and variations in carbon budget centers [57].
where represent the coordinates of the center of SDE; represent the latitude and longitude coordinates of the center of the spatial observation unit i, respectively; represents the weight of the spatial observation unit i; represents the azimuth of the SDE; represent the latitude and longitude coordinate deviations between the center of spatial observation cell i and the mean center, respectively; represents the standard deviation of the extended x-axis and y-axis; n represents the total number of space observation units in the study area.
2.3.4. Spatial Autocorrelation Analysis
In this paper, the global and the local Moran’s I indices were used to analyze the general trend of aggregation and the local spatial clustering pattern of the carbon budget from 2000 to 2020. The global Moran’s I index reflects the spatial autocorrelation between different county-level cities, and the local Moran’s I index reflects the local similarities and differences between county-level cities [48]. The calculation formula is as follows:
where represents the global Moran’s I index value; represents the local Moran’s I index value; n represents the number of administrative units; and represent the carbon budget of the ith and jth county-level cities; represents the average of the carbon budget; represent the spatial weighting matrix of the ith and jth county-level cities.
2.3.5. Calculation of Carbon Budget
Carbon budget is a measure of the balance between carbon emissions and carbon sinks, often expressed as the difference between the two. The formula for calculating the carbon budget is as follows:
where represents the carbon budget; represents the carbon sink; represents carbon emissions.
2.3.6. Construction of Carbon Compensation Zoning Model
In this paper, the three attributes of socio-economy, ecology, and the scale of carbon emission were considered to constitute the carbon compensation zoning index system. The economic contribution coefficient of carbon emission (ECC) and the ecological support coefficient of the carbon sink (ESC) were selected as indicators to characterize the socio-economic and ecological attributes, respectively [58]. The expression of each index is shown below.
- (1)
- ECCwhere , represent the GDP of the ith county-level city and the whole region; , represent the carbon emissions of the ith county-level city and the whole region. The coefficient is used to measure the contribution of regional carbon emissions and the economy. When < 1, it means that the county-level city contributes more to carbon emissions than to the economy.
- (2)
- ESCwhere , represent the carbon sink of the ith county-level city and the whole region. This coefficient measures the region’s contribution to the carbon sink and carbon emissions. When > 1, it means that the county-level city contributes more to the carbon sink than to carbon emissions.
In this paper, the normalized revealed comparative advantage (NRCA) index was used to discern the comparative advantage of the different attributes of each county-level city in the CAYRDUA [58], with the following formula:
where represents the indicator value of the jth attribute for the ith county-level city; represents the value of the total indicator for the jth attribute for all county-level cities; represents the total indicator values for all attributes for the ith county-level city. X represents the total indicator value for all county-level cities and attributes. If > 0, it means that the jth attribute of the ith county-level city has a comparative advantage in the study area.
This study constructed carbon compensation zoning by clustering the NRCA index for each attribute using the method of K-means. K-means is a division-based clustering algorithm that divides categories by calculating the Euclidean distance between the sample points and the cluster class center, recalculating the sample center, and iterating until the abort condition is met.
3. Results
3.1. Analysis of Spatiotemporal Distribution of Carbon Emissions
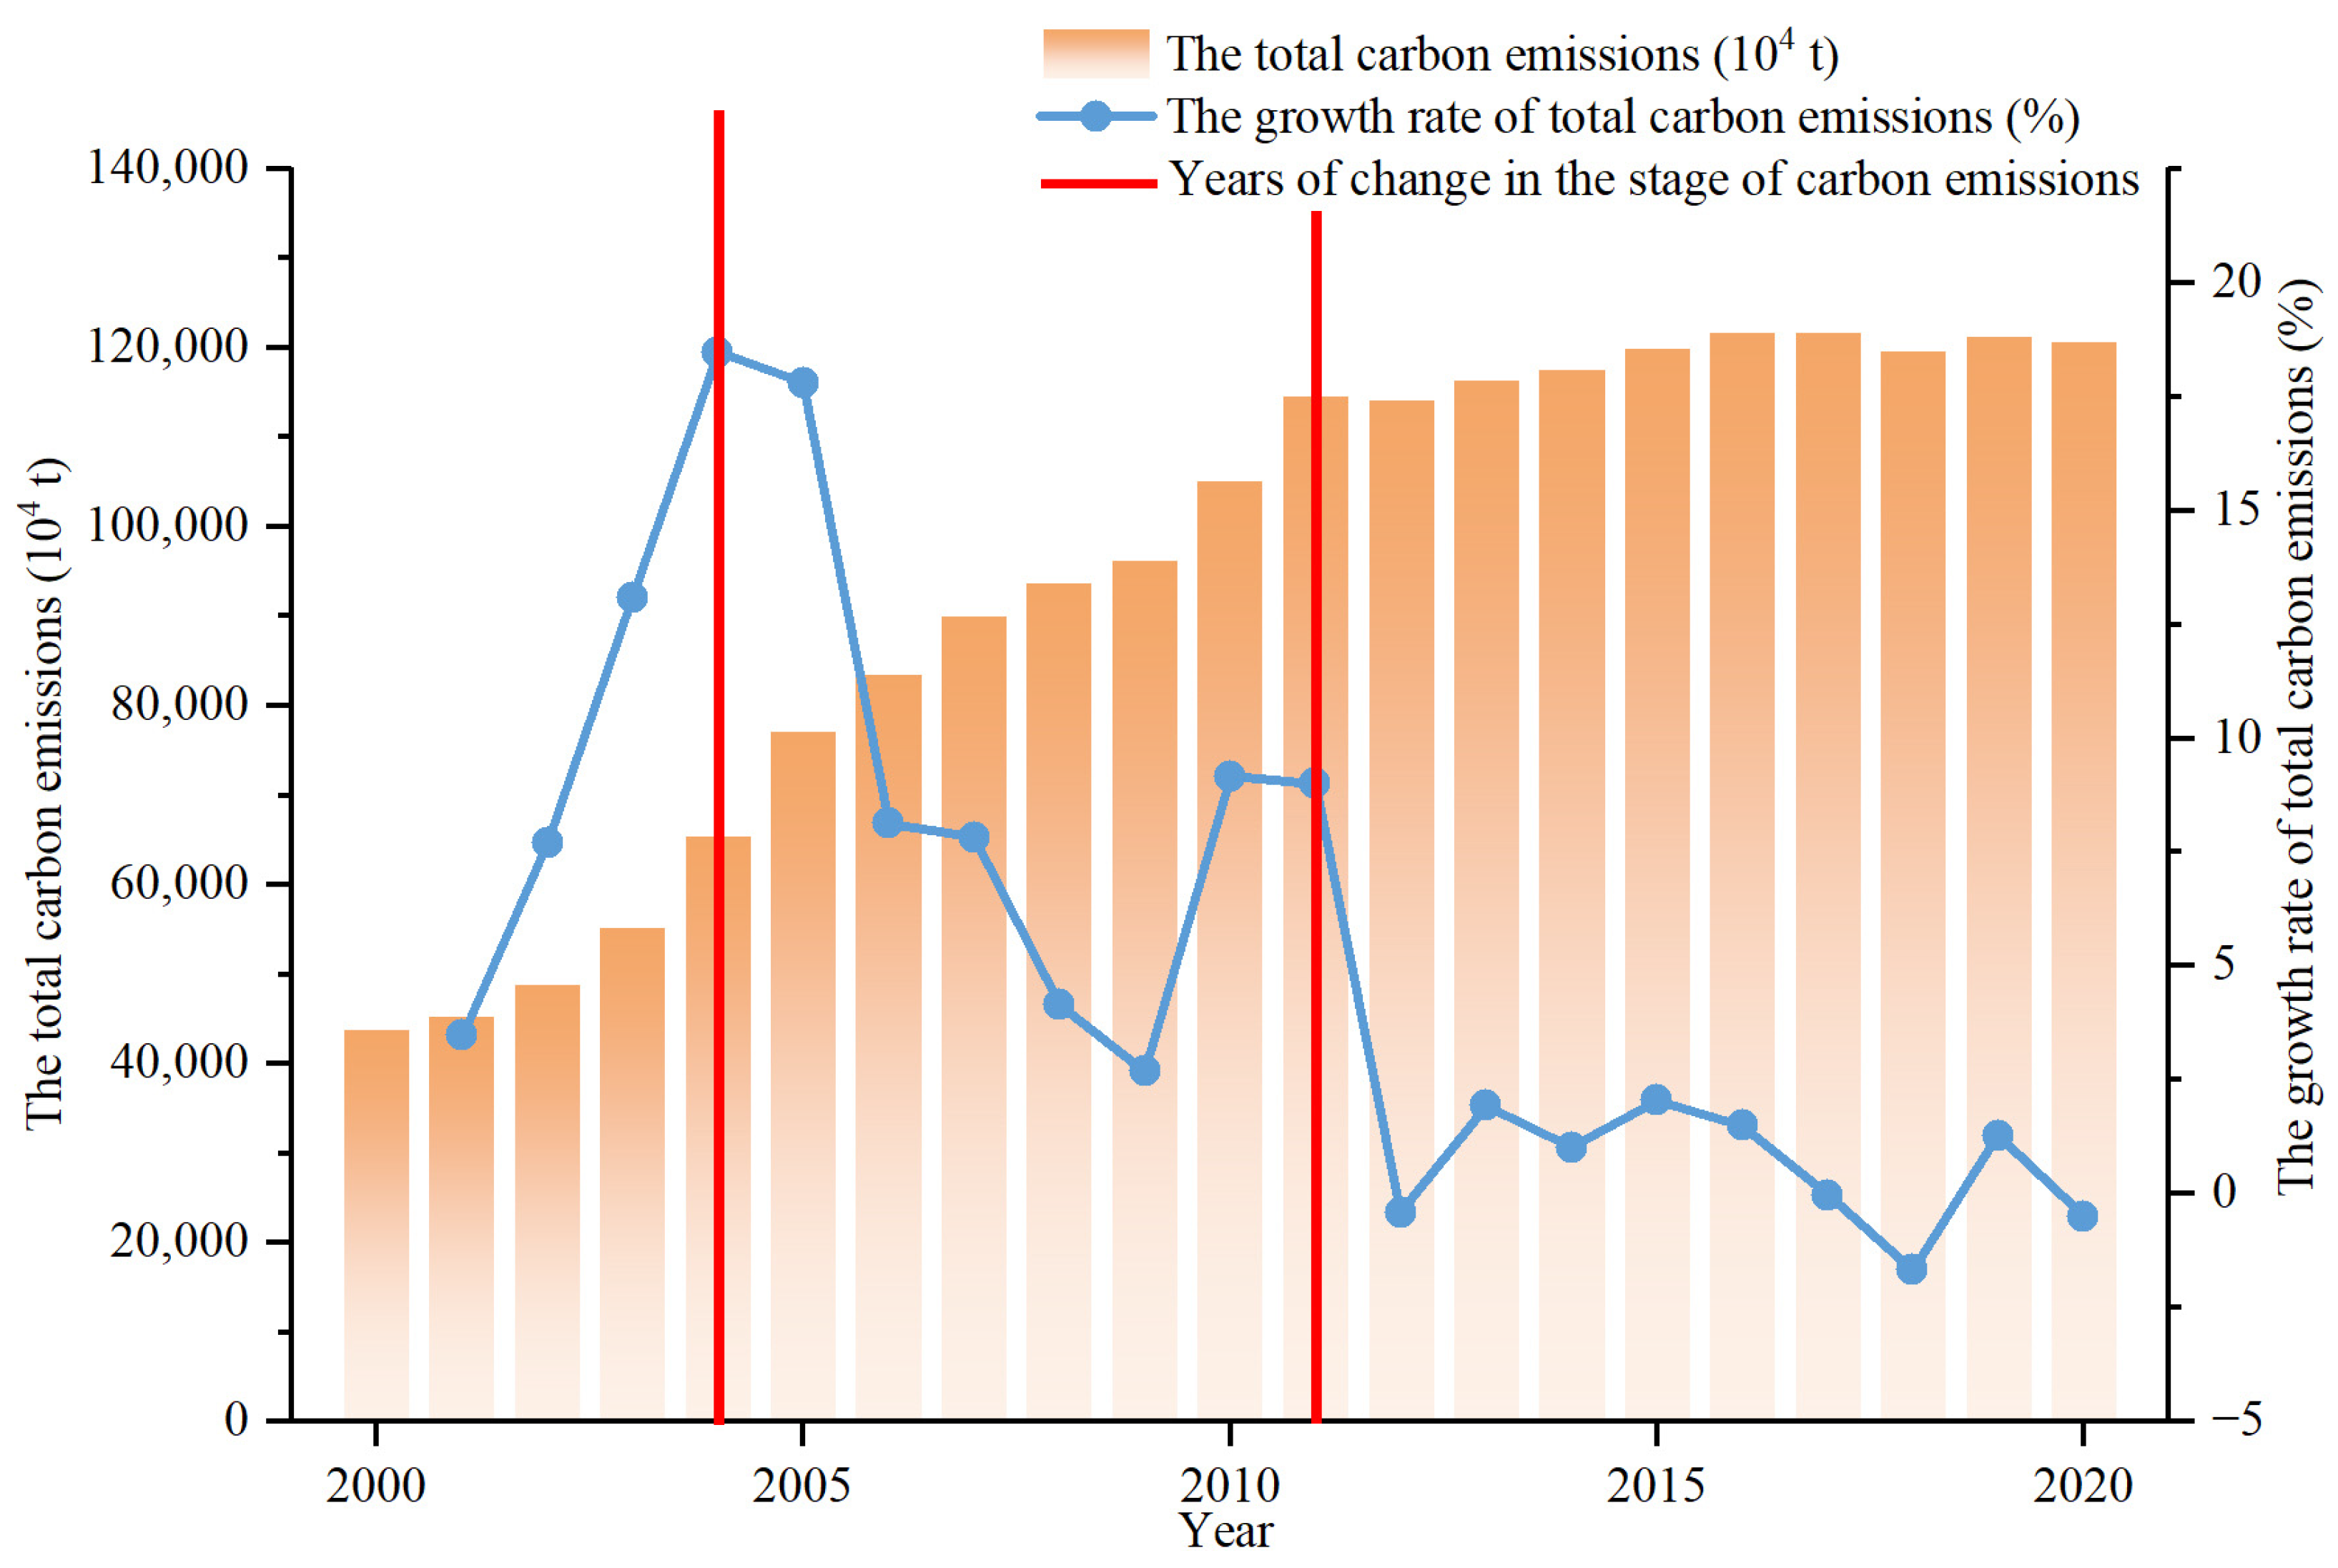
From a temporal perspective (Figure 4), the change in total carbon emissions in the study area from 2000 to 2020 is observed three stages: (1) the rapid growth stage (2000–2004), which was manifested in the continuous rapid growth of carbon emissions from 43,946.47 × 104 tons in 2000 to 65,611.25 × 104 tons in 2004, with an average annual growth rate of 10.54%; (2) the stable growth stage (2005–2011), where the growth rate of carbon emissions in the CAYRDUA slowed down but still maintained a positive total growth rate, with an average annual growth rate of 6.8%; (3) the stability stage (2012–2020), where the total amount of carbon emissions in the CAYRDUA was stable in general, increasing from 114,234.87 × 104 tons in 2012 to 120,728.18 × 104 tons in 2020, with an average annual growth rate of 0.69%.

Figure 4.
Changes in total carbon emissions in the CAYRDUA, 2000–2020.
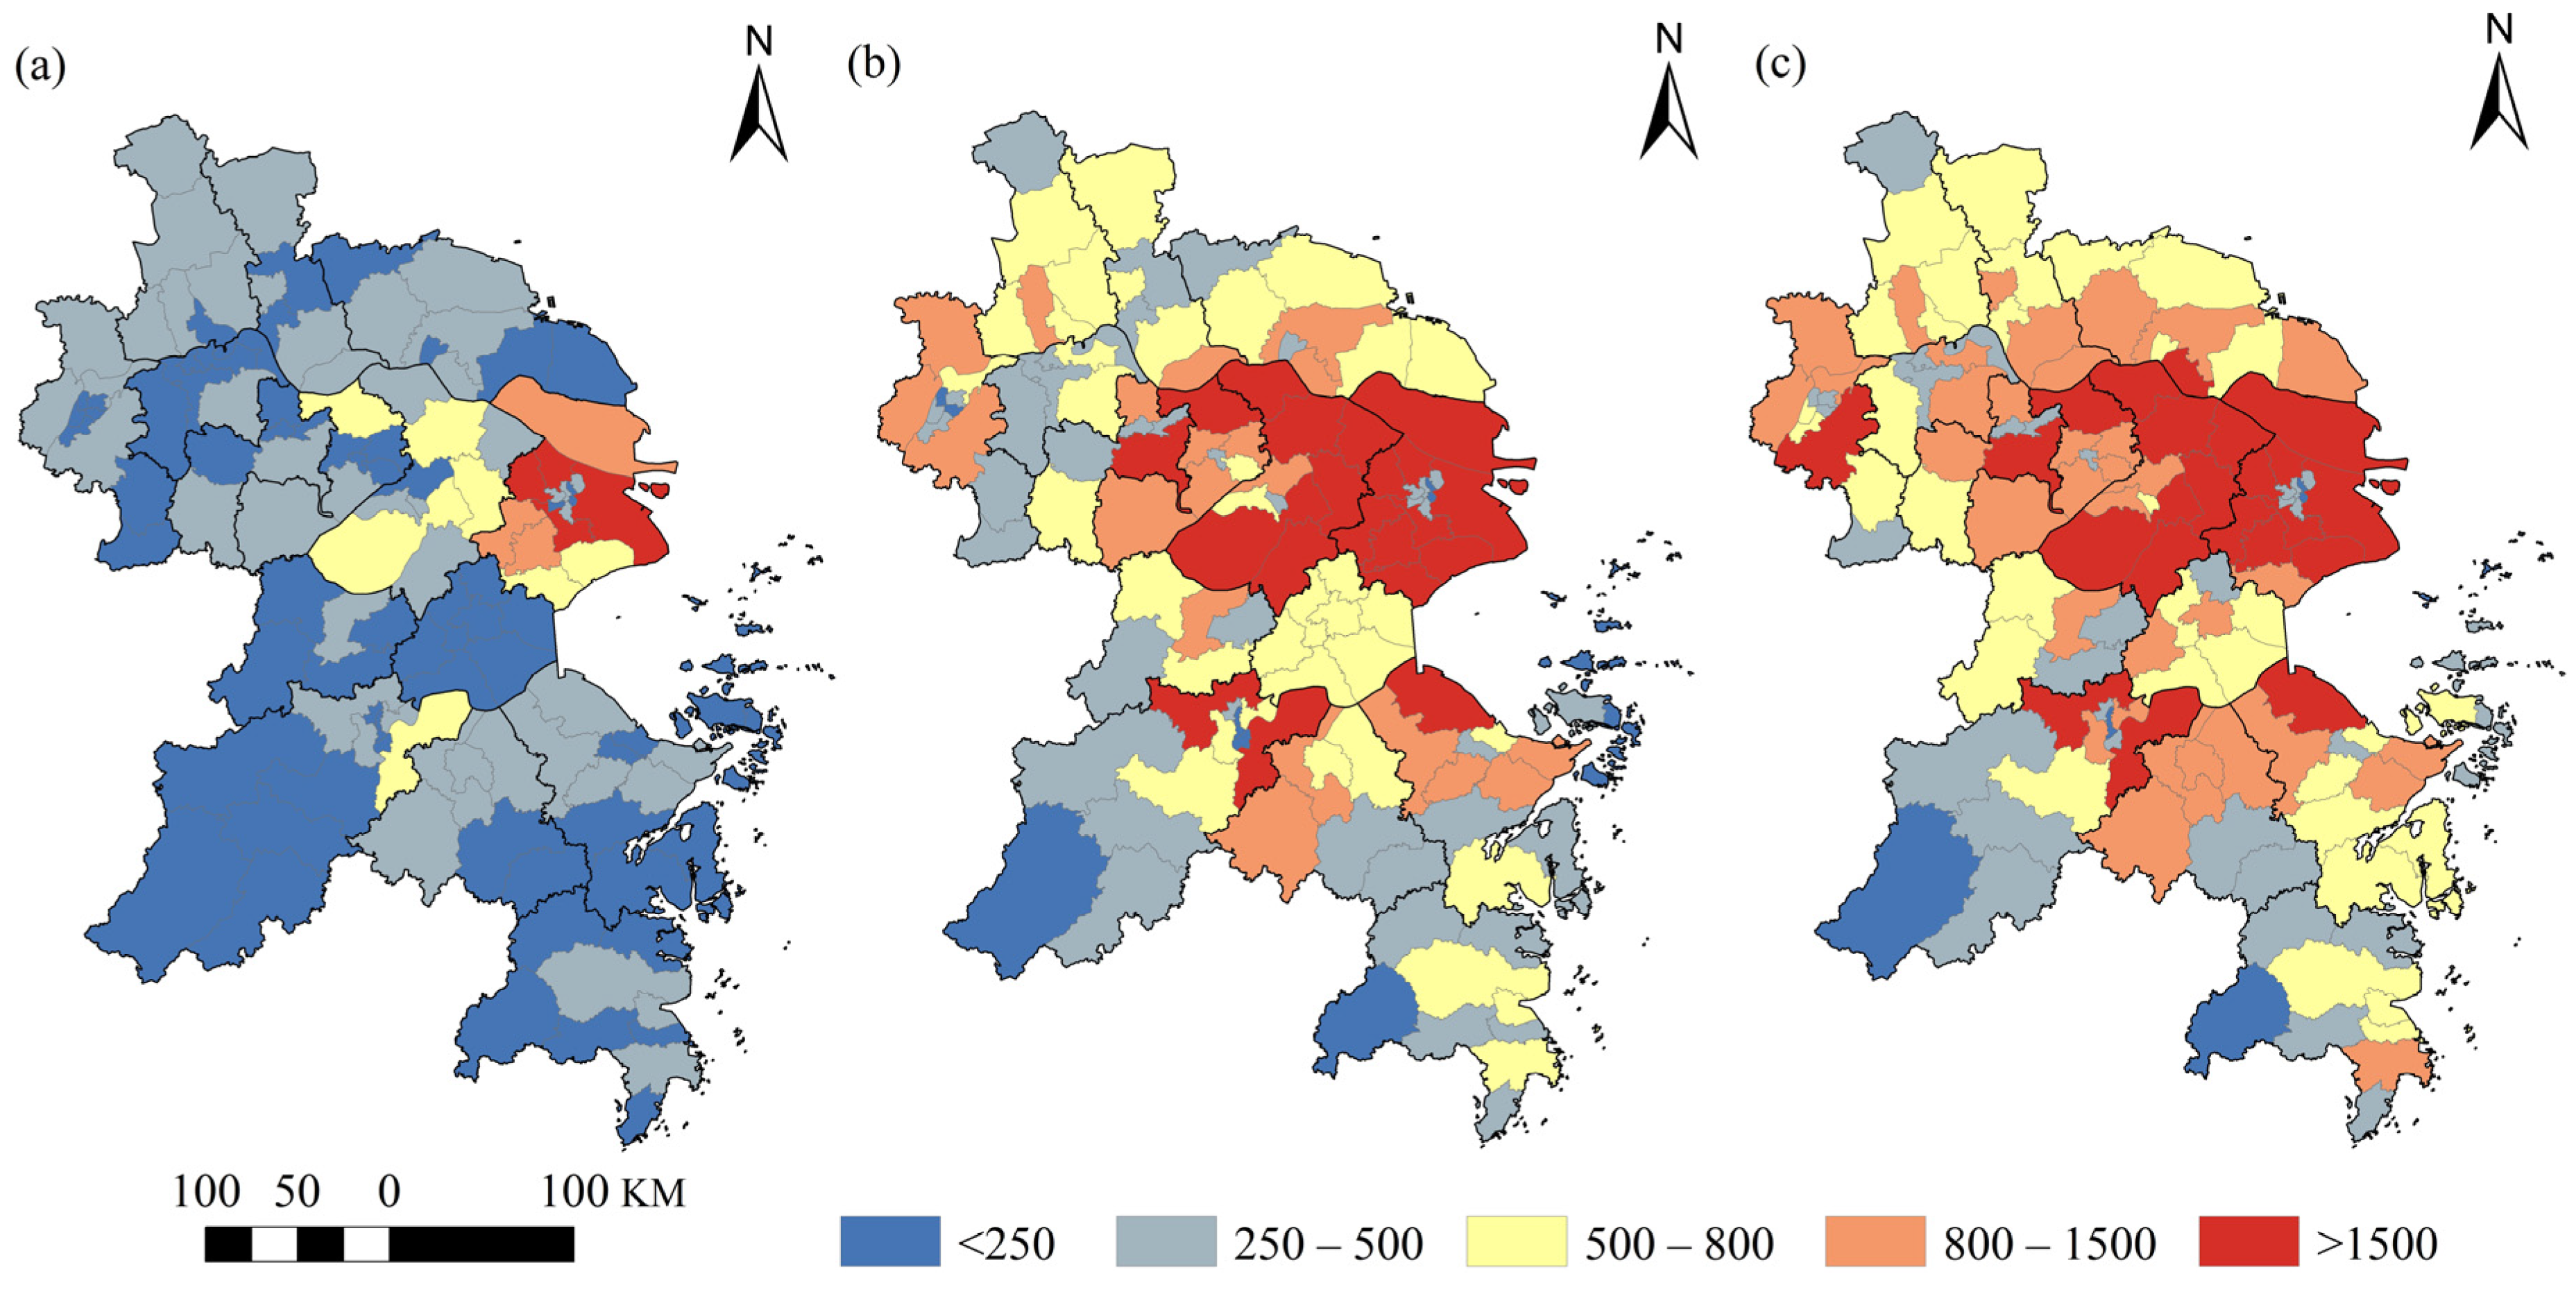
As shown in Figure 5, in 2000, the high carbon emission regions in the CAYRDUA showed a “core-periphery” distribution, with Shanghai as the center, which expanded in the central and northern parts of the region toward Nantong, Wuxi, and Nanjing, and in the southeastern part of the region toward Ningbo, with the area of high carbon emission gradually expanding. By 2020, the areas with higher carbon emissions exhibited a “Z-shaped” distribution in the central part of the CAYRDUA.
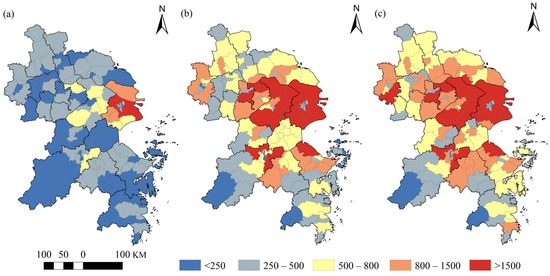
Figure 5.
Distribution of carbon emissions in the CAYRDUA, 2000–2020. (Unit: 104 tons) (a) 2000; (b) 2010; (c) 2020.
3.2. Analysis of Spatiotemporal Distribution of Carbon Sink
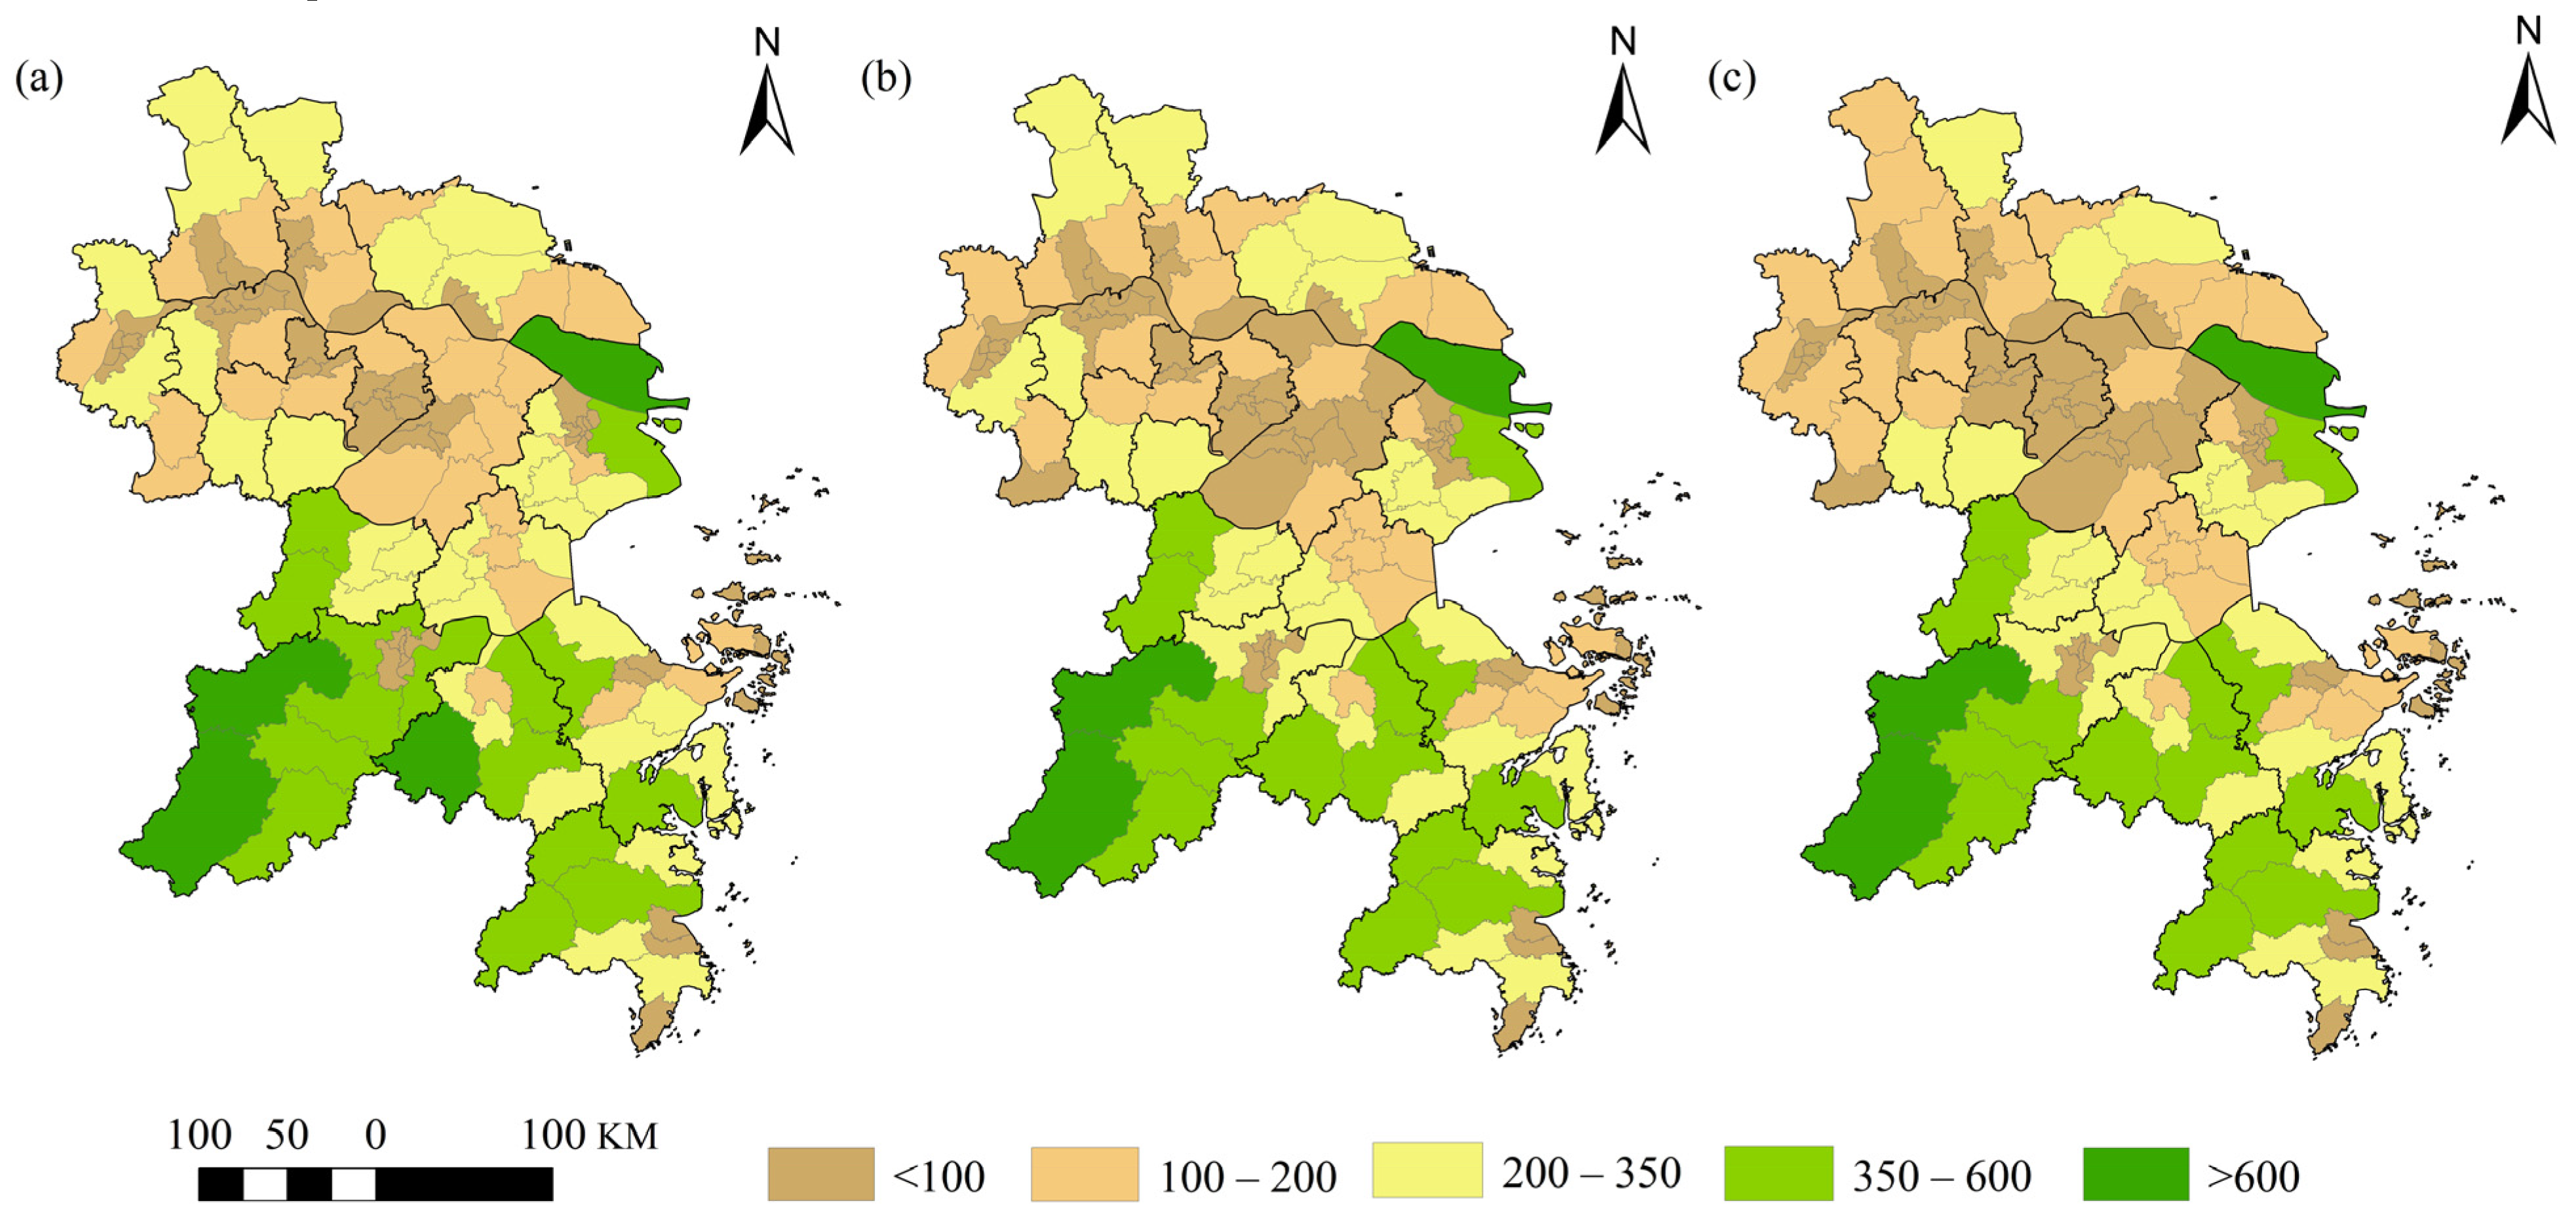
From a temporal perspective (Figure 6), the carbon sinks in the CAYRDUA showed a continuous downward trend, from 24,438.34 × 104 tons in 2000 to 21,783.84 × 104 tons in 2020, with an average annual growth rate of −0.57%. Spatially, the carbon sinks in the CAYRDUA exhibited a distribution pattern of “high in the south and low in the north”, with the distribution pattern of carbon sinks in the study area remaining largely unchanged. Low-value carbon sink areas were primarily concentrated in the central and northern plain areas, while high-value areas were concentrated in the southern hilly regions.
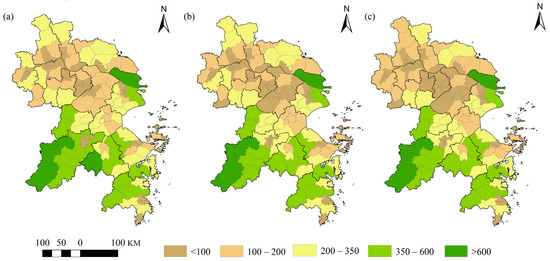
Figure 6.
Distribution of carbon sinks in the CAYRDUA, 2000–2020. (Unit: 104 tons) (a) 2000; (b) 2010; (c) 2020.
3.3. Analysis of the Spatiotemporal Distribution and Evolution of the Carbon Budget
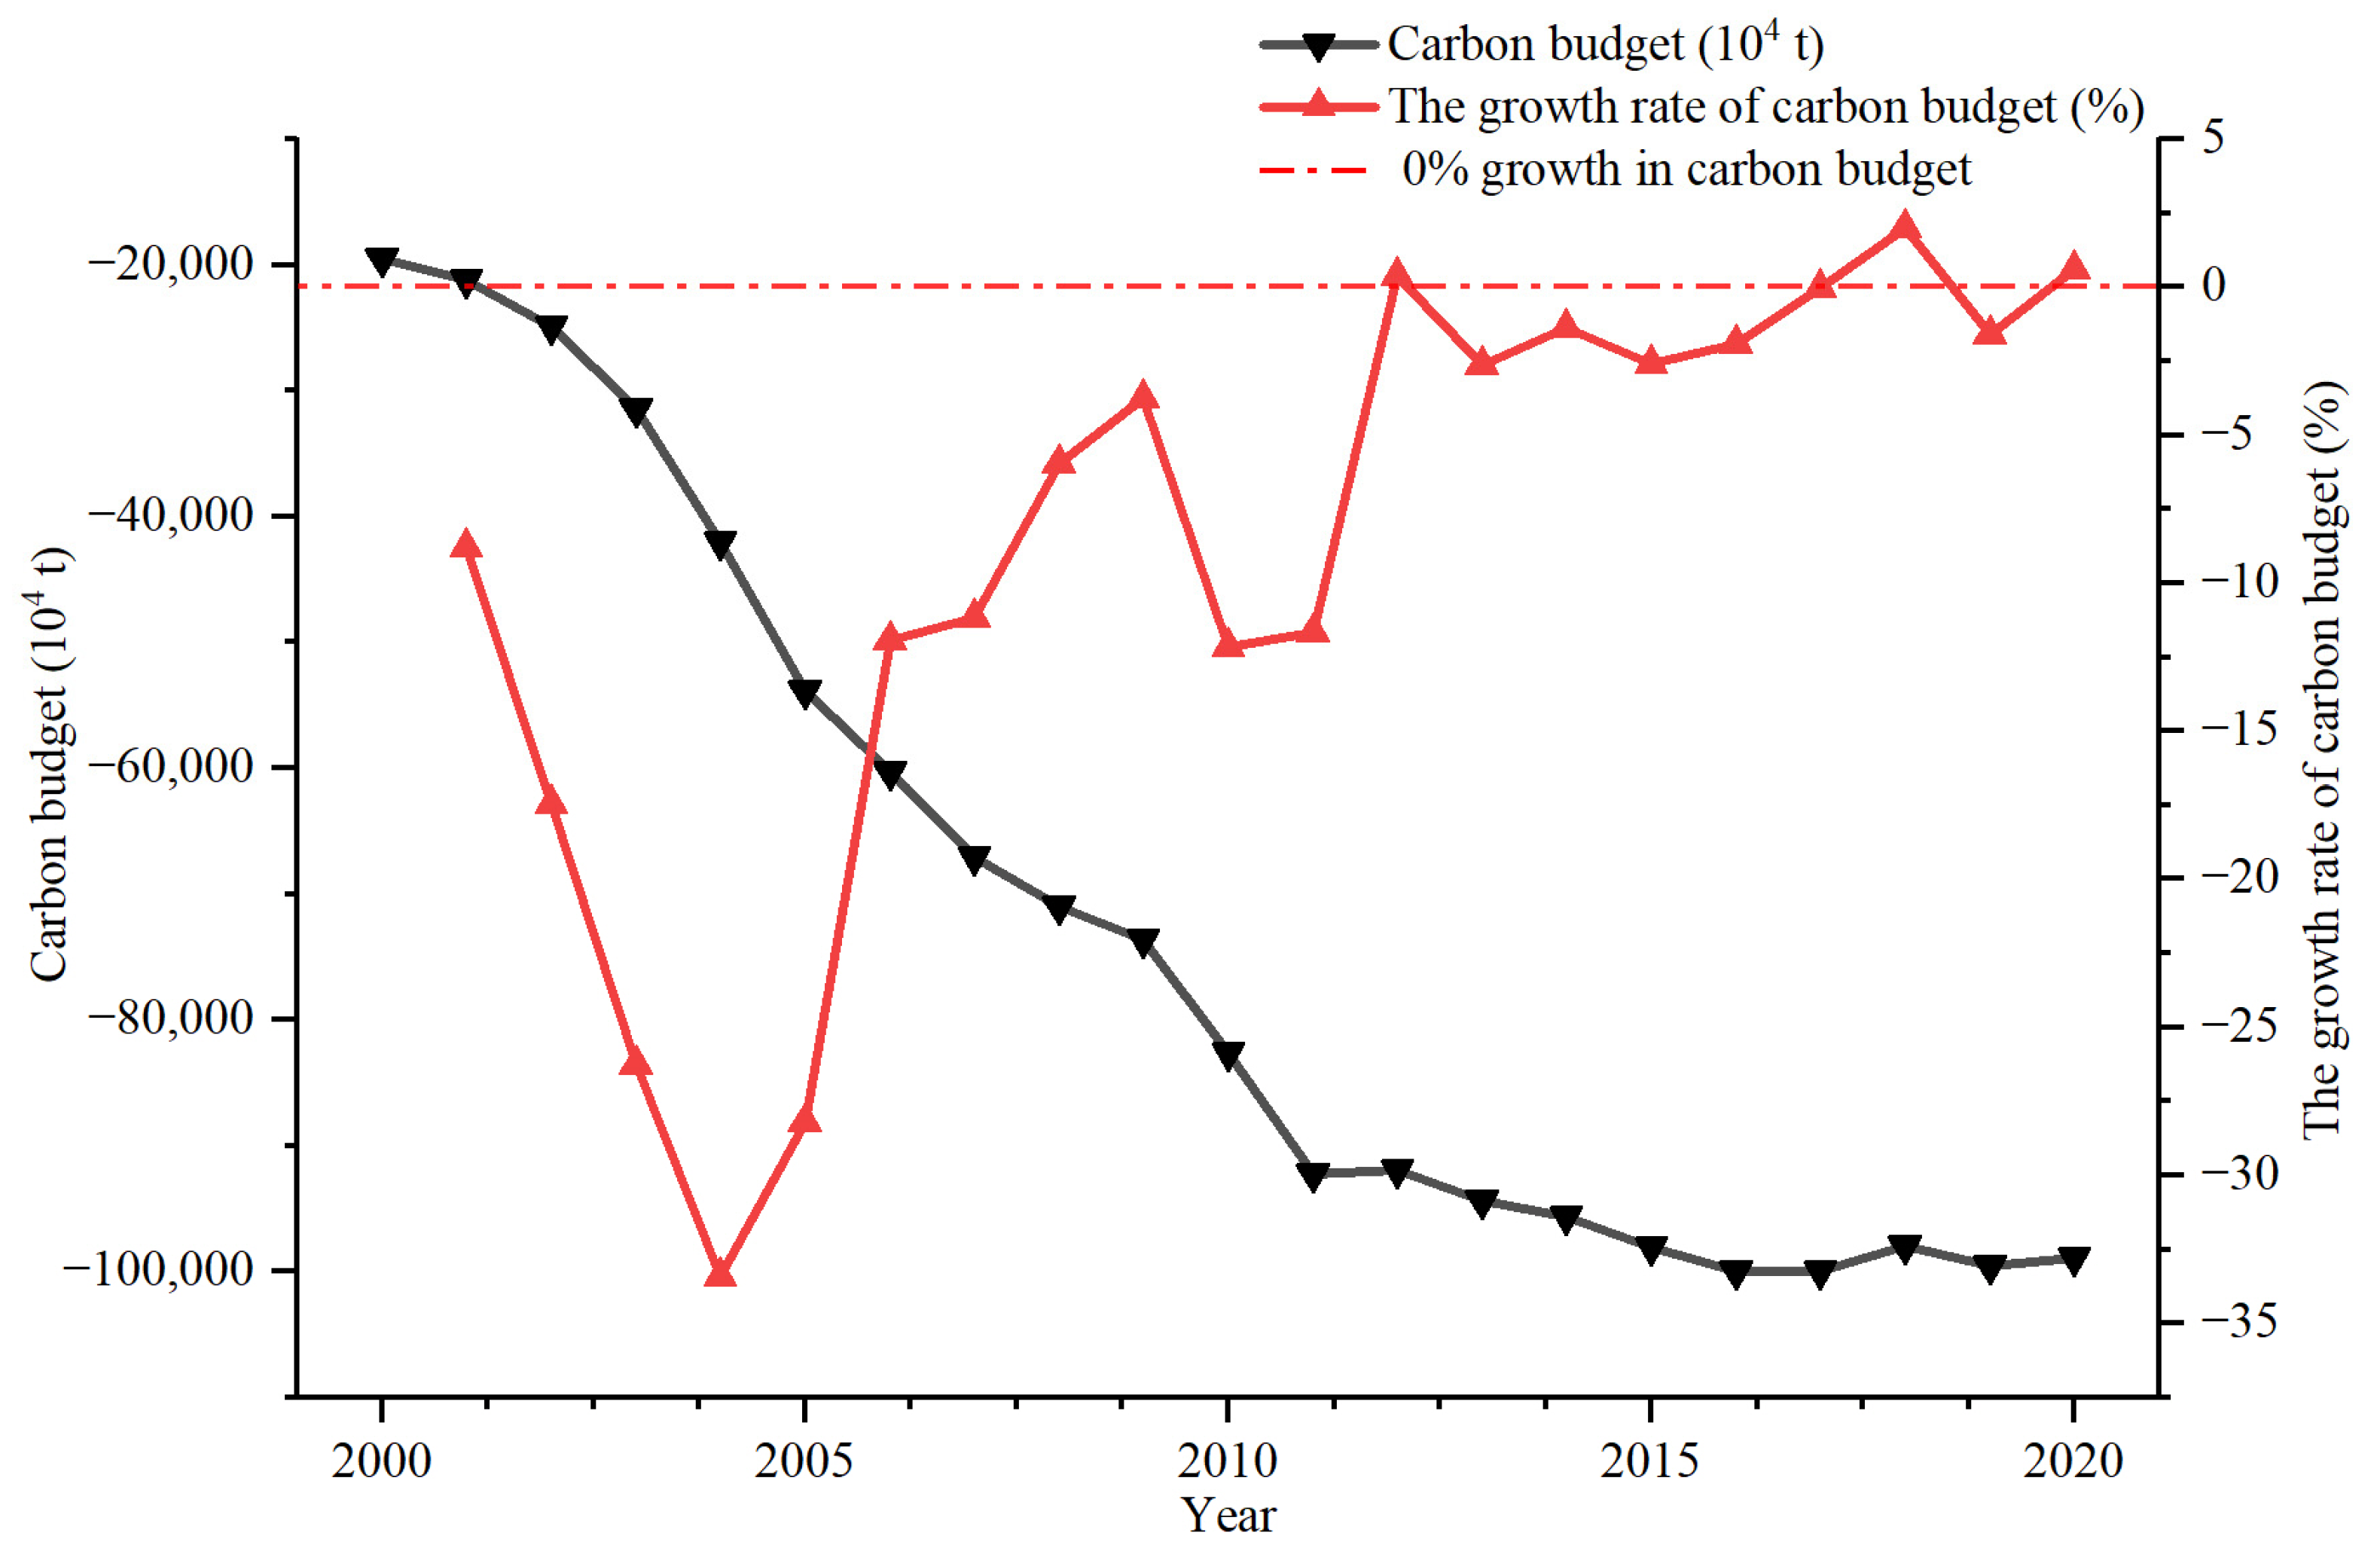
The carbon emissions in the CAYRDUA far exceed the carbon sinks, indicating a significant imbalance in the carbon budget. The carbon budget declined rapidly from −19,508.13 × 104 tons in 2000 to −98,944.34 × 104 tons in 2020, a reduction of 407.20%. By 2020, the carbon sink in the study area was only 18.04% of the carbon emission. The carbon budget change in the CAYRDUA is shown in two stages (Figure 7): (1) the rapid decline period (2000–2011), when the carbon budget deficit continued to expand, decreasing by 373.13% in 2011 compared to 2000. This period witnessed rapid industrial development in the study area, leading to increased energy demand. Simultaneously, rapid urbanization resulted in extensive conversion of cropland and forestland into construction land; (2) the relatively stable period (2012–2020), when the carbon budget in 2020 decreased by 7.62% compared with 2012, indicating a generally stable trend of change. This indicates that the continuous deterioration of the carbon budget in the study area has improved significantly. However, it is still negative, which is not conducive to achieving “carbon neutrality” in the study area.
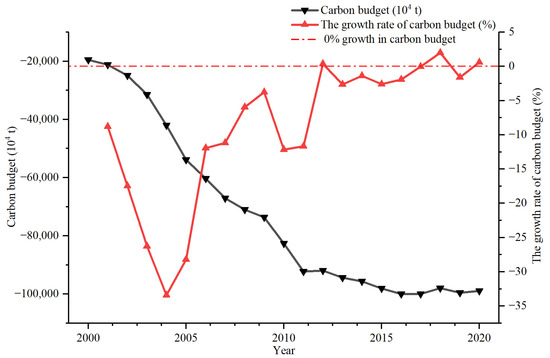
Figure 7.
Changes in carbon budget and growth rate in the CAYRDUA, 2000–2020.
As shown in Figure 8, there exists a significant spatial imbalance in carbon budget distribution, exhibiting a pattern of “higher in the south and lower in the north “in the CAYRDUA. Regions with severe carbon deficits are concentrated in the central and northern parts of the CAYRDUA, primarily in Jiangsu and Shanghai, gradually expanding northwestward and southeastward. Conversely, areas with carbon surpluses are predominantly distributed in southern cities, such as Hangzhou, Shaoxing, Taizhou, and Huzhou. The carbon budget in Zhejiang Province is significantly better than that in Jiangsu and Shanghai. In 2000, the carbon budget in Zhejiang Province exceeded that of Jiangsu Province by 13,887.73 ×104 tons, and this gap has widened over time. By 2020, this figure had increased to 32,077.07 × 104 tons. This spatially significant imbalance is attributed to a combination of various factors. On the one hand, Shanghai is a traditional financial center with intense land development and high population density. Meanwhile, Jiangsu is experiencing rapid development in the heavy industry [40], leading to a continuous increase in the proportion of carbon emissions from heavy industry, with Jiangsu province accounting for more than 50% of the total carbon emissions in the CAYRDUA from 2014 to 2019. On the other hand, Zhejiang Province in the southern part of the study area is characterized by mountainous terrain, favorable hydrothermal conditions, lush vegetation, and strong carbon sequestration capacity. In contrast, Jiangsu Province and Shanghai are characterized by flat terrain, with a predominant development of agricultural and construction land, resulting in relatively poorer carbon sequestration capacity.
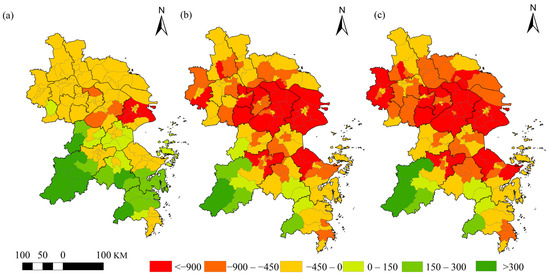
Figure 8.
Distribution of carbon budgets in the CAYRDUA, 2000–2020. (Unit: 104 tons) (a) 2000; (b) 2010; (c) 2020.
In terms of carbon budget changes at the prefectural level, Hangzhou exhibited the most favorable carbon budget situation from 2000 to 2003, with Taizhou following closely behind. However, after 2003, the carbon budget deficit in Hangzhou increased, and the carbon budget rapidly decreased from 2003 to 2008, with an annual average growth rate of −253.49%. Suzhou had the worst carbon budget situation among these cities. As a traditional industrial powerhouse, Suzhou’s carbon emissions far exceed those of other prefectural cities, comprising 15.11% of the total carbon emissions in the CAYRDUA in 2020, while its carbon sink accounted for less than 3%.
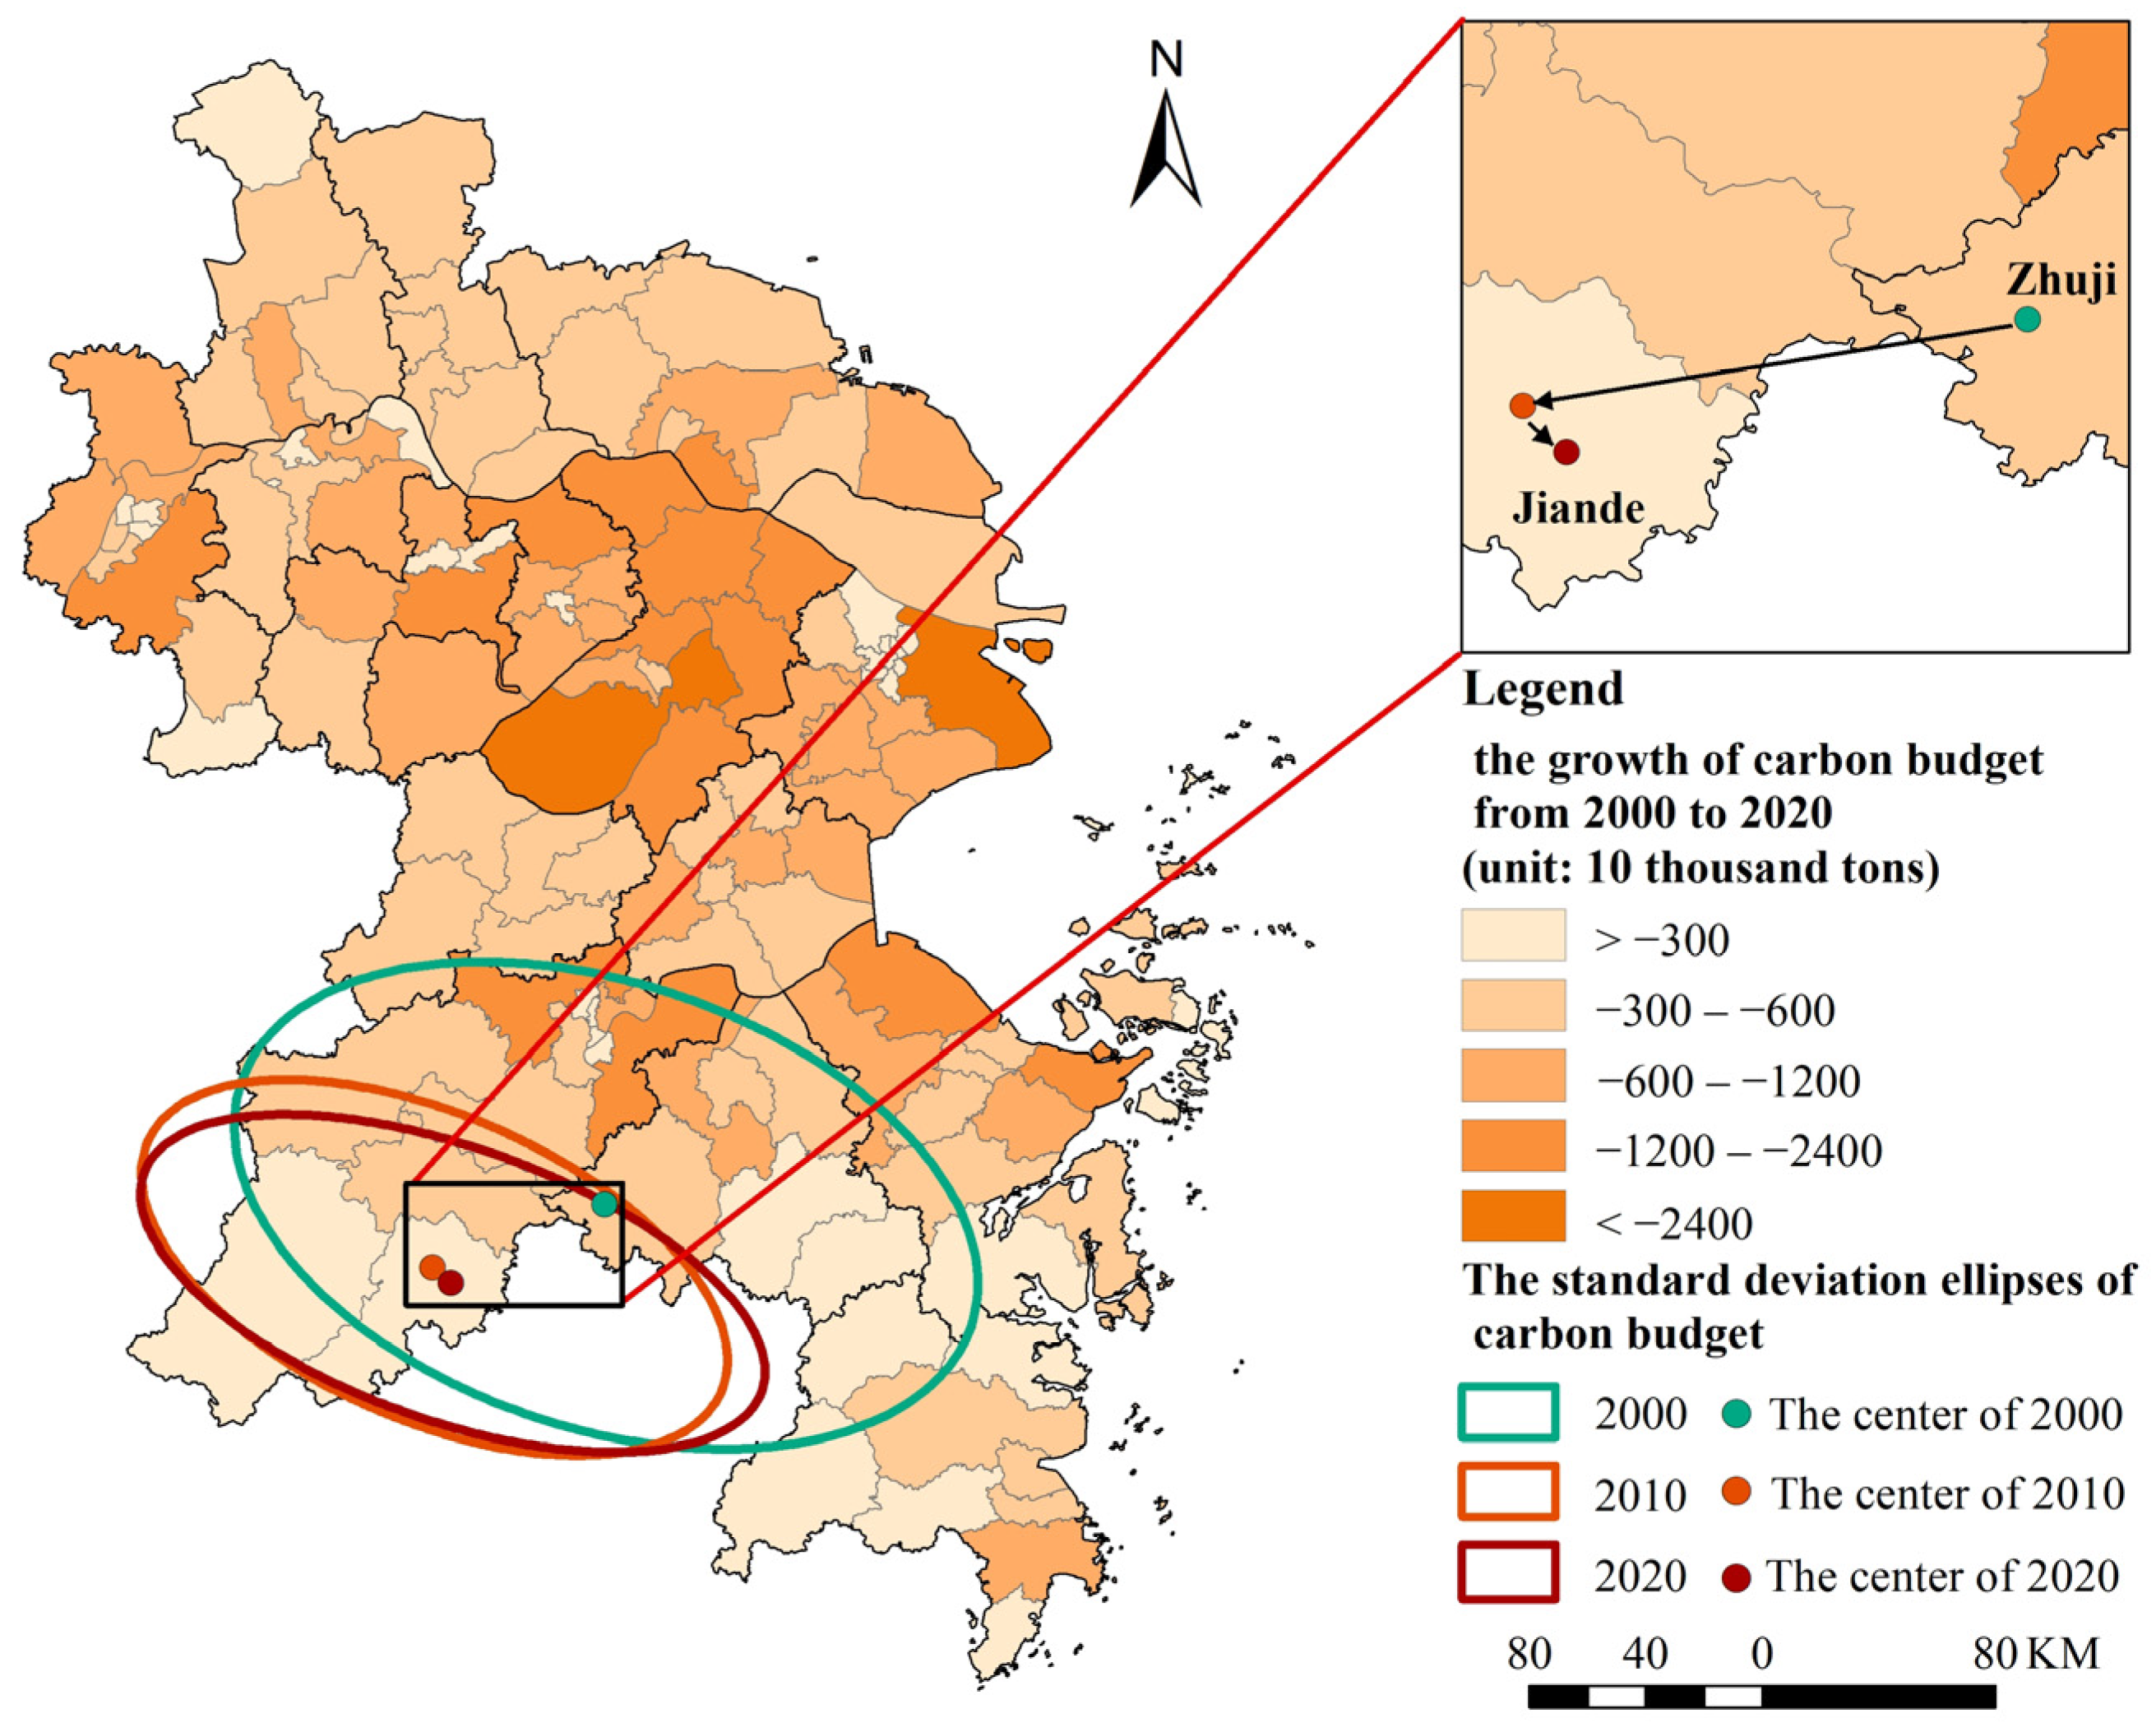
From 2000 to 2020, the shape of the SDE in the CAYRDUA exhibited a northwest–southeast pattern (Figure 9), being predominantly concentrated in the southern part of the CAYRDUA. The center shifted from Zhuji in Shaoxing to Jiande in Hangzhou, indicating significantly less carbon budget loss in the southwestern part compared to the southeastern part of the study area. Shaoxing and the southeastern cities have a weakened influence on the carbon budget patterns. The lengths of the axes, the reduction in the lengths of the short and long axes, as well as the narrowing distribution range of the SDE further indicate the deterioration of the carbon budget in the southern region of the study area. The oblateness increased from 0.47 in 2000 to 0.61, indicating a strengthening directionality of the carbon budget, with a more concentrated distribution in the northwest–southeast direction.
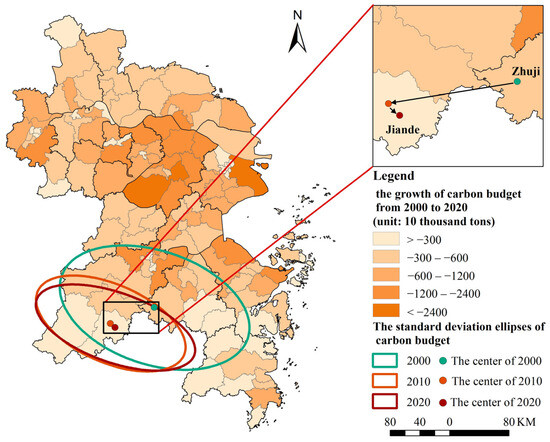
Figure 9.
The SDE analysis and center change in the CAYRDUA, 2000–2020.
In the spatial autocorrelation analysis, the carbon budget data in CAYRDUA passed the 99% confidence test and the 95% confidence test, as shown in Table 5. The global Moran’s I index of 0.32 in 2000 decreased to 0.09 in 2020, indicating that the spatial autocorrelation of CAYRDUA’s carbon budget decreased.
Table 5.
The parameter of the global Moran’s I.
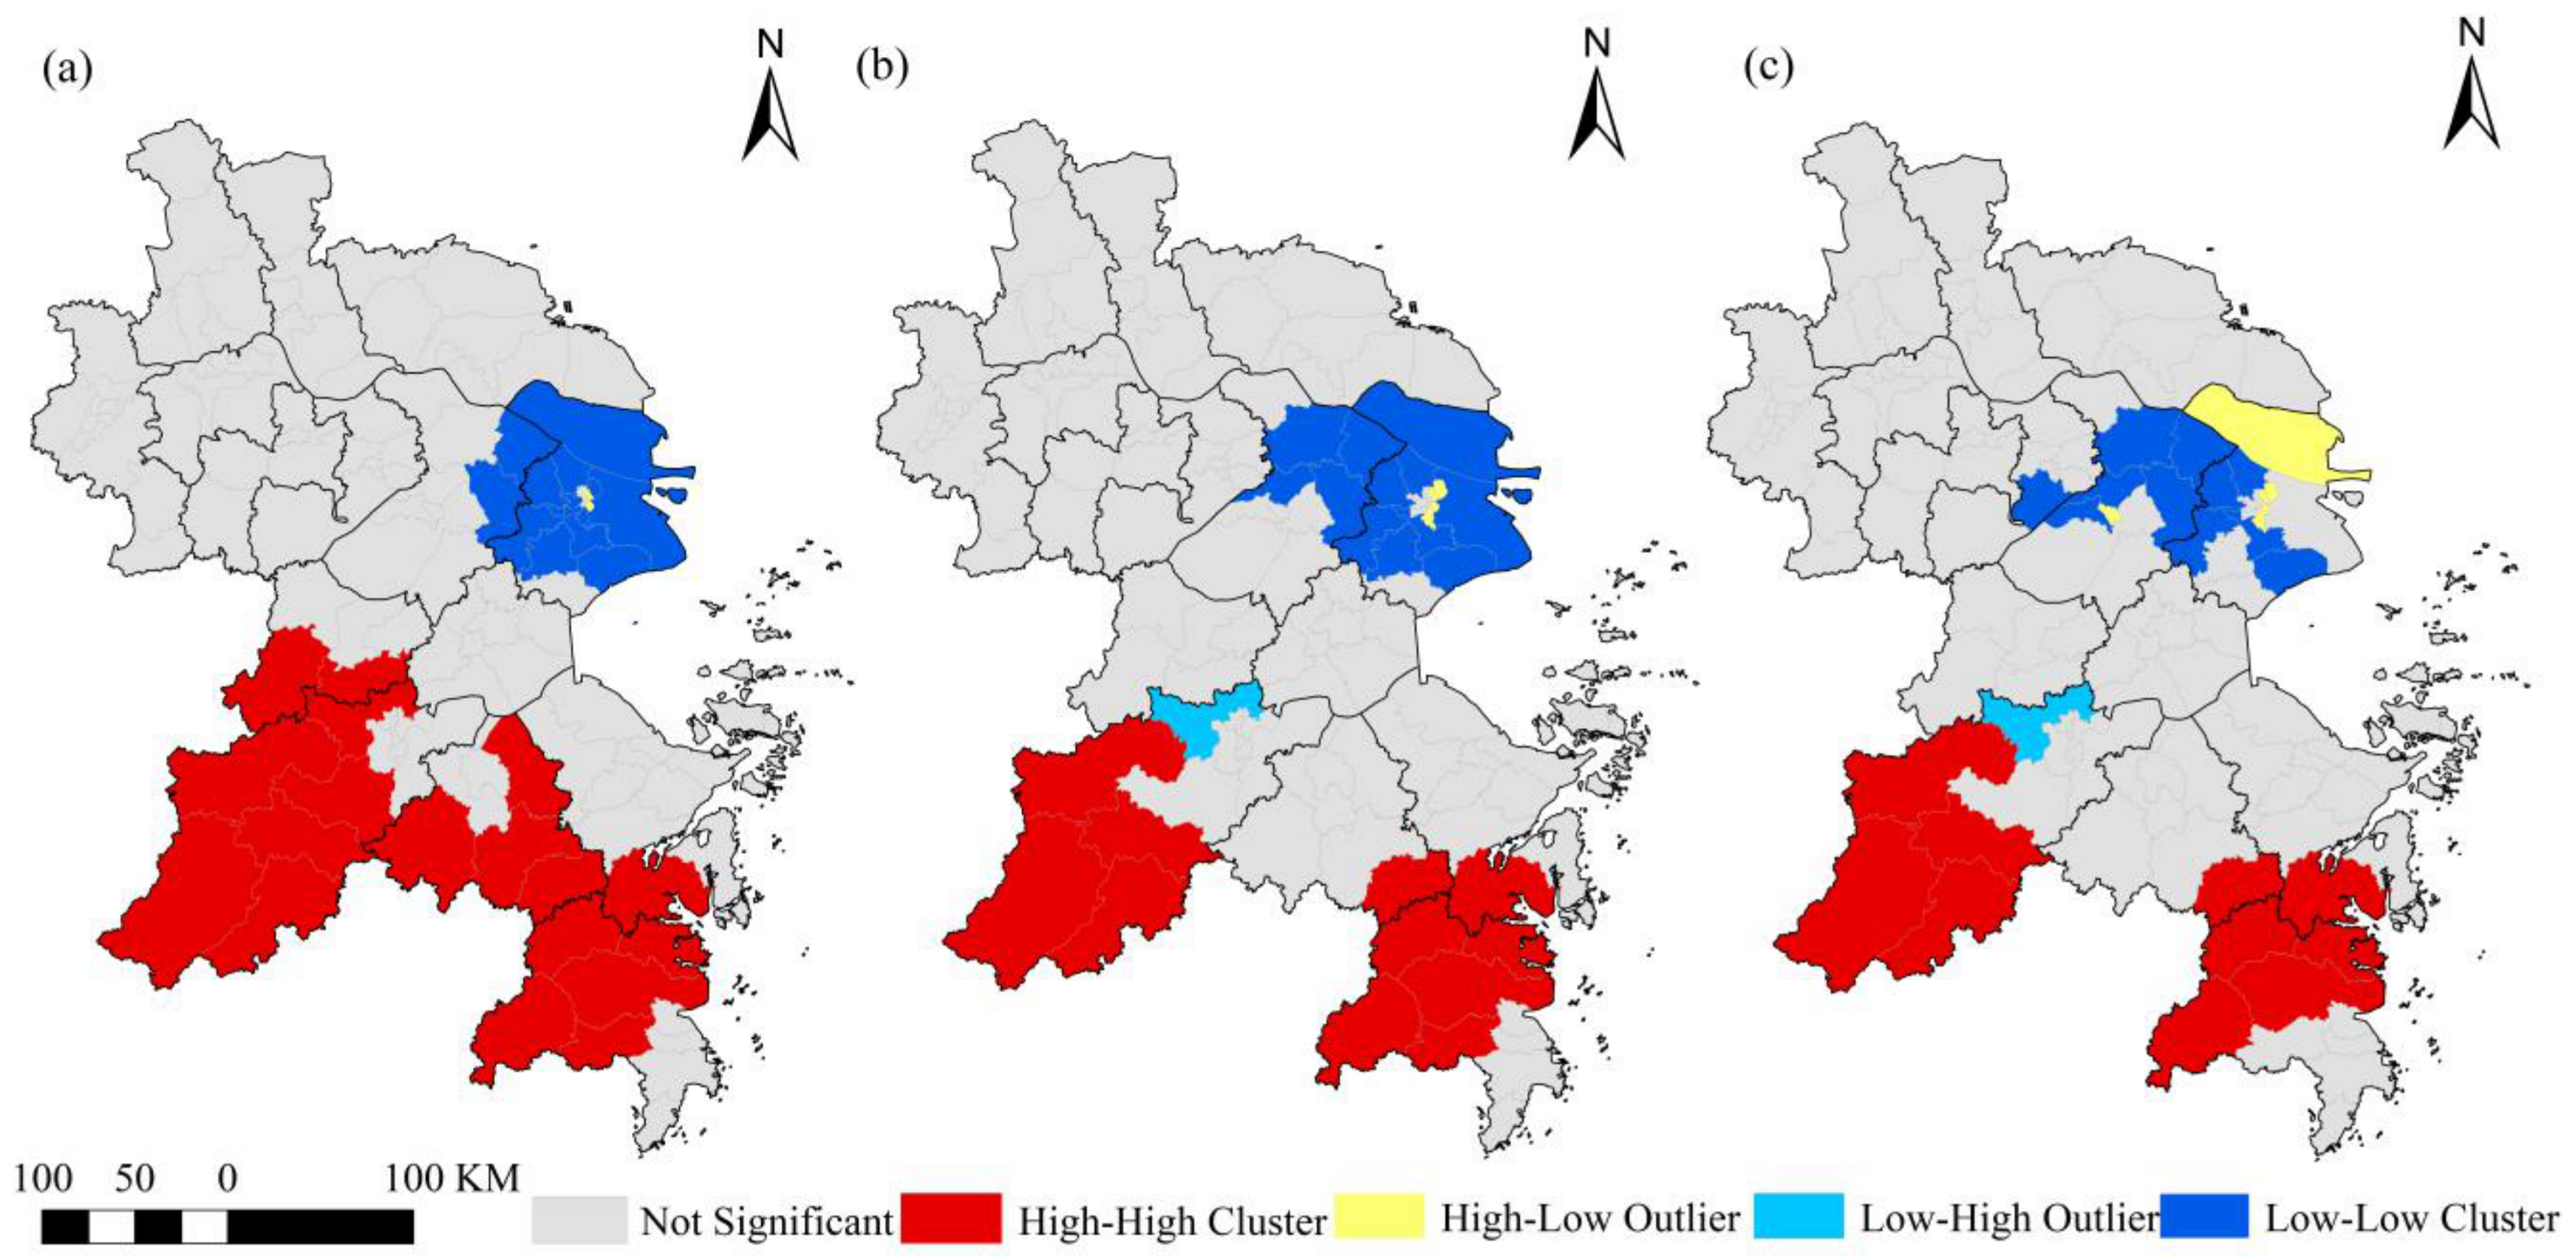
In 2000, there was a clear pattern of high–high clustering and low–low clustering in the carbon budget of the CAYRDUA (Figure 10). Low–low clustering was mainly observed in Shanghai, as well as in Kunshan and Taicang, two small parts of Suzhou. High–high clustering of the carbon budget was concentrated in the southern part of the CAYRDUA, including some county-level cities in Hangzhou, Taizhou, Shaoxing, Huzhou, Ningbo, and other areas. Over time, the high–high clustering area in the southern region of the study area decreased, splitting into two parts concentrated in the southwest and southeast of the CAYRDUA, with a reduction in the high–high clustering areas of Hangzhou and Shaoxing. This may be attributed to Hangzhou’s strategic goal of becoming a “Powerful Industrial City” in 2002, and the growth rate of industrial land in Hangzhou and Shaoxing exceeded the average level of Zhejiang Province from 2005 to 2020. Under the coordinated development of the CAYRDUA, the surrounding cities of Shanghai actively undertook industrial spillovers. From 2000 to 2020, the low–low clustering areas centered around Shanghai expanded to Suzhou and Wuxi. The carbon budget situation in Chongming District, located in the northern part of Shanghai, has improved, making it an isolated county-level city with high carbon budget values.

Figure 10.
Cluster patterns of carbon budgets in the CAYRDUA, 2000–2020. (a) 2000; (b) 2010; (c) 2020.
3.4. Carbon Compensation Zoning Results and Overlay Analysis
In this study, the NRCA index of three attributes was clustered by the K-means clustering algorithm, dividing the study area into 43 payment zones, 48 balanced zones, and 38 compensated zones. Overlaying with main functional zones, the zones are ultimately categorized into 11 types (Figure 11 and Table 6).
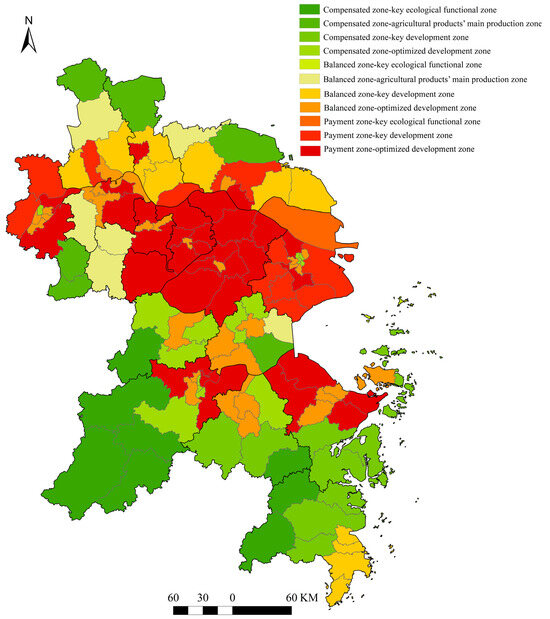
Figure 11.
Distribution of carbon compensation zones.
Table 6.
Main indicators of carbon compensation zones in CAYRDUA.
3.4.1. Payment Zone
The payment zone is distributed in the central part of the CAYRDUA, with a parallel distribution in the north and south. Concentrated in areas such as Shanghai, Suzhou, Nanjing, and Ningbo, the payment zone accounts for 34.02% of the total land area, with a highly developed economy (53.69% of GDP), high carbon emissions (63.70% of carbon emissions), and poor ecological carrying capacity (28.71% of carbon sinks). There is a serious mismatch between the economic contribution capacity of carbon emissions and the ecological carrying capacity (the ECC is 0.84, and the ESC is 0.45). This region is an important economic growth pole in the CAYRDUA.
(1) Payment zone—optimized development zone. This region is mainly composed of 31 county-level cities, primarily in Suzhou, Wuxi, Hangzhou, and Ningbo, spatially surrounded by the northern shore of the Taihu Lake and the southern shore of the Yangtze River, accounting for 23.42% of the total area, with the carbon emission contribution slightly higher than the economic contribution (the ECC is 0.85). It is predominantly composed of economically developed and industrially concentrated county-level cities (37.07% of GDP share), facing prominent resource and environmental issues (carbon emissions account for 43.42%, carbon sinks account for 15.19%, the ESC is only 0.35). County-level cities with manufacturing industries as the pillar industry should focus on improving per-unit output and enhancing economic contribution capability in subsequent development. For regions with industries such as metal smelting and rolling processing with high carbon emissions, such as the Zhangjiagang City of Suzhou, the Wujin District of Changzhou, the Jingkou District of Zhenjiang, and the Baoshan District of Shanghai, efforts should be made to promote the consumption of clean energy and introduce efficient and green equipment in production. Furthermore, it is essential to adhere to the “red lines” of arable land and ecology, strengthen the protection of the surrounding environment of the Taihu Lake Basin, construct Taihu Lake ecological wetlands, and enhance carbon sink capacity.
(2) Payment zone—key development zone. This region is situated in the Shanghai Municipality and Jiangsu Province, spatially distributed along the north bank of the Yangtze River and the eastern coastal areas, comprising 11 county-level cities in areas such as Shanghai and Nanjing. Characterized by a solid economic foundation and substantial development potential, this area occupies 8.51% of the total land area, contributing 19.01% of carbon emissions and 10.07% of carbon sinks. Its ecological carrying capacity surpasses that of the Payment zone—optimized development zone (with an ECC of 0.86 and an ESC of 0.53). In subsequent development phases, this area, as the primary recipient of industrial spillover effects, should prioritize the development of low-emission, high-end manufacturing industries. Simultaneously, attention should be directed toward urban green space construction and suburban vegetation coverage. Coastal county-level cities ought to exercise rational control over the development and utilization of tidal flats, minimize human activity disturbance, prioritize the protection of tidal flat ecosystems, and ensure that coastal tidal wetlands fulfill their due carbon sink function.
(3) Payment zone—key ecological functional zone. This region comprises only one county-level city, the Chongming District of Shanghai. It occupies 2.09% of the land area of the CAYRDUA, exhibiting strong ecological functions (with carbon sinks accounting for 3.45%, an ECC of 0.19, and an ESC of 2.72). Following industrial restructuring in the Chongming District, the proportion of the secondary industry’s GDP decreased from 55.7% to 26.1%. This area is endowed with several national forest parks, important water sources, nature reserves, and significant wetlands and tidal flats. In subsequent development phases, the area should further optimize its industrial structure and actively promote the development of ecotourism and ecological agriculture.
3.4.2. Balanced Zone
The balanced zone is primarily concentrated in the northern part of the research area and the northern counties of Zhejiang Province, spatially surrounding the outer edge of the payment zone. It accounts for 24.13% of the total land area, showing sound economic development (with a GDP share of 27.93%). There is a good alignment between carbon emissions and carbon sink contributions (carbon emissions account for 23.65%, while carbon sinks account for 20.98%). The difference between the carbon emission–economic contribution capability and the ecology carrying capacity is relatively small (with an ECC of 1.18 and an ESC of 0.89).
(1) Balanced zone—optimized development zone. This region accounts for 7.89% of the total land area, spatially mostly scattered along the Yangtze River, the Beijing–Hangzhou Canal, and the Qiantang River. It consists of 29 county-level cities, primarily in Nanjing, Zhenjiang, Shanghai, Jiaxing, and Ningbo, exhibiting a relatively high level of economic development (accounting for 17.60% of the GDP and 13.48% of the carbon emissions), while also possessing adequate carbon sink capabilities (8.36% of carbon sinks, an ECC of 1.31, and an ESC of 0.62) Most of the area belongs to the central urban area. In the subsequent development, it should optimize the spatial layout of the land, eliminate backward production capacity, and actively develop green industries. Ecologically, efforts should focus on constructing wetlands along the river basin and enhancing coastal soil and water conservation capacity.
(2) Balanced zone—key development zone. This region is mainly located in Jiangsu Province. It consists of 12 county-level cities, spatially distributed in the northern part of the Payment zone—key development zone and along the southeastern coast of the CAYRDUA. This area accounts for 9.40% of the total land, characterized by a relatively low level of economic development, contributing less to the total carbon emissions (7.09% of GDP and 6.73% of carbon emissions), yet exhibiting good ecological carbon sequestration capacity (accounting for 7.63% of carbon sinks). The ecological carrying capacity slightly exceeds the carbon emission–economic contribution capacity (with an ECC of 1.05 and an ESC of 1.13). In subsequent development phases, this area should actively collaborate with surrounding first-tier cities to develop distinctive industries and enhance economic contribution capabilities. Simultaneously, efforts should be made to promote energy conservation and emission reduction among the enterprises, reducing greenhouse gas emissions. Enhancing forest coverage and quality and increasing carbon sink capacity are essential.
(3) Balanced zone—agricultural products’ main production zone. This region accounts for 6.80% of the CAYRDUA, comprising six county-level cities, exhibiting good ecological carrying capacity (with an ESC of 1.48) but insufficient economic development (with an ECC of 0.95 and a GDP share of 3.18%). In subsequent development phases, efforts should be made to optimize the spatial structure, establish high-standard farmland, minimize the fragmentation of farmland, and enhance agricultural carbon sinks. By leveraging local soil characteristics and regional features, the cultivation of distinctive agricultural products should be promoted to elevate economic development levels.
(4) Balanced zone—key ecological functional zone. This region comprises only one county-level city, the Shengsi County in Zhoushan City. This area occupies 0.04% of the total land area and is characterized by a low level of economic development (with a GDP share of 0.07%), exhibiting a minor disparity between carbon emission–economic contribution capability and ecological carrying capacity (with an ECC of 0.70 and an ESC of 0.50). In subsequent development phases, there should be active promotion of marine economic industries and the construction of low-carbon and efficient smart ports. Simultaneously, the development of clean energy, such as wind energy, solar energy, and tidal energy, should be promoted to reduce carbon emissions. Ecologically, rational restoration and regular monitoring of coastal shorelines and wetlands should be conducted.
3.4.3. Compensated Zone
The compensated zone is concentrated in the southern part of the CAYRDUA. It accounts for about 41.84% of the land area, with a high ecological carrying capacity (the ECC is 1.45, the ESC is 3.98, and carbon sinks account for 50.31%), a relatively slow economic development (the share of GDP is 18.37%), and low carbon emission (the carbon emission only accounts for 12.65%).
(1) Compensated zones—optimized development zone. This region includes 14 county-level cities, primarily from Nanjing, Shanghai, Hangzhou, and Huzhou, accounting for 6.72% of the CAYRDUA. Despite relatively good economic development, the carbon emissions are low (with a GDP share of 9.76% and carbon emissions accounting for 4.44%, with an ECC of 2.20). It exhibits strong carbon sink capabilities (with carbon sinks accounting for 9.24% and an ESC of 2.08). This area is mainly situated in the hinterland of the CAYRDUA and can be divided into two parts. The first part comprises the old urban areas of first-tier cities, such as Shanghai, Hangzhou, and Nanjing, characterized by severe industrial hollowing. In subsequent development phases, efforts should be made to promote green and low-carbon lifestyles and emphasize urban greening actively. The second part comprises county-level cities primarily engaged in the secondary industry, mainly concentrated in cities such as Huzhou, Jiaxing, and Shaoxing in Zhejiang Province. This area has relatively favorable ecological conditions and high carbon sink capacity, with low intensity of land development. In subsequent development phases, attention should be paid to adjusting the industrial structure and promoting the transformation of traditional manufacturing industries. Strengthening the protection of vital water sources and existing ecological resources and exploring the path of ecological economy should also be emphasized.
(2) Compensated zones—key development zone. This region is mainly located along the southeastern coast of the CAYRDUA, which is entirely within Zhejiang Province. It includes 10 county-level cities, primarily in Ningbo, Shaoxing, Taizhou, and Zhoushan, accounting for 11.38% of the total land area. Despite low levels of economic development and carbon emissions (with a GDP share of 3.73% and carbon emissions accounting for 3.58%), this area demonstrates strong carbon sink capabilities (accounting for 15.13% of the total). It possesses good ecology carrying capacity (with an ECC of 1.04 and an ESC of 4.23). In the subsequent development phases, it is essential to capitalize on coastal advantages and foster unique marine industries. Additionally, exploring carbon emission markets and trading is crucial to identifying new avenues for economic growth. To address issues such as soil erosion and coastal pollution, ecology restoration measures should be implemented to enhance the region’s carbon sink capacity further.
(3) Compensated zones—agricultural products’ main production zone. This region is mainly located in Jiangsu Province, which is characterized by a flat terrain. It includes six county-level cities, primarily in Nanjing, Nantong, Taizhou, Yangzhou, and Jiaxing, accounting for 7.67% of the total land area. It contributes relatively less to carbon emissions and GDP (with a GDP share of 2.93% and carbon emissions accounting for 2.53%, with an ECC of 1.16) but exhibits good carbon sink functionality (contributing to 5.38% of carbon sinks and possessing an ESC of 2.13). In the subsequent development phases, efforts should be intensified to promote significant agricultural product development, develop distinctive brands, and foster specialized breeding techniques. Optimization of the ratio and usage of agricultural pesticides and fertilizers to promote low-carbon agriculture should be prioritized. Exploring new pathways that integrate specialty agriculture with tourism to drive local economic development should also be considered.
(4) Compensated zones—key ecological functional zone. This region is primarily located in the southwestern mountainous and hilly areas of the CAYRDUA, mainly including eight county-level cities, primarily in Hangzhou, Huzhou, Shaoxing, and Taizhou, accounting for 16.08% of the total land area. It exhibits strong ecological carrying capacity (with carbon sinks accounting for 20.56% and an ESC of 9.79). However, it has a low level of economic development (with a GDP share of 1.95% and an ECC of 0.9286). In the later stages of development, particular attention should be given to protecting water sources, such as Qiandao Lake and its surrounding wetlands, controlling the intensity of shoreline development, and addressing soil erosion in hilly areas. Economically, fostering collaboration with the surrounding ecological function zones is important for nurturing a distinctive tourism industry chain, consequently bolstering the ecological contribution to the economy.
4. Discussion
In this study, we calculated the carbon budget of the CAYRDUA by utilizing night-time light data, land use data, energy consumption data, and other socio-economic data; analyzed the distribution patterns and evolutionary trends; explored carbon compensation zones at the county level; and proposed low-carbon development recommendations. The study found that carbon emissions in the CAYRDUA have slowed down since 2011, which is consistent with previous studies. Wei et al. suggested that carbon emissions in the YRDUA were around 1.6 billion tons after 2011 [59], whereas this study indicates that the total carbon emissions in the study area stabilized at around 1.2 billion tons. This difference can be attributed to the different scopes of urban agglomeration. The carbon sinks in the CAYRDUA estimated in this study were higher than those in other similar studies [60], which was because the carbon sinks estimated in this study comprised the mass of carbon dioxide rather than the mass of carbon. In addition to considering the aboveground carbon sinks, the carbon dioxide fixed by the underground root system and litter was also estimated in this study, which better reflected the changes in carbon budget in the CAYRDUA in each year of the long time series. The Guangdong–Hong Kong–Macao Greater Bay Area urban agglomeration, the Beijing–Tianjin–Hebei urban agglomeration, and the YRDUA are China’s three major urban agglomerations. In terms of time, all three urban agglomerations showed decreasing trends in carbon budget after 2000 [58,61]. In 2000, the carbon budget of the Guangdong–Hong Kong–Macao Greater Bay Area was better than that of the YRDUA, and the worst carbon budget was found in the Beijing–Tianjin–Hebei urban agglomeration. The carbon budget of the YRDUA was the worst after 2017. The carbon budget of the Guangdong–Hong Kong–Macao Greater Bay Area was better [58,61]. This situation may be related to the industrial structure and economic scale, with Beijing–Tianjin–Hebei being a highly polluting and energy-consuming heavy industrial base [62]. At the same time, the YRDUA has a sizeable economic scale, with a concentration of manufacturing industries and a high demand for energy. The Guangdong–Hong Kong–Macao Greater Bay Area has diversified industries, with high-value-added and tertiary industries working together as the pillar industries. It has a higher carbon emission efficiency than the other two city clusters, playing a greater role in low-carbon development [63]. The industrial structure and carbon emission reduction experience of the Guangdong–Hong Kong–Macao Greater Bay Area urban agglomeration can provide a reference for the YRDUA and encourage the YRDUA to achieve a balance in the carbon budget.
From a spatial perspective, areas with high carbon emission contributions and economic development are often located in important water source areas, major river basins, and coastal areas, consistent with the findings of Xiong et al. [64]. The payment areas are faceted on the northern shore of Taihu Lake, the southern shore of the Yangtze River, and the eastern coast, a phenomenon related to economic, policy, and geographic factors. From 2001 to 2016, the financial center of the Yangtze River Delta shifted northwestward to Suzhou, and the intensity of financial ties between Shanghai and the surrounding cities continued to increase [65]. Leveraging the natural advantage of the Yangtze River waterway, Suzhou and Shanghai radiated to cities in southern Jiangsu Province, facilitating industrial transfer. Research has shown that the degree of synergy in the manufacturing industry between Suzhou, Wuxi, and Changzhou is higher than in other cities [66]. In 2016, China issued the “Outline of Yangtze River Economic Belt Development”, proposing to build development axes along the Yangtze River. It can be inferred that the trend of payment zones developing continuously to the west will continue.
The balanced zone—key development zone is mainly concentrated on the northern bank of the Yangtze River and the coastal areas surrounding the peripheral areas of the payment zone. The balanced zone—optimized development zone is scattered along both sides of the Beijing–Hangzhou Grand Canal and the coastal areas. From the perspective of ports, the Yangtze River, as China’s largest river, has a higher port density in its basin compared to the Beijing–Hangzhou Grand Canal basin [67], benefiting the county-level cities of Yangzhou, Taizhou, and Nantong adjacent to the Yangtze River, which have a better development potential and become the main industrial receiving sites for first-tier cities. In addition to the development axis along the Yangtze River, coastal cities have also proposed a development axis along the coast. Building upon major maritime ports, such as the Shanghai Port and Ningbo–Zhoushan Port, industries and regions with high carbon emissions will continue to migrate and expand to the north and south of the CAYRDUA.
This paper puts forward a low-carbon development proposal for each carbon compensation zone. It plans to realize the proposal through cooperation with the government and undertaking government projects, suggesting that the government incorporate it into the existing planning instruments. In the process, considering the coordinated development of carbon emission reduction plans and the economy, new jobs and economic growth in localities will increase by developing the carbon trading market and new energy industries, thereby increasing the benefits of the green economy. This will contribute to realizing the “dual carbon” target.
5. Conclusions
The study computed carbon emissions and carbon sinks at the county level within the CAYRDUA from 2000 to 2020. The carbon budget was then calculated, and its spatiotemporal patterns and evolution trends were analyzed. A carbon compensation zoning index system was developed based on three attributes: socio-economy, ecology, and the scale of carbon emissions. Different types of carbon compensation zones were delineated using NRCA and the K-means algorithm. Subsequently, low-carbon development recommendations were proposed for each type of carbon compensation zone, considering regional characteristics in conjunction with the main functional zones. The main conclusions are as follows:
(1) The growth of carbon emissions in the CAYRDUA can be delineated into three stages: a period of continuous rapid increase from 2000 to 2004, followed by a slowdown in growth from 2005 to 2011 and eventual stabilization of total carbon emissions after 2012. Spatially, high carbon emission areas have transitioned from a “core-periphery” pattern to a “Z-shaped” distribution, being primarily concentrated in the central region of the CAYRDUA, with an expanding spatial extent over time. Carbon sinks in the CAYRDUA have exhibited a sustained declining trend, with a spatial distribution pattern characterized by a “high in the south, low in the north” trend. High-carbon sink regions are predominantly located in the hilly southern areas, while low-carbon sink regions are situated in the central and northern plains.
(2) In the CAYRDUA, a significant imbalance exists in the carbon budget in terms of quantity and spatial distribution. Quantitatively, carbon emissions far exceed carbon sinks, leading to a severe imbalance in the carbon budget, with the deficit continuously increasing. From 2000 to 2011, there has been a rapid decline in the carbon budget, followed by a relative stabilization of the total carbon budget after 2012. Spatially, carbon budget distribution demonstrates a “high in the south, low in the north” pattern, with significant regional disparities. Zhejiang Province exhibits better carbon budget capabilities than Jiangsu and Shanghai. From 2000 to 2020, the number of cities with a carbon budget surplus has decreased, becoming highly concentrated in the southwest. The spatial distribution of carbon budgets in the CAYRDUA exhibits obvious spatial autocorrelation. As time progresses, the degree of spatial autocorrelation decreases, ecological disturbances increase, and the area of high–high clustering decreases.
(3) This study constructed a carbon compensation zoning index system based on three attributes: socio-economy, ecology, and the scale of carbon emission. Subsequently, the CAYRDUA, consisting of 129 county-level cities, was classified into 43 payment zones, 48 balanced zones, and 38 compensated zone. These zones were overlaid with the main functional zoning, and considering the regional characteristics and development levels, appropriate low-carbon development recommendations were provided for each zone. The research findings hold significance in providing insights for developed regions and urban agglomerations in China to explore low-carbon pathways and formulate emission reduction policies.
In this paper, we discussed the evolution of carbon budget and carbon compensation zoning at the county scale and gave suggestions for low-carbon development by combining the characteristics of different carbon compensation zones. However, the shortcoming is that we did not analyze in depth the driving factors affecting the carbon budget. Moreover, fewer indicators were used in carbon compensation zoning, and more indicators with zoning characteristics will be added in the later study for more scientific and accurate carbon compensation zoning.
Supplementary Materials
The following supporting information can be downloaded at: https://www.mdpi.com/article/10.3390/land13060747/s1, Table S1: The socio-economic and physical environmental attributes in the CAYRDUA and China in 2020.
Author Contributions
Conceptualization, R.W. and H.C.; methodology, Y.T., R.W. and H.C.; data curation, Y.T.; writing—original draft preparation, Y.T. and R.W.; writing—review and editing, H.C. and J.T.; validation, Y.T.; resources, H.Y., Z.Y. and J.W. All authors have read and agreed to the published version of the manuscript.
Funding
This research was funded by the Xinjiang Uygur Autonomous Region Key Research and Development Program (2022B01012-2, 2022B01012-1); the third comprehensive scientific investigation project in Xinjiang (2022xjkk1006); the National Natural Science Foundation of China (41971335); the Science and Technology Innovation Project of Jiangsu Provincial Department of Natural Resources (2023029, 2022008).
Data Availability Statement
The data presented in this study are available upon request from the corresponding author. The data are not publicly available due to privacy.
Conflicts of Interest
The authors declare no conflicts of interest.
References
- Golledge, N.R.; Kowalewski, D.E.; Naish, T.R.; Levy, R.H.; Fogwill, C.J.; Gasson, E.G.W. The multi-millennial Antarctic commitment to future sea-level rise. Nature 2015, 526, 421–425. [Google Scholar] [CrossRef] [PubMed]
- Strauss, B.H.; Kulp, S.A.; Rasmussen, D.J.; Levermann, A. Unprecedented threats to cities from multi-century sea level rise. Environ. Res. Lett. 2021, 16, 114015. [Google Scholar] [CrossRef]
- Kharin, V.V.; Flato, G.M.; Zhang, X.; Gillett, N.P.; Zwiers, F.; Anderson, K.J. Risks from Climate Extremes Change Differently from 1.5 °C to 2.0 °C Depending on Rarity. Earths Future 2018, 6, 704–715. [Google Scholar] [CrossRef]
- Alfieri, L.; Bisselink, B.; Dottori, F.; Naumann, G.; de Roo, A.; Salamon, P.; Wyser, K.; Feyen, L. Global projections of river flood risk in a warmer world. Earths Future 2017, 5, 171–182. [Google Scholar] [CrossRef]
- Bender, M.A.; Knutson, T.R.; Tuleya, R.E.; Sirutis, J.J.; Vecchi, G.A.; Garner, S.T.; Held, I.M. Modeled Impact of Anthropogenic Warming on the Frequency of Intense Atlantic Hurricanes. Science 2010, 327, 454–458. [Google Scholar] [CrossRef]
- Zhang, W.X.; Zhou, T.J. Increasing impacts from extreme precipitation on population over China with global warming. Sci. Bull. 2020, 65, 243–252. [Google Scholar] [CrossRef] [PubMed]
- Jevrejeva, S.; Jackson, L.P.; Grinsted, A.; Lincke, D.; Marzeion, B. Flood damage costs under the sea level rise with warming of 1.5 °C and 2 °C. Environ. Res. Lett. 2018, 13, 074014. [Google Scholar] [CrossRef]
- Mohan, R.R. Time series GHG emission estimates for residential, commercial, agriculture and fisheries sectors in India. Atmos. Environ. 2018, 178, 73–79. [Google Scholar] [CrossRef]
- Bonetti, B.; Abruzzi, R.C.; Peglow, C.P.; Pires, M.J.R.; Gomes, C.J.B. CH4 and CO2 monitoring in the air of underground coal mines in southern Brazil and GHG emission estimation. REM—Int. Eng. J. 2019, 72, 635–642. [Google Scholar] [CrossRef]
- Ali, Y.; Pretaroli, R.; Socci, C.; Severini, F. Carbon and water footprint accounts of Italy: A Multi-Region Input-Output approach. Renew. Sust. Energ. Rev. 2018, 81, 1813–1824. [Google Scholar] [CrossRef]
- Sugarmansyah, U.; Setiastuti, N.; Apriyanto, H.; Mulyono, H.; Heldini, N.; Pradnyapasa, D.A.; Putera, I.P.; Medtry, M.; Putra, A.S.; Karim, S.; et al. The Impact of Export on the Development of Green Industries for Sustainability in DI Yogyakarta Region, Indonesia: An Extended Input-Output Analysis. Pol. J. Environ. Stud. 2024, 33, 1849–1860. [Google Scholar] [CrossRef]
- da Silva, M.G.; Muniz, A.R.C.; Hoffmann, R.; Lisbôa, A.C.L. Impact of greenhouse gases on surface coal mining in Brazil. J. Clean. Prod. 2018, 193, 206–216. [Google Scholar] [CrossRef]
- Rabani, M.; Madessa, H.B.; Ljungström, M.; Aamodt, L.; Lovvold, S.; Nord, N. Life cycle analysis of GHG emissions from the building retrofitting: The case of a Norwegian office building. Build. Environ. 2021, 204, 108159. [Google Scholar] [CrossRef]
- Parodi, A.; De Boer, I.J.M.; Gerrits, W.J.J.; Van Loon, J.J.A.; Heetkamp, M.J.W.; Van Schelt, J.; Bolhuis, J.E.; Van Zanten, H.H. Bioconversion efficiencies, greenhouse gas and ammonia emissions during black soldier fly rearing—A mass balance approach. J. Clean. Prod. 2020, 271, 122488. [Google Scholar] [CrossRef]
- Friedlingstein, P.; O’Sullivan, M.; Jones, M.W.; Andrew, R.M.; Hauck, J.; Olsen, A.; Peters, G.P.; Peters, W.; Pongratz, J.; Sitch, S.; et al. Global Carbon Budget 2020. Earth Syst. Sci. Data 2020, 12, 3269–3340. [Google Scholar] [CrossRef]
- Jandl, R.; Ledermann, T.; Kindermann, G.; Weiss, P. Soil Organic Carbon Stocks in Mixed-Deciduous and Coniferous Forests in Austria. Front. For. Glob. Change 2021, 4, 688851. [Google Scholar] [CrossRef]
- Cavaleri, M.A.; Coble, A.P.; Ryan, M.G.; Bauerle, W.L.; Loescher, H.W.; Oberbauer, S.F. Tropical rainforest carbon sink declines during EI Nino as a result of reduced photosynthesis and increased respiration rates. New Phytol. 2017, 216, 136–149. [Google Scholar] [CrossRef]
- Mao, F.J.; Zhou, G.M.; Li, P.H.; Du, H.Q.; Xu, X.J.; Shi, Y.J.; Mo, L.F.; Zhou, Y.F.; Tu, G.Q. Optimizing selective cutting strategies for maximum carbon stocks and yield of Moso bamboo forest using BIOME-BGC model. J. Environ. Manage. 2017, 191, 126–135. [Google Scholar] [CrossRef]
- Peylin, P.; Law, R.M.; Gurney, K.R.; Chevallier, F.; Jacobson, A.R.; Maki, T.; Niwa, Y.; Patra, P.K.; Peters, W.; Rayner, P.J.; et al. Global atmospheric carbon budget: Results from an ensemble of atmospheric CO2 inversions. Biogeosciences 2013, 10, 6699–6720. [Google Scholar] [CrossRef]
- Sleeter, B.M.; Liu, J.X.; Daniel, C.; Rayfield, B.; Sherba, J.; Hawbaker, T.J.; Zhu, Z.L.; Selmants, P.C.; Loveland, T.R. Effects of contemporary land-use and land-cover change on the carbon balance of terrestrial ecosystems in the United States. Environ. Res. Lett. 2018, 13, 045006. [Google Scholar] [CrossRef]
- Magerl, A.; Le Noë, J.; Erb, K.H.; Bhan, M.; Gingrich, S. A comprehensive data-based assessment of forest ecosystem carbon stocks in the US 1907-2012. Environ. Res. Lett. 2019, 14, 125015. [Google Scholar] [CrossRef]
- Hu, Y.B.; Zhang, Q.; Hu, S.J.; Xiao, G.J.; Zhang, L.; Han, L.Y.; Yue, P.; Wang, J.S.; Qi, Y.; Ye, P.L. Crop yield and carbon sink potential with precipitation in maize and potato cropland ecosystems over the summertime monsoon transition zone of China. Soil. Use Manag. 2023, 39, 742–756. [Google Scholar] [CrossRef]
- Ali, G.; Pumijumnong, N.; Cui, S.H. Valuation and validation of carbon sources and sinks through land cover/use change analysis: The case of Bangkok metropolitan area. Land Use Policy 2018, 70, 471–478. [Google Scholar] [CrossRef]
- Li, T.; Li, J.; Zhou, Z.X.; Wang, Y.Z.; Yang, X.N.; Qin, K.Y.; Liu, J.Y. Taking climate, land use, and social economy into estimation of carbon budget in the Guanzhong-Tianshui Economic Region of China. Environ. Sci. Pollut. Res. 2017, 24, 10466–10480. [Google Scholar] [CrossRef]
- Kim, D.; Lim, C.H.; Song, C.; Lee, W.K.; Piao, D.; Heo, S.; Jeon, S. Estimation of future carbon budget with climate change and reforestation scenario in North Korea. Adv. Space Res. 2016, 58, 1002–1016. [Google Scholar] [CrossRef]
- Oshiro, K.; Gi, K.; Fujimori, S.; van Soest, H.L.; Bertram, C.; Després, J.; Masui, T.; Rochedo, P.; Roelfsema, M.; Vrontisi, Z. Mid-century emission pathways in Japan associated with the global 2 °C goal: National and global models’ assessments based on carbon budgets. Clim. Change 2020, 162, 1913–1927. [Google Scholar] [CrossRef]
- Villalobos, Y.; Canadell, J.G.; Keller, E.D.; Briggs, P.R.; Bukosa, B.; Giltrap, D.L.; Harman, I.; Hilton, T.W.; Kirschbaum, M.U.F.; Lauerwald, R.; et al. A Comprehensive Assessment of Anthropogenic and Natural Sources and Sinks of Australasia’s Carbon Budget. Global Biogeochem. Cycles 2023, 37, e2023GB007845. [Google Scholar] [CrossRef]
- Pique, G.; Fieuzal, R.; Debaeke, P.; Al Bitar, A.; Tallec, T.; Ceschia, E. Combining High-Resolution Remote Sensing Products with a Crop Model to Estimate Carbon and Water Budget Components: Application to Sunflower. Remote Sens. 2020, 12, 2967. [Google Scholar] [CrossRef]
- Zhang, C.P.; Song, K.Y.; Wang, H.; Randhir, T.O. Carbon budget management in the civil aviation industry using an interactive control perspective. Int. J. Sustain. Transp. 2020, 15, 30–39. [Google Scholar] [CrossRef]
- Tamburini, E.; Turolla, E.; Lanzoni, M.; Moore, D.; Castaldelli, G. Manila clam and Mediterranean mussel aquaculture is sustainable and a net carbon sink. Sci. Total Environ. 2022, 848, 157508. [Google Scholar] [CrossRef]
- Lesiv, M.; Shvidenko, A.; Schepaschenko, D.; See, L.; Fritz, S. A spatial assessment of the forest carbon budget for Ukraine. Mitig. Adapt. Strateg. Glob. Chang. 2019, 24, 985–1006. [Google Scholar] [CrossRef]
- de la Motte, L.G.; Jérôme, E.; Mamadou, O.; Beckers, Y.; Bodson, B.; Heinesch, B.; Aubinet, M. Carbon balance of an intensively grazed permanent grassland in southern Belgium. Agric. For. Meteorol. 2016, 228, 370–383. [Google Scholar] [CrossRef]
- Zhao, R.Q.; Liu, Y.; Li, Y.X.; Ding, M.L.; Zhang, Z.P.; Chuai, X.W.; Jiao, S.X. Overview of Regional Carbon Compensation: Mechanism, Pattern and Policy Suggestions. Areal Res. Dev. 2015, 34, 116–120. (In Chinese) [Google Scholar]
- Li, D.L.; Cao, L.J.; Zhou, Z.H.; Zhao, K.K.; Du, Z.N.; Chen, Y.J. Correlating CO2 emissions of cities with the inter-city carbon compensation mechanism: A regional perspective in the middle reaches of the Yangtze River (MRYR), China. Environ. Dev. Sustain. 2023, 26, 9185–9216. [Google Scholar] [CrossRef]
- Wang, W.X.; Wang, W.J.; Xie, P.C.; Zhao, D.Q. Spatial and temporal disparities of carbon emissions and interregional carbon compensation in major function-oriented zones: A case study of Guangdong province. J. Clean. Prod. 2020, 245, 118873. [Google Scholar] [CrossRef]
- Chen, J.; Wu, S.S.; Zhang, L.F. Spatiotemporal Variation of Per Capita Carbon Emissions and Carbon Compensation Zoning in Chinese Counties. Land 2023, 12, 1796. [Google Scholar] [CrossRef]
- Gao, S.S.; Zhang, X.P.; Chen, M.X. Spatiotemporal dynamics and driving forces of city-level CO2 emissions in China from 2000 to 2019. J. Clean Prod. 2022, 377, 134358. [Google Scholar] [CrossRef]
- Miao, Y.; Kong, C.C.; Wang, L.L.; Mu, J.Z.; Lu, X.; Bao, J.Q.; Li, H. A provincial lateral carbon emissions compensation plan in China based on carbon budget perspective. Sci. Total Environ. 2019, 692, 1086–1096. [Google Scholar] [CrossRef] [PubMed]
- Zhou, L.; Song, J.; Chi, Y.G.; Yu, Q.Z. Differential Spatiotemporal Patterns of CO2 Emissions in Eastern China’s Urban Agglomerations from NPP/VIIRS Nighttime Light Data Based on a Neural Network Algorithm. Remote Sens. 2023, 15, 404. [Google Scholar] [CrossRef]
- Han, J.; Meng, X.; Zhou, X.; Yi, B.L.; Liu, M.; Xiang, W.N. A long-term analysis of urbanization process, landscape change, and carbon sources and sinks: A case study in China’s Yangtze River Delta region. J. Clean. Prod. 2017, 141, 1040–1050. [Google Scholar] [CrossRef]
- Zhu, S.Y.; Ding, Y.; Pan, R.; Ding, A.F. Analysis of Interprovincial Differences in CO2 Emissions and Peak Prediction in the Yangtze River Delta. Sustainability 2023, 15, 6474. [Google Scholar] [CrossRef]
- Doll, C.N.H.; Muller, J.P.; Elvidge, C.D. Night-time imagery as a tool for global mapping of socioeconomic parameters and greenhouse gas emissions. Ambio 2000, 29, 157–162. [Google Scholar] [CrossRef]
- Elvidge, C.D.; Imhoff, M.L.; Baugh, K.E.; Hobson, V.R.; Nelson, I.; Safran, J.; Dietz, J.B.; Tuttle, B.T. Night-time lights of the world: 1994–1995. ISPRS-J. Photogramm. Remote Sens. 2001, 56, 81–99. [Google Scholar] [CrossRef]
- Meng, L.N.; Graus, W.; Worrell, E.; Huang, B. Estimating CO2 (carbon dioxide) emissions at urban scales by DMSP/OLS (Defense Meteorological Satellite Program’s Operational Linescan System) nighttime light imagery: Methodological challenges and a case study for China. Energy 2014, 71, 468–478. [Google Scholar] [CrossRef]
- Xu, J.H.; Li, Y.Y.; Hu, F.; Wang, L.; Wang, K.; Ma, W.H.; Ruan, N.; Jiang, W.Z. Spatio-Temporal Variation of Carbon Emission Intensity and Spatial Heterogeneity of Influencing Factors in the Yangtze River Delta. Atmosphere 2023, 14, 163. [Google Scholar] [CrossRef]
- Li, W.; Chen, Z.J.; Li, M.C.; Zhang, H.; Li, M.Y.; Qiu, X.Q.; Zhou, C. Carbon emission and economic development trade-offs for optimizing land-use allocation in the Yangtze River Delta, China. Ecol. Indic. 2023, 147, 109950. [Google Scholar] [CrossRef]
- Doumbia, E.T.; Liousse, C.; Keita, S.; Granier, L.; Granier, C.; Elvidge, C.D.; Elguindi, N.; Law, K. Flaring emissions in Africa: Distribution, evolution and comparison with current inventories. Atmos. Environ. 2019, 199, 423–434. [Google Scholar] [CrossRef]
- Su, Y.X.; Chen, X.Z.; Li, Y.; Liao, J.S.; Ye, Y.Y.; Zhang, H.G.; Huang, N.S.; Kuang, Y.Q. China’s 19-year city-level carbon emissions of energy consumptions, driving forces and regionalized mitigation guidelines. Renew. Sust. Energ. Rev. 2014, 35, 231–243. [Google Scholar] [CrossRef]
- Lv, Q.; Liu, H.B.; Wang, J.T.; Liu, H.; Shang, Y. Multiscale analysis on spatiotemporal dynamics of energy consumption CO2 emissions in China: Utilizing the integrated of DMSP-OLS and NPP-VIIRS nighttime light datasets. Sci. Total Environ. 2020, 703, 134394. [Google Scholar] [CrossRef]
- Li, X.; Li, D.R.; Xu, H.M.; Wu, C.Q. Intercalibration between DMSP/OLS and VIIRS night-time light images to evaluate city light dynamics of Syria’s major human settlement during Syrian Civil War. Int. J. Remote Sens. 2017, 38, 5934–5951. [Google Scholar] [CrossRef]
- Wei, W.; Du, H.B.; Ma, L.B.; Liu, C.F.; Zhou, J.J. Spatiotemporal dynamics of CO2 emissions using nighttime light data: A comparative analysis between the Yellow and Yangtze River Basins in China. Environ. Dev. Sustain. 2024, 26, 1081–1102. [Google Scholar] [CrossRef]
- Zhu, Z.; Yu, J.Y.; Luo, J.H.; Zhang, H.Y.; Wu, Q.L.; Chen, Y.H. A GDM-GTWR-Coupled Model for Spatiotemporal Heterogeneity Quantification of CO2 Emissions: A Case of the Yangtze River Delta Urban Agglomeration from 2000 to 2017. Atmosphere 2022, 13, 1195. [Google Scholar] [CrossRef]
- Xu, G.; Zeng, T.Y.; Jin, H.; Xu, C.; Zhang, Z.Q. Spatio-Temporal Variations and Influencing Factors of Country-Level Carbon Emissions for Northeast China Based on VIIRS Nighttime Lighting Data. Int. J. Environ. Res. Public. Health 2023, 20, 829. [Google Scholar] [CrossRef] [PubMed]
- Sun, W.; Wu, R.H. Study on the balance of carbon budget and its spatial differentiation in Yangtze River Delta. Geogr. Res. 2012, 31, 2220–2228. (In Chinese) [Google Scholar]
- Yang, J.; Huang, X. The 30 m annual land cover dataset and its dynamics in China from 1990 to 2019. Earth Syst. Sci. Data 2021, 13, 3907–3925. [Google Scholar] [CrossRef]
- Huang, M.; Ji, J.J.; Cao, M.K.; Li, K.R. Modeling study of vegetation shoot and root biomass in China. Acta Ecol. Sin. 2006, 26, 4156–4163. (In Chinese) [Google Scholar]
- Wang, R.; Ci, H.; Zhang, T.; Tang, Y.X.; Wei, J.Y.; Yang, H.; Feng, G.F.; Yan, Z.J. Spatial-Temporal Evolution Characteristics of Industrial Carbon Emissions in China’s Most Developed Provinces from 1998-2013: The Case of Guangdong. Energies 2023, 16, 2249. [Google Scholar] [CrossRef]
- Xia, S.Y.; Yang, Y. Examining spatio-temporal variations in carbon budget and carbon compensation zoning in Beijing-Tianjin-Hebei urban agglomeration based on major functional zones. J. Geog. Sci. 2022, 32, 1911–1934. [Google Scholar] [CrossRef]
- Wei, Z.Y.; Li, J.M.; Wang, Z.Y.; Zhou, A.Q.; Li, M.H. County carbon emissions in the Yangtze River Delta region: Spatial layout, dynamic evolution and spatial spillover effects. Front. Environ. Sci. 2022, 10, 977198. [Google Scholar] [CrossRef]
- Yi, B.L.; Han, J.; Zhou, X.; Yang, F.; Meng, X.; Cao, W.X.; Huang, L.X.; Xiang, W.N. Spatiotemporal pattern of carbon sources and sinks in Yangtze River Delta region, China. Chin. J. Appl. Ecol. 2015, 26, 973–980. (In Chinese) [Google Scholar]
- Luo, Z.H.; Wu, Y.Y.; Zhou, L.X.; Sun, Q.; Yu, X.J.; Zhu, L.P.; Zhang, X.J.; Fang, Q.L.; Yang, X.; Yang, J.; et al. Trade-off between vegetation CO2 sequestration and fossil fuel-related CO2 emissions: A case study of the Guangdong-Hong Kong-Macao Greater Bay Area of China. Sust. Cities Soc. 2021, 74, 103195. [Google Scholar] [CrossRef]
- Chai, Y.; Lin, X.Q.; Wang, D. Industrial Structure Transformation and Layout Optimization of Beijing-Tianjin-Hebei Region under Carbon Emission Constraints. Sustainability 2021, 13, 643. [Google Scholar] [CrossRef]
- Zheng, R.J.; Cheng, Y.; Liu, H.M.; Chen, W.; Chen, X.D.; Wang, Y.P. The Spatiotemporal Distribution and Drivers of Urban Carbon Emission Efficiency: The Role of Technological Innovation. Int. J. Environ. Res. Public. Health 2022, 19, 9111. [Google Scholar] [CrossRef]
- Xiong, S.W.; Yang, F.; Li, J.Y.; Xu, Z.N.; Ou, J.G. Temporal-spatial variation and regulatory mechanism of carbon budgets in territorial space through the lens of carbon balance: A case of the middle reaches of the Yangtze River urban agglomerations, China. Ecol. Indic. 2023, 154, 110885. [Google Scholar] [CrossRef]
- Ye, C.; Zhu, J.J.; Li, S.M.; Yang, S.; Chen, M.X. Assessment and analysis of regional economic collaborative development within an urban agglomeration: Yangtze River Delta as a case study. Habitat Int. 2019, 83, 20–29. [Google Scholar] [CrossRef]
- Zhu, K.; Sun, W.X. Collaborative agglomeration level and spatial correlation of intercity manufacturing industry: An empirical study based on the cities of the Yangtze River Delta. PLoS ONE 2023, 18, e0293645. [Google Scholar] [CrossRef] [PubMed]
- Zhang, P.L.; Li, H.L.; Wang, J.Q.; Hong, J.W. Analysis of Spatial Wharf Pattern of the Yangtze River Delta Urban Agglomeration, China. Isprs Int. J. Geo-Inf. 2019, 8, 541. [Google Scholar] [CrossRef]


Disclaimer/Publisher’s Note: The statements, opinions and data contained in all publications are solely those of the individual author(s) and contributor(s) and not of MDPI and/or the editor(s). MDPI and/or the editor(s) disclaim responsibility for any injury to people or property resulting from any ideas, methods, instructions or products referred to in the content. |
© 2024 by the authors. Licensee MDPI, Basel, Switzerland. This article is an open access article distributed under the terms and conditions of the Creative Commons Attribution (CC BY) license (https://creativecommons.org/licenses/by/4.0/).