

An Assessment of Landscape Perception Using a Normalised Naturalness Index in the Greater Seoul Area


Abstract
1. Introduction
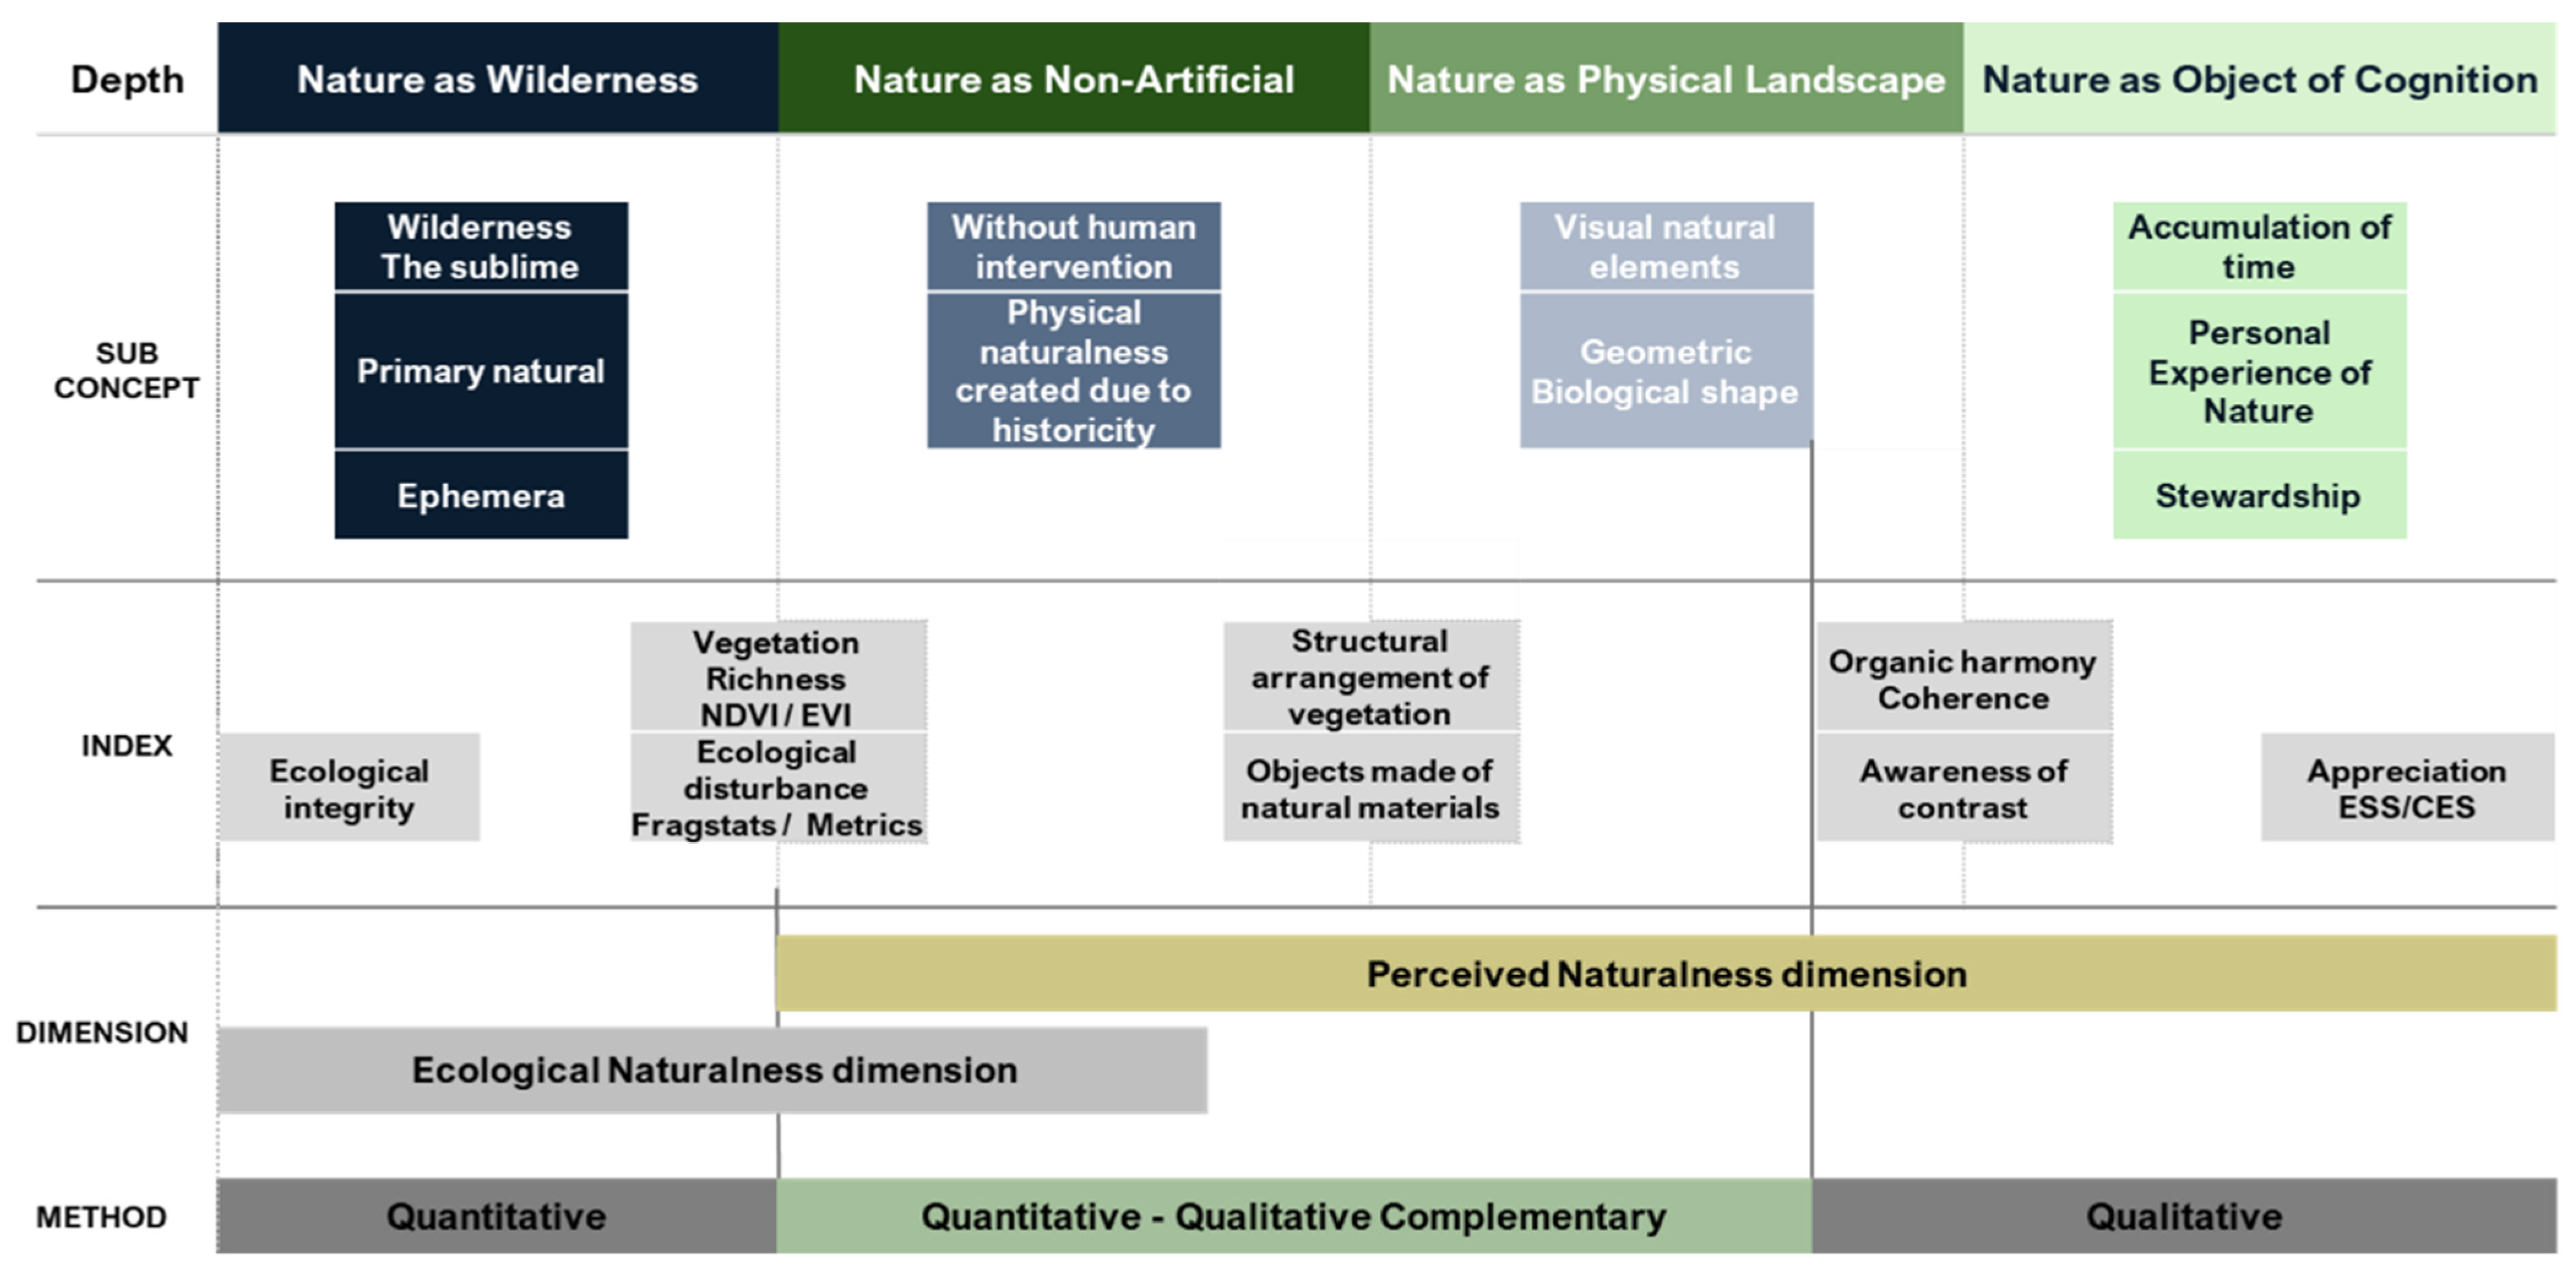
1.1. Landscape and Perception
1.2. Naturalness of Landscape Character
2. Material and Methods
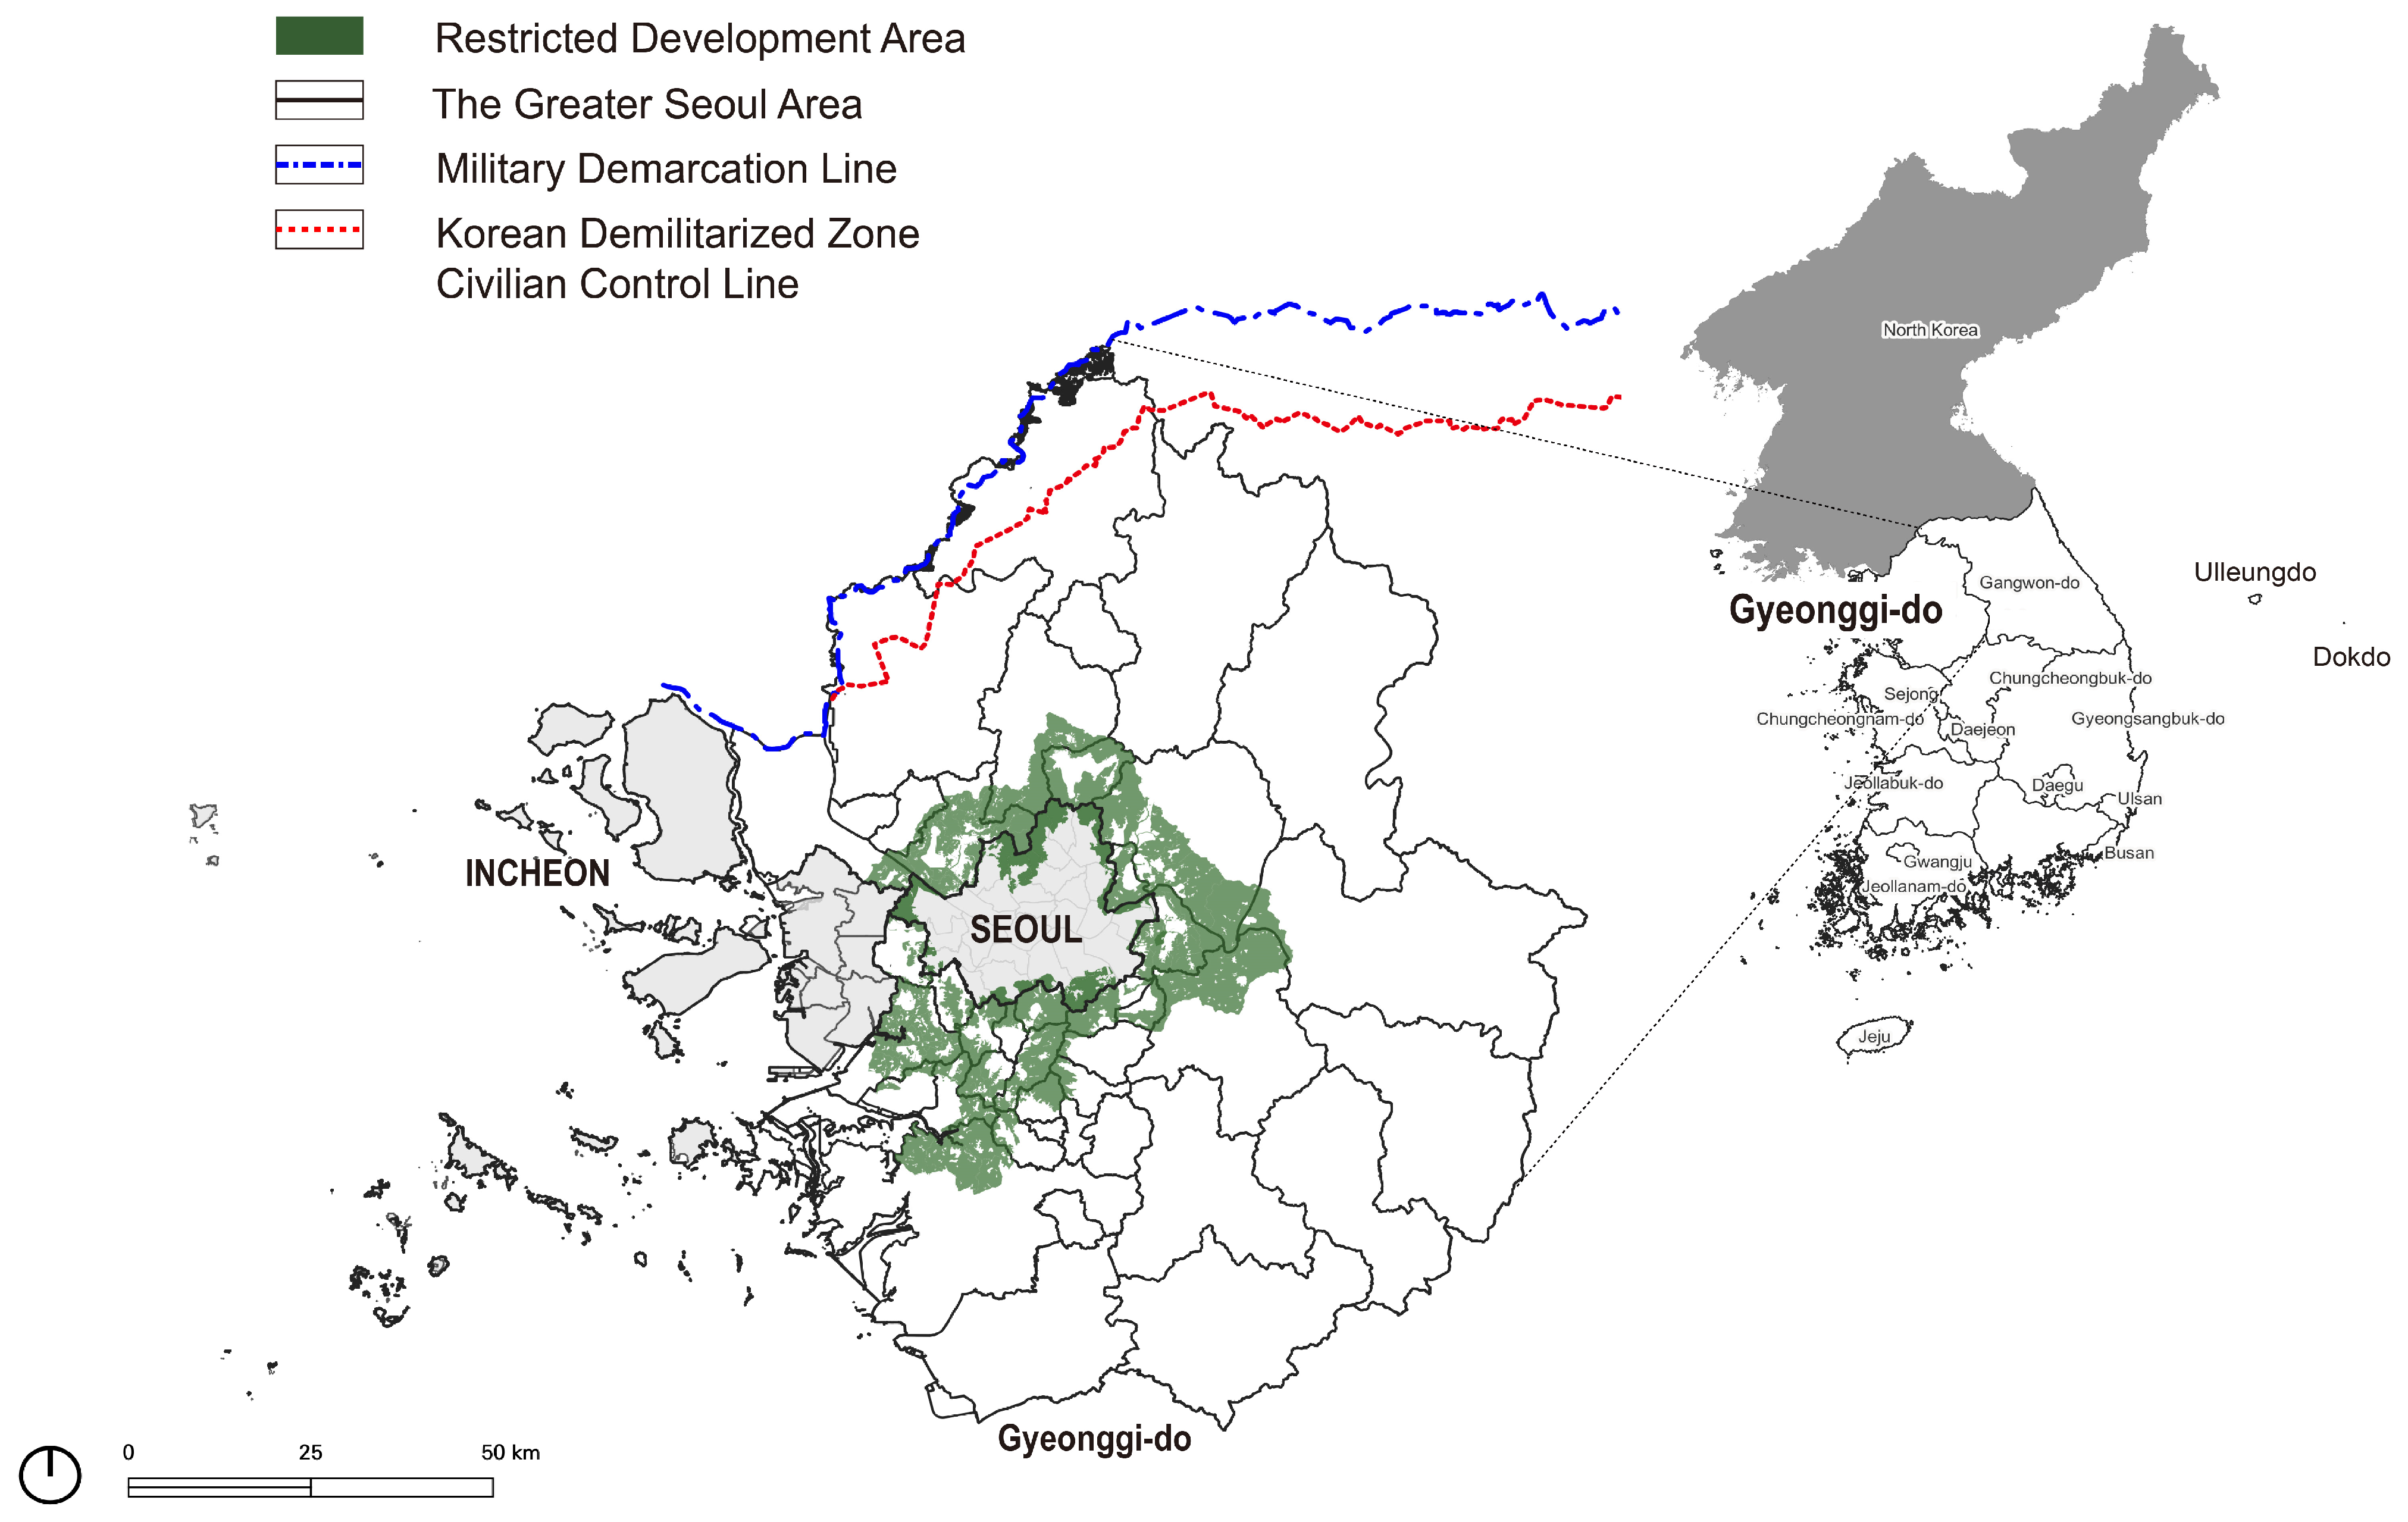
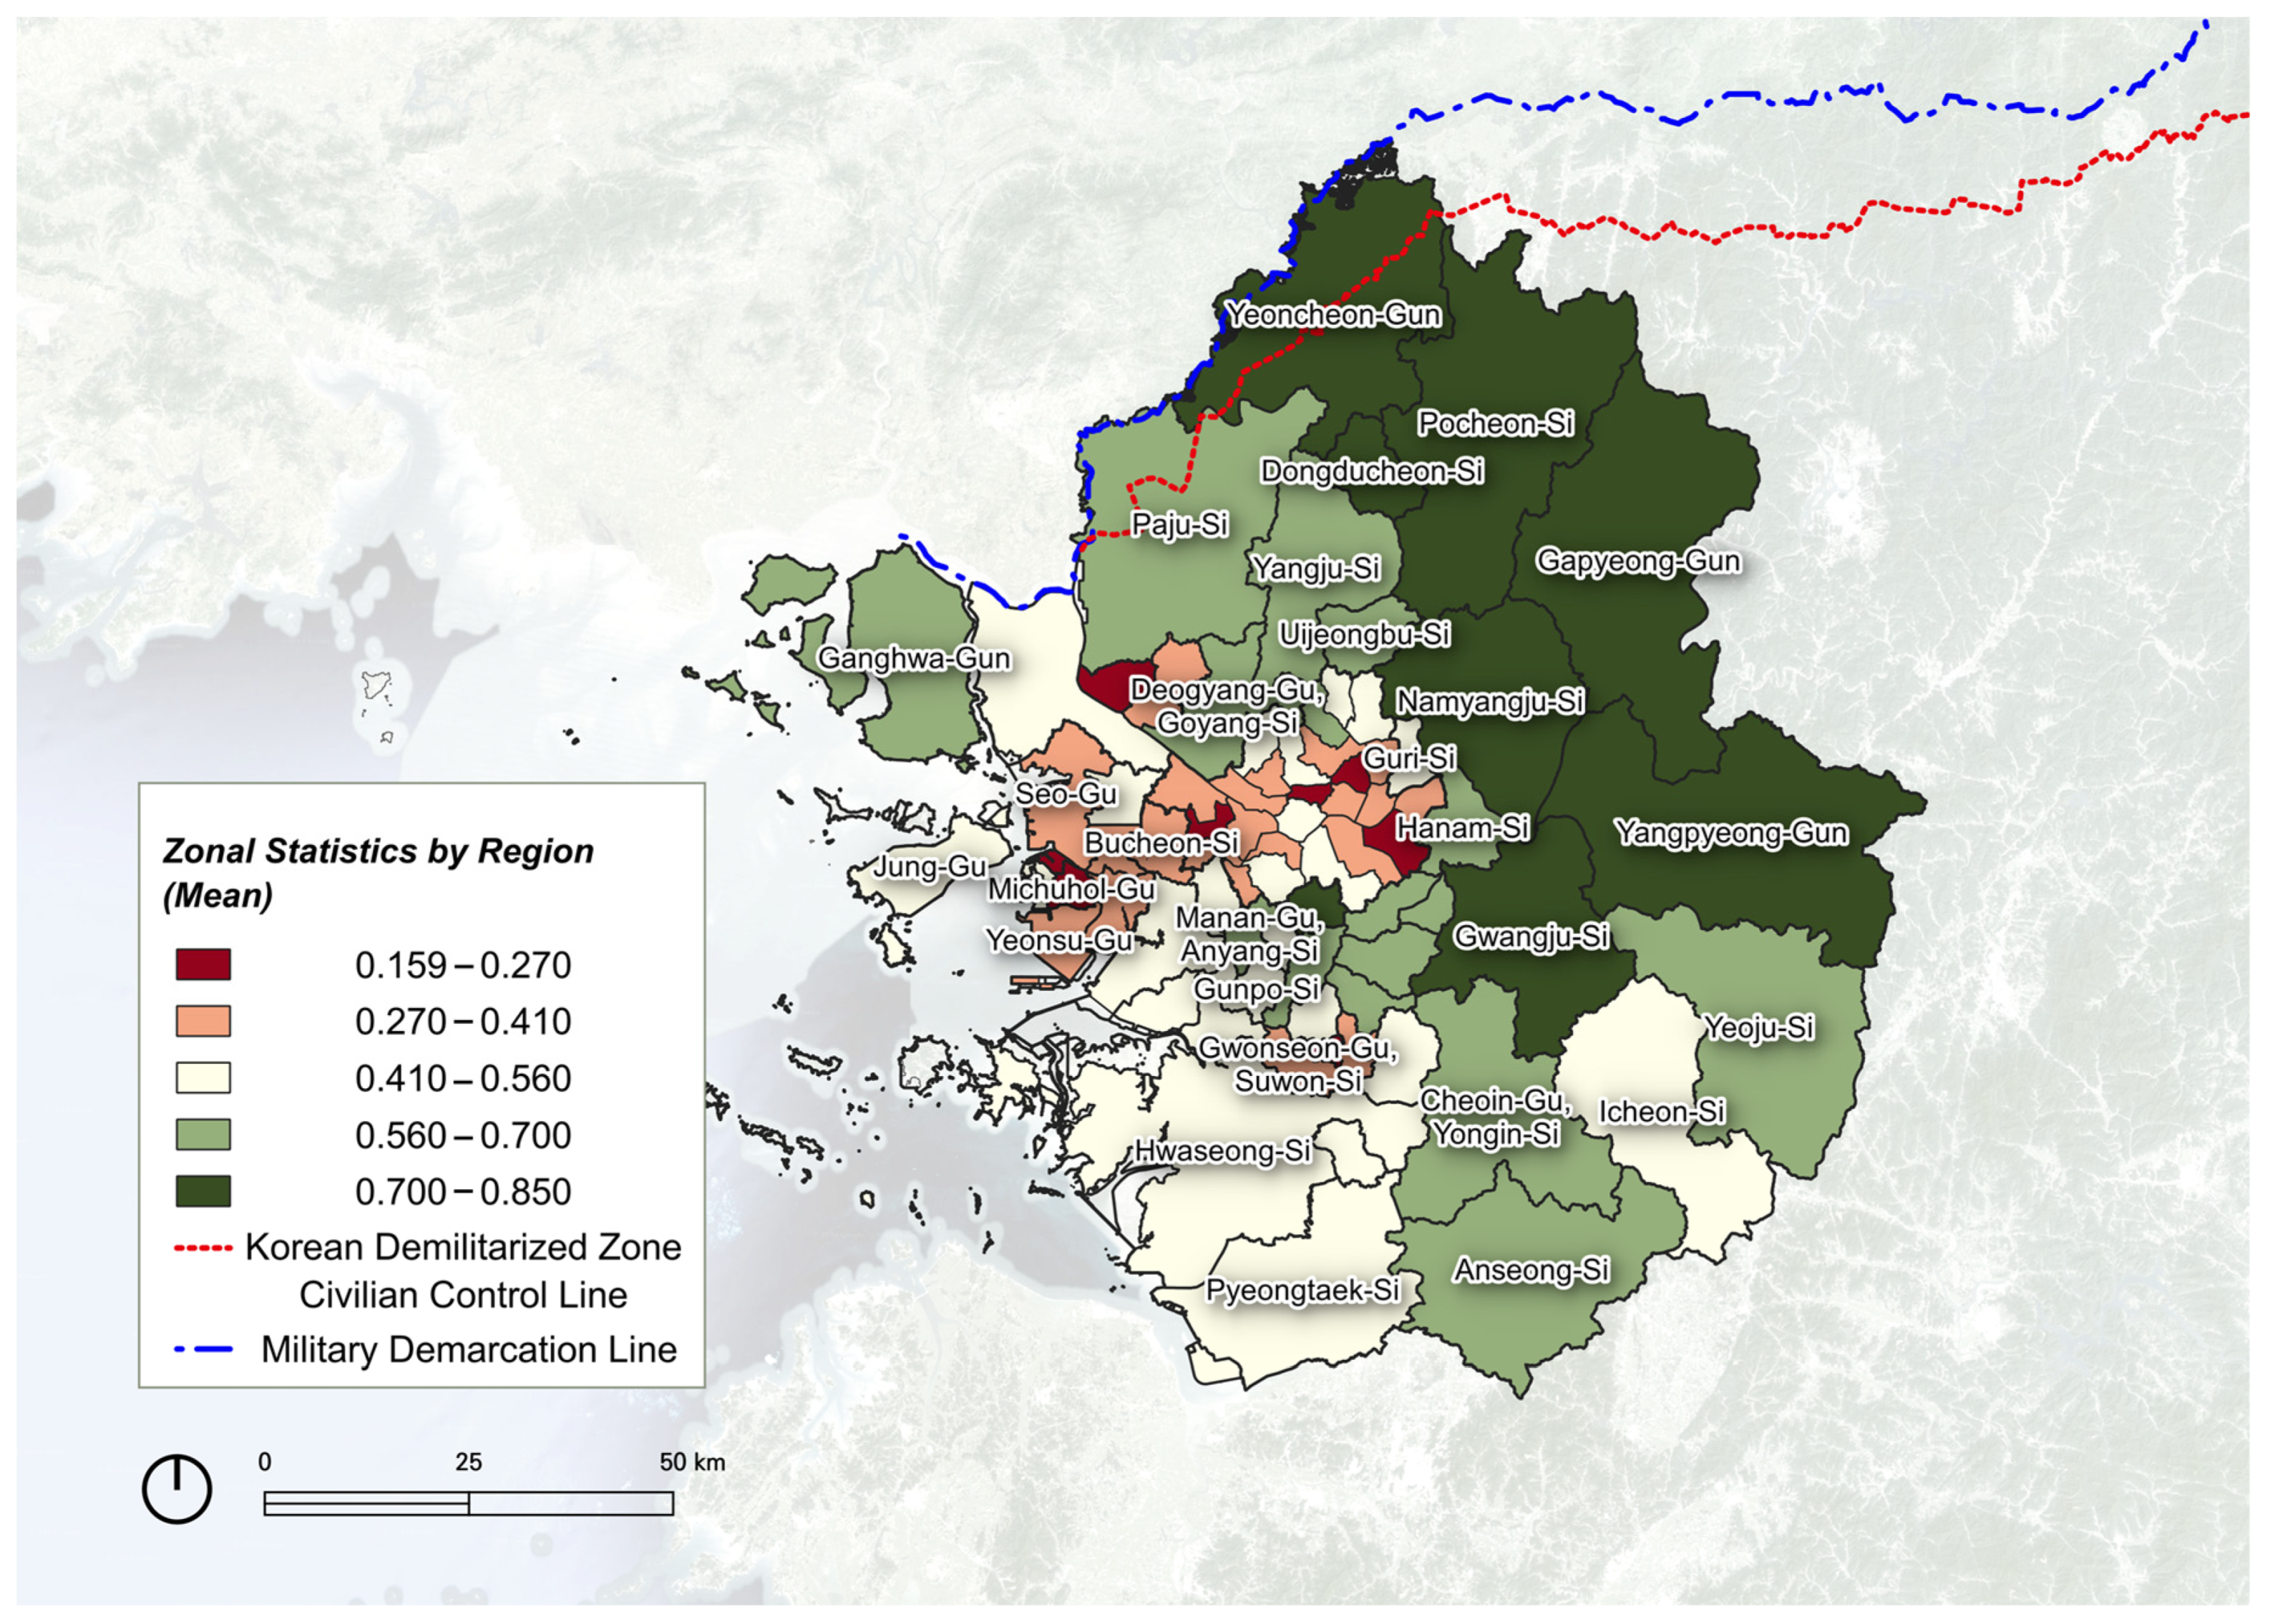
2.1. Study Area
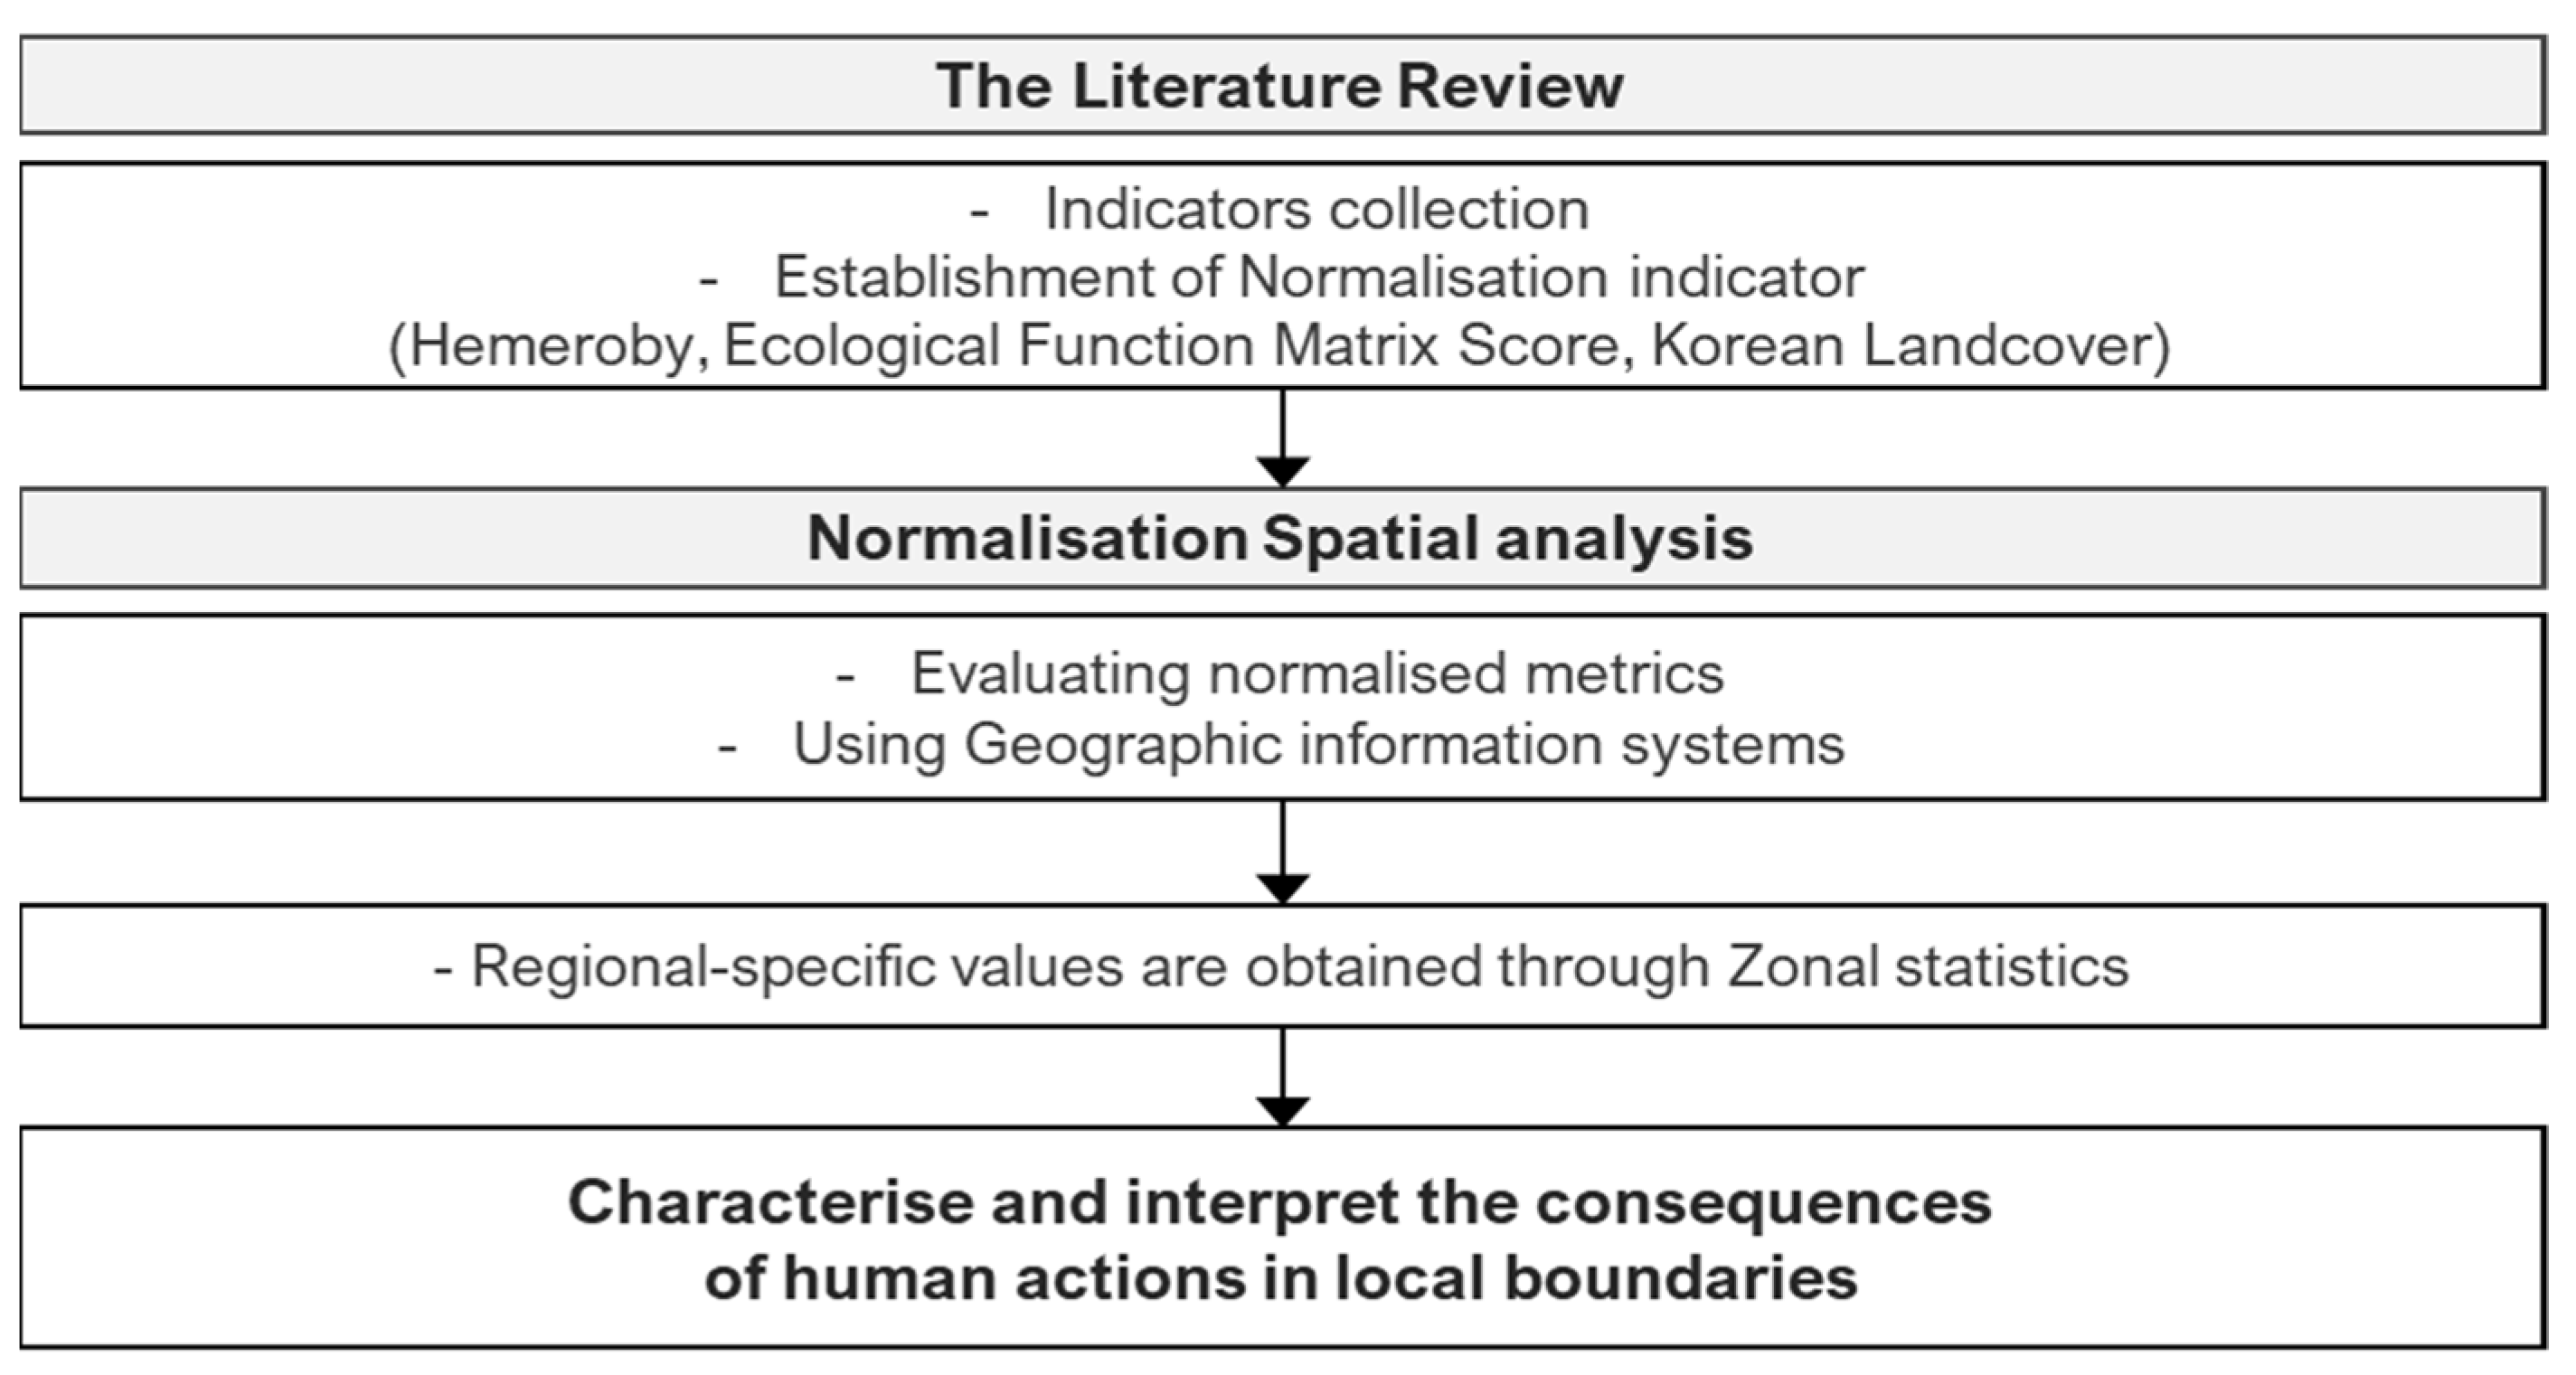
2.2. Method
3. Results
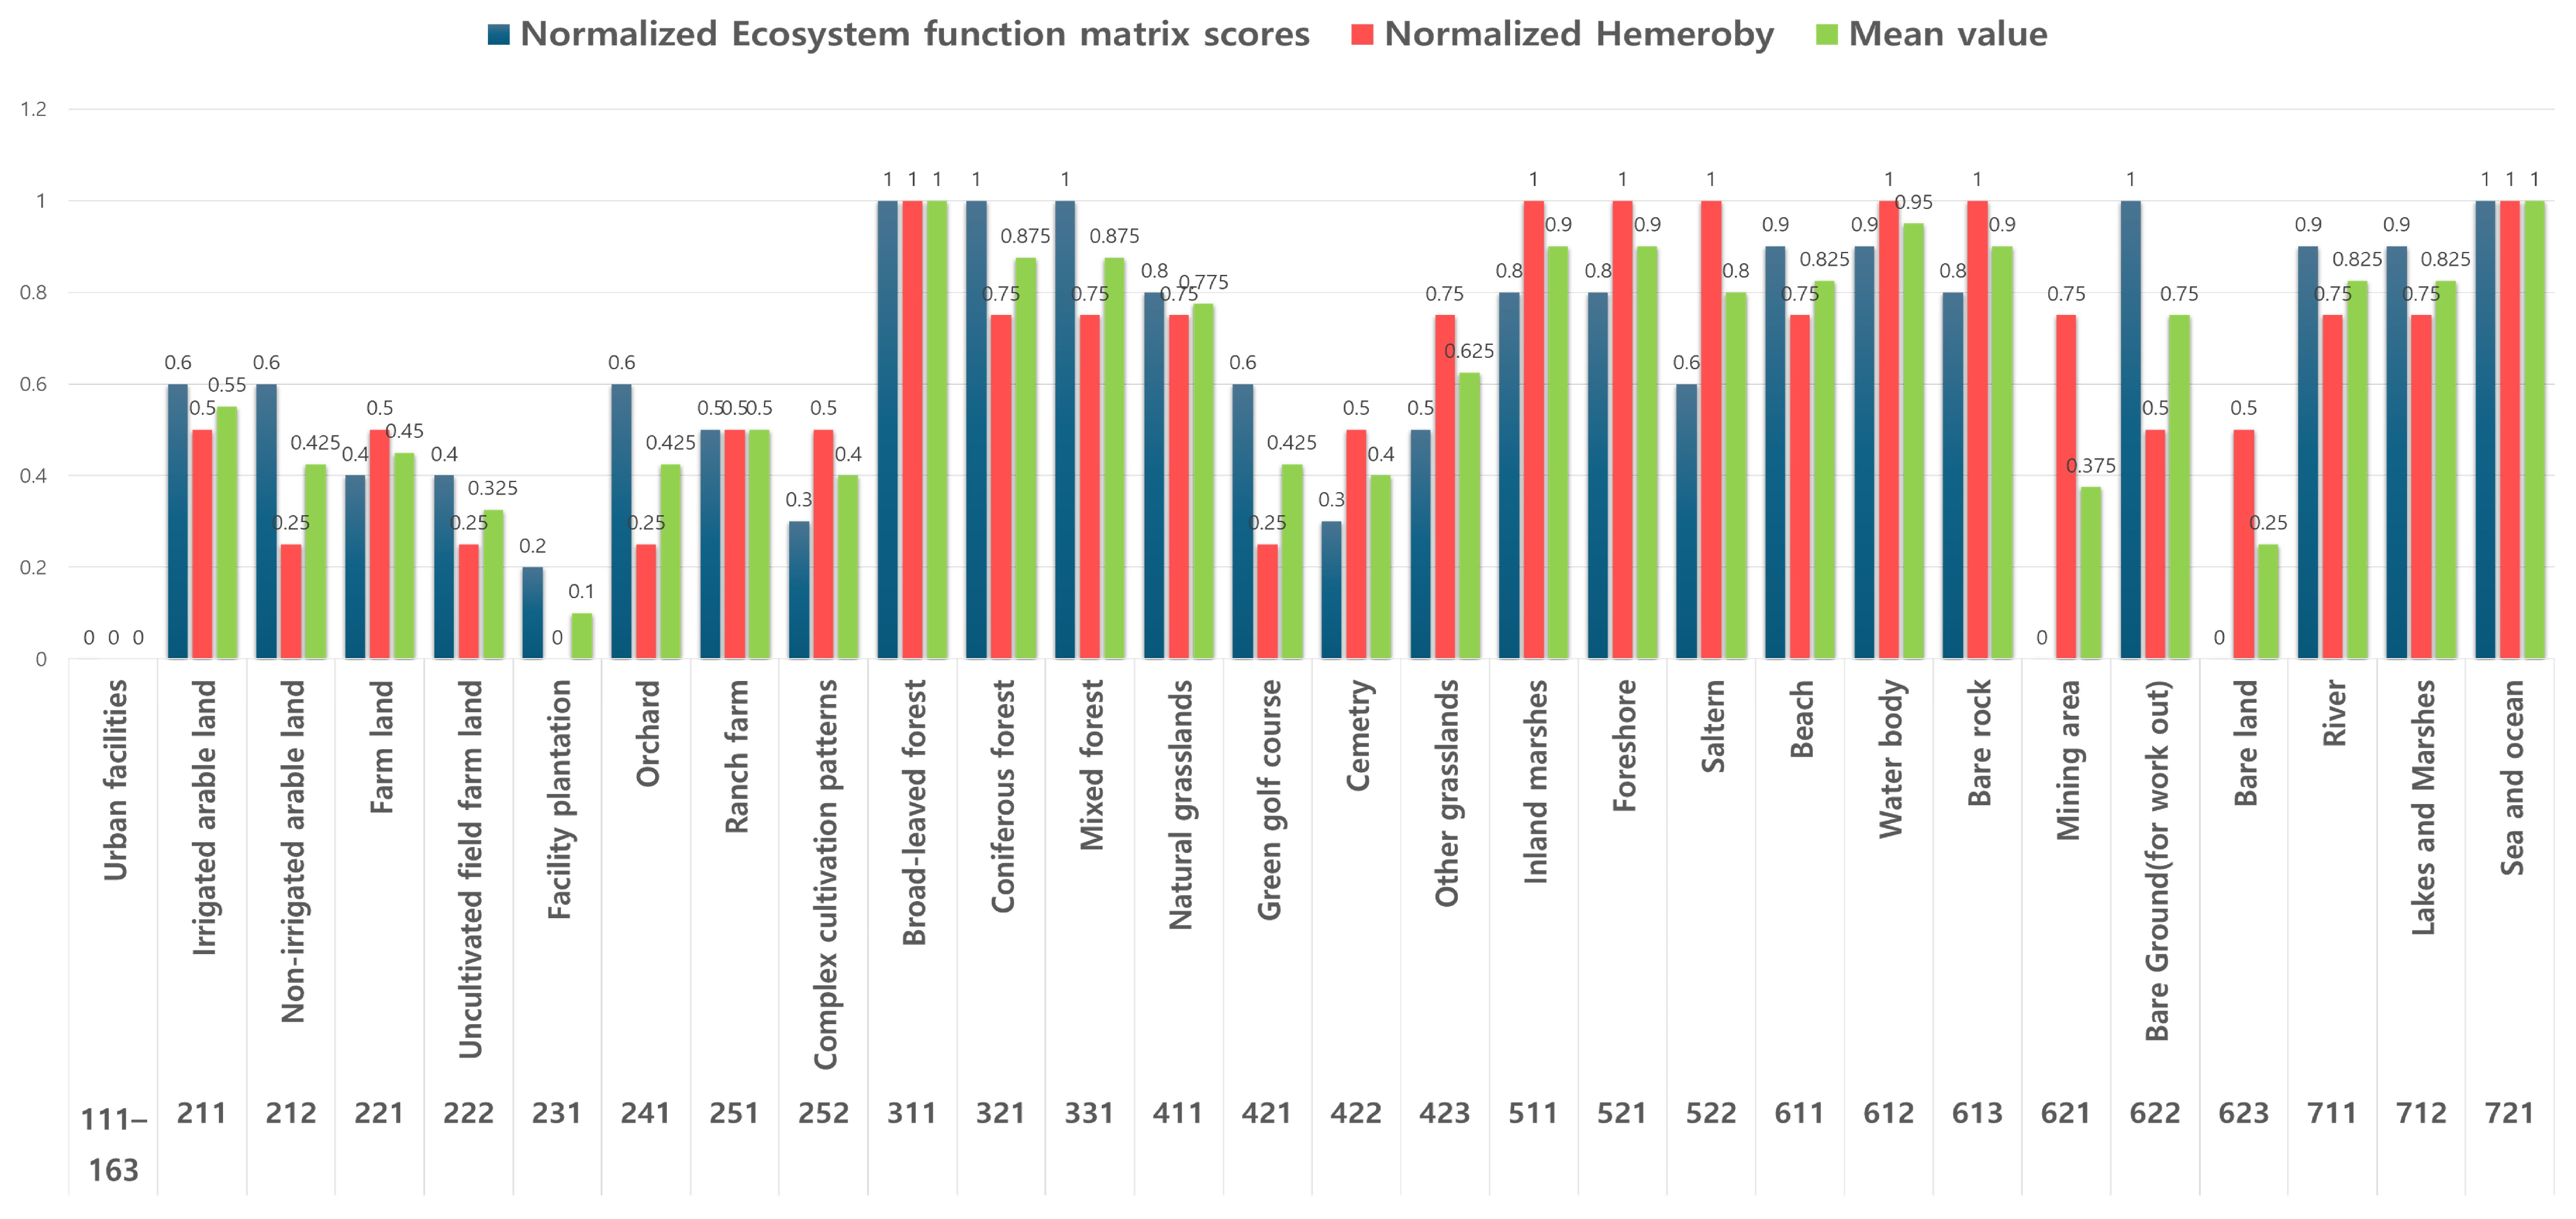
3.1. Integration of the Naturalness Score
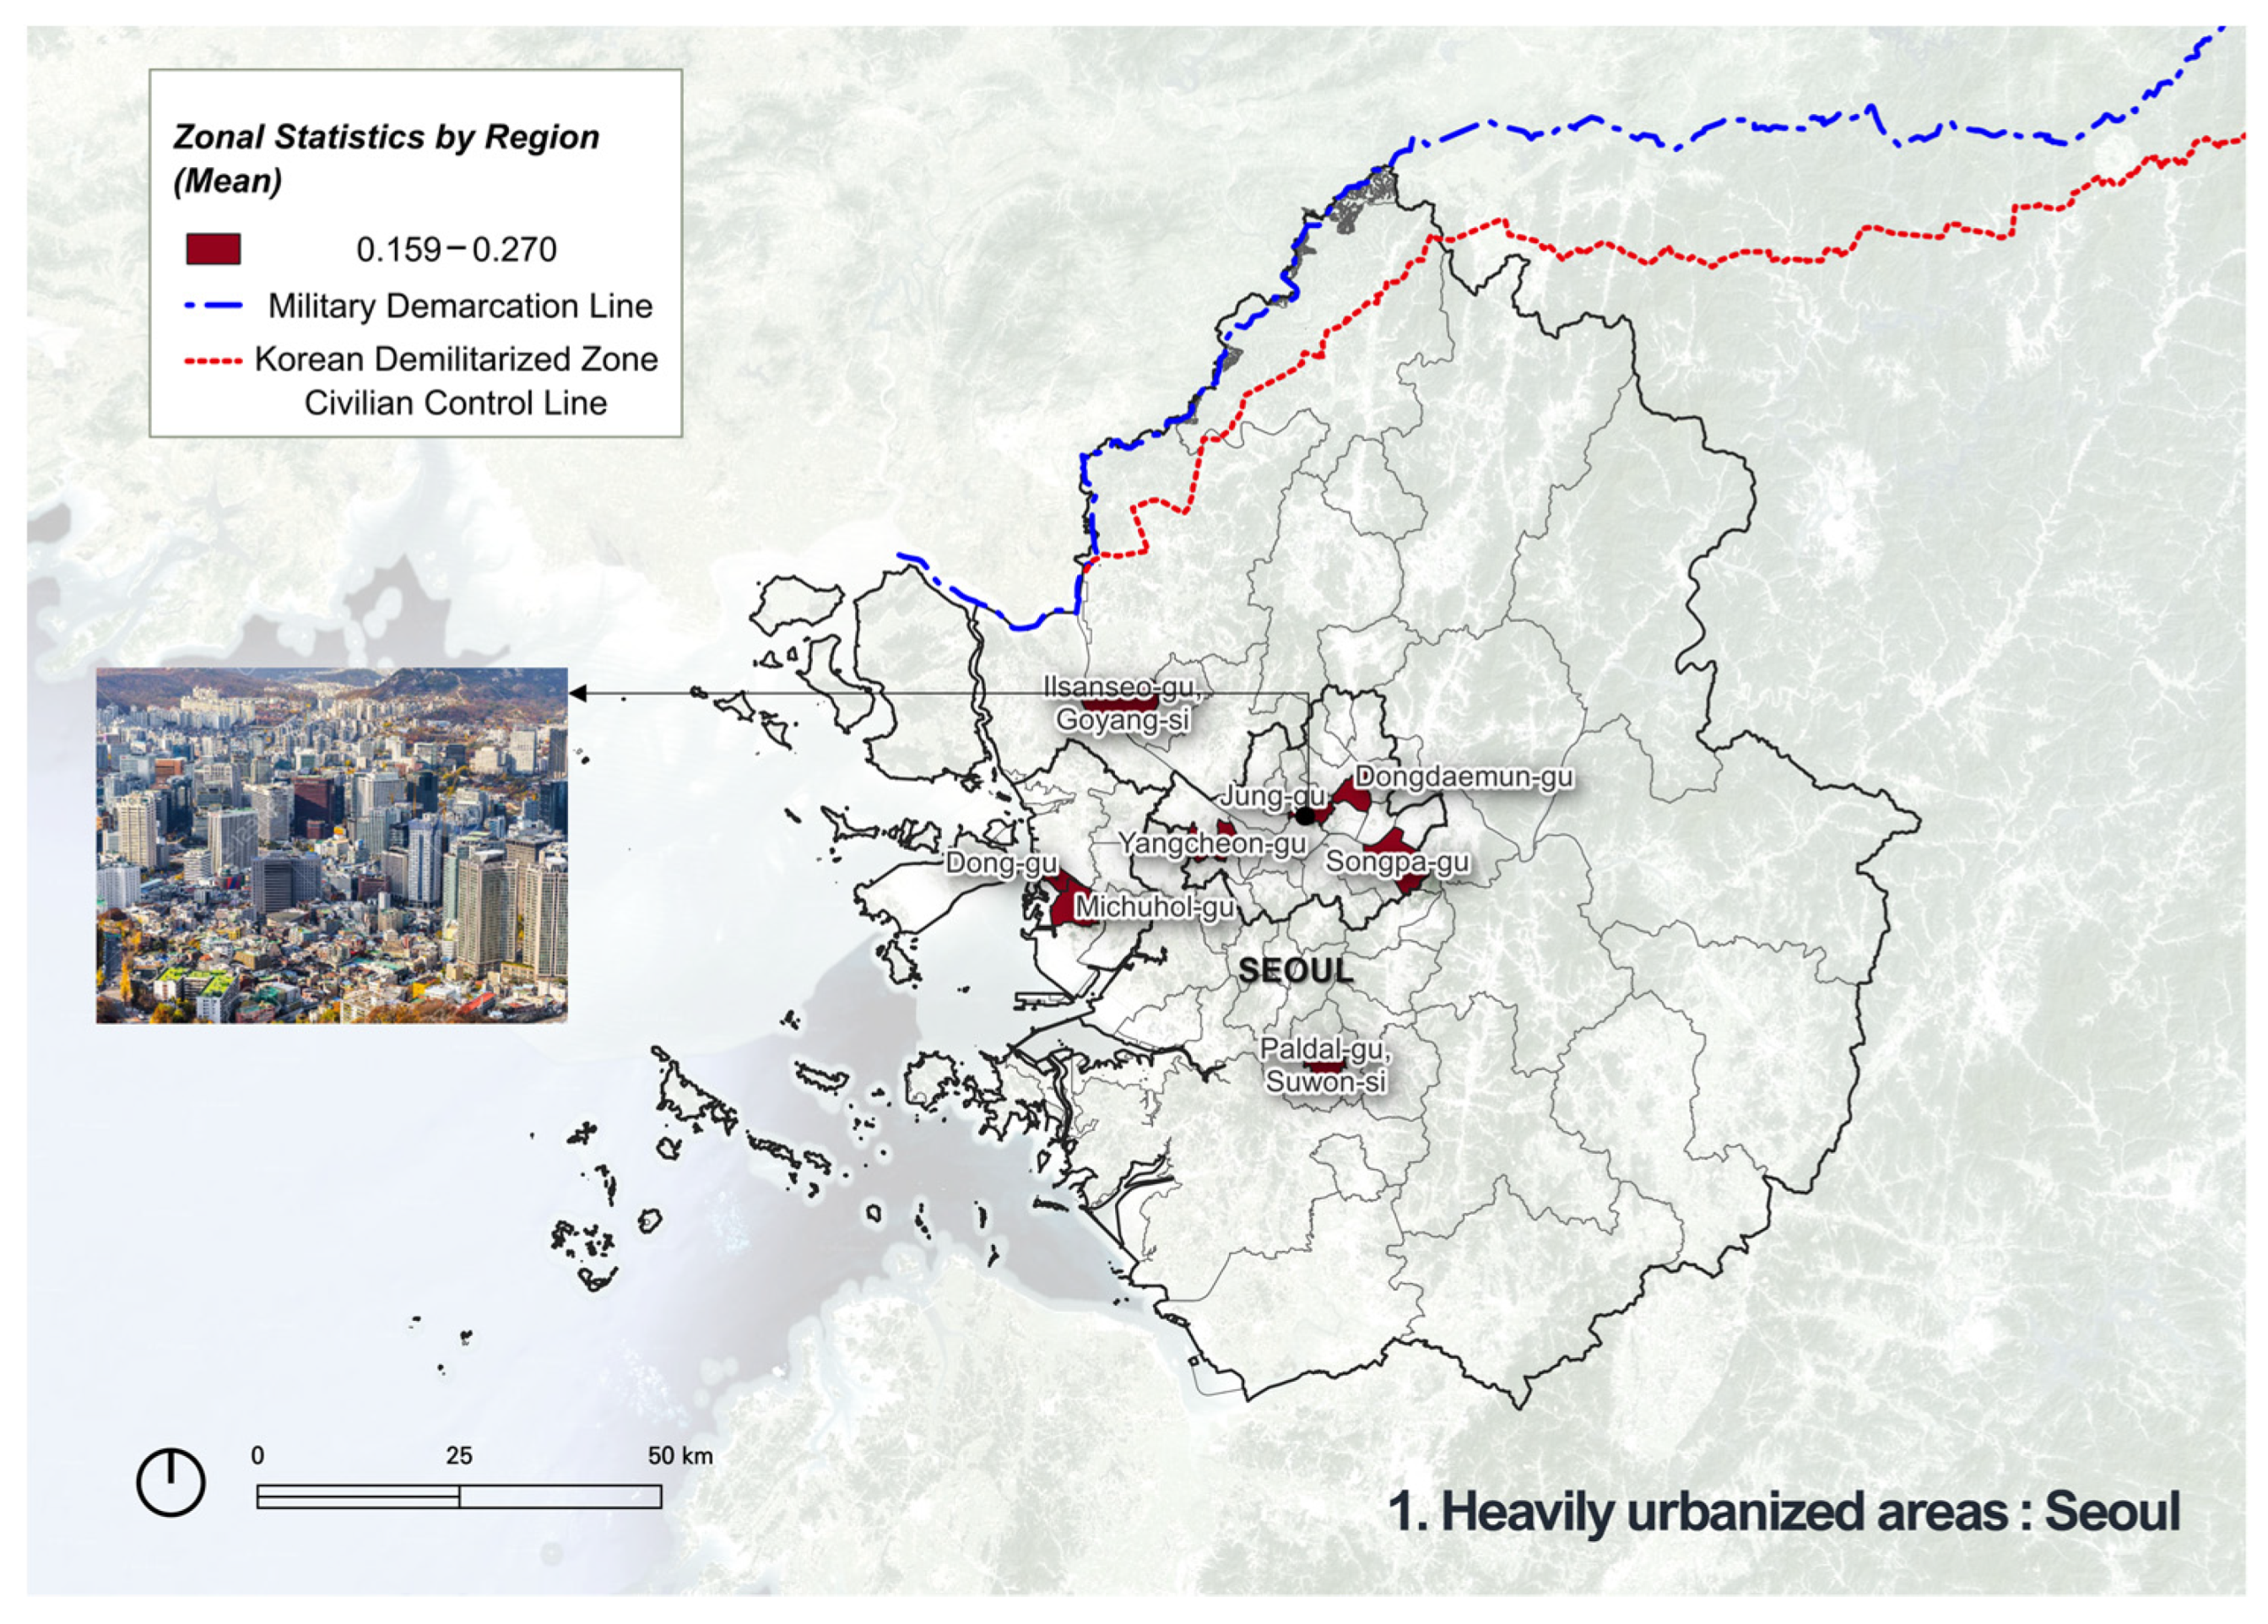
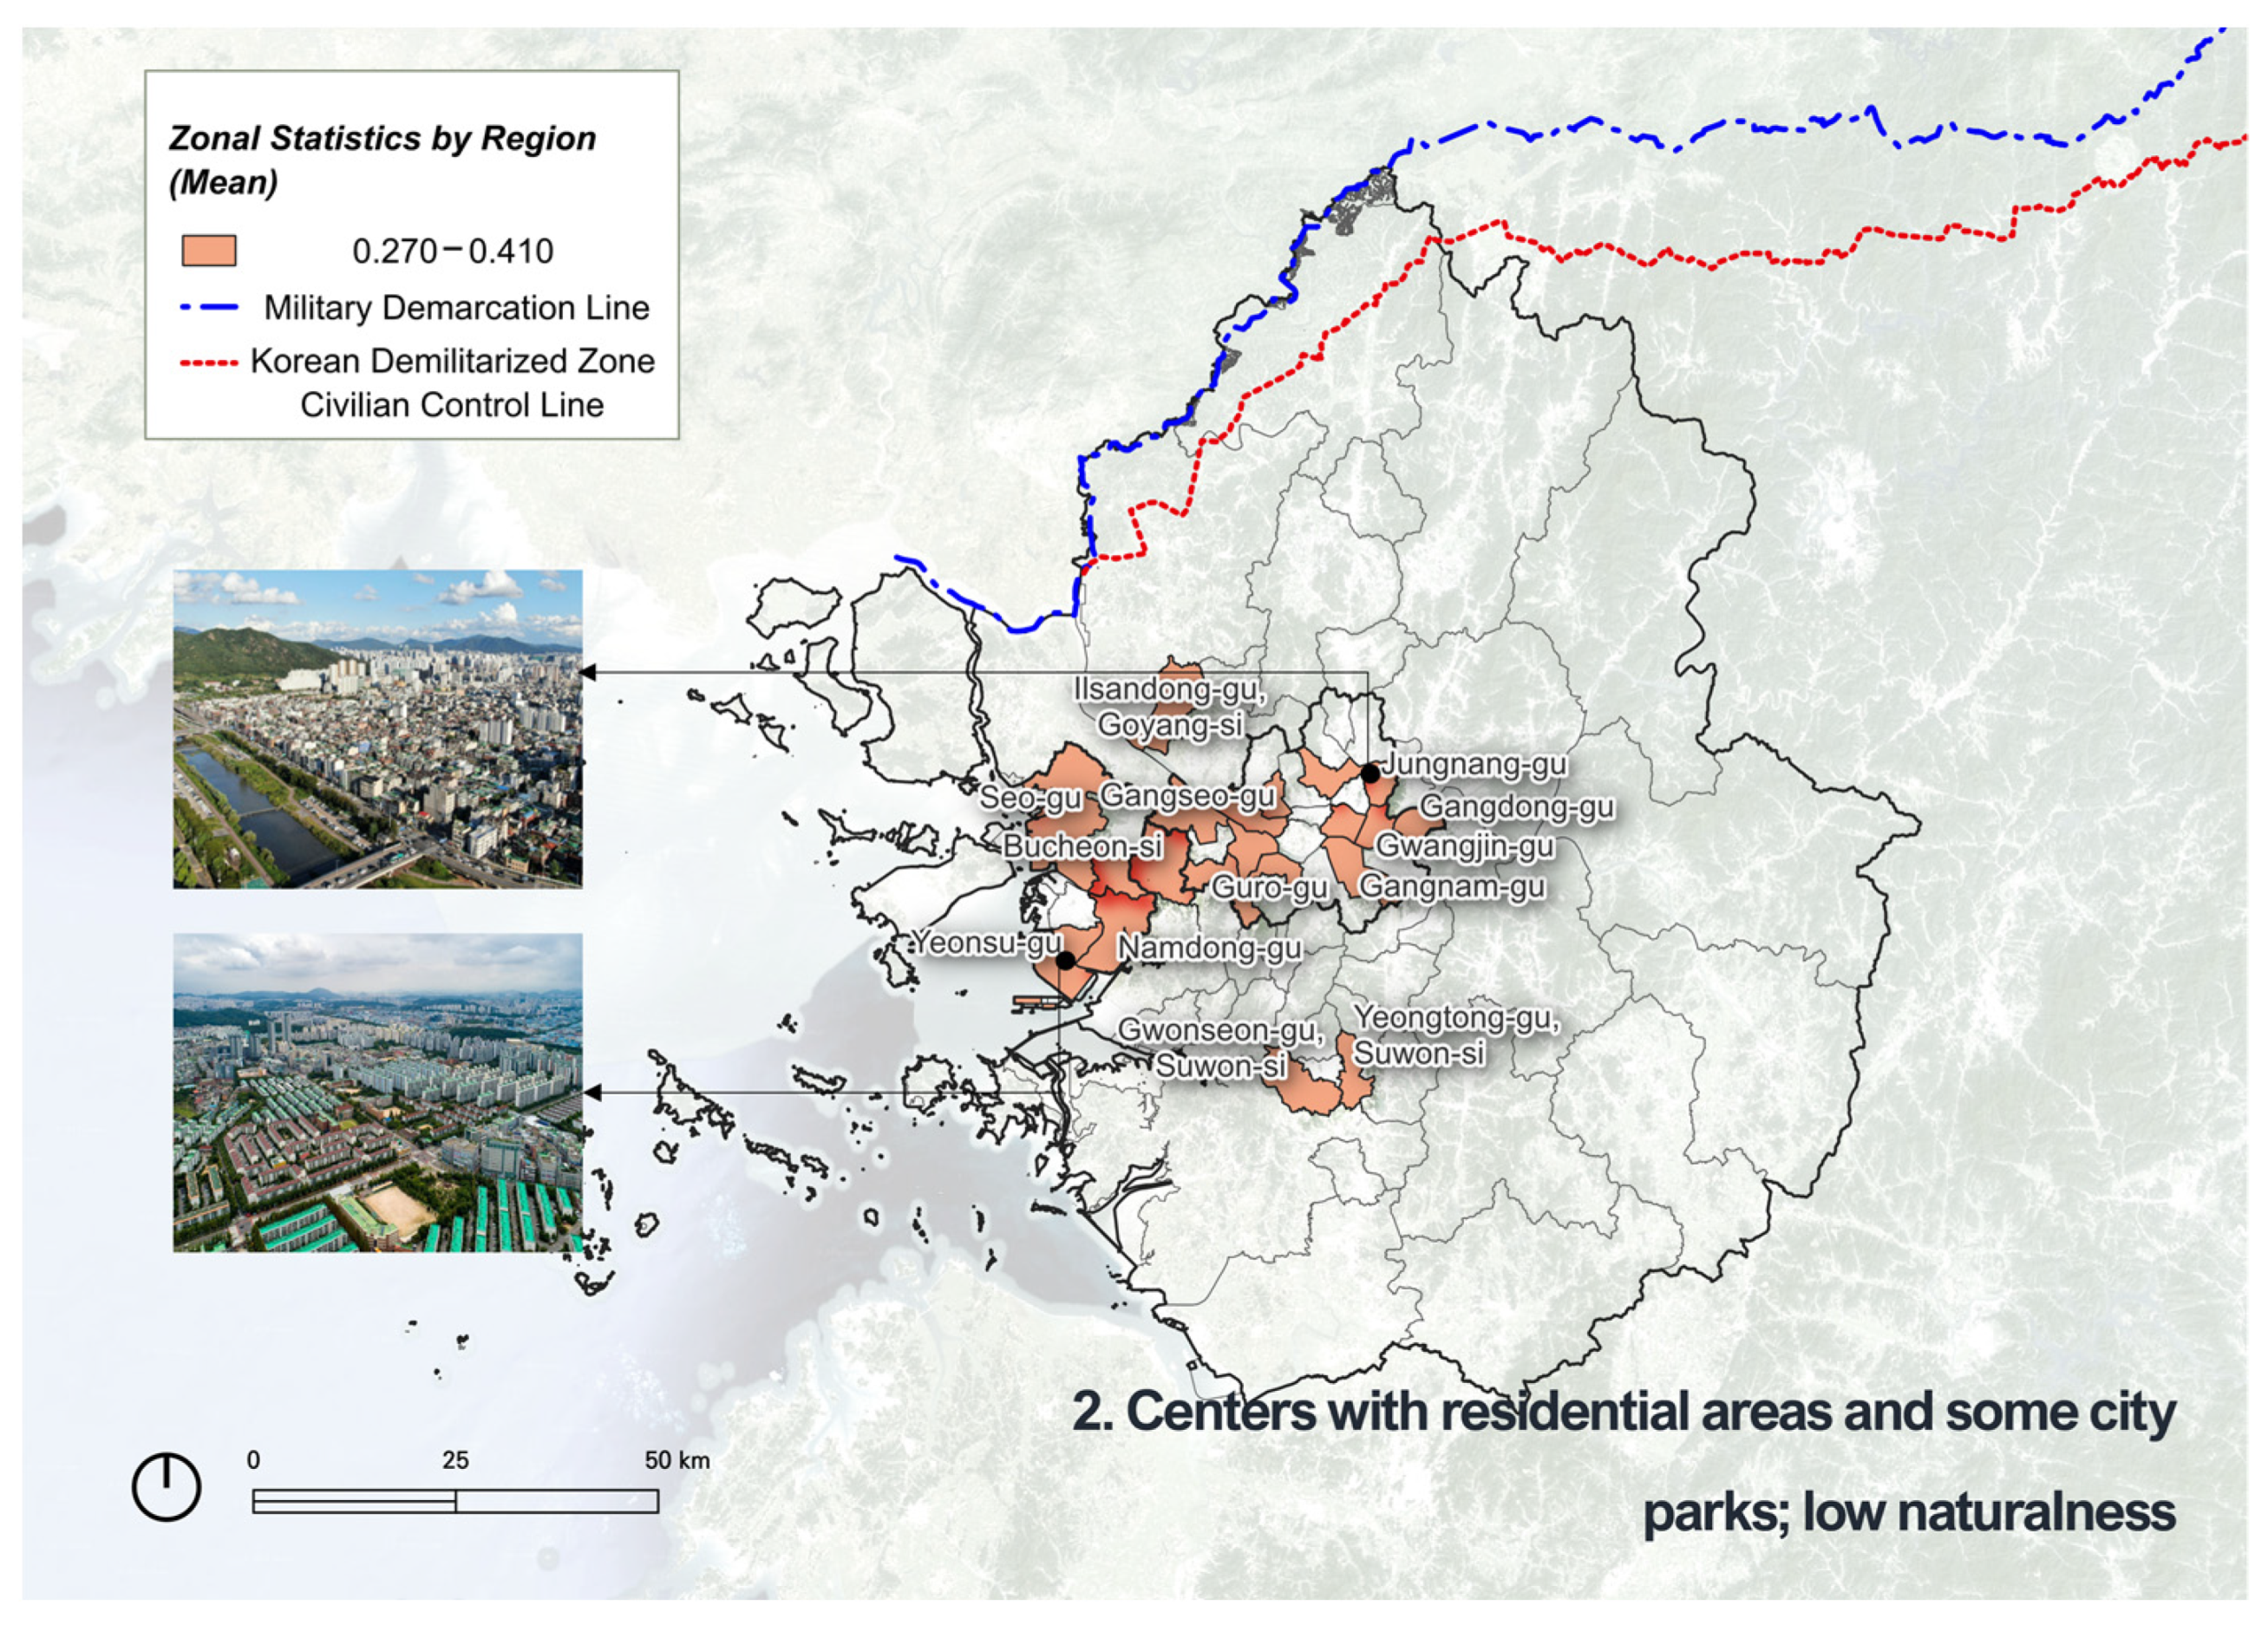
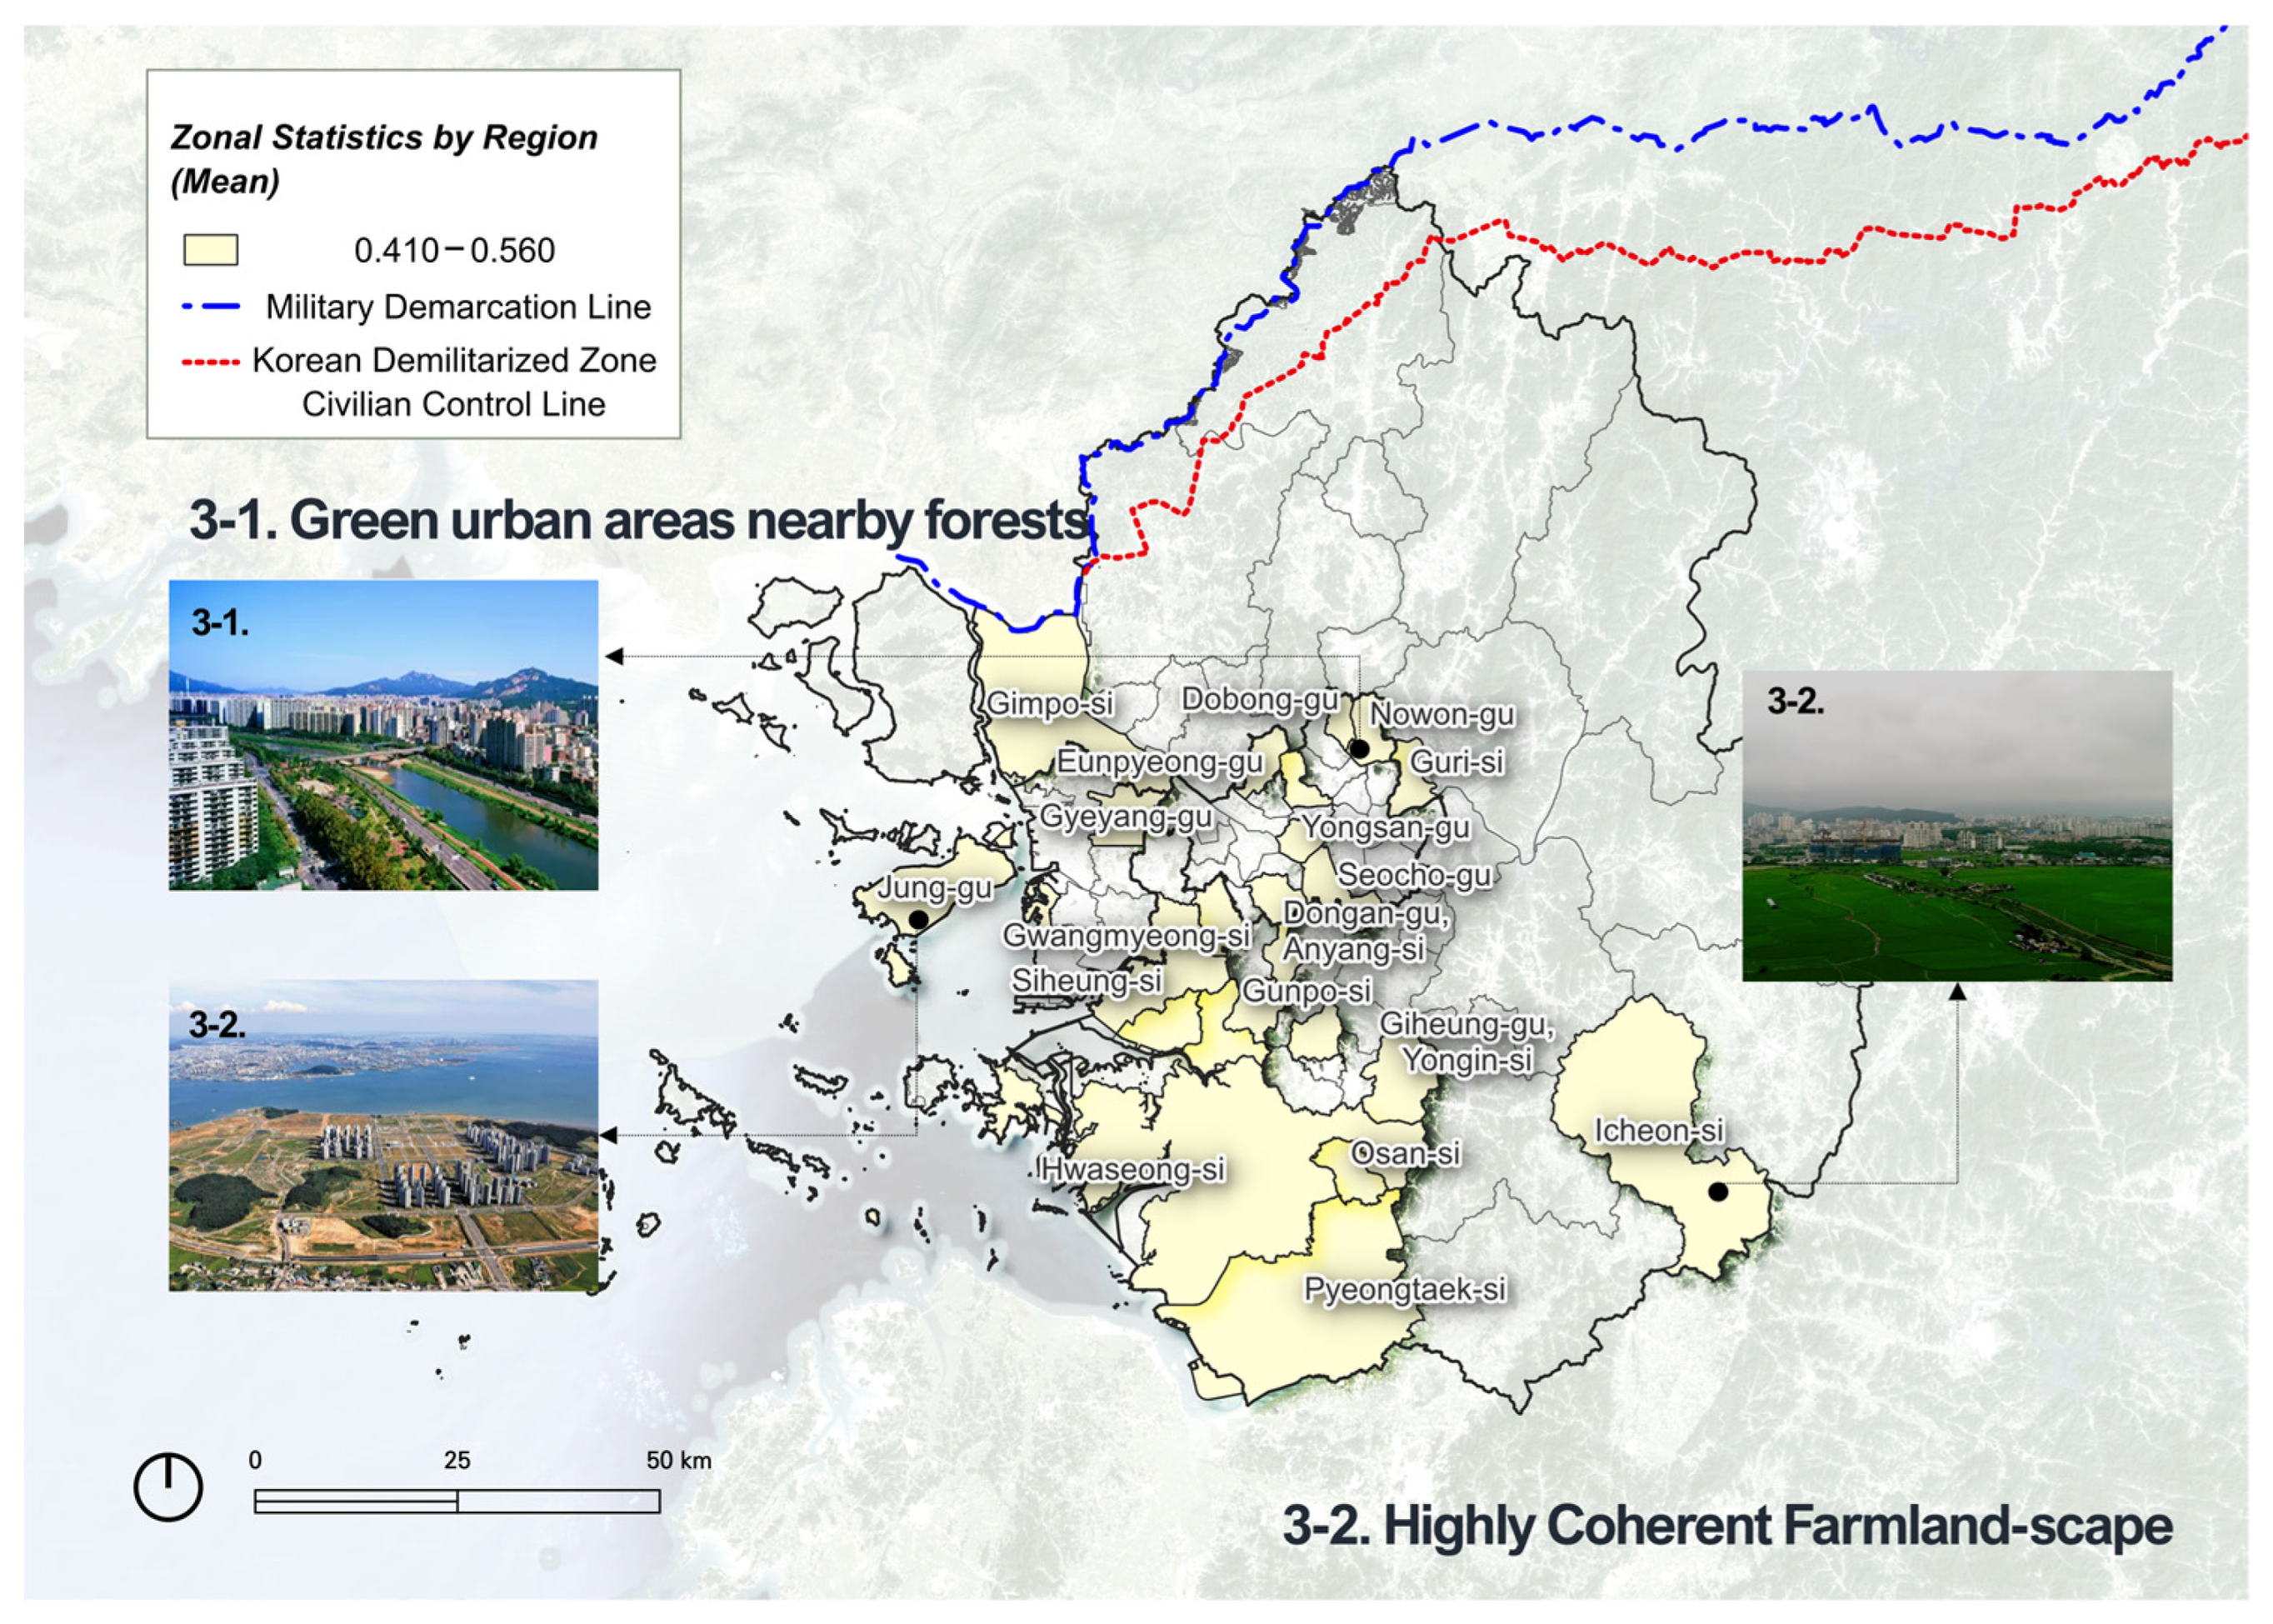
3.2. Landscape Characteristic Difference of Naturalness in the GSA
4. Discussion
5. Conclusions
Author Contributions
Funding
Data Availability Statement
Conflicts of Interest
Appendix A. Mean Value of the Normalised Naturalness Index
| Land Class | Name | Normalised Ecological Function Matrix Scores | Normalised Hemeroby | Average Normalised Value |
| 111 | Housing | 0 | 0 | 0 |
| 112 | Common residence | 0 | 0 | 0 |
| 121 | Industrial facilities | 0 | 0 | 0 |
| 131 | Commercial/Business units | 0 | 0 | 0 |
| 132 | Mixed area | 0.1 | 0 | 0.05 |
| 141 | Culture/sports/recreation facilities | 0 | 0 | 0 |
| 151 | Airport | 0 | 0 | 0 |
| 152 | Port areas | 0 | 0 | 0 |
| 153 | Railroad | 0 | 0 | 0 |
| 154 | Road | 0 | 0 | 0 |
| 155 | Other transportation | 0 | 0 | 0 |
| 161 | Environmental infrastructure | 0 | 0 | 0 |
| 162 | Educational and administrative | 0 | 0 | 0 |
| 163 | Other public facilities | 0 | 0 | 0 |
| 211 | Irrigated arable land | 0.6 | 0.5 | 0.55 |
| 212 | Non-irrigated arable land | 0.6 | 0.25 | 0.425 |
| 221 | Farmland | 0.4 | 0.5 | 0.45 |
| 222 | Uncultivated field farmland | 0.4 | 0.25 | 0.325 |
| 231 | Facility plantation | 0.2 | 0 | 0.1 |
| 241 | Orchard | 0.6 | 0.25 | 0.425 |
| 251 | Ranch farm | 0.5 | 0.5 | 0.5 |
| 252 | Complex cultivation patterns | 0.3 | 0.5 | 0.4 |
| 311 | Broad-leaved forest | 1 | 1 | 1 |
| 321 | Coniferous forest | 1 | 0.75 | 0.875 |
| 331 | Mixed forest | 1 | 0.75 | 0.875 |
| 411 | Natural grasslands | 0.8 | 0.75 | 0.775 |
| 421 | Green golf course | 0.6 | 0.25 | 0.425 |
| 422 | Cemetry | 0.3 | 0.5 | 0.4 |
| 423 | Other grasslands | 0.5 | 0.75 | 0.625 |
| 511 | Inland marshes | 0.8 | 1 | 0.9 |
| 521 | Foreshore | 0.8 | 1 | 0.9 |
| 522 | Saltern | 0.6 | 1 | 0.8 |
| 611 | Beach | 0.9 | 0.75 | 0.825 |
| 612 | Water body | 0.9 | 1 | 0.95 |
| 613 | Bare rock | 0.8 | 1 | 0.9 |
| 621 | Mining area | 0 | 0.75 | 0.375 |
| 622 | Bare Ground (for work out) | 1 | 0.5 | 0.75 |
| 623 | Bare land | 0 | 0.5 | 0.25 |
| 711 | River | 0.9 | 0.75 | 0.825 |
| 712 | Lakes and Marshes | 0.9 | 0.75 | 0.825 |
| 721 | Sea and ocean | 1 | 1 | 1 |
Appendix B. Result of Spatial Statistics Mean, Median Value in the GSA
| Fid | City Name | Administrative | Mean | Median | Stdev | |
| The lowest | 1 | Dongdaemun-gu | Seoul | 0.159 | 0.000 | 0.314 |
| 2 | Michuhol-gu | Incheon | 0.175 | 0.000 | 0.312 | |
| 3 | Paldal-gu, Suwon-si | Gyeonggi Province | 0.180 | 0.000 | 0.313 | |
| 4 | Jung-gu | Seoul | 0.185 | 0.000 | 0.350 | |
| 5 | Yangcheon-gu | Seoul | 0.231 | 0.000 | 0.363 | |
| 6 | Dong-gu | Incheon | 0.249 | 0.000 | 0.369 | |
| 7 | Ilsanseo-gu, Goyang-si | Gyeonggi Province | 0.265 | 0.000 | 0.327 | |
| 8 | Songpa-gu | Seoul | 0.266 | 0.000 | 0.351 | |
| 9 | Seongdong-gu | Seoul | 0.269 | 0.000 | 0.364 | |
| Lower | 10 | Dongjak-gu | Seoul | 0.283 | 0.000 | 0.394 |
| 11 | Geumcheon-gu | Seoul | 0.284 | 0.000 | 0.415 | |
| 12 | Guro-gu | Seoul | 0.285 | 0.000 | 0.398 | |
| 13 | Yeongdeungpo-gu | Seoul | 0.290 | 0.000 | 0.369 | |
| 14 | Bucheon-si | Gyeonggi Province | 0.297 | 0.000 | 0.374 | |
| 15 | Gwangjin-gu | Seoul | 0.300 | 0.000 | 0.398 | |
| 16 | Jungnang-gu | Seoul | 0.306 | 0.000 | 0.399 | |
| 17 | Mapo-gu | Seoul | 0.313 | 0.000 | 0.370 | |
| 18 | Yeonsu-gu | Incheon | 0.321 | 0.250 | 0.327 | |
| 19 | Gangseo-gu | Seoul | 0.322 | 0.000 | 0.364 | |
| 20 | Gangdong-gu | Seoul | 0.330 | 0.100 | 0.383 | |
| 21 | Gangnam-gu | Seoul | 0.333 | 0.000 | 0.406 | |
| 22 | Bupyeong-gu | Incheon | 0.336 | 0.000 | 0.406 | |
| 23 | Namdong-gu | Incheon | 0.349 | 0.250 | 0.394 | |
| 24 | Yeongtong-gu, Suwon-si | Gyeonggi Province | 0.359 | 0.250 | 0.388 | |
| 25 | Seodaemun-gu | Seoul | 0.365 | 0.000 | 0.438 | |
| 26 | Seongbuk-gu | Seoul | 0.388 | 0.000 | 0.436 | |
| 27 | Ilsandong-gu, Goyang-si | Gyeonggi Province | 0.393 | 0.325 | 0.373 | |
| 28 | Seo-gu | Incheon | 0.395 | 0.325 | 0.371 | |
| 29 | Gwonseon-gu, Suwon-si | Gyeonggi Province | 0.397 | 0.325 | 0.371 | |
| 30 | Osan-si | Gyeonggi Province | 0.407 | 0.325 | 0.358 | |
| Moderate | 31 | Yongsan-gu | Seoul | 0.427 | 0.625 | 0.422 |
| 32 | Dongan-gu, Anyang-si | Gyeonggi Province | 0.430 | 0.250 | 0.442 | |
| 33 | Danwon-gu, Ansan-si | Gyeonggi Province | 0.443 | 0.425 | 0.380 | |
| 34 | Siheung-si | Gyeonggi Province | 0.445 | 0.400 | 0.374 | |
| 35 | Gimpo-si | Gyeonggi Province | 0.450 | 0.550 | 0.343 | |
| 36 | Jung-gu | Incheon | 0.456 | 0.625 | 0.364 | |
| 37 | Gyeyang-gu | Incheon | 0.460 | 0.450 | 0.379 | |
| 38 | Gwangmyeong-si | Gyeonggi Province | 0.479 | 0.425 | 0.418 | |
| 39 | Pyeongtaek-si | Gyeonggi Province | 0.485 | 0.550 | 0.304 | |
| 40 | Eunpyeong-gu | Seoul | 0.492 | 0.625 | 0.449 | |
| 41 | Sangnok-gu, Ansan-si | Gyeonggi Province | 0.501 | 0.550 | 0.398 | |
| 42 | Hwaseong-si | Gyeonggi Province | 0.501 | 0.500 | 0.330 | |
| 43 | Dobong-gu | Seoul | 0.508 | 0.625 | 0.460 | |
| 44 | Guri-si | Gyeonggi Province | 0.514 | 0.625 | 0.401 | |
| 45 | Seocho-gu | Seoul | 0.518 | 0.625 | 0.445 | |
| 46 | Jongno-gu | Seoul | 0.518 | 0.750 | 0.444 | |
| 47 | Gwanak-gu | Seoul | 0.520 | 0.875 | 0.456 | |
| 48 | Giheung-gu, Yongin-si | Gyeonggi Province | 0.526 | 0.625 | 0.400 | |
| 49 | Nowon-gu | Seoul | 0.526 | 0.625 | 0.441 | |
| 50 | Gunpo-si | Gyeonggi Province | 0.532 | 0.625 | 0.421 | |
| 51 | Jangan-gu | Gyeonggi Province | 0.549 | 0.625 | 0.424 | |
| 52 | Icheon-si | Gyeonggi Province | 0.556 | 0.550 | 0.321 | |
| high | 53 | Gangbuk-gu | Seoul | 0.573 | 0.875 | 0.455 |
| 54 | Jungwon-gu, Seongnam-si | Gyeonggi Province | 0.576 | 0.875 | 0.444 | |
| 55 | Bundang-gu, Seongnam-si | Gyeonggi Province | 0.591 | 0.775 | 0.422 | |
| 56 | Deogyang-gu, Goyang-si | Gyeonggi Province | 0.608 | 0.775 | 0.382 | |
| 57 | Suji-gu, Yongin-si | Gyeonggi Province | 0.612 | 0.825 | 0.413 | |
| 58 | Anseong-si | Gyeonggi Province | 0.622 | 0.625 | 0.321 | |
| 59 | Uijeongbu-si | Gyeonggi Province | 0.638 | 0.875 | 0.404 | |
| 60 | Sujeong-gu, Seongnam-si | Gyeonggi Province | 0.644 | 0.875 | 0.417 | |
| 61 | Yeoju-si | Gyeonggi Province | 0.644 | 0.625 | 0.313 | |
| 62 | Ganghwa-gun | Incheon | 0.645 | 0.625 | 0.312 | |
| 63 | Uiwang-si | Gyeonggi Province | 0.646 | 0.875 | 0.398 | |
| 64 | Hanam-si | Gyeonggi Province | 0.648 | 0.825 | 0.387 | |
| 65 | Manan-gu, Anyang-si | Gyeonggi Province | 0.662 | 0.875 | 0.417 | |
| 66 | Paju-si | Gyeonggi Province | 0.666 | 0.875 | 0.346 | |
| 67 | Yangju-si | Gyeonggi Province | 0.669 | 0.875 | 0.355 | |
| 68 | Cheoin-gu, Yongin-si | Gyeonggi Province | 0.671 | 0.875 | 0.334 | |
| 69 | Gwacheon-si | Gyeonggi Province | 0.699 | 0.875 | 0.378 | |
| The highest | 70 | Namyangju-si | Gyeonggi Province | 0.725 | 0.875 | 0.351 |
| 71 | Gwangju-si | Gyeonggi Province | 0.737 | 0.875 | 0.346 | |
| 72 | Pocheon-si | Gyeonggi Province | 0.747 | 0.875 | 0.311 | |
| 73 | Dongducheon-si | Gyeonggi Province | 0.770 | 0.875 | 0.330 | |
| 74 | Yangpyeong-gun | Gyeonggi Province | 0.793 | 0.875 | 0.272 | |
| 75 | Yeoncheon-gun | Gyeonggi Province | 0.833 | 1.000 | 0.269 | |
| 76 | Gapyeong-gun | Gyeonggi Province | 0.852 | 1.000 | 0.240 |
References
- Lu, Y.; Nakicenovic, N.; Visbeck, M.; Stevance, A.-S. Policy: Five priorities for the UN sustainable development goals. Nature 2015, 520, 432–433. [Google Scholar] [CrossRef] [PubMed]
- Council of Europe Landscape Convention 1 as Amended by the 2016 Protocol. Available online: https://rm.coe.int/16807b6bc7 (accessed on 18 May 2024).
- Council of Europe (CoE). European Landscape Convention. CETS No. 176; Council of Europe: Florence, Italy; Strasbourg, France, 2000. [Google Scholar]
- Butler, A.; Berglund, U. Landscape character assessment as an approach to understanding public interests within the European landscape convention. Landsc. Res. 2012, 39, 219–236. [Google Scholar] [CrossRef]
- Jun, B.; Kim, I.; Shin, J.; Kwon, H. Development of landscape conservation value map of Jeju island, Korea for integrative landscape management and planning using conservation value of landscape typology. PeerJ 2021, 9, e11449. [Google Scholar] [CrossRef] [PubMed]
- Kim, D.; Son, Y. Differences in perceptions of naturalness among urban park user groups in seoul. Int. Rev. Spat. Plan. Sustain. Dev. 2022, 10, 112–129. [Google Scholar] [CrossRef] [PubMed]
- Scott, A. Assessing public perception of landscape: The LANDMAP experience. Landsc. Res. 2002, 27, 271–295. [Google Scholar] [CrossRef]
- Groening, G. The ‘Landscape must become the law’ or should it? Landsc. Res. 2007, 32, 595–612. [Google Scholar] [CrossRef]
- Jones, M. The European Landscape Convention and the question of public participation. In Justice, Power and the Political Landscape; Routledge: London, UK, 2019; pp. 231–251. [Google Scholar]
- Tudor, C. An approach to landscape character assessment. Nat. Engl. 2014, 65, 101716. [Google Scholar]
- James, P.; Gittins, J.W. Local landscape character assessment: An evaluation of community-led schemes in cheshire. Landsc. Res. 2007, 32, 423–442. [Google Scholar] [CrossRef]
- Rogge, D.; Rivard, B.; Zhang, J.; Sanchez, A.; Harris, J.; Feng, J. Integration of spatial–spectral information for the improved extraction of endmembers. Remote Sens. Environ. 2007, 110, 287–303. [Google Scholar] [CrossRef]
- Vizzari, M. Spatial modelling of potential landscape quality. Appl. Geogr. 2011, 31, 108–118. [Google Scholar] [CrossRef]
- Martin, E.A.; Dainese, M.; Clough, Y.; Báldi, A.; Bommarco, R.; Gagic, V.; Garratt, M.P.; Holzschuh, A.; Kleijn, D.; Kovács-Hostyánszki, A.; et al. The interplay of landscape composition and configuration: New pathways to manage functional biodiversity and agroecosystem services across Europe. Ecol. Lett. 2019, 22, 1083–1094. [Google Scholar] [CrossRef] [PubMed]
- Gobster, P.H.; Nassauer, J.I.; Daniel, T.C.; Fry, G. The shared landscape: What does aesthetics have to do with ecology? Landsc. Ecol. 2007, 22, 959–972. [Google Scholar] [CrossRef]
- Kim, K.-H.; Pauleit, S. Landscape character, biodiversity and land use planning: The case of Kwangju City Region, South Korea. Land Use Policy 2007, 24, 264–274. [Google Scholar] [CrossRef]
- Fry, G.; Tveit, M.S.; Ode, A.; Velarde, M.D. The ecology of visual landscapes: Exploring the conceptual common ground of visual and ecological landscape indicators. Ecol. Indic. 2009, 9, 933–947. [Google Scholar] [CrossRef]
- Martín, B.; Ortega, E.; Otero, I.; Arce, R.M. Landscape character assessment with GIS using map-based indicators and photographs in the relationship between landscape and roads. J. Environ. Manag. 2016, 180, 324–334. [Google Scholar] [CrossRef] [PubMed]
- Ministry of Environment’s Landcover Classification Data. 2021. Available online: https://egis.me.go.kr/map/map.do (accessed on 24 May 2024).
- Song, W.; Kim, E.; Jeon, S.W.; Park, S.; Lee, J. Improvement of the Criteria on Naturalness of the Environmental Conservation Value Assessment Map (ECVAM). J. Korea Soc. Environ. Restor. Technol. 2012, 15, 31–40. [Google Scholar] [CrossRef]
- The Environmental Conservation Value Assessment Map. Available online: https://mwebgis.neins.go.kr/mobile.do (accessed on 24 May 2024).
- Cho, J.; Lee, Y.-W.; Han, K.-S. The effect of fractional vegetation cover on the relationship between EVI and soil moisture in non-forest regions. Remote. Sens. Lett. 2014, 5, 37–45. [Google Scholar] [CrossRef]
- Kang, D.; Kim, D.-E.; Son, Y.-H. Extraction of Naturalness Evergreen Landscape Index(NELI) based on Time Series Harmonization Model-Using The 5 Years MODIS Satellite EVI Image. J. Korea Landsc. Counc. 2023, 15, 153–164. [Google Scholar] [CrossRef]
- Tveit, M.; Ode, Å.; Fry, G. Key concepts in a framework for analysing visual landscape character. Landsc. Res. 2006, 31, 229–255. [Google Scholar] [CrossRef]
- Purcell, A.; Lamb, R.J. Preference and naturalness: An ecological approach. Landsc. Urban Plan. 1998, 42, 57–66. [Google Scholar] [CrossRef]
- von Oheimb, G.; Westphal, C.; Tempel, H.; Härdtle, W. Structural pattern of a near-natural beech forest (Fagus sylvatica) (Serrahn, North-east Germany). For. Ecol. Manag. 2005, 212, 253–263. [Google Scholar] [CrossRef]
- Hur, M.; Nasar, J.L.; Chun, B. Neighborhood satisfaction, physical and perceived naturalness and openness. J. Environ. Psychol. 2010, 30, 52–59. [Google Scholar] [CrossRef]
- Ode, Å.; Tveit, M.S.; Fry, G. Capturing landscape visual character using indicators: Touching base with landscape aesthetic theory. Landsc. Res. 2008, 33, 89–117. [Google Scholar] [CrossRef]
- Hermes, J.; Albert, C.; von Haaren, C. Assessing the aesthetic quality of landscapes in Germany. Ecosyst. Serv. 2018, 31, 296–307. [Google Scholar] [CrossRef]
- Kerebel, A.; Gélinas, N.; Déry, S.; Voigt, B.; Munson, A. Landscape aesthetic modelling using Bayesian networks: Conceptual framework and participatory indicator weighting. Landsc. Urban Plan. 2019, 185, 258–271. [Google Scholar] [CrossRef]
- European Environment Agency(eea). Collections/CORINE Land Cover/CORINE Land Cover. Sentinel Hub Collections. 1994. Available online: https://collections.sentinel-hub.com/corine-land-cover/readme.html (accessed on 18 May 2024).
- Landres, P.B.; Brunson, M.W.; Merigliano, L.; Sydoriak, C.; Morton, S. Naturalness and wildness: The dilemma and irony of managing wilderness. In Proceedings of the Wilderness Science in a Time of Change Conference-Volume 5: Wilderness Ecosystems, Threats, and Management, Missoula, MT, USA, 23–27 May 1999; Proceedings RMRS-P-15-VOL-5. U.S. Department of Agriculture, Forest Service, Rocky Mountain Research Station: Ogden, UT, USA, 2000; pp. 377–381. [Google Scholar]
- Ode, Å.; Fry, G.; Tveit, M.S.; Messager, P.; Miller, D. Indicators of perceived naturalness as drivers of landscape preference. J. Environ. Manag. 2009, 90, 375–383. [Google Scholar] [CrossRef] [PubMed]
- Hagerhall, C.M.; Purcell, T.; Taylor, R. Fractal dimension of landscape silhouette outlines as a predictor of landscape preference. J. Environ. Psychol. 2004, 24, 247–255. [Google Scholar] [CrossRef]
- Wrbka, T.; Erb, K.-H.; Schulz, N.B.; Peterseil, J.; Hahn, C.; Haberl, H. Linking pattern and process in cultural landscapes. An empirical study based on spatially explicit indicators. Land Use Policy 2004, 21, 289–306. [Google Scholar] [CrossRef]
- Van den Berg, A.E.; Jorgensen, A.; Wilson, E.R. Evaluating restoration in urban green spaces: Does setting type make a difference? Landsc. Urban Plan. 2014, 127, 173–181. [Google Scholar] [CrossRef]
- Real, E.; Arce, C.; Sabucedo, J.M. Classification of landscapes using quantitative and categorical data, and prediction of their scenic beauty in north-western Spain. J. Environ. Psychol. 2000, 20, 355–373. [Google Scholar] [CrossRef]
- Wu, J.; Hobbs, R. Key issues and research priorities in landscape ecology: An idiosyncratic synthesis. Landsc. Ecol. 2002, 17, 355–365. [Google Scholar] [CrossRef]
- Sang, O.; Tveit, M.S. Perceptions of stewardship in Norwegian agricultural landscapes. Land Use Policy 2013, 31, 557–564. [Google Scholar] [CrossRef]
- Walz, U. Landscape Structure, Landscape Metrics and Biodiversity. Living Rev. Landsc. Res. 2011, 5, 5–35. [Google Scholar] [CrossRef]
- Kaplan, R. The analysis of perception via preference: A strategy for studying how the environment is experienced. Landsc. Plan. 1985, 12, 161–176. [Google Scholar] [CrossRef]
- Kellert, S.R.; Wilson, E.O. The Biophilia Hypothesis; Island Press: Washington, DC, USA, 1995; Available online: https://philpapers.org/rec/KELTBH (accessed on 18 May 2024).
- Son, Y.; Kang, D.; Kim, J.; Lee, S.; Lee, J. Landscape classification with self-organizing map using user participation and environmental data: The case of the Seoul Metropolitan Area. Landsc. Ecol. Eng. 2024. [CrossRef]
- Kwon, H.; Choi, T.; Kim, I.; Kim, S.; Kang, D.; Jun, B.; Jeong, D.; Lee, J.; Joo, W.; Seo, C. A Study on the Evaluation and Awareness of Local Ecological Value. (No. 11–16). Korea, National Institute of Ecology, Team of Ecosystem Services. 2020. Available online: https://www.nie.re.kr/nie/bbs/BMSR00025/view.do?boardId=1730185&menuNo=200064 (accessed on 18 May 2024).
- Jalas, J. Hemerobe and hemerochore Pflanzenarten. Acta Soc Pro Fauna Flora Fenn 1955, 72, 1–15. [Google Scholar]
- Kowarik, L. Zum menschlichen Einfluy auf Flora und Vegetation. Theoretische Konzepte und ein Quantifizierungsansatz am Beispiel von Berlin (West). Landschaftsentwickl. Umweltforsch 1988, 56, 1–280. [Google Scholar]
- Steinhardt, U.; Herzog, F.; Lausch, A.; Müller, E.; Lehmann, S. 16 The Hemeroby Index for Landscape Monitoring and Evaluation. Environ. Indices Syst. Anal. Approach 2000, I, 237. [Google Scholar]
- Walz, U.; Stein, C. Indicators of hemeroby for the monitoring of landscapes in Germany. J. Nat. Conserv. 2014, 22, 279–289. [Google Scholar] [CrossRef]
- Kim, D.-E.; Son, Y.-H. Evaluation of Perceived Naturalness of Urban Parks Using Hemeroby Index. J. Korean Inst. Landsc. Arch. 2021, 49, 89–100. [Google Scholar] [CrossRef]
- Erdős, L.; Bede-Fazekas, Á.; Bátori, Z.; Berg, C.; Kröel-Dulay, G.; Magnes, M.; Sengl, P.; Tölgyesi, C.; Török, P.; Zinnen, J. Species-based indicators to assess habitat degradation: Comparing the conceptual, methodological, and ecological relationships between hemeroby and naturalness values. Ecol. Indic. 2022, 136, 108707. [Google Scholar] [CrossRef]
- Tian, Y.; Liu, B.; Hu, Y.; Xu, Q.; Qu, M.; Xu, D. Spatio-temporal land-use changes and the response in landscape pattern to hemeroby in a resource-based city. ISPRS Int. J. Geo-Inf. 2020, 9, 20. [Google Scholar] [CrossRef]
- Wu, T.; Zha, P.; Yu, M.; Jiang, G.; Zhang, J.; You, Q.; Xie, X. Landscape pattern evolution and its response to human disturbance in a newly metropolitan area: A case study in Jin-Yi metropolitan area. Land 2021, 10, 767. [Google Scholar] [CrossRef]
- Barrett, D.; Heale, R. What are Delphi studies? Évid. Based Nurs. 2020, 23, 68–69. [Google Scholar] [CrossRef] [PubMed]
- Qgis.org. (4 May 2024). Class: QgsZonalStatistics. QGIS Python API. Available online: https://qgis.org/pyqgis/master/analysis/QgsZonalStatistics.html (accessed on 24 May 2024).
- McMahan, E.A.; Cloud, J.M.; Josh, P.; Scott, M. Nature with a human touch: Human-induced alteration negatively impacts perceived naturalness and preferences for natural environments. Ecopsychology 2016, 8, 54–63. [Google Scholar] [CrossRef]
- Liding, C.; Bojie, F.; Jianying, X.; Jie, G. Location-weighted landscape contrast index: A scale independent approach for landscape pattern evaluation based on source-sink ecological processes. Acta Ecologica Sinica 2003, 23, 2406–2413. [Google Scholar]
- Ferrari, C.; Pezzi, G.; Diani, L.; Corazza, M. Evaluating landscape quality with vegetation naturalness maps: An index and some inferences. Appl. Veg. Sci. 2008, 11, 243–250. [Google Scholar] [CrossRef]
- Carrus, G.; Lafortezza, R.; Colangelo, G.; Dentamaro, I.; Scopelliti, M.; Sanesi, G. Relations between naturalness and perceived restorativeness of different urban green spaces. PsyEcology 2013, 4, 227–244. [Google Scholar] [CrossRef]
- Marselle, M.R.; Hartig, T.; Cox, D.T.; de Bell, S.; Knapp, S.; Lindley, S.; Triguero-Mas, M.; Böhning-Gaese, K.; Braubach, M.; Cook, P.A.; et al. Pathways linking biodiversity to human health: A conceptual framework. Environ. Int. 2021, 150, 106420. [Google Scholar] [CrossRef]


| Hemeroby | Degree of Naturalness | Human Impact | Korea Landcover Type (Referred from CLC) | Hemeroby Score | Ecological Function Matrix Score |
|---|---|---|---|---|---|
| Ahemerobic | natural/Almost no human impacts | none | Bare rock | 5 points | 8 points Bare rock |
| Oligohemerobic | close to natural/weak human impacts | limited removal of wood, pastoralism, depiction through air and water | broadleaf forest, intertidal flats, mixed forest (potential natural vegetation), coastal lagoons, beaches, dunes, sands, estuaries, inland marshes, sea and ocean, peat bogs, saltern | 10 points broadleaf forest, coniferous forest, mixed forest, sea, and ocean | |
| 9 points beach, water body, river, lakes, and marshes | |||||
| Mesohemerobic | semi-natural/moderate human impacts | clearing and occasional ploughing, clear cut, occasional slight fertilisation | coniferous forest, transitional woodland shrub, mixed forest (not potential natural vegetation), sparsely vegetated areas, natural grasslands, other grasslands, burnt areas, river, lakes and marshes, beach | 4 points | 8 points natural grasslands, inland marshes, foreshore, bare rock |
| 5, 6 points irrigated arable land, ranch farm, extra bare land, pastures, golf field, other grasslands | |||||
| -euhemerobic | relatively for from natural/moderate strong human impacts | application of fertilisers lime and pesticides, ditch drainage | irrigated arable land, farmland, ranch farm, complex cultivation patterns, cemetery, extra bare land, pastures, land principally occupied by agriculture with significant areas of natural vegetation | 3 points | 3, 4 points farmland, unploughed farmland, complex cultivation patterns, cemetery |
| -euhemerobic | far from natural/strong human impacts | deep ploughing, drainage, application of pesticides and intensive fertilisation | non-irrigated, arable land, vineyards, complex cultivation patterns, orchard | 2 points | all most 3 points, orchard only 6 |
| facility plantation, greenhouse | 2 points | ||||
| Polyhemerobic | strange to natural/very strong human impacts | single destruction of the biocenosis and covering of the biotope with external material at the same time | sport and leisure facilities, discontinuous urban fabric, construction sites, mineral extraction sites, dump sites | 1 point | 1 point |
| Metahemerobic | artificial/excessively strong human impacts | biocenosis destroyed | continuous urban fabric, port areas, airports, industrial or commercial units, road and rail networks, housing | 0 points |
Disclaimer/Publisher’s Note: The statements, opinions and data contained in all publications are solely those of the individual author(s) and contributor(s) and not of MDPI and/or the editor(s). MDPI and/or the editor(s) disclaim responsibility for any injury to people or property resulting from any ideas, methods, instructions or products referred to in the content. |
© 2024 by the authors. Licensee MDPI, Basel, Switzerland. This article is an open access article distributed under the terms and conditions of the Creative Commons Attribution (CC BY) license (https://creativecommons.org/licenses/by/4.0/).
Share and Cite
Kim, D.; Son, Y. An Assessment of Landscape Perception Using a Normalised Naturalness Index in the Greater Seoul Area. Land 2024, 13, 750. https://doi.org/10.3390/land13060750
Kim D, Son Y. An Assessment of Landscape Perception Using a Normalised Naturalness Index in the Greater Seoul Area. Land. 2024; 13(6):750. https://doi.org/10.3390/land13060750
Chicago/Turabian StyleKim, Doeun, and Yonghoon Son. 2024. "An Assessment of Landscape Perception Using a Normalised Naturalness Index in the Greater Seoul Area" Land 13, no. 6: 750. https://doi.org/10.3390/land13060750
APA StyleKim, D., & Son, Y. (2024). An Assessment of Landscape Perception Using a Normalised Naturalness Index in the Greater Seoul Area. Land, 13(6), 750. https://doi.org/10.3390/land13060750