Abstract
The definition of cities from the physical view in China is lacking. Most research regarding Chinese cities relies on the definition from the administrative view, which is often inconsistent as there are serious discrepancies between the administrative boundaries and the physical extent of Chinese cities. This study aims to delineate Chinese urbanised areas using population census data at the township level and analyse the identified urbanised areas’ characteristics. The results show that the numbers of Chinese urbanised areas in 2000, 2010, and 2020 were 758, 942, and 1058, respectively, indicating there are several ‘cities outside the system’ that meet the requirements of urban agglomeration but are constrained by the city designation system. The degree of population aggregation and the growth rate of urbanised areas are greater than those of administrative cities. This indicates that the geographical scopes of administrative cities cannot accurately reflect the ‘real’ urban areas. Additionally, the city-size distribution follows Zipf’s law, with the Zipf coefficient moving closer to one if we fit the Zipf model based on the urbanised areas. It is necessary to establish official urbanised areas and publish statistical data based on urbanised areas, which could have significant implications both for policymakers and researchers.
1. Introduction
An important issue in urban studies is how to define cities, which has significant implications both for policymakers and researchers. Cities can be defined as administrative and physical entities. The definition of administrative cities relies on administrative or legal boundaries. By contrast, from the physical view, a city is a contiguous urbanised area with densely concentrated people and socioeconomic services [1]. In practice, an urbanised area is generally defined by using the thresholds of population density and size. Urbanised areas that are defined from the physical view are consistent with people’s understanding of the real urban development boundaries and are important for scholars and policymakers to understand cities and their evolution and socioeconomic characteristics.
There is a lack of official definitions for urbanised areas in China and studies on Chinese cities have heavily relied on administrative cities, which entail various drawbacks. First, the definitions of Chinese administrative cities and urban populations frequently cause confusion, making Chinese cities inconsistent and incomparable with their counterparts in Western countries [2]. In China, cities are officially approved urban administrative entities [3]. However, cities do not constitute an independent administrative category but rather fall under different administrative levels (i.e., provincial, prefecture, and county). Most cities at the prefecture level and above are area-type units that consist of densely populated urban districts (shi xia qu), as well as subordinate counties and county-level cities, which are termed as a ‘city administering county’. When mentioning a Chinese city and measuring its urban population, we must specify its administrative level and distinguish between urban districts and the entire municipal area, especially for cities at the prefecture level and above.
Second, administrative cities cannot reflect the ‘real’ urban areas because there are serious discrepancies between the administrative boundaries and the physical areas of cities. The administrative areas of cities that include vast rural areas and large agricultural populations are much larger than the physical urban areas. However, many counties and towns can be defined as independent physical urban areas from the physical view of built-up area continuity and population scale/density; however, these are categorised as non-city entities in the Chinese administrative system, which is a peculiar phenomenon called ‘invisible Chinese cities’ [4]. Therefore, the total number of Chinese administrative cities only increased from 663 to 685 in 2000–2020, while the total urban population grew from 455.99 million to 901.99 million in the same period.
Third, the frequent adjustments of the boundaries of administrative cities have resulted in an increasing mismatch between administrative cities and the physical dimensions of Chinese cities. Before economic reforms, a city was typically a densely populated settlement with an urban landscape but this situation has dramatically changed since the early 1980s because of three strategies to adjust the urban administrative system; these include ‘city administering county’, ‘converting county to city’, and ‘large cities annexing surrounding counties as urban districts’. These practices have led to the frequent changing of urban boundaries and territories, the creation of hybrid spaces that consist of urban and rural administrative units, and the confusion of China’s complex urban population statistics [3,5].
In recent years, with the emergence of new data and the progress of technologies, there have been increasing studies that attempt to identify physical urban areas in China. A line of studies has used newly emerging data, such as large-scale impervious surfaces (mainly using remote sensing data) [6,7,8] and urban night-time light [9,10,11] to identify physical urban areas. However, this type of data can benefit the classification of urban and non-urban land use but makes it difficult to delineate a continuous urban area boundary. Another line of studies has relied on emerging net spatiotemporal network big data, such as location-based social media data, vector data of street/road nodes, mobile phone data, points of interest (POIs), etc. Big data have the characteristics of timeliness, high precision, and public accessibility but the key problem of using big data is how to reduce the influence of errors. Many newly emerging techniques are employed to define physical urban areas in recent studies. With the progress of new techniques, there are many studies delineating the boundaries of physical urban areas by exploring these new techniques such as the spatial relationships (such as continuity and distance) of urban features through clustering techniques, the city clustering algorithm (CCA) [12], the percolation-based method [4,13,14], and the knowledge-based morphological aggregation method [15]. Moreover, the natural cities approach delimitates urban boundary\boundaries based on cross-scale statistical distributions (i.e., head/tail breaks) using night-time light data, street nodes, and location-based social media data [16,17].
Despite many attempts to delineate physical urban areas, there are two problems with these studies. First, although newly emerging data stimulate innovative methods to extract physical urban areas, socioeconomic features such as density and population size are more accurate measures for urbanised area delineation. The density and size of the population are the direct indicators for the concentration of human socio-economic activities, which reflect the major feature of urbanised areas, and in many countries, the official definitions of urbanised areas are based on population size and density. For example, an urbanised area in Japan, termed a Densely Inhabited District (DID), is defined as a district with a population density of at least 4000 people/km2 and a total population of 5000 or more. An urbanised area in the United States (US) refers to an urban area with a population of 50,000 or more. Second, urbanised areas defined by the aforementioned methods are difficult to match with socioeconomic statistical data, gathered to correspond to administrative units. Such a mismatch hinders applications in policymaking and academic research based on urbanised areas. As the urban administrative system plays a dominant role in China, policies and administration are generally conducted based on administrative units. Urbanised areas that do not consider administrative divisions have little policy implications for administration. Moreover, the official definitions of urbanised areas in many countries also use census-enumeration districts as the basic unit block of area. Therefore, the delineation of urbanised areas based on an appropriate scale of administrative units can be considered benchmarks for relevant policy making. To address these issues, this study aims to delineate Chinese urbanised areas using population census data at the township level. To provide a more nuanced understanding of the Chinese urban system, we analyse the temporal and spatial characteristics as well as city-size distribution of the identified urbanised areas.
2. Materials and Methods
2.1. Data Source
The data of this study are derived from China’s 2000, 2010, and 2020 population censuses. The population census is taken every ten years and provides the best data accuracy among population statistics in China. The basic census unit is a census tract and micro-level data are aggregated into large-scale administrative units. We employed the population census data at the township level (i.e., xiang, zhen, and jiedao) to define urbanised areas. For each township-level administrative division, the data report the resident population (changzhu renkou). The three population censuses have consistent criteria for the resident population, which identify people who had resided in the township-level administrative division of enumeration for more than six months on census day.
In many countries, urbanised areas are created from census tracts or blocks, such as in the US and Japan. With the advantage of being small-scale, census tracts can accurately delineate the boundary of urbanised areas; however, it is highly demanding in terms of data quality. In China, geographic information on census tracts and corresponding statistical data are not available. Moreover, the social and economic statistics and administrative management are conducted based on administrative divisions in China; therefore, it is of little significance to use census tracts for delineation considering the practicability of using the results for follow-up academic research and policymaking. Therefore, considering both the feasibility and practicability of the results, this study uses administrative divisions as the basic statistical unit to delineate urbanised areas.
We selected the township-level administrative division (i.e., towns, townships, and urban sub-districts) as the basic statistical unit to define urbanised areas. China’s administrative system is structured in four basic administrative levels: province, prefecture, county, and township. Overall, the area of provincial and prefecture-level administrative divisions is too large. Three types of county-level administrative divisions (i.e., counties, county-level cities, and urban districts) differ widely in urban characteristics. The urbanisation level of urban districts is higher and has fewer internal differences, while the differences in population distribution and urbanisation level of counties and county-level cities are substantial. If county-level administrative divisions are considered as the basic statistical unit and such differences are ignored, it will be difficult to accurately identify urbanised areas with aggregation characteristics. As neighbourhood and village committees are not part of the nation’s legal administrative divisions and their statistical data and boundaries are not available, they are not suitable for this study. As the lowest level in the administrative system, township-level administrative divisions can accurately and objectively reflect the boundaries of urbanised areas and strike a good balance between keeping the minimum statistical unit and ensuring data availability.
According to the seventh census data, China had 41,610 township-level administrative divisions in 2020, including 8842 sub-district offices, 21,054 towns, 8762 townships, and 2737 other types of divisions. Due to the absence of maps of the administrative divisions in 2000 and 2010, we consider the map for 2020 as the benchmark to match with the township-level administrative divisions of the previous two censuses. Because many administrative divisions have been adjusted during this period, the difficulty of matching lies in how to align with these adjustments. Treatments of boundary changes over time are indicated in the delineation procedure section. There are three main types of adjustment. First, the entire division was transformed into another administrative category. For example, the township changes into a town or an urban sub-district. Second, two township-level administrative divisions are combined into one. And third, one township-level administrative division is divided into two or more divisions. In the first case, adjustment is not needed because the geographical scope remains unchanged. To handle the second case, we combined the geographical scope of administrative divisions in 2000 or 2010 with the corresponding population data based on the latest divisions. The third case causes difficulties as most details of these divisions are not public. Therefore, we adopted an approximate method to distribute the population with the divided area as the weight and calculated the population density. This approximate treatment will not change the population density and, therefore, has little influence on the delineation result.
2.2. Delineation Methods
2.2.1. Selection of Indicators
There are two opinions regarding the selection of indicators for delineating urbanised areas in the existing literature. The first one is to take population density and population size as the main indicators. These two indicators reflect the degree of population aggregation, which is the essential characteristic of urbanised areas and can be compared among countries. The second is to take the spatial characteristics such as the proportion of urban land use, the proportion of the population in built-up areas, and infrastructure distribution as the main indicators. Such an indicator system has two major disadvantages: (1) it cannot objectively reflect multiple urbanised areas within one administrative city and urbanised areas across the administrative boundaries and (2) authoritative data sources of urban land use or built-up areas are unavailable in China. The urbanised area is characterized by population aggregation; therefore, it is better to directly use the population size and density indicators to reflect the degree of population aggregation, rather than using the land indicator to reflect it indirectly. Therefore, this paper adopts two complementary indicators, that is, total population size and population density, to delineate urbanised areas. We refer to international experiences and combine them with China’s conditions to determine the thresholds of the two indicators.
- (1)
- The Indicator of Population Density
Although the population density of other countries cannot be immediately applicable to China, the value range of the lower bound of population density in China’s urbanised areas can be roughly determined by bench-marking against foreign standards. As per the current standards of the US, the maximum value of the lower bound of population density is 1000 people/mi2 (about 386 people/km2) and the minimum value is 500 people/mi2 (about 193 people/km2) [18]. The standard for a DID in Japan is 4000 people/km2 [19]. Preliminarily judging from the land area and population characteristics in China, the lower bound of the population density indicator in China’s urbanised areas should be between the values set in the American and Japanese standards.
In this paper, the lower bound of population density is set at 1500 people/km2 for the following reasons. First, most existing studies on delineating urbanised areas by population density in China have chosen 1500 people/km2 as the lower bound of population density (see Table 1). Second, Provisions on Statistical Division of Urban and Rural Areas (Trial), issued by the National Bureau of Statistics in 1999, stipulates that ‘the population of all administrative areas under the jurisdiction of municipal districts with more than 1500 people/km2 should be counted as urban population’. This threshold has been tested by multiple national departments with full consideration of the population, social, and economic development conditions of China’s current urbanisation stage, thus demonstrating a strong rationality. In research, 1500 people/km2 is considered the lower bound of population density in cities and towns in most cases, indicating its rationality.

Table 1.
The lower bound of population density in urbanised areas in relevant countries and existing studies.
- (2)
- The indicator of population size
In theory, the threshold of population size of an urbanised area is related to the economies of scale of access to public goods. From a social and economic perspective, adequate high-quality public services and infrastructures are the main characteristics of urban areas. However, the input of these public goods requires a scale effect, which can only be realized when the population agglomeration reaches a certain level; otherwise, it may eventually lead to low efficiency of resource usage [23]. Therefore, the bottom line of the economies of scale of public goods needs to be considered when setting the lower bound of population size for urbanised areas.
This study sets the lower bound of population size in urbanised areas as 50,000 people, which is a common threshold for defining urban areas in many countries. In the US, urbanised areas comprise areas that together have a minimum population of 50,000 inhabitants [18]. In the Organisation for Economic Co-operation and Development (OECD) European Community (EC), many countries also adopt 50,000 inhabitants as the lower bound of the population standard for establishing a city [24]. This implies that in the practice of developed countries, 50,000 people are generally used as the threshold to judge whether a region falls into the category of a city.
2.2.2. Delineation Procedure
The delineation method mainly involves the following two steps.
First, the population density of each township administrative division is preliminarily judged and the township-level administrative divisions with a lower bound of 1500 people/km2 in population density are marked as ‘quasi-urbanised areas’.
Second, the population size aggregation of ‘quasi-urbanised areas’ adjacent to the boundary is calculated. We define adjacent divisions as those connected by shared boundaries; as long as two township-level administrative divisions have a common border, they are considered adjacent divisions. If the lower bound of 50,000 people is met, all adjacent township administrative divisions will be divided into ‘urbanised areas’.
When delineating urbanised areas, corresponding measures should be taken for the following special circumstances:
- (1)
- Treatment of boundary changes over time. There are four main types of adjustment. First, the entire division has been transformed into another administrative category. For example, the township changes into a town or an urban sub-district. In this case, adjustment is not needed because the geographical scope remains unchanged. Second, two or more township-level administrative divisions are combined into one. To address this issue, we combine the geographic boundaries of these administrative divisions from 2000 or 2010. We aggregate the population and area of the combined township-level administrative divisions to calculate the corresponding population density and total population size, based on which we determine whether it belongs to an urbanized area. Third, one township-level administrative division is divided into two or more divisions. This change causes difficulties as most details of these divisions are not public. Therefore, we adopted an approximate method to distribute the population with the divided area as the weight and calculated the population density, respectively. This approximate treatment will not change the population density and, therefore, has little influence on the delineation result. Fourth, several villages/communities under one township-level administrative division may be divided and assigned to another division, while both townships retain their names. Due to the lack of specific adjustment details we used a comprehensive approach by collectively handling all the townships involved. Their populations and areas are summed up as a whole and their population density and size are calculated to determine whether they meet the criteria for urbanised areas. Given the relatively small number of cases in the third and fourth adjustments, the method used is not expected to significantly impact the main conclusions;
- (2)
- Treatment of enclaves. In this study, enclaves refer to the township-level administrative divisions, which are fully surrounded by urbanised areas but do not meet the standards of an urbanised area. For such kind of enclave, we combine the rest of the surrounding areas into the same urbanised area;
- (3)
- Treatment of coastal islands. In coastal areas, an island not connected to the mainland, if it meets the population density indicator of an urbanised area, should be divided into ‘quasi-urbanised areas’. If there is an urbanised area that meets the standard in the surrounding county, the island, and the surrounding county, it will be combined into the same urbanised area;
- (4)
- Treatment of urbanised areas spanning over higher-level administrative divisions. According to the above method, urbanised areas may belong to different counties, prefectures, or provincial administrative divisions. We calculated the total population of these divisions and named these kinds of urbanised areas, a ‘combined urbanised area (CUA)’ (The number of urbanised areas is counted in each administrative division as ‘one’, while the data of area and population size are counted according to the administrative division. For example, if an UA spans two prefecture-level cities, A and B, the number of urbanised areas will be counted once in the A prefecture-level city and B prefecture-level city, respectively, while only the actual area and population of the urbanised area in A and B prefecture-level cities will be counted when calculating the area and population data of each prefecture-level city. Therefore, when checking the total number of urbanised areas, there may be inconsistencies between the number of urbanised areas included in the higher administrative divisions and the total number of urbanised areas included in the lower administrative divisions).
3. Results
3.1. Results of Urbanised Areas Delineation
The results show that the number of urbanised areas in China in 2000, 2010, and 2020 is 758, 942, and 1058, respectively. Figure 1 presents the spatial distribution of urbanised areas in the three consensus years. In the past 20 years, the number of urbanised areas in China has increased by 300, with a growth rate of 39.6%. During the same period, the number of administrative cities in China did not experience a significant change, dropping from 663 in 2000 to 657 in 2010 and then increasing to 685 in 2020, with only 22 additions over 20 years. The difference between the number of urbanised areas and administrative cities has increased from only 95 in 2000 to 373 in 2020. Furthermore, we divided the urbanised areas and administrative cities into five levels based on population size. Urbanised areas in the three years all show a pyramid structure, while the size structure of administrative cities is spindle-shaped, with few cities at smaller scales (Table 2). For the urbanised areas, we found that the number of megacities increased from 5 in 2000 to 17 in 2020. The largest increase was observed in medium-sized and small cities, up by 62 and 168, respectively. The number of micro-cities increased from 525 in 2000 to 624 in 2010 and decreased to 563 in 2020. Simultaneously, in administrative cities, the number of megacities expanded by 17, more than the number of urbanised areas. The number of large- and medium-sized cities increased by 64 and 75, respectively, and their absolute number and growth were greater than those in urbanised areas. The number of small and micro administrative cities is smaller than that of urbanised areas and on a downward trajectory. In 2020, the number of small and micro administrative cities was only 258 and 120, respectively.
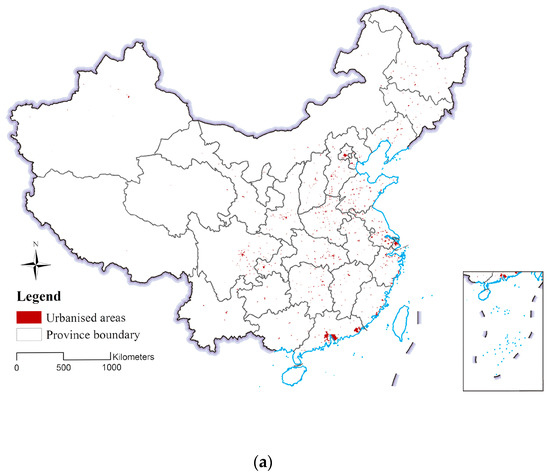
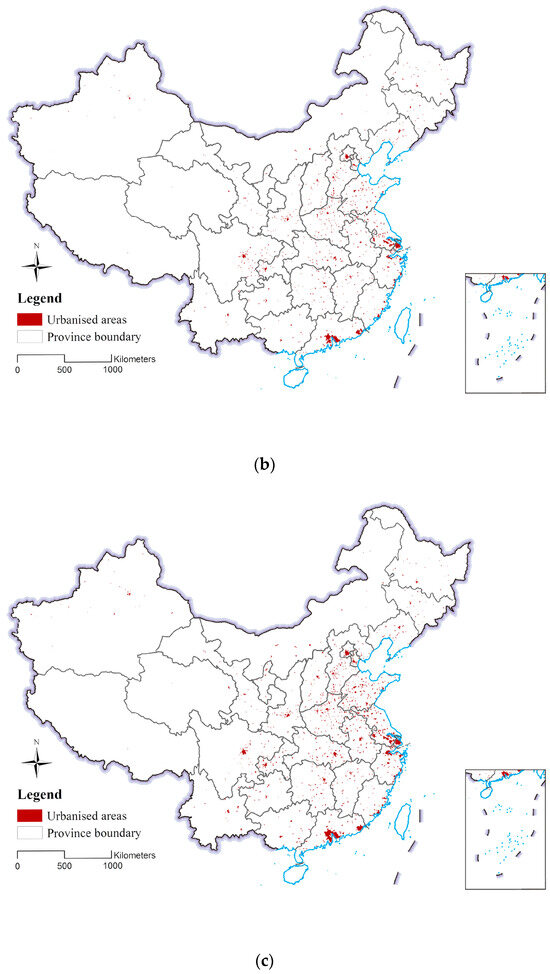
Figure 1.
Distribution of urbanised areas in China in (a) 2000; (b) 2010; and (c) 2020.
Table 2.
Quantitative changes in urbanised areas of different scales.
Urbanised areas have faster growth rates in terms of population and area than those in administrative cities. As shown in Table 3, from 2000 to 2020, the population and area of urbanised areas more than doubled. The population size expanded from 253.66 million in 2000 to 386.58 million in 2010 and 566.52 million in 2020, with an average annual growth rate of 4.1%. The proportion of the population in the national total population rose from 20.41% to 40.18%. Compared to the urban population (chenzhen renkou) that is commonly used to measure the urbanization rate as published by the censuses, the population in urbanised areas identified in this study is smaller but grows at a faster rate. The urban population increased from 345.65 million in 2000 to 475.55 million in 2010 and 672.49 million in 2020, with an average annual growth rate of 3.38%, lower than the growth rate in population size in urbanised areas identified in this study. The difference between the two lies in the fact that the urban population refers to people classified as living in cities or towns according to statistical definitions. Some towns that are far from cities do not meet the population density and size criteria set by this study and thus are not included in urbanised areas. Therefore, the population identified in urbanised areas by this study is smaller than the urban population published by the censuses. This also indicates that urbanised areas can more accurately reflect the physical urban areas of cities.
Table 3.
Changes in population size and area in urbanised areas and administrative cities.
The area of urbanised area has sprawled from 57,242 to 84,963 and finally 127,525 km2, with a growth rate consistent with that of population, and the proportion of the area in the national land area went up from 0.6% to 1.32%. The area of administrative cities increased from 1,753,085 km2 in 2000 to 1,879,150 km2 in 2010 and 2,336,443 km2 in 2020, with a growth rate of only 33%. The expansion of administrative cities is mainly attributed to the adjustment of administrative divisions, such as converting a county into an urban district and county-level city, the essence of which is institutional adjustment. The growth of urbanised areas demonstrates the substantial improvement in population and the aggregation degree of urban activities. From the comparison of their population and area expansion, we find that with the development of urbanization, the geographical scope of urbanised areas keeps expanding and becomes increasingly aggregated. Moreover, the urban population growth of non-administrative cities in China is faster than that of administrative cities, which may be concentrated in counties and towns where the urban characteristics are present. It indicates that, with the advancement of urbanization, China is witnessing the continuous expansion of urbanised areas and the emergence of several urbanised areas with high degrees of population aggregation.
The rapid sprawling of large urbanised areas is another manifestation of the characteristics of an urbanised area. Table 4 lists the top 10 urbanised areas of the three consensus years and Figure 2 depicts the growth of the five urbanised areas with the largest populations in 2020 over the past two decades. The largest urbanised area in China is in the Pearl River Delta region of Guangdong Province. In 2000, two urbanised areas with a population exceeding 10 million were formed in the Pearl River Delta region, Shenzhen-Dongguan CUA and Guangzhou-Foshan-Zhongshan-Jiangmen CUA. The population size of the Shanghai urbanised area reached 11.79 million in 2000 and the population density exceeded 8000 people/km2. In 2010, the two urbanization areas in the Pearl River Delta region were connected physically, forming a super-large area encompassing seven prefecture-level cities, with a population of 36.97 million, an area of about 8560 km2, and a density of over 4000 people/km2. In 2010, the population sizes of the Shanghai urbanised area and Beijing urbanised area were 19.51 million and 13.79 million, respectively, and the density was significantly higher than that of the urbanised area in the Pearl River Delta. By 2020, the combined urbanised areas in the Pearl River Delta have been further expanded, and some towns and streets in Zhuhai have been included, increasing the population to 60.45 million, the area to 11,285 km2, and density to over 5000 people/km2. The Shanghai and Suzhou urbanization areas are expanded and connected, forming a combined urbanised area spanning provinces. This combined urbanised area has a total population of 22.18 million and covers an area of 3321 km2. The Beijing urbanised area is also growing rapidly, with a population size above 15 million. Moreover, Hangzhou and Chengdu recorded a relatively high growth rate in urbanised areas. In 2000, a total of 3.73 million people lived in the Chengdu urbanised area, ranking ninth in China; in 2010, the number increased to 7.26 million, moving it up to fifth place; and in 2020, it came in at 12.83 million people, ranking fourth. In 2000, Hangzhou was not in the top 10 largest urbanised areas. In 2010, Hangzhou and Shaoxing formed a combined urbanised area, with a total population of six million, ranking seventh place. In 2020, Hangzhou-Shaoxing CUA and Jiaxing City were further connected to form a combined urbanised area, rising to fifth place with a population size of 10.51 million. Another super-large combined urbanised area is Wuxi-Suzhou-Changzhou CUA, which had a population of 9.31 million in 2020, taking the eighth place.
Table 4.
Top 10 urbanised areas with population size in China from 2000 to 2020.
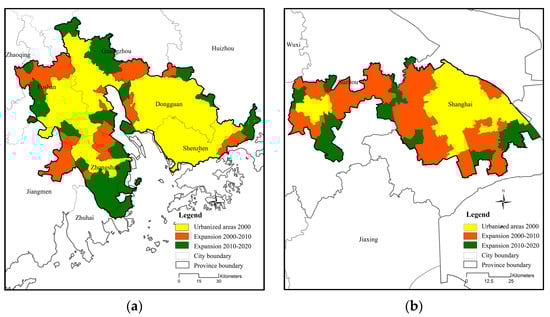
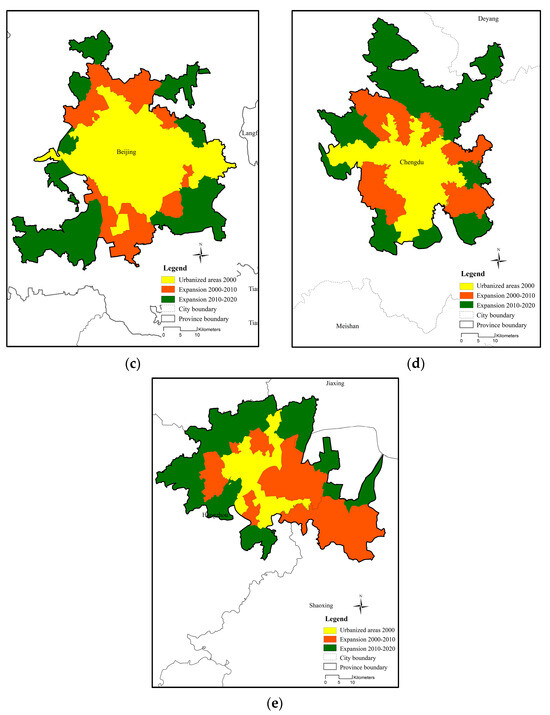
Figure 2.
Expansion of five urbanised areas in the past 20 years before 2020: (a) Guangzhou-Shenzhen CUA; (b) Shanghai-Suzhou CUA; (c) Beijing UA; (d) Chengdu-Deyang CUA; and (e) Hangzhou-Shaoxing-Jiaxing CUA.
3.2. Spatial Characteristics of Urbanised Areas
In this section, we analyse the spatial characteristics of urbanised areas by comparing the geographical scopes of urbanised areas with those of administrative cities. Due to the lack of officially defined physical urban areas, researchers generally define an urban area based on the administrative divisions of Chinese administrative cities, that is, urban districts are regarded as within the scopes of urban areas for prefecture-level cities and above, while the whole city territories are regarded as the urban areas regarding county-level cities. Counties are categorized into non-urban areas. Therefore, researchers commonly consider the urban districts of prefecture-level cities and above and the whole city territory of county-level cities as urban areas. This may cause deviation in the analysis results due to differences in varying degrees between administrative cities and physical urban areas. Therefore, we make a comparative analysis of the urbanised areas defined in this study and administrative cities to identify their differences in spatial characteristics.
Figure 3 indicates the spatial distributions of urbanised areas and the geographical spatial scope of administrative cities in the three consensus years. The red areas refer to the urbanised areas in each year, the blue areas represent the urban districts of prefecture-level cities and above, and the green areas illustrate the county-level cities. There are big differences in the geographical scope between urbanised areas and administrative cities. First, overall, administrative cities cover a much larger area than those of urbanised areas, revealing that a large number of non-urbanised areas are included in both urban districts and county-level cities and taking these areas as physical urban areas will overestimate the scope of the latter. It can be seen from Table 5 that in 2000, China’s urbanised area was only 3% of the area of administrative cities and the population size accounted for 73% and, in 2020, the proportion of area rose to 5.5% and the population size increased to 84%. Therefore, substituting a physical urban area with administrative cities will, to some extent, overestimate the area and population size.
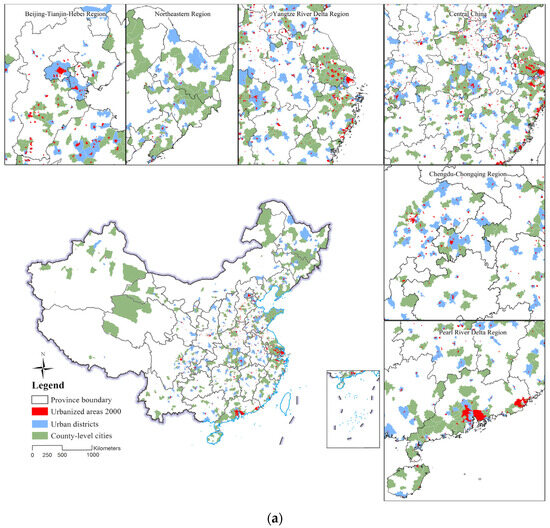
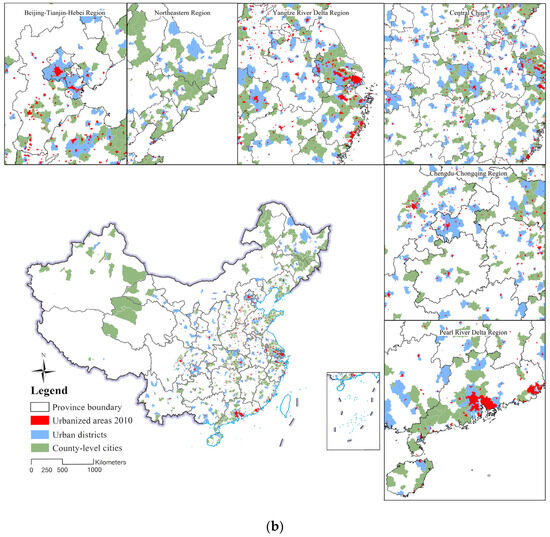
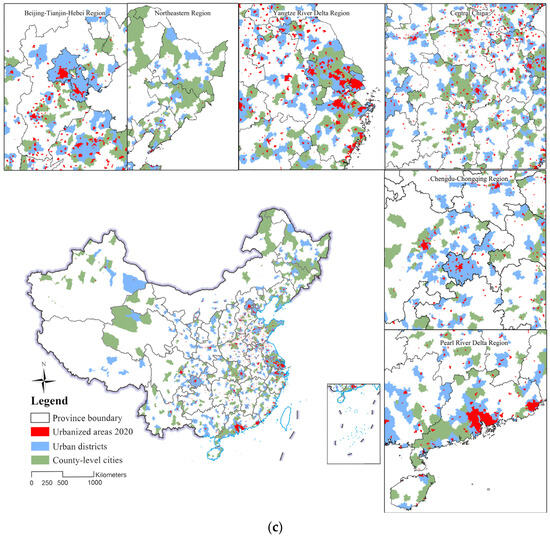
Figure 3.
The distribution of urbanised areas and geographic scope of administrative cities in China in (a) 2000; (b) 2010; and (c) 2020.
Table 5.
Number of urbanised areas in administrative cities.
Second, most cities at the prefecture level and above have urbanised areas within their urban districts (Table 3). In most cities, there is one urbanised area and two or more urbanised areas in the municipal districts of some cities, which are mainly developed cities along the eastern coast. For a few cities at the prefecture level and above, there is no urbanised area in the urban districts and these are mostly small cities located in the middle and west of the country. In 2000, among 262 cities at the prefecture level and above, only 9 of them had no urbanised area in their urban districts, 187 cities had only one urbanised area, and 66 cities had two or more independent urbanised areas. In the urban districts of Beijing and Shanghai, there were six independent urbanised areas. In 2010, the number of cities at the prefecture level and above increased to 287, of which 10 had no urbanised areas in their urban districts, 201 had one urbanised area, and 49 cities had two independent urbanised areas. In 2020, 20 cities at the prefecture level and above had no urbanised areas because some of them are newly designated cities. Ninety-four cities are prefecture-level and above with two or more urbanised areas.
Third, the overall population aggregation level of county-level cities is relatively low. In China’s administrative cities, county-level cities are administrative divisions with apparent non-agricultural characteristics in population, economy, industry, and infrastructure, setting them apart from counties. In 2000, only 221 of the 403 county-level cities in China had urbanised areas, accounting for about 55%. Only 17 county-level cities had two or more urbanised areas. In 2010, among the 365 county-level cities in China, there existed urbanised areas in 253 of them, accounting for 69% of the total, and there were two or more urbanised areas in 16 county-level cities. In 2020, there are 259 among 387 county-level cities with urbanised areas, accounting for 66.9%, and 23 of them have two or more urbanised areas.
Fourth, the population and urban activities in counties are poorly concentrated. Although several counties are densely populated, the residents are not concentrated; therefore, they have not developed into urbanised areas. There were 217 counties with urbanised areas in 2000 (accounting for 12.9%), 330 counties in 2010 (accounting for 20%), and 380 counties in 2020 (accounting for 25.5%). Although the number of counties with urbanised areas is increasing, their proportion is not high. By 2020, there were 1493 counties (autonomous counties) in China and 1113 counties failed to meet the standards of an urbanised area. A large population lives in counties but some counties that have the potential to develop into urbanised areas have failed to aggregate their population and urban activities partly due to the restrictions of the administrative system.
Fifth, the expansions of urbanised areas have increasingly crossed the boundaries of administrative cities, forming a large number of combined urbanised areas. In 2020, there were 17 combined urbanised areas across prefecture-level units in China, including Shanghai-Suzhou CUA, spanning the provincial administrative units mentioned in the previous section. The formation of combined urbanised areas is mainly driven by the close economic and social interactions among cities in the region. With the development of the economy and society, people living in different cities have been engaged in closer and more frequent exchanges than ever before. The expansion of combined urbanised areas has further shown that administratively, the designation of cities cannot meet the needs of urbanisation development.
3.3. City-Size Distribution of Urbanised Areas
City-size distribution within a region or county has been demonstrated to follow the power law, which is known as Zipf’s law [25] (Zipf, 1949). This law is a useful tool to understand the evolution of the urban system. If the size and order of a city display a double logarithmic linear relationship, it implies conformity with Zipf’s law. The basic form of Zipf’s law is as follows:
In this equation, Pk refers to the size of the city ranked k, P1 indicates the size of the largest city, and q stands for the Zipf coefficient. You can obtain a double logarithmic linear model by taking a double logarithm for the above formula:
In an ideal case, the Zipf coefficient, q, is close to one; a higher q value indicates a more concentrated city-size distribution and a larger population size gap between cities; a lower q value means a more dispersed city-size distribution and a smaller population size gap between cities.
Empirical studies have indicated that city-size distributions in many Western advanced countries follow Zipf’s law [26], though the Zipf coefficient is not always close to one [27]. A large number of studies have been conducted to examine the city distribution of China’s urban system. However, there are debates on China’s city-size distribution in the existing literature regarding whether Chinese cities follow Zipf’s law, with some scholars arguing that China’s city distribution does follow Zipf’s law [28]. Some studies, however, have found contrasting evidence that both smaller cities and megacities deviate from the Zipf distribution line [29] and some have observed that China’s city-size distribution is more in line with a log normal specification rather than a power low [30]. Furthermore, scholars have demonstrated the existence of bimodality in China’s city-size distribution [31]. Moreover, existing research has reached a consensus that China has a flat city-size distribution (the Zipf coefficient is less than one), revealing the under-development of large cities in China’s urban system [29,32].
Current debates in the literature might be a consequence of the analysis unit selection, as most of these studies on city-size distribution are based on administrative cities. As mentioned earlier, China’s administrative cities fail to reflect the physical urban areas of Chinese cities. Most research regarding city-size distribution in European and American countries is based on cities defined from the physical perspective, which also leads to the incomparability of research conclusions between China and foreign countries. Therefore, this paper uses Zipf’s law to fit the identified urbanised areas and administrative cities, respectively, to better reveal the city-size distribution of China’s urban system by comparing their analysis results.
Figure 4 presents the fitting results of the Zipf model, from which we can obtain several main conclusions. First, compared with administrative cities, the city-size distribution of urbanised areas demonstrates more consistency with Zipf’s law. The goodness of fit of the Zipf models in 2000, 2010, and 2020 stood at 0.9308, 0.9347, and 0.8576, respectively, while the goodness of fit of the urbanised areas in the corresponding years were 0.9881, 0.9906, and 0.9808, respectively. We conducted the Kolmogorov–Smirnov test for goodness of fit, which shows that both administrative cities and urbanised areas of three years do not reject the hypothesis of a power law distribution at the 1% level (Table 6). The fitting result is better in urbanised areas and a higher level of consistency is observed between the city-size distribution and Zipf’s law. Second, the Zipf coefficient of the resident population size distribution in urbanised areas is closer to one than that of the administrative cities. The Zipf coefficients of administrative cities in 2000, 2010, and 2020 were 0.8496, 0.9120, and 1.0368, respectively, while the corresponding coefficients of urbanised areas were 0.9731, 0.9718, and 0.9982, respectively. No matter which year is regarded as the benchmark, the slope value of urbanised areas is closer to one and is more likely to follow Zipf’s law. Third, the Zipf coefficients of both administrative cities and urbanised areas exhibit a trend of growth. For administrative cities, the Zipf coefficient rises from 0.8496 in 2000 to 0.9120 in 2010 and surpasses 1 in 2020. Regarding urbanised areas, the Zipf coefficient in 2000 was 0.9731, highly close to 1, indicating a limited increase. The trend implies that large cities grow faster than small cities since 2000. Our results imply that Chinese city-size distribution is consistent with Zipf’s law, which is consistent with some existing studies [28]. The evolutional trend of city-size distribution is similar to Wang and Chen’s finding [29].
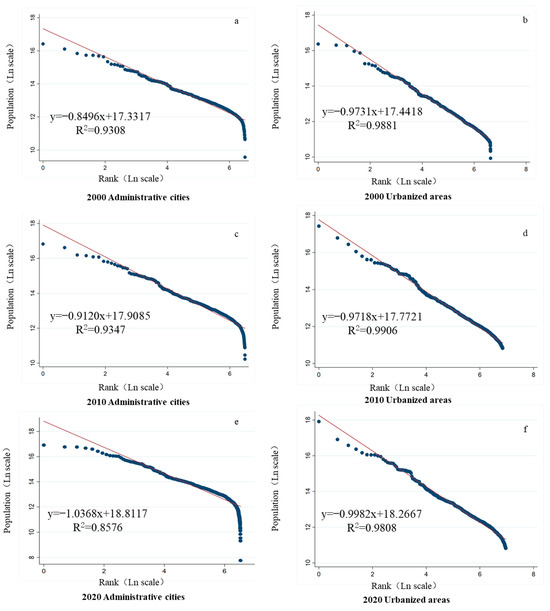
Figure 4.
The city-size distributions and results of fitting by Zifp’s model of China’s administrative cities and urbanised areas in 2000, 2010, and 2020.
Table 6.
Estimation results and the Kolmogorov–Smirnov test for goodness of fit.
To sum up, we posit that the city-size distribution of China’s urban system generally fits with Zipf’s law if we define cities based on urbanised areas. Current debates regarding whether Chinese cities follow Zipf’s law may be partly attributed to the selection of the analysis unit. Compared with administrative cities, urbanised areas can better reveal the characteristics of population distribution in an urban system. Moreover, we argue that large cities in China are not too small and, as the population in high-order urbanised areas grows faster, the population distribution within the Chinese urban system becomes increasingly concentrated in large urbanised areas.
4. Discussion
This paper attempts to define urbanised areas in China by using the township-level administrative units in the 2000, 2010, and 2020 population censuses. The findings have several implications. First, the ‘real’ number of Chinese cities should be much larger than the number of designated cities. A comparison of the number between urbanised areas and administrative cities reveals that the city designation system in China cannot fully meet the needs of its urbanization development. The number of urbanised areas identified in this paper proves that there are a large number of counties and towns in China that meet the requirements of urban agglomeration. Due to the constraints of the city designation system, they are ‘cities outside the system’. Comparisons with other countries also demonstrate that there are a limited number of administrative cities in China. For example, in 2020, Japan had a total population of 125.71 million and 772 cities, with an average of 6.1 cities per million people. In 2020, China had a population of 1.41 billion but only 685 cities, with an average of only 0.48 cities per million people. Moreover, the scope of administrative cities includes a large number of non-urbanised areas with a low level of population aggregation.
Second, the population aggregation level and growth rate of ‘real’ cities are greater than those of administrative cities. During the period of 2000 to 2020, both the population and area of urbanised areas doubled. Furthermore, the population size and growth rate of administrative cities were far lower than those of urbanised areas. In this period, the population density in urbanised areas was above 4400 people/km2, while in administrative cities, it was less than 400 people/km2, with a difference of more than 10 times. In the long term, urbanised areas remain highly aggregated and the population density is much higher than that of the administrative cities. These indicate that urbanised areas are the main spaces for urban population aggregation, which warrants more attention from policymakers and scholars.
Third, urbanised areas and administrative cities are different in spatial characteristics, which may lead to bias in the analysis results by conducting urban research based on administrative cities. In general, the geographical scopes of administrative cities are much larger than those of urbanised areas. On the one hand, the urban scopes defined based on administrative cities cannot accurately reflect the real physical urban areas and there are apparent inconsistencies between them. These areas with non-urban characteristics in their physical and geographical features are included in administrative cities. On the other hand, with the continuous adjustment of administrative divisions, the geographic scopes of administrative cities are gradually deviating from the actual physical urban areas.
Fourth, the city-size distribution is generally in line with Zipf’s law, with the Zipf coefficient moving closer to one if we fit the Zipf model based on urbanised areas. This implies that debates on China’s city-size distribution in the existing literature regarding whether Chinese cities follow Zipf’s law may be caused by the selection of administrative cities as analysis units. In the past two decades, the city-size distribution of the Chinese urban system has evolved toward a typical Zipf distribution, which can be attributed mainly to the relaxation of restrictions on population mobility. Such reforms could lead to the evolution of China’s urban system into a more natural system driven by bottom-up forces.
In addition, this study has advantages in terms of methodology and data. Firstly, it uses official census data, which are highly reliable. In comparison, the emerging spatiotemporal big data have more difficulty controlling for errors than census data. Secondly, identifying urbanised areas based on township-level administrative divisions ensures a stable, accurate, and reliable source of original data, which aligns with the formulation and implementation of national policies and plans. Thirdly, this study uses two main indicators—population density and population size—to identify urbanised areas. Compared to some recent studies using night-time light data, street nodes, or location-based social media data, our results are more intuitive and have stronger policy significance. Of course, there are some shortcomings in our methodology, which will be detailed below.
5. Conclusions
As there is a lack of the definition of cities from the physical view in China, most research regarding Chinese cities has to rely on administratively defined cities, which may lead to misinterpretation of many characteristics of cities. Therefore, this study attempts to delineate Chinese urbanised areas using 2000, 2010, and 2020 population census data at the township level. A delineation method based on population density and population size is applied to identify urbanized areas. Based on the identified results, we analyse the spatial characteristics and city-size distributions of urbanised areas.
The results indicate that the number of urbanised areas increased from 758 in 2000 to 942 in 2010 and 1058 in 2020, an increase of 39.6%. However, the number of administrative cities only increased by 22 in the same period. The population size expanded from 253.66 million in 2000 to 386.58 million in 2010 and 566.52 million in 2020, with an average annual growth rate of 4.1%. The area of administrative cities increased from 1,753,085 km2 in 2000 to 1,879,150 km2 in 2010 and 2,336,443 km2 in 2020, with a growth rate of only 33%. Spatially, there are big differences in the geographical scope between urbanised areas and administrative cities. In 2000, China’s urbanised area was only 3% of the area of administrative cities and the population size accounted for 73%; in 2020, the proportion of area rose to 5.5% and the population size increased to 84%. In 2020, only 20 among 298 cities at the prefecture level and above had no urbanised area within their urban districts, while there were 259 among 387 county-level cities and 380 among 1493 counties with urbanised areas. In 2020, there were 17 combined urbanised areas across prefecture-level units in China and most of these CUAs were concentrated in coastal regions. In addition, the city-size distribution of urbanised areas demonstrates more consistency with Zipf’s law. The increase in Zipf’s coefficient from 2000 to 2020 implies that large urbanised areas have grown faster than small urbanised areas since 2000.
Based on the findings of this study, we conclude that the system of city designation in China fails to comprehensively reflect the actual situation of urbanization in China and cannot meet the needs of urban research. It is recommended that an official statistical system of an ‘urbanised area’ should be established as soon as possible to supplement the existing urban statistical system. The statistical system of an ‘urbanised area’ can accurately identify the urban space with agglomeration characteristics in China, making up for the lack of statistical data in physical urban areas, and show the distribution of entity cities demonstrating agglomeration. This study is an attempt in this regard. It is suggested that the Chinese government establishes and publishes the basic data of urbanised areas from the seventh national census in 2020, which can be used as a reference for academic research and can be continuously improved and promoted in future censuses.
In summary, establishing official urbanized areas has significant policy implications. Specifically, these include the following aspects.
First, urbanized areas can serve as an important basis for administrative boundary adjustments. When converting counties into districts, decisions can be based on whether the urbanised area of a county is geographically connected to the central urban districts. Similarly, when converting counties into county-level cities, the inclusion of urbanized areas with a certain population size can be a key criterion.
Second, urbanised areas can provide a basis for policy making when delineating the spatial scope of urban agglomerations and metropolitan areas. For example, the boundaries of metropolitan areas can be determined based on the extent of the CUA and the range of urban agglomerations can be defined based on the dense distribution of urbanised areas exceeding a certain population size.
Third, public services, infrastructure, and land development indicators can be determined based on the population density and size of urbanised areas. This is because urbanized areas better reflect the spatial concentration of urban populations compared to administrative urban regions.
This study has the following limitations. First, there may be errors caused by adjustments to the boundaries of administrative divisions. Due to the lack of administrative division maps for the years 2000 and 2010, we used the 2020 map as a reference to match with township-level administrative divisions from the previous two censuses. Although we made every effort to clarify the processes and results of township-level administrative adjustments and matched area and population data accordingly, some adjustments were too complex to fully align with existing maps and data. Therefore, we had to use approximate algorithms, which might lead to some errors in the results. Second, there are limitations in the selected indicators for the division method. Considering data availability and accuracy, this study used the most classic and commonly used indicators—population density and size—to identify urbanized areas. In recent years, various new data and methods have emerged, such as network spatiotemporal big data, night-time light data, and POI data. Future research could consider combining different indicators and employing cross-validation methods to further improve the accuracy of identifying urbanized areas.
Author Contributions
Conceptualization, Y.Y., Y.T. and J.W.; methodology, Y.T. and J.W.; software, Y.T. and J.W.; validation, J.W.; formal analysis, Y.T. and J.W.; investigation, Y.Y.; resources, Y.Y.; data curation, Y.T. and J.W.; writing—original draft preparation, Y.Y. and J.W.; writing—review and editing, J.W.; visualization, Y.T. and J.W.; supervision, Y.Y.; project administration, Y.Y.; funding acquisition, Y.Y. and J.W. All authors have read and agreed to the published version of the manuscript.
Funding
This research was funded by the National Natural Science Foundation of China, grant number 72274200.
Data Availability Statement
The data presented in this study are available on request from the corresponding author due to privacy restrictions.
Conflicts of Interest
The authors declare no conflicts of interest.
References
- Zhou, Y.X.; Shi, Y. Toward establishing the concept of physical urban area in China. J. Chin. Geogr. 1995, 50, 289–301. (In Chinese) [Google Scholar]
- Qin, B.; Zhang, Y. Note on urbanization in China: Urban definitions and census data. China Econ. Rev. 2014, 30, 495–502. [Google Scholar] [CrossRef]
- Ma, L.J.C. Urban administrative restructuring, changing scale relations and local economic development in China. Political Geogr. 2005, 24, 477–497. [Google Scholar] [CrossRef]
- Long, Y. Redefining Chinese city system with emerging new data. Appl. Geogr. 2016, 75, 36–48. [Google Scholar] [CrossRef]
- Zhou, Y.X.; Ma, L.J.C. China’s urbanization levels: Reconstructing a baseline from the fifth population census. China Q. 2003, 13, 176–196. [Google Scholar] [CrossRef]
- Chen, J.; Chen, J.; Liao, A.; Cao, X.; Chen, L.; Chen, X.; He, C.; Han, G.; Peng, S.; Lu, M.; et al. Global land cover mapping at 30m resolution: A POK-based operational approach. ISPRS J. Photogramm. Remote Sens. 2015, 103, 7–27. [Google Scholar] [CrossRef]
- Gong, P.; Li, X.; Zhang, W. 40-Year (1978–2017) human settlement changes in China reflected by impervious surfaces from satellite remote sensing. Sci. Bull. 2019, 64, 756–763. [Google Scholar] [CrossRef]
- Li, X.; Gong, P.; Zhou, Y.; Wang, J.; Bai, Y.; Chen, B.; Hu, T.; Xiao, Y.; Xu, B.; Yang, J.; et al. Mapping global urban boundaries from the global artificial impervious area (GAIA) data. Environ. Res. Lett. 2020, 15, 094044. [Google Scholar] [CrossRef]
- Hu, X.; Qian, Y.; Pickett, S.T.A.; Zhou, W. Urban mapping needs up-to-date approaches to provide diverse perspectives of current urbanization: A novel attempt to map urban areas with nighttime light data. Landsc. Urban Plan. 2020, 195, 103709. [Google Scholar] [CrossRef]
- Li, F.; Yan, Q.; Bian, Z.; Liu, B.; Wu, Z. A POI and LST Adjusted NTL Urban Index for Urban Built-Up Area Extraction. Sensors 2020, 20, 2918. [Google Scholar] [CrossRef]
- Zhou, Y.; Li, X.; Asrar, G.R.; Smith, S.J.; Imhoff, M. A global record of annual urban dynamics (1992–2013) from nighttime lights. Remote Sens. Environ. 2018, 219, 206–220. [Google Scholar] [CrossRef]
- Chen, Y.; Wang, J.; Long, Y.; Zhang, X.; Li, X. Defining urban boundaries by characteristic scales. Comput. Environ. Urban Syst. 2022, 94, 101799. [Google Scholar] [CrossRef]
- Cao, W.; Dong, L.; Wu, L.; Liu, Y. Quantifying urban areas with multi-source data based on percolation theory. Remote Sens. Environ. 2020, 241, 111730. [Google Scholar] [CrossRef]
- Chen, Z.; Yeh, A.G.-O. Delineating functional urban areas in Chinese mega city regions using fine-grained population data and cellphone location data: A case of Pearl River Delta. Comput. Environ. Urban Syst. 2022, 93, 101771. [Google Scholar] [CrossRef]
- Zhang, X.; Du, S.; Zhou, Y.; Xu, Y. Extracting physical urban areas of 81 major Chinese cities from high-resolution land uses. Cities 2022, 131, 104061. [Google Scholar] [CrossRef]
- Jiang, B.; Jia, T. Zipf’s law for all the natural cities in the United States: A geospatial perspective. Int. J. Geogr. Inf. Sci. 2011, 25, 1269–1281. [Google Scholar] [CrossRef]
- Jiang, B.; Miao, Y. The Evolution of Natural Cities from the Perspective of Location-Based Social Media. Prof. Geogr. 2015, 67, 295–306. [Google Scholar] [CrossRef]
- U.S. Bureau of the Census. Urban Area Criteria for the 2010 Census; No. 2011–21647; pp. 53029–53043. Available online: https://www.federalregister.gov/documents/2011/08/24/2011-21647/urban-area-criteria-for-the-2010-census (accessed on 1 January 2024).
- MLIT. Available online: http://nlftp.mlit.go.jp/ksj/gml/datalist/KsjTmplt-A16-v2_3.html (accessed on 1 January 2024).
- Song, X.; Liu, P.; Zhou, Y. Urban and rural area divisions: Taking Shanghai as an example. Acta Geogr. Sin. 2006, 8, 787–797. (In Chinese) [Google Scholar]
- Hui, Y.; Jin, Z.; Chen, W. Study on urban-rural area division and urban population counting: The case of Changshu city. Area Res. Dev. 2009, 28, 42–46. (In Chinese) [Google Scholar]
- Jiang, M.; Xi, Q. Estimating major urbanized areas in China: A population concentration approach. Soc. Sci. China 2015, 8, 26–46. (In Chinese) [Google Scholar]
- Henderson, J.V. Efficiency of resource usage and city size. J. Urban Econ. 1986, 19, 47–70. [Google Scholar] [CrossRef]
- Dijkstra, L.; Poelman, H. Cities in Europe: The New OECD-EC Definition. Regional Focus. 2014. Available online: https://ec.europa.eu/regional_policy/en/information/publications/regional-focus/2012/cities-in-europe-the-new-oecd-ec-definition (accessed on 1 January 2024).
- Zipf, G.K. Human Behavior and the Principle of Least Effort; Addison-Wesley Press: Boston, MA, USA, 1949. [Google Scholar]
- Berry, B.J.L.; Okulicz-Kozaryn, A. The city size distribution debate: Resolution for US urban regions and megalopolitan areas. Cities 2012, 29, S17–S23. [Google Scholar] [CrossRef]
- Carroll, G.R. National city-size distributions what do we know after 67 years of research? Prog. Hum. Geogr. 1982, 6, 1–43. [Google Scholar] [CrossRef]
- Song, S.; Zhang, K.H. Urbanisation and city size distribution in China. Urban Stud. 2002, 39, 2317–2327. [Google Scholar] [CrossRef]
- Wang, J.; Chen, Y. Economic Transition and the Evolution of City-Size Distribution of China’s Urban System. Sustainability 2021, 13, 3287. [Google Scholar] [CrossRef]
- Anderson, G.; Ge, Y. The size distribution of Chinese cities. Reg. Sci. Urban Econ. 2005, 35, 756–776. [Google Scholar] [CrossRef]
- Li, X.; Nam, K.-M. One country, two “urban” systems: Focusing on bimodality in China’s city-size distribution. Ann. Reg. Sci. 2017, 59, 427–452. [Google Scholar] [CrossRef]
- Xu, Z.; Zhu, N. City size distribution in China: Are large cities dominant? Urban Stud. 2009, 46, 2159–2185. [Google Scholar] [CrossRef]
Disclaimer/Publisher’s Note: The statements, opinions and data contained in all publications are solely those of the individual author(s) and contributor(s) and not of MDPI and/or the editor(s). MDPI and/or the editor(s) disclaim responsibility for any injury to people or property resulting from any ideas, methods, instructions or products referred to in the content. |
© 2024 by the authors. Licensee MDPI, Basel, Switzerland. This article is an open access article distributed under the terms and conditions of the Creative Commons Attribution (CC BY) license (https://creativecommons.org/licenses/by/4.0/).