
Quantitative Analysis Method of the Organizational Characteristics and Typical Types of Landscape Spatial Sequences Applied with a 3D Point Cloud Model


Abstract
:1. Introduction
1.1. Theoretical Studies on Spatial Sequence
1.2. Quantitative Studies of Spatial Sequences
1.3. Application of 3D Point Cloud Data in Landscape Spatial Research
1.4. Summary
- How to obtain the overall spatial point cloud information of landscape space and extract spatial sequence models composed of units and paths?
- What factors can describe the organizational characteristics of spatial sequences?
- Can different organization types be described by factors and their threshold intervals?
2. Materials and Methods
2.1. Study Cases
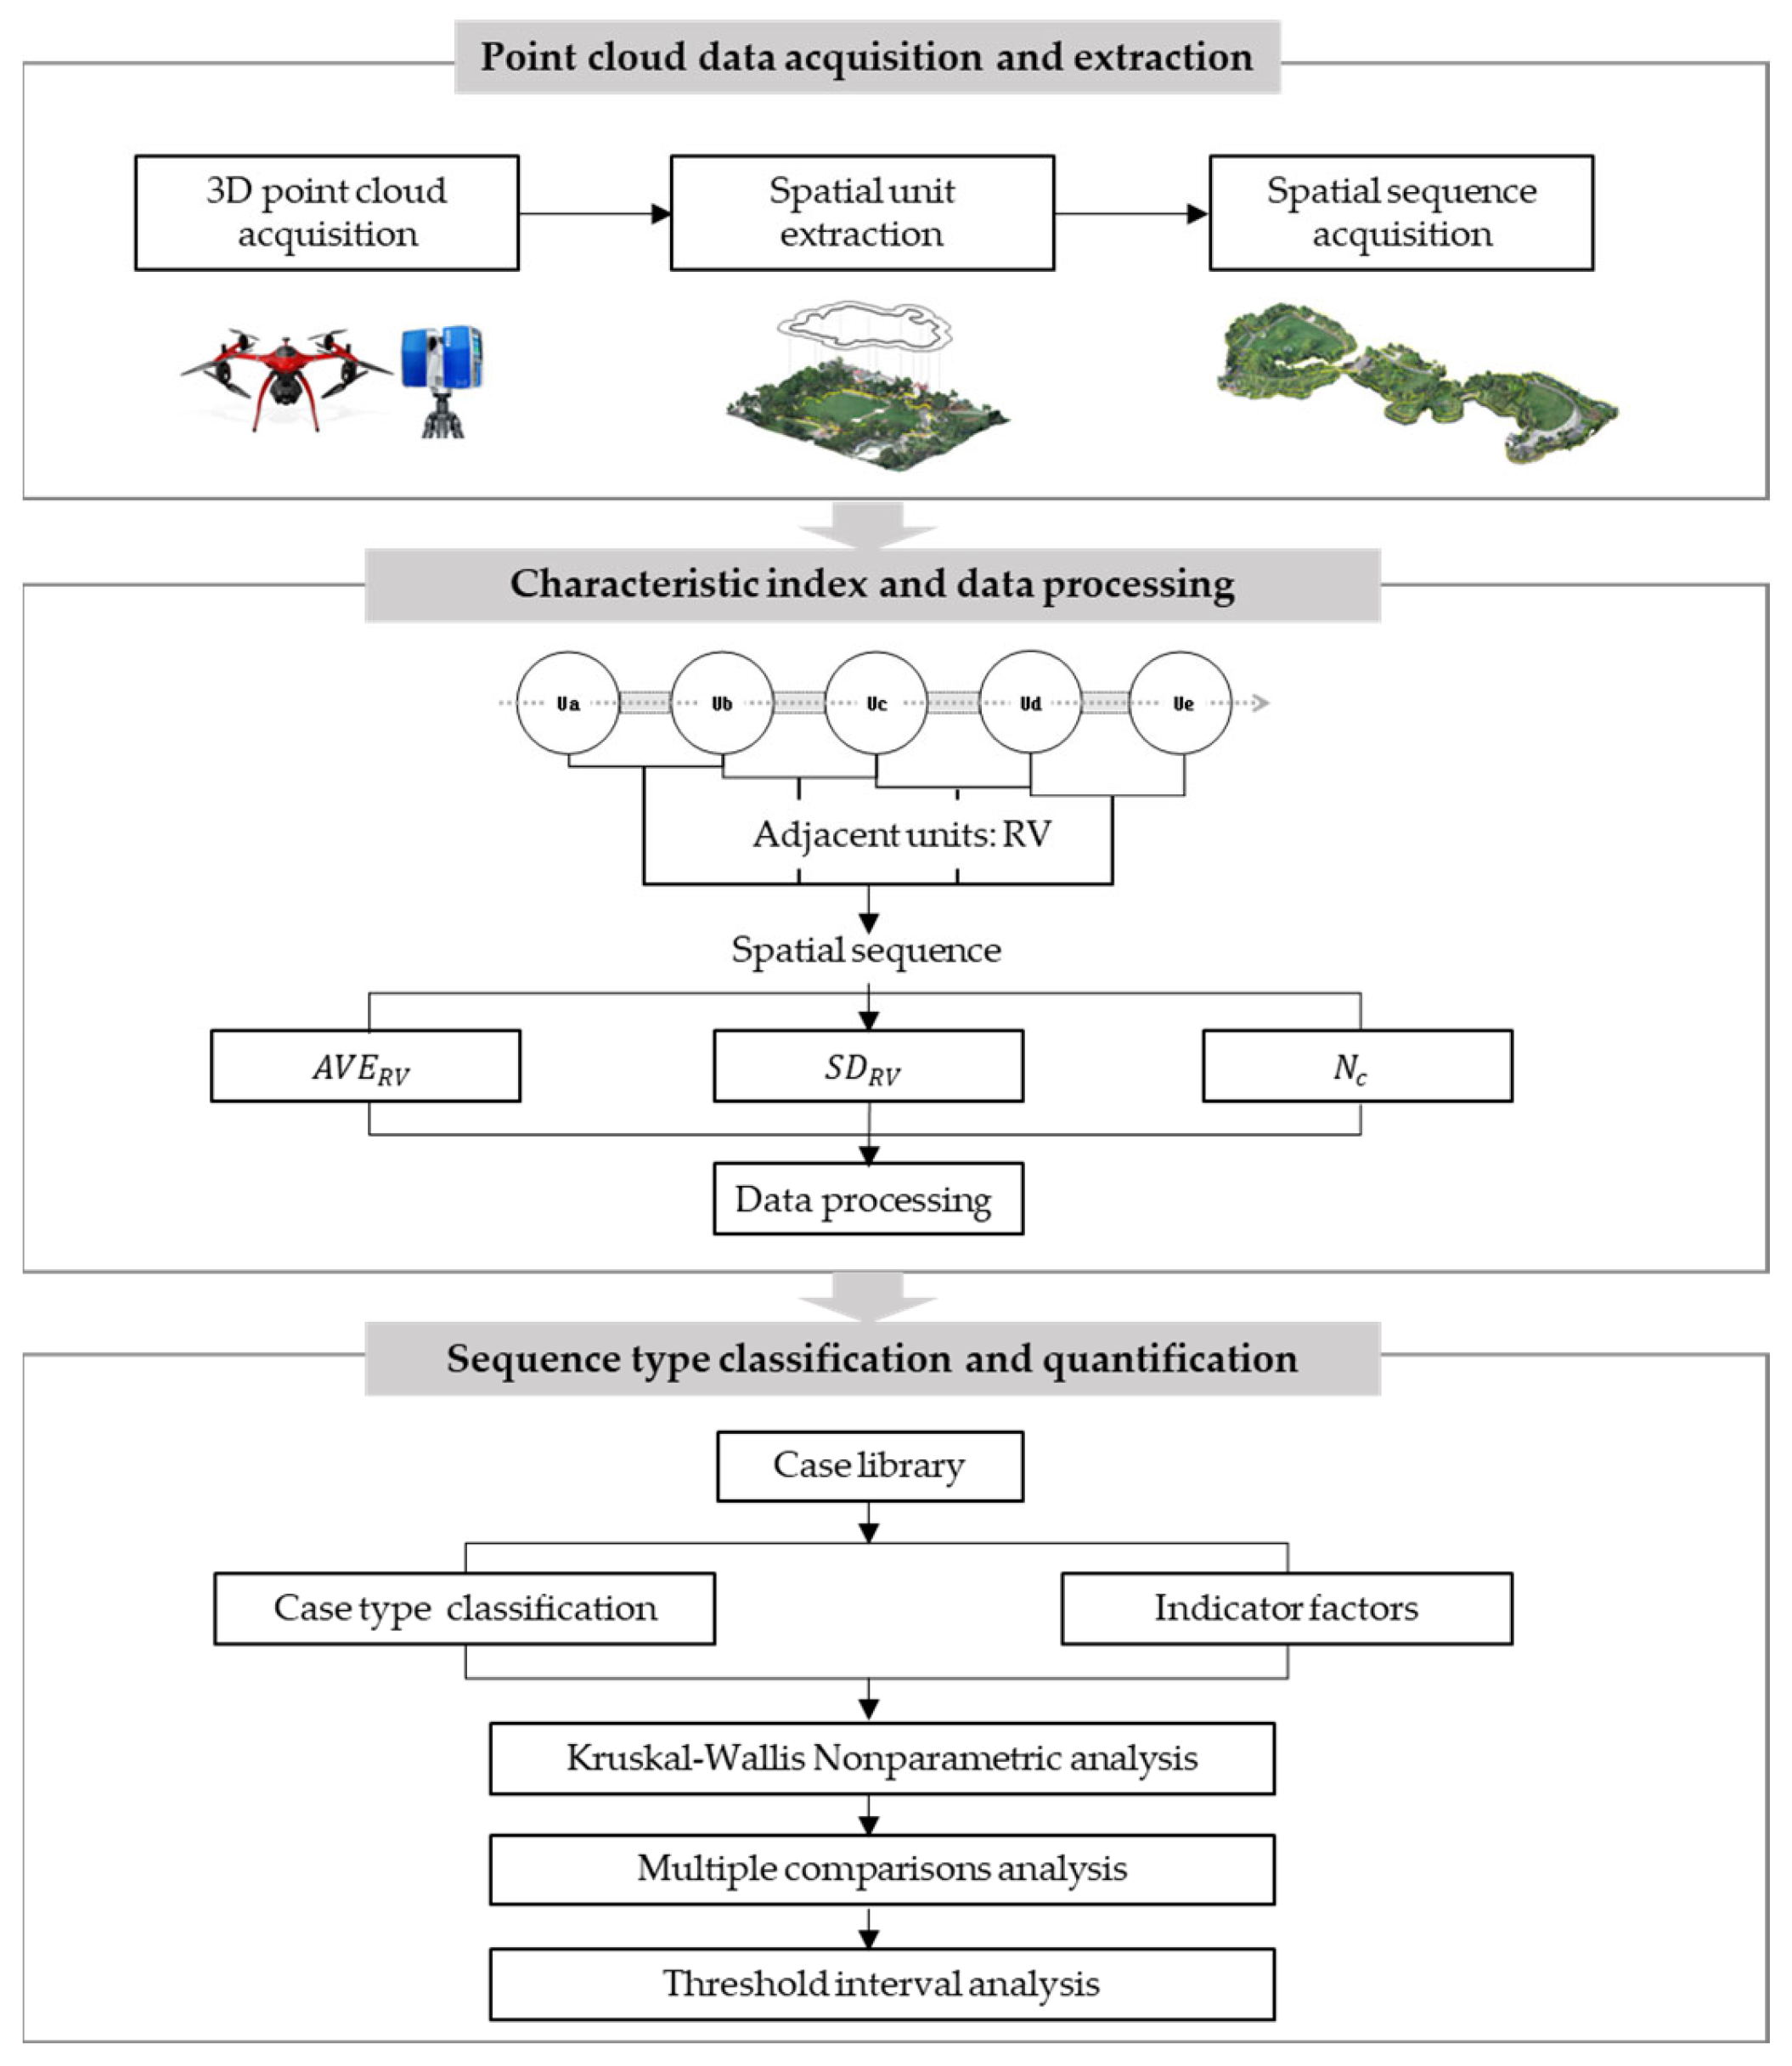
2.2. Workflow
2.3. Point Cloud Data Acquisition and Extraction
2.3.1. Overall Space Information Acquisition
2.3.2. Spatial Unit Extraction
- The internal domain of the unit can accommodate people’s activities and has an independent enclosure structure;
- It is connected by garden roads and is accessible;
- It meets the minimum external spatial modulus defined by Yoshinobu [42].
2.3.3. Spatial Sequence Acquisition
- Starting point: The space at the main and secondary park entrances is the starting point of the sequence.
- Ending point: In addition to the spaces located at the main and secondary entrances and exits of the park, nodes in the park where tourists stay for a long time or with outstanding tourism value are included.
- Path: A path developed based on the first-level and second-level park roads.
- Number of units: In this paper, the combination of 4–7 spatial units is uniformly used as the modulus for sequence extraction.
2.4. Characteristic Index and Data Processing
2.4.1. Characteristic Index for Sequence Organizational Characteristics
- RV
2.4.2. Point Cloud Data Processing and Calculation
2.5. Sequence Type Classification and Quantification
3. Application and Results
3.1. Case Data Processing
3.2. Typical Types of Landscape Spatial Sequences
- Fluctuating spatial sequence
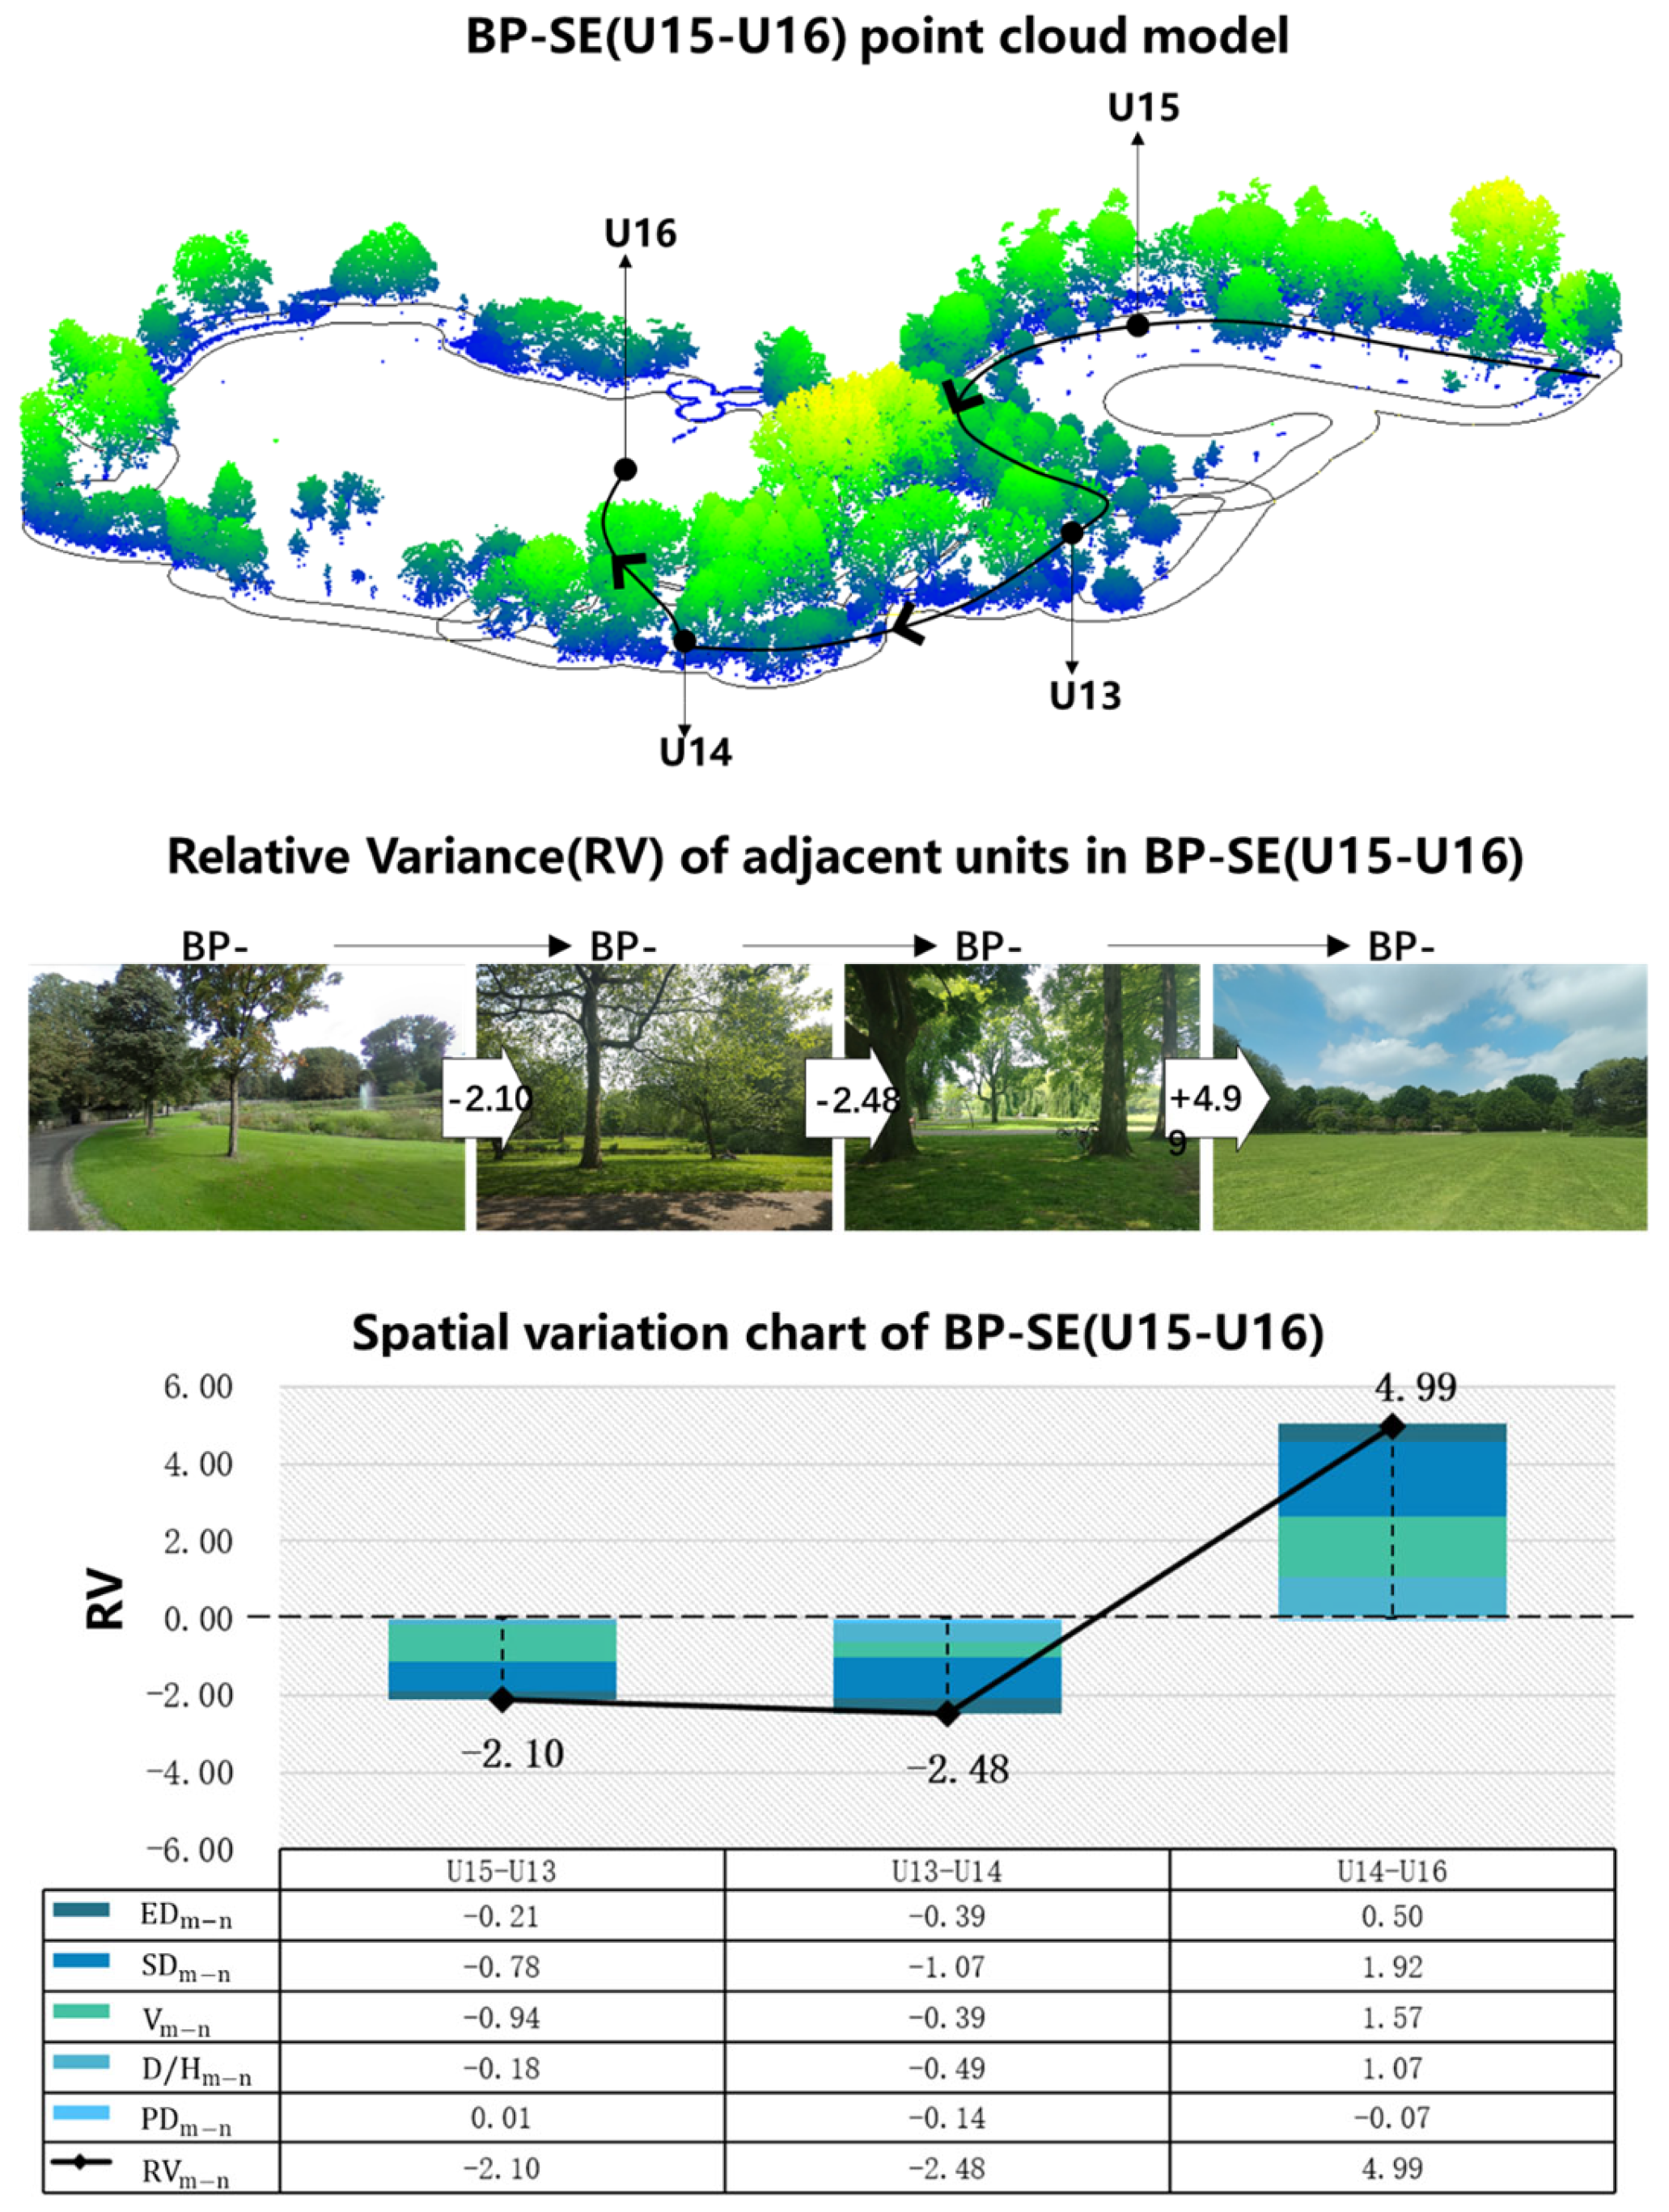
- Reversal spatial sequence
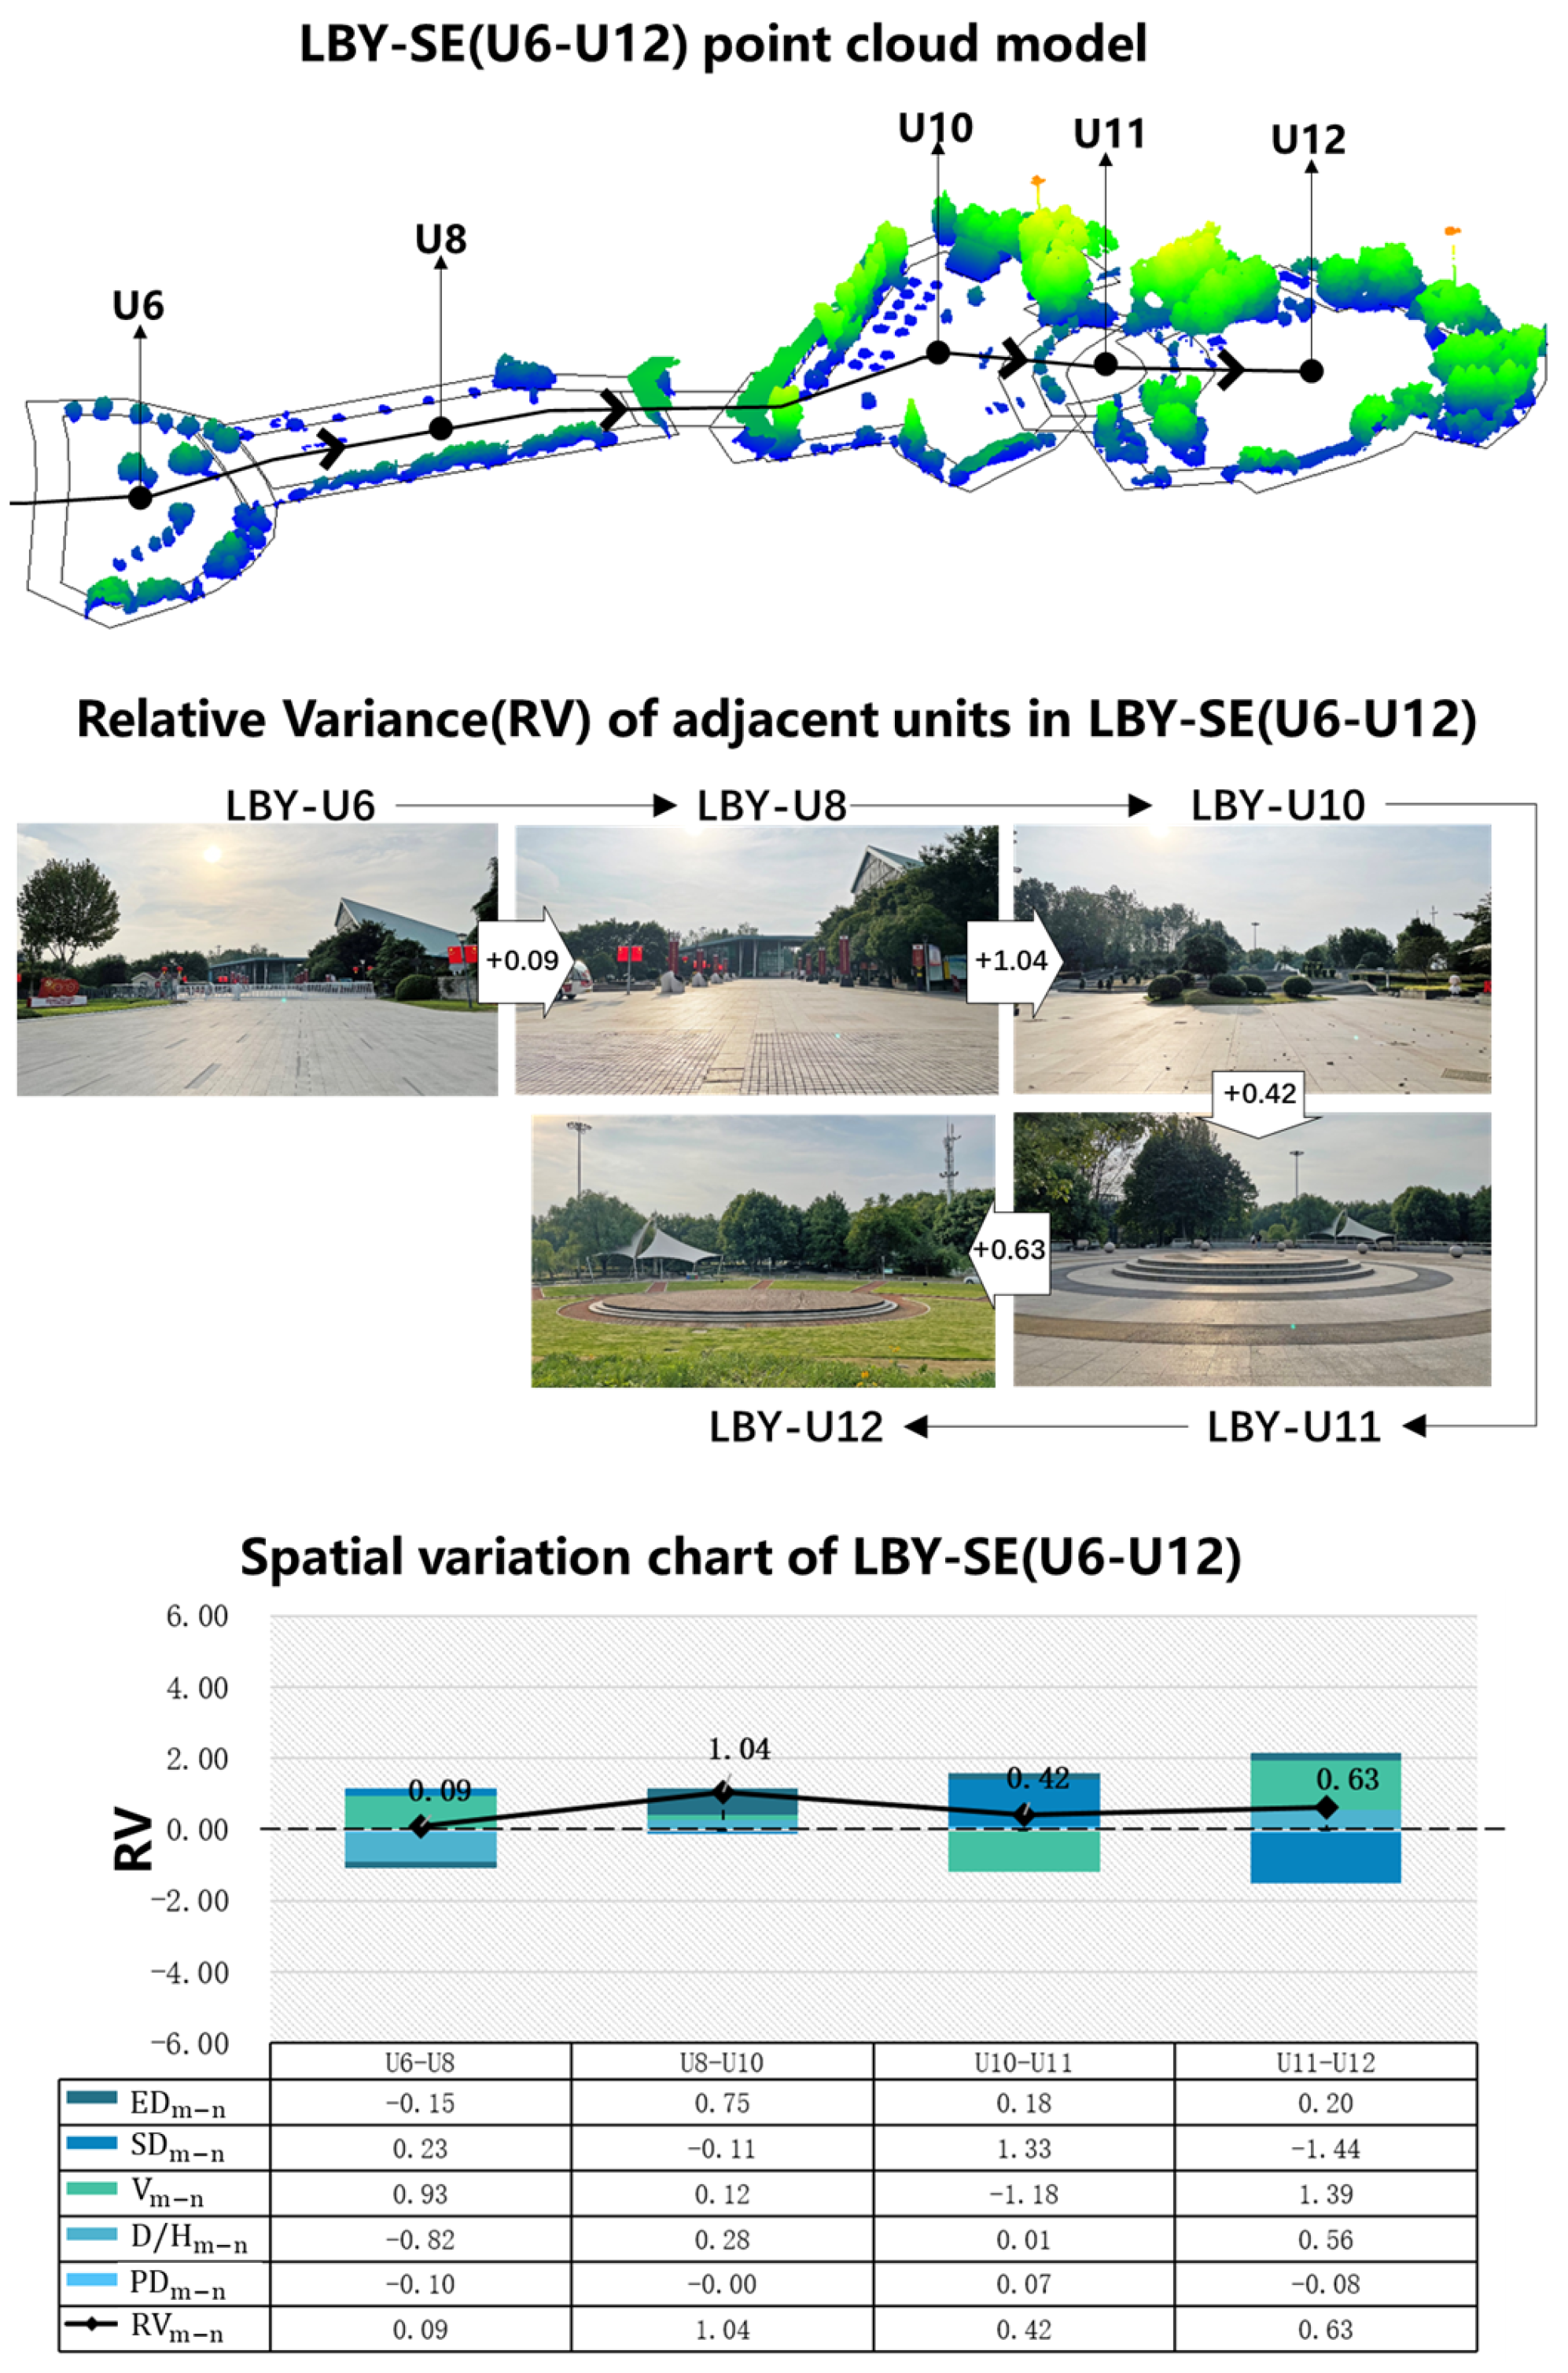
- Moderate spatial sequence
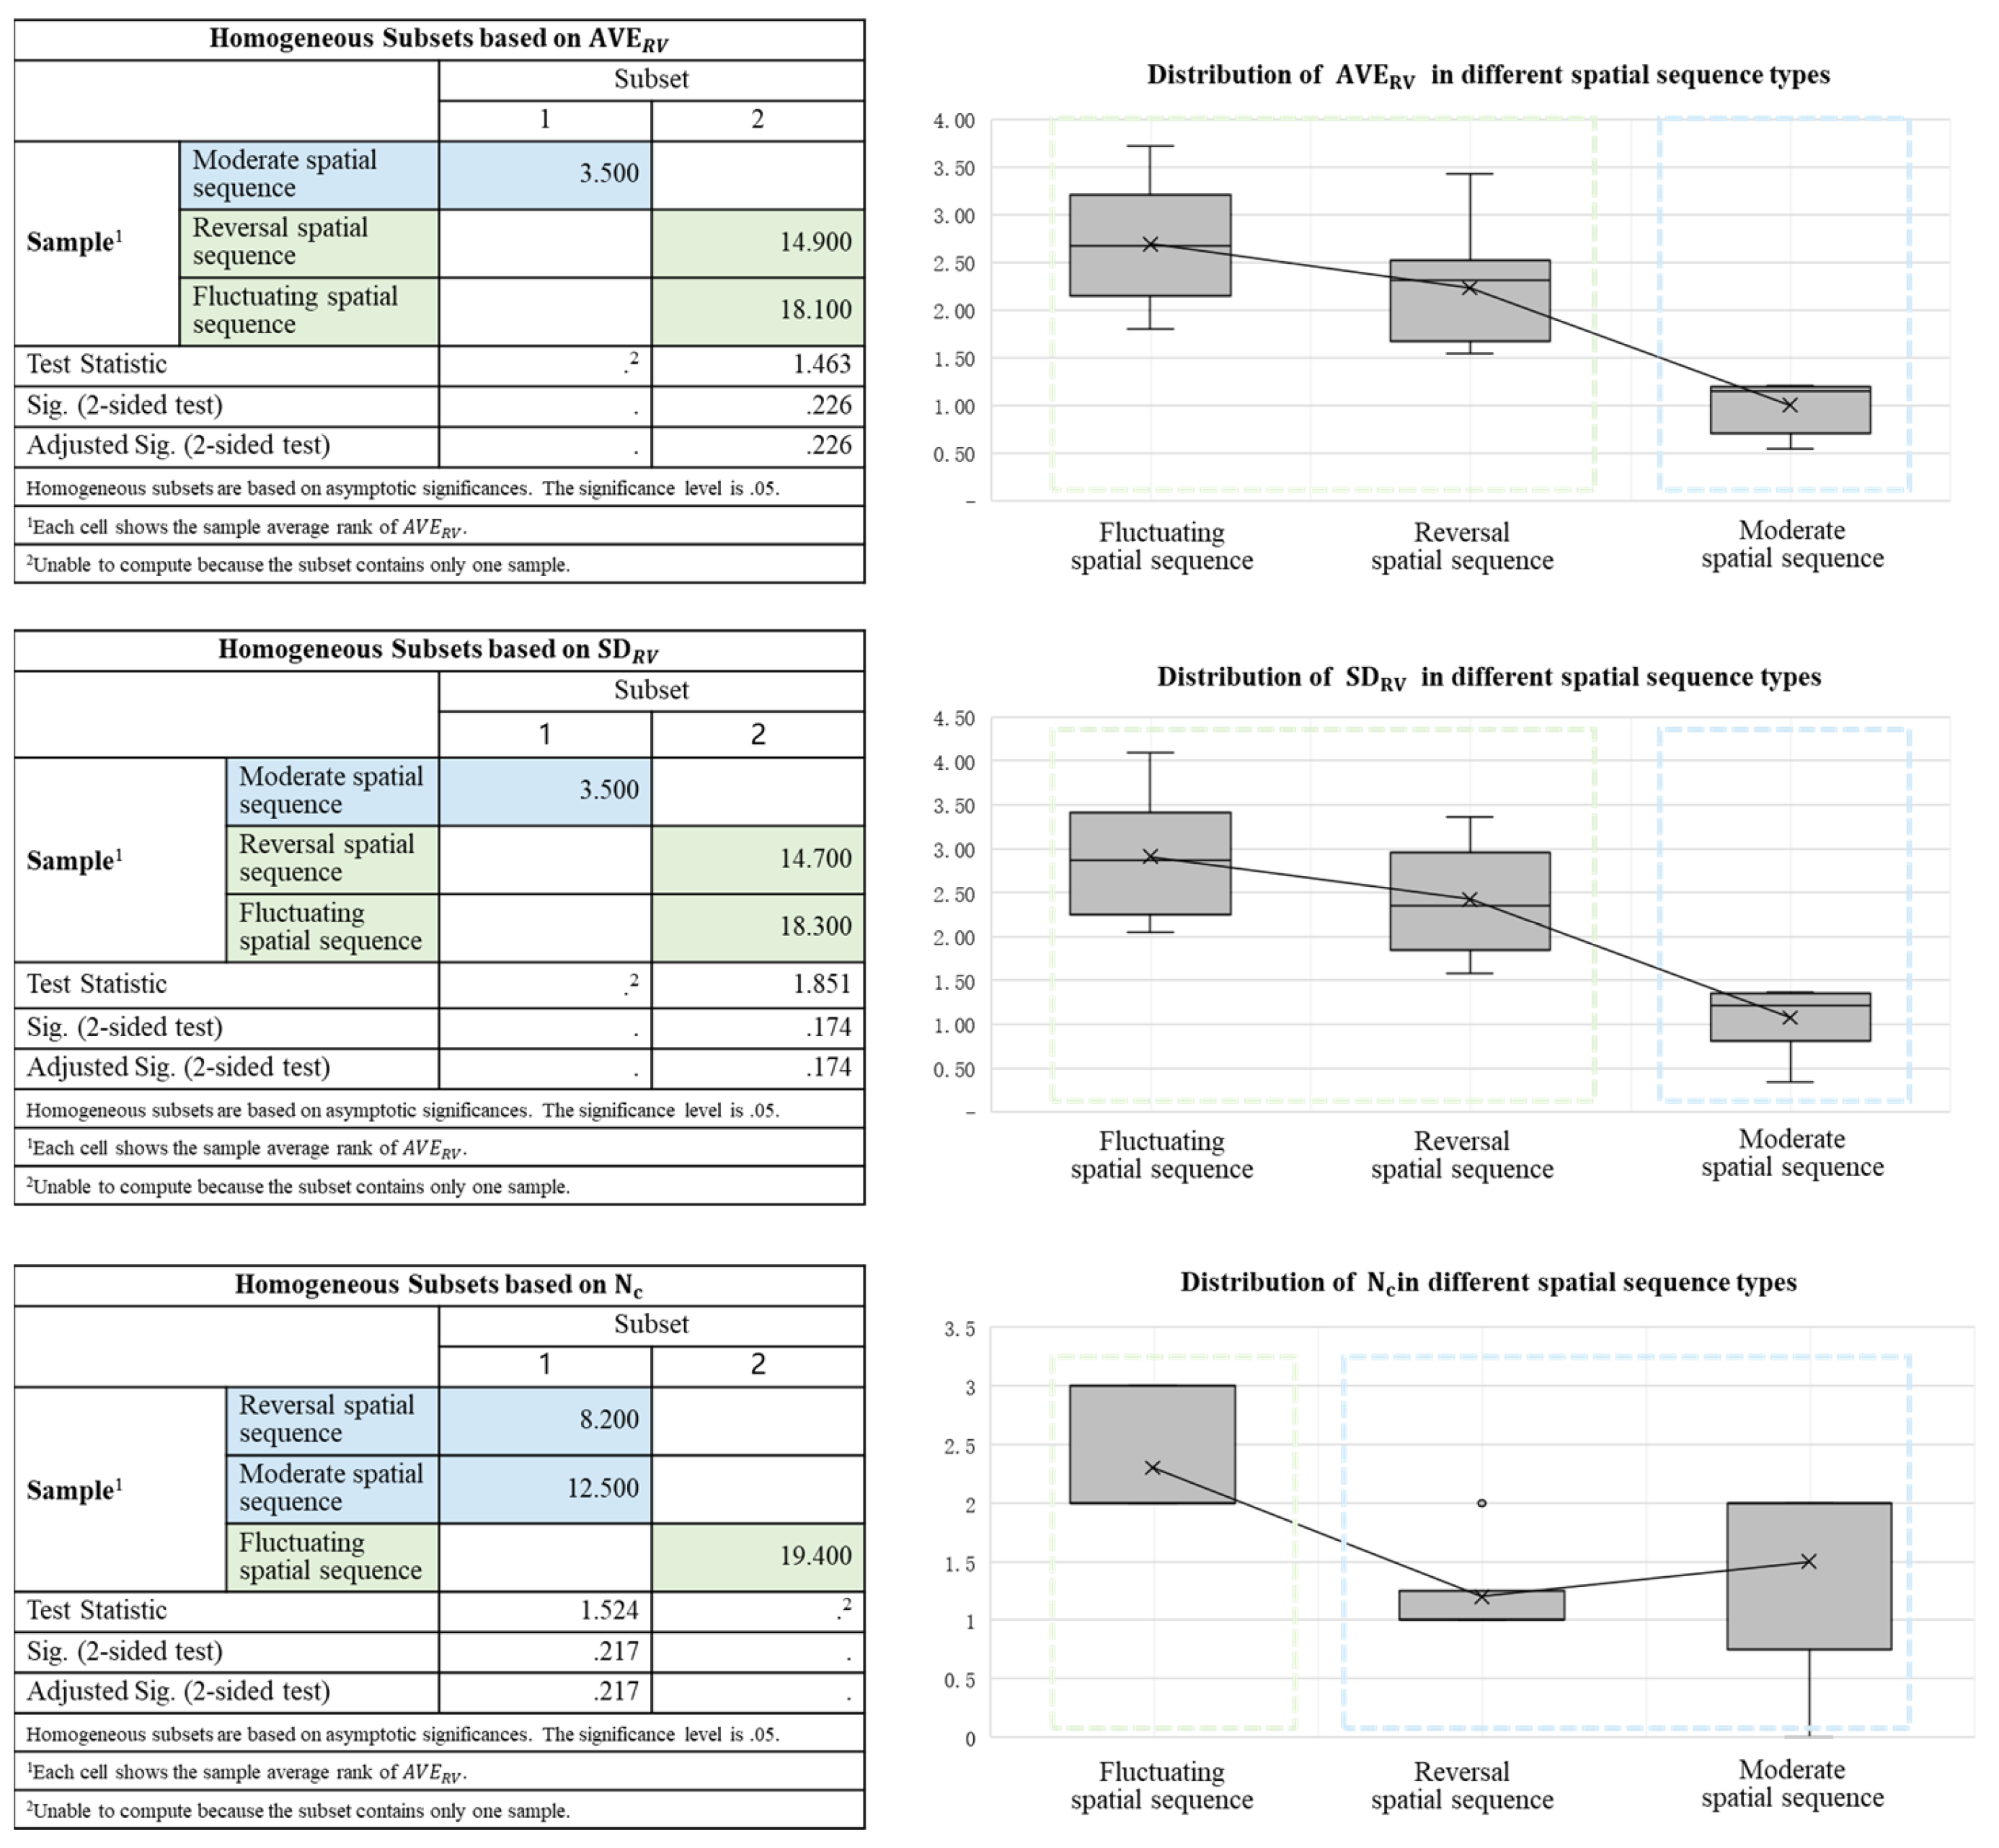
3.3. Quantitative Characterization of Typical Types
- Quantitative characterization of fluctuating spatial sequences
- Quantitative characterization of reversal sequences
- Quantitative characterization of moderate sequences
4. Conclusions
4.1. Comparison with Previous Studies
- Improved spatial data acquisition efficiency and accuracy
- Improve the comprehensiveness of the quantitative index factor system
- Improve the reliability of classification results combined with quantitative analysis methods
4.2. Implications
- Theoretical implications
- Practical implications
4.3. Limitations and Prospect
Author Contributions
Funding
Data Availability Statement
Conflicts of Interest
Appendix A

| Park Name | Number of Sequences Extracted | Sequence Names a |
|---|---|---|
| QingLv Garden | 6 | QLY-SE (U1–U8), QLY-SE (U20–U15), QLY-SE (U28–U15), QLY-SE (U20–U12), QLY-SE (U18–U12), QLY-SE (U18–U15) |
| Hexi Ecological Park | 4 | HX-SE (U2–U6), HX-SE (U10–U6), HX-SE (U14–U4), HX-SE (U12–U6) |
| Expo Park | 4 | LBY-SE (U6–U12), LBY-SE (U15–U19), LBY-SE (U22–U25), LBY-SE (U41–U38) |
| Vondel Park | 8 | VP-SE (U32–U12), VP-SE (U32–U14) a, VP-SE (U32–U14) b, VP-SE (U33–U14), VP-SE (U33–U17), VP-SE (U4–U14), VP-SE (U4–U27), VP-SE (U32–U26) |
| Rembrandt Park | 10 | RP-SE (U1–U4), RP-SE (U1–U6), RP-SE (U10–U4), RP-SE (U15–U6), RP-SE (U16–U20) a, RP-SE (U16–U20) b, RP-SE (U16–U20) c, RP-SE (U16–U32), RP-SE (U32–U20) a, RP-SE (U32–U20) b |
| Beatrix Park | 6 | BP-SE (U1–U16), BP-SE (U1–U2), BP-SE (U12–U23), BP-SE (U15–U17), BP-SE (U21–U16), BP-SE (U21–U15) |
| Ooster Park | 5 | OP-SE (U2–U10), OP-SE (U3–U13), OP-SE (U10–U2), OP-SE (U13–U2), OP-SE (U11–U2) |
| Sarphati Park | 3 | SP-SE (U1–U3), SP-SE (U4–U1) a, SP-SE (U4–U1) b |
| Morningside Park | 5 | MP-SE (U14–U2), MP-SE (U1–U2), MP-SE (U19–U14), MP-SE (U30–28), MP-SE (U29–23) |
| Constitution Gardens | 6 | CG-SE (U1–U5), CG-SE (U12–U1), CG-SE (U12–U18), CG-SE (U20–U9), CG-SE (U9–U17), CG-SE (U1–U15) |
| West Potomac Park | 5 | WPP-SE (U1–U18), WPP-SE (U1–U15), WPP-SE (U8–U18), WPP-SE (U8–U15), WPP-SE (U25–U21) |
| Gold Star Family Park | 2 | GSFP-SE (U1–U7), GSFP-SE (U13–U7) |
| Miller River Park | 2 | MRP-SE (U8–U4), MRP-SE (U5–U11) |
| Buffalo Bayou Park | 6 | BBP-SE (U1–U10), BBP-SE (U11–U17), BBP-SE (U37–U43) a, BBP-SE (U37–U43) b, BBP-SE (U47–U53), BBP-SE (U56–U51) |
References
- Robinson, N. The Planting Design Handbook, 2nd ed.; Ashgate: Hants, UK, 2007. [Google Scholar]
- Simonds, J.O.; Starke, B.W. Landscape Architecture: A Manual of Environmental Planning and Design, 5th ed.; McGraw-Hill: New York, NY, USA, 2013. [Google Scholar]
- Cheng, Y.N. The Theory and Method of Modern Landscape Design; Southeast University Press: Nanjing, China, 2010. [Google Scholar]
- Walliss, J.; Rahmann, H. Landscape Architecture and Digital Technologies: Re-Conceptualising Design and Making; Routledge: London, UK, 2016. [Google Scholar]
- Urech, P. Point-cloud modeling: Exploring a site-specific approach for landscape design. J. Digit. Landsc. Archit. 2019, 4-2019, 290–297. [Google Scholar]
- Urech, P.R.W.; Dissegna, M.A.; Girot, C.; Grêt-Regamey, A. Point cloud modeling as a bridge between landscape design and planning. Landsc. Urban Plan. 2020, 203, 103903. [Google Scholar] [CrossRef]
- Nijhuis, S.; de Vries, J. Design as research in landscape architecture. Landsc. J. 2020, 38, 87–103. [Google Scholar] [CrossRef]
- Dee, C. Form and Fabric in Landscape Architecture: An Introduction; Taylor & Francis: Oxford, UK, 2001. [Google Scholar]
- Peng, Y.G. Analysis of the Chinese Classical Garden; China Building Industry Press: Beijing, China, 1986. [Google Scholar]
- Ji, H. The Spatial Sequence Design Comparison of China and West Dynamic Landscape. Master’s Thesis, Southeast University, Nanjing, China, 2014. [Google Scholar]
- Sun, X.X. Landscape Art and Landscape Design; China Architecture & Building Press: Beijing, China, 2011. [Google Scholar]
- Yang, H.X. The Treatise on the Garden of Jiangnan; China Architecture & Building Press: Beijing, China, 2011. [Google Scholar]
- Liu, M.; Nijhuis, S. Mapping landscape spaces: Methods for understanding spatial-visual characteristics in landscape design. Environ. Impact Assess. Rev. 2020, 82, 106376. [Google Scholar] [CrossRef]
- Liu, B.Y.; Zhang, T. Landscape space sequence organization based on visual sense. Chin. Landsc. Archit. 2010, 11, 31–35. [Google Scholar]
- Lin, R.Y. Characterization Study and Optimizing Strategy on Landscape Spatial Sequence of Zhongshan Park in Wuhan Based on Visual Perception. Master’s Thesis, Huazhong University of Science and Technology, Wuhan, China, 2017. [Google Scholar]
- Yu, R.; Ostwald, M.J. Spatio-visual experience of movement through the Yuyuan Garden: A computational analysis based on isovists and visibility graphs. Front. Archit. Res. 2018, 7, 497–509. [Google Scholar] [CrossRef]
- Liu, M.; Nijhuis, S. Digital methods for mapping landscape spaces in landscape design. J. Digit. Landsc. Archit. 2020, 5, 125–161. [Google Scholar]
- Zhang, Q.H.; Zhang, Y.X. Research on the Spatial Sequence of Memorial Landscape Based on Visual Sense-A Case Study of Nanjing Yuhuatai Martyrs’ Cemetery. Chin. Landsc. Archit. 2019, 35, 55–60. [Google Scholar]
- Wang, A.D. A Comparative Study of the Spatial Sequences of Jiangnan Classical Gardens and Modern Display Buildings. Master’s Thesis, Shandong Jianzhu University, Jinan, China, 2019. [Google Scholar]
- Wang, Y.; Zlatanova, S.; Yan, J.; Huang, Z.; Cheng, Y. Exploring the relationship between spatial morphology characteristics and scenic beauty preference of landscape open space unit by using point cloud data. Environ. Plan. B Urban Anal. City Sci. 2021, 48, 1822–1840. [Google Scholar] [CrossRef]
- Austin, R.L. Elements of Planting Design; John Wiley & Sons: New York, NY, USA, 2002. [Google Scholar]
- Booth, N.K. Basic Elements of Landscape Architectural Design; Waveland Press: Long Grove, IL, USA, 1989. [Google Scholar]
- Yılmaz, S.; Özgüner, H.; Mumcu, S. An aesthetic approach to planting design in urban parks and greenspace. Landsc. Res. 2018, 43, 965–983. [Google Scholar] [CrossRef]
- Wehr, A.; Lohr, U. Airborne laser scanning—An introduction and overview. ISPRS J. Photogramm. Remote Sens. 1999, 54, 68–82. [Google Scholar] [CrossRef]
- Baltsavias, E.P. A comparison between photogrammetry and laser scanning. ISPRS J. Photogramm. Remote Sens. 1999, 54, 83–94. [Google Scholar] [CrossRef]
- Wang, Y.J.; Cheng, Y.N. Construction and analysis of 3D scene model of landscape space based on UAV oblique photography and 3D laser scanner. J. Digit. Landsc. Archit. 2018, 3, 283–290. [Google Scholar]
- Yang, C.; Han, F.; Shutter, L.; Wu, H. Capturing spatial patterns of rural landscapes with point cloud. Geogr. Res. 2020, 58, 77–93. [Google Scholar] [CrossRef]
- Jordana, T.R.; Goetcheus, C.L.; Madden, M. Point cloud mapping methods for documenting cultural landscape features at the Wormsloe State Historic Site, Savannah, Georgia, USA. Int. Arch. Photogramm. Remote Sens. Spat. Inf. Sci. 2016, 41, 277–280. [Google Scholar] [CrossRef]
- Wróżyński, R.; Pyszny, K.; Sojka, M. Quantitative landscape assessment using LiDAR and rendered 360 panoramic image. Remote Sens. 2020, 12, 386. [Google Scholar] [CrossRef]
- Tachikawa, R.; Kunii, Y. Comprehensive Quantitative Understanding of the Landscape Using Tls Point Cloud Dat. Int. Arch. Photogramm. Remote Sens. Spat. Inf. Sci. 2022, 43, 297–302. [Google Scholar] [CrossRef]
- Lin, W.; Meng, Y.; Qiu, Z.; Zhang, S.; Wu, J. Measurement and calculation of crown projection area and crown volume of individual trees based on 3D laser-scanned point-cloud data. Int. J. Remote Sens. 2017, 38, 1083–1100. [Google Scholar] [CrossRef]
- Fan, G.; Nan, L.; Chen, F.; Dong, Y.; Wang, Z.; Li, H.; Chen, D. A new quantitative approach to tree attributes estimation based on LiDAR point clouds. Remote Sens. 2020, 12, 1779. [Google Scholar] [CrossRef]
- Zhao, Y.; Wu, B.; Wu, J.; Shu, S.; Liang, H.; Liu, M.; Badenko, V.; Fedotov, A.; Yao, S.; Yu, B. Mapping 3D visibility in an urban street environment from mobile LiDAR point cloud. GIScience Remote Sens. 2020, 57, 797–812. [Google Scholar] [CrossRef]
- Zhang, G.T.; Verbree, E.; Wang, X.J. An Approach to Map Visibility in the Built Environment from Airborne LiDAR Point Clouds. IEEE Access 2021, 9, 44150–44161. [Google Scholar] [CrossRef]
- Urech, P.R.; Mughal, M.O.; Bartesaghi-Koc, C. A simulation-based design framework to iteratively analyze and shape urban landscapes using point cloud modeling. Comput. Environ. Urban Syst. 2022, 91, 101731. [Google Scholar] [CrossRef]
- Cheng, S.; Li, X.Y.; Zhang, X.H.; Wang, R.J. Preliminary Study on Microclimate Analysis Methods of Small Landscape Spaces Based on Three-dimensional Vegetation Point Cloud Data—Taking Mei’an of Southeast University as an Example. Chin. Landsc. Archit. 2022, 38, 98–103. [Google Scholar]
- Xu, H.; Wang, C.C.; Shen, X.; Zlatanova, S. 3D Tree Reconstruction in Support of Urban Microclimate Simulation: A Comprehensive Literature Review. Buildings 2021, 11, 417. [Google Scholar] [CrossRef]
- Barton, J.; Gorte, B.; Eusuf, M.S.R.S.; Zlatanova, S. A voxel-based method to estimate near-surface and elevated fuel from dense LiDAR point cloud for hazard reduction burning. ISPRS Ann. Photogramm. Remote Sens. Spat. Inf. Sci. 2020, 6, 3–10. [Google Scholar] [CrossRef]
- Hu, K.; Chen, Z.; Kang, H.; Tang, Y. 3D vision technologies for a self-developed structural external crack damage recognition robot. Autom. Constr. 2024, 159, 105262. [Google Scholar] [CrossRef]
- Zlatanova, S.; Yan, J.; Wang, Y.; Diakité, A.; Isikdag, U.; Sithole, G.; Barton, J. Spaces in Spatial Science and Urban Applications—State of the Art Review. ISPRS Int. J. Geo-Inf. 2020, 9, 58. [Google Scholar] [CrossRef]
- Wang, Y.J.; Cheng, Y.N.; Zlatanova, S.; Palazzo, E. Identification of Physical and Visual Enclosure of Landscape Space Units with the Help of Point Cloud. Spat. Cogn. Comput. 2020, 20, 257–279. [Google Scholar] [CrossRef]
- Yoshinobu, A. Exterior Design in Architecture; Van Nostrand Reinhold: New York, NY, USA, 1970. [Google Scholar]


| Park Name | Abbr. | Location | Area (ha) |
|---|---|---|---|
| QingLv Garden | QLY | Nanjing | 26.97 |
| Hexi Ecological Park | HX | Nanjing | 22.12 |
| Expo Park | LBY | Nanjing | 67.22 |
| Vondel Park | VP | Amsterdam | 44.92 |
| Rembrandt Park | RP | Amsterdam | 48.27 |
| Beatrix Park | BP | Amsterdam | 28.40 |
| Ooster Park | OP | Amsterdam | 11.65 |
| Sarphati Park | SP | Amsterdam | 5.02 |
| Morningside Park | MP | New York | 20.63 |
| Constitution Gardens | CG | Washington D.C. | 19.93 |
| West Potomac Park | WPP | Washington D.C. | 68.34 |
| Gold Star Family Park | GSFP | Chicago | 5.15 |
| Miller River Park | MRP | Stamford | 7.76 |
| Buffalo Bayou Park | BBP | Houston | 72.32 |
| Spatial Sequence Types | Cases a |
|---|---|
| Fluctuating spatial sequence | HX-SE (U6–U10), QLY-SE (U1–U8), RP-SE (U1–U4), BP-SE (U21–U15), SP-SE (U1–U3), VP-SE (U32–U12), VP-SE (U32–U14) b, BBP-SE (U1–U10), CG-SE (U12–U1), MP-SE (U1–U2) |
| Reversal spatial sequence | LBY-SE (U41–U38), RP-SE (U10–U4), RP-SE (U16–U20) a, RP-SE (U32–U20) b, BP-SE (U1–U16), BP-SE (U12–U23), BP-SE (U15–U16), OP-SE (U13–U2), GSFP-SE (U13–U7), WPP-SE (U8–U18) |
| Moderate spatial sequence | LBY-SE (U15–U19), LBY-SE (U6–U12), BP-SE (U1–U2), MP-SE (U19–U14), MP-SE (U30–U28), MP-SE (U29–U23) |
| Kruskal–Wallis H(K) | 13.03 | 14.57 | 14.44 |
| Asymp. Sig. | 0.001 | 0.001 | 0.001 |
| Fluctuating spatial sequence | [1.54, 3.68] | [1.59, 4.03] | [2, 3] |
| Reversal spatial sequence | [0, 2] | ||
| Moderate spatial sequence | [0.54, 1.21] | [0.35, 1.37] |
Disclaimer/Publisher’s Note: The statements, opinions and data contained in all publications are solely those of the individual author(s) and contributor(s) and not of MDPI and/or the editor(s). MDPI and/or the editor(s) disclaim responsibility for any injury to people or property resulting from any ideas, methods, instructions or products referred to in the content. |
© 2024 by the authors. Licensee MDPI, Basel, Switzerland. This article is an open access article distributed under the terms and conditions of the Creative Commons Attribution (CC BY) license (https://creativecommons.org/licenses/by/4.0/).
Share and Cite
Wang, Y.; Cheng, Y.; Zlatanova, S.; Cheng, S. Quantitative Analysis Method of the Organizational Characteristics and Typical Types of Landscape Spatial Sequences Applied with a 3D Point Cloud Model. Land 2024, 13, 770. https://doi.org/10.3390/land13060770
Wang Y, Cheng Y, Zlatanova S, Cheng S. Quantitative Analysis Method of the Organizational Characteristics and Typical Types of Landscape Spatial Sequences Applied with a 3D Point Cloud Model. Land. 2024; 13(6):770. https://doi.org/10.3390/land13060770
Chicago/Turabian StyleWang, Yijing, Yuning Cheng, Sisi Zlatanova, and Shi Cheng. 2024. "Quantitative Analysis Method of the Organizational Characteristics and Typical Types of Landscape Spatial Sequences Applied with a 3D Point Cloud Model" Land 13, no. 6: 770. https://doi.org/10.3390/land13060770