Article

Distribution and Variation of Soil Water and Salt before and after Autumn Irrigation

1
College of Water Conservancy and Civil Engineering, Inner Mongolia Agricultural University, Hohhot 010018, China
2
Department of Water Conservancy and Civil Engineering, Hetao College, Bayannur 015000, China
3
Urat Sub-Center, Inner Mongolia Hetao Irrigation District Water Conservancy Development Centre, Bayannur 014400, China
4
Water Conservancy Research Institute of Bayannur City, Bayannur 015000, China
5
School of Materials Science and Engineering, Beihang University, Beijing 100191, China
*
Authors to whom correspondence should be addressed.
Land 2024, 13(6), 773; https://doi.org/10.3390/land13060773
Submission received: 23 March 2024 / Revised: 28 April 2024 / Accepted: 27 May 2024 / Published: 30 May 2024
(This article belongs to the Special Issue Salinity Monitoring and Modelling at Different Scales)

Abstract

:
Autumn irrigation is a key measure for alleviating soil salinity and promoting sustainable agricultural development in the Hetao Irrigation district; however, only a part of farmland is irrigated in autumn during the non-growth period of crops, which leads to the redistribution of soil water and salt between autumn-irrigated land (AIL) and adjacent non-autumn-irrigated land (NAIL) after autumn irrigation. To explore the distribution and variation of soil water and salt in different positions of AIL and NAIL after local autumn irrigation and reveal the interaction range between AIL and NAIL, field experiments were carried out for two years in typical test areas. The results showed that compared with non-autumn irrigation, autumn irrigation improved the distribution uniformity of soil water and salt profiles in both horizontal and vertical directions; after autumn irrigation, the water content of the soil at the nearest sampling point to the boundary in the AIL increased the least, but the desalination rate was the greatest, while the water and salt contents of the soil within 45 m from the sampling points to the boundary in the NAIL both increased significantly. NAIL received the drainage of AIL and made the groundwater level after the rise in AIL fell quickly back, but unreasonable autumn irrigation caused the groundwater level of AIL to remain at a high level before freezing, exacerbating the risk of groundwater carrying salts to the surface soil during the freezing and thawing period, detrimental to the growth of crops in the next spring. The research results are of great significance to the rational use of farmland water resources and the improvement of soil salinization in cold and dry areas.

1. Introduction

Irrigation is a major use of water in agriculture. Thus far, about 70% of freshwater on Earth is used for agriculture, of which about 90% is used for irrigation [1,2]. In arid and semi-arid regions with insufficient precipitation, irrigation is essential to agricultural productivity. It can not only meet the water demand of crops, increase food production, and provide possibilities for regional and even global food security but also increase farmers’ income, improve agricultural profitability, and promote economic prosperity [3,4,5]. However, the use of saline irrigation water and chemical fertilizers increases soil salinity, and, combined with improper irrigation water and drainage practices, this usually results in increased soil salinization, threatening crop growth and reducing agricultural productivity [6,7]. According to statistics, more than 20% of irrigated land worldwide is impacted by soil salinization, and the total loss caused by irrigation-related salinity is USD 27.3 billion per year. If left unattended, by 2025, the global irrigation area threatened by soil salinization may expand to more than 50% [8,9,10]. Therefore, a correct and profound understanding of the problem of soil salinization brought on by irrigation is essential for achieving sustainable agricultural development.
The Hetao Irrigation District (HID) is one of the largest irrigation districts in China, with an irrigated area of 570,000 ha, and it is an important grain and oil production base in the country. Surface water flood irrigation is the common irrigation method for the region, but, due to its location in arid and semi-arid regions, extremely high evaporation precipitation ratios (about 10:1), shallow water table depths (the average annual groundwater level is 1.5–2 m), long-term irrigation from the Yellow River (the average amount of annual total dissolved salts in irrigation water is 0.5 g/L), and imperfect drainage systems result in the severe salinization of soil in the root zone [11]. In order to reduce the harm of soil salinization in the root zone to the growth of crops in the following year and adjust the soil moisture in the field, every year, after harvesting the crops in the autumn and before the soil freezes, the irrigation district uses water flood irrigation via the Yellow River to leach out the soil salinity in the root zone. After a long period of production practice, autumn irrigation has become an important local irrigation method [12,13]. However, due to the wide range of autumn irrigation methods, irrigation period concentration (October–November each year), and the large irrigation quota (approximately one-third of annual water consumption), there has been a sharp increase in groundwater levels after irrigation. In the case of poor drainage conditions, groundwater levels easily remain high for a long time before freezing, which, in turn, leads to the secondary salinization of soil and affects the spring sowing of crops in the following year [14,15,16].
Dry drainage (also known as internal drainage) is a method that can alleviate secondary soil salinization in irrigated farmland. This method mainly discharges excess water and salt from irrigated land to nearby fallow land (fallow land is land that has been permanently or seasonally fallowed) through groundwater flow and then consumes water in the soil under evaporation, while salt is stored in fallow land [17]. Compared with traditional artificial drainage, this method has more advantages in cost and environmental protection [18]. In the past 30 years, dry drainage has been widely used in Pakistan, Iran, and China [19,20,21]. Wu et al. [22] studied the effectiveness of dry drainage using a combination of remote sensing, a conceptual model, and field experiments in HID and observed that excess water and salt in the irrigated land migrating to the fallow land through groundwater and dry drainage was effective in controlling salt levels in the irrigated land. However, the effect of dry drainage is easily affected by climatic conditions, the ratio of irrigated land to fallow land, and the evaporation capacity of the land. To further prove the effectiveness of dry drainage [23,24], Wang et al. [25] conducted field observations for five years in a 2900 ha experimental field at Yonglian Experimental Station in HID and found that fallow land received excess water and salt from the surrounding irrigated cropland. Moreover, the salt content of the soil profile increased significantly, and the salt accumulation of irrigated cropland exhibited an accelerating trend with the weakening of the evaporative capacity of fallow land. Liu et al. [26] investigated the water–salt migration between cropland and adjacent wasteland during the growing season in HID, and the results showed that during the irrigation period, irrigation (and precipitation) promoted the flow of water and salt from cropland to wasteland. However, during the intervals of irrigation, when the evapotranspiration of farmland was greater than that of wasteland, the lateral water and salt flux was reversed. Although the above scholars revealed water and salt movement between irrigated and fallow lands at different scales, these studies were conducted under fully irrigated conditions (full irrigation means that all cropped lands are irrigated).
In recent years, due to the national directive on water conservation, the average annual water diversion of HID has been reduced from 5.2 billion m3 to 4.0 billion m3, based on which, the irrigation district has adopted the measure of “partial autumn irrigation”, which mainly means that farmlands planted with late-season crops, such as sunflower, are not irrigated in autumn seasons, but are irrigated in spring after the soil melts the following year [27,28]. Simultaneously, influenced by the planting structure and farmers’ willingness, the area of non-autumn-irrigated land (NAIL) is increasing, while the area of autumn-irrigated land (AIL) is relatively decreasing. AIL and NAIL are adjacent to each other and distributed in an interleaved manner [29]. To a certain extent, the working principle of NAIL is similar to that of fallow land under full irrigation. After irrigation, NAIL can receive drainage from surrounding irrigated land, causing the water table in the nearby irrigated land to fall back quickly, but, because the NAIL will be irrigated in the spring during the following year, drainage water durations are much shorter compared to fallow land. Peng et al. [30] studied the characteristics of water–salt movement in farmland after local autumn irrigation conditions in HID and found that the salts that were washed out of the AIL entered the NAIL through the flow of groundwater, increasing soil salt content in the NAIL. Although the study revealed that water–salt movement between AIL and NAIL was influenced by the proportion of AIL in the whole region, the scope of the interaction of water–salt movement between AIL and NAIL was not clear. Therefore, the objective of this study was as follows: to monitor changes in soil moisture, salinity, and groundwater in different positions of AIL and NAIL before and after autumn irrigation; quantitatively analyze the redistribution of water and salinity in different locations of AIL and NAIL and the distance of interaction; and reveal the scope of mutual influence between AIL and NAIL to provide scientific information for the better management of irrigation water and the control of soil salinization in the future.
In response to the current situation of autumn irrigation in HID, we conducted field monitoring of water and salt distributions at different distances between AIL and nearby ANIL. Our objectives were to (1) reveal the distribution of and changes in soil water and salt at different distances between AIL and NAIL before and after autumn irrigation, (2) find the distances at which AIL and NAIL interacted with each other under dry drainage conditions, and (3) provide a theoretical basis for rational autumn irrigation and soil salinization prevention.

2. Materials and Methods

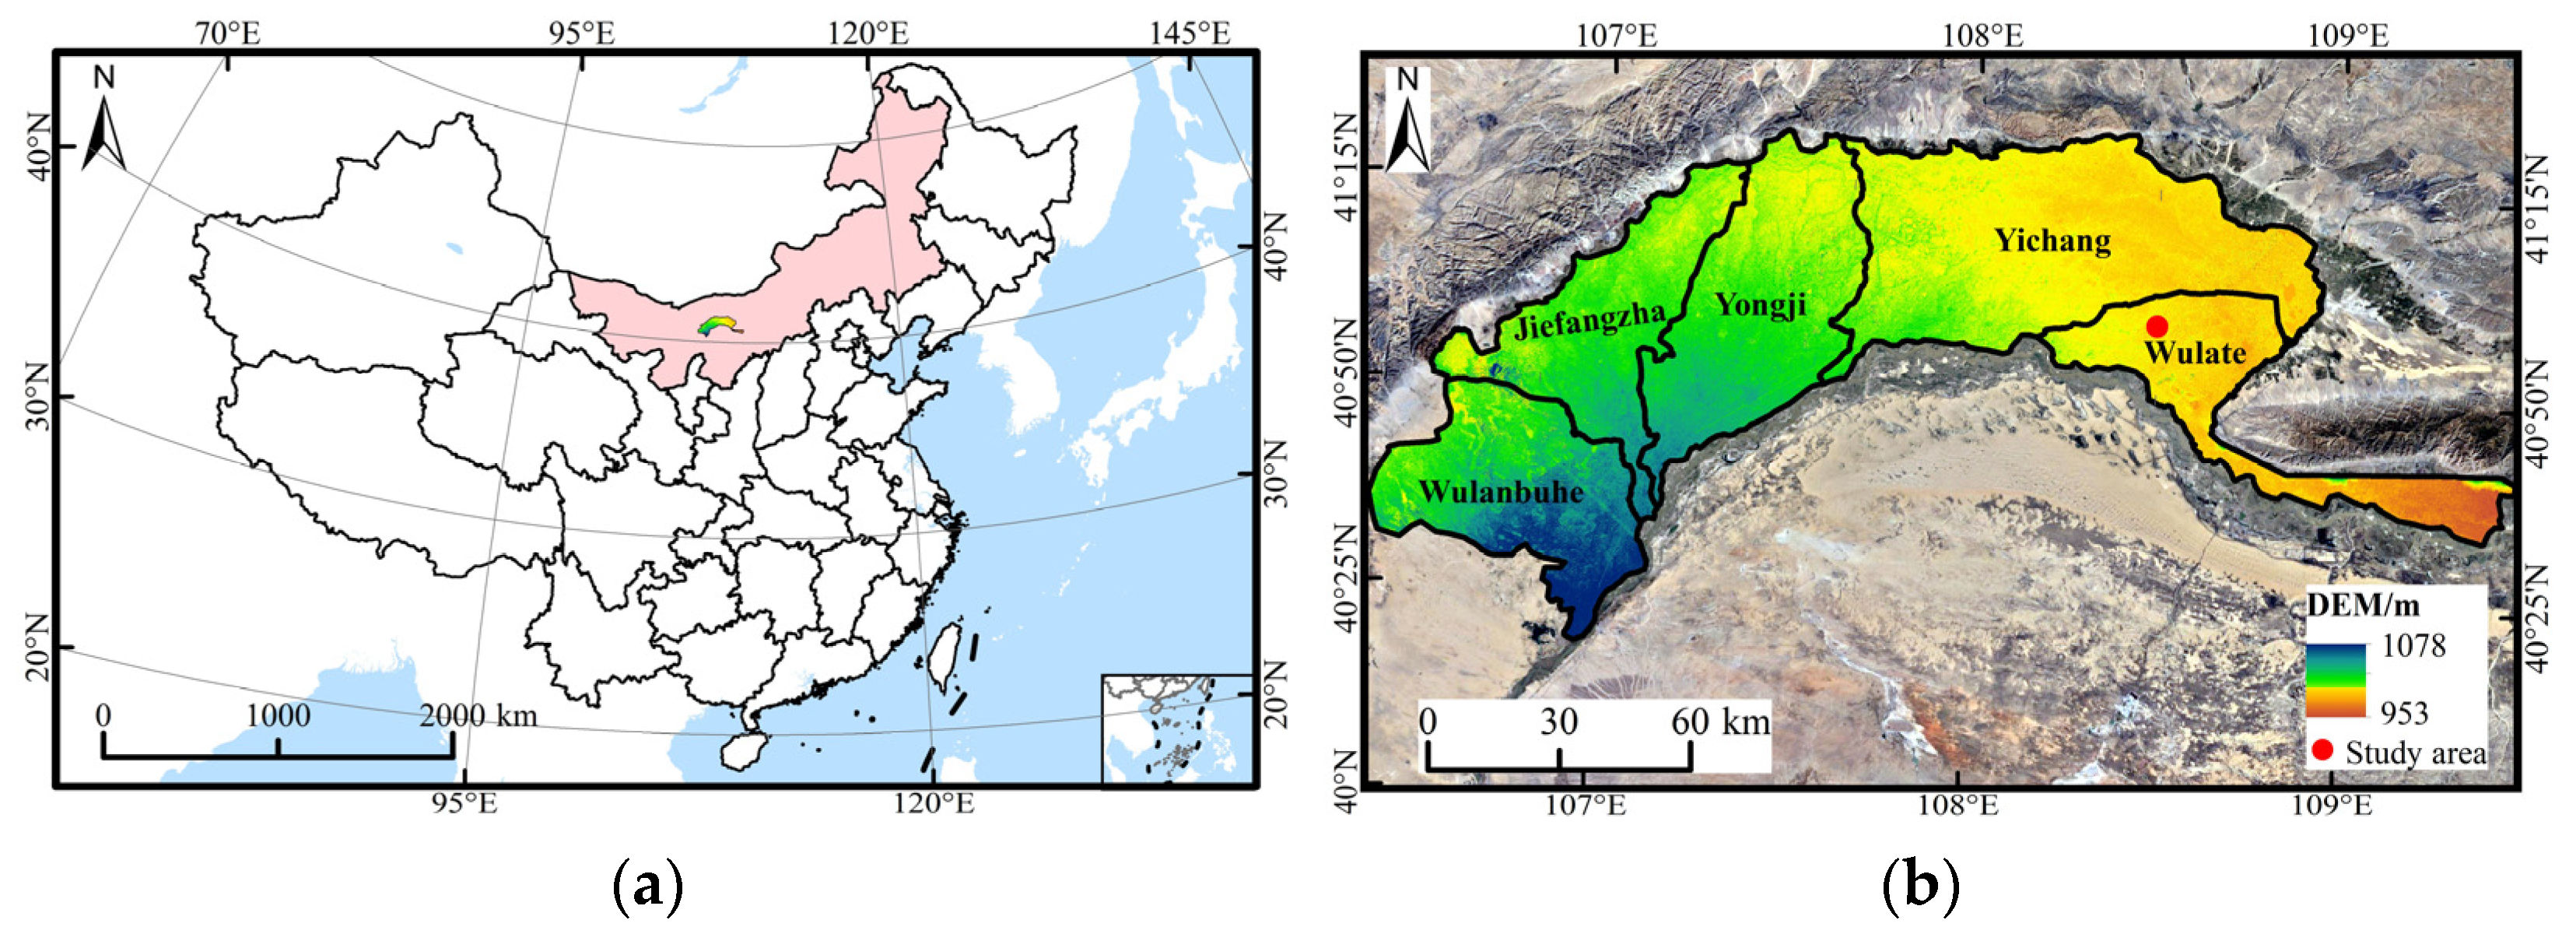
2.1. Study Area Description

The study area (40°55′04′′ N, 108°30′29′′ E, 985.9 m) is located in Xixiaozhao Town, UradQianqi, Bayannur City, Inner Mongolia Autonomous Region, China, and belongs to the Wulate Irrigation District of HID (Figure 1a,b). Its climate is classified as follows: mid-temperate continental climate, dry and windy weather, sufficient sunshine, less precipitation, substantial evaporation, and a short frost-free period. The annual mean temperature of the research region is 6~8 °C; the average wind speed is 2.8 m/s; the average sunshine hours is 3202 h; the annual precipitation is 200~250 mm, with the majority falling between June and September (accounting for 79% of the annual precipitation); the annual pan evaporation (E20) is 2173 mm [31]; the frost-free period is about 130 d; the annual average groundwater depth is 1.8 m; and the maximum freezing depth is 1 m [32]. The soil texture of the 0~200 cm soil stratum is mainly sandy loam, silty loam, and loamy sand. The specific physical properties are shown in Table 1. The soil bulk density was determined via the ring knife method. Soil texture was determined using a HELOS & RODOS fully automated dry particle size analyzer (Sympatec GmbH, Dresden, Germany) to measure soil particle gradation, in accordance with the soil texture triangle map of the United States Department of Agriculture [33].

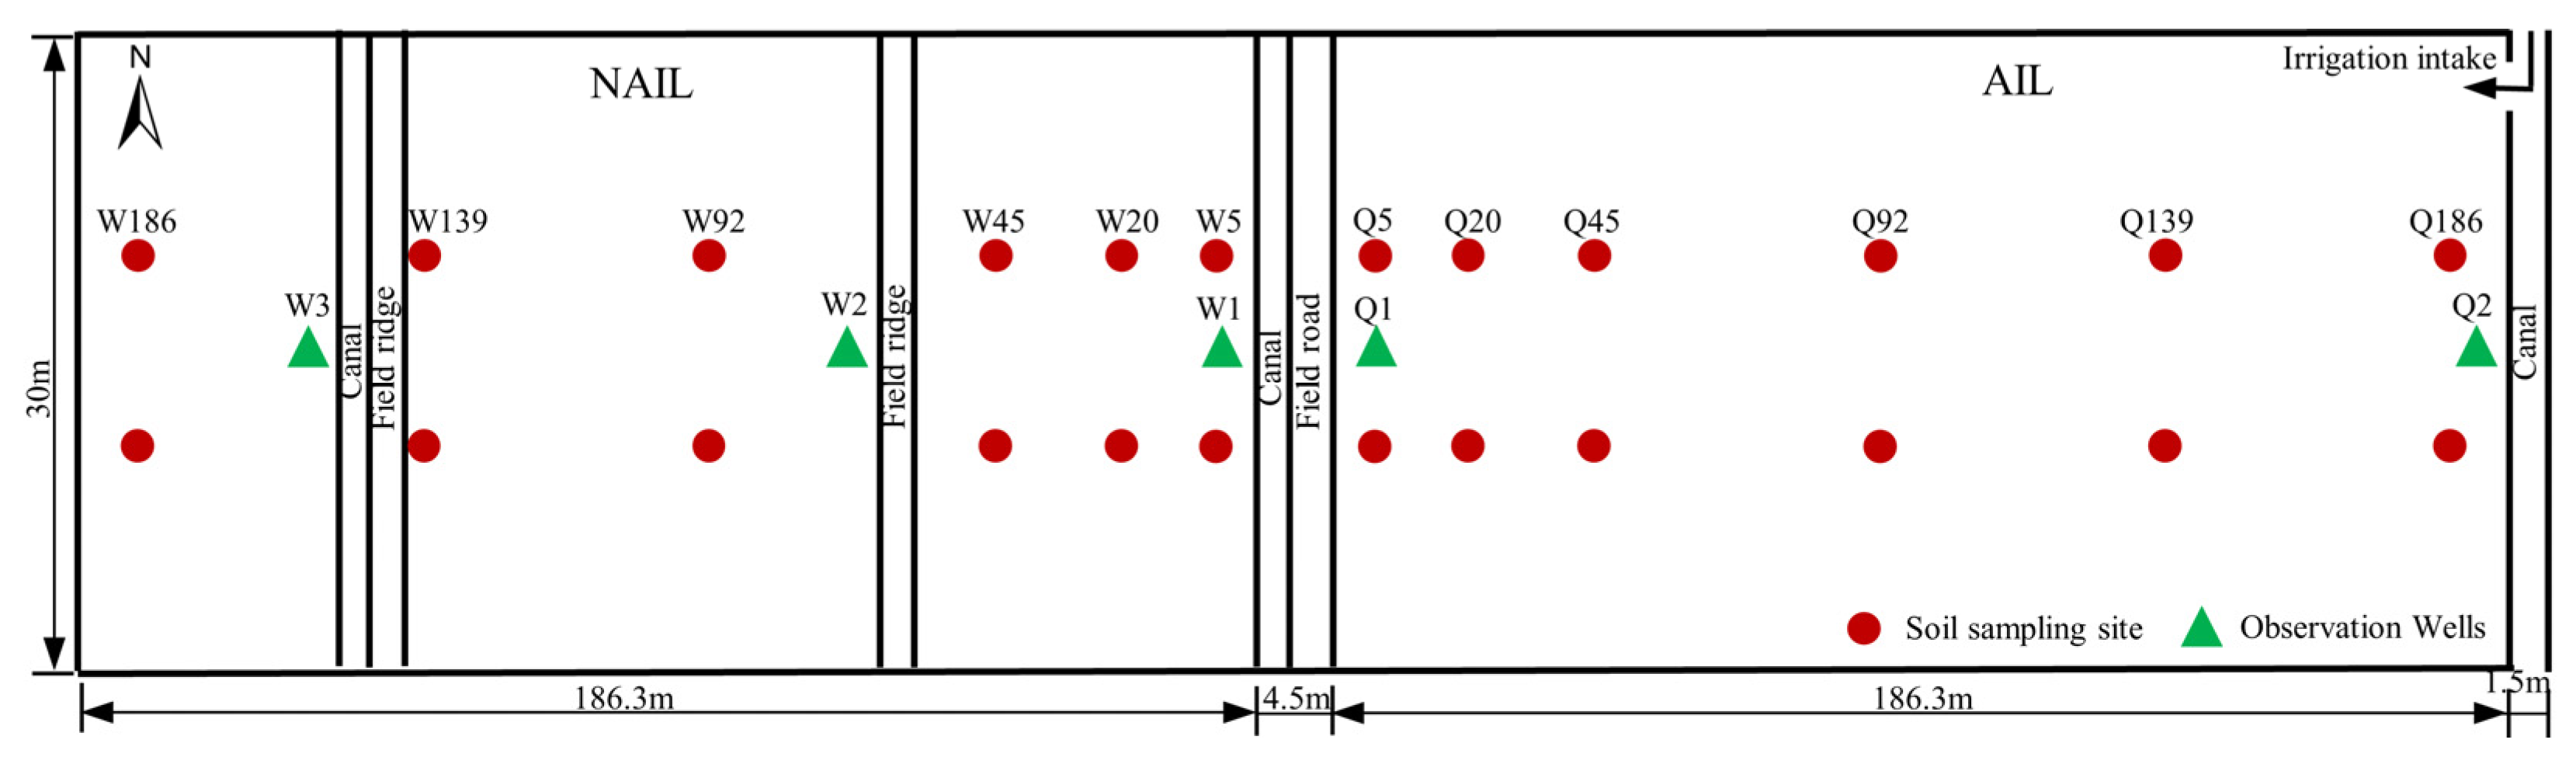
2.2. Experimental Design

The fields adjacent to the AIL and NAIL were selected as the test area and tested from October to December 2021 and October to December 2022. The east side of the test area belongs to Huaimu Village, which comprises AIL, and the west side belongs to Beigedu Village, which comprises NAIL. AIL and NAIL are separated by the agricultural canal and the field road (Figure 2). The average ground elevation of the test area was 985.89 m. The ground elevation of the AIL was slightly higher than that of the NAIL, and the maximum elevation difference was 5 cm. The shape of the test area was rectangular, measuring 378.6 m long from the east to the west and 30 m wide from the north to the south. The test area covered about 11,360 m2, with a 50% share of AIL and a 50% share of NAIL. With the exception of the interface between AIL and NAIL, the other three sides of the AIL were irrigated land, while the other three sides of the NAIL were non-irrigated land. Before the autumn harvest, the main crop planted in the experimental field was sunflower, and, after the autumn harvest, the experimental field was not turned over and leveled. Six soil water and salt sampling points (parallel to the boundary and 5, 20, 45, 92, 139, and 186 m from the boundary) were set up in AIL and NAIL, respectively, and they were named with respect to their distance from the boundary. The six sampling points in the AIL were named Q5, Q20, Q45, Q92, Q139, and Q186 and each sampling point in NAIL was named W5, W20, W45, W92, W139, and W186. There were two replicates perpendicular to the boundary, with a total of 24 sampling points. A total of five groundwater level observation wells were laid out in the test area. Two observation wells, Q1 and Q2, were laid out from the west to the east in the AIL and three groundwater observation wells, W1, W2, and W3, were laid out from the east to the west in the NAIL. The canals on the east side of wells W1 and W3 are both diversion canals for NAIL. During autumn irrigation, the diversion openings of these canals are closed, and no water passes through the canals.

2.3. Data Collection and Measurement

The test area was irrigated with water from the Yellow River on 18–19 October 2021 and 16–18 November 2022, and the irrigation method was flood irrigation. The irrigation water volume was determined using a trapezoidal water-measuring weir, which was 4600 m3/ha and 4200 m3/ha in 2021 and 2022, respectively, and the conductivity of the irrigation water was determined using a DDS-307A conductivity meter (Hangzhou Qiwei Instrument Co., Ltd., Hangzhou, China), which was 0.73 dS/m and 0.75 dS/m in the two years, respectively. Before and after autumn irrigation, soil samples were gathered at the set sampling points on 13 October and 25 November 2021 and 27 October and 15 December 2022, respectively. The soil sampling depth was 200 cm. There was a total of 8 layers: 2, 10, 30, 50, 70, 100, 150, and 200 cm. The soil samples were collected using soil drills, and soil water content (SWC) and salinity were measured. The SWC was obtained via the drying method, while soil salinity was described by means of soil electrical conductivity (SEC) [21]. The soil samples were dried naturally and then fully ground; then, they were passed through a 1 mm sieve to make a leaching solution with a soil–water ratio of 1:5, and conductivity (conductivity at 25 °C) was determined using a DDS-307A conductivity meter. Groundwater levels in all observation wells were automatically collected using a TD-Diver (Model DI801) groundwater level monitor manufactured (Chengdu Yaohua Technology Co., Ltd., Chengdu, China), and it was set to be collected at 1 h intervals. The meteorological data of the test period were gathered from the China Meteorological Data Network (http://data.cma.cn/ (accessed on 10 August 2023)), and these data were used to compute the daily reference evapotranspiration (ETo) using the FAO-56 Penman–Monteith equation [34]. The daily values of the temperature, reference evapotranspiration, and precipitation during the two-year test period are shown in Figure 3. In 2021 and 2022, the daily mean temperature continued to be lower than 0 °C from 29 November and 28 November, respectively, and the soil entered the freezing period. During the two-year sampling period, the total precipitation was 6.4 mm and 9.4 mm and the total reference evapotranspiration was 66 mm and 59 mm, respectively.

2.4. Research Methods

2.4.1. Changes in Soil Water Content

The variation in SWC was defined as the percentage of SWC variation after autumn irrigation compared to before autumn irrigation. The calculation formula is as follows:
Δ θ = ( θ 2 θ 1 ) × 100 % / θ 1
where θ is the variation rate of SWC (%), θ 2 is the SWC after autumn irrigation (%), and θ 1 is the SWC before autumn irrigation (%). If θ > 0 , this indicates an increase (%). If θ < 0 , this indicates a decrease (%).

2.4.2. Soil Desalination Rate

The soil desalination rate was defined as the percentage of soil salinity reduction after autumn irrigation compared to before autumn irrigation. The calculation formula is as follows:
Δ S E C = ( S E C 1 S E C 2 ) × 100 % / S E C 1
where S E C is the desalination rate (%), S E C 1 is the soil salinity before autumn irrigation (dS/m), and S E C 2 is the soil salinity after autumn irrigation (dS/m). If S E C > 0 , desalination occurred (%). If S E C < 0 , salt accumulation occurred (%).

2.4.3. Estimation of Groundwater Table Depths at Soil Sampling Sites

Groundwater table depth was estimated at each sampling point in the NAIL according to Darcy’s law:
J = Δ H / L
Z s = H s g H s w = H s g ( H i J L i s )
where J is the hydraulic gradient between observation wells, H is the groundwater level elevation difference between observation wells (m), and L is the horizontal distance between observation wells (m). Z s is the groundwater table at each soil sampling point (s = 5, 20, 45, 92, 139, 186) in the NAIL (m), H s g is the ground elevation of each soil sampling point (m), H s w is the water table elevation of each soil sampling point (m), H i is the groundwater level elevation at the observation wells closer to the boundary (i = w1, w2) (m), and L i s is the horizontal distance between the observation wells closer to the boundary and the soil sampling point (m).

2.5. Data Processing Methods

The Kriging interpolation method in Surfer15.0 software was used to plot the spatial and temporal distribution of soil water and salt and Origin2022 software was used to draw the change in soil water and salt at different depths. SPSS19.0 software was applied to test the differentiation of the data (one-way ANOVA).

3. Results

3.1. Distribution Characteristics of Water–Salt in the Soil Profiles

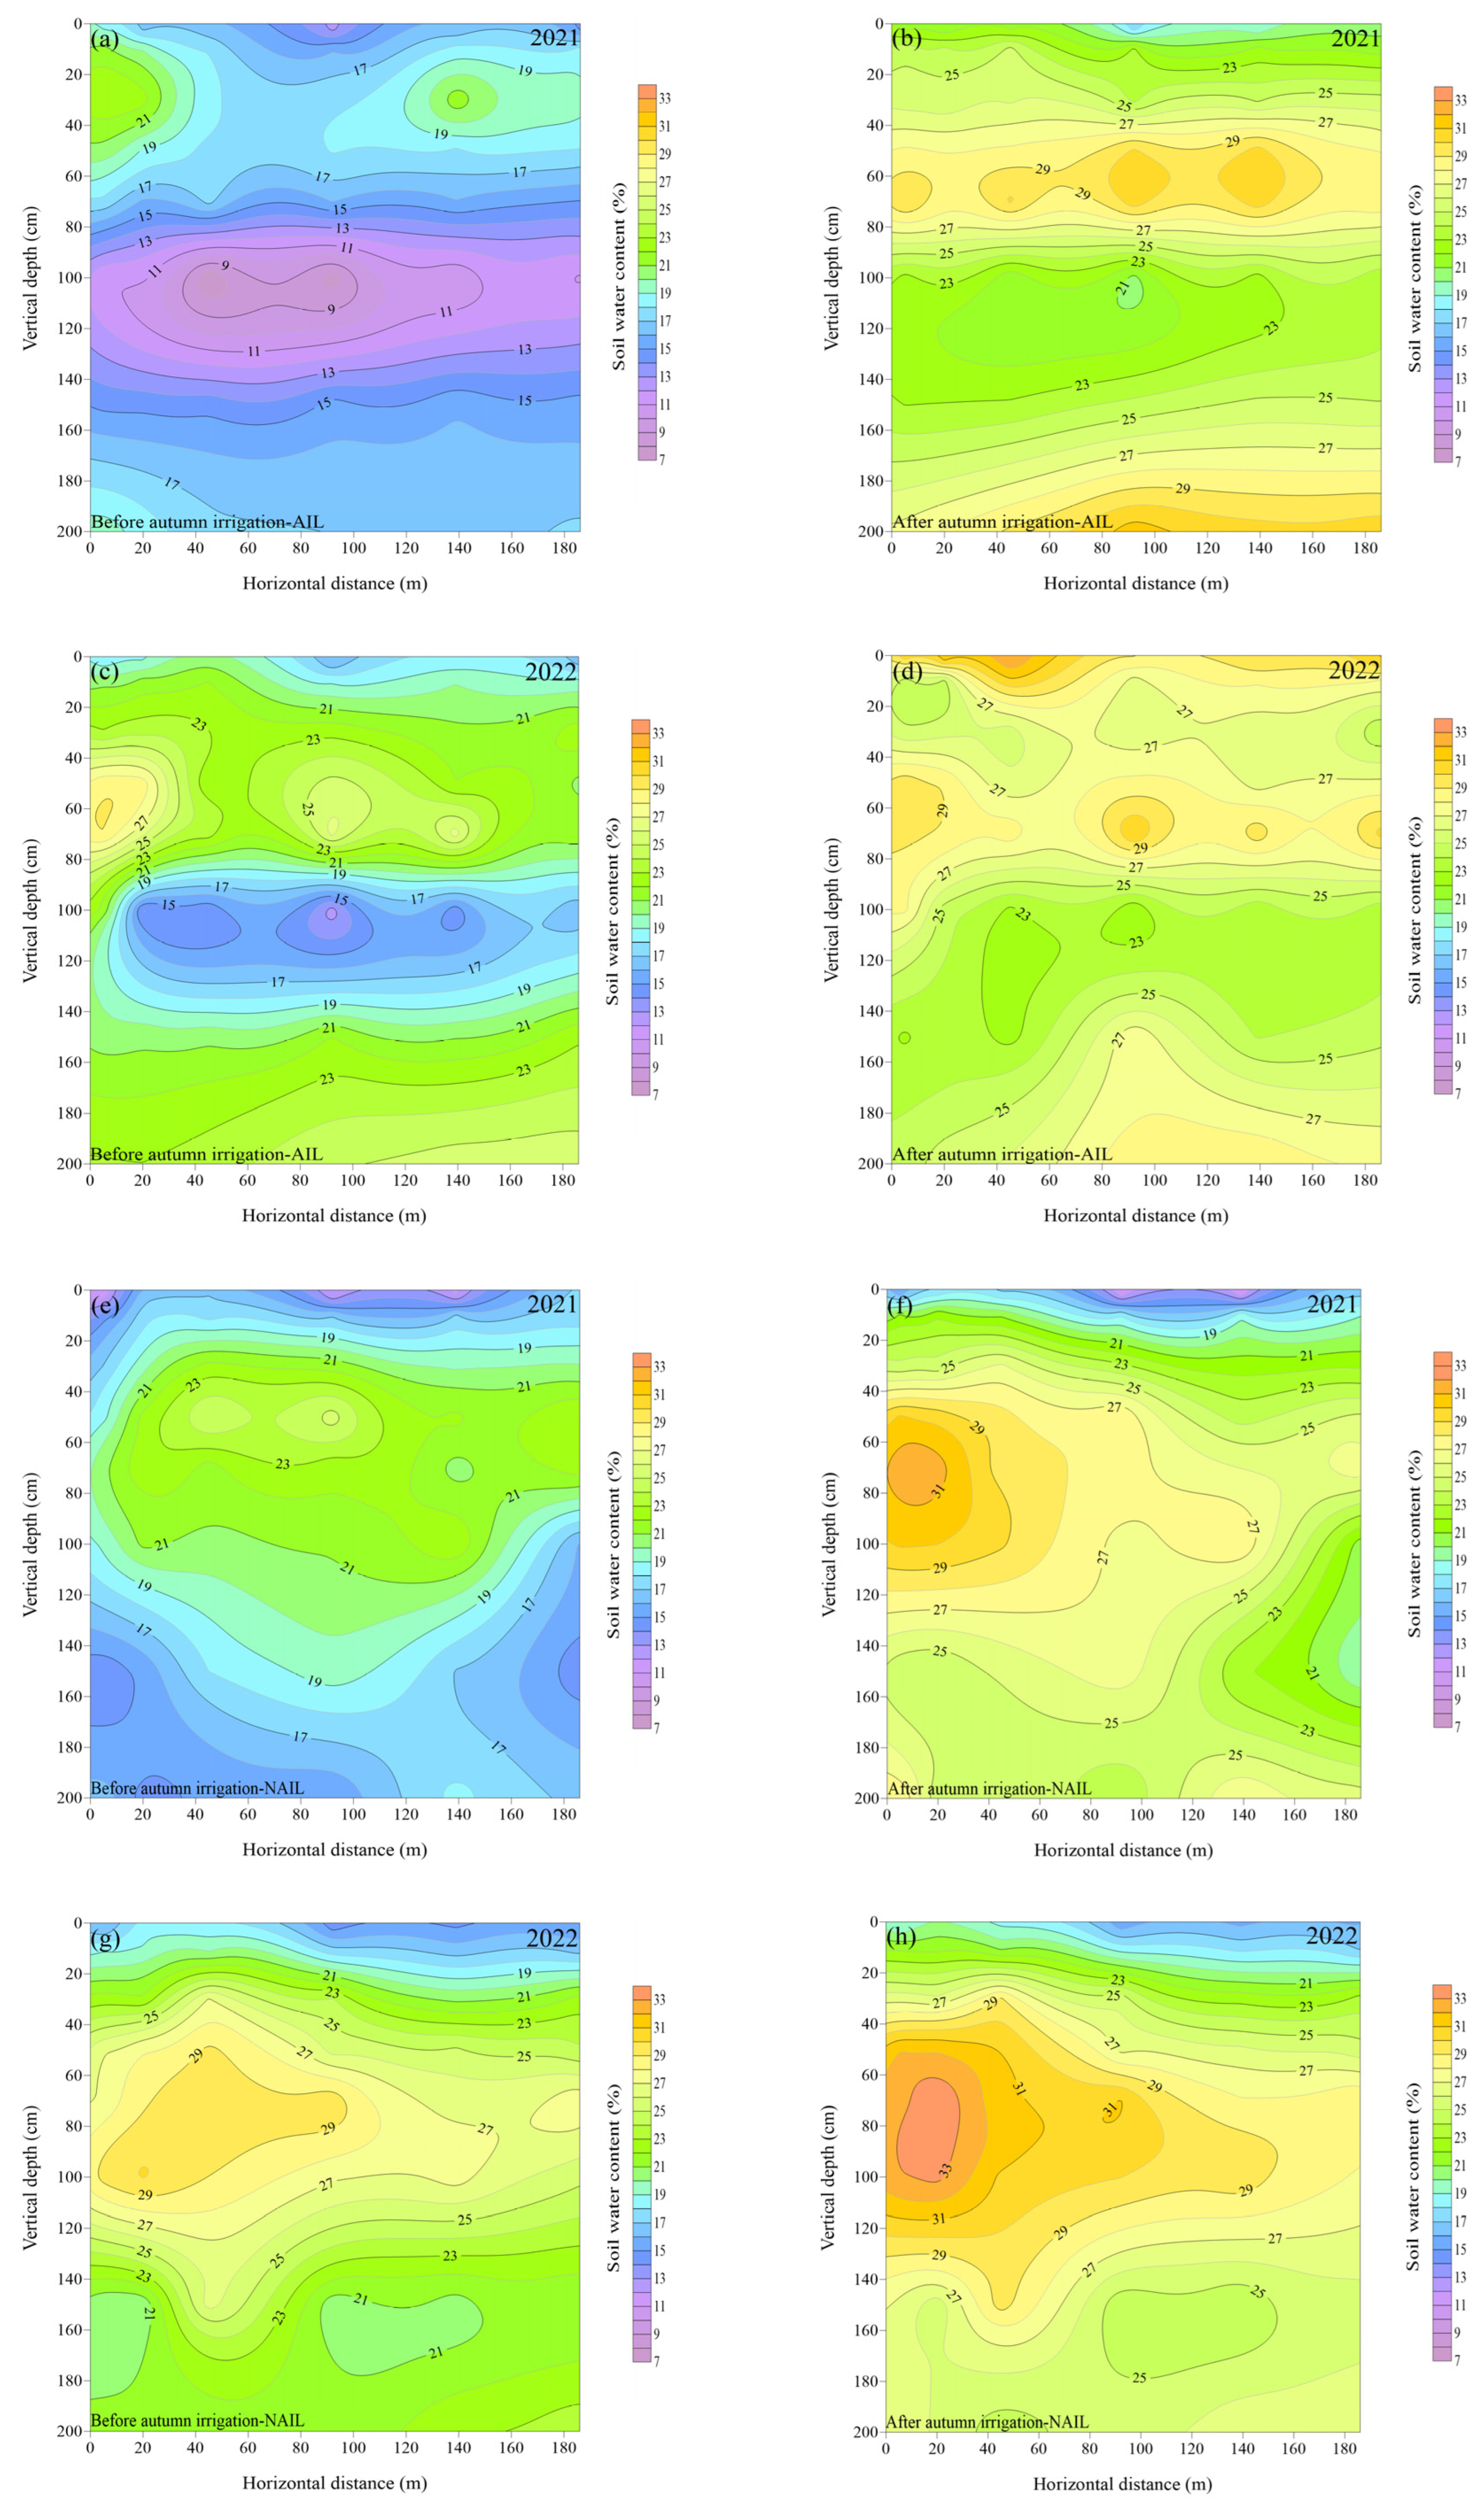
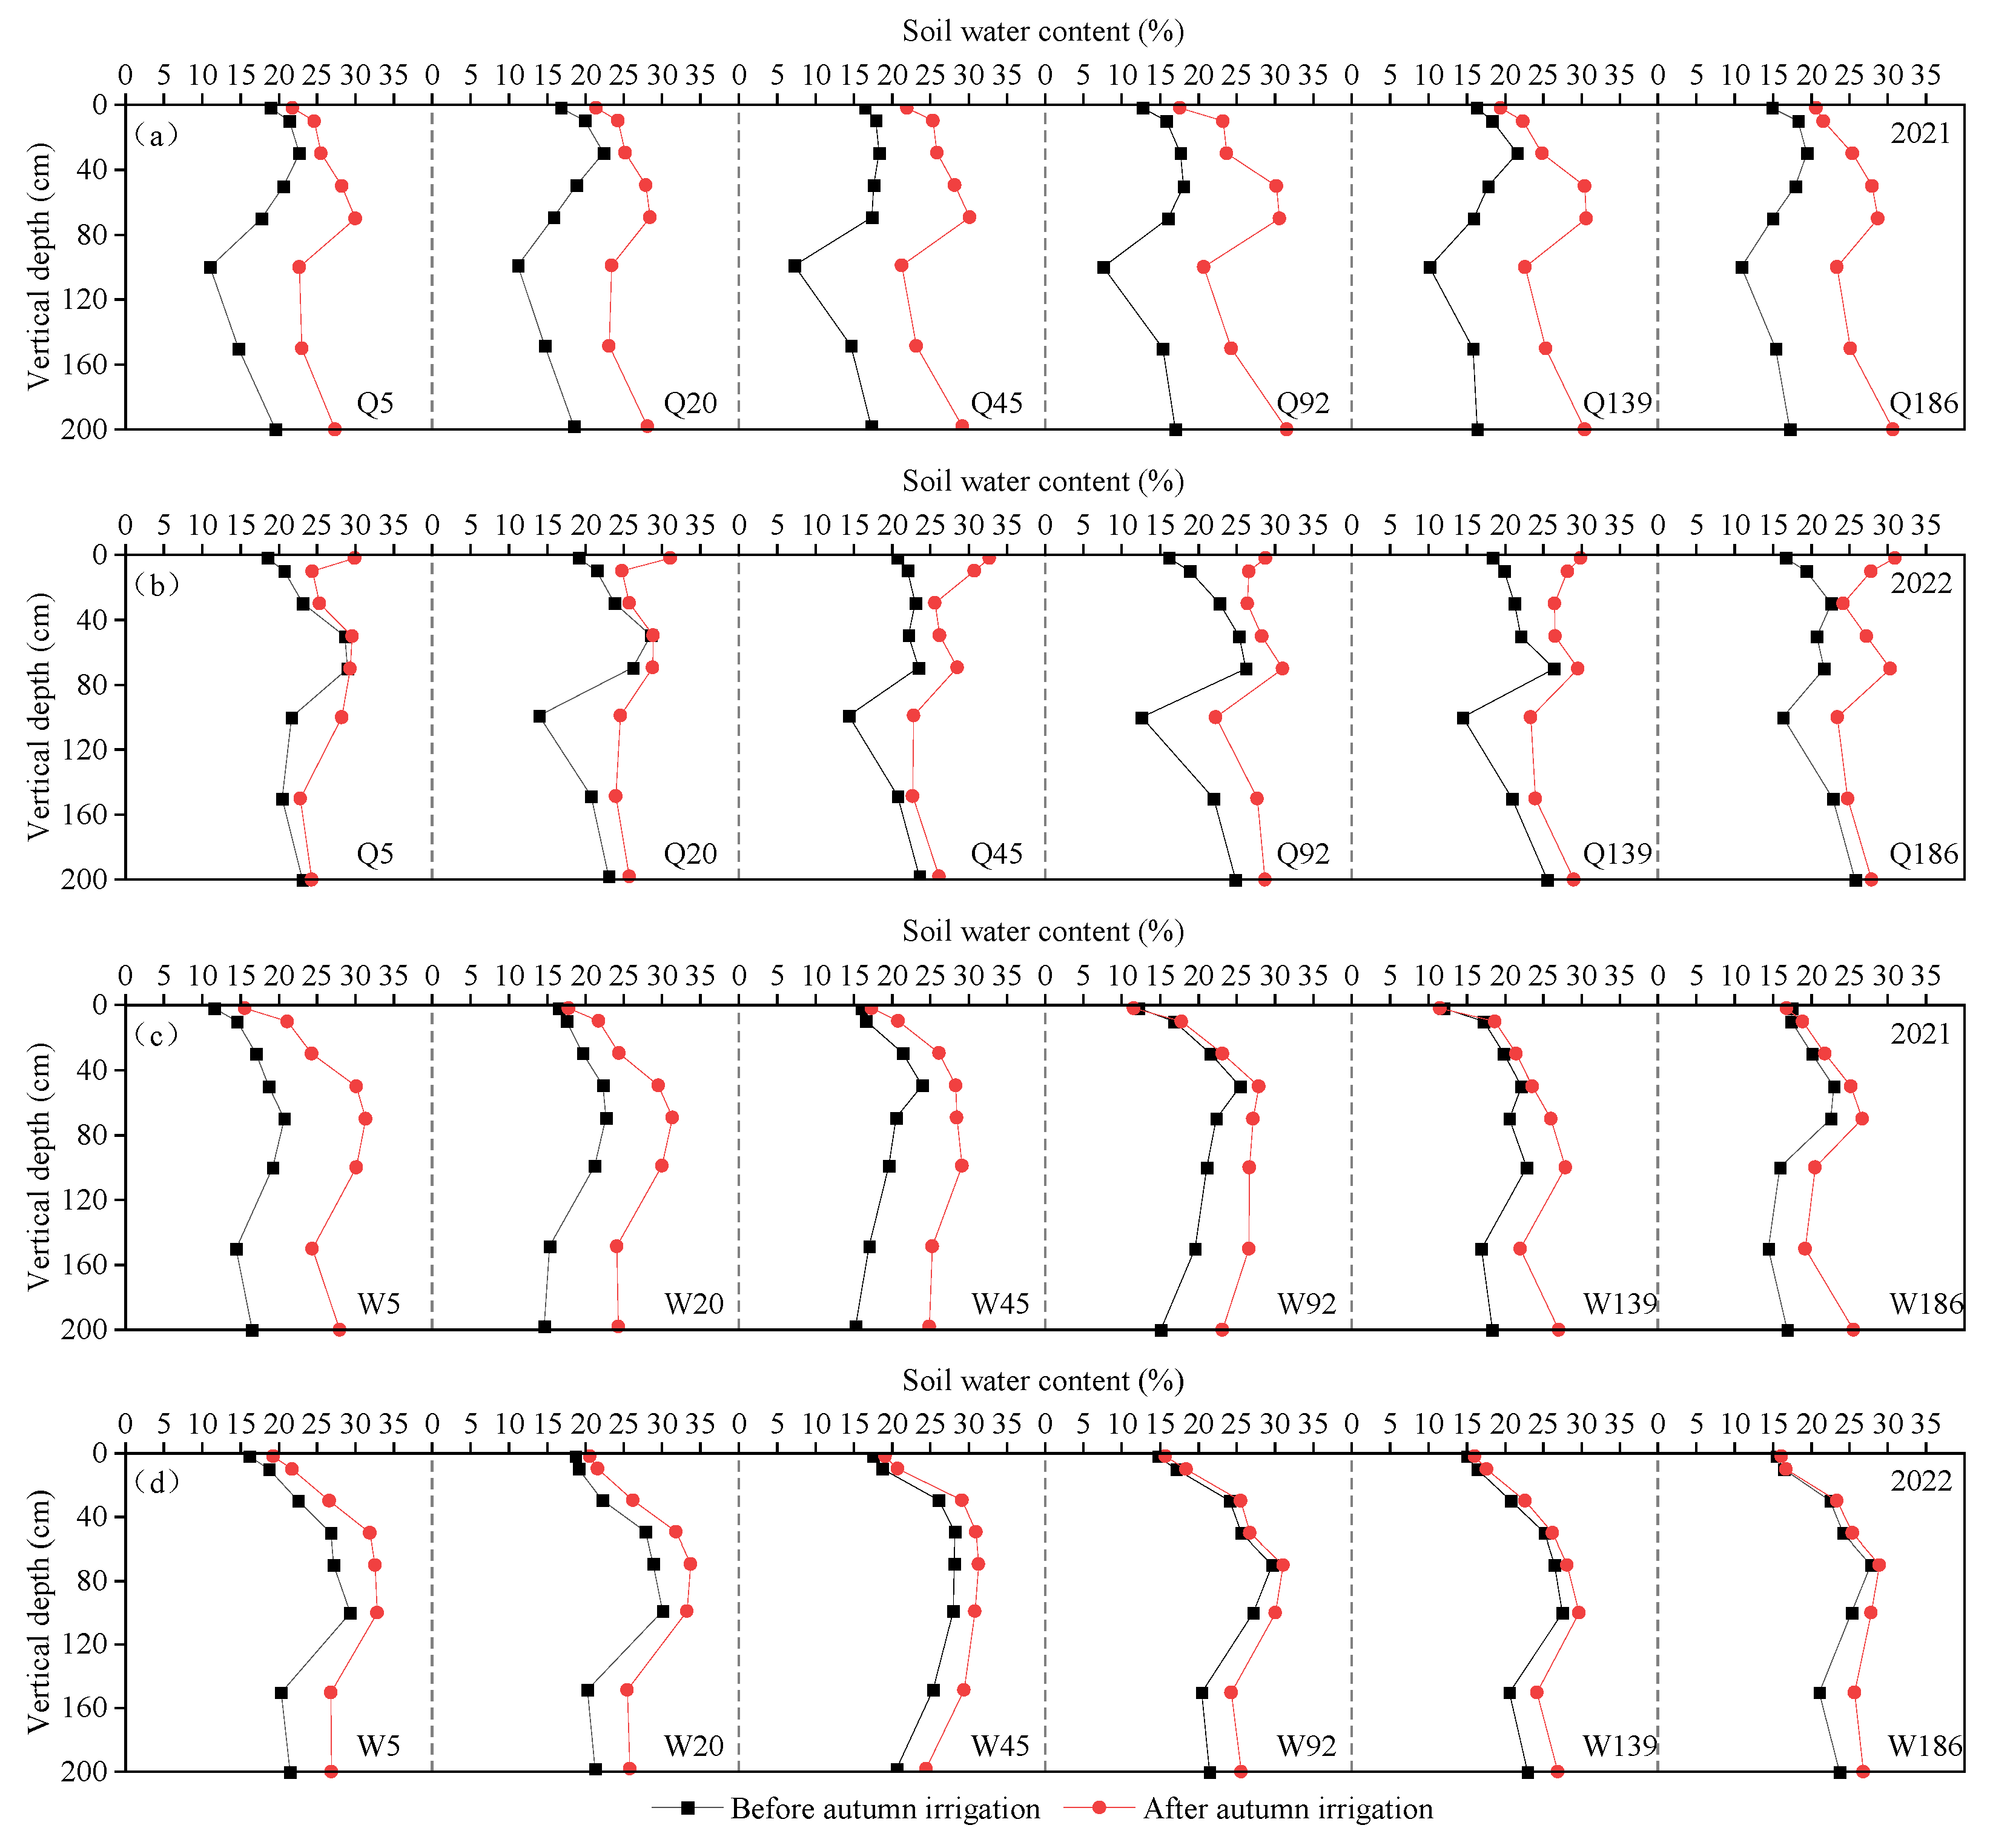
3.1.1. Distribution Characteristics of Water Content in the Soil Profiles

The distribution of SWC was similar for two years in AIL and NAIL before and after autumn irrigation, as shown in Figure 4. Before autumn irrigation, the SWC of AIL and NAIL exhibited a Z-shaped (Figure 4a,c) and an inverted C-shaped distribution (Figure 4e,g) in the vertical direction, respectively. The maximum values appeared in the depth range of 50 ± 20 cm and 70 ± 30 cm and the minimum values appeared in the 100 cm soil layer and the surface layer (2 cm). The lowest value of SWC in AIL was not on the surface but in the 100 cm soil layer, which was a result of the relatively large amount of sand in the 100 cm soil layer (Table 1), resulting in the poor water retention capacity of the soil layer. The SWC of the 0~200 cm soil layer in AIL and NAIL changed between 9.7~20.3% and 14.3~22.6% in 2021 and between 16.3~25.7% and 16.3~28% in 2022, respectively. After autumn irrigation, the vertical distribution of SWC in AIL and NAIL was basically the same as that before autumn irrigation, and the SWC of all soil layers increased (except for the 2 cm soil layer with a horizontal distance of 92~186 m from the boundary in the 2021 NAIL). However, compared with that before autumn irrigation, for two years, the vertical maximum difference of SWC in AIL decreased by 13% and 37.4% (Figure 4b,d), while that of NAIL increased by 61.3% and 12.4%, respectively (Figure 4f,h). This shows that autumn irrigation improves the vertical distribution uniformity of SWC in AIL but reduces the vertical distribution uniformity of SWC in NAIL.
In the horizontal direction, before autumn irrigation, there was no significant difference in SWC at each distance sampling point in the AIL and NAIL (p > 0.05). The SWC varied between 15~18.3% (Figure 4a) and 20.7~23.2% (Figure 4c) for two years at each sampling site for the AIL and between 16.6~19.3% (Figure 4e) and 21.8~24.1% (Figure 4g) for NAIL. After autumn irrigation, the SWC for two years for AIL increased to 25.4 ± 0.2% (Figure 4b) and 27 ± 0.3% (Figure 4d), and the maximum difference was 84.2% and 67.6% lower than that before autumn irrigation. For NAIL, the SWC at 5, 20, and 45 m from the boundary was significantly higher than for the other three sampling points (there was no significant difference between the other three sampling points) (p < 0.05). The SWC at the three sampling sites within 45 m from the boundary in 2021 was higher than the mean values of the other three sampling sites by 14.6, 13.6, and 11.9% (Figure 4f), and it was 13.2%, 13.1%, and 11.7% higher than in 2022 (Figure 4h). The closer the sampling point to the boundary, the higher the SWC. Compared with before autumn irrigation, the maximum difference of SWC in the two years increased by 41.1% and 57.6%, respectively. This shows that autumn irrigation improved the horizontal distribution uniformity of SWC in AIL, but the horizontal distribution uniformity of SWC in NAIL was worse.

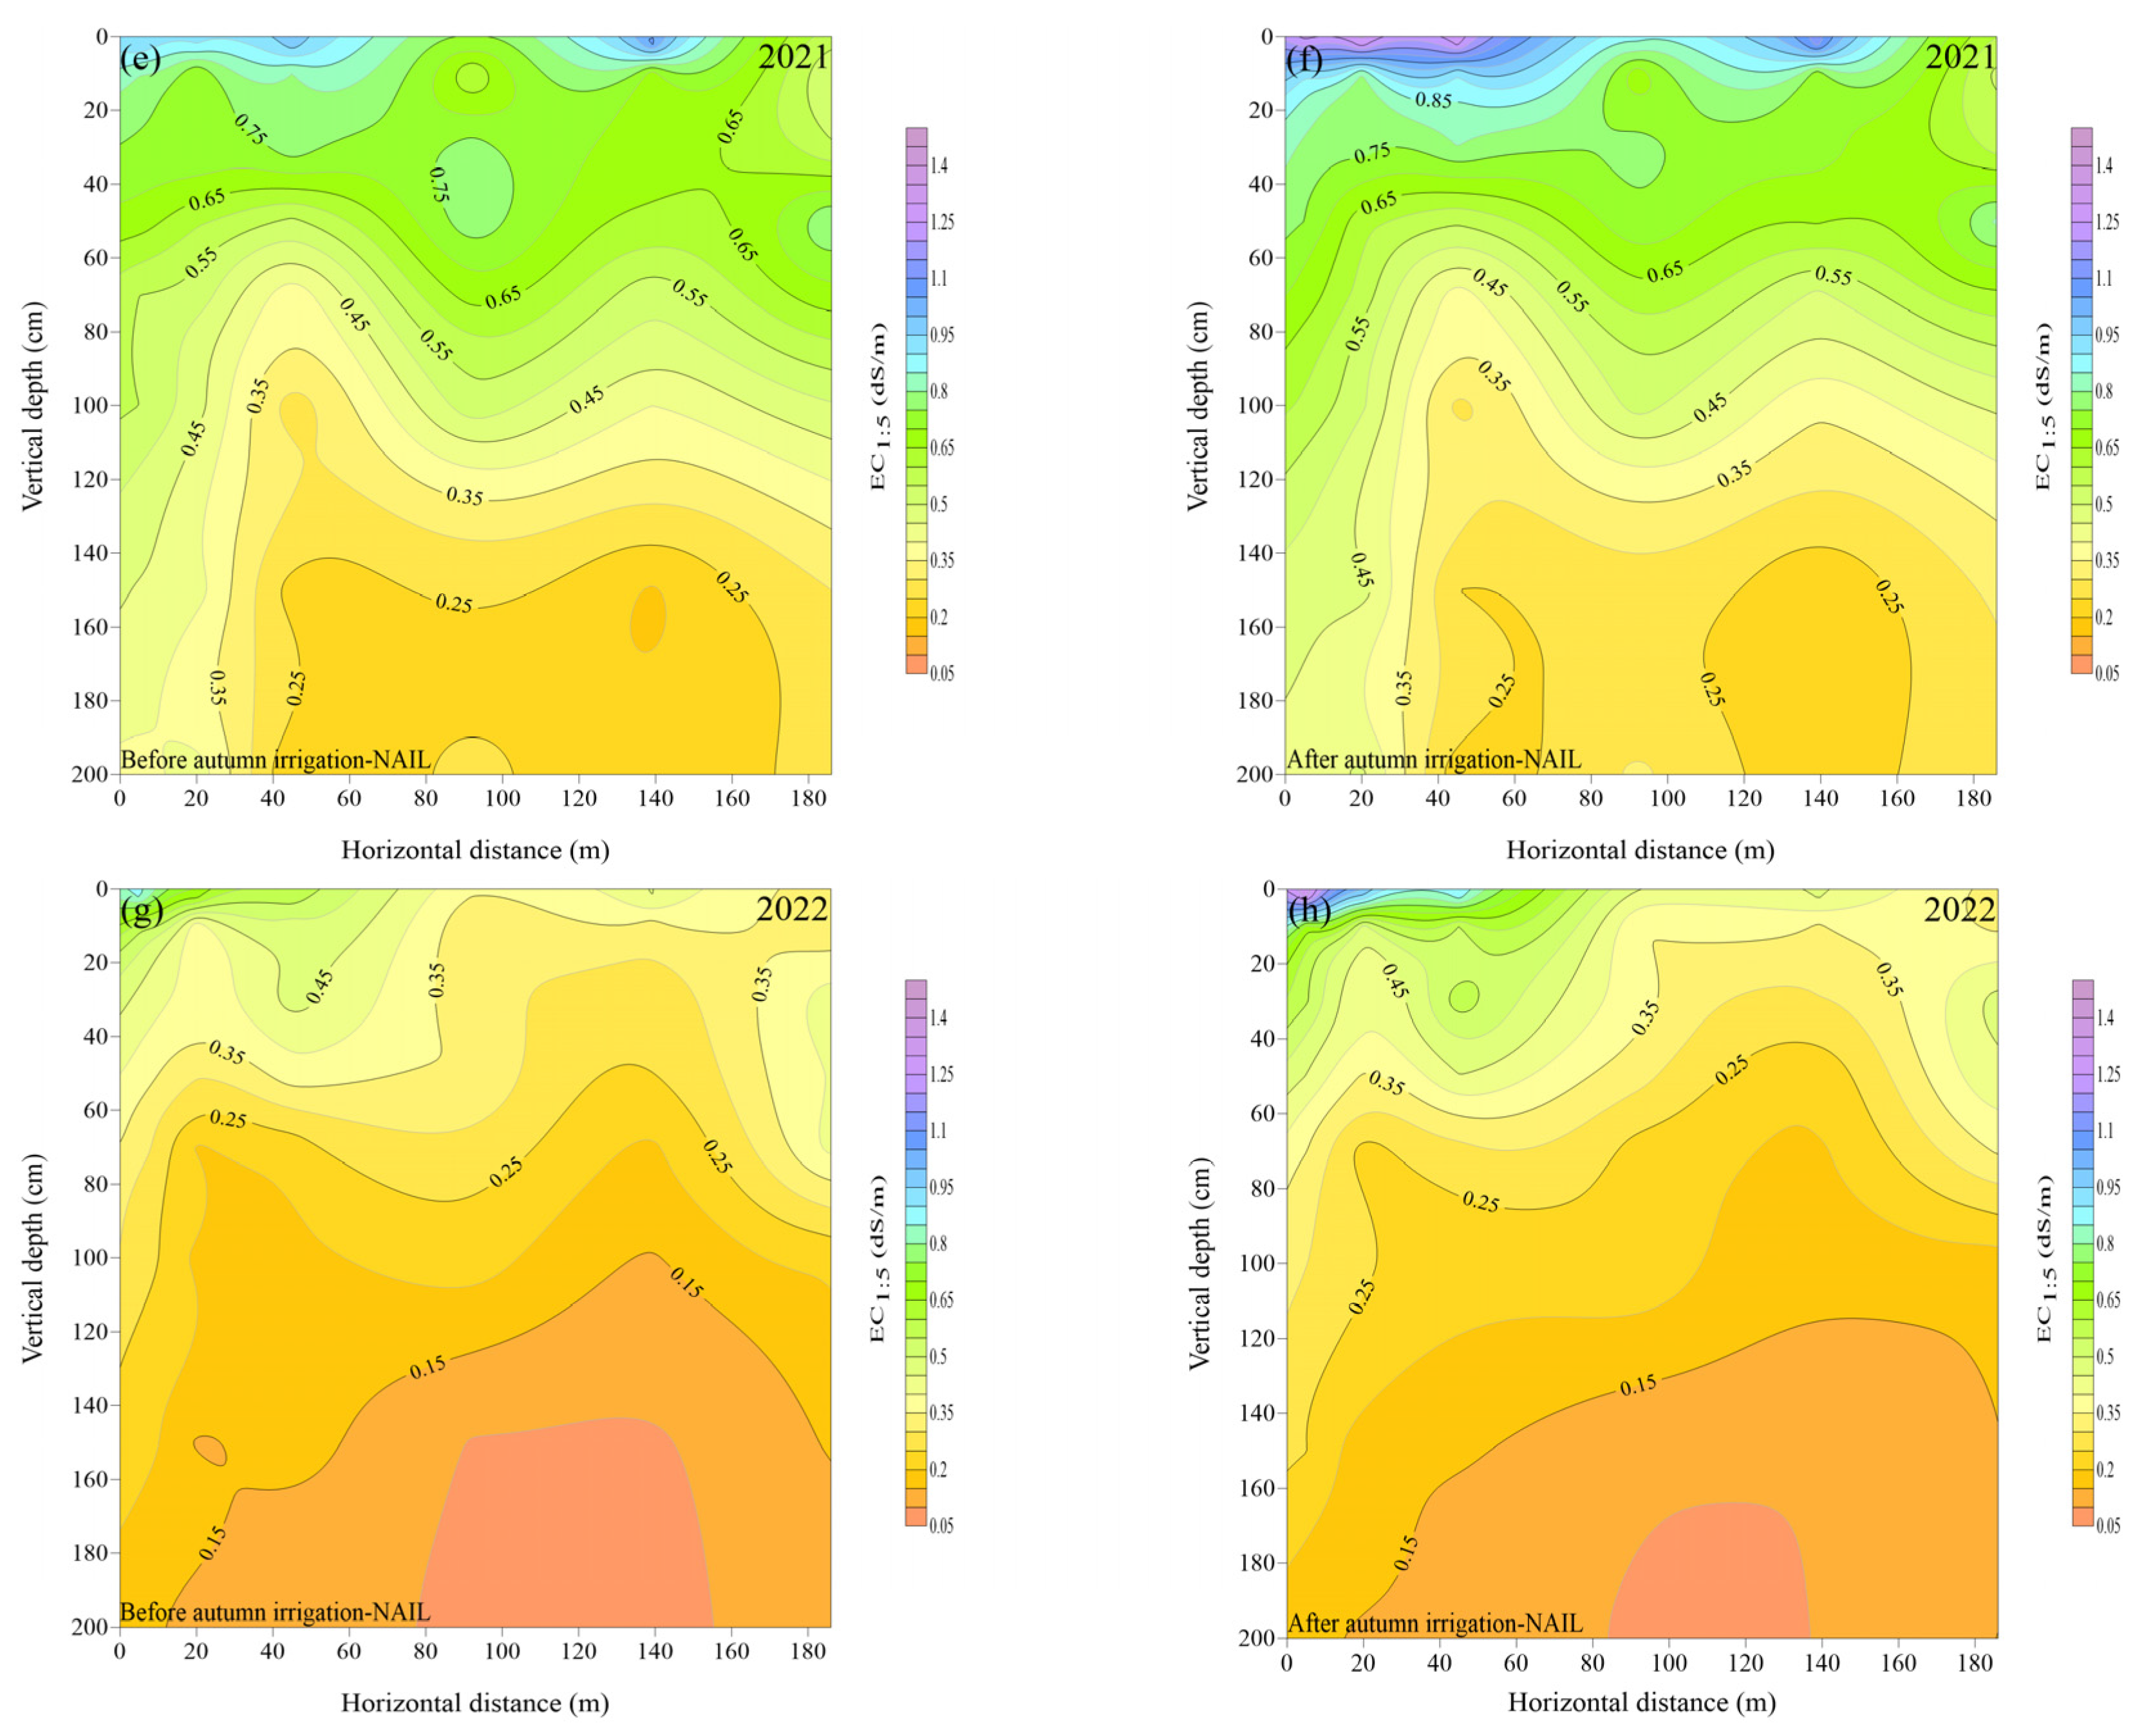
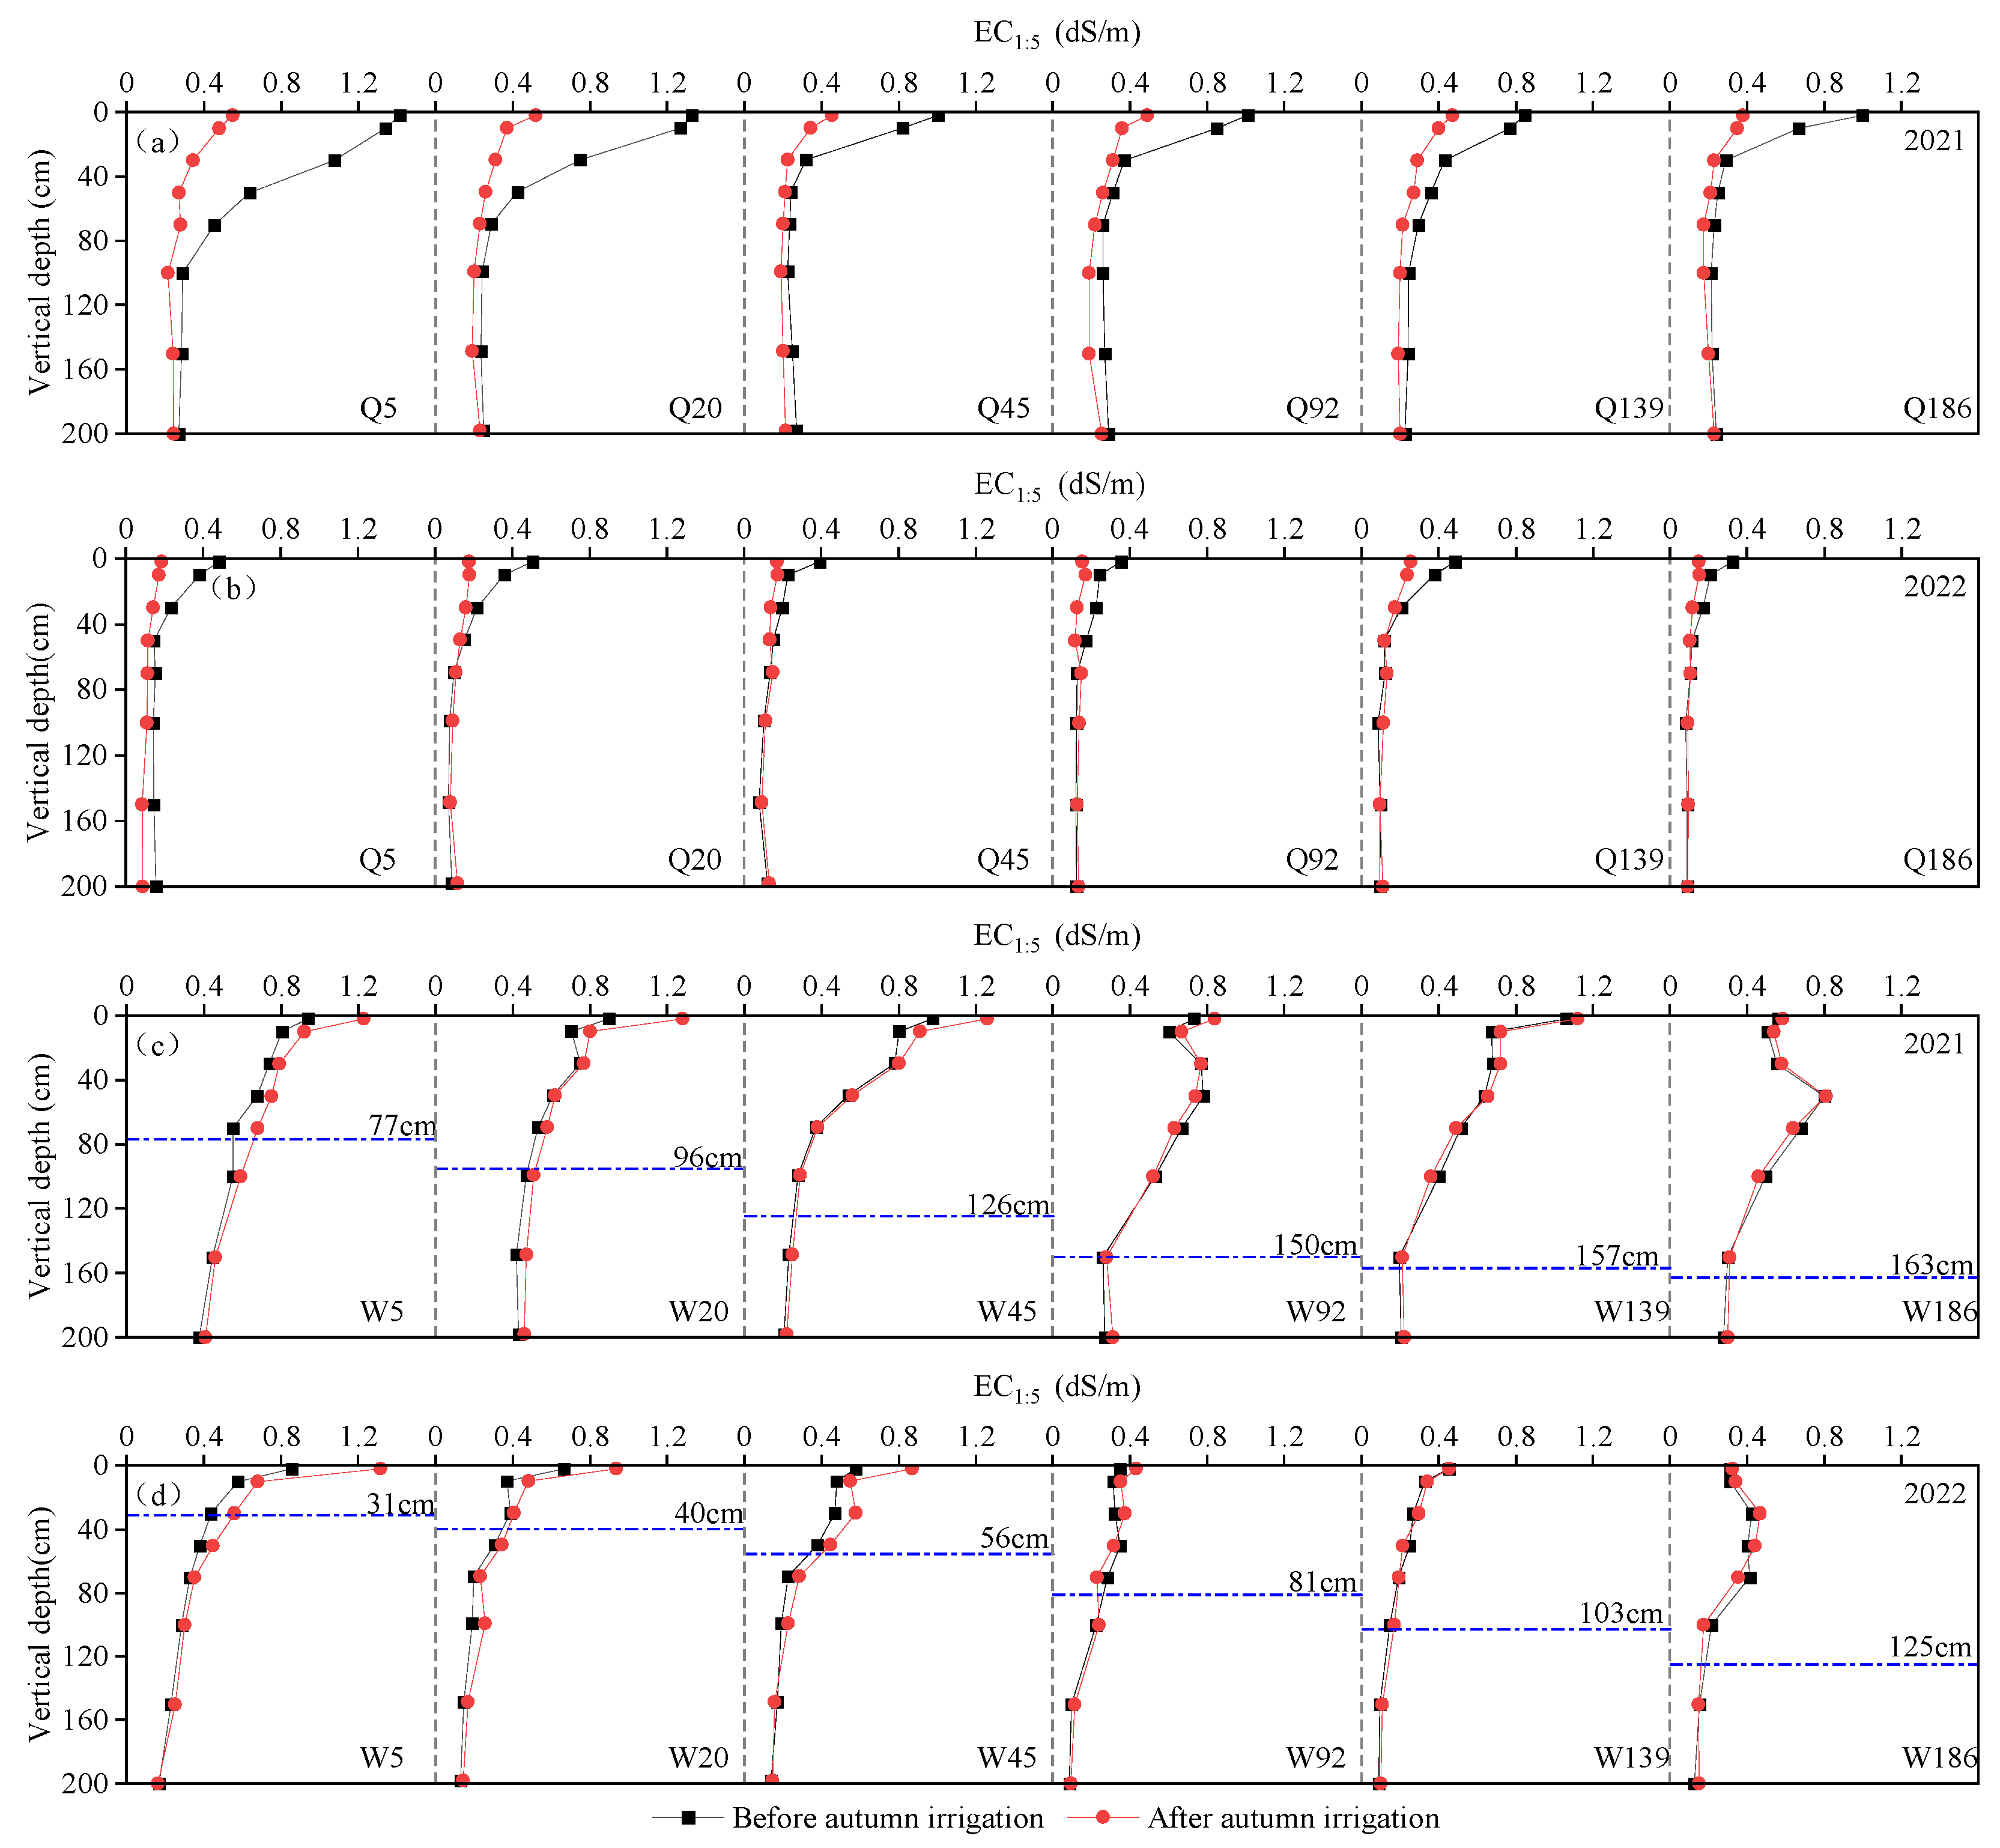
3.1.2. Distribution Characterization of Salt in the Soil Profiles

The two-dimensional distribution of soil salinity in AIL and NAIL over two years was basically the same, as shown in Figure 5. Before autumn irrigation, due to evapotranspiration during the time of crop growth, soil salinity in the top layer (0~10 cm) of both AIL and NAIL was higher in the two years, ranging between 0.95~1.1 dS/m and 0.3~0.42 dS/m (Figure 5a,c) and between 0.68~0.86 dS/m and 0.41~0.54 dS/m (Figure 5e,g), respectively. With the increase in soil depth, soil salinity decreased significantly in the 10~50 cm soil layer and gradually decreased in the 50~200 cm soil layer, with minimum values of 0.25, 0.1 dS/m, and 0.29, 0.12 dS/m. The salts in the horizontal direction all accumulated near 0~5 m from the boundary, and the farther the distance, the fewer the salts. This may be a result of the accumulation of salt eluted from a distance away from the boundary with drainage water to the vicinity of the boundary after the last irrigation. After autumn irrigation, soil salts in the 0~50 cm soil layer exhibited a significant decrease (Figure 5b,d) and increase (Figure 5f,h) in AIL and NAIL, respectively, and the changes in soil salts in all other soil layers were small. For the entire profiles, the salinity of the AIL was close in the horizontal direction, varying between 0.24~0.33 dS/m and 0.11~0.16 dS/m in the two years, respectively, while the salinity of NAIL in the range of 0~45 m from the boundary reached the level of moderate salinity (0.4~0.8 dS/m), especially in the surface soil, which reached the level of severe salinity (0.8~1.6 dS/m). Compared with that before autumn irrigation, the difference in soil salinity in the horizontal and vertical directions of the AIL decreased after irrigation by 72.7% and 37.5% and by 67.1% and 71.9% in the two years, while the difference in soil salinity in the NAIL increased by 66.7% and 55.6% and by 28.1% and 43.9%, respectively. It can be observed that the distribution uniformity of soil salts in the horizontal and vertical directions of AIL improved after irrigation, while the distribution of soil salts in the horizontal and vertical directions of the NAIL worsened.

3.2. Changes in Soil Profile Water Salinity

3.2.1. Changes in Soil Profile Water Content

The changes in soil profile water content at each sampling point in AIL and NAIL before and after autumn irrigation are shown in Figure 6. After autumn irrigation, the average SWC in the root zone (0~50 cm) of the AIL increased by 33.1% and 29.2% in the two-year test period, which was 58.7% lower (Figure 6a) and 37.7% higher (Figure 6b) than that in the deeper layer (50~200 cm), respectively. In the second year, the increase in SWC in the root zone was greater than that in the deep layer. The main reason for this was that irrigation water did not fully infiltrate and froze in the top layer of the soil (0~10 cm). In the NAIL, the average SWC in the root zone (0~50 cm) increased by 17% (Figure 6c) and 9.9% (Figure 6d) in two years, respectively, and this was smaller than the changes in the deep SWC (42% and 14.8%), indicating that the water in the NAIL was more concentrated in the deeper soil layers after irrigation. In the horizontal direction, the largest increase in SWC among the AIL was in Q92, with increases of 67.7% and 30.2% in two years, and the smallest increase was in Q5, with increases of 38.5% and 15.5% in two years, respectively. The rest of the sampling sites changed in between. Under the influence of AIL irrigation, the SWC of each sampling point in NAIL increased by 18.3~54.5% and 8.3~19.7% in the two years, respectively, and the closer the sampling point to the boundary, the greater the increase in SWC.

3.2.2. Changes in Soil Profile Salinity

The changes in soil salinity in the 0~200 cm soil layer before and after autumn irrigation at each sampling point of AIL and NAIL are shown in Figure 7. As observed in Figure 7a,b, the degree of soil desalination at each sampling point in AIL decreased with an increase in vertical depth. The closer the sampling point to the boundary (Q5), the greater the desalination rate of the soil profile, which was 54.5% and 45.3% in the two years, respectively, while the desalination rates of the remaining sampling points were between 34.5~51.8% and 21.6~33.2%, respectively. Salts washed from the AIL entered the groundwater and migrated to the NAIL through lateral flow. Soil salts in the root zone (0~50 cm) of the NAIL accumulated due to evaporation. The salt accumulation rates in two years were 10.3% and 17.9%, respectively, which were about 2.9 and 2.8 times that of the deeper soil (Figure 7c,d). All sampling points were affected by fluctuations in the water table: the greater the depth of fluctuation, the greater the salt accumulation rates in the soil profile. For example, in 2021, the W5, W20, W45, W92, W139, and W186 sampling sites accumulated 14.8, 14, 11.7, 3.1, 3.1, and 1.2% salt after irrigation and, in 2022, they accumulated 25, 24.4, 23.9, 6.3, 3.1, and 1.7% salt, respectively. Further analyses revealed that the salt accumulation rate in the soil profile of the sampling points within 45 m from the boundary was significantly higher than that of the sampling points beyond 92 m (p < 0.5), which was about 5.5 and 6.6 times higher than the average salt accumulation rate of the sampling points beyond 92 m. Therefore, there was a range limit for the effect of autumn irrigation on soil salinity in the adjacent NAIL, which was between 45 and 92 m.

3.3. Changes in Groundwater Levels and Salinity

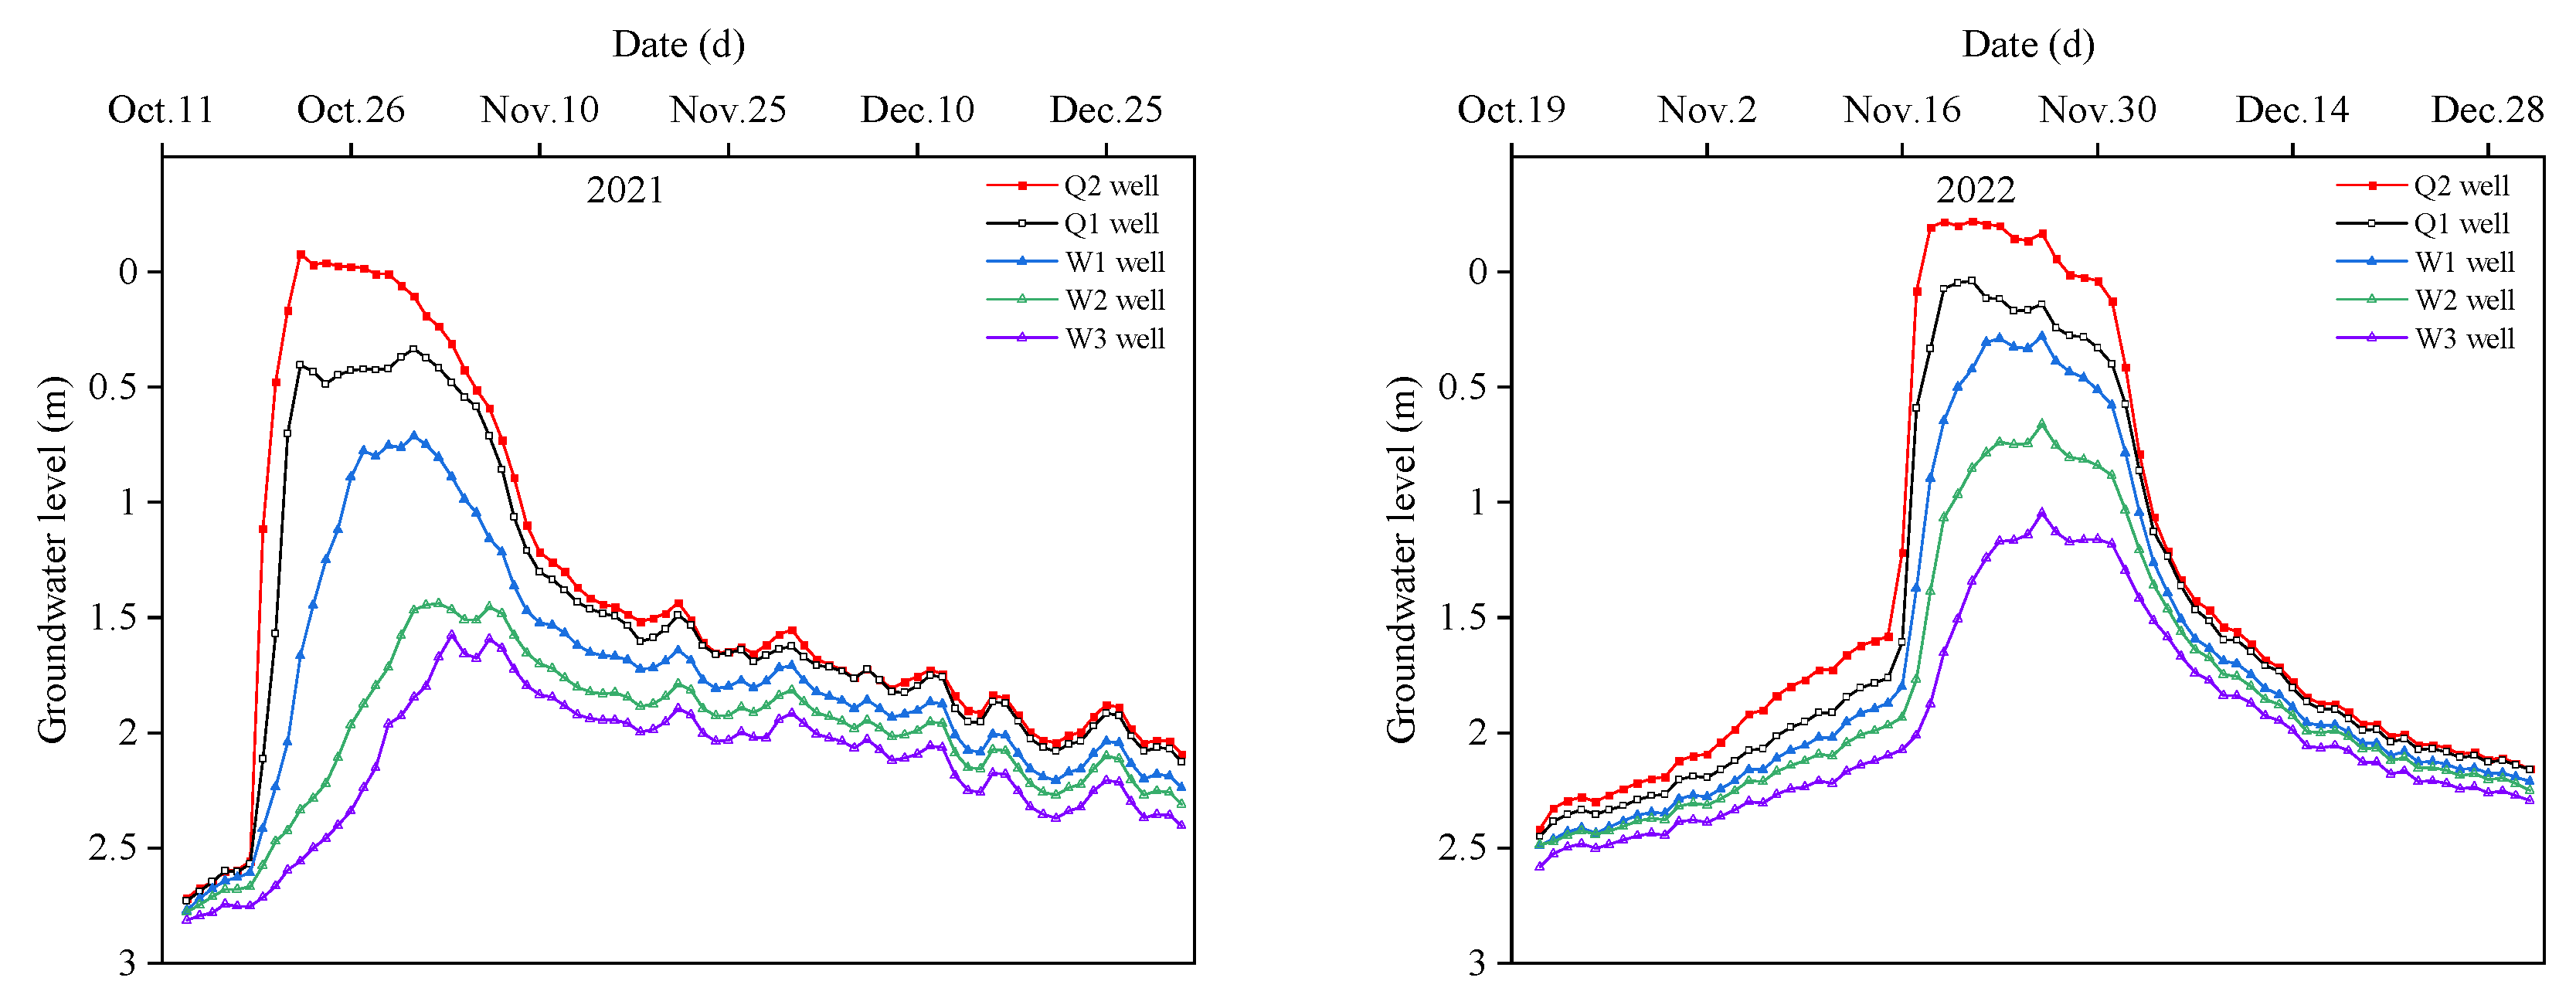
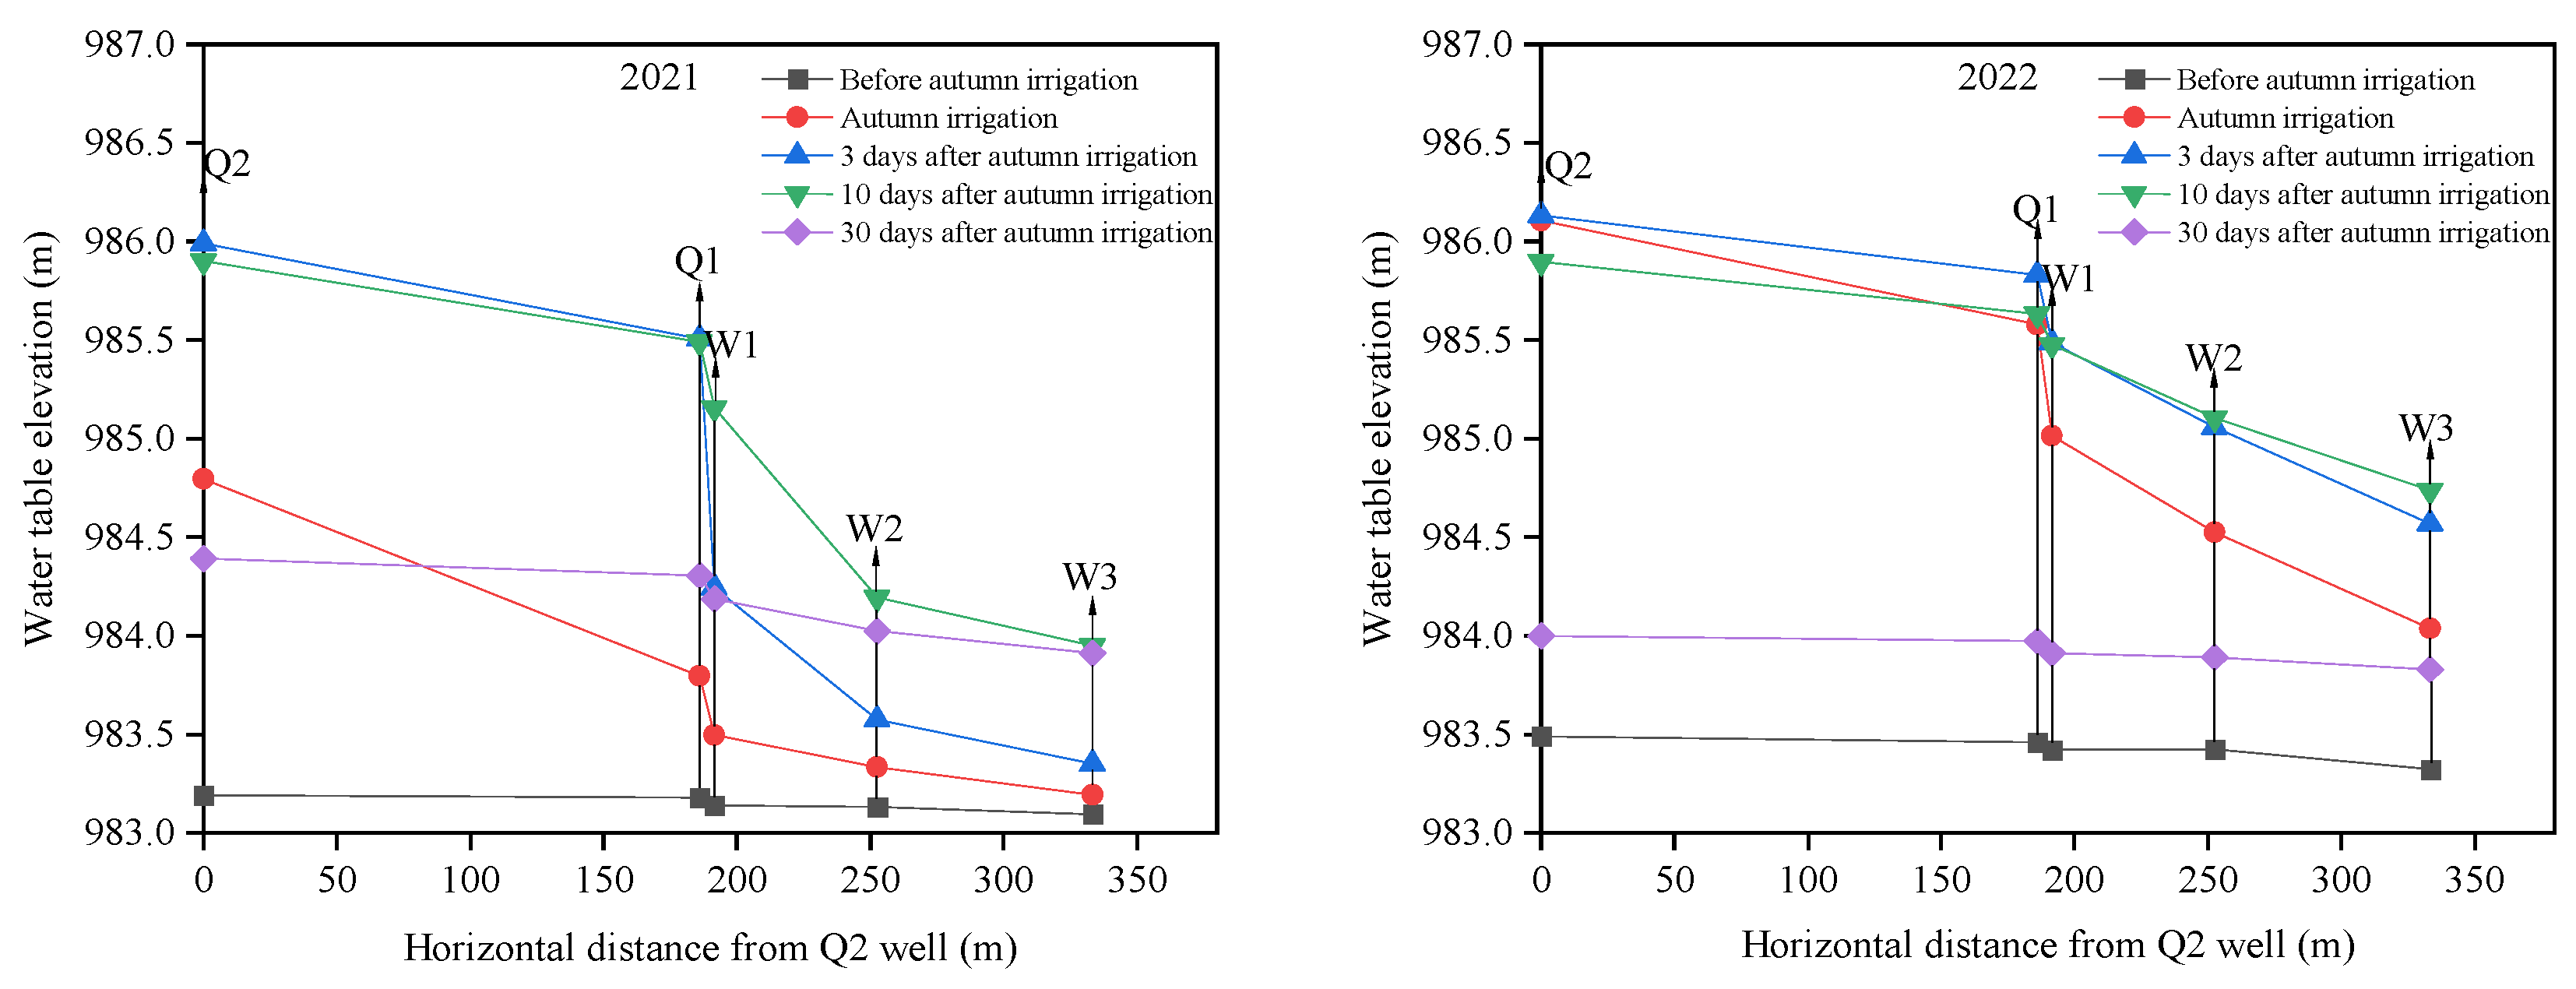
3.3.1. Changes in Groundwater Levels

As illustrated in Figure 8, the change process of groundwater level in each observation well during the two-year test period was the same, exhibiting a first increasing and then decreasing change. Before autumn irrigation, the depths of the groundwater level in each observation well were substantial and similar to one another, and they varied between 2.72–2.81 m and 2.42–2.59 m in the two years. The hydraulic gradient between the observation wells in AIL and NAIL was small and groundwater flow was weak (Figure 9). This was mainly due to the study area not being irrigated since spring irrigation, long-term diving evaporation, and the adjustment to the groundwater’s constant movement. After autumn irrigation, the infiltration of irrigation water resulted in a rapid increase in groundwater levels in AIL and reached a peak on the third day after irrigation, but, due to the obvious water level differences between AIL and NAIL, the larger hydraulic gradient promoted the groundwater’s continuous flow from AIL to NAIL. The groundwater level of AIL decreased while the groundwater level of NAIL increased (Figure 9). On day 10, after irrigation, in 2021, the groundwater level of AIL and NAIL was between 0.01~0.42 m and 0.75~1.96 m, respectively. In contrast, in 2022, it was between 0.01~0.28 m and 0.43~1.17 m (before soil freezing), respectively. With time, the hydraulic gradient between the observation wells became smaller, and the groundwater level decreased synchronously. Until the 30th day after irrigation, the groundwater level varied between 1.52~1.6 m and 1.72~2 m (before soil freezing) and between 1.91~1.94 m and 2~2.08 m for the two years in the AIL and NAIL, respectively (Figure 8). The following could be observed: NAIL received the drainage of the AIL, which could cause the groundwater level after the rise of the AIL to quickly decrease, but earlier autumn irrigation was more capable of ensuring that the groundwater level of AIL fell below the designed critical depth of the HID before freezing (about 1.5) [35].

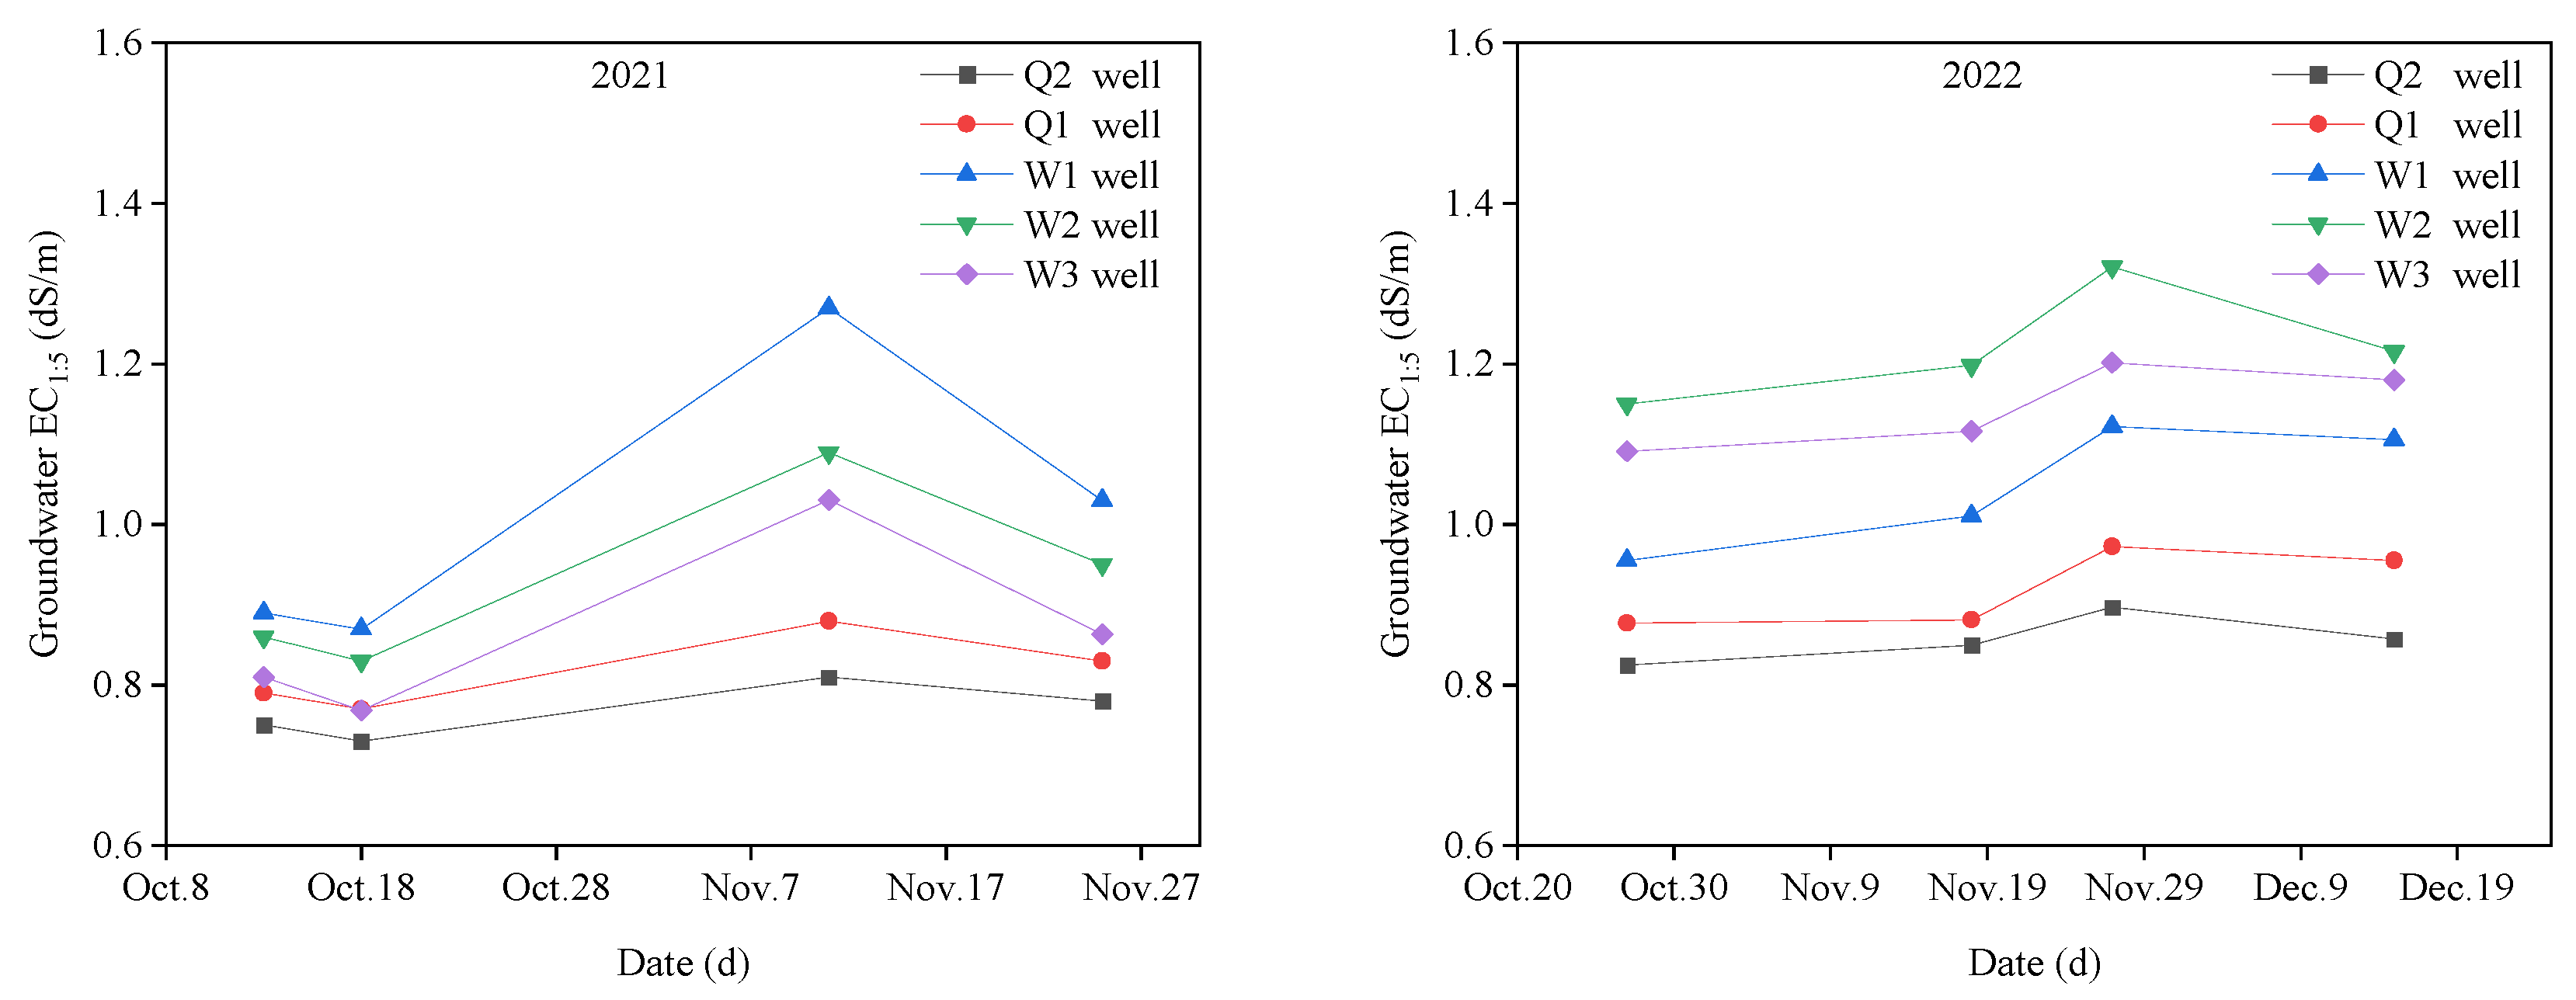
3.3.2. Changes in Groundwater Salinity

As observed in Figure 10, the groundwater salinity of each observation well in the two years had the same change rule, increasing at the beginning of autumn irrigation and decreasing at the end of the autumn irrigation process. Before autumn irrigation, groundwater salinity in each observation well for two years was between 0.75~0.89 dS/m and 0.83~1.15 dS/m. After autumn irrigation, groundwater salinity increased in all observation wells, and the increase in groundwater salinity in NAIL was greater than that in AIL; this may have been caused by the leaching of salts from AIL into the groundwater and their flow toward NAIL through the horizontal flow and the further dissolution of salts in the soil during the rise of the groundwater.

4. Discussion

4.1. Effect of Autumn Irrigation on Soil Moisture

In the study area, where the water table was shallow, soil moisture conditions in different horizontal areas were influenced by irrigation, precipitation, evapotranspiration, groundwater movement, and freeze–thaw cycles, with irrigation being the main driver affecting the distribution and change in soil moisture in AIL and NAIL [36,37]. In this study, after autumn irrigation, the infiltration of irrigation water resulted in smaller differences in soil moisture between horizontal and vertical directions in AIL, which concurs with the findings of Feng et al. [38]. The closer the sampling point to the boundary (Q5), the stronger the hydrodynamic conditions (Figure 9), the faster the water movement, and the greater the drainage (salt discharge). However, in NAIL, the continuous evaporation of topsoil and the increase in deeper soil water increased the difference in soil moisture in the vertical direction [30]. With the increase in the distance from the boundary, the water content of the soil profile gradually decreased. For example, the SWC of W5, W20, and W45 after irrigation was significantly higher than that of the other three positions (there was no significant difference between the other three positions) (p < 0.05), similar to the results of Yin et al. [39]. The autumn irrigation period in HID is short and is followed by a freezing period. The freezing effect prompts the water in the deep soil to carry salt upward, and the water moves and amasses within the frozen soil layer [14]. Following autumn irrigation, the deeper soils of NAIL received increased leaching water recharge, which increased the flow of water from deeper to shallower layers throughout the freezing period and aggravated the salinization process of surface soil when the soil melted the next year.

4.2. Effect of Autumn Irrigation on Soil Salinity

Irrigation not only affects the distribution of water in soil but also changes the distribution of salt in soil, especially in cold-arid regions [40,41]. In addition, irrigation water may also introduce new salts to the soil [42]. In this study, the soil desalination rate of the soil layer above 50 cm was significantly higher than that of the soil layer below 50 cm in the AIL after irrigation, and the difference in soil salinity in the vertical direction was decreased; in contrast, the further accumulation of salts in the surface soil of NAIL increased the difference compared to that of the deeper soil layer. In terms of the entire soil profile, the AIL as a whole exhibited desalination, while the NAIL as a whole exhibited an accumulation of salts, which was consistent with the findings of Peng et al. [30]. Over the two-year experimental period, although the time of soil sampling was different, the precipitation and reference evapotranspiration caused by temporal difference was small (Figure 3), and the groundwater level in both years had already dropped to 1.7~2.0 m and 1.8~2.0 m by post-irrigation sampling (Figure 8). Therefore, different soil sampling times had little effect on the change of water–salt in the soil profile (0~200 cm). In the horizontal direction, there was no significant difference in soil profile salinity at different locations in the AIL after autumn irrigation (p > 0.5), but soil salinity was significantly greater in the proximal zone of NAIL (distance from the boundary of the NAIL was less than 45 m) than in the distal zone (distance from the boundary of NAIL was more than 92 m). This is a different conclusion compared to the study of Yuan et al. [43], which noted that the soil profile’s salt in the near-distance zone of non-irrigated land after irrigation was less than that in the far-distance zone. The cause for this distinction was the different topography of the two test areas. Yuan et al.’s test area had a relatively large elevation difference, and the larger elevation difference tended to make it easier for soil profiles with low topography to become drenched with lateral water flow seepage from areas of high topography. It has been shown [23,41,44] that there exists a critical value for the dry drainage control salt effect of non-irrigated land when the critical value is exceeded: the drainage salt control ability of some non-irrigated land is reduced or even has no effect. The results of the current study are consistent with the above studies. This study observed the following: the influence distance of AIL irrigation on adjacent NAIL was between 45 and 92 m from the boundary of NAIL. As for the specific impact distance, further research is needed.

4.3. Effects of Autumn Irrigation on Groundwater

Groundwater levels and salinity are closely linked to soil water–salt conditions. When the groundwater level and groundwater mineralization are more substantial, soil salinity in the root zone is more severe [45,46]. Thus, controlling the groundwater table is essential in order to prevent and control soil salinization. Substantial water infiltration after irrigation will cause the groundwater level to increase sharply. Surface soil salts migrate to deeper soils and groundwater due to leaching [12], while drainage is an important way to control the dynamics and changes in the groundwater levels [47]. It has been shown that in HID, the groundwater level is below the designed critical depth (about 1.5 m) before the freezing period, which can prevent the salt in the surface soil from exceeding the crop salt tolerance standard in the next spring period [35]. In this study, it was observed that after autumn irrigation, NAIL received the drainage of AIL, which caused the groundwater level of AIL to rapidly decrease below the groundwater-designed critical depth in the irrigation area before the freezing period (in 2021); this is consistent with an earlier study [30]. However, in the 2022 test results, it was further observed that the groundwater levels of AIL did not decrease below the irrigation area designed critical depth before the freezing period. The primary causes of this phenomenon are diverse. On the one hand, the larger autumn irrigation quota and the proximity of the autumn irrigation time to the freezing period resulted in the groundwater levels being higher in AIL before the freezing period, and the groundwater did not have sufficient time to discharge; on the other hand, relatively low air temperatures after autumn irrigation (Figure 3) resulted in low-temperature soil water, high soil water viscosity, and slow movement, which resulted in a slow groundwater level decrease rate. Therefore, in order to reduce the secondary salinization of soil, which is caused by high groundwater levels before the freezing period, under the conditions of dry drainage, determining a reasonable autumn irrigation system is particularly important for controlling the depth of the water table in AIL before the freezing period, and methods for determining this system form a new research area.

5. Conclusions

(1)
Autumn irrigation improved the uniformity of soil water–salt distributions in AIL but reduced the uniformity of soil water–salt distributions in adjacent NAIL. After autumn irrigation, the maximum difference between the average values of two-year soil water content (salinity) in the horizontal and vertical directions decreased by 75.9% and 25.2% (55.1% and 69.5%) for AIL, respectively, while it increased by 49.4% and 36.9% (61.2% and 36%) for NAIL, respectively.
(2)
During the two-year experimental period, autumn irrigation increased the water content of soil profiles in AIL by 38.5~67.7% and 15.5~30.2% and it decreased the salt content by 34.5~54.5% and 21.6~45.3%, respectively. The closer the sampling point to the boundary (Q5), the greater the drainage and salt discharge. In contrast, in NAIL, the soil profile’s water (salt) content increased by 18.3~54.5% and 8.3~19.7% (1.2~14.8% and 1.7%~25%) in the two years, respectively. The closer the sampling point to the boundary, the greater the increase in water–salt content in the soil profile.
(3)
After autumn irrigation, the W5, W20, and W45 sampling sites all exhibited large increases in soil profile salinity, with increases of 11.7~14.8% and 23.9~25% within two years, respectively. The average salt accumulation rate was about 5.5 and 6.6 times that of the average salt accumulation rate of sampling points W92, W139, and W186. It can be observed that there was a range limit of the effect of AIL irrigation on the salinity of the soil in NAIL, which was between approximately 45 and 92 m from the boundary. If the limit distance was exceeded, the dry salt discharge effect of the increased NAIL was weakened.
(4)
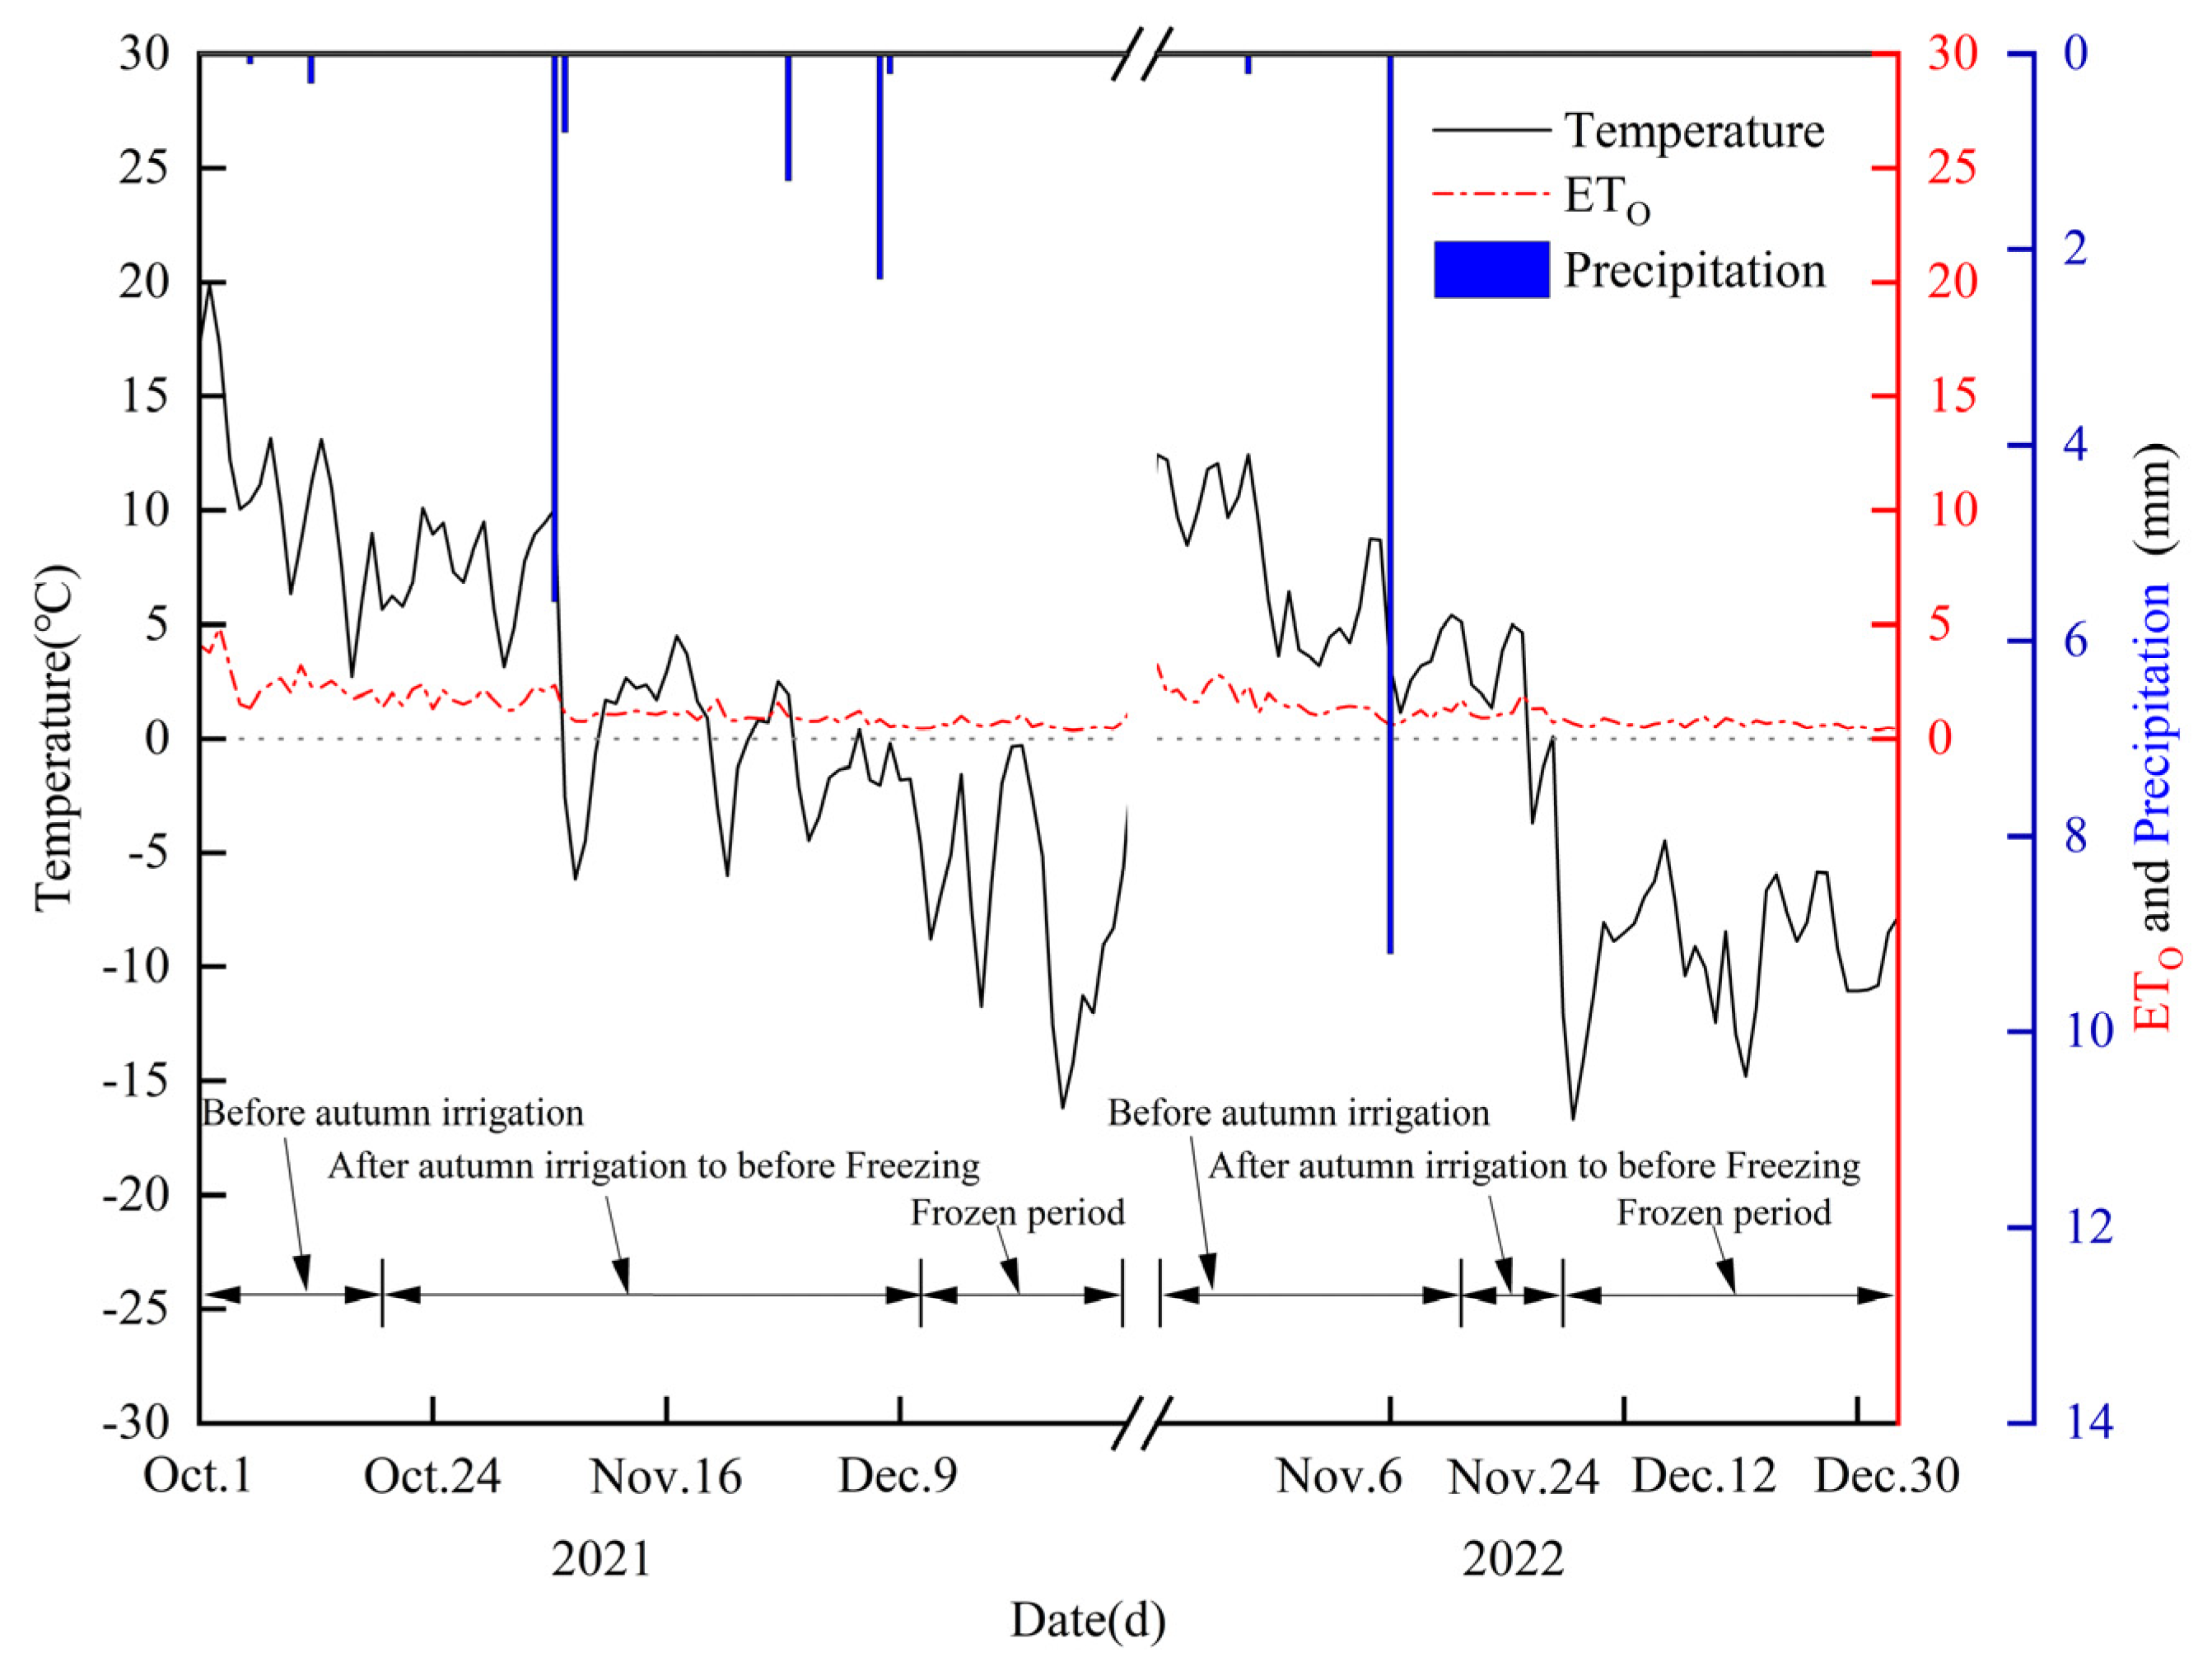
NAIL received drainage from AIL, causing post-irrigation AIL’s groundwater level to decrease rapidly, especially from earlier autumn irrigation, which could reduce the depth of AIL’s groundwater level before freezing to less than 1.5 m. This meets the requirements for the groundwater-designed critical depth in HID. When the autumn irrigation time is delayed to the eve of soil freezing, the depth of the groundwater table in AIL is still above 1.5 m, which will aggravate the risk of salt presence in surface soil during the freeze–thaw period.

Author Contributions

Writing–original draft, Y.Z.; methodology, Y.Z. and W.F.; funding acquisition, R.L.; resources, Q.M., M.S., X.Y., W.W. and Y.H.; project administration, R.L.; writing—review and editing, Y.Z., R.L. and W.F.; formal analysis, Y.Z. and Q.M.; visualization Y.Z. and M.S.; data curation, X.Y., W.W. and Y.H. All authors have read and agreed to the published version of the manuscript.

Funding

This research was funded by the National Natural Science Foundation of China (52069021).

Data Availability Statement

The original contributions presented in the study are included in the article, further inquiries can be directed to the corresponding author.

Acknowledgments

Thanks to the National Natural Science Foundation of China for supporting this work.

Conflicts of Interest

The authors declare no conflicts of interest.

References

  1. Li, P.; Ren, L. Evaluating the saline water irrigation schemes using a distributed agro-hydrological model. J. Hydrol. 2021, 594, 125688. [Google Scholar] [CrossRef]
  2. Ramos, T.B.; Darouich, H.; Oliveira, A.R.; Farzamian, M.; Monteiro, T.; Castanheira, N.; Paz, A.; Alexandre, C.; Gonçalves, M.C.; Pereira, L.S. Water use, soil water balance and soil salinization risks of Mediterranean tree orchards in southern Portugal under current climate variability: Issues for salinity control and irrigation management. Agric. Water Manag. 2023, 283, 108319. [Google Scholar] [CrossRef]
  3. Cao, Z.; Zhu, T.; Cai, X. Hydro-agro-economic optimization for irrigated farming in an arid region: The Hetao Irrigation District, Inner Mongolia. Agric. Water Manag. 2023, 277, 108095. [Google Scholar] [CrossRef]
  4. Rosegrant, M.W.; Ringler, C.; Zhu, T. Water for Agriculture: Maintaining Food Security under Growing Scarcity. Annu. Rev. Environ. Resour. 2009, 34, 205–222. [Google Scholar] [CrossRef]
  5. Ringler, C.; Agbonlahor, M.; Barron, J.; Baye, K.; Meenakshi, J.; Mekonnen, D.K.; Uhlenbrook, S. The role of water in transforming food systems. Glob. Food Secur. 2022, 33, 100639. [Google Scholar] [CrossRef]
  6. Devkota, K.P.; Devkota, M.; Rezaei, M.; Oosterbaan, R. Managing salinity for sustainable agricultural production in salt-affected soils of irrigated drylands. Agric. Syst. 2022, 198, 103390. [Google Scholar] [CrossRef]
  7. Feng, W.; Wang, T.; Zhu, Y.; Sun, F.; Giesy, J.P.; Wu, F. Chemical composition, sources, and ecological effect of organic phosphorus in water ecosystems: A review. Carbon Res. 2023, 2, 12. [Google Scholar] [CrossRef]
  8. Li, L.; Liu, H.; Gong, P.; Lin, E.; Bai, Z.; Li, P.; Wang, C.; Li, J. Multi-objective optimization of winter irrigation for cotton fields in salinized freeze-thaw areas. Eur. J. Agron. 2023, 143, 126715. [Google Scholar] [CrossRef]
  9. Qadir, M.; Quillérou, E.; Nangia, V.; Murtaza, G.; Singh, M.; Thomas, R.J.; Drechsel, P.; Noble, A.D. Economics of salt-induced land degradation and restoration. Nat. Resour. Forum 2014, 38, 282–295. [Google Scholar] [CrossRef]
  10. Singh, A. Soil salinization management for sustainable development: A review. J. Environ. Manag. 2021, 277, 111383. [Google Scholar] [CrossRef]
  11. Chang, X.; Gao, Z.; Wang, S.; Chen, H. Modelling long-term soil salinity dynamics using SaltMod in Hetao Irrigation District, China. Comput. Electron. Agric. 2019, 156, 447–458. [Google Scholar] [CrossRef]
  12. Ramos, T.B.; Liu, M.; Paredes, P.; Shi, H.; Feng, Z.; Lei, H.; Pereira, L.S. Salts dynamics in maize irrigation in the Hetao plateau using static water table lysimeters and HYDRUS-1D with focus on the autumn leaching irrigation. Agric. Water Manag. 2023, 283, 108306. [Google Scholar] [CrossRef]
  13. Tan, X.; Wu, J.; Wu, M.; Huang, J.; Tan, B.; Li, L. Effects of ice cover on soil water, heat, and solute movement: An experimental study. Geoderma 2021, 403, 115209. [Google Scholar] [CrossRef]
  14. Chen, H.; Peng, Z.; Zeng, W.; Wu, J. Salt Movement during Soil Freezing Events in Inner Mongolia, China. J. Coast. Res. 2018, 82, 55–63. [Google Scholar] [CrossRef]
  15. Liu, J.; Huang, Q.; Li, Z.; Liu, N.; Li, J.; Huang, G. Effect of Autumn Irrigation on Salt Leaching under Subsurface Drainage in an Arid Irrigation District. Water 2023, 15, 2296. [Google Scholar] [CrossRef]
  16. Lu, X.; Li, R.; Shi, H.; Liang, J.; Miao, Q.; Fan, L. Successive simulations of soil water-heat-salt transport in one whole year of agriculture after different mulching treatments and autumn irrigation. Geoderma 2019, 344, 99–107. [Google Scholar] [CrossRef]
  17. Ansari, S.; Abedi-Koupai, J.; Mostafazadeh-Fard, B.; Shayannejad, M.; Mosaddeghi, M.R. Assessment of solute transport and distribution under dry drainage conditions using a physical model. Irrig. Drain. 2019, 68, 797–807. [Google Scholar] [CrossRef]
  18. Wichelns, D.; Oster, J. Sustainable irrigation is necessary and achievable, but direct costs and environmental impacts can be substantial. Agric. Water Manag. 2006, 86, 114–127. [Google Scholar] [CrossRef]
  19. Abedi-Koupai, J.; Ansari, S.; Mostafazadeh-Fard, B.; Shayannejad, M.; Mosaddeghi, M.R. Experimental study and numerical simulation of soil water and salt transport under dry drainage conditions. Environ. Earth Sci. 2020, 79, 89. [Google Scholar] [CrossRef]
  20. Konukcu, F.; Gowing, J.; Rose, D. Dry drainage: A sustainable solution to waterlogging and salinity problems in irrigation areas? Agric. Water Manag. 2006, 83, 1–12. [Google Scholar] [CrossRef]
  21. Zhang, W.; Shi, H.; Li, Z.; Wang, W.; Fu, X.; Li, Z. Redistribution Mechanism for Irrigation Water and Salinity in Typical Irrigation and Drainage Unit in the Hetao Irrigation District, China. J. Irrig. Drain. Eng. 2022, 148, 04022021. [Google Scholar] [CrossRef]
  22. Wu, J.; Zhao, L.; Huang, J.; Yang, J.; Vincent, B.; Bouarfa, S.; Vidal, A. On the effectiveness of dry drainage in soil salinity control. Sci. China Technol. Sci. 2009, 52, 3328–3334. [Google Scholar] [CrossRef]
  23. Wei, F.; Shen, C.; Liu, J.; Wu, J. Analysis Based on Numerical Simulation on the Influencing Factors of Salinity Control Effect of Dry Drainage. China Rural Water Hydropower 2015, 5, 85–90. [Google Scholar]
  24. Yang, X.; Zhu, Q.; Ma, M.; Wu, J. Research on the Evaporation Capacity and Water—Salt VariationCharacteristics of Different Types of Saline Wasteland. China Rural Water Hydropower 2019, 9, 49–53. [Google Scholar]
  25. Wang, C.; Wu, J.; Zeng, W.; Zhu, Y.; Huang, J. Five-year experimental study on effectiveness and sustainability of a dry drainage system for controlling soil salinity. Water 2019, 11, 111. [Google Scholar] [CrossRef]
  26. Liu, G.; Wang, C.; Wang, X.; Huo, Z.; Liu, J. Growing season water and salt migration between abandoned lands and adjacent croplands in arid and semi-arid irrigation areas in shallow water table environments. Agric. Water Manag. 2022, 274, 107968. [Google Scholar] [CrossRef]
  27. Mao, W.; Zhu, Y.; Wu, J.; Ye, M.; Yang, J. Evaluation of effects of limited irrigation on regional-scale water movement and salt accumulation in arid agricultural areas. Agric. Water Manag. 2022, 262, 107398. [Google Scholar] [CrossRef]
  28. Shi, H.; Yang, S.; Li, R.; Li, X.; Li, W.; Yan, J.; Miao, Q.; Li, Z. Soil Water and Salt Movement and Soil Salinization Control in Hetao Irrigation District: Current State and Future Prospect. J. Irrig. Drain. Eng. 2020, 39, 1–17. [Google Scholar] [CrossRef]
  29. Fan, L.; Shi, H.; Yan, J.; Li, X.; Dou, X.; Qi, Q.; Li, H. Analysis of Soil Water and Salt Redistribution during the Freeze-thaw Periodin “Autumn Watering-spring Irrigation”. J. Irrig. Drain. Eng. 2023, 42, 90–97+113. [Google Scholar] [CrossRef]
  30. Peng, Z.; Wu, J.; Huang, J. Water and salt movement under partial irrigation in Hetao Irrigation District, Inner Mongolia. J. Hydraul. Eng. 2016, 47, 110–118. [Google Scholar] [CrossRef]
  31. Dou, X.; Shi, H.; Li, R.; Miao, Q.; Tian, F.; Yu, D. Distribution Characteristics of Salinity and Nutrients in Salinized Soil. Trans. Chin. Soc. Agric. Mach. 2022, 53, 279–290+330. [Google Scholar] [CrossRef]
  32. Wang, R.; Wan, H.; Chen, S.; Xia, Y.; Bai, Q.; Peng, Z.; Shang, S. Spatial distribution pattern of soil salinization in farmland of Wulate sub-irrigation areas in Hetao Irrigation District in Inner Mongolia in spring. Trans. Chin. Soc. Agric. Eng. 2021, 37, 105–113. [Google Scholar]
  33. Wu, K.; Zhao, R. Soil Texture Classification and Its Application in China. Acta Pedol. Sin. 2019, 56, 227–241. [Google Scholar] [CrossRef]
  34. Allen, R.G.; Pereira, L.S.; Raes, D.; Smith, M. Crop Evapotranspiration (Guidelines for Computing Crop Water Requirements); FAO Irrig. Drain. Paper No. 56; FAO: Rome, Italy, 1998. [Google Scholar]
  35. Guo, S. Influence of Autumn Irrigation time upon Moisture-Salt Movement and Agricultural Environment in Hetao Irrigation Area of Inner Mongolia. J. China Agric. Univ. 1997, S1, 147–150. [Google Scholar]
  36. Wen, Y.; Wan, H.; Shang, S. A monthly distributed water and salt balance model in irrigated and non-irrigated lands of arid irrigation district with shallow groundwater table. J. Hydrol. 2023, 616, 128811. [Google Scholar] [CrossRef]
  37. Wu, T.; Li, H.; Lyu, H. Effect of freeze–thaw process on heat transfer and water migration between soil water and groundwater. J. Hydrol. 2023, 617, 128987. [Google Scholar] [CrossRef]
  38. Feng, Z.-Z.; Wang, X.-K.; Feng, Z.-W. Soil N and salinity leaching after the autumn irrigation and its impact on groundwater in Hetao Irrigation District, China. Agric. Water Manag. 2005, 71, 131–143. [Google Scholar] [CrossRef]
  39. Yin, X.; Feng, Q.; Zheng, X.; Zhu, M.; Wu, X.; Guo, Y.; Wu, M.; Li, Y. Spatio-temporal dynamics and eco-hydrological controls of water and salt migration within and among different land uses in an oasis-desert system. Sci. Total Environ. 2021, 772, 145572. [Google Scholar] [CrossRef] [PubMed]
  40. Wang, T.; Feng, W.; Liu, J.; Fan, W.; Li, T.; Song, F.; Yang, F.; Liao, H.; Leppäranta, M. Eutrophication in cold-arid lakes: Molecular characteristics and transformation mechanism of DOM under microbial action at the ice-water interface. Carbon Res. 2024, 3, 42. [Google Scholar] [CrossRef]
  41. Soltani, M.; Rahimikhoob, A.; Sotoodehnia, A.; Mendicino, G.; Akram, M.; Senatore, A. Numerical evaluation of the effects of increasing ratio of cropped to uncropped width on dry drainage efficiency in salty soils. Irrig. Drain. 2018, 67, 91–100. [Google Scholar] [CrossRef]
  42. Malakar, A.; Snow, D.; Ray, C. Irrigation Water Quality-A Contemporary Perspective. Water 2019, 11, 1482. [Google Scholar] [CrossRef]
  43. Yuan, C.; Feng, S.; Zhuang, X.; Qian, Z. Analyzing water-salt dynamics in typical cultivated and wasteland in Hetao irrigation district of Inner Mongolia. Agric. Res. Arid. Areas. 2022, 40, 76–85. [Google Scholar] [CrossRef]
  44. Huang, Y.; Ma, Y.; Zhang, S.; Li, Z.; Huang, Y. Optimum allocation of salt discharge areas in land consolidation for irrigation districts by SahysMod. Agric. Water Manag. 2021, 256, 107060. [Google Scholar] [CrossRef]
  45. Khasanov, S.; Li, F.; Kulmatov, R.; Zhang, Q.; Qiao, Y.; Odilov, S.; Yu, P.; Leng, P.; Hirwa, H.; Tian, C. Evaluation of the perennial spatio-temporal changes in the groundwater level and mineralization, and soil salinity in irrigated lands of arid zone: As an example of Syrdarya Province, Uzbekistan. Agric. Water Manag. 2022, 263, 107444. [Google Scholar] [CrossRef]
  46. Shokri-Kuehni, S.M.; Raaijmakers, B.; Kurz, T.; Or, D.; Helmig, R.; Shokri, N. Water table depth and soil salinization: From pore-scale processes to field-scale responses. Water Resour. Res. 2020, 56, e2019WR026707. [Google Scholar] [CrossRef]
  47. Askri, B.; Khodmi, S.; Bouhlila, R. Impact of subsurface drainage system on waterlogged and saline soils in a Saharan palm grove. Catena 2022, 212, 106070. [Google Scholar] [CrossRef]
Figure 1. The location of Hetao Irrigation District in Inner Mongolia, China, (a) and the location of the study area (b).
Land 13 00773 g001
Figure 2. Schematic diagram of the test site’s layout (AIL is autumn-irrigated land and NAIL is non-autumn-irrigated land).
Land 13 00773 g002
Figure 3. Daily values of temperature, reference evapotranspiration (ETO), and precipitation during the 2021 and 2022 experimental periods.
Land 13 00773 g003
Figure 4. Distribution of soil water content in autumn-irrigated land (AIL, ad) and non-autumn-irrigated land (NAIL, eh) before and after autumn irrigation in 2021 and 2022.
Land 13 00773 g004
Figure 5. Distribution of soil salinity (EC1:5) in autumn-irrigated land (AIL, ad) and non-autumn-irrigated land (NAIL, eh) in 2021 and 2022.
Land 13 00773 g005aLand 13 00773 g005b
Figure 6. Changes in soil water content at each sampling point in autumn-irrigated land (a,b) and non-autumn-irrigated land (c,d) before and after autumn irrigation in 2021 and 2022.
Land 13 00773 g006
Figure 7. Changes in soil salinity (EC1:5) at each sampling point in autumn-irrigated land (a,b) and non-autumn-irrigated land (c,d) before and after autumn irrigation in 2021 and 2022 (the blue dotted line is the highest influence depth line of groundwater levels after autumn irrigation).
Land 13 00773 g007
Figure 8. The change process of groundwater levels at each observation well in autumn-irrigated land and non-autumn-irrigated land before and after autumn irrigation in 2021 and 2022.
Land 13 00773 g008
Figure 9. The change process of the hydraulic gradient between observation wells in autumn-irrigated land and non-autumn-irrigated land before and after autumn irrigation in 2021 and 2022.
Land 13 00773 g009
Figure 10. The change in groundwater salinity (EC1:5) at each observation well in autumn-irrigated land and non-autumn-irrigated land before and after autumn irrigation in 2021 and 2022.
Land 13 00773 g010
Table 1. Soil physical properties of the study area from 0 to 200 cm.
Land TypesSoil Depth (cm)Particle Distribution (%)Soil Bulk Density
(g cm−3)
Soil
Texture
Clay (<0.002 mm)Silt
(0.002–0.05 mm)
Sand
(0.05–2 mm)
0–52.2943.1854.531.51Sandy loam
5–202.4543.3054.251.55Sandy loam
20–402.2555.6242.131.57Silty loam
AIL40–601.1155.6643.231.52Silty loam
60–800.7954.6744.541.53Silty loam
80–1000.2127.2272.571.61Loamy sand
100–1500.2121.3478.451.62Loamy sand
150–2000.3610.3889.261.62Loamy sand
0–52.6840.1157.211.50Sandy loam
5–202.2630.2267.521.55Sandy loam
20–403.7560.6035.641.60Silty loam
NAIL40–604.9054.7340.371.54Silty loam
60–801.8963.2234.901.51Silty loam
80–1000.8552.6746.471.55Silty loam
100–1500.2521.3178.441.62Loamy sand
150–2000.2720.5579.181.63Loamy sand
Notes: AIL is autumn-irrigated land and NAIL is non-autumn-irrigated land.
Disclaimer/Publisher’s Note: The statements, opinions and data contained in all publications are solely those of the individual author(s) and contributor(s) and not of MDPI and/or the editor(s). MDPI and/or the editor(s) disclaim responsibility for any injury to people or property resulting from any ideas, methods, instructions or products referred to in the content.

