
Long-Term Response of Floodplain Meadow Normalized Difference Vegetation Index to Hydro-Climate and Grazing Pressure: Tamir River Plains, Mongolia


 , ,
, ,
Abstract
:1. Introduction
2. Materials and Methods
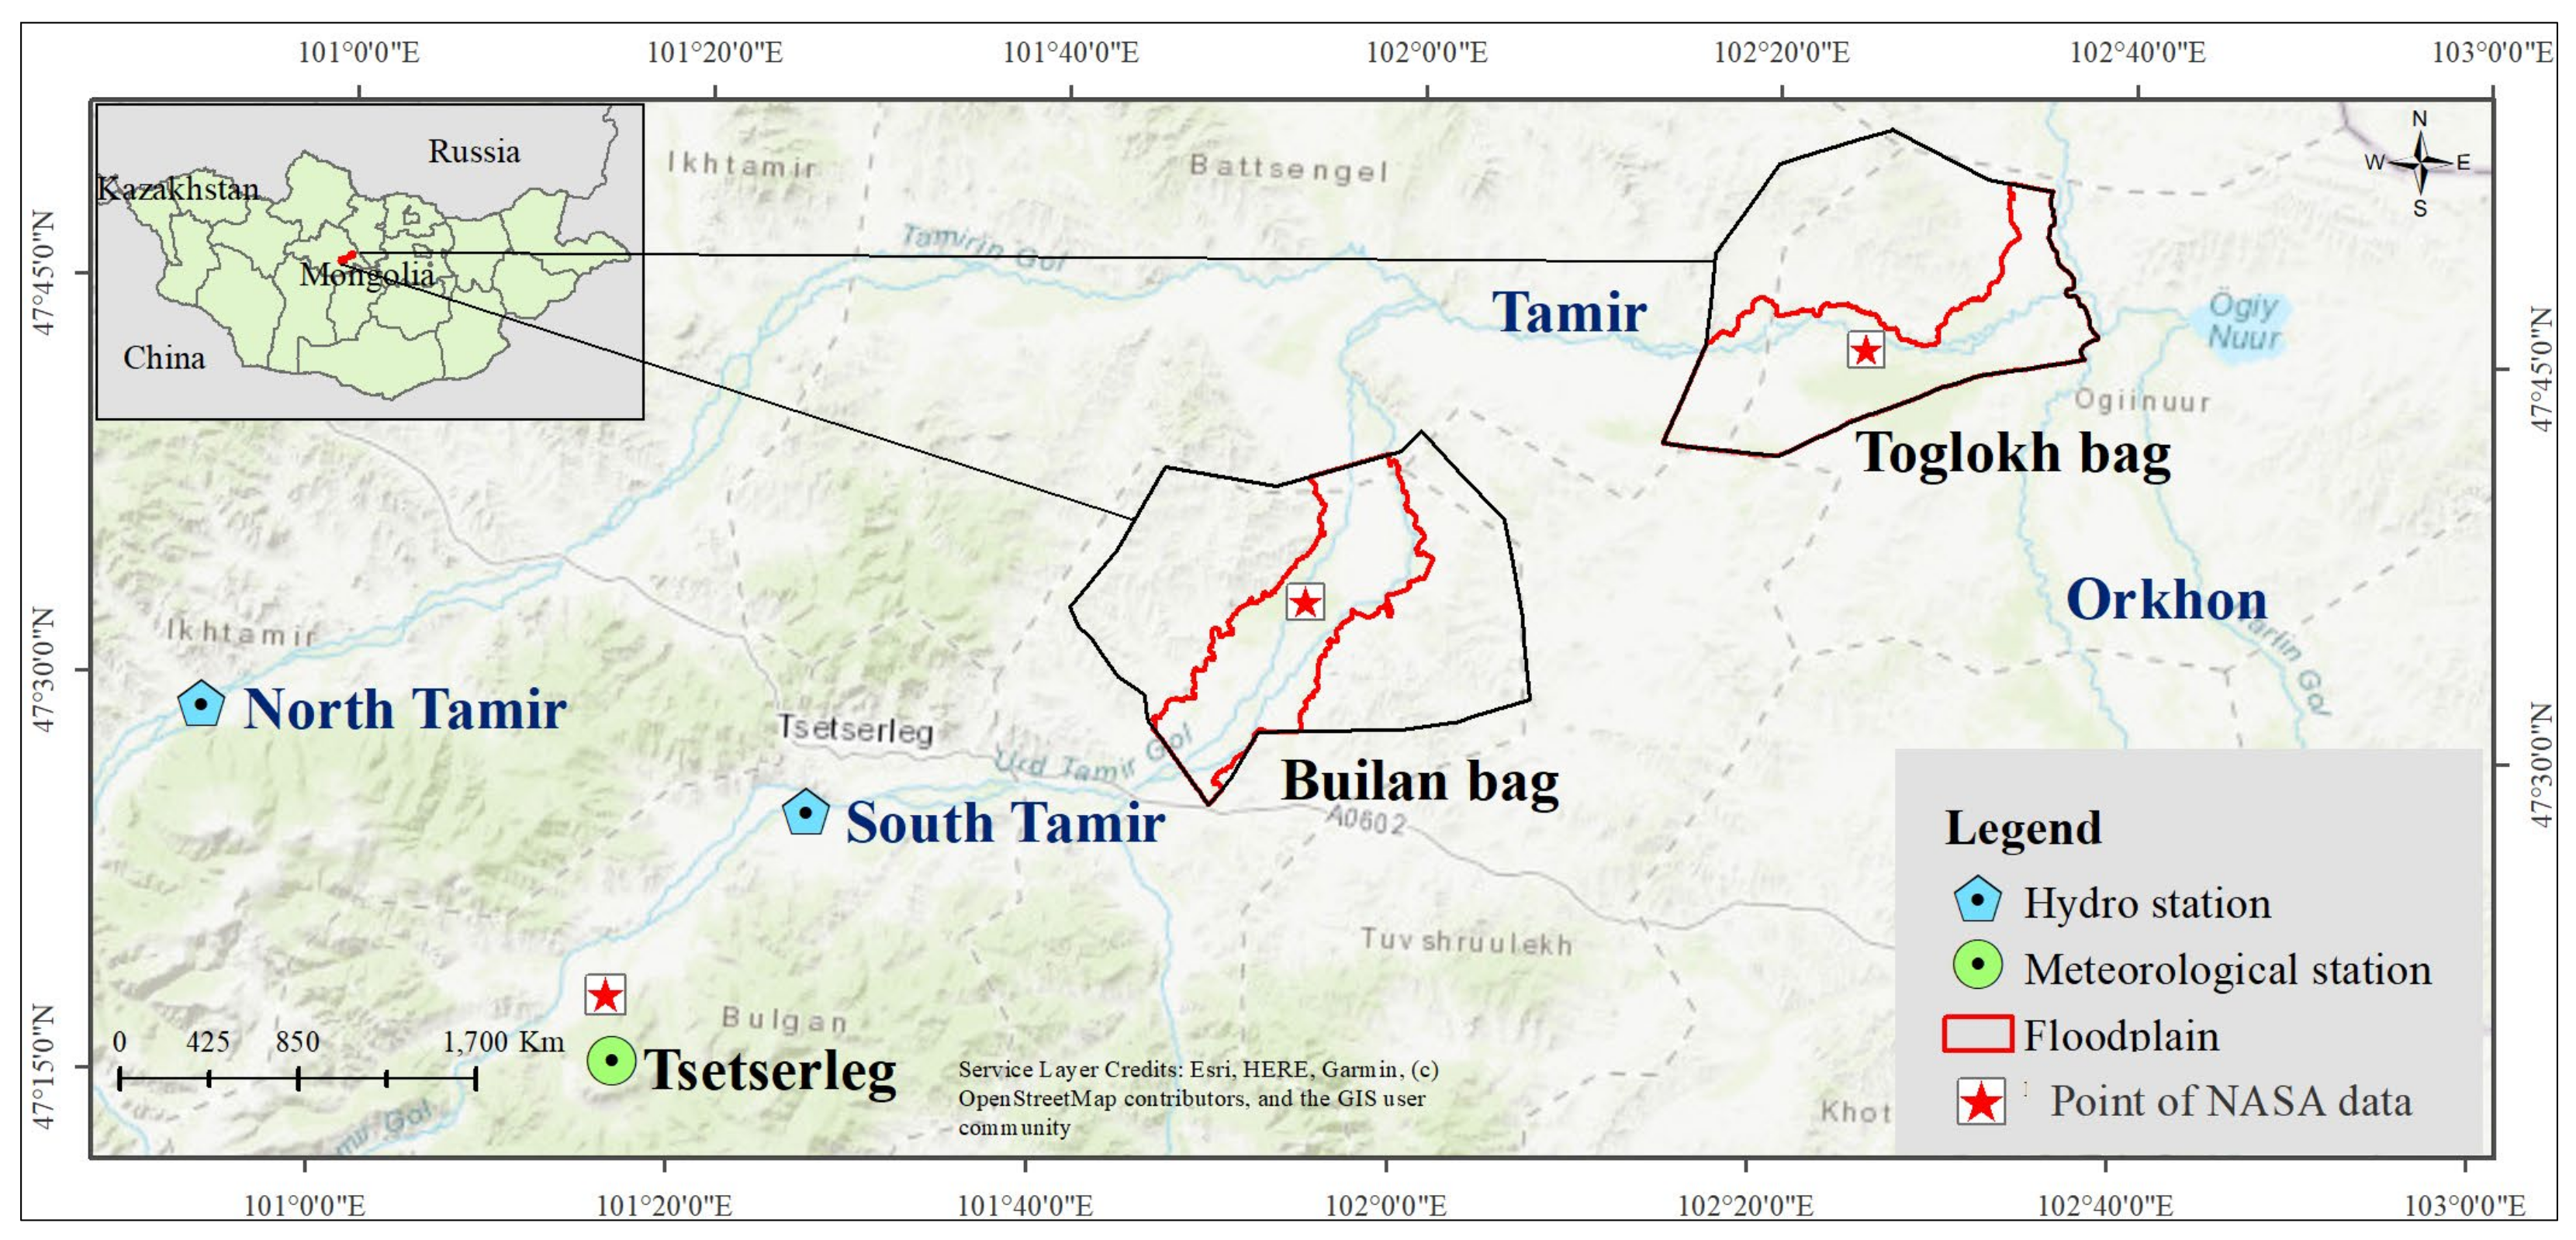
2.1. Study Area
2.2. Satellite Data
2.3. Meteorological Data
2.4. Grazing Data
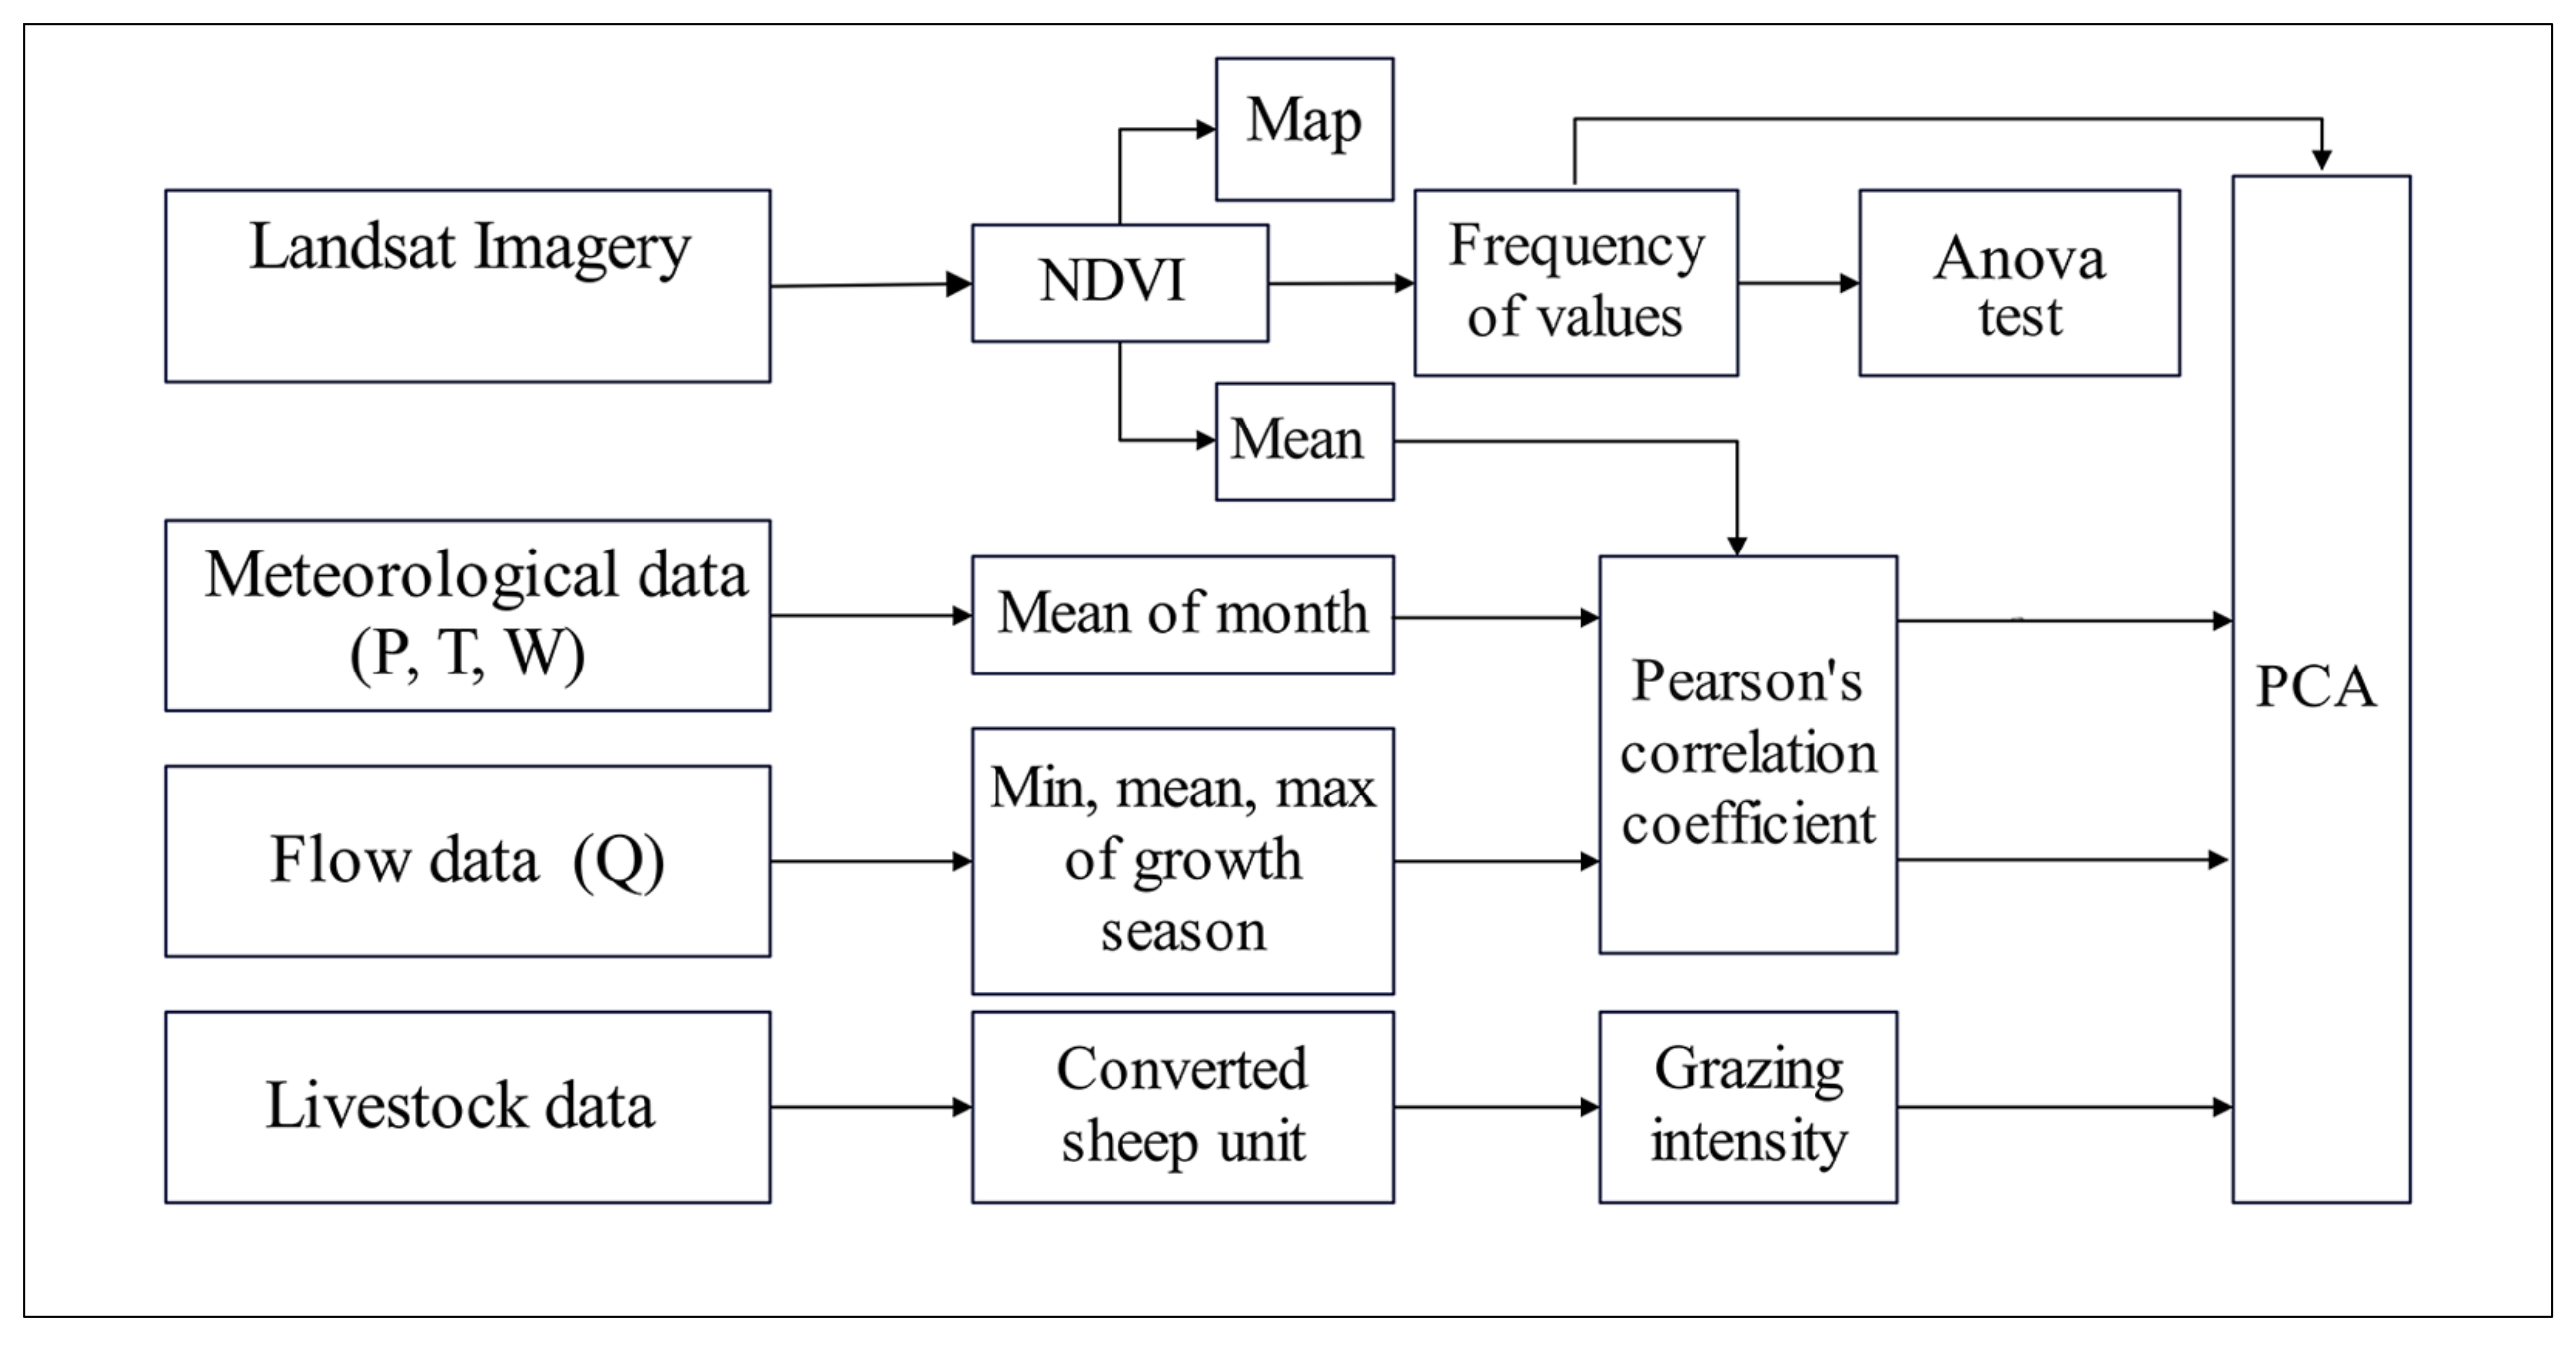
2.5. Statistical Analysis
3. Results
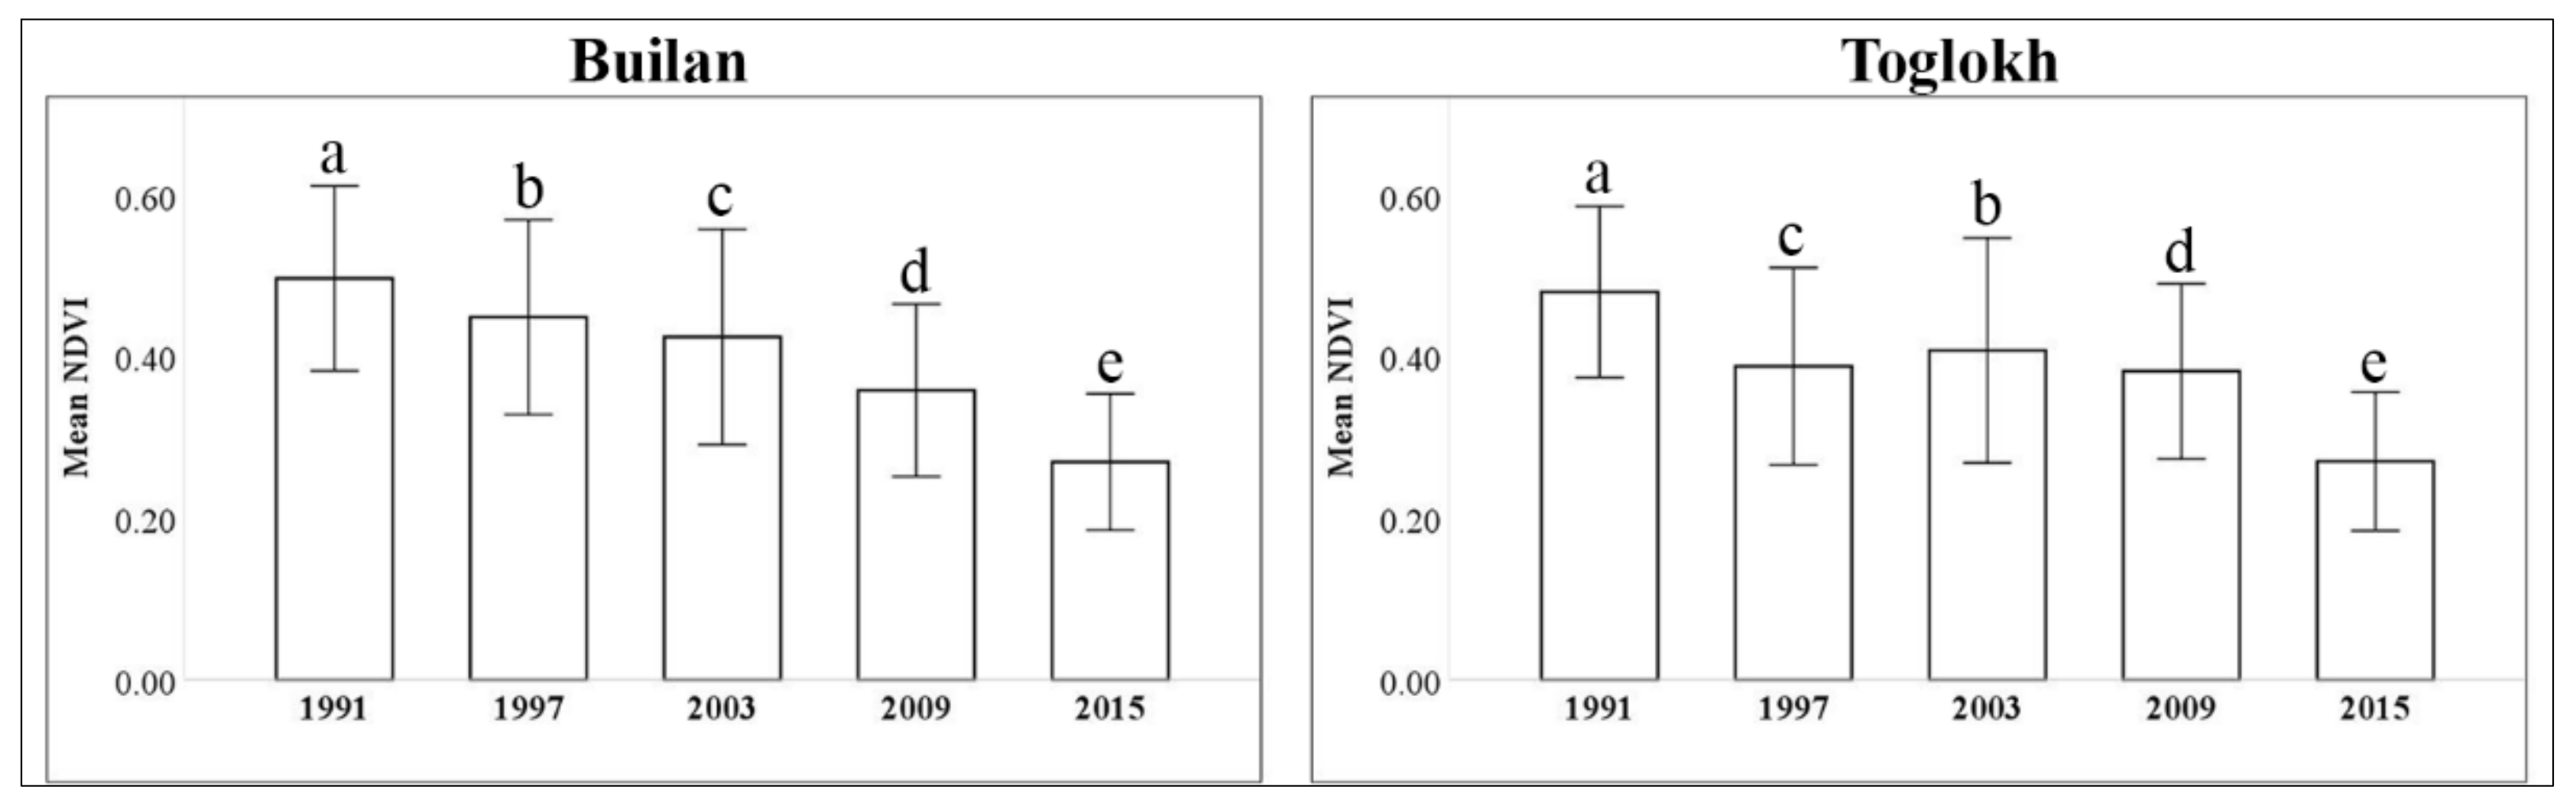
3.1. NDVI Change
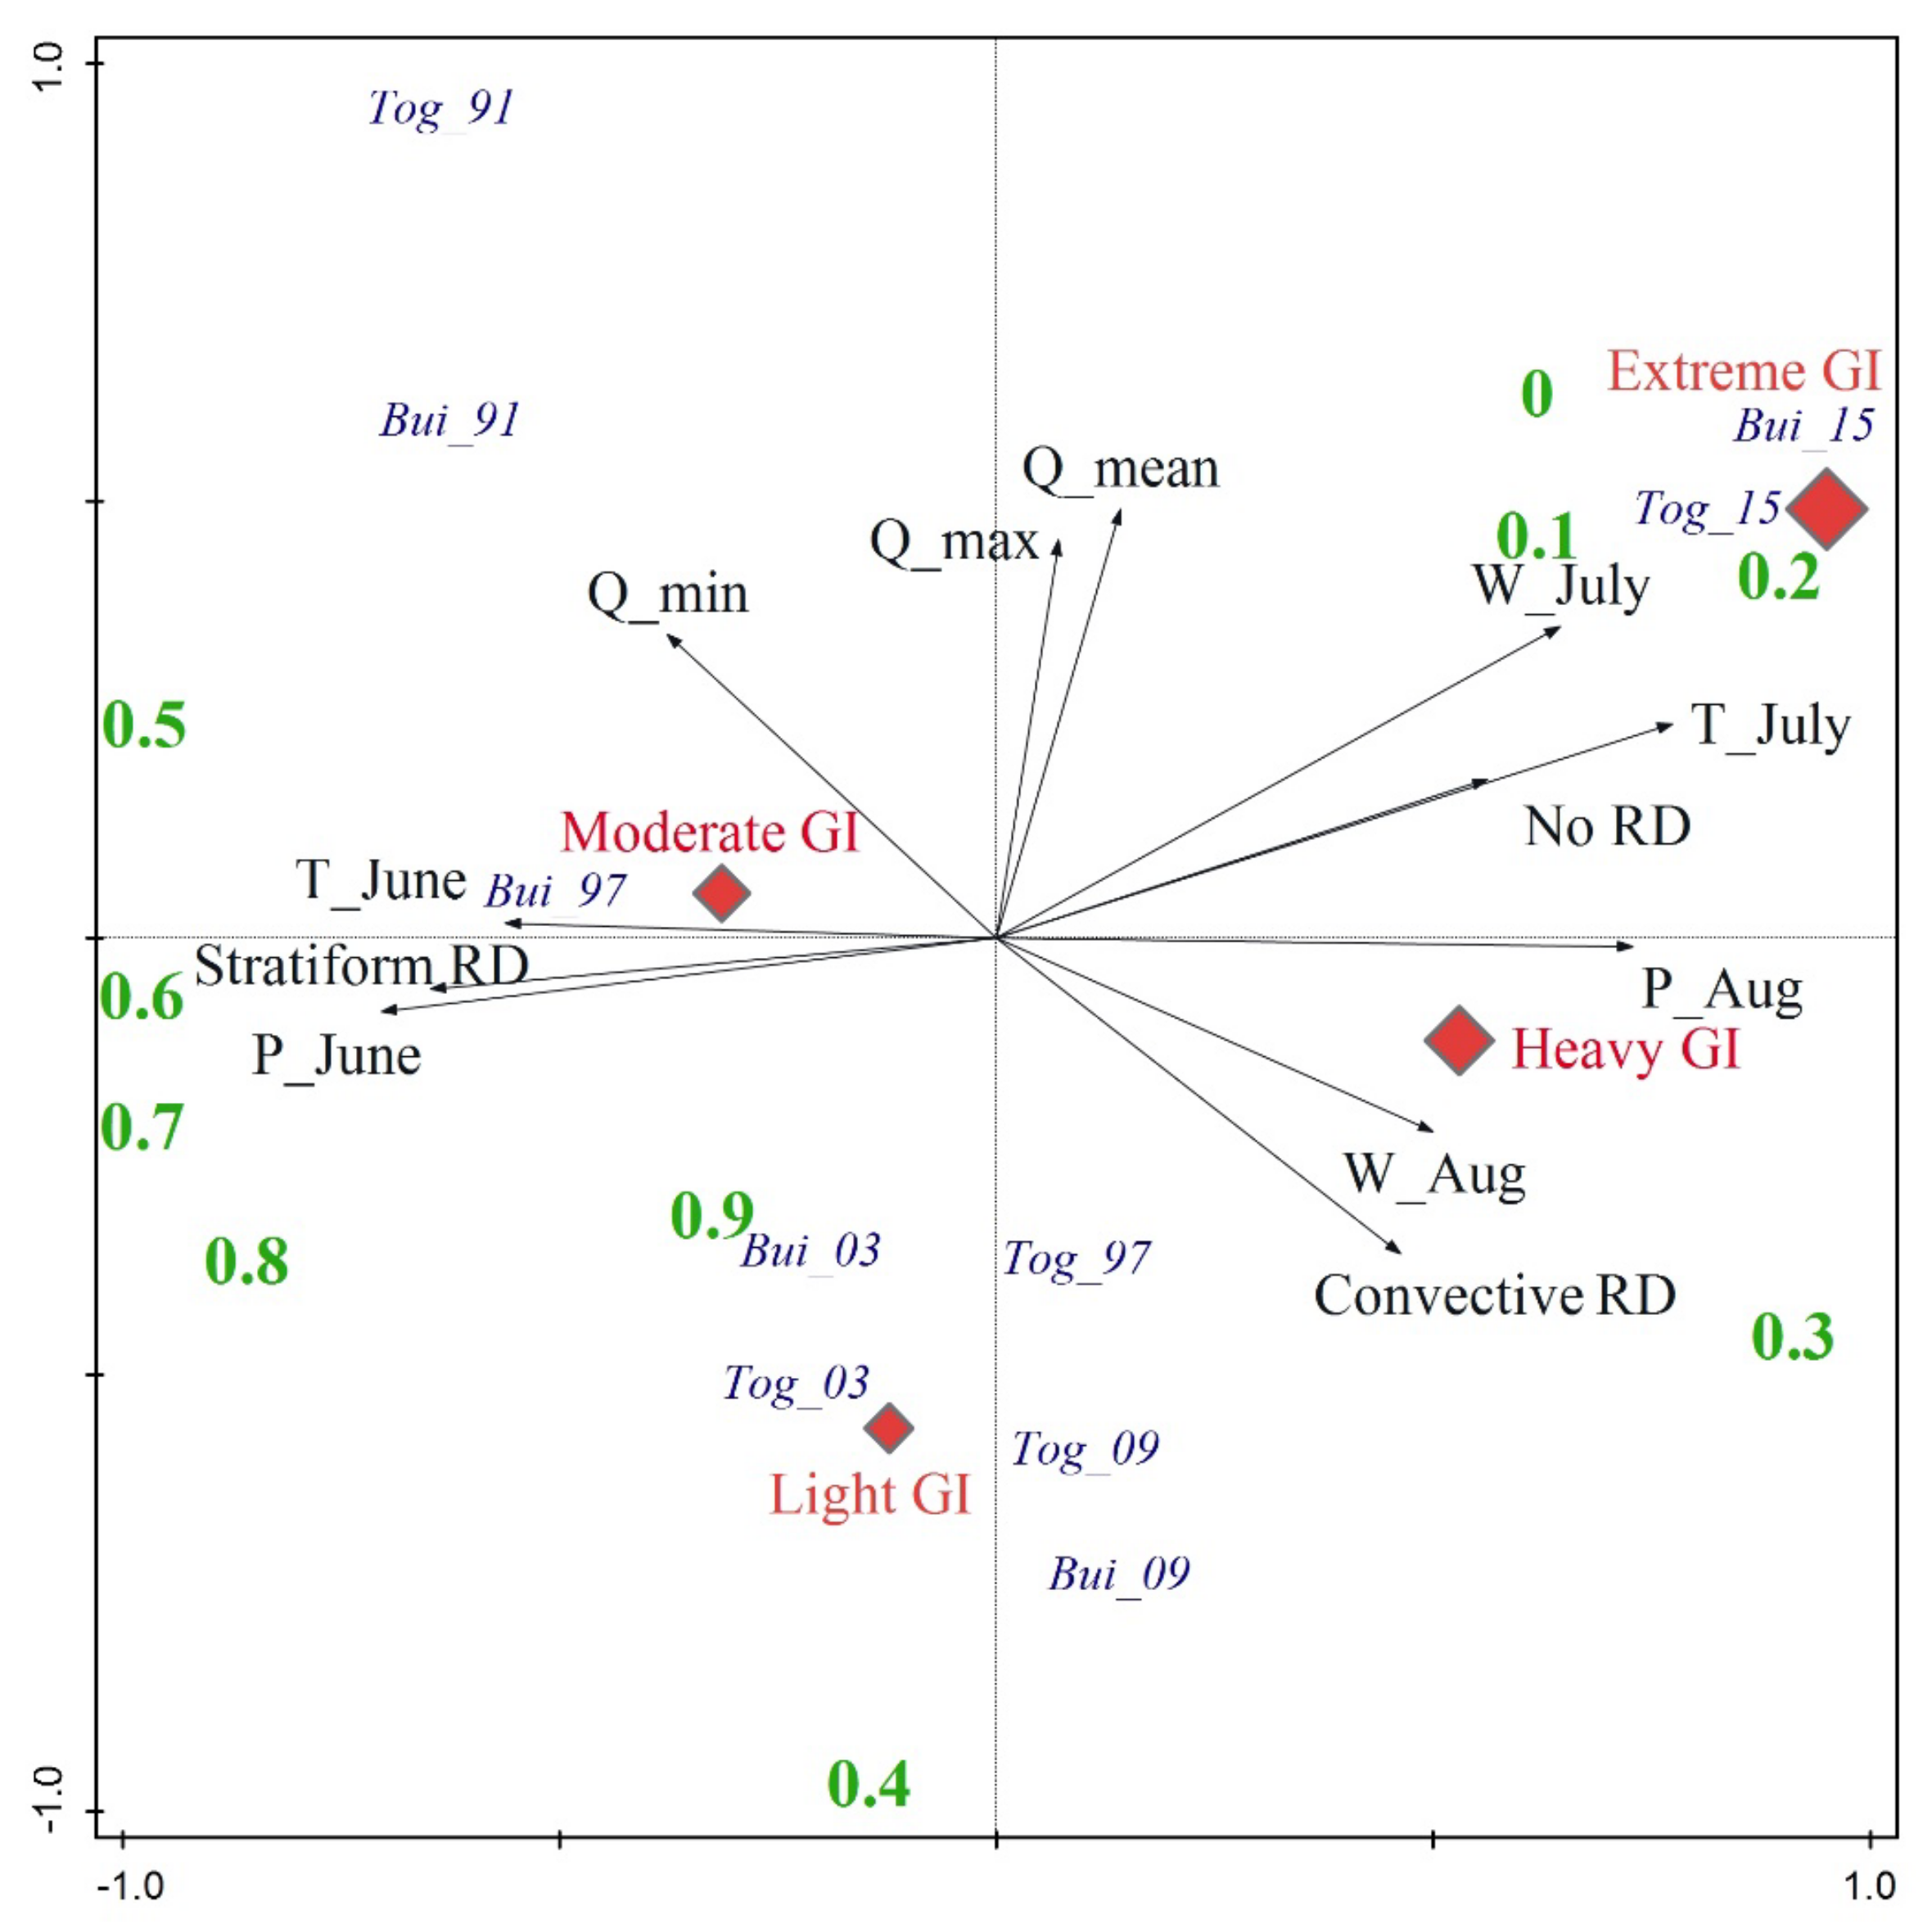
3.2. Driving Factors
3.2.1. Climatic Factors
3.2.2. Grazing Intensity
4. Discussion
5. Conclusions
Author Contributions
Funding
Data Availability Statement
Conflicts of Interest
| 1 | USGS official website. https://glovis.usgs.gov/app/ (accessed on 25 July 2017). |
| 2 | NASA’s Prediction of Worldwide Energy Resources. https://power.larc.nasa.gov/data-access-viewer/ (accessed on 13 December 2022). |
References
- Neal, J.; Schumann, G.; Bates, P. A Subgrid Channel Model for Simulating River Hydraulics and Floodplain Inundation over Large and Data Sparse Areas. Water Resour. Res. 2012, 48, 2012WR012514. [Google Scholar] [CrossRef]
- Capon, S.J.; Chambers, L.E.; Mac Nally, R.; Naiman, R.J.; Davies, P.; Marshall, N.; Pittock, J.; Reid, M.; Capon, T.; Douglas, M.; et al. Riparian Ecosystems in the 21st Century: Hotspots for Climate Change Adaptation? Ecosystems 2013, 16, 359–381. [Google Scholar] [CrossRef]
- Allan, J.D. Landscapes and Riverscapes: The Influence of Land Use on Stream Ecosystems. Annu. Rev. Ecol. Evol. Syst. 2004, 35, 257–284. [Google Scholar] [CrossRef]
- Fernandes, M.R.; Segurado, P.; Jauch, E.; Ferreira, M.T. Riparian Responses to Extreme Climate and Land-Use Change Scenarios. Sci. Total Environ. 2016, 569–570, 145–158. [Google Scholar] [CrossRef] [PubMed]
- Naiman, R.J.; Decamps, H.; Pollock, M. The Role of Riparian Corridors in Maintaining Regional Biodiversity. Ecol. Appl. 1993, 3, 209–212. [Google Scholar] [CrossRef]
- Tockner, K.; Stanford, J.A. Riverine Flood Plains: Present State and Future Trends. Environ. Conserv. 2002, 29, 308–330. [Google Scholar] [CrossRef]
- Muhury, N.; Apan, A.A.; Marasani, T.N.; Ayele, G.T. Modelling Floodplain Vegetation Response to Groundwater Variability Using the ArcSWAT Hydrological Model, MODIS NDVI Data, and Machine Learning. Land 2022, 11, 2154. [Google Scholar] [CrossRef]
- Wasko, C.; Nathan, R.; Peel, M.; Stein, L.; O’Shea, D. Understanding Changes in Flood Magnitude and Timing. In Proceedings of the Copernicus Meetings, Montpellier, France, 29 May–3 June 2022. [Google Scholar]
- Rayburg, S.; Neave, M.; Thompson-Laing, J. The Impact of Flood Frequency on the Heterogeneity of Floodplain Surface Soil Properties. Soil Syst. 2023, 7, 63. [Google Scholar] [CrossRef]
- Van Rooijen, E.; Siviglia, A.; Vetsch, D.F.; Boes, R.M.; Vanzo, D. Quantifying Fluvial Habitat Changes Due to Multiple Subsequent Floods in a Braided Alpine Reach. J. Ecohydraulics 2022, 9, 1–21. [Google Scholar] [CrossRef]
- Wang, W.; Wang, C.; Sardans, J.; Tong, C.; Jia, R.; Zeng, C.; Peñuelas, J. Flood Regime Affects Soil Stoichiometry and the Distribution of the Invasive Plants in Subtropical Estuarine Wetlands in China. CATENA 2015, 128, 144–154. [Google Scholar] [CrossRef]
- Shilpakar, R.L.; Thoms, M.C.; Reid, M.A. The Resilience of a Floodplain Vegetation Landscape. Landsc. Ecol. 2021, 36, 139–157. [Google Scholar] [CrossRef]
- Sorokin, Y.; Zelikova, T.J.; Blumenthal, D.; Williams, D.G.; Pendall, E. Seasonally Contrasting Responses of Evapotranspiration to Warming and Elevated CO2 in a Semiarid Grassland. Ecohydrology 2017, 10, e1880. [Google Scholar] [CrossRef]
- Wassens, S.; Ning, N.; Hardwick, L.; Bino, G.; Maguire, J. Long-Term Changes in Freshwater Aquatic Plant Communities Following Extreme Drought. Hydrobiologia 2017, 799, 233–247. [Google Scholar] [CrossRef]
- Metera, E.; Sakowski, T.; Słoniewski, K.; Romanowicz, B. Grazing as a Tool to Maintain Biodiversity of Grassland—A Review. Anim. Sci. Pap. Rep. 2010, 28, 315–334. [Google Scholar]
- Harezlak, V.; Augustijn, D.; Leuven, R.; Geerling, G. Measuring and modelling plant traits in floodplains of regulated rivers. In Proceedings of the 12th International Symposium on Ecohydraulics, Tokyo, Japan, 19–24 August 2018. [Google Scholar]
- Lai, L.; Kumar, S. A Global Meta-Analysis of Livestock Grazing Impacts on Soil Properties. PLoS ONE 2020, 15, e0236638. [Google Scholar] [CrossRef] [PubMed]
- Han, J.; Dai, H.; Gu, Z. Sandstorms and Desertification in Mongolia, an Example of Future Climate Events: A Review. Environ. Chem. Lett. 2021, 19, 4063–4073. [Google Scholar] [CrossRef] [PubMed]
- Huang, S.; Tang, L.; Hupy, J.P.; Wang, Y.; Shao, G. A Commentary Review on the Use of Normalized Difference Vegetation Index (NDVI) in the Era of Popular Remote Sensing. J. For. Res. 2021, 32, 2719. [Google Scholar] [CrossRef]
- Hilker, T.; Natsagdorj, E.; Waring, R.H.; Lyapustin, A.; Wang, Y. Satellite Observed Widespread Decline in Mongolian Grasslands Largely Due to Overgrazing. Glob. Change Biol. 2014, 20, 418–428. [Google Scholar] [CrossRef] [PubMed]
- Liu, Y.Y.; Evans, J.P.; McCabe, M.F.; De Jeu, R.A.M.; Van Dijk, A.I.J.M.; Dolman, A.J.; Saizen, I. Changing Climate and Overgrazing Are Decimating Mongolian Steppes. PLoS ONE 2013, 8, e57599. [Google Scholar] [CrossRef]
- Cheng, Y.; Tsubo, M.; Ito, T.Y.; Nishihara, E.; Shinoda, M. Impact of Rainfall Variability and Grazing Pressure on Plant Diversity in Mongolian Grasslands. J. Arid Environ. 2011, 75, 471–476. [Google Scholar] [CrossRef]
- Miao, L.; Sun, Z.; Ren, Y.; Schierhorn, F.; Müller, D. Grassland Greening on the Mongolian Plateau despite Higher Grazing Intensity. Land Degrad. Dev. 2021, 32, 792–802. [Google Scholar] [CrossRef]
- Sternberg, T. Unravelling Mongolia’s Extreme Winter Disaster of 2010. Nomadic Peoples 2010, 14, 72–86. [Google Scholar] [CrossRef]
- Rao, M.P.; Davi, N.K.; D’Arrigo, R.D.; Skees, J.; Nachin, B.; Leland, C.; Lyon, B.; Wang, S.-Y.; Byambasuren, O. Dzuds, Droughts, and Livestock Mortality in Mongolia. Environ. Res. Lett. 2015, 10, 074012. [Google Scholar] [CrossRef]
- Fernandez-Gimenez, M.E.; Batjav, B.; Baival, B. Lessons from the Dzud: Adaptation and Resilience in Mongolian Pastoral Social-Ecological Systems; World Bank: Washington, DC, USA, 2012. [Google Scholar]
- Batima, P.; Natsagdorj, L.; Gombluudev, P.; Erdenetsetseg, B. Observed Climate Change in Mongolia. In AIACC Working Paper No.12; An Electronic Publication of the AIACC Project; AIACC: Washington, DC, USA, 2005; Available online: https://start.org/wp-content/uploads/AIACCsummary.pdf (accessed on 25 March 2024).
- Reading, R.P.; Bedunah, D.J.; Amgalanbaatar, S. Conserving Biodiversity on Mongolian Rangelands: Implications for Protected Area Development and Pastoral Uses. In USDA Forest Service Proceedings; USDA Forest Service: Washington, DC, USA, 2006. [Google Scholar]
- NSO (National Statistics Office) 2015. Available online: https://www2.1212.mn/stat.aspx?LIST_ID=976_L10_1&year=2015 (accessed on 26 May 2024).
- Nandintsetseg, B.; Boldgiv, B.; Chang, J.; Ciais, P.; Davaanyam, E.; Batbold, A.; Bat-Oyun, T.; Stenseth, N.C. Risk and Vulnerability of Mongolian Grasslands under Climate Change. Environ. Res. Lett. 2021, 16, 034035. [Google Scholar] [CrossRef]
- Tserendash, S.; Bilegt, T. Pasture, Soil Utilization, and Management; Admon Printing: Ulaanbaatar, Mongolia, 2017; Volume IV. [Google Scholar]
- Davaa, G.; Oyunbaatar, D. Surface Water of Mongolia; Admon Printing: Ulaanbaatar, Mongolia, 2017; Volume II. [Google Scholar]
- Zorigt, M.; Battulga, G.; Sarantuya, G.; Kenner, S.; Soninkhishig, N.; Hauck, M. Runoff Dynamics of the Upper Selenge Basin, a Major Water Source for Lake Baikal, under a Warming Climate. Reg. Environ. Change 2019, 19, 2609–2619. [Google Scholar] [CrossRef]
- Sumiya, V.; Yamkhin, J.; Gansukh, T.-E.; Ganbold, U.; Jargalsaikhan, O.; Batbayar, N. The Effects of Livestock Grazing on Soil Water Content in a Wetland of Mongolia. Mong. J. Biol. Sci. 2023, 21, 15–21. [Google Scholar]
- Klemas, V. Remote Sensing of Riparian and Wetland Buffers: An Overview. J. Coast. Res. 2014, 297, 869–880. [Google Scholar] [CrossRef]
- Milani, G.; Kneubühler, M.; Tonolla, D.; Doering, M.; Schaepman, M.E. Characterizing Flood Impact on Swiss Floodplains Using Interannual Time Series of Satellite Imagery. IEEE J. Sel. Top. Appl. Earth Obs. Remote Sens. 2020, 13, 1479–1493. [Google Scholar] [CrossRef]
- Parsons, M.; Thoms, M.C. Patterns of Vegetation Greenness during Flood, Rain and Dry Resource States in a Large, Unconfined Floodplain Landscape. J. Arid Environ. 2013, 88, 24–38. [Google Scholar] [CrossRef]
- Castelli, R.M.; Chambers, J.C.; Tausch, R.J. Soil-Plant Relations along a Soil-Water Gradient in Great Basin Riparian Meadows. Wetlands 2000, 20, 251–266. [Google Scholar] [CrossRef]
- Batjargal, D.; Batsukh, N. Calculation of Potential Groundwater Resources in Orkhon River Basin. Mong. Geosci. 2022, 27, 9–19. [Google Scholar] [CrossRef]
- Densambuu, B.; Sainnemekh, S.; Bestelmeyer, B.; Ulambayar, B.; Tseelei, E.-A.; Battur, A.; Baasandai, E. National Report on the Rangeland Health of Mongolia: Second Assessment; Green Gold-Animal Health Project, SDC: Ulaanbaatar, Mongolia, 2018; 62p. [Google Scholar]
- Vandandorj, S.; Munkhjargal, E.; Boldgiv, B.; Gantsetseg, B. Changes in Event Number and Duration of Rain Types over Mongolia from 1981 to 2014. Environ. Earth Sci 2017, 76, 70. [Google Scholar] [CrossRef]
- Vandandorj, S.; Gantsetseg, B.; Boldgiv, B. Spatial and Temporal Variability in Vegetation Cover of Mongolia and Its Implications. J. Arid Land 2015, 7, 450–461. [Google Scholar] [CrossRef]
- Surenkhorloo, P.; Buyanaa, C.; Dolgorjav, S.; Bazarsad, C.-O.; Zamba, B.; Bayarsaikhan, S.; Heiner, M. Identifying Riparian Areas of Free Flowing Rivers for Legal Protection: Model Region Mongolia. Sustainability 2021, 13, 551. [Google Scholar] [CrossRef]
- Mansour, K. Remote Sensing Based Indicators of Vegetation Species for Assessing Rangeland Degradation: Opportunities and Challenges. Afr. J. Agric. Res. 2012, 7, 3261–3270. [Google Scholar] [CrossRef]
- Rivera-Marin, D.; Dash, J.; Ogutu, B. The Use of Remote Sensing for Desertification Studies: A Review. J. Arid Environ. 2022, 206, 104829. [Google Scholar] [CrossRef]
- Drisya, J.; Roshni, T. Chapter 27—Spatiotemporal Variability of Soil Moisture and Drought Estimation Using a Distributed Hydrological Model. In Integrating Disaster Science and Management; Samui, P., Kim, D., Ghosh, C., Eds.; Elsevier: Amsterdam, The Netherlands, 2018; pp. 451–460. ISBN 978-0-12-812056-9. [Google Scholar]
- White, J.W.; Hoogenboom, G.; Wilkens, P.W.; Stackhouse, P.W.; Hoel, J.M. Evaluation of Satellite-Based, Modeled-Derived Daily Solar Radiation Data for the Continental United States. Agron. J. 2011, 103, 1242–1251. [Google Scholar] [CrossRef]
- Kadhim Tayyeh, H.; Mohammed, R. Analysis of NASA POWER Reanalysis Products to Predict Temperature and Precipitation in Euphrates River Basin. J. Hydrol. 2023, 619, 129327. [Google Scholar] [CrossRef]
- Chen, T.; Xu, H.; Qi, X.; Shan, S.; Chen, S.; Deng, Y. Temporal Dynamics of Satellite-Derived Vegetation Pattern and Growth in an Arid Inland River Basin, Tibetan Plateau. Glob. Ecol. Conserv. 2022, 38, e02262. [Google Scholar] [CrossRef]
- Halin, Z.; Zhang, T.-H.; Zhao, X.; Zhou, R.-L. Effects of Sheep Grazing and Precipitation Patterns on Sandy Grassland Vegetation in Inner Mongolia, China. In Proceedings of the 2nd International Conference on Environmental Science and Development, Mumbai, India, 7–9 January 2011. [Google Scholar]
- Zhou, X.; Wang, J.; Hao, Y.; Wang, Y. Intermediate Grazing Intensities by Sheep Increase Soil Bacterial Diversities in an Inner Mongolian Steppe. Biol. Fertil. Soils 2010, 46, 817–824. [Google Scholar] [CrossRef]
- Keselman, H.J.; Murray, R. Tukey Tests for Pair-Wise Contrasts Following the Analysis of Variance: Is There a Type IV Error? Psychol. Bull. 1974, 81, 608–609. [Google Scholar] [CrossRef]
- Braak, C.J.F.; Ṡmilauer, P. Canoca Reference Manual and User’s Guide; Microcomputer Power: Ithaca, NY, USA, 2018. [Google Scholar]
- Bendix, J.; Hupp, C.R. Hydrological and Geomorphological Impacts on Riparian Plant Communities. Hydrol. Process. 2000, 14, 2977–2990. [Google Scholar] [CrossRef]
- Merritt, D.M.; Scott, M.L.; LeROY Poff, N.; Auble, G.T.; Lytle, D.A. Theory, Methods and Tools for Determining Environmental Flows for Riparian Vegetation: Riparian Vegetation-flow Response Guilds. Freshw. Biol. 2010, 55, 206–225. [Google Scholar] [CrossRef]
- Moliere, D.R.; Lowry, J.B.C.; Humphrey, C.L. Classifying the Flow Regime of Data-Limited Streams in the Wet-Dry Tropical Region of Australia. J. Hydrol. 2009, 367, 1–13. [Google Scholar] [CrossRef]
- Maltchik, L.; Medeiros, E.S.F. Conservation Importance of Semi-Arid Streams in North-Eastern Brazil: Implications of Hydrological Disturbance and Species Diversity. Aquat. Conserv. Mar. Freshw. Ecosyst. 2006, 16, 665–677. [Google Scholar] [CrossRef]
- Rountree, M.W.; Rogers, K.H.; Heritage, G.L. Landscape state change in the semi-arid sabie river, kruger national park, in response to flood and drought. S. Afr. Geogr. J. 2000, 82, 173–181. [Google Scholar] [CrossRef]
- Naiman, R.J.; Latterell, J.J.; Pettit, N.E.; Olden, J.D. Flow Variability and the Biophysical Vitality of River Systems. Comptes Rendus Geosci. 2008, 340, 629–643. [Google Scholar] [CrossRef]
- Hering, D.; Gerhard, M.; Manderbach, R.; Reich, M. Impact of a 100-Year Flood on Vegetation, Benthic Invertebrates, Riparian Fauna and Large Woody Debris Standing Stock in an Alpine Floodplain. River Res. Applic. 2004, 20, 445–457. [Google Scholar] [CrossRef]
- Bao, G.; Qin, Z.; Bao, Y.; Zhou, Y.; Li, W.; Sanjjav, A. NDVI-Based Long-Term Vegetation Dynamics and Its Response to Climatic Change in the Mongolian Plateau. Remote Sens. 2014, 6, 8337–8358. [Google Scholar] [CrossRef]
- Nilsson, C.; Jansson, R.; Kuglerová, L.; Lind, L.; Ström, L. Boreal Riparian Vegetation Under Climate Change. Ecosystems 2013, 16, 401–410. [Google Scholar] [CrossRef]
- Nilsson, C.; Brown, R.L.; Jansson, R.; Merritt, D.M. The Role of Hydrochory in Structuring Riparian and Wetland Vegetation. Biol. Rev. 2010, 85, 837–858. [Google Scholar] [CrossRef]
- Chu, H.; Venevsky, S.; Wu, C.; Wang, M. NDVI-Based Vegetation Dynamics and Its Response to Climate Changes at Amur-Heilongjiang River Basin from 1982 to 2015. Sci. Total Environ. 2019, 650, 2051–2062. [Google Scholar] [CrossRef]
- Goulden, C.E.; Mead, J.; Horwitz, R.; Goulden, M.; Nandintsetseg, B.; McCormick, S.; Boldgiv, B.; Petraitis, P.S. Interviews of Mongolian Herders and High Resolution Precipitation Data Reveal an Increase in Short Heavy Rains and Thunderstorm Activity in Semi-Arid Mongolia. Clim. Change 2016, 136, 281–295. [Google Scholar] [CrossRef]
- Mandakh, N.; Tsogtbaatar, J.; Dash, D.; Khudulmur, S. Spatial Assessment of Soil Wind Erosion Using WEQ Approach in Mongolia. J. Geogr. Sci. 2016, 26, 473–483. [Google Scholar] [CrossRef]
- Gardiner, B.; Berry, P.; Moulia, B. Review: Wind Impacts on Plant Growth, Mechanics and Damage. Plant Sci. 2016, 245, 94–118. [Google Scholar] [CrossRef] [PubMed]
- Van Gardingen, P.; Grace, J. Plants and Wind. In Advances in Botanical Research; Callow, J.A., Ed.; Academic Press: Cambridge, MA, USA, 1991; Volume 18, pp. 189–253. [Google Scholar]
- Ennos, A.R. Wind as an Ecological Factor. Trends Ecol. Evol. 1997, 12, 108–111. [Google Scholar] [CrossRef] [PubMed]
- Ma, Q.; Chai, L.; Hou, F.; Chang, S.; Ma, Y.; Tsunekawa, A.; Cheng, Y. Quantifying Grazing Intensity Using Remote Sensing in Alpine Meadows on Qinghai-Tibetan Plateau. Sustainability 2019, 11, 417. [Google Scholar] [CrossRef]
- Mijiddorj, T.N.; Alexander, J.S.; Samelius, G.; Mishra, C.; Boldgiv, B. Traditional Livelihoods under a Changing Climate: Herder Perceptions of Climate Change and Its Consequences in South Gobi, Mongolia. Clim. Change 2020, 162, 1065–1079. [Google Scholar] [CrossRef]
- Kowal, V.A.; Ahlborn, J.; Jamsranjav, C.; Avirmed, O.; Chaplin-Kramer, R. Modeling Integrated Impacts of Climate Change and Grazing on Mongolia’s Rangelands. Land 2021, 10, 397. [Google Scholar] [CrossRef]
- Fernández-Giménez, M.E. The Effects of Livestock Privatisation on Pastoral Land Use and Land Tenure in Post-Socialist Mongolia. Nomadic Peoples 2001, 5, 49–66. [Google Scholar] [CrossRef]
- Fernandez-Gimenez, M.E.; Batbuyan, B. Law and Disorder: Local Implementation of Mongolia’s Land Law. Dev. Change 2004, 35, 141–166. [Google Scholar] [CrossRef]
- Li, A.; Wu, J.; Huang, J. Distinguishing between Human-Induced and Climate-Driven Vegetation Changes: A Critical Application of RESTREND in Inner Mongolia. Landsc. Ecol. 2012, 27, 969–982. [Google Scholar] [CrossRef]
- Alaoui, A.; Rogger, M.; Peth, S.; Blöschl, G. Does Soil Compaction Increase Floods? A Review. J. Hydrol. 2018, 557, 631–642. [Google Scholar] [CrossRef]
- Clary, W.P. Vegetation and Soil Responses to Grazing Simulation on Riparian Meadows. J. Range Manag. 1995, 48, 18. [Google Scholar] [CrossRef]
- Zhan, T.; Zhang, Z.; Sun, J.; Liu, M.; Zhang, X.; Peng, F.; Tsunekawa, A.; Zhou, H.; Gou, X.; Fu, S. Meta-Analysis Demonstrating That Moderate Grazing Can Improve the Soil Quality across China’s Grassland Ecosystems. Appl. Soil Ecol. 2020, 147, 103438. [Google Scholar] [CrossRef]
- Miller, J.; Chanasyk, D.; Curtis, T.; Entz, T.; Willms, W. Influence of Streambank Fencing with a Cattle Crossing on Riparian Health and Water Quality of the Lower Little Bow River in Southern Alberta, Canada. Agric. Water Manag. 2010, 97, 247–258. [Google Scholar] [CrossRef]
- Sovell, L.; Vondracek, B.; Frost, J.; Mumford, K. Impacts of Rotational Grazing and Riparian Buffers on Physicochemical and Biological Characteristicsof Southeastern Minnesota, USA, Streams. Environ. Manag. 2000, 26, 629–641. [Google Scholar] [CrossRef]
- Miller, J.; Chanasyk, D.; Curtis, T.; Entz, T.; Willms, W. Environmental Quality of Lower Little Bow River and Riparian Zone along an Unfenced Reach with Off-Stream Watering. Agric. Water Manag. 2011, 98, 1505–1515. [Google Scholar] [CrossRef]


| Floodplain | May | June | July | August | |||||
|---|---|---|---|---|---|---|---|---|---|
| z | slope | z | slope | z | slope | z | slope | ||
| Builan | T | −0.142 | −0.053 | 0.022 | 0.007 | 0.087 | 0.021 | 0.203 | 0.080 |
| P | −0.051 | −0.091 | −0.080 | −0.394 | 0.007 | 0.210 | 0.123 | 0.311 | |
| W | 0.106 | 0.009 | −0.131 | −0.008 | 0.055 | 0.002 | 0.072 | 0.007 | |
| Toglokh | T | −0.174 | −0.059 | −0.007 | −0.001 | 0.087 | 0.015 | 0.181 | 0.077 |
| P | −0.029 | −0.074 | −0.159 | −0.545 | −0.014 | −0.103 | 0.188 | 0.474 | |
| W | 0.080 | 0.004 | 0.029 | 0.002 | 0.157 | 0.005 | 0 | −0.001 | |
| Years | 1991 | 1997 | 2003 | 2009 | 2015 |
|---|---|---|---|---|---|
| Builan | 0.013 | 0.015 | 0.018 | 0.011 | 0.007 |
| Toglokh | 0.011 | 0.015 | 0.019 | 0.012 | 0.007 |
| Builan | Toglokh | |||||||
|---|---|---|---|---|---|---|---|---|
| Year | 1997 | 2003 | 2009 | 2015 | 1997 | 2003 | 2009 | 2015 |
| 1991 | 0.048 * | 0.073 * | 0.139 * | 0.227 * | 0.092 * | 0.072 * | 0.098 * | 0.221 * |
| 1997 | 0.024 * | 0.090 * | 0.179 * | −0.019 * | 0.006 * | 0.118 * | ||
| 2003 | 0.066 * | 0.155 * | 0.026 * | 0.138 * | ||||
| 2009 | 0.089 * | 0.112 * | ||||||
| Factors | May | June | July | August | June to August |
|---|---|---|---|---|---|
| Q min. | - | - | - | - | 0.409 |
| Q mean | - | - | - | - | −0.102 |
| Q max. | - | - | - | - | −0.051 |
| Temperature | 0.293 | 0.580 | −0.766 ** | −0.077 | - |
| Precipitation | −0.246 | 0.688 * | 0.129 | −0.751 * | - |
| Wind speed | −0.150 | −0.169 | −0.643 * | −0.507 | - |
| No rain days | - | - | - | - | −0.569 |
| Stratiform rain days | 0.666 * | ||||
| Convective rain days | −0.503 |
Disclaimer/Publisher’s Note: The statements, opinions and data contained in all publications are solely those of the individual author(s) and contributor(s) and not of MDPI and/or the editor(s). MDPI and/or the editor(s) disclaim responsibility for any injury to people or property resulting from any ideas, methods, instructions or products referred to in the content. |
© 2024 by the authors. Licensee MDPI, Basel, Switzerland. This article is an open access article distributed under the terms and conditions of the Creative Commons Attribution (CC BY) license (https://creativecommons.org/licenses/by/4.0/).
Share and Cite
Nyamjav, L.; Nergui, S.; Gantumur, B.; Zorigt, M.; Jansson, R. Long-Term Response of Floodplain Meadow Normalized Difference Vegetation Index to Hydro-Climate and Grazing Pressure: Tamir River Plains, Mongolia. Land 2024, 13, 781. https://doi.org/10.3390/land13060781
Nyamjav L, Nergui S, Gantumur B, Zorigt M, Jansson R. Long-Term Response of Floodplain Meadow Normalized Difference Vegetation Index to Hydro-Climate and Grazing Pressure: Tamir River Plains, Mongolia. Land. 2024; 13(6):781. https://doi.org/10.3390/land13060781
Chicago/Turabian StyleNyamjav, Lkhaakhuu, Soninkhishig Nergui, Byambakhuu Gantumur, Munkhtsetseg Zorigt, and Roland Jansson. 2024. "Long-Term Response of Floodplain Meadow Normalized Difference Vegetation Index to Hydro-Climate and Grazing Pressure: Tamir River Plains, Mongolia" Land 13, no. 6: 781. https://doi.org/10.3390/land13060781