Article

Quantifying Dissolved Organic Carbon Efflux from Drained Peatlands in Hemiboreal Latvia

by
Raitis Normunds Meļņiks
*,
Emīls Mārtiņš Upenieks
,
Aldis Butlers
,
Arta Bārdule
,
Santa Kalēja
and
Andis Lazdiņš
*
Latvian State Forest Research Institute ‘Silava’ (LSFRI Silava), Rigas Str. 111, LV-2169 Salaspils, Latvia
*
Authors to whom correspondence should be addressed.
Land 2024, 13(6), 790; https://doi.org/10.3390/land13060790
Submission received: 26 April 2024 / Revised: 27 May 2024 / Accepted: 31 May 2024 / Published: 3 June 2024

Abstract

:
This study evaluated the impact of different land use types on groundwater dissolved organic carbon (DOC) concentrations and annual DOC efflux from drained peatlands to catchment runoff, providing insights into the mechanisms of carbon stock changes in peatland soils. We measured groundwater chemical properties and various environmental variables, and calculated daily runoff and evapotranspiration for 2021 to estimate monthly and annual DOC efflux and analyzed main affecting factors in different peatland land use types. The highest DOC concentrations in groundwater were found in Scots pine forests and active peat extraction sites, with values of 113.7 mg L−1 and 109.7 mg L−1, respectively, and the lowest in silver birch forests and croplands, at 51.9 mg L−1 and 18.6 mg L−1, respectively. There were statistically significant correlations, including a strong negative correlation between DOC concentrations and several groundwater chemical properties, such as pH, electrical conductivity (EC), Ca, Mg, and K concentrations. The concentrations of DOC in the groundwater of drained peatland showed significant variation between different land use types. The highest annual DOC efflux was observed in active peat extraction sites, at 513.1 kg ha−1 y−1, while the lowest was in grasslands, at 61.9 kg ha−1 y−1, where Ca and Mg concentrations, as well as EC, were the highest. Continuous monitoring of these concentration patterns is essential.

1. Introduction

Under wet soil conditions, the production of soil organic matter exceeds decomposition; thus, organic material accumulation can occur [1,2]. Areas where a layer of peat has naturally formed are called peatlands, which are of fundamental ecological importance, being the most efficient carbon (C) sinks among other terrestrial ecosystems [3,4]. These large C sinks in peatlands are ensured by the wet conditions—natural peatlands are always wetlands [5]. Most peatland areas can be found in the temperate zone of North America and Eurasia, and they cover [6] roughly 2.8% of the world’s land area; furthermore, they hold between one-third and one-half of the world’s soil carbon (C) stock. Nonetheless, these vital ecosystems are under considerable risk from the dual challenges of heavy land use and drainage on a global scale. Studies also suggest that global atmosphere warming in temperate and boreal zones can indeed lower groundwater levels and impact carbon accumulation in wetlands [6,7,8]. Lowering the water table by drainage is a prerequisite for peatland forestry, use for agriculture, and peat extraction in most countries [9,10]. These practices are also common in Latvia, where more than 10% of the total area is covered by peatlands [11,12]. As a result, the hydrological regime of the peatlands is altered, and mineralization of peat is promoted, resulting in increased gross C losses. After drainage, the peat initially begins to decompose rapidly, which can cause the greenhouse gas (GHG) emissions to increase. However, both natural and drained peatlands can experience significant mineralization, particularly during dry summer conditions [13,14,15].
On-site emissions occur locally, but off-site emissions occur when waterborne organic matter (including DOC) is transported outside peatland areas and further emitted as CO2 or CH4 due to biological or chemical transformation [16]. Over the course of the past 30 years, increasing concentrations of DOC have been observed in surface waters in several parts of Europe and North America, which implies an increased release of dissolved organic matter from soils [17]. DOC is mostly defined as organic molecules that can pass through a filter with a pore size of 0.45 µm. It is formed during the decomposition of organic matter and transported by water [18]. Forest floor, ground vegetation, litter, and wood debris are considered important sources of DOC and comprise different substrates that produce different volumes of DOC with varying complexity [19]. DOC fluxes are an important source of carbon in most ecosystems and facilitate the transfer of nutrients from terrestrial to aquatic ecosystems [20]. C emissions from water can make up to 15–50% of total GHG emissions, and DOC accounts for most of them [16]. However, the share of human-induced DOC influx to surface waters due to peatland drainage is not known.
The concentration of DOC and efflux tends to correlate with precipitation. DOC concentrations in rainwater are generally very low, but they increase as water encounters canopies and forest floor [21]. Additionally, certain physical and chemical soil water properties, such as the pH level and basic ion and phosphate concentrations, can significantly influence the DOC content [22]. DOC fluxes increase with higher carbon contents in soils, as well as with more wetlands within the watershed [23].
DOC fluxes can also be affected by evapotranspiration, which plays an important role in the water cycle, being responsible for a significant proportion of water removal from the ecosystem. In summary, evapotranspiration is affected by weather, vegetation characteristics, management, and environmental factors [24]. As a result of afforestation, the tree stand affects the groundwater level through evapotranspiration. An effective drainage system in the first years after ditching increases runoff and reduces evapotranspiration. If ditches are maintained, as the stand biomass increases, runoff decreases but transpiration increases [25]. Lower runoff may therefore result in lower DOC efflux, which would reduce off-site emissions [16,26]. Therefore, it is necessary to ensure proper management, which can mitigate climate change while also preventing the degradation of land and conserving biodiversity [4].
In this study, we assessed the DOC concentration in groundwater and monthly and annual DOC efflux from drained peatlands with different land use types through ditches and catchment runoff out of peatlands. To estimate monthly and annual runoff, and to evaluate the factors affecting DOC concentration, in addition to groundwater sampling, measuring environmental variables and GHG concentrations, we calculated 7-day and monthly runoff and evapotranspiration.

2. Materials and Methods
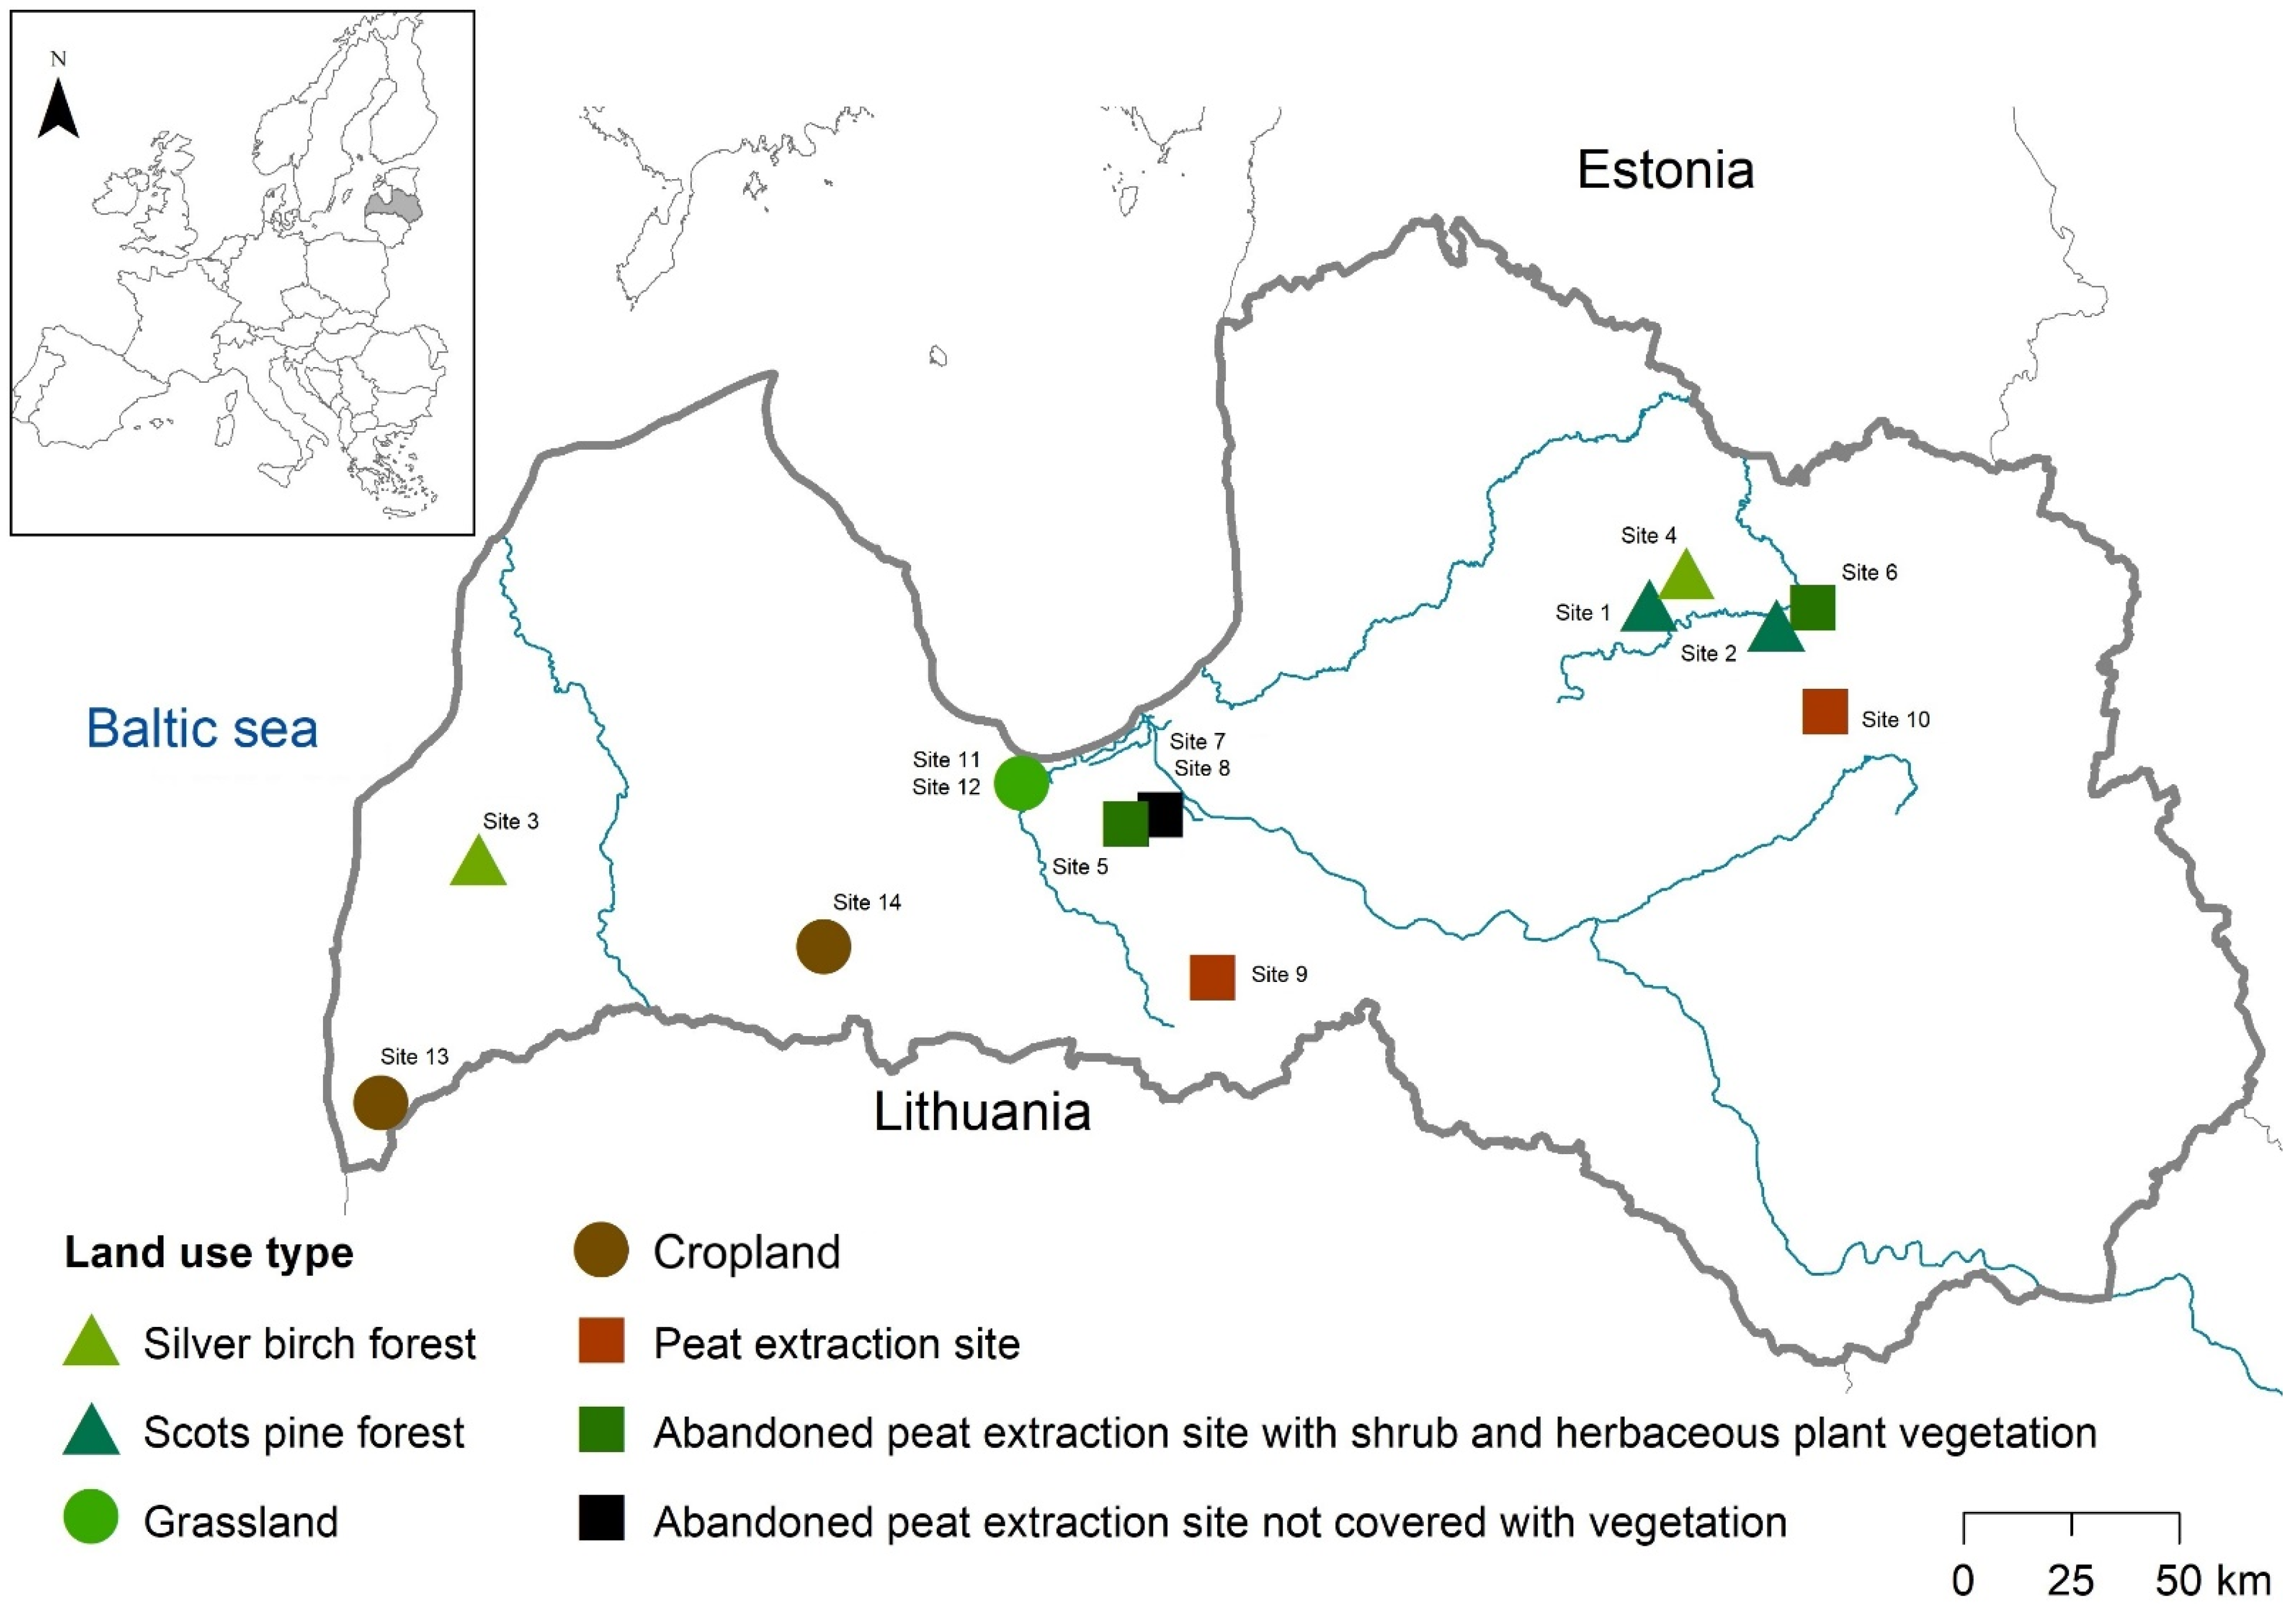
2.1. Research Sites

This study was carried out across 14 sites in drained hemiboreal peatlands in Latvia, representing former peat extraction sites with different current land use types (Figure 1). The research was conducted during the 2021 season. The meteorological conditions in Latvia in 2021 were characteristic for the area, with no notable anomalies observed [27]. The mean annual precipitation in Latvia for 2021 was 676 mm, which is 1% less than the typical annual mean of 685 mm. The annual mean air temperature recorded was 7.0 °C, with the coldest monthly mean temperature being −5.2 °C in February 2021 and the warmest monthly mean temperature reaching 21.5 °C in July 2021. The year 2021 experienced a mean air temperature that was 0.2 °C higher than the climatic norm for the period 1991–2020, making it the ninth consecutive year of exceeding temperatures, and the fourth consecutive year with precipitation less than the climatic norm.
Each land use type was represented by two research sites. Four of the sites were in the forest land—two Scots pine (Pinus sylvestris L.) and two silver birch (Betula spp.). The main characteristics of these forest stands are represented in Table 1. In addition to forested peatlands, research sites were established in active peat extraction sites, former peat extraction sites, which are abandoned with or without vegetation or are currently managed as cropland and grassland, where the current land use type in each site has been practiced for more than 20 years (Table 2). In all study sites, the soil type was Histosol and the peat layer depth was at least 1 m.

2.2. Data Collection and Measurements of Environmental Variables

Groundwater samples were collected every month in the period from January to December 2021. Water samples were collected from groundwater wells next to the ditches. At each research site, we installed three groundwater wells 50 cm from the ditches, 3 m apart from each other. These wells were constructed from 5 cm wide and 150 cm long polyvinyl chloride (PVC) pipes with a covered top to block direct precipitation. The pipes were perforated to allow groundwater to enter and were lined with geotextile to filter out soil particles and organisms.
A vacuum pump was used to collect water from the wells, which connected the water in the well and the glass bottle with plastic tubes. During each measurement session, we also recorded a set of environmental variables. These included the groundwater (GW) level, where positive values indicate flooding and water level in ditch, but negative values indicate water levels below the surface. Additionally, we measured soil and air temperatures using a Comet data logger (COMET SYSTEM, s.r.o., 756 61 Roznov pod Radhostem, Czech Republic) [28] equipped with Pt1000 temperature probes. Atmospheric pressure readings were measured using the Gasmet DX4040 instrument (Gasmet Technologies Oy, Mestarintie 6, Vantaa FI-01730 FINLAND) [29]. Additionally, the presence of water in the drainage ditches was monitored manually, noting that a zero value indicated an absence of water.
GW samples were gathered and transported to the Latvian State Forest Research Institute “Silava” laboratory, accredited according to the LVS EN ISO 17025:2018 [30], for subsequent analysis. Analysis conducted on these samples included pH measurement according to the LVS ISO 10523:2012 [31]; electrical conductivity (EC) in accordance with the LVS EN 27888:1993 [32]; as well as total nitrogen (TN) and dissolved organic carbon (DOC) concentrations, which were determined using a FORMACSHT TOC/TN Analyzer with an ND25 nitrogen detector (Skalar Analytical B.V. Tinstraat 12, 4823 AA Breda The Netherlands) [33] according to the LVS EN 12260:2004 [34] and LVS EN 1484:2000 [35], respectively. Concentrations of potassium (K), calcium (Ca), and magnesium (Mg) were quantified using an iCE3500 flame atomic absorption spectrometer (Thermo Fisher Scientific (Asheville) LLC, 275 Aiken Road, Asheville, NC 28804 USA, Serial No: AA05191115) [36] according to LVS EN ISO 7980:2000 [37] and LVS ISO 9964-3:2000 [38]. Notably, water samples were not collected from the ditches due to their predominantly dry condition throughout the year.
In addition to the collection of GW samples and environmental variables, measurements of GHG (CO2, CH4, and N2O) concentrations from drainage ditches were conducted during each measurement session, for correlation analysis. We used a closed-type GHG flux measurement chamber to record GHG fluxes across the full cross-section of a drainage ditch, including the ditch bed or water surface and its slopes. This chamber spans the ditch’s width, perpendicular to its longitudinal axis, ensuring GHG flux data collection from the cross-sectional area of the ditches ranging in size from 0.65 m2 to 1.32 m2. Metal construction covered the surface of the drainage ditch, with plastic film pressed against the ditch profile by a stainless steel chain placed around the perimeter of the gas exchange chamber. The chamber’s 50 cm width was kept constant during the study. A small ventilator was placed inside the chamber to continuously circulate the air, aiding in the accurate measurement of GHG levels. GHG concentrations were measured using a portable Gasmet DX4040 gas analyzer [29], which utilizes Fourier transform infrared (FTIR) spectroscopy. This setup facilitated the monitoring of changes in the levels of GHG within the chamber, capturing the average atmospheric content of these gasses over 2 min intervals across a 30 min duration, resulting in 15 individual measurements per chamber for each measurement period. These measurements were documented using “Calcmet Lite v2.0” software [29], Calcmet Lite v2.0. The GHG data processing and emission calculation methodology in our research sites is described more in depth in the study published by Vanags-Duka et al. (2022) [39].

2.3. Evapotranspiration and Runoff Estimation

To assess the annual DOC efflux from the peatlands, we used daily meteorological data to calculate monthly and annual DOC efflux for each land use type. Initially, we assessed 7-day precipitation and calculated actual evapotranspiration to estimate how much water from the area goes through the runoff. This is performed by subtracting 7-day potential evapotranspiration (Equation (1)) from the 7-day total precipitation. In this study, we assumed that the precipitation water which fed the aquifers was zero. The DOC efflux was determined by multiplying the measured monthly GW DOC concentrations with the calculated water runoff in millimeters. Runoff and efflux were then quantified from L m−2 to kg ha−1 based on DOC concentration. We obtained monthly and annual values.
Q = P − ET
where Q is the water runoff, mm; P is the precipitation, mm; and ET is the evapotranspiration, mm.
We calculated potential evapotranspiration (ETo) using the R package ‘evapotranspiration’, with the Penman–Monteith equation (Equation (2)) [24,40]. The input data required, including precipitation, for the calculations were taken from the Latvian Environment, Geology and Meteorology Centre (LEGMC) database using data from the closest meteorological station for each research site. The parameters required for the calculations were the daily maximum and minimum air temperature, maximum and minimum air humidity, and the solar radiation.
ETo = (0.408∆(Rn−G) + γ (900/(T + 273)) u2 (es − ea))/(∆ + γ (1 + 0.34u2))
where ETo is the reference evapotranspiration, mm day−1; Rn is the total solar radiation, MJ m−2, d; G is the soil heat flux, MJ m−2, d; T is the daily mean air temperature at 2 m height from ground, °C; u2 is the wind speed, 2 m height, m s−1; es is the saturated vapor pressure, kPa; ea is the water vapor pressure, kPa; es–ea is the saturated vapor pressure deficit, kPa; ∆ is the vapor pressure curve, kPa °C−1; and γ is the psychometric constant, kPa °C−1.
Initial output data of Equation (2) were the reference evapotranspiration, which provides information on a default area with grassland vegetation covering the entire area. To obtain representative data on potential evapotranspiration, it was necessary to apply the correction coefficients for each land use type in this study. Equation (3) was used to transform the reference evapotranspiration into the evapotranspiration corresponding to the vegetation using the Food and Agriculture Organization of the United Nations (FAO) correction coefficients.
ETc = Kc · ETo
where ETc is the actual evapotranspiration, mm; Kc is the vegetation specific coefficient (Table 3); and ETo is the reference evapotranspiration, mm.
Table 3 presents the FAO Kc values, adjusted for our study case from the study by Allen et al. [24], for various agricultural crops, including deciduous trees and conifers [41]. These Kc values are influenced by vegetation characteristics, soil evaporation, and the vegetative growth period. The coefficients are categorized into three distinct phases, Kc ini, Kc mid, and Kc end, each corresponding to specific intervals before, within, or after the vegetation period, respectively (Table 3). The coefficient value transitions from Kc ini to Kc mid, linearly interpolated from the onset of the vegetation period to the first day of active vegetation growth, with the value increasing incrementally each day. The Kc mid value is then applied throughout the entire active vegetative growth period. Between Kc mid and Kc end, the coefficient value is linearly interpolated from the final day of active vegetation growth to the last day of the vegetation period. Following the Kc end period, the coefficient value for each day gradually decreases until it reverts to the Kc ini value, beginning from the first day the mean diurnal air temperature falls below zero. This value remains constant for the remainder of the period. The coefficient values used for ETo correction vary, reflecting the specific vegetation present. If the daily mean air temperature is below 0 °C, precipitation accumulates and releases linearly when the air temperature is positive.

2.4. Statistical Analysis

All statistical analyses were performed using R software [42]. A comparison of the DOC concentration and efflux among different land use types was conducted. The comparison included monthly mean DOC concentrations and runoff, as well as the annual total DOC runoff under different land use types. The Kruskal–Wallis rank sum test, along with pairwise comparisons via the Wilcoxon rank sum test, were used to identify differences in the mean values of DOC concentrations and environmental variables, including groundwater chemistry, across various peatland land use types, using (‘stats’) package [35]. For all analysis we used a significance threshold of 0.05. Correlations between DOC concentrations and environmental variables were compared using Spearman’s correlation (‘corrplot’) [43]. The function cor() from (‘ggpmisc’) [44] was used to calculate the significance levels for Spearman correlations. Using correlation analysis, DOC concentrations were compared with groundwater chemical properties (pH, EC, K, Ca, Mg, and TN concentration), soil and air temperatures, water levels (WLs) in wells and ditches, precipitation, and GHG (CO2, CH4, and N2O) emissions from ditches. We explored the factors affecting DOC concentrations in GW using a five-component partial least squares (PLS) model. In the analysis, environmental parameters (denoted as X) were analyzed to explain variations in DOC concentrations (denoted as Y) in GW employing the PLS regression method. The computation of the PLS regression was conducted using the ‘mdatools’ package [45], which prioritizes the X variables based on their importance on explaining the variation in Y, a process quantified through variables important for projection (VIP) values. In addition to PLS regression and correlation analysis, we performed non-linear regression analysis between the most important variables according to PLS regression, explaining DOC concentrations individually.
For each research site, the catchment area was calculated using a LiDAR-derived digital elevation model (DEM), which was included in the correlation analysis, to detect the impact of catchment area on DOC concentrations. We used Latvian Geospatial Information Agencies LiDAR data (Latvian Geospatial Information Agency (LGIA), Latvia, Riga, Ojara Vaciesa street 43) and GRASS GIS 8.3.1. tool “r.terraflow” for this task. Data visualization was performed using ArcMap 10.8 for spatial data and maps, but figures were created using R package ‘ggplot2’ [46].

3. Results

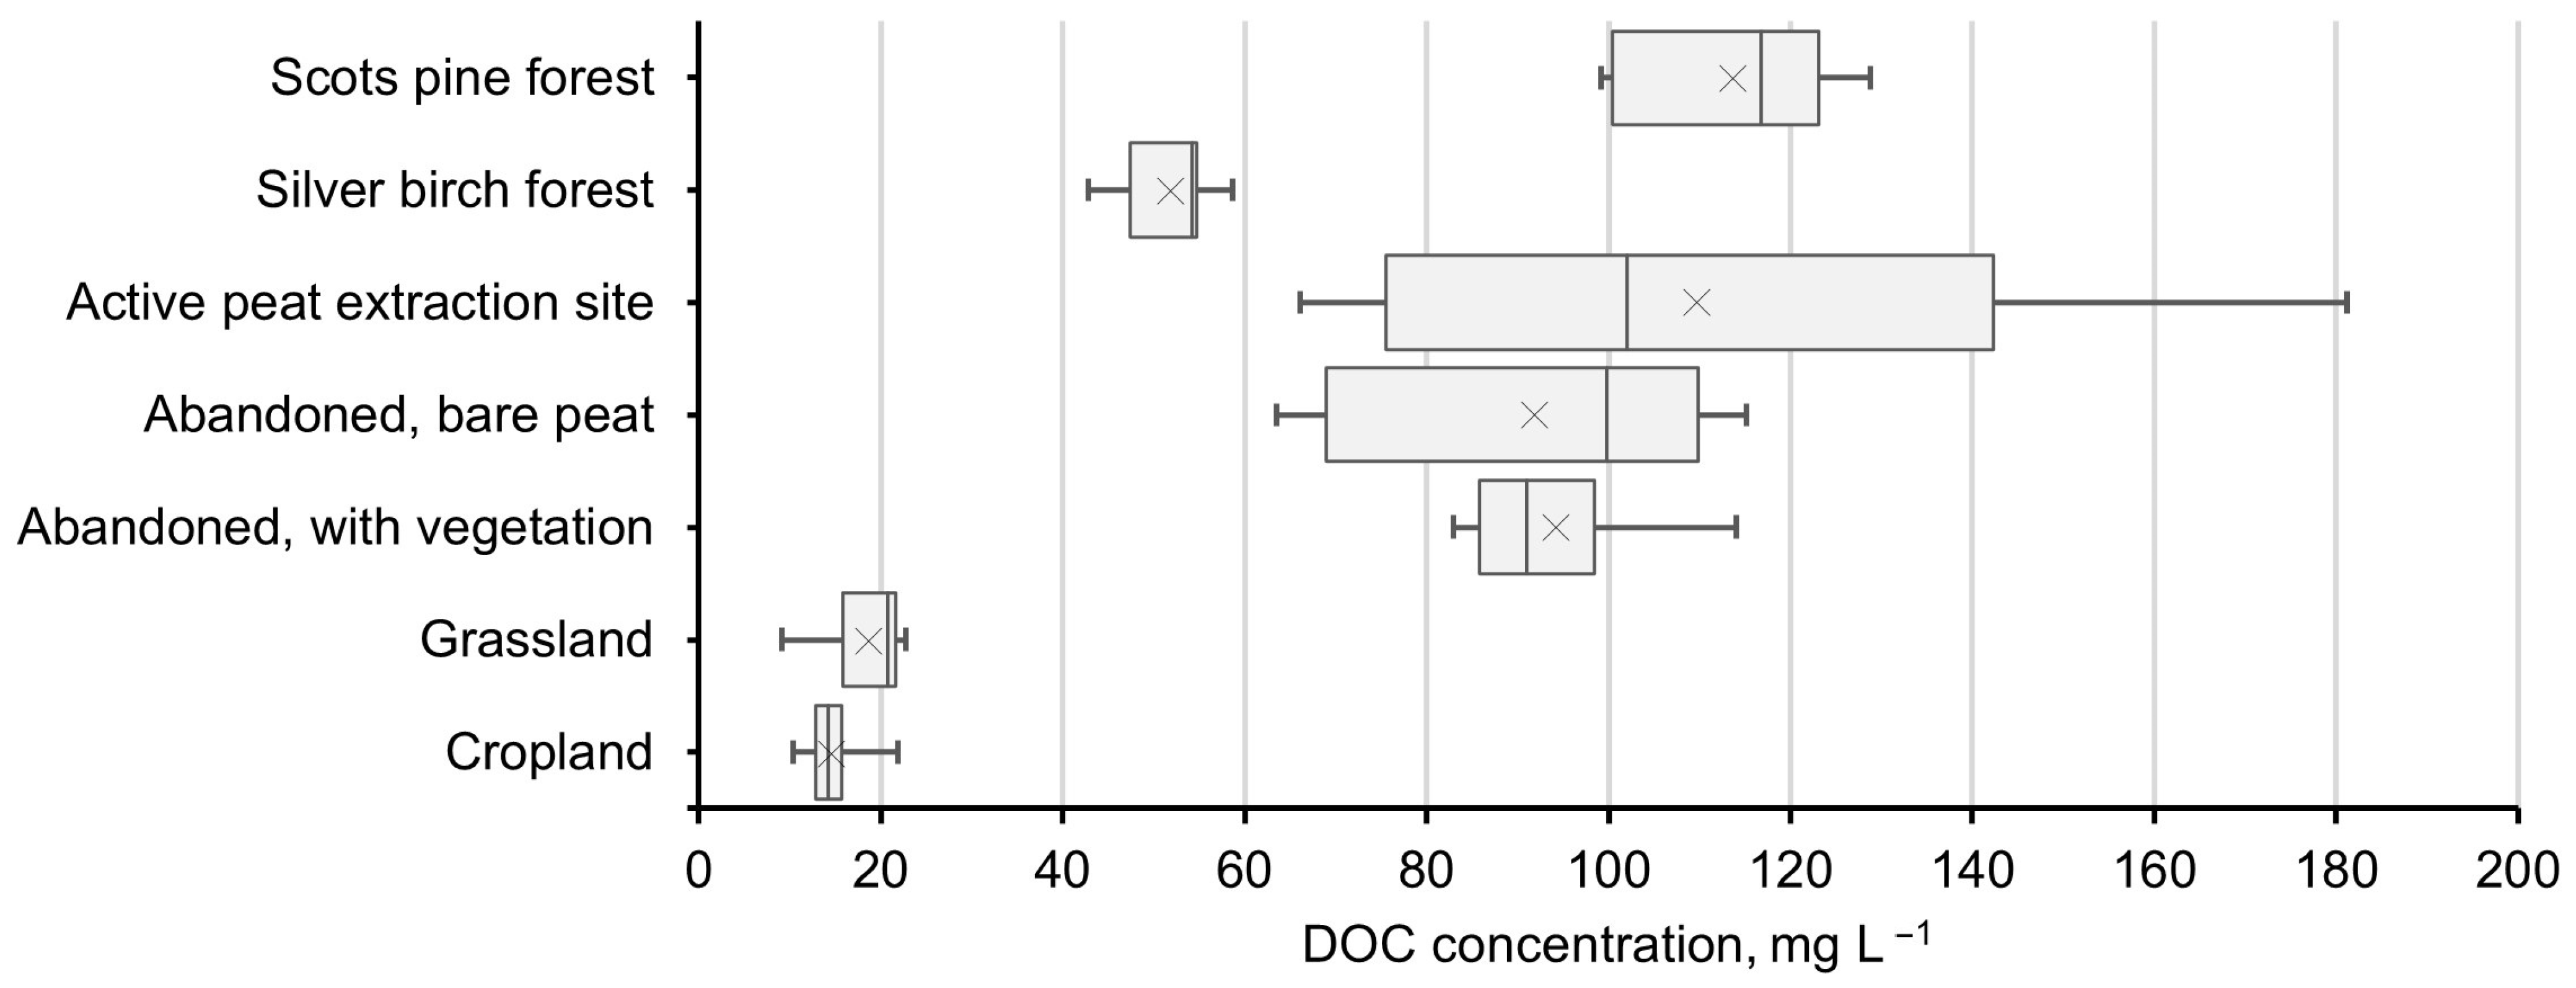
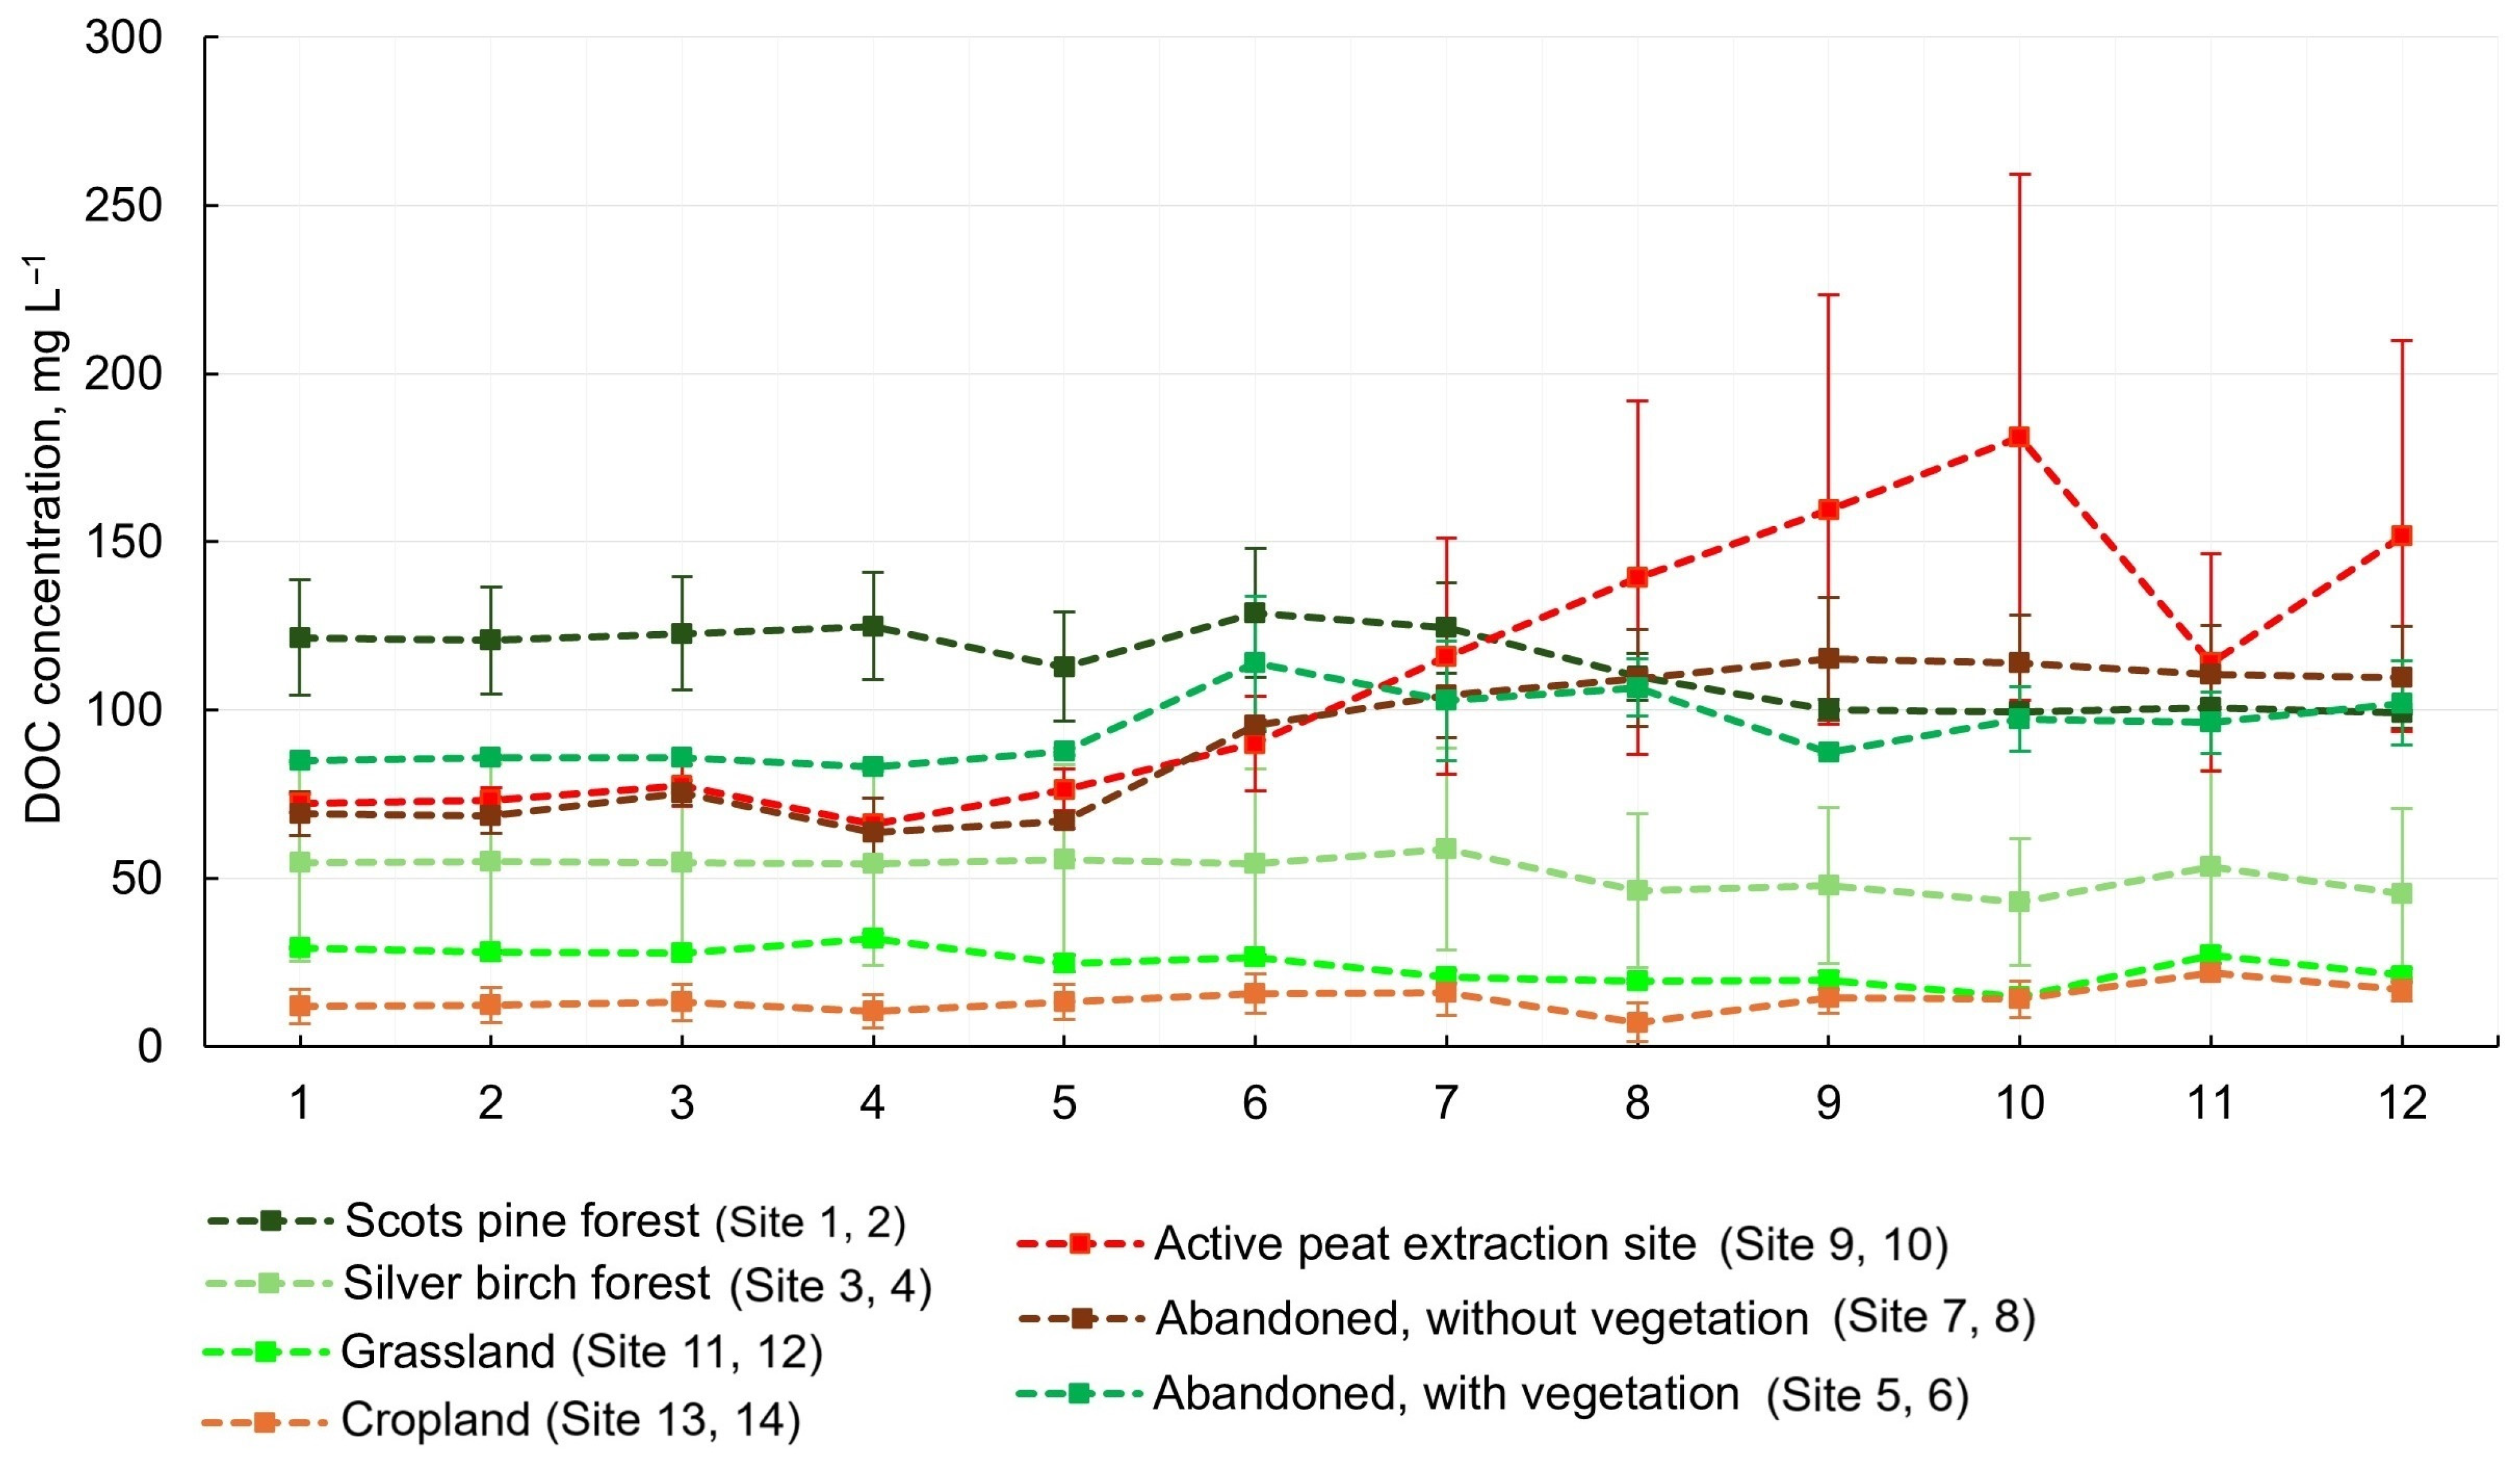
3.1. Variation in DOC Concentration in Groundwater

Mean DOC concentrations in GW varied between land use types. In general, the mean DOC concentration for all studied land use types was 74.9 ± 15.9 mg L−1. We observed the highest mean concentration in Scots pine forests (113.7 ± 3.3 mg L−1), followed by active peat extraction sites (109.7 ± 11.5 mg L−1), abandoned peat extractions sites with shrub vegetation (94.9 ± 3.1 mg L−1), and with bare peat (91.8 ± 6.1 mg L−1). In silver birch forests, DOC concentrations were significantly lower than in Scots pine forests (51.9 ± 1.4 mg L−1), while in cropland (14.5 ± 0.6 mg L−1) and grassland (18.6 ± 1.3 mg L−1), they were the lowest from all studied land use types (Figure 2, Table 4).
The dynamics of DOC concentration in groundwater varied and did not show consistent patterns across different land use types. In active peat extraction sites, DOC concentrations increased from April to October, but in abandoned sites without vegetation, they increased starting from June. In vegetated areas, the concentrations were more stable year-round, staying close to the mean value. Conversely, the most notable fluctuations in DOC concentration were observed in non-vegetated areas, including active peat extraction sites and abandoned sites without vegetation (Figure 3).
In active peat extraction sites, the mean DOC concentration is highly influenced by Site 10, where it increased from June to October. In contrast, in Site 9, the DOC concentration remained steady throughout the year. Additionally, in abandoned sites without vegetation, Site 7 affected the mean DOC concentration in this land use type, where the DOC concentration significantly increased starting in June. In Site 8, the concentration remained comparatively steady throughout the year.

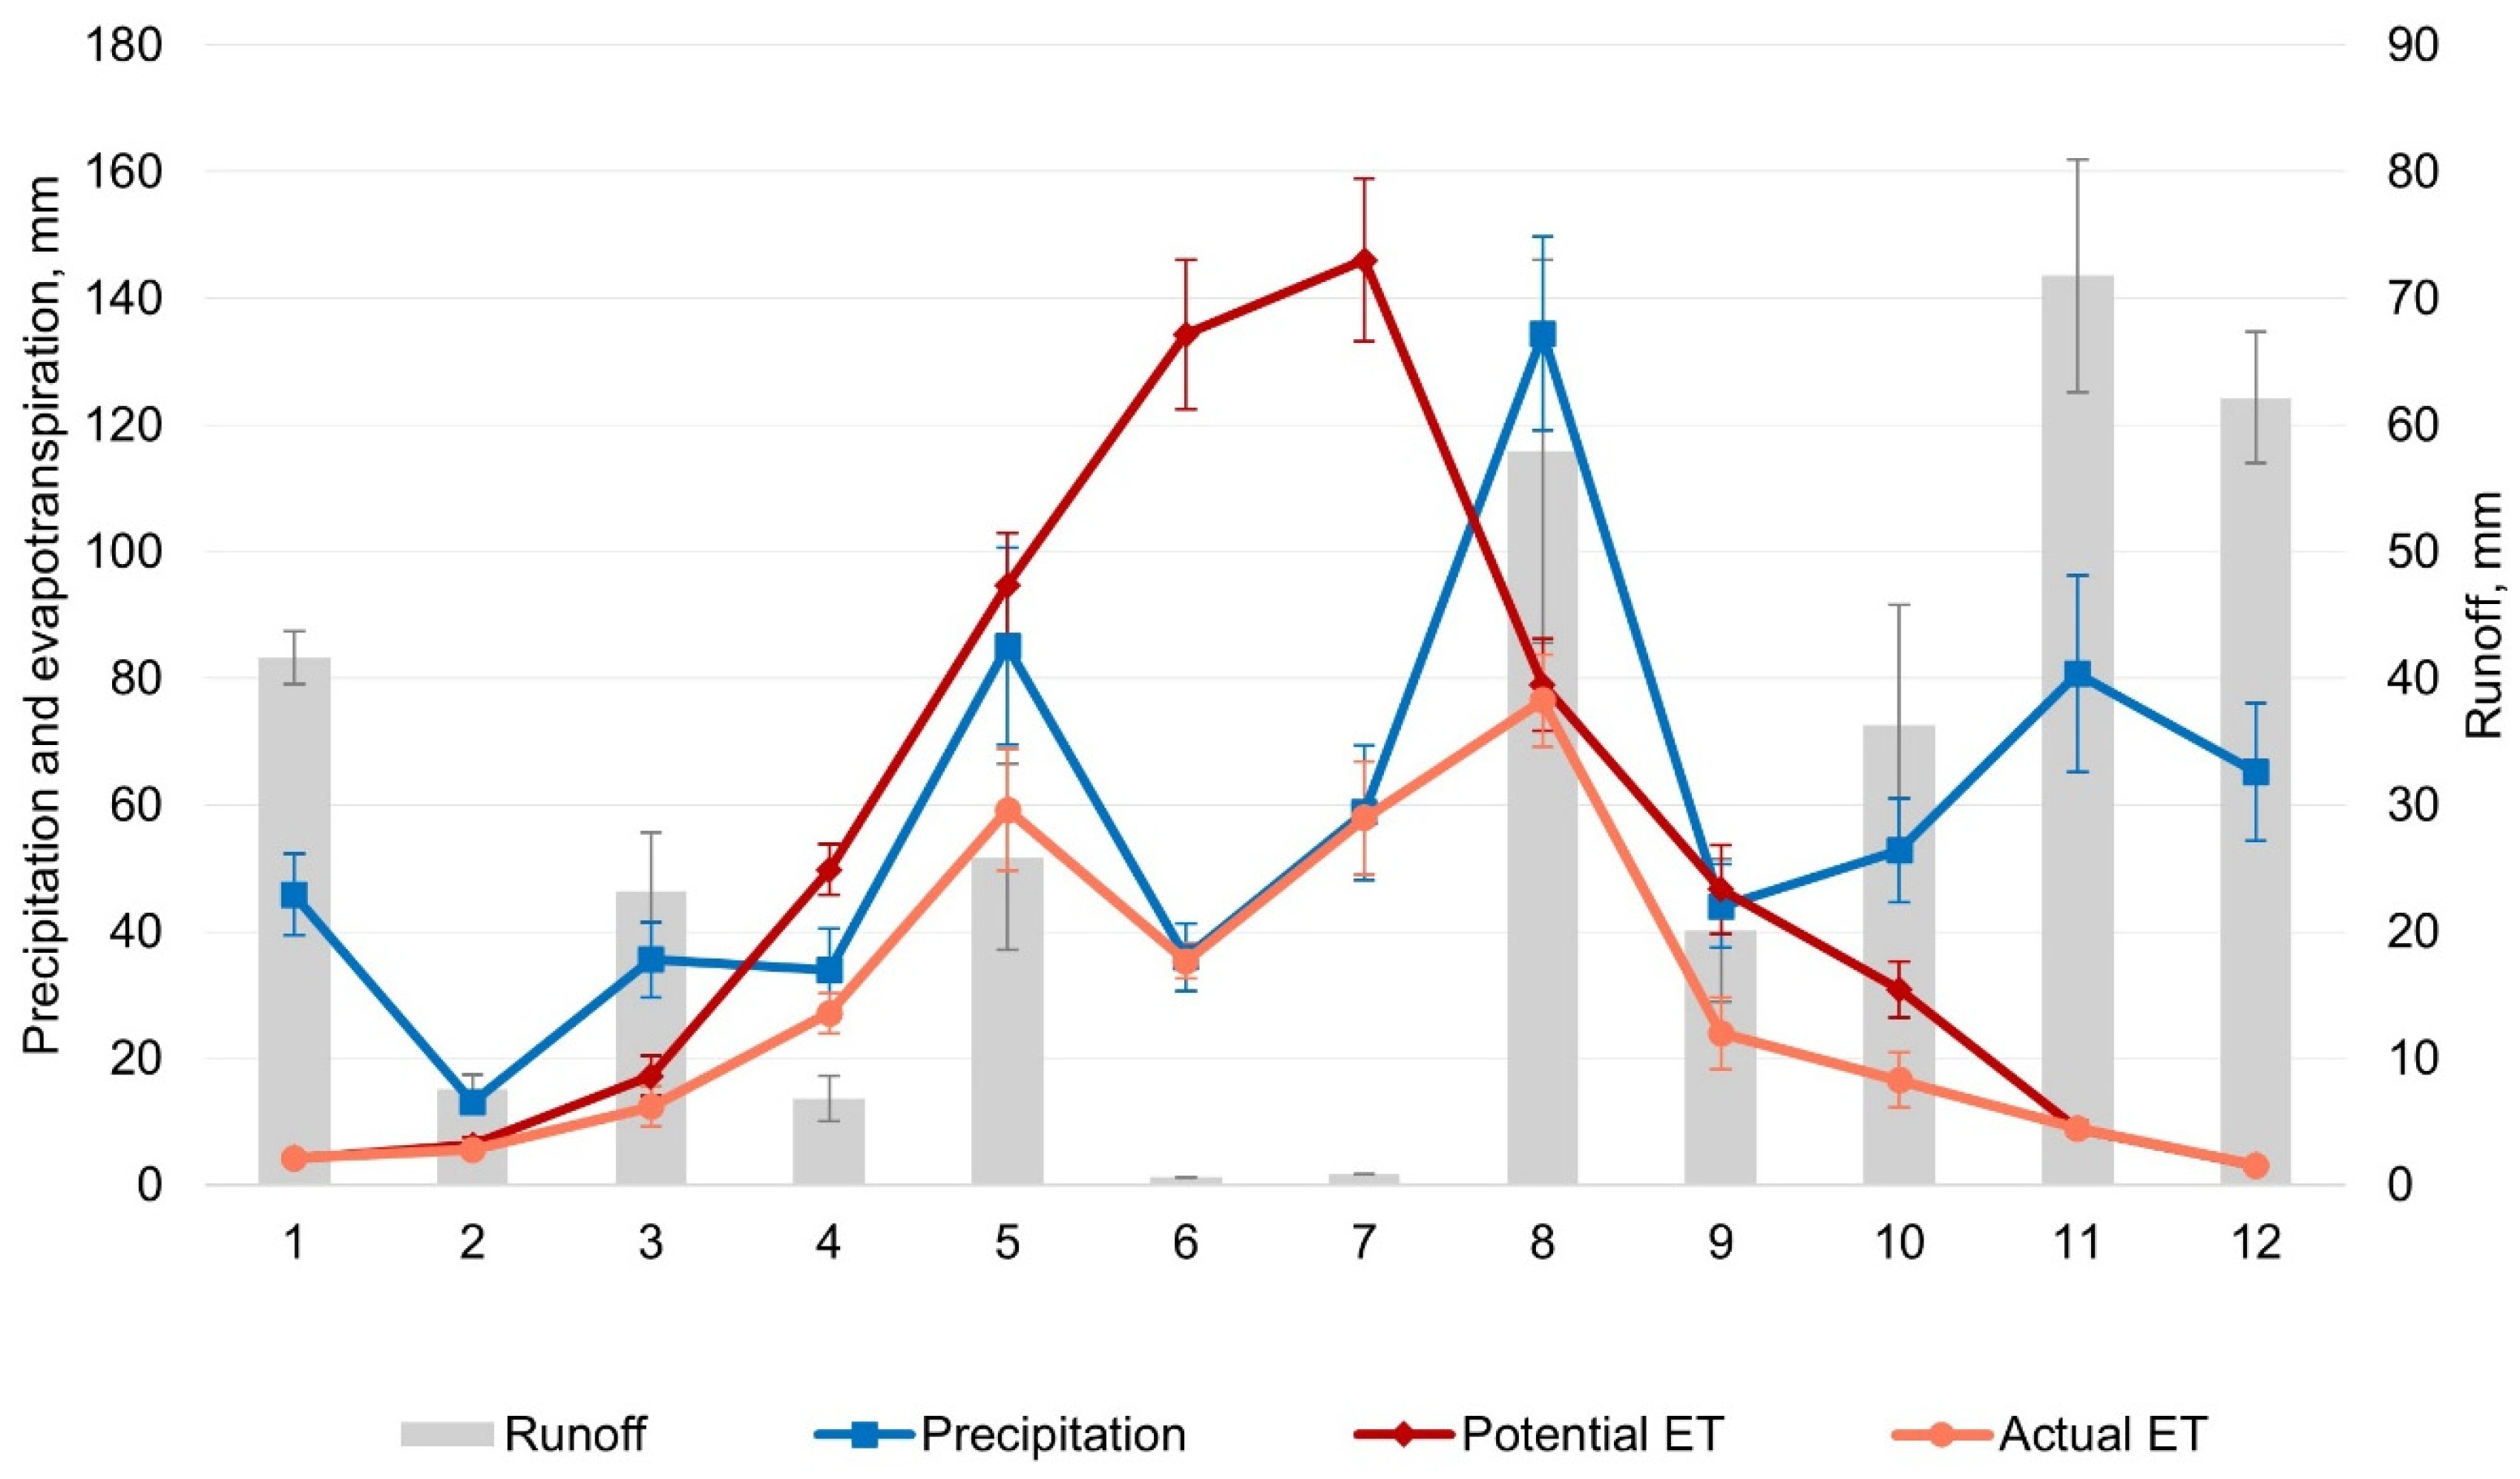
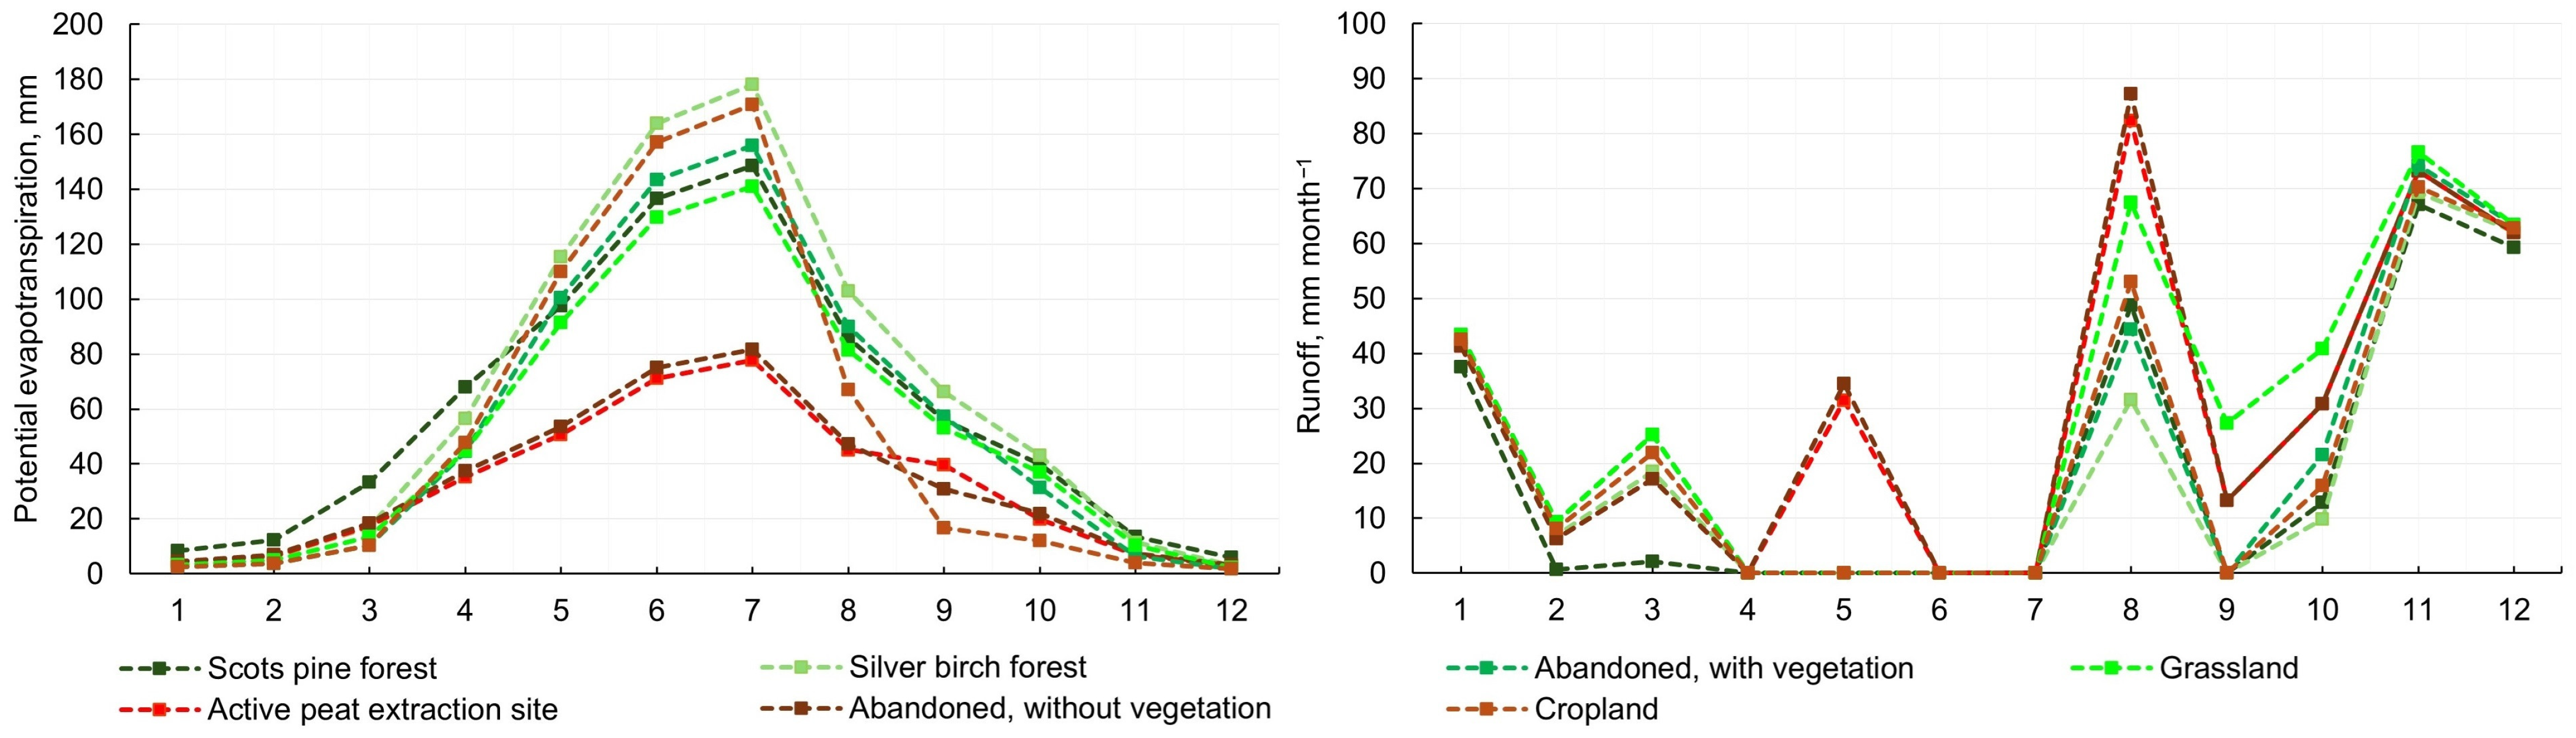
3.2. Runoff and Evapotranspiration

The highest monthly mean precipitation within all research sites was observed in August (134 mm, Figure 4), which resulted in runoff rates from 37 mm in silver birch forests to 87 mm in active peat extraction sites. The lowest monthly mean precipitation within all research sites was observed in February, with 13 mm, and runoff rates, from 4 mm in Scots pine forests to 9 mm in croplands and abandoned peat extraction sites with vegetation.
In June and July, in all research sites, potential evapotranspiration exceeded precipitation significantly, resulting in 0 mm runoff. The exceptions were active peat extraction sites and abandoned peat extraction sites without vegetation, where runoff was similar (4 mm and 5 mm in June and July, respectively). Potential evapotranspiration rates between different land use types did not vary significantly, except active and abandoned peat extraction sites without vegetation compared to other land use types (Figure 5). We estimated the highest potential annual evapotranspiration in silver birch and Scots pine forests (767 ± 61 mm y−1 and 705 ± 47 mm y−1, respectively), whereas the lowest was in active peat extraction sites and abandoned peat extraction sites without vegetation (388 ± 26 mm y−1 and 395 mm y−1, respectively).
The highest annual runoff was observed in active peat extraction sites and abandoned peat extraction sites and croplands (423 ± 27 mm y−1, 418 ± 25 mm y−1 and 392 ± 26 mm y−1, respectively), followed by abandoned peat extraction sites with vegetation and grasslands (349 ± 22 mm y−1 and 347 mm y−1, respectively). We estimated the lowest annual runoff in Scots pine and silver birch forests to be 307 mm y−1 in both forest types.

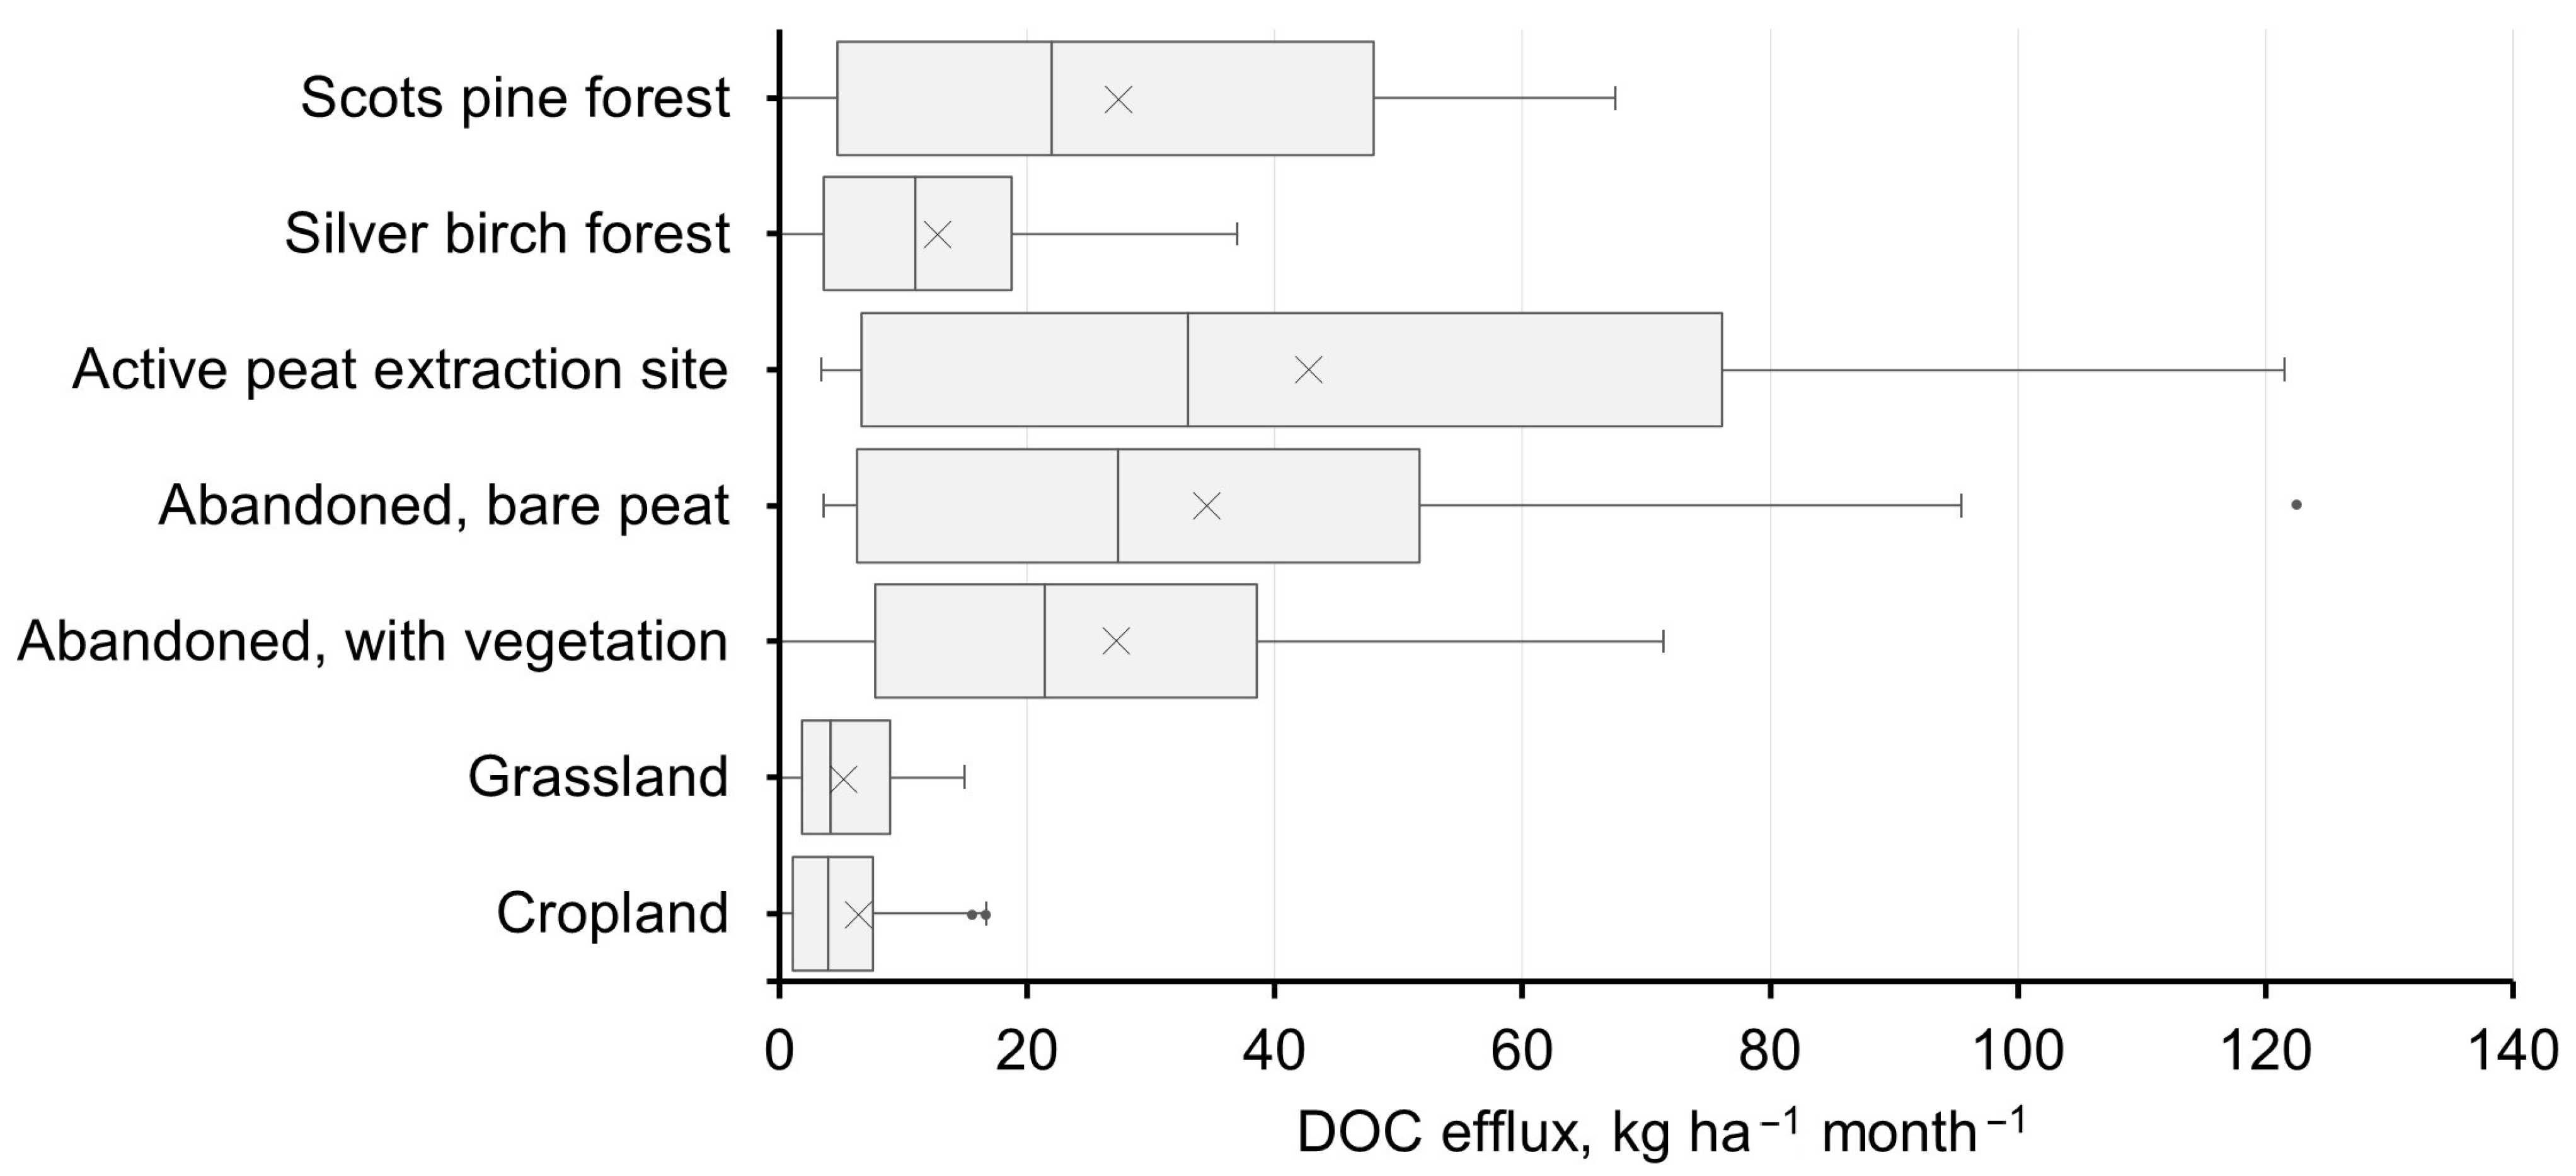
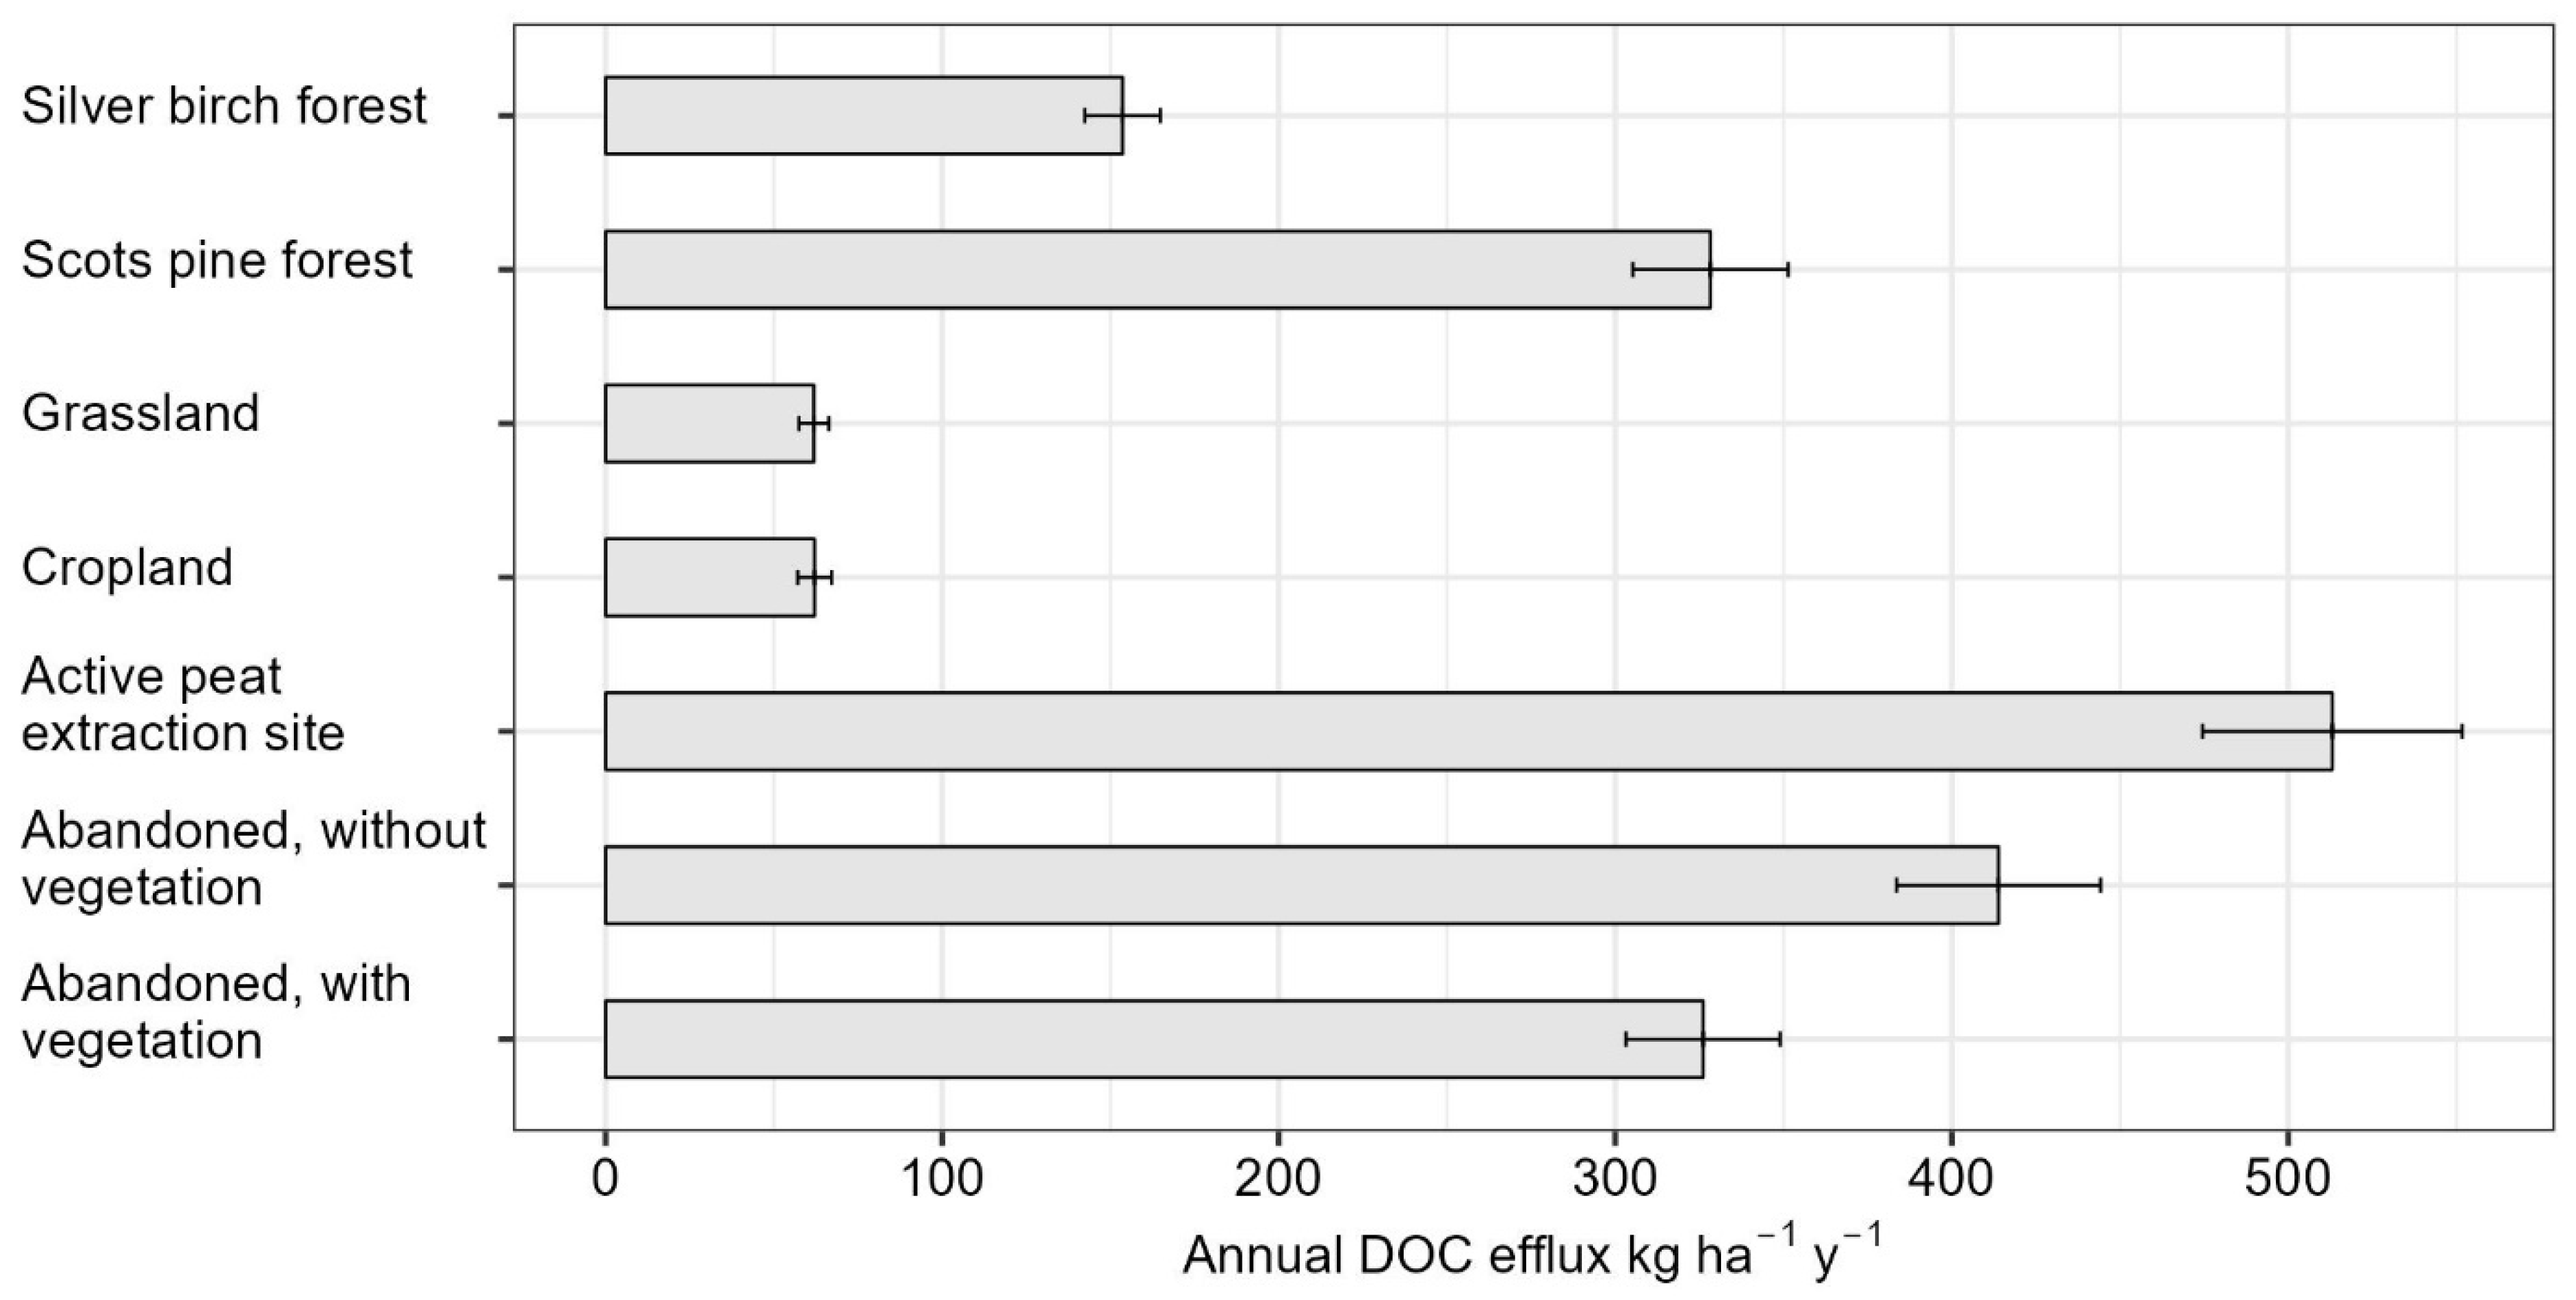
3.3. DOC Efflux from Peatlands

Similarly to monthly mean DOC concentrations in groundwater, the mean monthly DOC efflux generally showed similar patterns, when comparing different land use types. Overall, for all studied land use types, the mean monthly DOC efflux was 23.5 ± 6.0 kg ha−1 month−1. The highest DOC efflux was observed in active peat extraction sites (42.7 ± 11.6 kg ha−1 month−1), followed by abandoned sites without vegetation (34.5 ± 9.1 kg ha−1 month−1), Scots pine forests (27.3 ± 6.9 kg ha−1 month−1), and abandoned sites with shrub vegetation (27.2 ± 6.9 kg ha−1 month−1). In silver birch forests, the DOC efflux was significantly lower than in Scots pine forests (12.8 ± 3.3 kg ha−1 month−1), while the lowest was observed in cropland (6.4 ± 1.5 kg ha−1 month−1) and grassland (5.1 ± 1.3 kg ha−1 month−1, Figure 6). Compared to the overall mean value of monthly DOC efflux (23.5 ± 6.0), the most noticeable differences in DOC efflux occurred in active peat extraction sites and abandoned peat extraction sites without vegetation, which showed the highest mean monthly DOC efflux. However, while Scots pine forests exhibit the highest DOC concentrations, the greater runoff in areas without vegetation resulted in a higher DOC efflux despite their lower DOC concentrations. This increased runoff is due to lower evapotranspiration in areas without vegetation cover, which, in turn, leads to elevated DOC efflux.
The highest annual DOC efflux values (Figure 7) were observed in areas without vegetation—active peat extraction sites (513.1 ± 38.7 kg ha−1 y−1) and abandoned peat extraction sites without vegetation (413.9 ± 30.3 kg ha−1 y−1). Comparatively high DOC efflux was also observed in Scots pine forests (328.3 ± 23.1 kg ha−1 y−1) and in abandoned peat extraction sites with shrub vegetation (326.1 ± 22.9 kg ha−1 y−1). In the silver birch forests, annual DOC efflux was comparatively low (153.6 ± 11.2 kg ha−1 y−1), but the lowest was in croplands (62.1 ± 5.0 kg ha−1 y−1) and grasslands (61.9 ± 4.4 kg ha−1 y−1).

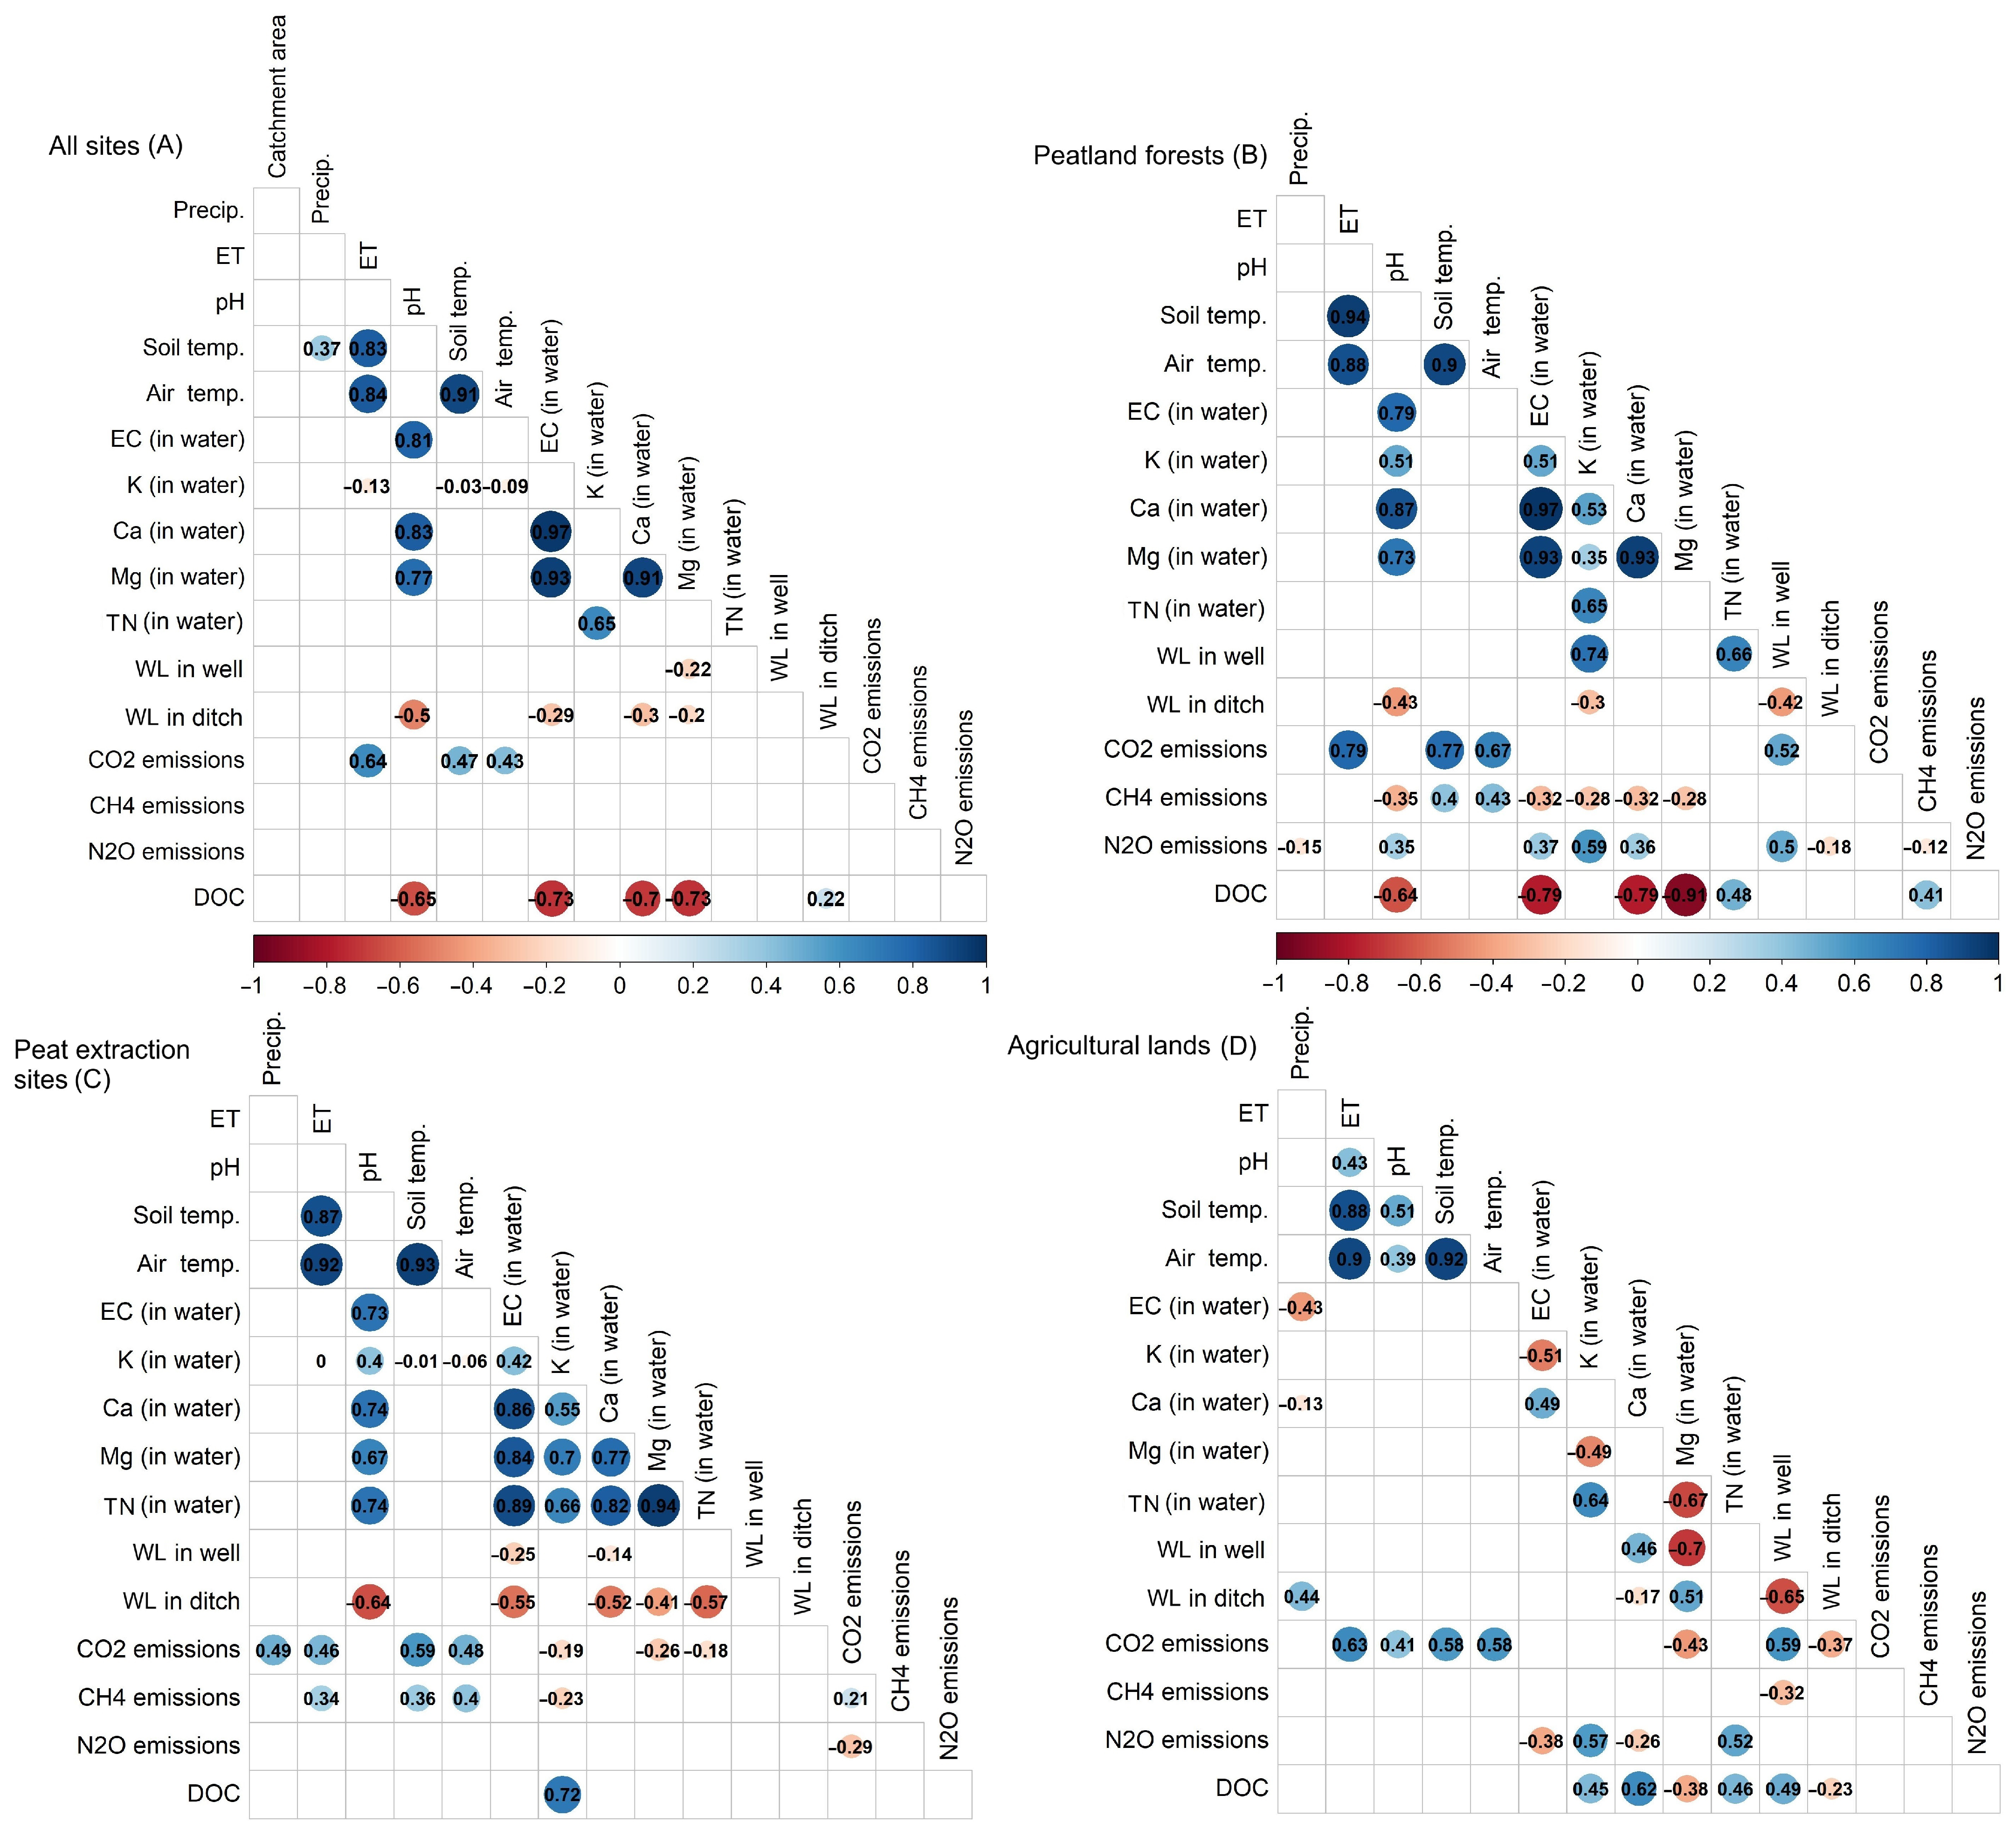
3.4. Evaluation of Affecting Factors

The monthly mean DOC concentration was correlated with several physical and chemical variables of groundwater (Figure 8). Statistically significant (p < 0.05) correlations for DOC concentrations were observed with groundwater pH (ρ = −0.65), EC (ρ = −0.73), Ca (ρ = −0.70), and Mg (ρ = −0.73) concentrations. Although weak (ρ = 0.22), a statistically significant (p < 0.05), positive correlation between DOC concentration and WL in the ditch was observed. The other parameters did not show a significant correlation with DOC concentrations.
The explanatory power (R2 = 0.67) of the PLS model revealed that different factors affect DOC concentration levels and the usefulness of PLS model. VIP scores calculated from the model elucidated the relative importance of the predictors. Notably, water chemical properties—specifically EC, Mg, Ca, and pH—emerged as the most critical variables, with VIP scores of 1.84, 1.83, 1.79, and 1.65, respectively, when analyzing our dataset with all land use types. These scores, which are inter-related, affirm the significant influence of water chemical composition, including acidity on DOC concentrations. Additional variables, such as K, TN, and the WL in the ditch, also showed substantial influence depending on the land use type.
In peatland forests, DOC concentrations in groundwater were negatively correlated with water pH (ρ = −0.64), EC and Ca concentration (ρ = −0.79), and Mg concentration (ρ = −0.91), while positively correlated with instantaneous CH4 emissions from drainage ditches (ρ = 0.41), as well as with TN concentrations in groundwater (ρ = 0.48). A PLS model (R2 = 0.74) revealed that the most influential parameters on CH4 emissions are water pH, EC, Ca, and Mg concentrations, with VIP scores >1.5, but CH4 emissions from drainage ditches and TN concentration in groundwater showed VIP scores 0.9 and 1.05, respectively.
DOC concentrations in peat extraction sites were significantly and strongly positive correlated with K concentration (ρ = 0.72) and PLS model was weak (R2 = 0.34).
In agricultural lands (grasslands and croplands), the analysis revealed slightly different correlations compared to other land use types; DOC was positively correlated with Ca concentration (ρ = 0.62), WL in wells (ρ = 0.49), TN (ρ = 0.46), and K concentration (ρ = 0.45), and negatively correlated with the Mg concentration (ρ = −0.38) and WL in ditches (ρ = −0.23). The PLS model (R2 = 0.54) revealed that variation was mostly explained by Ca, K, and TN concentrations and the WL in wells, with VIP scores of 1.6, 1.4, 1.3, and 1.1, respectively.
In all research sites, the most important variable was EC in water (R2 = 0.54); however, excluding one outlier (research Site 10), the coefficient increased significantly (R2 = 0.71). In peatland forests, the most important affecting variable was the Ca concentration in groundwater (R2 = 0.76), but in peat extraction sites, the K concentration in groundwater showed the highest non-linear relationship (R2 = 0.74, Figure 9).

4. Discussion

4.1. DOC Efflux and Affecting Factors

Comparing our results to other studies—for example, a large-scale study [47] that examined 62 sites across the globe (51 boreal and temperate peatlands and 11 tropical peatlands) and revealed that annual DOC efflux from peatlands may vary between 14 and 948 kg ha−1 y−1, averaging 244 ± 219 kg ha−1 y−1—it can be concluded that our results are similar and comparable to the results from temperate and boreal climate zones. The amount of DOC efflux increases from colder to tropical climates, and it is influenced by thermal gradient, which contributes to other large studies [16,48]. Across both drained and natural sites, peatlands in boreal (137 kg ha−1 y−1), temperate (242 kg ha−1 y−1), and tropical regions (579 kg ha−1 y−1) showed significantly different amounts of DOC efflux. Disturbed sites had significantly higher annual DOC efflux than those from undisturbed naturally wet sites, showing means of 307 ± 231 and 185 ± 193 kg ha−1 y−1, respectively [16,48]. Our results revealed that among all studied land use types of peatlands, the mean annual DOC efflux varied from 61.9 ± 4.4 kg ha−1 y−1 in grasslands to 513.1 ± 38.7 kg ha−1 y−1 active peat extraction sites. Silver birch (153.6 ± 11.2 kg ha−1 y−1) and Scots pine forests (328.3 ± 23.1 kg ha−1 y−1) are common in Latvia, where more than 10% of the total area is covered by peatlands [11,12]. The DOC efflux from Scots pine forests and all peat extraction sites coincided with values from the temperate climate zone, while efflux from silver birch forests, croplands, and grasslands were more comparable to the results from the boreal zone, which contributes to previous findings about the thermal gradient impact.
The default DOC efflux factor in naturally wet temperate and boreal peatlands is provided by the Intergovernmental Panel on Climate Change (IPCC) guidelines [49]. Tier 1 is 210 and 80 kg C ha−1 y−1, respectively, and the impact of drained organic soils is expressed with a default coefficient of 0.6 to be used as a 60% increase compared to naturally wet peatlands. Those coefficients were obtained from a range of studies conducted in different boreal peatlands in Scandinavian countries and Canada (37–159 kg C ha−1 y−1), and in temperate zones (53–360 kg C ha−1 y−1, [49]). In our study, the mean annual DOC efflux from drained peatlands with different land use types was 265.5 ± 66.6 kg C ha−1 y−1. Our mean drained peatland DOC efflux value is comparable to the value provided by the IPCC guidelines for temperate climate zones. In Scots pine forests and abandoned peat extraction sites with vegetation, this value fell within the guidelines; however, in active peat extraction sites and abandoned sites without vegetation, DOC efflux was higher. Moreover, in silver birch forests, the DOC efflux of croplands and grasslands was significantly lower. This indicates that the emission factors provided in the IPCC guidelines for temperate climate zones characterize DOC emissions in Latvia incompletely and, depending on the land use type of peatland, emissions may be lower (Table 5).
Our findings indicate that our applied methodology for calculating runoff, evapotranspiration and, accordingly, DOC efflux using a calculation of the total ecosystem water balance provides comparable results to the values obtained using other modeling and direct measurements. The advantage of such a methodology is the possibility to calculate the total runoff of the ecosystem and catchment area, compared to direct runoff measurement methods by measuring surface stream runoff; it is also possible to calculate the runoff of smaller catchments without direct measurements. However, the disadvantages of such an approach should also be considered, such as the challenges of including various physical parameters of the catchment in the calculation [50], and an uncertainty of soil moisture and the variety of evapotranspiration correction coefficients [51]. Some studies [52,53] have highlighted how soil properties, such as the degree of soil organic matter decomposition, soil pH, and texture, affect DOC composition and biodegradability.

4.2. DOC Concentrations and Affecting Factors

In Finland, Rasilo et al. [54] also studied DOC efflux from mixed forest peatland catchment and obtained similar yet higher DOC concentrations in GW compared to our study, ranging from 43 mg L−1 in spring to 123.0 mg L−1 in autumn, pointing to seasonal differences, which we did not observed in our case. Only one research site (Site 10), which was an active peat extraction site, showed a similar trend, with significantly increasing DOC concentrations from August to October. In a study conducted in Canada, Thompson et al. [55] estimated slightly lower runoff, 80–213 to 164–236 mm y−1, respectively, compared to our estimations, where the annual runoff varied from 307 mm in silver birch forests to 423 mm in active and abandoned peat extraction sites without vegetation.
A recent study in Finland [56] identified several factors influencing variations in DOC concentrations, with stream sulfate (SO4) concentrations standing out as the predominant driver. This aligns with findings that decreasing SO4 concentrations significantly impact long-term increases in DOC trends, acting as a primary control mechanism. This conclusion is supported by previous research in Krycklan, Sweden, which examined the DOC and SO4 relationship in soil water, as reported by Ledesma et al. [57]. That study also noted that concentrations of Ca, Mg, and other basic cations significantly influence DOC concentrations. Laudon et al. [58] further mentioned that drops in basic cation concentrations, linked with decreases in SO4 concentrations, influence water acidity, leading to higher DOC solubility and pH drops [59].
Negative correlations between the DOC concentration and Ca and Mg concentrations have been observed in several other studies. For example, prior research in drained soils in Canada found a negative correlation between DOC concentrations in groundwater and pH values, attributing this trend to pH levels [60]. Elevated DOC concentrations under acidic conditions are associated with the dissociation of hydrogen atoms from carbonic acids, which become hydrogen ions. As pH levels drop below the pKa value of organic materials, DOC sorption in groundwater increases, leading to higher concentrations [61,62]. Although sulfur compounds were not analyzed in our study, we found a significant negative correlation between pH and DOC. These findings suggest that basic cations such as Ca and Mg play a crucial role in regulating pH and electrical conductivity (EC) in water, which in turn affects DOC solubility and concentrations.
In our case study, the annual mean DOC concentration in different land use types showed a statistically significant relationship with Ca and Mg concentrations. The mean Ca concentration in GW across all research sites was 42 mg L−1, while for Mg it was 7.6 mg L−1. The mean Ca and Mg concentrations are considerably higher in cropland (averaging 97.2 mg L−1 Ca and 17.9 mg L−1 Mg), grasslands (108.7 mg L−1 and 25.6 mg L−1, respectively) and silver birch forests (59.03 mg L−1 Ca and 11.48 mg L−1 Mg). Higher concentrations of Ca and Mg in those land use types were accompanied with significantly higher pH values (7.18–7.81) compared to Scots pine forests and all peat extraction sites (pH 5.22–6.29). In croplands and grasslands, this can be attributed to historical liming practices common in Latvian agriculture and higher peat decomposition levels [63,64]. Liming with Ca- and Mg-containing fertilizers, such as wood ash or dolomite lime, is used to increase soil pH for favorable agricultural conditions [63,65,66].
Silver birch forests, where the mean Ca and Mg concentrations were also significantly higher, may be receiving basic cations from groundwater, providing a higher concentration of these nutrients accordingly [67]. In Scots pine forests, the Ca and Mg concentrations were low (averaging 18.5 mg L−1 Ca and 0.8 mg L−1 Mg), similar to active peat extraction sites and abandoned extraction sites. An increasing DOC concentration was paralleled by a statistically significant decrease in Ca and Mg concentrations, indicating increasing DOC in groundwater, being less bound to soil, influenced by Ca and Mg sorption in the soil [60,68]. Differences in DOC and Ca and Mg concentrations in our research sites may also be influenced by bedrock material, on which peatland has developed [69]. In Latvia, bedrock and groundwater are mostly neutral or slightly alkaline [70]. Even though these factors, such as bedrock material, were not considered in our study, they may have influenced peat chemical properties due to capillary effects, plant uptake, and litter input.

5. Conclusions

DOC concentrations in groundwater in drained peatlands vary significantly depending on land use types; it is necessary to continue to monitor patterns of these concentrations. Patterns of DOC concentrations and their affecting factors did not fluctuate significantly within the year, except in active peat extraction sites, which showed that peat extraction is of fundamental importance to DOC concentrations. Croplands and grasslands were the most insignificant sources of DOC; the main drivers of lower DOC concentrations were the availability of nutrients compared with other sites, which is affected by pH. In peatland forests, the DOC concentration was mostly explained by concentrations of Ca and Mg, but in peat extraction sites, the K concentration in water had the highest influence. We did not identify an impact of water level in the ditches and the groundwater level on DOC concentrations. DOC efflux was mostly influenced by DOC concentration and evapotranspiration in different land use types. The study results indicate that peat extraction site afforestation with silver birch can reduce DOC efflux from peatland, but sites with active peat extraction and abandoned peat extraction sites without vegetation are significant sources of DOC. It is necessary to improve runoff and evapotranspiration estimates, as well as catchment area characterization, using elevation and satellite data to obtain more site-specific runoff and DOC efflux data. The obtained DOC efflux depending on land use type can be considered when selecting the most suitable peatland restoration techniques, and can be included in national calculations of a C stock changes and GHG emissions.

Author Contributions

Conceptualization, A.L.; methodology, R.N.M. and A.L.; software, R.N.M. and E.M.U.; validation, A.B. (Aldis Butlers), A.B. (Arta Bārdule) and A.L.; formal analysis, R.N.M.; investigation, R.N.M., S.K. and A.B. (Aldis Butlers); resources, A.L.; data curation, A.L.; writing—original draft preparation, R.N.M.; writing—review and editing, A.B. (Aldis Butlers), A.B. (Arta Bārdule); visualization, R.N.M. and E.M.U.; supervision, A.L.; project administration, A.L.; funding acquisition, A.L. All authors have read and agreed to the published version of the manuscript.

Funding

This research was funded by Forest Sector Competence Center Project No. 5.1.1.2.i.0/1/22/A/CFLA/007, “Prototype and datasets of the Carbon-Binding Forestry Planning Program”, and Fundamental and Applied Research Program Project No. LZP-2021/1-0137, “Evaluation of factors affecting greenhouse gas (GHG) emissions from surface of tree stems in deciduous forests with drained and wet soils”.

Data Availability Statement

Data are available on request made to the corresponding author Raitis Normunds Meļņiks.

Acknowledgments

R.M.’s contribution was supported by the European Regional Development Fund project “Evaluation of factors affecting greenhouse gas (GHG) emissions reduction potential in cropland and grassland with organic soils” (1.1.1.1/21/A/031) and doctoral grant project (No. 8.2.2.0/20/I/006). A.L.’s contribution was funded by the European Regional Development Fund project, No. 1.1.1.1/19/A/064, “Development of greenhouse gas emission factors and decision support tools for management of peatlands after peat extraction”.

Conflicts of Interest

The authors declare no conflicts of interest. The funders had no role in the design of the study; in the collection, analyses, or interpretation of data; in the writing of the manuscript; or in the decision to publish the results.

References

  1. Bragg, O.M. Hydrology of peat-forming wetlands in Scotland. Sci. Total Environ. 2002, 294, 111–129. [Google Scholar] [CrossRef]
  2. Nikodemus, O.; Kārkliņš, A.; Kļaviņš, A.; Melecis, V. Augsnes Ilgtspējīga Izmantošana un Aizsardzība; LU Akadēmiskais Apgāds: Rīga, Latvia, 2008. [Google Scholar]
  3. Page, S.E.; Baird, A.J. Peatlands and Global Change: Response and Resilience. Annu. Rev. Environ. Resour. 2016, 41, 35–57. [Google Scholar] [CrossRef]
  4. Parish, F.; Sirin, A.; Charman, D.; Joosten, H.; Minayeva, T.; Silvius, M.; Stringer, L. Assessment on Peatlands, Biodiversity and Climate Change: Main Report; Global Environment Centre: Kuala Lumpur, Malaysia; Wetlands International: Wageningen, The Netherlands, 2008. [Google Scholar]
  5. Joosten, H.; Couwenberg, J. Are Emission Reductions from Peatlands MRV-Able? Wetlands International: Wageningen, The Netherlands, 2009. [Google Scholar]
  6. Xu, J.; Morris, P.J.; Liu, J.; Holden, J. PEATMAP: Refining estimates of global peatland distribution based on a meta-analysis. Catena 2018, 160, 134–140. [Google Scholar] [CrossRef]
  7. Bonan, G.; Pollard, D.; Thompson, S. Effects of boreal forest vegetation on global climate. Nature 1992, 359, 716–718. [Google Scholar] [CrossRef]
  8. Frolking, S.; Talbot, J.; Jones, M.C.; Treat, C.C.; Kauffman, J.B.; Tuittila, E.-S.; Roulet, N. Peatlands in the Earth’s 21st century climate system. Environ. Rev. 2011, 19, 371–396. [Google Scholar] [CrossRef]
  9. Price, J.S.; Heathwaite, A.L.; Baird, A.J. Hydrological processes in abandoned and restored peatlands: An overview of management approaches. Wetl. Ecol. Manag. 2003, 11, 65–83. [Google Scholar] [CrossRef]
  10. Höper, H.; Augustin, J.; Cagampan, J.P.; Drösler, M.; Lundin, L.; Moors, E.J.; Vasander, H.; Waddington, J.M.; Wilson, D. Restoration of peatlands and greenhouse gas balances. In Peatlands and Climate Change; Strack, M., Ed.; International Peat Society: Jyväskylä, Finland, 2008; pp. 182–211. [Google Scholar]
  11. Ozola, I.; Dauskane, I.; Aunina, I.; Stivrins, N. Paludiculture in Latvia—Existing Knowledge and Challenges. Land 2023, 12, 2039. [Google Scholar] [CrossRef]
  12. Ivanovs, J.; Haberl, A.; Melniks, R. Modeling Geospatial Distribution of Peat Layer Thickness Using Machine Learning and Aerial Laser Scanning Data. Land 2024, 13, 466. [Google Scholar] [CrossRef]
  13. Couwenberg, J. Emission Factors for Managed Peat Soils: An Analysis of IPCC Default Values; Wetlands International: Bonn, Germany, 2009. [Google Scholar]
  14. Escobar, D.; Belyazid, S.; Manzoni, S. Back to the Future: Restoring Northern Drained Forested Peatlands for Climate Change Mitigation. Front. Environ. Sci. 2022, 10, 834371. [Google Scholar] [CrossRef]
  15. Mos, H.; Harun, M.H.; Jantan, N.M.; Hashim, Z.; Ibrahim, A.S.; Yusup, Y. Differences in CO2 Emissions on a Bare-Drained Peat Area in Sarawak, Malaysia, Based on Different Measurement Techniques. Agriculture 2023, 13, 622. [Google Scholar] [CrossRef]
  16. Evans, C.D.; Renou-Wilson, F.; Strack, M. The role of waterborne carbon in the greenhouse gas balance of drained and re-wetted peatlands. Aquat. Sci. 2016, 78, 573–590. [Google Scholar] [CrossRef]
  17. Sawicka, K.; Clark, J.M.; Vanguelova, E.; Monteith, D.T.; Wade, A.J. Spatial properties affecting the sensitivity of soil water dissolved organic carbon long-term median concentrations and trends. Sci. Total Environ. 2021, 780, 146670. [Google Scholar] [CrossRef]
  18. Kolka, R.; Weishampel, P.; Fröberg, M. Measurement and Importance of Dissolved Organic Carbon. In Field Measurements for Forest Carbon Monitoring; Hoover, C.M., Ed.; Springer: Dordrecht, The Netherlands, 2008; pp. 171–176. [Google Scholar]
  19. Hollands, C.; Shannon, V.L.; Sawicka, K.; Vanguelova, E.I.; Benham, S.E.; Shaw, L.J.; Clark, J.M. Management impacts on the dissolved organi carbon release from deadwood, ground vegetation and the forest floor in a temperate Oak woodland. Sci. Total Environ. 2022, 805, 150399. [Google Scholar] [CrossRef]
  20. Neff, J.C.; Asner, G.P. Dissolved Organic Carbon in Terrestrial Ecosystems: Synthesis and a Model. Ecosystems 2001, 4, 29–48. [Google Scholar] [CrossRef]
  21. Michalzik, B.; Kalbitz, K.; Park, J.-H.; Solinger, S.; Matzner, E. Fluxes and concentrations of dissolved organic carbon and nitrogen—A synthesis for temperate forests. Biogeochemistry 2001, 52, 173–205. [Google Scholar] [CrossRef]
  22. Kalbitz, K.; Solinger, S.; Park, J.-H.; Michalzik, B.; Matzner, E. Controls on the Dynamics of Dissolved Organic Matter in Soils: A Review. Soil Sci. 2000, 165, 277–304. [Google Scholar] [CrossRef]
  23. Aitkenhead, J.A.; McDowell, W.H. Soil C:N ratio as a predictor of annual riverine DOC flux at local and global scales. Glob. Biogeochem. Cycles 2000, 14, 127–138. [Google Scholar] [CrossRef]
  24. Allen, R.G.; Pereira, L.S.; Raes, D.; Smith, M. Crop Evapotranspiration (Guidlines for Computing Crop Water Requirements); FAO: Rome, Italy, 1998. [Google Scholar]
  25. Sarkkola, S.; Hokka, H.; Koivusalo, H.; Nieminen, M.; Ahti, E.; Paivanen, J.; Laine, J. Role of tree stand evapotranspiration in maintaining satisfactory drainage conditions in drained peatlands. Can. J. For. Res. 2010, 40, 1485–1496. [Google Scholar] [CrossRef]
  26. Kløve, B.; Berglund, K.; Berglund, Ö.; Weldon, S.; Maljanen, M. Future options for cultivated Nordic peat soils: Can land management and rewetting control greenhouse gas emissions? Environ. Sci. Policy 2017, 69, 85–93. [Google Scholar] [CrossRef]
  27. LEGMC Climate Portal. Available online: https://klimats.meteo.lv/operativais_klimats/laikapstaklu_apskati/arhivs/2021/gads/ (accessed on 30 April 2023).
  28. Comet System. Available online: https://www.cometsystem.com/products/temperature-data-logger-for-four-external-pt1000-probes/reg-u0141 (accessed on 30 October 2023).
  29. Gasmet. Available online: https://www.gasmet.com/cases/gas-analyzer-builds-complete-picture-of-contamination/ (accessed on 30 October 2023).
  30. LVS EN ISO 17025:2018; General Requirements for the Competence of Testing and Calibration Laboratories. Ltd. “Latvijas Standarts” (LVS): Riga, Latvia, 2018.
  31. LVS ISO 10523:2012; Water Quality—Determination of pH (ISO 10523:2008). Ltd. “Latvijas Standarts” (LVS): Riga, Latvia, 2012.
  32. LVS EN 27888:1993; Water Quality—Determination of Electrical Conductivity. Ltd. “Latvijas Standarts” (LVS): Riga, Latvia, 1993.
  33. Skalar. Formacs Total Organic Carbon/Total Nitrogen Analyzers. Available online: https://www.skalar.com/products/formacs-total-organic-carbon-total-nitrogen-analyzers (accessed on 30 October 2023).
  34. LVS EN 12260:2004; Water Quality—Determination of Nitrogen. Ltd. “Latvijas Standarts” (LVS): Riga, Latvia, 2004.
  35. LVS EN 1484:2000; Water Quality—Guidelines for the Determination of Total Organic Carbon (TOC) and Dissolved Organic Carbon (DOC). Ltd. “Latvijas Standarts” (LVS): Riga, Latvia, 2000.
  36. Thermo Fisher Scientific. QuantStudio™ 7 Flex Real-Time PCR System. Available online: https://www.thermofisher.com/order/catalog/product/942350023500 (accessed on 30 October 2023).
  37. LVS EN ISO 7980:2000; Water Quality—Determination of Calcium and Magnesium—Atomic Absorption Spectrometric Method. Ltd. “Latvijas Standarts” (LVS): Riga, Latvia, 2000.
  38. LVS ISO 9964-3:2000; Water Quality—Determination of Sodium and Potassium—Part 3: Flame Photometric Method. Ltd. “Latvijas Standarts” (LVS): Riga, Latvia, 2000.
  39. Vanags-Duka, M.; Bārdule, A.; Butlers, A.; Upenieks, E.M.; Lazdiņš, A.; Purviņa, D.; Līcīte, I. GHG Emissions from Drainage Ditches in Peat Extraction Sites and Peatland Forests in Hemiboreal Latvia. Land 2022, 11, 2233. [Google Scholar] [CrossRef]
  40. Monteith, J.L. Evaporation and environment. In Symposia of the Society for Experimental Biology; Cambridge University Press: Cambridge, UK, 1965; Volume 19, pp. 205–234. [Google Scholar]
  41. Zotarelli, L.; Dukes, M.D.; Romero, C.C.; Migliaccio, K.W.; Morgan, K.T. Step by Step Calculation of the Penman-Monteith Evapotranspiration (FAO-56 Method); Agricultural and Biological Engineering Department, UF/IFAS Extension: Gainesville, FL, USA, 2015. [Google Scholar]
  42. R Core Team. The R Project for Statistical Computing. Available online: https://www.R-project.org (accessed on 25 July 2023).
  43. Wei, T.; Simko, V. R Package ‘Corrplot’: Visualization of a Correlation Matrix (Version 0.92). 2021. Available online: https://github.com/taiyun/corrplot (accessed on 20 December 2023).
  44. Aphalo, P. ggpmisc: Miscellaneous Extensions to ‘ggplot2’. R Package Version 0.5.3. 2023. Available online: https://CRAN.R-project.org/package=ggpmisc (accessed on 20 December 2023).
  45. Kucheryavskiy, S. mdatools-R package for chemometrics. Chemom. Intell. Lab. Syst. 2020, 198, 103937. [Google Scholar] [CrossRef]
  46. ggplot2: Create Elegant Data Visualisations Using the Grammar of Graphics. Available online: https://cran.r-project.org/web/packages/ggplot2/index.html (accessed on 30 July 2023).
  47. Rosset, T.; Binet, S.; Rigal, F.; Gandois, L. Peatland dissolved organic carbon export to surface waters: Global significance and effects of anthropogenic disturbance. Geophys. Res. Lett. 2022, 49, e2021GL096616. [Google Scholar] [CrossRef]
  48. Evans, C.D.; Williamson, J.M.; Kacaribu, F.; Irawan, D.; Suardiwerianto, Y.; Hidayat, M.F.; Laurén, A.; Page, S.E. Rates and spatial variability of peat subsidence in Acacia plantation and forest landscapes in Sumatra, Indonesia. Geoderma 2019, 338, 410–421. [Google Scholar] [CrossRef]
  49. IPCC. 2013 Supplement to the 2006 IPCC Guidelines for National Greenhouse Gas Inventories: Wetlands; Hiraishi, T., Krug, T., Tanabe, K., Srivastava, N., Baasansuren, J., Fukuda, M., Troxler, T.G., Eds.; IPCC: Geneva, Switzerland, 2014. [Google Scholar]
  50. Jaiswal, R.K.; Ali, S.; Bharti, B. Comparative evaluation of conceptual and physical rainfall–runoff models. Appl. Water Sci. 2020, 10, 48. [Google Scholar] [CrossRef]
  51. Launiainen, S.; Guan, M.; Salmivaara, A.; Kieloaho, A.-J. Modeling boreal forest evapotranspiration and water balance at stand and catchment scales: A spatial approach. Hydrol. Earth Syst. Sci. 2019, 23, 3457–3480. [Google Scholar] [CrossRef]
  52. Filep, T.; Rékási, M. Factors controlling dissolved organic carbon (DOC), dissolved organic nitrogen (DON) and DOC/DON ratio in arable soils based on a dataset from Hungary. Geoderma 2011, 162, 312–318. [Google Scholar] [CrossRef]
  53. Yallop, A.R.; Clutterbuck, B. Land management as a factor controlling dissolved organic carbon release from upland peat soils 1: Spatial variation in DOC productivity. Sci. Total Environ. 2009, 407, 3803–3813. [Google Scholar] [CrossRef]
  54. Rasilo, T.; Ojala, A.; Huotari, J.; Starr, M.; Pumpanen, J. Concentrations and quality of DOC along the terrestrial–aquatic continuum in a boreal forested catchment. Freshw. Sci. 2015, 34, 440–455. [Google Scholar] [CrossRef]
  55. Thompson, L.M.; Low, M.; Shewan, R.; Schulze, C.; Simba, M.; Sonnentag, O.; Tank, S.E.; Olefeldt, D. Concentrations and yields of mercury, methylmercury, and dissolved organic carbon from contrasting catchments in the discontinuous permafrost region, western Canada. Water Resour. Res. 2023, 59, e2023WR034848. [Google Scholar] [CrossRef]
  56. Zhu, X.; Berninger, F.; Chen, L. Several mechanisms drive the heterogeneity in browning across a boreal stream network. ESS Open Archive, 2023; preprint. [Google Scholar] [CrossRef]
  57. Ledesma, J.L.J.; Futter, M.N.; Laudon, H.; Evans, C.D.; Köhler, S.J. Boreal forest riparian zones regulate stream sulfate and dissolved organic carbon. Sci. Total Environ. 2016, 560–561, 110–122. [Google Scholar] [CrossRef]
  58. Laudon, H.; Sponseller, R.A.; Bishop, K. From legacy effects of acid deposition in boreal streams to future environmental threats. Environ. Res. Lett. 2021, 16, 015007. [Google Scholar] [CrossRef]
  59. Lawrence, G.B.; Roy, K.M. Ongoing increases in dissolved organic carbon are sustained by decreases in ionic strength rather than decreased acidity in waters recovering from acidic deposition. Sci. Total Environ. 2021, 766, 142529. [Google Scholar] [CrossRef]
  60. Kerr, J.G.; Eimers, M.C. Decreasing soil water Ca2+ reduces DOC adsorption in mineral soils: Implications for long-term DOC trends in an upland forested catchment in southern Ontario, Canada. Sci. Total Environ. 2012, 427–428, 298–307. [Google Scholar] [CrossRef]
  61. Reemtsma, T.; Bredow, A.; Gehring, M. The natura and kinetics of organic matter release from soil by salt solutions. Eur. J. Soil Sci. 1999, 50, 53–64. [Google Scholar] [CrossRef]
  62. Güngör, E.B.O.; Bekbölet, M. Zinc release by humic and fulvic acid as influenced by pH, complexation and DOC sorption. Geoderma 2010, 159, 131–138. [Google Scholar] [CrossRef]
  63. Goulding, K.W.T. Soil acidification and the importance of liming agricultural soils with particular reference to the United Kingdom. Soil Use Manag. 2016, 32, 390–399. [Google Scholar] [CrossRef]
  64. Deru, J.G.C.; Hoekstra, N.; van Agtmaal, M.; Bloem, J.; de Goede, R.; Brussaard, L.; van Eekeren, N. Effects of Ca:Mg ratio and pH on soil chemical, physical and microbiological properties and grass N yield in drained peat soil. N. Z. J. Agric. Res. 2023, 66, 61–82. [Google Scholar] [CrossRef]
  65. Grover, S.P.; Butterly, C.R.; Wang, X.; Tang, C. The short-term effects of liming on organic carbon mineralisation in two acidic soils as affected by different rates and application depths of lime. Biol. Fertil. Soils 2017, 53, 431–443. [Google Scholar] [CrossRef]
  66. Makovskis, K.; Dūmiņš, K.; Štāls, T.A.; Vendiņa, V.; Bārdule, A.; Lazdiņa, D. Long-Term Effect of Wood Ash and Wastewater Sludge Fertilization on Tree Growth in Short-Rotation Forest Plantations on Abandoned Agricultural Land: A Case Study. Sustainability 2023, 15, 16272. [Google Scholar] [CrossRef]
  67. Wind-Mulder, H.L.; Rochefort, L.; Vitt., D.H. Water and peat chemistry comparisons of natural and post-harvested peatlands across Canada and their relevance to peatland restoration. Ecol. Eng. 1996, 7, 161–181. [Google Scholar] [CrossRef]
  68. Sapek, B. Relationship between dissolved organic carbon and calcium and megnesium in soil water phase and their uptake by meadow vegetation. J. Water Land Dev. 2013, 19, 69–76. [Google Scholar] [CrossRef]
  69. Fröberg, M.; Berggren, D.; Bergkvist, B.; Bryant, C.; Mulder, J. Concentration and Fluxes of Dissolved Organic Carbon (DOC) in Three Norway Spruce Stands along a Climatic Gradient in Sweden. Biogeochemistry 2006, 77, 1–23. [Google Scholar] [CrossRef]
  70. Āboltiņš, O.; Dreimanis, A. Glacigenic deposits in Latvia. In Glacial Deposits in North-East Europe; Ehlers, J., Kozarski, S., Gibbard, P., Eds.; Balkema, Rotterdam/Brookfield; CRC Press: Boca Raton, FL, USA, 1995; pp. 105–113. [Google Scholar]
Figure 1. Location and land use type of the research sites in Latvia.
Land 13 00790 g001
Figure 2. Variation in monthly mean DOC concentration in groundwater by land use type (n = 24 for each land use type). Rectangles fall within the first to third quartile range. The intercepts fall within the zeroth to fourth quartile range. The rectangles are divided by the median. “x” represents the arithmetic mean value. Abandoned means abandoned peat extraction site.
Land 13 00790 g002
Figure 3. Mean monthly DOC concentrations in groundwater in different land use types. Abandoned means abandoned peat extraction site.
Land 13 00790 g003
Figure 4. Monthly mean precipitation, potential evapotranspiration, actual evapotranspiration, and runoff rates in all research sites (n = 2190).
Land 13 00790 g004
Figure 5. Monthly potential evapotranspiration (left) and runoff (right) rates in all research sites. Abandoned means abandoned peat extraction site.
Land 13 00790 g005
Figure 6. Mean monthly DOC efflux by land use type, each represented with 24 measurements (n = 168). The rectangles are located within the first to third quartile range. The intercepts range from the zeroth to fourth quartile. Dots represent extremes. The rectangles are divided by the median. “x” represents the arithmetic mean value. Abandoned means abandoned peat extraction site.
Land 13 00790 g006
Figure 7. Estimated annual DOC efflux from each land use type, each represented by 24 concentration measurements and runoff estimates (n = 168). Whiskers indicate S.E. Abandoned means abandoned peat extraction site.
Land 13 00790 g007
Figure 8. Correlation matrix for each land use type group. All sites (A) consist of all research sites, Peatland forests (B) consist of Scots pine forests and silver birch forests; peat extraction sites (C) consist of active peat extraction sites and abandoned peat extraction sites with and without vegetation; and agricultural lands (D) consist of croplands and grasslands. Red indicates negative correlation; blue indicates positive correlation; blank indicates insignificant correlation (p > 0.05).
Land 13 00790 g008
Figure 9. Most significant individual regressions between monthly mean DOC concentrations and different parameters of groundwater chemical composition in different types of land use. All sites (A) consist of all research sites, Peatland forests (B) consist of Scots pine forests and silver birch forests; peat extraction sites (C) consist of active peat extraction sites and abandoned peat extraction sites with and without vegetation; agricultural lands (D) consist of croplands and grasslands. Abandoned means abandoned peat extraction site.
Land 13 00790 g009
Table 1. Main parameters of the forest stands (Mean ± S.E.).
Land Use Type,
Tree Specie
Research SiteNumber of Trees ha−1Tree Diameter at Breast Height, cmTree Height, cm
Scots pine forestSite 1206021.3 ± 0.918.8 ± 1.3
Scots pine forestSite239207.9 ± 0.48.6 ± 0.5
Silver birch forestSite380014.2 ± 0.813.7 ± 1.4
Silver birch forestSite4194015.3 ± 0.316.8 ± 0.7
Table 2. Characterization of the research sites.
Land Use TypeResearch SiteDitch Catchment Area, haDitch Width, cmDitch Depth, cmCoordinates (EPSG: 4326)
XY
Scots pine forestSite11922053125.994357.2681
Site 2962125426.4794 57.2165
Silver birch forestSite 3212605721.520056.7274
Site 41922695226.1401 57.3312
Abandoned peat extraction site with shrub and herbaceous plant vegetationSite 5951537523.9802 56.8246
Site 6812076926.6256 57.2494
Abandoned peat extraction site with bare peatSite 71311335723.9773 56.8259
Site 8411963824.1085 56.8453
Active peat extraction siteSite 91371429024.305856.5041
Site 1024014412226.6558 57.0322
GrasslandSite 11522324623.5818 56.9108
Site 12662557023.5951 56.9129
CroplandSite 13481665221.1897 56.2119
Site 14552055122.8384 56.5644
Table 3. Adjusted FAO correction coefficient values for each land use type using Allen et al. [24].
Land Use TypeKc iniKc midKc end
Scots pine forest111
Silver birch forest0.51.20.95
Abandoned peat extraction site with shrub and herbaceous plant vegetation0.61.050.7
Abandoned peat extraction site with bare beat0.50.650.55
Active peat extraction site0.50.650.55
Grassland0.610.9
Cropland0.31.050.3
Table 4. Variations in monthly mean values (±S.E.) of environmental variables in different land use types. Superscript numbers show statistically significant (p < 0.05) differences between mean values across land use types (n = 24 for each land use type). Abandoned means abandoned peat extraction site.
ParameterCropland (1)Grassland (2)Silver Birch Forest (3)Scots Pine Forest (4)Abandoned with Vegetation (5)Abandoned without Vegetation (6)Active Peat Extraction Site (7)
DOC, mg L−114.17 ± 1.63 2, 3, 4, 5, 6, 718.62 ± 1.26 3, 4, 5, 6, 751.86 ± 8.06 4, 5, 6, 7113.71 ± 4.41 5, 694.23 ± 3.5691.81 ± 5.37109.72 ± 14.14
ET, mm49.59 ± 13.0 51.08 ± 14.28 63.99 ± 12.52 6, 758.81 ± 9.88 6, 753.97 ± 11.19 32.34 ± 5.4332.34 ± 5.43
pH7.81 ± 0.04 3, 4, 5, 6, 77.71 ± 0.06 3, 4, 5, 6, 77.18 ± 0.1 4, 5, 6, 75.47 ± 0.2 75.63 ± 0.21 75.22 ± 0.17 76.29 ± 0.12
EC, µS cm−1465.57 ± 13.56 3, 4, 5, 6, 7533.82 ± 31.26 3, 4, 5, 6, 7285.13 ± 20.39 4, 5, 6, 768.58 ± 6.49 6, 782.28 ± 8.42 6, 750.17 ± 4.06 7114.96 ± 13.11
K, mg L−11.6 ± 0.17 3, 4, 5, 61.3 ± 0.41 1.0 ± 0.08 4, 5, 70.41 ± 0.02 5, 6, 70.67 ± 0.05 6, 70.9 ± 0.06 71.96 ± 0.18
Ca, mg L−1 96.74 ± 2.56 2, 3, 4, 5, 6, 7108.75 ± 3.78 3, 4, 5, 6, 759.03 ± 3.26 4, 5, 6, 718.53 ± 1.84 616.4 ± 1.78 610.11 ± 1.17 718.54 ± 1.9
Mg, mg L−1 18.09 ± 0.98 2, 3, 4, 5, 6, 725.55 ± 0.64 3, 4, 5, 6, 711.48 ± 1.19 4, 5, 6, 70.83 ± 0.08 5, 6, 71.3 ± 0.07 6, 70.62 ± 0.02 74.45 ± 0.42
TN, mg L−16.62 ± 1.61 2, 41.74 ± 0.66 3, 5, 6, 73.75 ± 0.72 72.7 ± 0.21 5, 74.04 ± 0.2 6, 73.35 ± 0.27 78.11 ± 0.68
GW, cm−29.63 ± 7.1 2, 4, 5−5.25 ± 5.01 3, 5, 7−47.54 ± 8.06 4, 6, 7−11.18 ± 3.53 5, 7−55.94 ± 9.47 6, 7−16.92 ± 3.05 7−28.13 ± 3.94
WL in ditch, cm11.3 ± 2.35 2, 3, 5, 6, 719.49 ± 2.2 3, 4, 62.81 ± 1.27 5, 6, 75.75 ± 2.23 5, 6, 738.55 ± 9.5937.49 ± 7.0124.13 ± 5.42
Table 5. Comparison of the annual DOC efflux in different types of land use estimated within this study with IPCC default DOC emission factors for temperate climate zone. ∆ DOC is proportional increase (1 + ∆ DOC) in DOC flux from drained peatlands relative to naturally wet peatlands.
Land Use TypeIPCC DOC Efflux (Natural) (kg C ha−1 y−1)IPCC ∆DOC (Drained) IPCC DOC Efflux (Drained) (kg C ha−1 y−1)DOC Efflux in Our Research Sites (kg C ha−1 y−1)∆DOC (Drained) in Our Research Sites
Scots pine forest210 (170–260)0.6340 (270–420)328.3 ± 23.10.56
Silver birch forest153.6 ± 11.2-
Active peat extraction site
Abandoned extraction site with vegetation
513.1 ± 38.71.44
326.1 ± 22.90.55
Abandoned extraction with bare peat413.9 ± 30.30.97
Grassland61.9 ± 4.39-
Cropland62.1 ± 5.0-
Mean265 ± 66.6 -
Disclaimer/Publisher’s Note: The statements, opinions and data contained in all publications are solely those of the individual author(s) and contributor(s) and not of MDPI and/or the editor(s). MDPI and/or the editor(s) disclaim responsibility for any injury to people or property resulting from any ideas, methods, instructions or products referred to in the content.

