Article

Spatio-Temporal Correlation and Optimization of Urban Development Characteristics and Carbon Balance in Counties: A Case Study of the Anhui Province, China

School of Public Administration, Central China Normal University, Wuhan 430079, China
*
Author to whom correspondence should be addressed.
Land 2024, 13(6), 810; https://doi.org/10.3390/land13060810
Submission received: 2 April 2024 / Revised: 29 May 2024 / Accepted: 31 May 2024 / Published: 6 June 2024
(This article belongs to the Section Land Systems and Global Change)

Abstract

:
Exploring the carbon balance pattern from the perspective of urban spatial development pattern is an effective way to solve the urban carbon emissions reduction problem, promote high-quality economic development, and synergize the development of the regional “nature–economy” dual system. Taking 105 counties (districts) in Anhui Province as an example, based on the calculation of regional carbon balance and urban development characteristics in 2001, 2010, and 2019, we used the spatio-temporal leap model to analyze urban development characteristics and combined the GWTR model and geodetic probes to explore the spatial and temporal correlation between the carbon balance and urban development characteristics, as well as their influence mechanisms. The results of the study show that: (1) The carbon balance of the 105 counties in Anhui Province shows a general decline in the time axis, with a small recovery, and the spatial sequence decreases and then increases from the north to the south. (2) The urban structure of southeast Anhui Province and central Anhui Province is stable, and the development status is good, but the carbon balance is out of balance, the carbon emissions are much higher than the carbon sinks, and the urban structure of the mountainous areas of west Anhui Province and north Anhui Province is dynamic and coordinated, with the carbon balance in harmony. (3) The spatial development characteristics of the cities in Anhui Province have a negative impact on the carbon balance at the scale-area level and a positive impact at the functional structure level. Among them, the area of urban built-up area and the number of the largest urban patches have strong explanatory power for the carbon balance, and the number of the largest urban patches is the main driver of spatial heterogeneity in the carbon balance. (4) The carbon budget of Anhui Province under the influence of urban spatial development characteristics can be divided into four regions: the economic development–carbon balance lopsided area, the ecological protection–carbon balance surplus area, the urban agglomeration–carbon balance adjustment area, and the potential enhancement–carbon balance equilibrium area. Based on the results, urban development needs to strengthen the construction of urban functional zones, and when formulating low-carbon policies in provinces with uneven development, it is necessary to comprehensively analyze the differences in development between cities and build cities according to local conditions.

1. Introduction

Cities are the main places for human survival activities and the symbol of human interference in nature [1]. In recent years, the acceleration of the global urbanization process has led to an expansion of urban land area from 239,000 km2 in 2000 to 519,800 km2 in 2020, an expansion of 117.49% [2]. China’s urbanization rate has also risen from 15.9% in 1978 to 45.4% in 2020 [3]. The expansion of the urban scale has not only brought about economic development but also serious environmental problems. Carbon emissions have increased significantly, with urban areas that occupy only 2% of the global surface contributing to about 75% of carbon emissions [4]. In 2018, global carbon emissions reached their highest value to date at 34.05 billion tons, three times the 1965 level. Under such a context, the increasingly severe greenhouse effect and resulting global warming pose a significant threat to human survival and the ecological environment [5]. Therefore, governments around the world have expressed their determination and implementation pathways for reducing carbon emissions intensity, effectively reducing global greenhouse gas levels and improving the ecological environment. The European Commission presented its Green Deal in December 2019, with specific commitments to reduce net greenhouse gas emissions by 55 per cent by 2030 compared to 1990 levels. The Chinese government has also proposed a “dual carbon” goal, aiming to reach peak carbon emissions by 2030 and achieve carbon neutrality by 2060, which provides China’s direction and pathways for global carbon reduction efforts [6]. On 24 October 2021, the Central Committee of the Communist Party of China and the State Council issued “Opinions on the Complete and Accurate Implementation of the New Development Idea and Doing a Good Job of Carbon Peak and Carbon Neutrality”, which provides systematic planning and overall deployment for the major work of carbon peaks and carbon neutrality. Carbon balance accounting is one of the key components of achieving the “dual carbon” goals [7]. The Chinese Academy of Sciences has developed a carbon balance assessment system suitable for China, providing a powerful scientific tool for China to carry out “carbon neutrality” accounting. This study is based on the carbon budget situation during urban development, analyzes the association between the carbon budget and urban spatial development characteristics, and provides pathways for balancing urban expansion and carbon emissions.
Carbon balance is one of the focuses of global climate change research. Early studies proposed complex carbon exchange processes between the Earth’s atmospheric and biospheric layers [8]. Scholars have explored carbon sources and sinks, respectively, from the perspectives of the natural ecological environment and energy emissions [9,10,11]. The results show that human activities significantly alter the climate environment [12]. Both organic and inorganic carbon sinks can remove carbon emissions to some extent [13,14]. Therefore, the academic field has shifted its perspective to the study of the interaction between carbon sources and carbon sinks, primarily focusing on the carbon balance and cycling [15,16,17] within natural ecosystems like grasslands, forests, and lakes at global [18], national [19], and regional scales [20]. The advent of the “Anthropocene” has made regional carbon balance a new focus for exploring carbon exchange processes [21,22]. The benefits of new technology have diversified research methods, allowing scholars to calculate regional carbon sources and sinks more accurately through various methods. From different perspectives, scholars have used the production estimation method [23], greenhouse gas inventory method [24], sample plot inventory method [25], system dynamics [26], and other methods to calculate regional carbon balance. On this basis, scholars focus on the spatial and temporal characteristics of carbon balance [27], influencing factors [28], land use carbon balance [29], etc. The results show that there are obvious regional characteristics of carbon balance in urban areas, and its influencing factors match the regional ecosystem. Therefore, the investigation of urban carbon balance needs to be based on the actual situation of different cities, from the development mode and characteristics of cities, land use, and resource allocation to exploring the impact of the spatial development characteristics of different cities on the carbon balance [30,31]. In this regard, Shi et al. [32] constructed a quantitative relationship between urban spatial development characteristics and carbon emissions; Wang et al. [33] analyzed the impact mechanisms of urban spatial development characteristics on carbon emissions in 104 prefectural cities in China; and Liu et al. [34] analyzed the relationship between urbanization and carbon emissions at the county level, further narrowing the scope of research.
Through the analysis of the above studies, it can be seen that previous studies mostly focused on the urban spatial development characteristics and carbon emissions at the municipal level and above, with less involvement in the study at the county scale. And the studies mostly focused on the carbon emissions perspective, while the carbon sink perspective, which is greatly affected by urban development, was less involved. Therefore, the purpose of this study is as follows: (1) explore the characteristics of urban spatial development at the county level in areas with uneven development; (2) analyze the spatial–temporal correlation between the spatial development characteristics of county-level cities and the carbon balance; and (3) clarify the impact mechanism of urban spatial development characteristics on the carbon balance.
In this study, 104 county-level divisions in Anhui Province were selected as research areas to measure the carbon balance and analyze the spatial and temporal correlation characteristics of urban spatial development and the carbon balance in Anhui Province from 2001 to 2019. The selection of the study area and scale is primarily based on two considerations: First, many cities in Anhui Province receive support from surrounding provinces and cities. Therefore, the province exhibits diverse urban spatial development characteristics, which can provide decision-making references for regions with uneven urban development. Second, the county level, as the basic unit of the city, is crucial for the implementation of macro and micro policies [35]. Discussions based on counties can implement carbon emissions reduction policies and provide support for multi-scale studies.

2. Overview of the Study Area and Data Sources

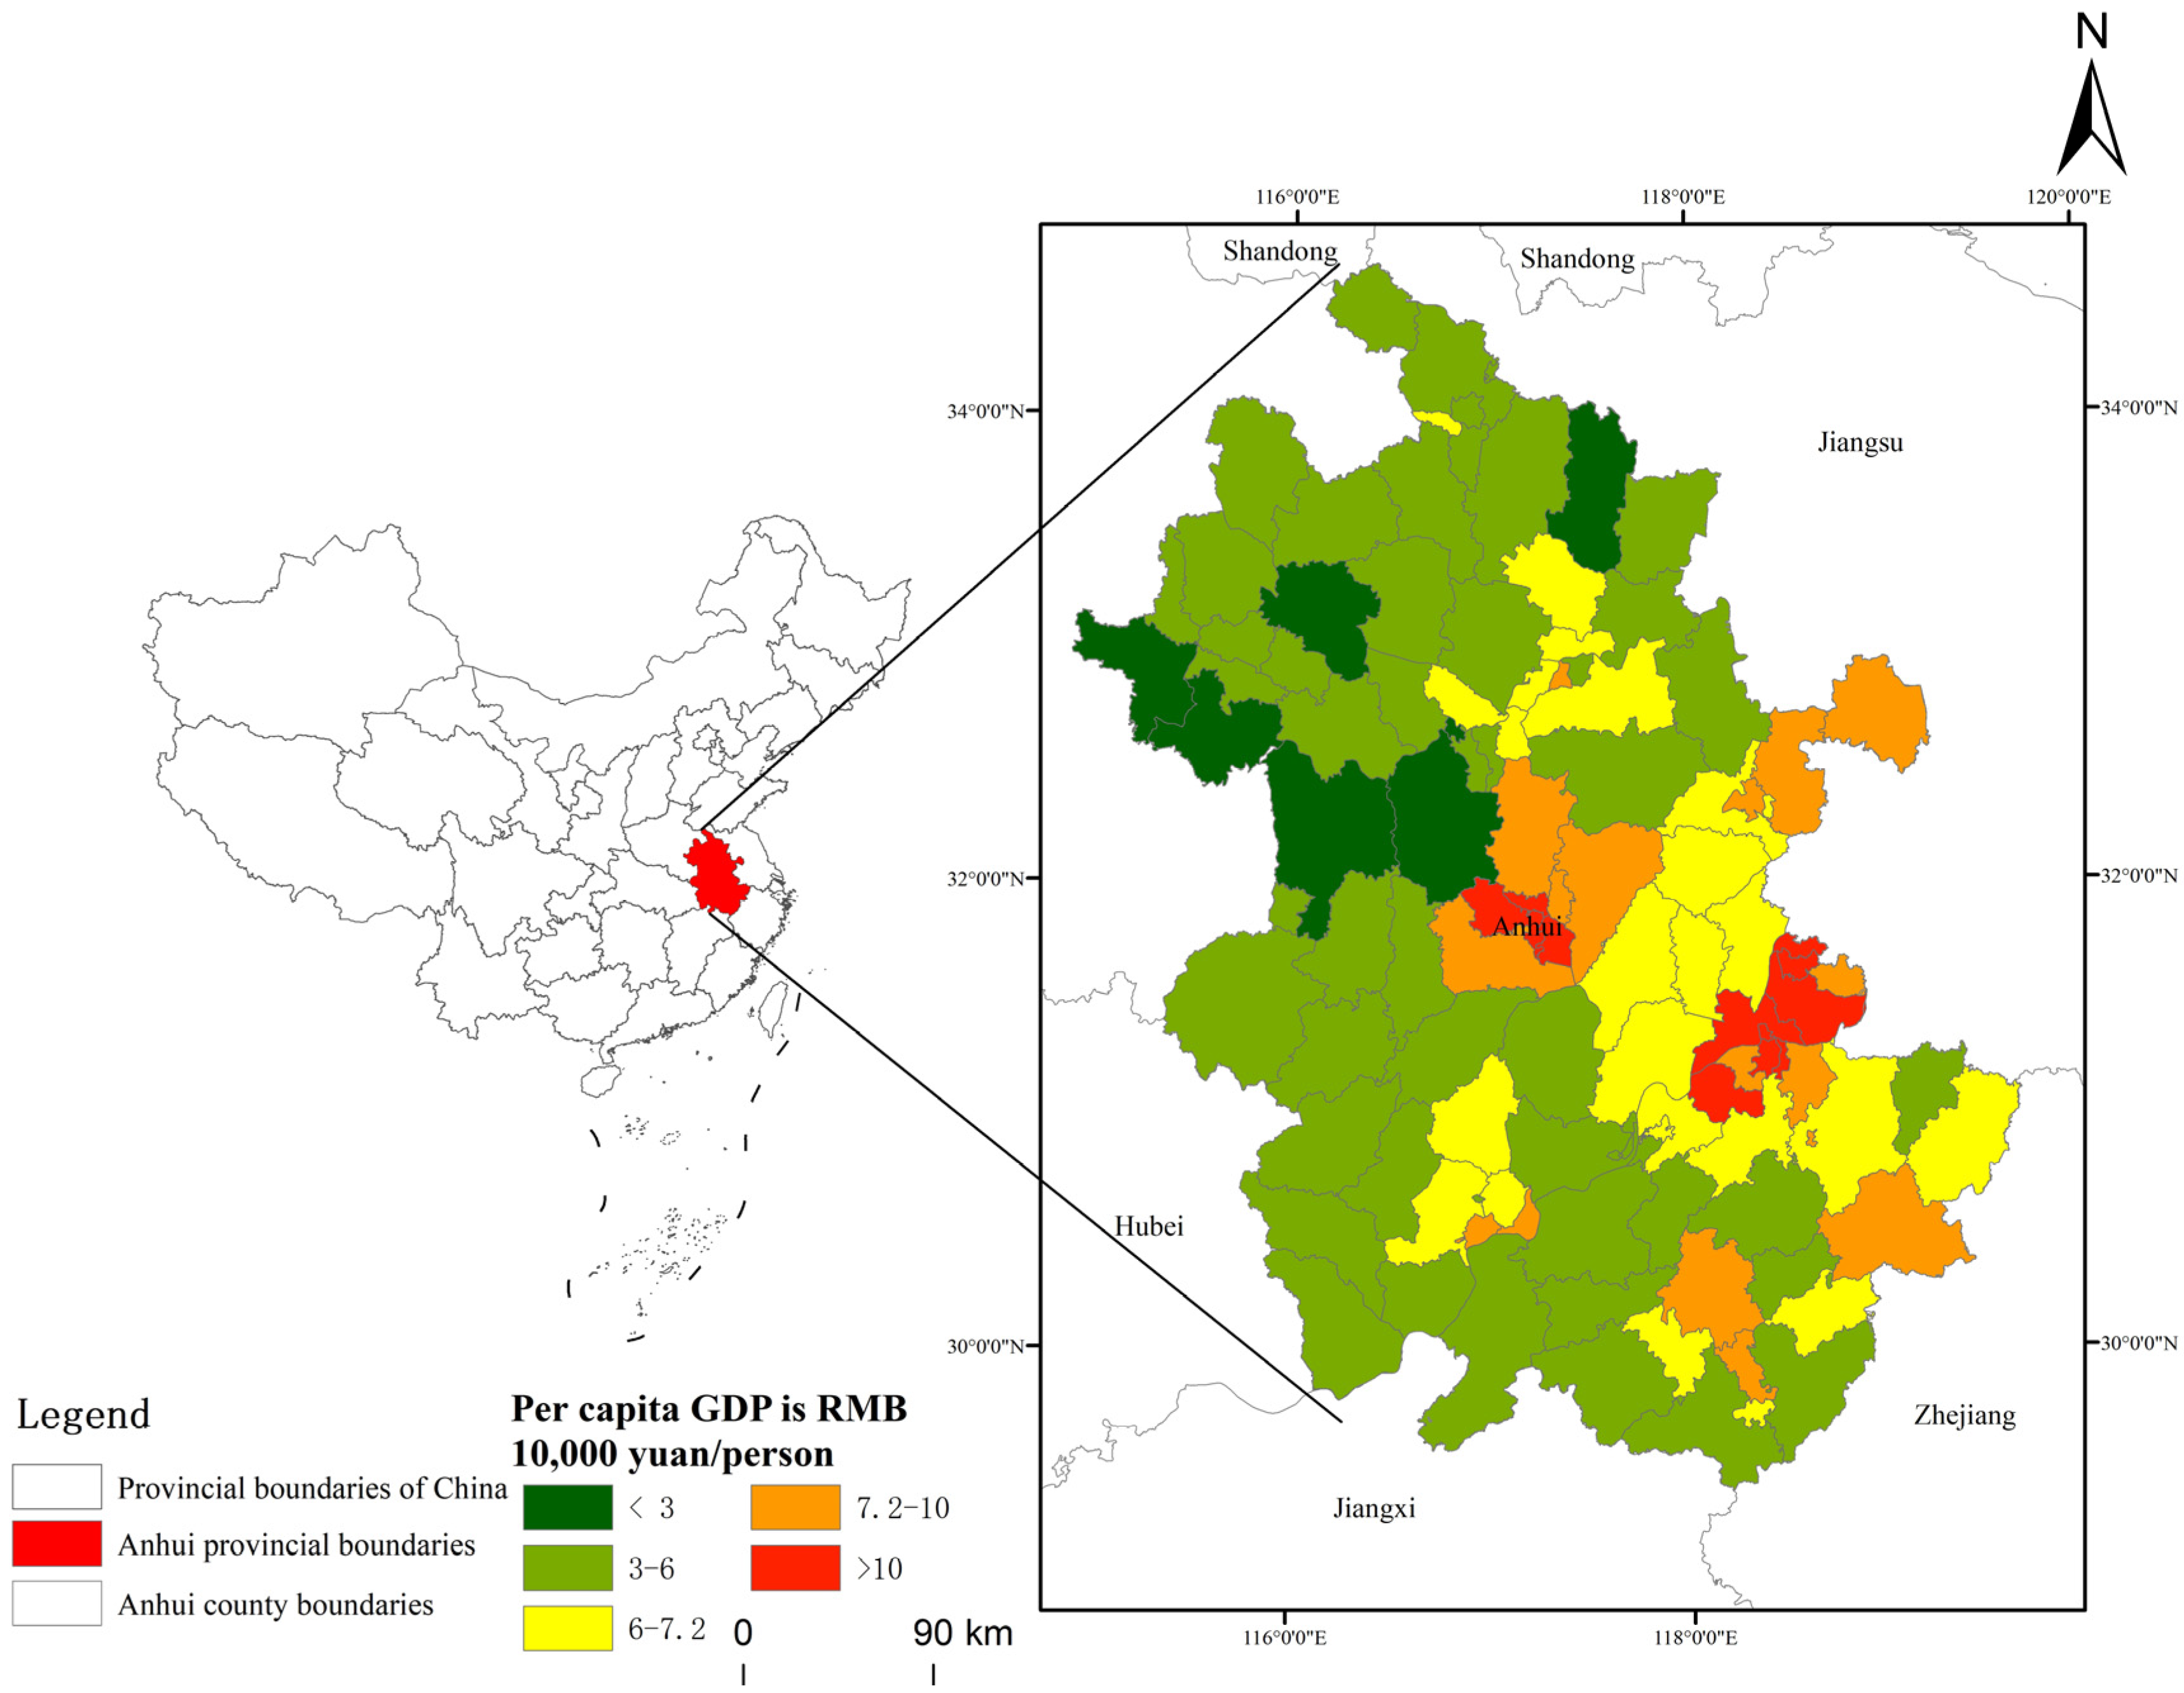
2.1. Overview of the Study Area

Anhui Province (Figure 1) is located in the central and eastern part of China, spanning the Yangtze River and Huaihe River to the north and south, with a total land area of 14.01 km2, accounting for 1.45% of the national land area and a total of 105 counties (districts). As a new member of the “Yangtze River Delta” economic zone, Anhui Province has received peer-to-peer support and assistance from Jiangsu, Zhejiang, Shanghai, and other provinces and cities. The level of urbanization and industrialization has been continuously improved. The GDP reached RMB 3868.06 billion in 2020, which was a period of rapid development. However, at the county level, the economic development of the 105 counties (districts) in Anhui Province is uneven (Figure 1). Only 25 counties’ (districts’) per capita GDP reached the national average (RMB 72,000/person), and only 10 counties (districts) reached more than RMB 100,000/person. These counties are distributed in the Anhui Hefei metropolitan area and around the Nanjing metropolitan area. The per capita GDPs of the northern, southern, and western mountainous areas of Anhui are basically lower than the provincial average (RMB 62,000/person). The per capita GDP of each county (district) has a kurtosis of 3.025 and a skewness of 1.537, which are not in line with the normal distribution, and the degree of skewness is more serious, indicating that the economic development of Anhui Province is unbalanced (Table 1).

2.2. Data Sources

Since China launched the “Carbon Special” survey in January 2011, the carbon storage and carbon sequestration capacities of various ecosystems have been systematically investigated and observed, and the carbon sequestration situation of China’s terrestrial ecosystems was identified for the first time in 2019. Therefore, this paper mainly selects the land use data for Anhui Province in 2001, 2010, and 2019 for research.
The land use data for Anhui Province in 2001, 2010, and 2019 used in this paper are from Jie Yang et al. [36], based on the Google Earth Landsat image build for China with 30 m resolution in 1990–2020 for land cover data and dynamics (https://essd.copernicus.org/articles/13/3907/2021/, accessed on 12 November 2023).
The carbon emissions data for the three years are derived from the ODIAC2019 carbon emission dataset [37], which is based on the data for fossil fuel combustion, cement production, and gas combustion, with a resolution of 1 km × 1 km (tC/km2).
For climate data, NPP data are from MODIS NPP data from the United States Geological Survey (https://www.usgs.gov/, accessed on 25 November 2023). Average annual temperature and precipitation are obtained from the National Earth System Science Data Center (http://www.geodata.cn/, accessed on 26 November 2023).
Soil bulk density data, gravel data, and soil organic carbon content data are derived from the 1:100,000 HWSD dataset, and the data in the dataset for China are the 1:100,000 soil map provided by the Nanjing Institute of Soil Research, Chinese Academy of Sciences. Soil data at the level of 0~30 cm are selected in this study.

3. Methods

In this paper, the study of carbon balance and urban spatial development characteristics in Anhui Province firstly starts from the spatial and temporal evolution of the two, then comprehensively analyzes the spatial and temporal interaction between the two and explores the mechanism of their influence and, finally, based on the above analysis, carries out the zonal control and management of carbon balance in Anhui Province (Figure 2).

3.1. Measurement of Carbon Balance

The carbon balance is the relative balance between the carbon emissions and carbon sink. This paper uses the difference between the carbon sink and carbon emissions, that is, the net value of the carbon cycle, to measure the carbon balance. The carbon sink is equal to the carbon emissions, and the carbon balance is zero, so the carbon sink and carbon emissions compensate each other, and the urban carbon is balanced. If the carbon balance is positive, the carbon sink is greater than the carbon emissions, indicating that the carbon sink can make up for the carbon emissions, and the urban carbon presents a coordinated balance. If the carbon balance is negative, the carbon sink is less than the carbon emissions, indicating that the carbon sink is weaker than the carbon emissions, and the urban carbon presents a malignant imbalance. In this study, the urban carbon balance is obtained based on the annual net productivity data and carbon emissions data of the ecosystem [38], and the formula is as follows:
C B = N E P C E
where CB is the carbon balance (kg C/m2), NEP is the annual net ecosystem productivity (kg C/m2), and CE is the average annual CO2 emissions (kg C/m2).
NEP represents the net photosynthetic production of atmospheric CO2 into the ecosystem [39], which was calculated by net primary productivity (NPP) of vegetation and heterotrophic respiration (Rh) of soil with the following equation:
N E P = N P P R h
where NPP is annual net primary productivity (kg C/m2), and Rh is annual soil heterotrophic respiration (kg C/m2).
The measurement method of Rh requires the deployment of sample points [40], which consumes a lot of manpower and material resources for the measurement, so this paper, based on the results of Zhang et al. [41], utilized soil respiration (Rs) to derive Rh with the following formula:
R h = 0.6163 × R s 0.7918
where Rs is the annual soil respiration (kg C/m2).
The formula for Rs is referenced to the soil respiration model developed by Chen et al. [42] based on 657 annual soil respiration data points published from 147 sites around the world with the following equation:
R s = 1.55 e 0.031 T × P P + 0.68 × SOC SOC + 2.23
where T is the mean annual temperature (°C), P is the total annual precipitation (m), and SOC is the density of soil organic carbon in the <30 cm surface layer (kg C/m2).
The formula for SOC is as follows:
SOC = C c × γ × H × ( 1 0.01 × δ 2 mm ) × 0.1
where Cc is the organic carbon content of top soil <30 cm; γ is the soil bulk weight (g/cm3); H is the soil thickness (cm); and δ2mm is the soil <2 mm gravel (%).

3.2. Analysis of the Characteristics of Urban Spatial Development and Their Spatial–Temporal Evolution

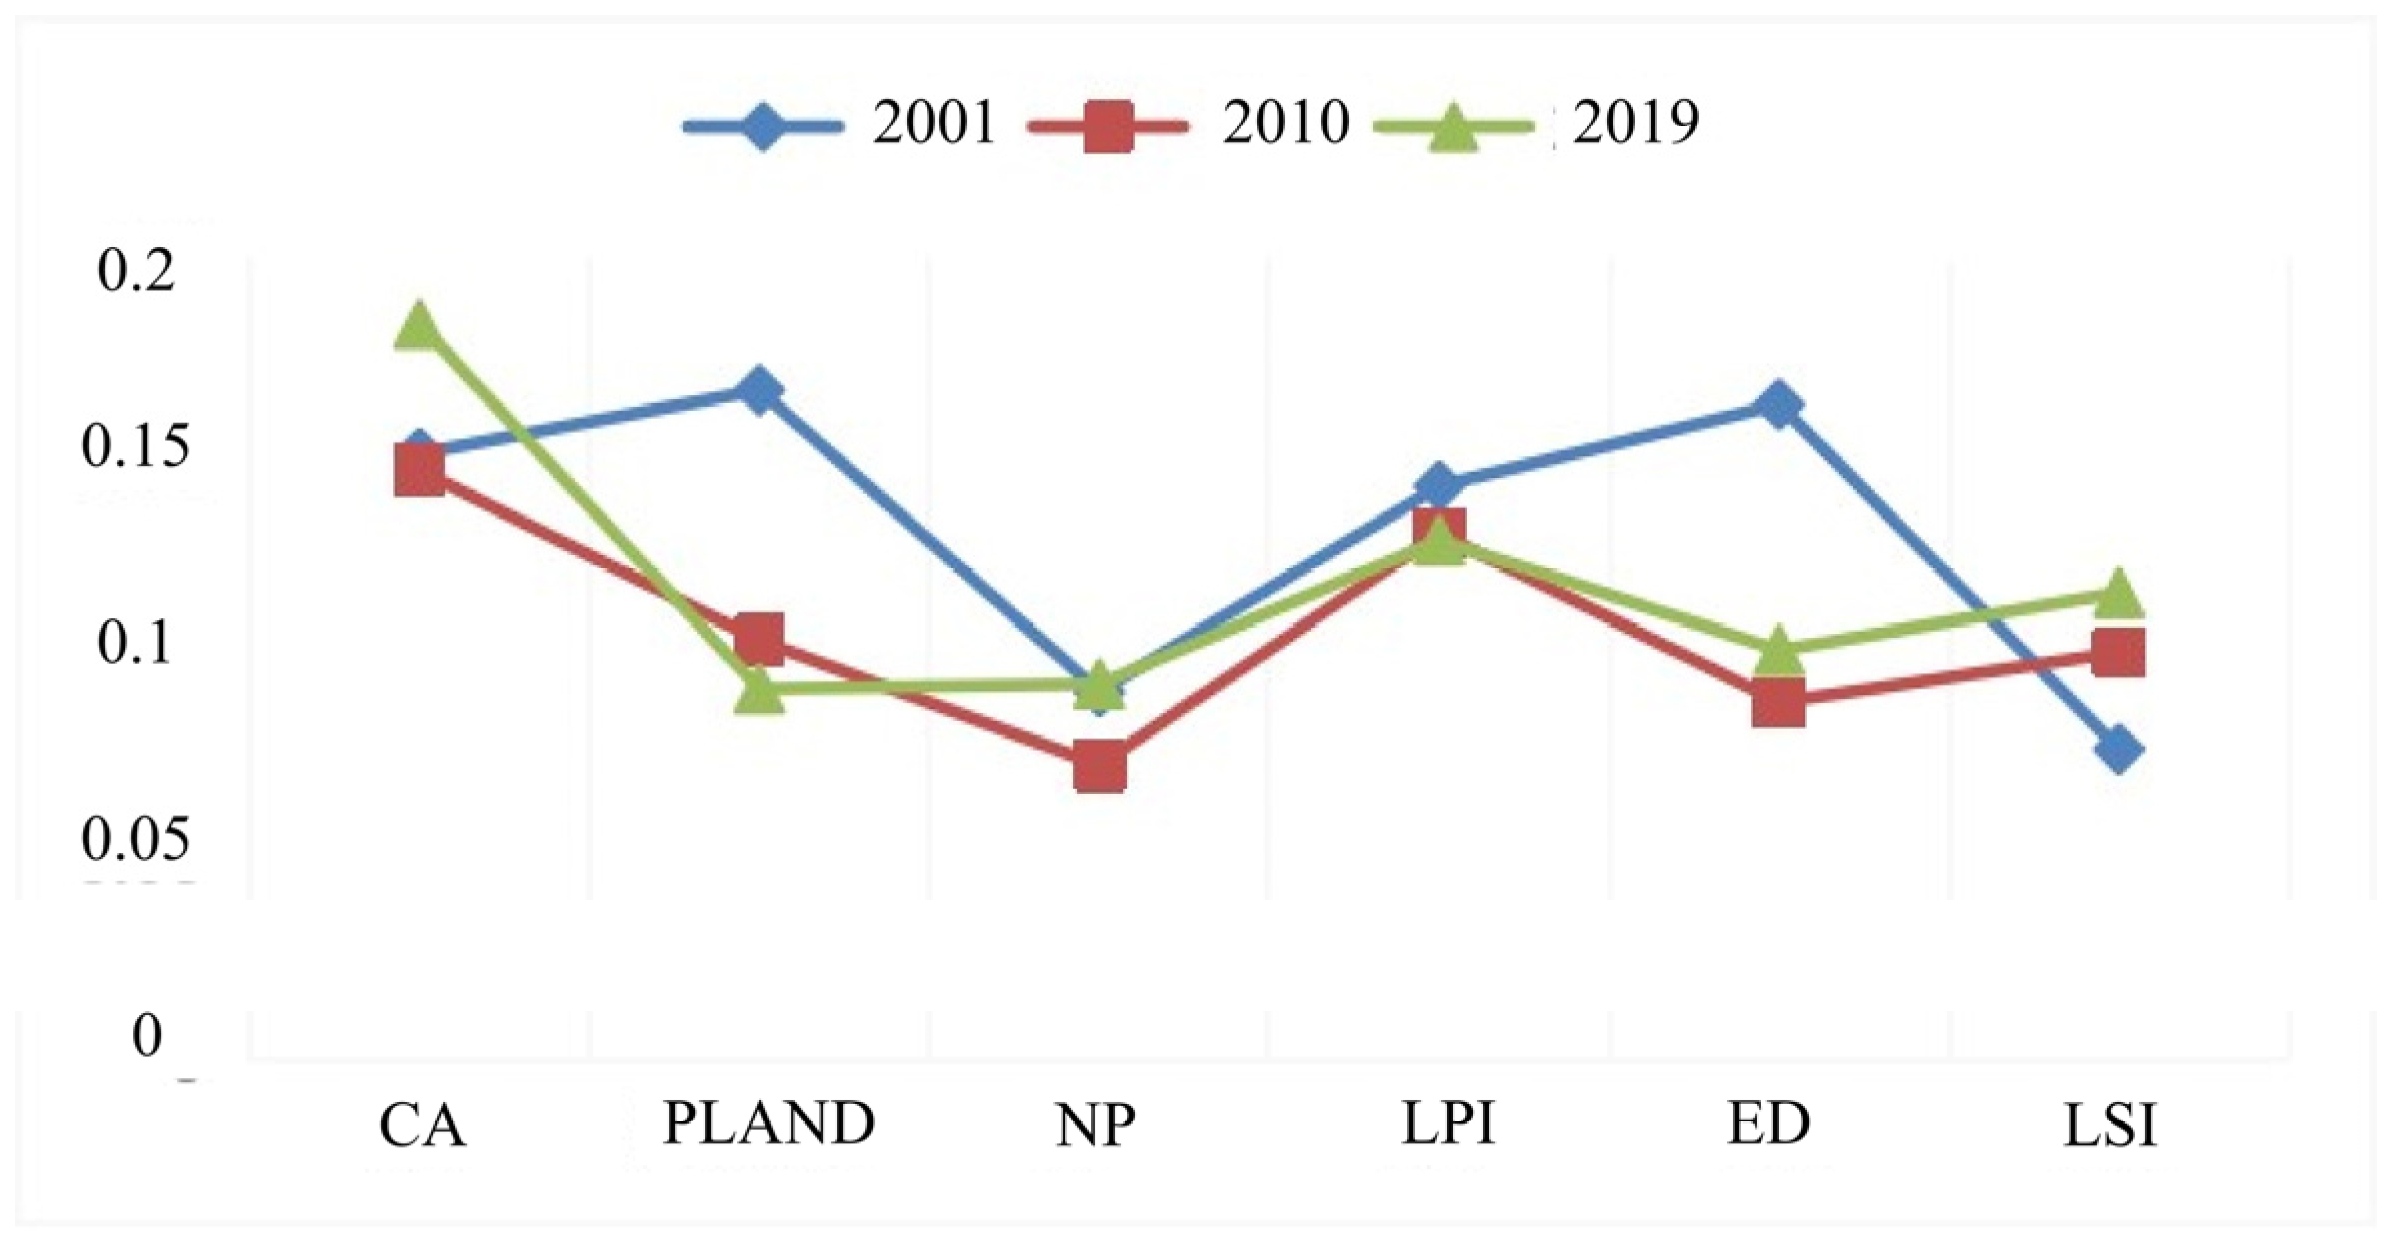
3.2.1. Indicator Selection

Urban spatial development characteristics are the internal differentiation structure and external characteristics of a city in the process of development. These elements eventually present a state of alienation at the spatial level through a variety of combinations. At present, a landscape pattern index is mostly used to represent them [43]. The three aspects of urban scale, fragmentation of urban land, and complexity of urban development form are set, and six landscape indicators are selected to quantify urban spatial development characteristics (Table 2). At the same time, due to the homogeneity and differentiation among indicators of urban spatial development characteristics, a comprehensive analysis of each indicator is carried out by combining the LISA time–space transition method.

3.2.2. Analysis of Spatial and Temporal Evolution of Urban Development Characteristics

As an external feature of urban social and economic development, the urban spatial development characteristics of Anhui Province affect the realization of the regional carbon balance. In-depth exploration of the spatial and temporal evolution characteristics of various indicators of urban development characteristics is of great significance for Anhui Province to improve the level of green and low-carbon development. Therefore, this paper adopts the LISA time path and LISA time leap to carry out the analysis of the spatio-temporal evolution of urban development patterns. The LISA time path uses the migration characteristics of the coordinates of lagged quantities in Moran’s I scatter plot to demonstrate the spatio-temporal dynamic changes in the variables, thus revealing the synergistic changes and spatio-temporal difference characteristics of the variables within the scope of the study on a regional scale geospatially [44]. The LISA time path analysis includes the relative length and the curvature, where the relative length can reflect the characteristics of the urban spatial dynamics of the carbon balance, and the curvature characterizes the characteristics of spatio-temporal fluctuations of the carbon balance, the expression of which is as follows:
d i = N t = 1 T 1 d ( L i , t , L i , t + 1 ) i = 1 N 1 t = i T = 1 d ( L i , t , L i , t + 1 )
ε i = t = 1 T 1 d ( L i , t , L i , t + 1 ) d ( L i , t , L i , t + 1 )
where di is the time path length of the ith research unit; ε i is the time curvature of the ith research unit; N is the number of research units; T is the annual time interval; and d(Li,t,Li,t+1) is the moving distance of research unit i from year t to year t + 1.

3.3. Correlation Analysis between Urban Spatial Development Characteristics and Carbon Balance Degree

In order to explore and analyze the spatio-temporal evolution mechanism and driving factors between the carbon balance degree and urban spatial development characteristics, this paper uses a spatio-temporal geographical weighted regression model to explore the spatio-temporal interaction between urban spatial development characteristics and carbon balance degree on the basis of quantifying two elements and exploring the overall evolution trend of the urban spatial development characteristics. At the same time, the influence degree and operation mechanism of various indicators of the urban spatial development characteristics on the carbon balance are analyzed by using the geographical detector model.
(1)
GTWR Model
Geographically and Temporally Weighted Regression (GTWR) is a local linear regression model that takes into account both spatial and temporal non-stationarities. Compared with the traditional geographical weighted regression (GWR), GTWR introduces the time dimension on the basis of spatial heterogeneity so that the regression parameters of the independent variables change with time and space. The regression parameters of the independent variables change with the change in spatio-temporal location; thus, there are obvious advantages in exploring the spatio-temporal differences of county urban development characteristics on carbon balance, and their expression [45] is as follows:
y i = β 0 ( u i , v i , t i ) + k β k ( u i , v i , t i ) X i k + ε i
where yi denotes the value of the dependent variable for the ith sample point; ( u i , v i ) denotes the latitude and longitude coordinates of the ith sample point; ti denotes the time of observation and represents the time coordinates; β 0 ( u i , v i , t i ) denotes the regression constant for the ith sample point; Xik denotes the kth explanatory variable for the ith sample point; ε i is the residual; β k ( u i , v i , t i ) is the regression parameter for the kth explanatory variable for the ith sample point.
β ^ ( u i , v i , t i ) = [ X T W ( u i , v i , t i ) X ] 1 X T W ( u i , v i , t i ) Y
where β ^ ( u i , v i , t i ) is β k ( u i , v i , t i ) the estimated value; XT is the transpose of the matrix; Y is the matrix constituted in the sample; W ( u i , v i , t i ) is the spatio-temporal distance weight matrix. Due to the different units of measurement for temporal and spatial distances, the following formula is generally constructed using the bi-square spatial weight function to calculate the spatio-temporal distance:
W i j = exp { [ ( u i u j ) 2 + ( v i v j ) 2 ] + τ ( t i t j ) 2 ( h s ) 2 }
(2)
Geodetector model
The geodetector model is a geostatistical method to explore the spatial differentiation characteristics of geographic elements and their driving force. By exploring the explanatory power of the respective variables on the dependent variables through the factor detector, it can effectively analyze the magnitude of the influence of the indicators of the urban spatial development characteristics on the carbon balance and the operation mechanism, and its formula is as follows:
q = 1 g = 1 L N g δ h 2 N δ 2
where Ng and δ g 2 are the number of samples and variance of stratification g, respectively; N and δ 2 are the number of samples and variance of the whole model, respectively.
(3)
K-means clustering
The K-means clustering algorithm is utilized for the classification of regionally similar categories. The evaluation index primarily relies on the distance between classification objects and cluster centers. According to the partitioning rule, a higher degree of similarity is indicated by a shorter distance between two objects and the same cluster center.
① Calculate the sum of squared errors (SSE) for each cluster, which represents their level of aggregation, and determine the optimal value for k based on the elbow rule.
② Input both the optimal k value and corresponding data into SPSS for iterative analysis with 99 iterations set, resulting in obtaining data from categories with maximum cluster center values within each dataset.

4. Results and Analysis

4.1. Analysis of Spatial–Temporal Evolution of Urban Spatial Development Characteristics

The urban development characteristics of counties (districts) in Anhui province tend to be in harmony with their economic development level; that is, the counties with better economic level have larger built-up areas, tend to have multi-core cities, and have higher internal construction complexity. While the urban characteristics of districts and counties with medium and weak economic levels are more complicated, this paper selects the relative length and curvature of the time path of the urban development characteristics to measure (Figure 3). By simulating the specific location of the urban spatial development characteristics of the counties (districts) in Anhui Province from 2001 to 2019 in a Moran scatter plot, the relative length and curvature of the LISA time path of the urban spatial development characteristics of the counties (districts) are calculated, in which the relative length can be used to analyze the spatial structural stability of the urban spatial development of various counties and districts. The greater the relative length value, the stronger the manifestation of dynamic local spatial dependence and local spatial structure in the urban spatial development characteristics will be. The curvature degree can be utilized to analyze the impact and level of dependence of the urban development on surrounding cities, with a higher value indicating a more pronounced directionality in terms of the dynamic local spatial dependence within the urban spatial development characteristics. This facilitates exploration of both internal and external features associated with urban spatial development.

4.1.1. Relative Length of Anhui

The average LISA path relative length of the urban spatial development characteristic index in each county (district) in Anhui province is approximately 0.243, indicating the range of median area in the figure. Moreover, regions with higher values exhibit longer time paths than the average, predominantly situated in the northern and southern regions of Anhui Province. These regions demonstrate a more dynamic local spatial structure with respect to urban spatial development characteristics. Notably, She County and Xiuning County in Huangshan City, Dangshan District in Suzhou City, and Jinzhai County in the Lu’an District all possess medium to high values for their time path lengths of the urban spatial development characteristic indexes, suggesting a development structure that requires improvement due to instability and high dependence while also having potential for growth. Conversely, the central and southeast Anhui regions such as Wuhu City and the Maanshan counties (districts) have shorter time paths compared to the average. Among these cities are Shushan District, Yaohai District, Ma’anshan District, and Wuhu Jinghu District, which exhibit relatively well-developed urban spatial characteristics with complete functional areas.

4.1.2. Curvature of Anhui

The average LISA path curvature of the urban spatial development characteristic index in the Anhui counties (districts) is approximately 1.996, indicating a predominant pattern characterized by “clusters of high-value areas and point-like distribution of low-value areas”. Cities exhibiting significant curvature for each index are concentrated in southern Anhui, central Anhui, and select counties (districts) in northern Anhui Province. These counties and districts demonstrate substantial fluctuations in spatial dependence regarding their urban spatial development characteristics. The observed urban development patterns in the southern and northern regions of Anhui are influenced by the support received from Jiangsu and Zhejiang provinces, resulting in the establishment of numerous new districts to accommodate industrial transfers from these provinces. The low-value area characterized by curvature is primarily distributed sporadically throughout central Anhui and southern Anhui. Overall, most areas within Anhui Province exhibit high curvatures while displaying strong dependence on neighboring regions.
The comprehensive analysis reveals that the spatial development characteristics of cities in Anhui Province exhibit varying degrees of fluctuating growth patterns. The cities with stable spatial structures and high spatial dependence are primarily located in central and southeast Anhui Province. There are two types of cities: firstly, Hefei City, which serves as a key construction city in Anhui Province, and secondly, Wuhu City, Ma’anshan City, and other cities directly supported by Nanjing City and other urban centers. These cities possess ample construction land, particularly for industrial purposes, as the urban industrial sector is experiencing rapid development while urban functional zoning gradually stabilizes. On the other hand, the cities with dynamic spatial structures are predominantly situated in the southern and northern regions of Anhui province. Despite having more ecological land resources and receiving assistance from Yangtze River Delta cities, these locations face challenges such as unfavorable geographical positioning and population outflow that hinder full industry development and contribute to an unstable urban structure.

4.2. Analysis of the Calculation Results of Carbon Budget Balance in Anhui Province

The figure (Figure 4) demonstrates that from 2001 to 2019, the majority of regions maintained a state of carbon balance equilibrium. However, approximately one-third of the counties gradually transitioned into a lopsided state, where the carbon sink progressively declined relative to carbon emissions. Consequently, there was a gradual increase in the number of counties exhibiting a lopsided carbon balance and a weakening of the carbon sink compared to emissions, thereby exacerbating this lopsidedness. Geographically speaking, as we move from north to south, there is a gradual rise in the occurrence of the carbon sink surpassing emissions due to superior natural resource endowment in the southern regions.
In 2001, there were 39 counties (districts) in Anhui province where the carbon sink was lower than the carbon emissions, indicating a negative carbon balance. These counties (districts) were primarily located in the flat regions of northern and central Anhui, such as Panji District in Huainan City, Fengtai County, Shushan District, and Yaohai District in Hefei City. On the other hand, there were 71 counties (districts) with carbon sinks exceeding carbon emissions, predominantly found in the mountainous and hilly areas of southern Anhui, like Jinzhai County of Lu’an City and Huangshan City. Considering that the economy of Anhui Province was still underdeveloped in 2001, the natural advantages present in these mountainous and hilly regions resulted in a relative equilibrium or favorably lopsided situation regarding the carbon balance.
In 2010, the total carbon sink in Anhui Province experienced a decrease of 447.62% compared to 2001, with significant declines observed in the mountainous and hilly areas of southern Anhui province. Overall, there was an upward trend in carbon emissions, particularly evident in urban areas of north and middle Anhui Province. The number of counties (districts) experiencing carbon sinks lower than carbon emissions increased to 52 from 2001; however, this change was relatively small and mainly concentrated in certain regions of Huainan City and Hefei City. Conversely, the number of counties (districts) where the carbon sink exceeded carbon emissions decreased to 58. During the period from 2001 to 2010, Anhui Province witnessed relatively high rates of economic development. Notably, among the regions experiencing substantial increases in carbon emissions were the four districts of Hefei City which benefited from key developmental initiatives within Anhui Province; additionally, cities like Huainan City in northern Anhui Province intensified mineral exploitation activities. Chuzhou City, Maanshan City, and other cities were part of the initial group that entered the Nanjing Metropolitan Area when it was established in 2002; thanks to Nanjing’s assistance, these cities underwent rapid economic growth, accompanied by increased levels of carbon emissions.
In 2019, the overall carbon sink in Anhui Province experienced a significant decline of 42.57% compared to 2010, while the overall carbon emission continued its upward trajectory. The number of counties (districts) with a higher carbon sink than carbon emissions remained relatively consistent with those counties exhibiting lower levels of carbon sequestration than emissions. Notably, the mountainous and hilly regions in southern Anhui witnessed marginal recovery in their capacity for carbon sequestration, accounting for approximately 20.8% of the total amount captured. This positive trend can be attributed to Anhui Province’s strategic focus on ecological civilization cities and pursuit of the “double-carbon” goal, alongside concerted efforts to renovate and safeguard the ecological environment within these specific areas.
The carbon balance of Anhui Province exhibited a spatial distribution pattern with increasing values from north to south and experienced a gradual decline from 2001 to 2019. During the period of 2010–2019, the mountainous and hilly regions in southern Anhui province benefited from ecological protection policies, leading to a modest recovery. Carbon emissions across the entire area displayed an upward trend over time, with Hefei county in central Anhui and Panji District and Fengtai District of Huainan City in northern Anhui consistently exhibiting high levels of carbon emissions along with significant increases.

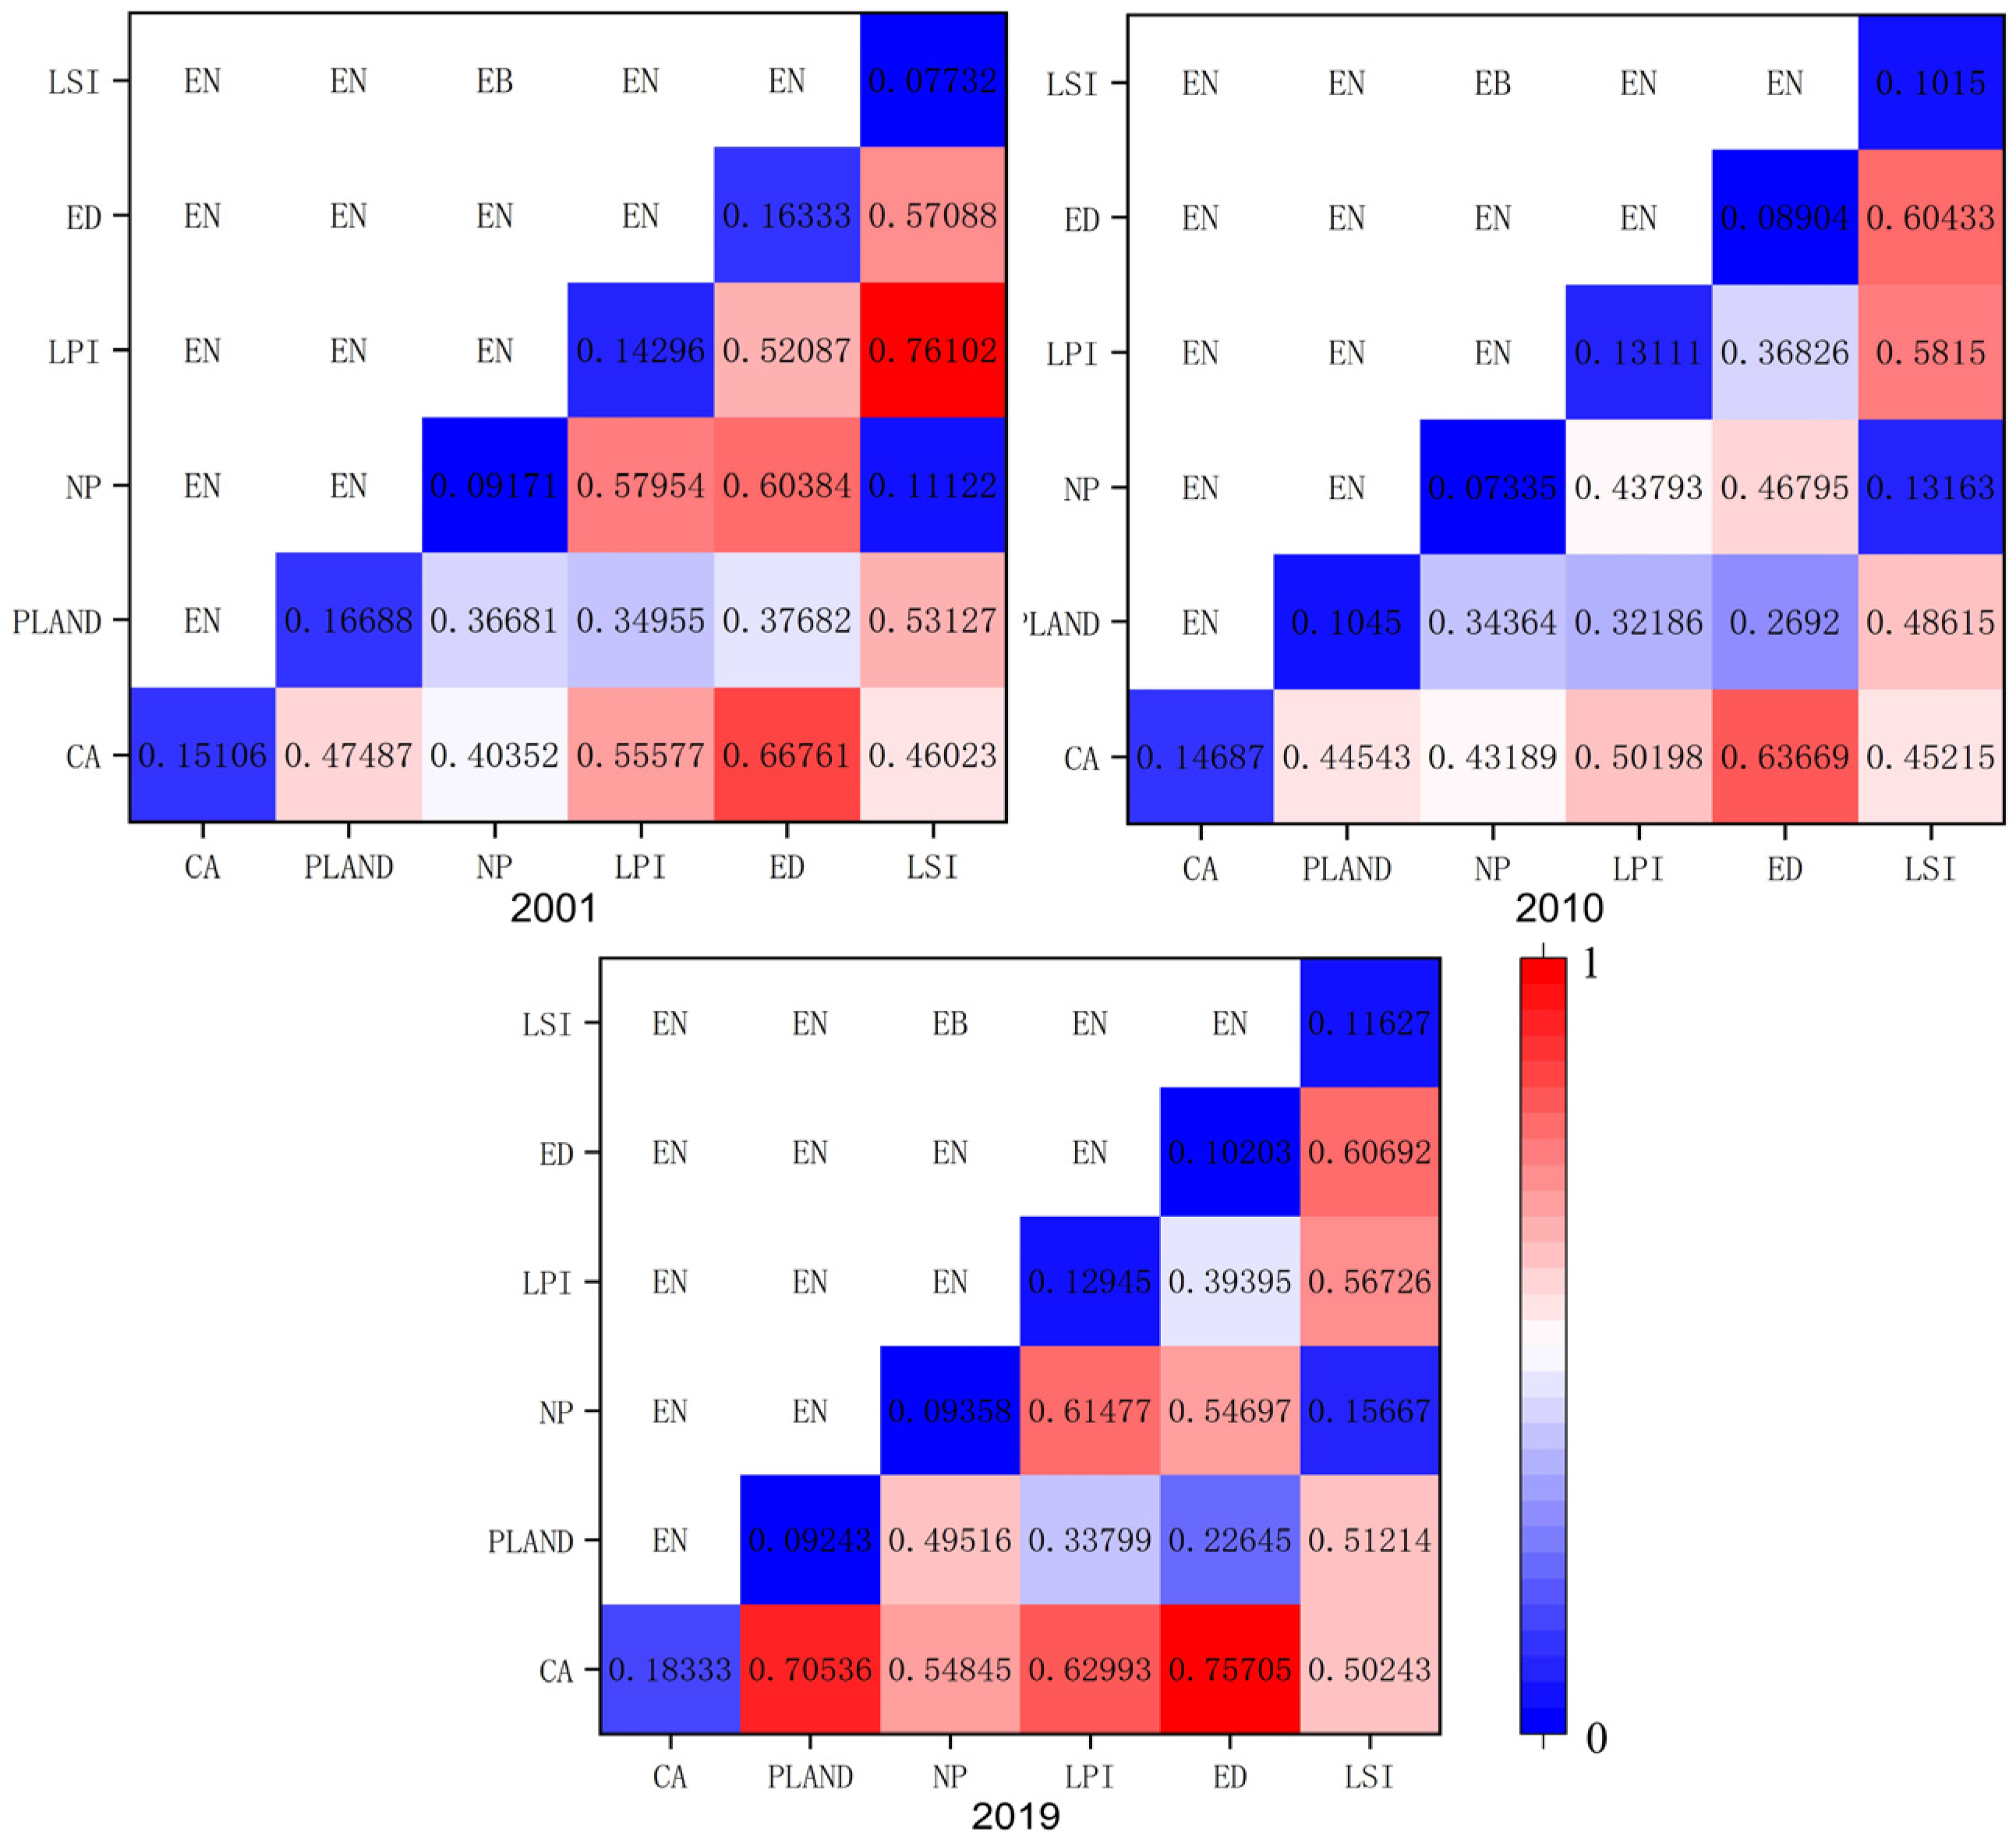
4.3. Spatial and Temporal Correlation Analysis of Urban Spatial Development Characteristics and Carbon Balance Degree in Anhui Province

To further investigate the presentation and mechanism of the spatio-temporal correlation between carbon budget balance degree and urban spatial development characteristics in Anhui Province, this study employs the spatio-temporal and geographical weighted regression method to investigate the correlation mechanism of these two factors from a temporal and spatial perspective. In general, there is a positive correlation between maximum patch index (LPI), landscape shape index (LSI), urban edge (ED), and carbon balance. Conversely, built-up area (CA), proportion of patches in the landscape area (PLAND), and number of urban patches (NP) exhibit a negative correlation with the carbon balance. The magnitude of regression coefficients indicates the level of influence exerted by each factor. The specific analysis is as follows:
Among them, the maximum patch index (LPI), landscape shape index (LSI), and urban edge (ED) exhibit a positive correlation with the carbon balance. This positive correlation is observed in most counties (districts) of Anhui Province, while a few counties (districts) show a negative correlation that partially overlaps (Figure 5).
As depicted in Figure 5A, there is a positive correlation between the maximum patch index (LPI) and the carbon budget balance. This suggests that as urban mononicity develops, the carbon budget balance also demonstrates an upward trend. The influence of the LPI on the carbon budget balance gradually deepened from 2001 to 2019, increasing from west to east. Initially, only Jinzhai County was within the high-value area during 2001–2010. However, from 2010 to 2019, this high-value area continued to expand, with only eastern Tianchang City, Ma’anshan City, and Huangshan City falling into the low-value area. These findings indicate that a single-core city development model is more suitable for most cities in Anhui.
The positive correlation between the landscape shape index (LSI) and the carbon balance is evident in Figure 5B, indicating that an increase in LSI promotes the enhancement in the carbon balance. From 2001 to 2010, Shexian County of Huangshan City exhibited a high regression coefficient value, while most areas within the province displayed low values. Between 2010 and 2019, the influence’s regression coefficient increased across the entire province, reaching high values in the southern and northeastern regions of Anhui Province. Simultaneously, there was a significant decrease in low-value areas with only a few counties (districts) such as Huoqiu County and Funan County exhibiting negative correlations. Overall, both the LSI and its regression coefficient demonstrated an annual increase during the study period. Furthermore, with urban development progressing diversely over time, there was also a tendency for reduction in negative correlation areas, indicating that enhancing urban spatial development characteristics’ diversification could positively impact carbon balance, thus emphasizing the need for diversified internal construction within urban settings.
The positive correlation between edge density (ED) and the carbon budget balance is evident in Figure 5C, suggesting that an increase in ED can promote a corresponding increase in the carbon budget balance. Spatially, the impact of ED decreased from west to east between 2001 and 2019. From 2001 to 2010, Jinzhai County and Funan County exhibited high values, while Tianchang City and Maanshan City had low values, with most of the central region falling within the moderate value range. Between 2010 and 2018, the high-value area expanded towards the east while the low-value area expanded towards the west. Western Anhui’s counties (districts) were predominantly classified as high-value areas, whereas most counties and cities along Anhui’s southeastern border fell into the low-value category. Additionally, Huangshan’s counties and cities also exhibited low-values. Overall, Jinzhai, Huoqiu, and Funan counties, as well as mountainous regions in southern Anhui, are characterized by a relatively underdeveloped economic level and urban construction; however, they still possess significant development potential. Consequently, their influence increased during this study period. On the other hand, counties and cities bordering southern Anhui, as well as Nanjing in Jiangsu Province, are influenced by the Nanjing Metropolitan Area, resulting in relatively advanced urban construction during this study period, but with suspended urban development trends leading to reduced influence.
The built-up area (CA), the number of urban patches (NP), and the proportion of PLAND patches in the landscape area are inversely correlated with the carbon budget balance, while certain cities exhibit a positive correlation trend in their development (Figure 6).
As depicted in Figure 6a, there is a negative correlation between the total built-up area (CA) and the degree of carbon balance, with decreasing influence from south to north. From 2001 to 2010, high regression coefficients were concentrated in southern Anhui Province, whereas low values were primarily distributed in northern Anhui Province. Between 2010 and 2019, the high-value region shifted slightly northward and gradually encompassed the central Anhui area, while a positively inclined middle-high value region emerged in the northern Anhui area. Throughout the 2001–2019 period, the CA regression coefficient exhibited an upward trend within northern Anhui’s low-value region; meanwhile, it remained stable at intermediate levels for central Anhui, and within southern Anhui’s high-value region, it displayed a diffusive pattern. Overall, as economic development progressed in Anhui Province from 2001 to 2019, there was an increase in urban construction land area, which further intensified CA’s negative impact on the carbon balance.
The negative correlation between the proportion of landscape area occupied by patches (PLAND) and the carbon balance degree is clearly evident from Figure 6b, indicating that an increase in PLAND leads to a downward trend in the carbon balance degree. The impact degree is generally higher in western regions and lower in eastern regions. From 2001 to 2010, areas with high regression coefficients were primarily concentrated in Lu’an City, Fuyang City, and Anqing City, while areas with low regression coefficients were mainly found in Tianchang City of Chuzhou City, Ma’anshan City, Guangde County, and Langxi County of Xuancheng City. Between 2010 and 2019, there was a significant diffusion trend towards the east for high-value areas; only Xuancheng, Wuhu, and Chuzhou Cities had low-value areas. Among them, Tianchang City and Dangshan County showed a positive correlation with an upward trend in their influence degrees. Overall, the urban regression coefficient experienced varying degrees of decrease as the proportion of construction land increased during the study years, suggesting that as urban built-up area expands, it has a diminishing impact on the carbon budget balance.
The negative correlation between the number of urban patches (NP) and the carbon balance is clearly evident in Figure 6c, indicating that an increase in NP leads to a downward trend in the carbon balance. From 2001 to 2010, high-value areas were predominantly located in southern Anhui, with Shexian County, Xiuning County, and Tunxi district of Huangshan being most affected by the NP’s impact on the carbon budget. Between 2010 and 2019, there was a significant increase in NP along with an expanding trend observed in its regression coefficient’s high-value area. Most parts of southern and northern Anhui exhibited high regression coefficients, while only certain counties (districts) in central Anhui Province fell within the low-value range. This demonstrates that a more fragmented urban development pattern results in higher transportation costs and carbon emissions. Given Anhui Province’s dependence on economic support from other provinces and cities, coupled with scattered development modes lacking centripetal force at the county and city levels, it becomes apparent that the negative impact of the NP on the carbon balance tends to become increasingly severe as economic development progresses.
To conclude, in regions characterized by disparate levels of development, the decentralization of urban development and the marginalization of urban peripheral areas resulting from the expansion of urban areas and the disproportionate level of economic development will contribute to the detrimental growth patterns in cities. This will diminish the efficiency of various urban functions and impede the achievement of developmental linkages between urban regions. Consequently, cities are unable to mutually promote one another, leading to an incongruity in carbon balance degree. Therefore, adopting a single-center city model alongside diversified internal functional zoning can effectively enhance the utilization rate of urban resources and safeguard the environment for urban development. This model is particularly advantageous for managing smaller populations while promoting significant improvement in a city’s carbon balance degree. Cities with higher levels of development should expand their influence by radiating from their peripheries towards surrounding cities. They should establish a multi-center development model that emphasizes internal diversification construction and fosters communication between industrial growth and ecological environmental protection perspectives. By doing so, mutual promotion and common advancement among urban agglomerations can be achieved.

4.4. Analysis of the Impact of Urban Spatial Development Characteristics on Carbon Balance

In order to investigate the contribution rate and relative importance of the six indicators in urban spatial development characteristics to the carbon balance, this study employs geographical detectors for single-factor detection and multi-factor interaction detection to quantify the contribution rate of urban spatial development characteristics, which considers that individual factors and their interactions may have varying impacts on the carbon balance. This research aims to identify key driving factors responsible for spatial heterogeneity in the carbon balance.
The results of single-factor detection indicate that (Figure 7) the sequence of individual factors in 2001 was PLAND > ED > CA > LPI > NP > LSI; in 2010, it was CA > LPI > PLAND > LSI > ED > NP > PLAND; and in 2019, it was CA > LPI > LSI > ED > NP > PLAND. A comprehensive analysis reveals that CA, representing the total area of urban built-up areas, has a relatively significant impact on the carbon balance, followed by the LPI. The impacts of PLAND and ED have undergone substantial changes from 2001 to 2019, exhibiting a declining trend with less noticeable effects in later periods. The NP and LSI do not exert significant influences. Overall, the degree of impact of individual factors on the carbon balance is relatively low.
Through interactive exploration of the influencing factors, it can be observed that the interaction between any two factor yields exhibit greater impact than the explanatory power of a single factor (Figure 8). Furthermore, most factors exhibit nonlinear enhancement in their interaction influence types (EN), with only LSI∩NP demonstrating two-factor enhancement. This suggests that the explanatory power of interactions among most indicators is greater than their independent effects.
The intersection of LSI∩LPI, ED∩CA, LSI∩ED, as well as LPI∩CA, consistently fall within the area of high influence in the figure. However, the intersection of ED∩NP, as well as LPI∩CA, only exhibits high values in 2001, while PLAND∩CA only shows a high value in 2019. The intersection of LPI∩NP initially decreases but then rises from 2001 to 2019. The remaining factors demonstrate minimal changes in explanatory power.
The combination of CA with ED and LPI exhibits robust explanatory power in interactive detection, suggesting that the synergy between urban area and urban form expansion amplifies their impact on the carbon budget. Moreover, the influence of urban size on the carbon budget is particularly significant in single-core cities. Overall, these findings underscore the substantial role played by CA across all scenarios.
When the NP itself is a single factor, its explanatory power is not statistically significant. However, showing a high value for a single year emerges in the interaction test. NP∩ED indicates that the interaction between urban dispersion degree with urban construction form and expansion has a more pronounced impact on the carbon balance. NP∩LPI suggests that the establishment of radiation-assisted functional areas centered on single-core cities exerts a more substantial influence on the carbon balance. Overall, the influence of the NP is relatively weak and tends to diminish with urban development.
The explanatory power of the LSI as a single factor is relatively weak, but its interaction influence is significantly enhanced. The intersection between the LSI and LPI indicates that a diversified internal construction of single-core cities can effectively promote urban carbon emissions reduction and improve the regional carbon balance. Similarly, the intersection between the LSI and ED suggests that considering urban form construction and expansion from the perspective of diversification has a positive impact on the carbon balance to some extent. These results demonstrate that the LSI exhibits strong explanatory power under combined action.
PLAND’s interpretation is generally low, exerting only limited influence when combined with the LSI, and its single-factor influence also diminishes with urban development.
The LPI not only possesses a robust explanatory power on its own but also exhibits a strong combined explanatory power with CA, the NP, and the LSI. This suggests that urban core issues have a significant impact on the carbon balance, ranking second only to the influence of urban area.
The explanatory power of ED itself demonstrated a declining trend throughout the study period, while its interactive explanatory power exhibited substantial value solely under the joint influence of the LPI and CA, two influential factors. These findings indicate that ED alone does not exert a significant impact on the carbon balance.
Based on the findings, each factor exerts distinct individual and combined effects on the degree of carbon balance, with higher explanatory power observed in the combined perspective. Notably, both urban construction scale and core development status significantly impact the degree of carbon balance as individual or combined factors. This is attributed to incomplete functions of unbalanced urban development, calling for improved auxiliary functional areas centered around single-core cities to promote parallel development of diversified urban construction and low-carbon cities.

4.5. Zoning Control and Optimization Strategies of Urban Spatial Development Characteristics and Carbon Balance

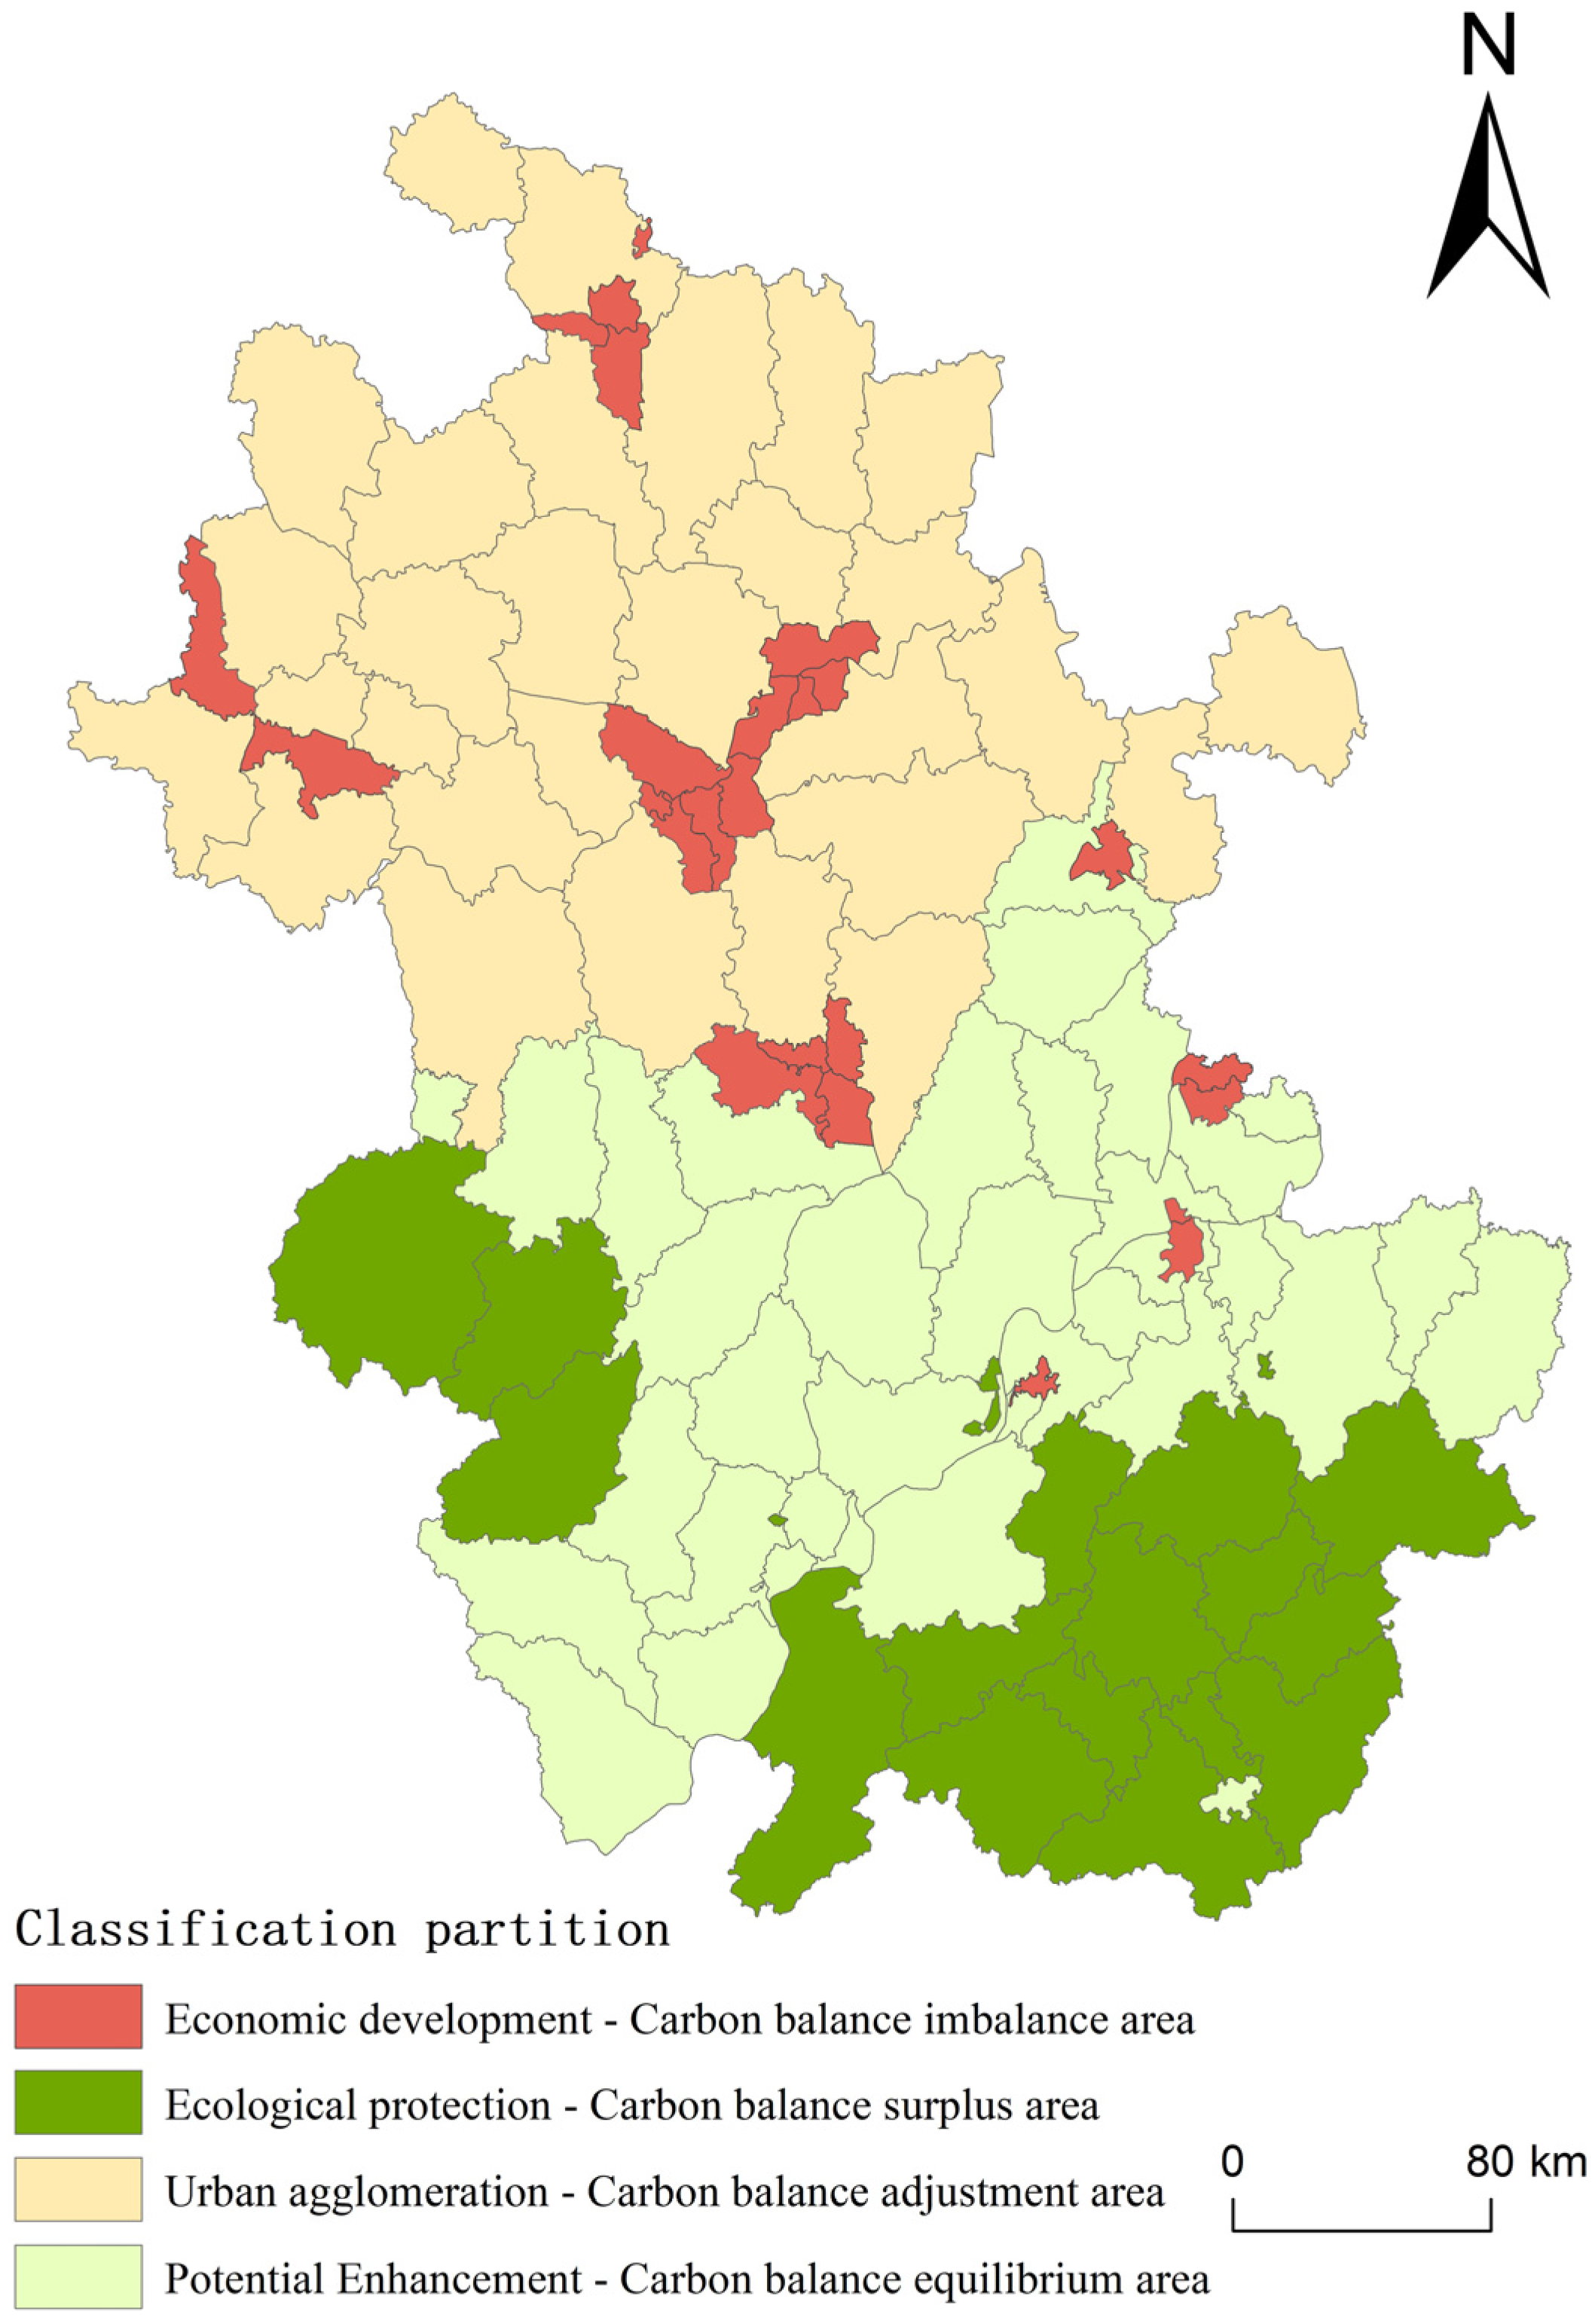
4.5.1. Optimizing Partitions

In order to investigate the zoning governance characteristics of the regional carbon balance under the influence of urban spatial development characteristics, this study considers carbon balance as the primary variable and urban spatial development characteristics as the covariate. K-means clustering in SPSS is employed for regionalization, and the optimal number of partitions is determined to be four based on the “elbow rule”, as depicted in Figure 9.
Anhui Province is divided into four regions, namely the regions of economic development–carbon balance lopsided area, ecological protection–carbon balance surplus area, urban agglomeration–carbon balance adjustment area, and potential enhancement–carbon balance equilibrium area.
The areas of economic development–carbon balance lopsided area are mainly concentrated in the economically developed counties and districts in Anhui Province, including Shushan District and Luyang District of Hefei City, Panji District and Datong District of Huainan City, Huaishang District of Bengbu City, Yingzhou District of Fuyang City, Jinghu District of Wuhu City, and Huashan District of Maanshan City, and 25 other counties (districts). These areas are primarily located in the northern and central parts of Anhui Province rather than the southern or western regions. This zone is characterized by a significant lopsided area in carbon balance with a relatively high proportion of urban areas concentrated within it. The overall functional structure within this region is relatively well developed; however, further strengthening of internal functional zoning construction is necessary.
The ecological protection–carbon balance surplus area for ecological protection are primarily concentrated in 18 counties in southern and northern Anhui, including Jinzhai County, Huoshan County, and Yuexi County of Anqing, situated within the Dabie Mountain area, as well as Huangshan City, Xuancheng City, and Chizhou City, located within the regional scope of Huangshan Mountain. These regions exhibit a surplus in carbon balance with significantly higher carbon sinks than carbon sources; however, they face challenges due to their relatively low overall development level and backward economic status. While urban distribution is concentrated in these areas, there is a lack of internal and external structural and functional construction. Despite having development potential, geographical conditions characterized by mountains and hills, along with the need for ecological environment protection, pose difficulties for realizing this potential.
The urban agglomerations and carbon balance adjustment zones are primarily situated in northern Anhui and certain counties in central Anhui, encompassing county-level administrative units within Huainan City, Chuzhou City, Bengbu City, Fuyang City, etc. In terms of economic development level, they exhibit a lag behind the downtown area; however, their land area is generally extensive. The distinguishing characteristics of this region lie in its relatively coordinated carbon balance with a certain surplus to support urban spatial development to some extent. Moreover, the region boasts a large expanse of urban construction land; nevertheless, its proportion relative to the overall area remains low and exhibits an extremely dispersed distribution pattern. The inner and outer structure as well as function of the city have been partially established. Most of these areas are located in the Huang-Huai-hai Plain which benefits from favorable geographical conditions and abundant cultivated land resources. Consequently, farmland predominates in most regions, leading to numerous scattered township units.
The area of carbon balance equilibrium is mainly distributed in central and southern Anhui Province, including Wuhu City, Ma’anshan City, Tongling City, Anqing County, Feixi County of Hefei, Jin’an District, Yuan District of Lu’an, and Quanjiao County of Chuzhou within the Yangtze River basin. This region exhibits an equilibrium carbon balance with little surplus and a moderate urbanization proportion but relatively concentrated urban distribution. While the internal structure and function are relatively perfect, there is room for improvement in terms of external structure and function. Urban development in this region is driven by factors such as radiation effect from provincial capital Hefei City, assistance from other cities like Nanjing in Jiangsu province, and economic drive from the Yangtze River basin. Therefore, there exists the potential for economic development; however, maintaining the ecological environment is crucial due to the delicate equilibrium of the carbon balance.

4.5.2. Policy Recommendations

The economic development–carbon balance lopsided area serves as the primary economic development area in Anhui Province, characterized by relatively well-developed urban infrastructure but a low ecological environment quality and challenges in transforming construction land from a land use perspective. Given these circumstances, large-scale ecological construction becomes challenging. Therefore, the construction of this region can be approached through the following measures: (1) reasonably demarcating the urban boundary red line to prevent uncontrolled city expansion, optimizing the structure and layout of urban ecological spaces, and harmonizing production, living, and ecological areas, and (2) the economy should adjust its industrial structure by relocating high carbon-emitting industries to other counties or districts while actively promoting information industry development and scaling up high-tech industries, as well as the green and low-carbon sectors.
The ecological protection–carbon balance surplus area is the primary ecological land area in Anhui Province, characterized by abundant forest and grassland resources, high carbon sequestration capacity, and the provision of essential ecological functions such as soil conservation, water conservation, and biodiversity preservation. However, due to geographical constraints and underdeveloped ecological resources, this region experiences a low level of economic development. Therefore, the construction of this area can be approached from the following perspectives: (1) Scientific identification of crucial ecological sources within the region, establishment of strict ecological protection boundaries, and creation of a robust and stable ecological security framework to ensure sustainable optimization of environmental quality in the core zone; (2) the rational development of the eco-tourism industry while limiting exploitation outside the core ecological source area, enhancement of living conditions for mountain residents, active promotion of homestead system reforms in rural mountainous areas, and overall improvement in regional economic development capacity through rural-focused initiatives.
The urban agglomeration–carbon balance adjustment area is the primary grain growing area in Anhui Province. Most of its cities are dispersed across towns and townships, and the slow improvement in the regional economic development level can be mainly attributed to the primary industry. Therefore, the construction of this zone can be carried out from the following perspectives: (1) Enhancing farmland infrastructure construction and utilizing land engineering technology to improve the quality of regional cultivated land while maintaining a dynamic balance in cultivated land quantity and (2) consolidating scattered urban and rural areas to facilitate large-scale mechanized grain planting. Simultaneously, in order to offset potential increases in carbon emissions resulting from mechanization, it is essential to promote ecological agriculture, actively conduct soil testing formula experiments, and adjust fertilizer and pesticide application structures.
The potential enhancement–carbon balance equilibrium area is influenced by multiple factors. Overall, the cities in this region exhibit a robust early stage of development and capacity, with some cities recently receiving assistance from other provinces, indicating a positive developmental trend. However, rapid urbanization has resulted in the degradation of the regional ecological environment quality, particularly due to inadequate protection measures for the Yangtze River basin leading to a significant decline in biodiversity. Therefore, approaching the construction of this area can be addressed from the following perspectives: (1) strengthening protective measures for the Yangtze River basin by reducing or centralizing construction activities around it while promoting sustainable economic development within the basin and regulating fishing practices and operation time for local residents and (2) actively seeking industrial support and assistance from other provinces while implementing a “one-for-one” policy to simultaneously enhance ecological land construction alongside industrial development.

5. Discussion and Conclusions

5.1. Discussion

5.1.1. Carbon Balance Accounting and Spatiotemporal Differentiation Characteristics

Carbon balance is the result of the comprehensive action of carbon emissions and carbon sinks. This paper measures the regional carbon balance by constructing the research framework of NEP and ODIAC carbon emissions (energy consumption carbon emissions) [46]. Carbon emissions accounting based on fossil fuel consumption is the mainstream research in the current academic field, and the ODIAC dataset effectively measures the global carbon dioxide emissions [47]. Although NEP assessment of carbon sinks has been verified in existing studies [48,49], the overall study is in the initial stage, and different selections of climate and soil data will lead to significant differences in results [50]. In this study, the soil respiration measurement results of Zhang [41] and Chen [51] are adopted. The average estimate of carbon sinks obtained is similar to Zhang’s [41] 0.134Pg C a-1, which is significantly different from Li [52] and Zhang [53], which further indicates that the value of the carbon sink is significantly correlated with the geographical region.
The carbon balance presents a spatial distribution pattern of ecological land balance and production land imbalance, which is consistent with Lou’s [54] research, and the overall decrease in time and partial increase, which is reflected in Han’s study [55]. In this study, the carbon balance of most regions in Anhui Province is in a relatively balanced state, which is related to the topography and landform of Anhui Province and the large amount of cultivated, forest, and grass land [56]. Meanwhile, the topography and landform of Anhui Province show a trend of being high in the south and low in the north, from the Huang-Huai-hai Plain in the north to the Dabie Mountains and Huangshan Mountains in the south [57], making the carbon sink gradually higher than the carbon emissions from north to south. In the early period, a small-scale peasant economy flourished in the north of Anhui, and the development of mountainous and hilly areas in the south was difficult [58]. Carbon sinks played a dominant role in the carbon balance, and areas with high carbon emissions were basically concentrated in the central part of Anhui Province. From 2001 to 2010, the Wanjiang development strategy became the top priority in the development of Anhui Province [59], thus boosting the overall economic development level of Anhui Province. The disequilibrium of the carbon balance in Anhui province had a high increase, which is similar to the national trend studied by Xie [60]. In order to truly integrate into the Yangtze River Economic Belt, Anhui Province needs to balance industrial development and ecological protection and promote the development of new economic industries, which is the general solution to the problems faced by all regions with unbalanced development [61]. Therefore, from 2010 to 2019, in terms of internal development planning and external provincial assistance, although the overall carbon emissions of Anhui province are on the rise, its unbalanced areas are more concentrated. And the carbon balance equilibrium area rebounded to a certain extent compared with the previous period. Studies have shown that this is also related to land use patterns and energy use levels [62].

5.1.2. Correlation Analysis between Urban Spatial Development Characteristics and Carbon Balance in Unbalanced Regions

An unbalanced region generally refers to the great difference in the level of economic development among different localities in the same political unit, which is sometimes reflected not only in the economy but also in the social livelihood [63]. The urban spatial characteristics are reflected in different functional zones, and the ecological environment presents different environmental characteristics and carbon emissions according to different geographical location characteristics [64].
In this study, Anhui Province is geographically divided into north and south by the Huaihe River, and there are great differences between southern and northern Anhui in terms of development conditions, customs, and other aspects [65], so there is an unbalanced development trend among various cities. Under the guidance of the food security strategy and the construction of ecological civilization, the difference between the urban structure of northern and southern Anhui Province has been further increased, and the urban functional structure of the agricultural plain in the central and northern parts of Anhui Province is more complete, while the southern part is more dispersed [66]. According to the research results, the carbon balance coordination area of Anhui Province was mostly distributed in southern Anhui Province, and the carbon balance decreased the least during the study period [67]. Accordingly, the spatial structure of the two cities is relatively discrete, and the level of economic development is low. Southern Anhui Province is an important area for ecological protection [68], and its GDP basically depends on the contribution of the tourism industry [69]. Jinzhai County and other places in the Dabie Mountain area are in the ranks of the national-level poor counties. Due to their geographical proximity to Nanjing and direct assistance from Nanjing, Wuhu, and Maanshan are second only to the provincial capital Hefei in terms of carbon emissions [70], and their carbon balance is in the high-negative-value area. Northern Anhui is also supported by the industrial transfer of Xuzhou, Suzhou, and other cities. However, due to the distance and transportation problems, the negative carbon balance and high-value areas are only distributed in Panji District, Huainan City, Huainan City, Huaishang District, Fuyang City, Yingquan District, and other counties (districts). These regions are basically the main force to undertake the secondary production transfer from Jiangsu, Zhejiang, and Shanghai. This is also determined by the development model of various cities in the Yangtze River Delta [71], while most other areas in northern Anhui, as major grain producing areas, are constrained by basic farmland protection areas, and the development of primary production leads to a certain degree of recovery of the carbon balance, which is similar to the study of Li Tan et al. [72]. Hefei City in central Anhui Province is the key construction area of the Anhui provincial government, and its carbon emission ranks first in the province.

5.1.3. Impact Mechanism of Urban Spatial Development Characteristics on Carbon Balance

The characteristics of urban spatial development have an impact on carbon emissions by changing the layout of urban functional areas and land use structures [73]. According to the study in this paper, urban size, urban area ratio, and urban distribution dispersion have a negative impact on carbon balance, while urban development pattern has a positive impact on carbon balance, which is consistent with the study of Shi [74]. In this study, the maximum number of urban patches and the intra-urban complexity have a positive impact on the carbon balance, which is inconsistent with the research results of Tenfei et al., that urban multi-core development and urban single-core development are more conducive to the carbon balance [75]. This is because the characteristics of urban spatial development have different impacts on the carbon balance of different regions.
Since a ‘city’ is a complex system, its development status is affected by population, economy, land, society, and other perspectives [76]. Therefore, while discussing the characteristics of urban spatial development, it is necessary to understand the background conditions of this region. As mentioned above, Anhui Province is a region with a medium level of unbalanced development. In particular, cities such as Jinzhai County and Funan County and their low economic level cannot support the development mode of multi-nuclear cities, and the population and transportation conditions cannot provide the necessary foundation for the construction of multi-nuclear cities [77]. Hefei, Wuhu and other cities have the conditions to develop multi-core cities with the support of the province or outside of the province, but due to the imperfect rail transit construction within the city, the construction of multi-core cities will increase the transportation cost and thus lead to the increase in carbon emissions [78]. Under this scenario, the construction of single-core cities has become the necessary policy for the development of all cities and counties (districts) in Anhui Province at the present stage. The LSI∩LPI mentioned above, that is, the combination of urban internal complexity and maximum urban patch number, has a strong influence on the carbon budget of Anhui Province. Therefore, the development of single-core cities will be promoted in parallel with the construction of diversification within cities, and economically developed regions and less developed regions will simultaneously promote economic construction and ecological construction [79]. Grain production regions also need to seek development on the basis of balancing the relationship between economy, food and ecology, which requires the promotion of diversified urban construction.

5.2. Conclusions

From a county perspective, this study examines the temporal and spatial correlation between urban spatial development characteristics and the carbon balance in Anhui Province from 2001 to 2019. It explores the impact of various indicators of urban spatial development characteristics on the carbon balance and summarizes the mechanism through which urban development affects the carbon balance. The findings are as follows:
(1) The carbon balance of Anhui Province from 2001 to 2019 shows a general decline and a small-scale recovery. Regionally, counties (districts) dominated by nature and food security policies still have a better trend in carbon balance, while areas with rapid economic development and industrial transfer from Jiangsu, Zhejiang, and Shanghai have a significant decline in carbon balance. It shows that regional natural geography and government policies have a significant impact on carbon balance.
(2) The urban spatial development in Anhui Province can be classified into two main types: Firstly, cities with a stable spatial structure and high spatial dependence are primarily located in central and southeast Anhui Province. These areas exhibit better economic development and higher indicators of urban spatial development. Secondly, there are cities with a dynamic spatial structure mainly situated in the southern and western mountainous regions, as well as the northern part of Anhui Province. These areas have a greater presence of natural landscapes and land types dominated by food security concerns, resulting in relatively favorable carbon balance.
(3) Research on the mechanisms affecting the carbon balance suggest that most cities in Anhui Province are suitable for adopting a single-core city approach to promote diversification of urban construction. However, fragmented urban development resulting from mere expansion of urban areas, coupled with an imbalanced economic development level and challenges in extending influence to peripheral regions, may lead to unsustainable urban growth. Therefore, it is crucial for urban development strategies to align with local disparities and adopt diverse approaches aimed at fostering low-carbon and efficient urbanization.
(4) The explanatory power of various factors and interactive factors of urban development characteristics on the carbon balance varies, with LPI demonstrating a stronger influence. Therefore, it is imperative to enhance the construction of radiation auxiliary functional areas centered around single-core cities and promote their parallel development alongside intra-city diversification. This will effectively facilitate the establishment of low-carbon cities.
(5) The study uses K-means to divide the carbon balance of Anhui province under the influence of urban spatial development characteristics into four regions, which are the economic development–carbon balance lopsided area, ecological protection–carbon balance surplus area, urban agglomeration–carbon balance adjustment area, and potential enhancement–carbon balance equilibrium area. And the optimization policy suggestions for each type of zoning are put forward.

Author Contributions

All authors contributed to the study conception and design. The framework of the paper was performed by Y.W. Material preparation, data collection, and analysis were performed by H.K. and A.D. The first draft of the manuscript was written by Y.W. and H.K., and all authors commented on previous versions of the manuscript. All authors have read and agreed to the published version of the manuscript.

Funding

This work is supported by the National Natural Science Foundation of China (No.71403095, No.71873054).

Institutional Review Board Statement

This article does not contain any studies with human participants performed by any of the authors.

Data Availability Statement

Dataset available on request from the authors.

Conflicts of Interest

The authors declare no conflicts of interest.

References

  1. Lewis, S.L.; Maslin, M.A. Defining the Anthropocene. Nature 2015, 519, 171–180. [Google Scholar] [CrossRef] [PubMed]
  2. Jin, Y.; Ding, J.; Chen, Y.; Zhang, C.Z.; Hou, X.H.; Zhang, Q.Q.; Liu, Q.K. Urban Land Expansion Simulation Considering the Increasing versus Decreasing Balance Policy: A Case Study in Fenghua, China. Land 2023, 12, 2099. [Google Scholar] [CrossRef]
  3. Zhang, X.P.; Li, P. Research progress of the impact of built environment on carbon emissions of urban construction land. Sci. Technol. Rev. 2021, 39, 65–74. [Google Scholar]
  4. Li, H.B.; Jin, X.B.; Han, B.; Xu, W.Y.; Zhou, Y.K. Theoretical research and practical strategy of comprehensive land consolidation under the goal of carbon emission peak and carbon neutrality. Geogr. Res. 2022, 41, 3164–3182. [Google Scholar]
  5. Tang, X.; Liu, S.; Wang, Y.; Wan, Y.W. Study on carbon emission reduction countermeasures based on carbon emission influencing factors and trends. Environ. Sci. Pollut. Res. Int. 2024, 31, 14003–14022. [Google Scholar] [CrossRef]
  6. Yang, P.J.; Peng, S.; Benani, N.; Dong, L.Y.; Li, X.M.; Liu, R.P.; Mao, G.Z. An integrated evaluation on China’s provincial carbon peak and carbon neutrality. J. Clean. Prod. 2022, 377, 134497. [Google Scholar] [CrossRef]
  7. Huang, H.Z.; Jia, J.S.; Chen, D.L.; Liu, S.T. Evolution of spatial network structure for land-use carbon emissions and carbon balance zoning in Jiangxi Province: A social network analysis perspective. Ecol. Indic. 2024, 158, 111508. [Google Scholar] [CrossRef]
  8. Ronald, G.P.; Yang, X.K.; Wang, S.B. Interacting atmospheres: Global atmospheric biosphere chemistry. AMBIO-J. Hum. Environ. 1994, 23, 50–61. [Google Scholar]
  9. Friedlingstein, P.; Jones, M.W.; O’Sullivan, M.; Andrew, R.M.; Bakker, D.C.E. Global carbon budget 2021. Earth Syst. Sci. Data 2022, 14, 1917–2005. [Google Scholar] [CrossRef]
  10. Rogelj, J.; Schaeffer, M.; Meinshausen, M.; Knutti, R.; Alcamo, J.; Keywan, R.; William, H. Zero emission targets as long-term global goals for climate protection. Environ. Res. Lett. 2015, 10, 105007. [Google Scholar] [CrossRef]
  11. Lin, B.Q.; Benjamin, N.I. Influencing factors on carbon emissions in China transport industry. A new evidence from quantile regression analysis. J. Clean. Prod. 2017, 150, 175–187. [Google Scholar] [CrossRef]
  12. Allen, M.R.; Frame, D.J.; Huntingford, C.; Jones, C.D.; Lowe, J.A.; Meinshausen, M.; Meinshausen, N. Warming caused by cumulative carbon emissions towards the trillionth tonne. Nature 2009, 458, 1163–1166. [Google Scholar] [CrossRef]
  13. Christian, H.; Gibran, V. Carbon footprint analysis of household consumption in greater Guadalajara reveal stark socio-spatial inequalities. Ecol. Econ. 2022, 199, 107495. [Google Scholar]
  14. Moon, S.; Chamberlain, C.P.; Hilley, G.E. New estimates of silicate weathering rates and their uncertainties in global rivers. Geochim. Cosmochim. Acta 2014, 134, 257–274. [Google Scholar] [CrossRef]
  15. David, P.T.; William, D.R.; Yang, Z.Q.; Robert, E.K.; Warren, B.C.; Maureen, V.D.; Peter, E.T.; Beverly, E.L. Decadal trends in net ecosystem production and net ecosystem carbon balance for a regional socioecological system. For. Ecol. Manag. 2011, 262, 1318–1325. [Google Scholar]
  16. Roberto, P.; Ramdane, A.; Alessandro, C.; Kurz, W.A.; Grassi, G. The European forest carbon budget under future climate conditions and current management practices. Biogeosciences 2022, 19, 3263–3284. [Google Scholar]
  17. Qi, Y.C.; Dong, Y.S.; Geng, Y.B.; Yang, X.H.; Gen, H.L. The progress in the carbon cycle researches in grassland ecosystem in China. Prog. Geogr. 2003, 22, 342–352. [Google Scholar]
  18. Nie, D.P.; Xu, D.Y.; Wang, B. Research on the relationship between global carbon cycle and forests: Problems and progress. World For. Res. 1997, 5, 34–41. [Google Scholar]
  19. Thomas, W.; Nancy, L.; Guy, R. A practical approach for assessing the sensitivity of the Carbon Budget Model of the Canadian Forest Sector (CBM-CFS3). Ecol. Model. 2008, 219, 373–382. [Google Scholar]
  20. Wan DJ Liu, J.P.; Zhao, D.D. Assessment of Carbon Storage under Different SSP-RCP Scenarios in Terrestrial Ecosystems of Jilin Province, China. Int. J. Environ. Res. Public Health 2023, 20, 3691. [Google Scholar] [CrossRef]
  21. Rong, T.Q.; Zhang, P.Y.; Li, G.H.; Wang, Q.X.; Zheng, H.T.; Chang, Y.H.; Zhang, Y. Spatial correlation evolution and prediction scenario of land use carbon emissions in the Yellow River Basin. Ecol. Indic. 2023, 154, 110701. [Google Scholar] [CrossRef]
  22. Sun, X.Y.; Lian, W.W.; Gao, T.M.; Chen, Z.Z.; Duan, H.M. Spatial-temporal characteristics of carbon emission intensity in electricity generation and spatial spillover effects of driving factors across China’s provinces. J. Clean. Prod. 2023, 405, 136908. [Google Scholar] [CrossRef]
  23. Fang, J.Y.; Ke, J.H.; Tang, Z.Y.; Chen, A.P. Implications and estimations of four terrestrial froductivity parameters. Chin. J. Plant Ecol. 2001, 25, 414–419. [Google Scholar]
  24. Cai, B.F.; Cui, C.; Zhang, D.; Cao, L.B.; Wu, P.C.; Pang, L.Y.; Zhang, J.H.; Da, C.Y. China City-level greenhouse gas emissions inventory in 2015 and uncertainty analysis. Appl. Energy 2019, 253, 113579. [Google Scholar] [CrossRef]
  25. IPCC Climate Change. The Physical Science Basis: Working Group I Contribution to the Sixth Assessment Report of the Intergovernmental Panel on Climate Change; Cambridge University Press: Cambridge, UK, 2021. [Google Scholar]
  26. Li, L.; Xia, Q.Y.; Dong, J.; Zhang, B. County-level carbon ecological compensation of Wuhan Urban agglomeration under carbon neutrality target: Based on the difference in land use carbon budget. Acta Ecol. Sin. 2023, 43, 2627–2639. [Google Scholar]
  27. Ma, L.; Xiang, L.G.; Wang, C.; Chen, N.C.; Wang, W. Spatiotemporal evolution of urban carbon balance and its response to new-type urbanization: A case of the middle reaches of the Yangtze River Urban Agglomerations, China. J. Clean. Prod. 2022, 380, 135122. [Google Scholar] [CrossRef]
  28. Wang, Y.; Wang, Y.; Duan, X. Ecological and economic influencing factors on the spatial and temporal evolution of carbon balance zoning in the Taihu Basin. Front. Ecol. Evol. 2024, 11, 103389. [Google Scholar] [CrossRef]
  29. Zhao, C.X.; Liu, Y.L.; Yan, Z.X. Effects of land-use change on carbon emission and its driving factors in Shaanxi Province from 2000 to 2020. Environ. Sci. Pollut. Res. Int. 2023, 30, 68313–68326. [Google Scholar] [CrossRef] [PubMed]
  30. Zuo, S.D.; Dai, S.Q.; Ren, Y. More fragmentized urban form more CO2 emissions? A comprehensive relationship from the combination analysis across different scales. J. Clean. Prod. 2020, 244, 118659. [Google Scholar] [CrossRef]
  31. Ou, J.P.; Liu, X.P.; Li, X.; Chen, Y.M. Quantifying the relationship between urban forms and carbon emissions using panel data analysis. Landsc. Ecol. 2013, 28, 1889–1907. [Google Scholar] [CrossRef]
  32. Shi, K.F.; Xu, T.; Li, Y.Q.; Chen, Z.Q.; Gong, W.K.; Wu, J.P.; Yu, B.L. Effects of urban forms on CO2 emissions in China from a multi-perspective analysis. J. Environ. Manag. 2020, 262, 110300. [Google Scholar] [CrossRef] [PubMed]
  33. Wang, M.S.; Madden, M.; Liu, X.J. Exploring the relationship between Urban Forms and CO2 emissions in 104 Chinese cities. J. Urban Plan. Dev. 2017, 143, 04017014. [Google Scholar] [CrossRef]
  34. Liu, X.Z.; Li, Y. Relationship between urbanization and carbon emissions in the ChangZhu-Tan Region at the county level. Environ. Sci. 2023, 44, 6664–6679. [Google Scholar]
  35. Liu, Y.S.; Yang, R.; Lin, Y.C. Pattern evolution and optimal paths of county urbanization in China. Acta Geogr. Sin. 2022, 77, 2937–2953. [Google Scholar]
  36. Jie, Y.; Xin, H. The 30 m annual land cover datasets and its dynamics in China from 1990 to 2020. Earth Syst. Sci. Data 2021, 13, 3907–3925. [Google Scholar]
  37. Oda, T.; Maksyutov, S.; Andres, R.J. The Open-source Data Inventory for Anthropogenic CO2, version 2016 (ODIAC2016): A global monthly fossil fuel CO2 gridded emissions data product for tracer transport simulations and surface flux inversions. Earth Syst. Sci. Data 2018, 10, 87–107. [Google Scholar] [CrossRef] [PubMed]
  38. Wen, J.Q.; Chuai, X.W.; Li, S.C.; Song, S.; Li, Y.W.; Wang, M.J.; Wu, S.S. Spatial heterogeneity of the carbon emissioneffect resulting from urban expansion among three coastal agglomerations in China. Sustainability 2019, 11, 4590. [Google Scholar] [CrossRef]
  39. Lyu, J.Q.; Fu, X.H.; Lu, C.; Zhang, Y.Y.; Luo, P.P.; Guo, P.; Huo, A.D.; Zhou, M.M. Quantitative assessment of spatiotemporal dynamics in vegetation NPP, NEP and carbon sink capacity in the Weihe River Basin from 2001 to 2020. J. Clean. Prod. 2023, 428, 139384. [Google Scholar] [CrossRef]
  40. Wang, X.; Zhu, B.; Li, C.; Gao, M.R.; Wang, Y.Q.; Zhou, Z.X.; Yuan, H.Y. Dissecting soil CO2 fluxes from a subtropical forest in China by integrating field measurements with a modeling approach. Geoderma 2011, 161, 88–94. [Google Scholar] [CrossRef]
  41. Zhang, M.; Huang, X.J.; Chuai, X.W. Study on the spatial distribution and change trend of net ecosystem productivity in China. Geogr. Geogr. Inf. Sci. 2019, 36, 69–74. [Google Scholar]
  42. Chen, Y.M.; Li, X.P.; Ai, B. Simulating Urban Form and Energy Consumption in the Pearl River Delta Under Different Development Strategies. Ann. Assoc. Am. Geogr. 2013, 103, 1567–1585. [Google Scholar] [CrossRef]
  43. Wu, Y.Z.; Shi, K.F.; Cui, Y.Z.; Liu, S.R.; Liu, L.L. Differentiated effects of morphological and functional polycentric urban spatial structure on carbon emissions in China: An empirical analysis from remotely sensed nighttime light approach. Int. J. Digit. Earth 2023, 16, 532–551. [Google Scholar] [CrossRef]
  44. Zhang, Z.A.; Huang, Z.F.; Cao, F.D.; Wang, K.; Chen, X.Y. The space-time transition characteristics and its driving mechanism of county-scale inbound tourism in Zhejiang province. Geogr. Res. 2016, 35, 1177–1192. [Google Scholar]
  45. Shi, H.X.; Chang, M. How does agricultural industrial structure upgrading affect agricultural carbon emissions? Threshold effects analysis for China. Environ. Sci. Pollut. Res. Int. 2023, 30, 52943–52957. [Google Scholar] [CrossRef] [PubMed]
  46. Li, X.; Xiong, S.; Li, Z.; Zhou, M.X.; Li, H.G. Variation of global fossil-energy carbon footprints based on regional net primary productivity and the gravity model. J. Clean. Prod. 2019, 213, 225–241. [Google Scholar] [CrossRef]
  47. Chen, J.W.; Zhao, F.; Zeng, N.; Oda, T. Comparing a global high-resolution downscaled fossil fuel COsub2/sub emission dataset to local inventory-based estimates over 14 global cities. Carbon Balance Manag. 2020, 15, 9. [Google Scholar] [CrossRef] [PubMed]
  48. Cai, H.Y.; Di, X.Y.; Chang, S.X.; Wang, C.K.; Shi, B.K.; Geng, P.F.; Jin, G.Z. Carbon storage, net primary production, and net ecosystem production in four major temperate forest types in northeastern China. Can. J. For. Res. 2015, 46, 620–623. [Google Scholar] [CrossRef]
  49. Chang, C.C. A multivariate causality test of carbon dioxide emissions, energy consumption and economic growth in China. Appl. Energy 2010, 87, 3533–3537. [Google Scholar] [CrossRef]
  50. Yang, Q.; Pu, L.; Jiang, C.; Gong, G.; Tan, H.; Wang, X.; He, G. Unveiling the spatial-temporal variation of urban land use efficiency of Yangtze River Economic Belt in China under carbon emission constraints. Front. Environ. Sci. 2023, 10, 1096087. [Google Scholar] [CrossRef]
  51. Chen, S.T.; Huang, Y.; Zou, J.W.; Shi, Y.S.; Lu, Y.Y.; Zhang, W.; Hu, Z.H. Interannual variability in soil respiration from terrestrial ecosystems in China and its response to climate change. Sci. China Earth Sci. 2012, 55, 2091–2098. [Google Scholar] [CrossRef]
  52. Li, J.; Zhang, Y.D.; Gu, F.X.; Huang, M.; Guo, R.; Hao, W.P.; Xia, X. Spatial and temporal dynamics of net ecosystem productivity in Northeast China over the past 50 years. Acta Ecol. Sin. 2014, 34, 1490–1502. [Google Scholar]
  53. Zhang, L.; Xiao, J.F.; Li, L.; Lei, L.P.; Li, J. China’s sizeable and uncer- tain carbon sink:A perspective from GOSAT. Chin. Sci. Bull. 2014, 59, 1547–1555. [Google Scholar] [CrossRef]
  54. Lou, H.; Shi, X.; Ren, X.; Yang, S.T.; Cai, M.Y.; Pan, Z.H.; Zhu, Y.F.; Feng, D.Y.; Zhou, B.C. Limited terrestrial carbon sinks and increasing carbon emissions from the Hu Line spatial pattern perspective in China. Ecol. Indic. 2024, 162, 112035. [Google Scholar] [CrossRef]
  55. Han, J.; Meng, X.; Zhou, X.; Yi, B.L.; Liu, M.; Xiang, W.N. A long-term analysis of urbanization process, landscape change, and carbon sources and sinks: A case study in China’s Yangtze River Delta region. J. Clean. Prod. 2017, 141, 1040–1050. [Google Scholar] [CrossRef]
  56. Liang, P.; Bin, D.; Ping, W.; Sheng, S.W.; Sun, L.; Fang, L.; Li, H.R.; Liu, L.P. Research on ecological risk assessment in land use model of Shengjin Lake in Anhui province, China. Environ. Geochem. Health 2019, 41, 2665–2679. [Google Scholar]
  57. Yu, C.; Wang, B.; Liu, H.; Zhang, L.; Yang, X.S.; Xiu, Z.Z. Dynamic changes of forest biomass and productivity in Anhui Province from 1994 to 2013. Resour. Environ. Yangtze Basin 2015, 24, 53–61. [Google Scholar]
  58. Liu, L.P. Research on the disparity of county economic development in Anhui Province. Issues Agric. Econ. 2010, 31, 80–86. [Google Scholar]
  59. Zhao, X.Y.; Jiang, J.D.; Zhang, L.; Hong, C.C.; Li, K.Y. Analysis of urban economic relations and radiation range of central cities in Wanjiang City Belt. Econ. Geogr. 2011, 31, 218–223. [Google Scholar]
  60. Xie, Y.; Weng, Q. World energy consumption pattern as revealed by DMSP-OLS nighttime light imagery. Mapp. Sci. Remote Sens. 2016, 53, 265–282. [Google Scholar] [CrossRef]
  61. Chen, M.X.; Gong, Y.H.; Lu, D.D.; Ye, C. Build a people-oriented urbanization: China’ s new-type urbanization dream and Anhui model. Land Use Policy 2019, 80, 1–9. [Google Scholar] [CrossRef]
  62. Jiang, W.; Deng, Y.; Tang, Z.; Lei, X.; Chen, Z. Modelling the potential impacts of urban ecosystem changes on carbon storage under different scenarios by linking the CLUE-S and the InVEST models. Ecol. Model. 2017, 345, 30–40. [Google Scholar] [CrossRef]
  63. Horan, C.; Jonas GE, A. Governing Massachusetts: Uneven Development and Politics in Metropolitan Boston. Econ. Geogr. 2015, 74, 83–95. [Google Scholar]
  64. Chen, L.; Li, X.; Kang, X.; Liu, W.; Wang, M.X. Analysis of the cooperative development of multiple systems for urban Economy-Energy-Carbon: A case study of Chengdu-Chongqing Economic Circle. Sustain. Cities Soc. 2024, 108, 105395. [Google Scholar] [CrossRef]
  65. Bao, S.; Lu, L.; Zhi, J.; Li, J.F. An Optimization Strategy for Provincial “Production-Living-Ecological” Spaces under the Guidance of Major Function-Oriented Zoning in China. Sustainability 2024, 16, 2248. [Google Scholar] [CrossRef]
  66. Yang, Z.; Hong, Y.; Zhai, G.; Wang, S.H.; Zhao, M.S.; Liu, C.; Yu, X.X. Spatial Coupling of Population and Economic Densities and the Effect of Topography in Anhui Province, China, at a Grid Scale. Land 2023, 12, 2128. [Google Scholar] [CrossRef]
  67. Li, Y.M.; Shen, Y.S.; Wang, S.H. Spatio-temporal characteristics and effects of terrestrial carbon emissions based on land use change in Anhui Province. J. Soil Water Conserv. 2022, 36, 182–188. [Google Scholar]
  68. Niu, J.J.; Mao, C.M.; Xiang, J. Based on ecological footprint and ecosystem service value, research on ecological compensation in Anhui Province, China. Ecol. Indic. 2024, 158, 111341. [Google Scholar] [CrossRef]
  69. Chen, J.; Hu, F. Research on Current Situation and Countermeasures of Tourism Development in Anhui Province. J. Tour. Manag. 2024, 1, 13–21. [Google Scholar]
  70. Fang, D.C.; Zeng, Z.B. Measurement of Economic convergence and path of coordinated and balanced development in Yangtze River Delta. Reg. Econ. Rev. 2022, 6, 22–29. [Google Scholar]
  71. Lv, T.; Hu, H.; Han, H.; Zhang, X.M.; Fan, H.B.; Yan, K.G. Towards sustainability: The spatiotemporal patterns and influence mechanism of urban sprawl intensity in the Yangtze River Delta urban agglomeration. Habitat Int. 2024, 148, 103089. [Google Scholar] [CrossRef]
  72. Li, T.; Chen, T.Y.; Fan, Y.L.; Chen, F. Influencing factors, industry differences and forecast of carbon emission of energy consumption in Anhui Province. J. Saf. Environ. 2020, 20, 1494–1503. [Google Scholar]
  73. She, Q.N.; Jia, W.X.; Pan, C.; Zhu, X.Y.; Yang, F.; Liu, M.; Xiang, W.N. Spatial and temporal variation characteristics of urban forms’ impact on regional carbon emissions in the Yangtze River Delta. China Popul. Resour. Environ. 2015, 25, 44–51. [Google Scholar]
  74. Shi, F.C.; Liao, X.; Shen, L.Y.; Meng, C.H.; Lai, Y.Y. Exploring the spatiotemporal impacts of urban form on CO2 emissions: Evidence and implications from 256 Chinese cities. Environ. Impact Assess. Rev. 2022, 96, 106850. [Google Scholar] [CrossRef]
  75. Teng, F.; Wang, Y.J.; Wang, M.J.; Li, S.C.; Lin, Y.H.; Cai, H.F. Spatiotemporal coupling relationship between urban spatial morphology andcarbon budget in Yangtze River Delta urban agglomeration. Acta Ecol. Sin. 2022, 42, 9636–9650. [Google Scholar]
  76. Li, Y.; Luan, W.; Yang, D.; Cai, X.Z. The influence mechanism of supporting cities’ development on the spatial expansion of economic development zones: Evidence from China’s coast. J. Clean. Prod. 2024, 440, 140844. [Google Scholar] [CrossRef]
  77. Zhu, J.; Niu, X.; Wang, Y. Polycentric Urban Spatial Structure Identification Based on Morphological and Functional Dimensions: Evidence from Three Chinese Cities. Sustainability 2024, 16, 2584. [Google Scholar] [CrossRef]
  78. Jin, Y.S.; Xu, Y.S. The divergent effects of polycentric urban form on urban carbon emissions: Spatial balance and spatial dispersion in Chinese cities. Urban Clim. 2024, 55, 101862. [Google Scholar] [CrossRef]
  79. Zhou, K.J.; Kong, F.H.; Yin, H.W.; Destouni, G.; Meadows, M.E.; Andersson, E.; Chen, L.D.; Chen, B.; Li, Z.Y.; Su, J. Urban flood risk management needs nature-based solutions: A coupled social-ecological system perspective. NPJ Urban Sustain. 2024, 4, 101038. [Google Scholar] [CrossRef]
Figure 1. Location and GDP per capita of study area.
Land 13 00810 g001
Figure 2. Logic diagram of the research methodology. (CE: Carbon Emission; NEP: Net Ecosystem Productivity; CA: Class Area; PLAND: Percent of Landscape; NP: Number of Patches; LPI: Largest Patch Index; LSI: Landscape Shape Index; ED: Edge Density; GTWR: Geographically and Temporally Weighted Regression).
Land 13 00810 g002
Figure 3. Temporal and spatial transition analyses of urban spatial form in Anhui Province.
Land 13 00810 g003
Figure 4. Spatial distribution of carbon balance in Anhui Province from 2001 to 2019.
Land 13 00810 g004
Figure 5. Spatial distribution of positive correlation regression coefficient between urban spatial development characteristics and carbon balance in Anhui Province. (A): The GWTR regression coefficient of LPI; (B): The GWTR regression coefficient of LSI; (C): The GWTR regression coefficient of ED.
Land 13 00810 g005
Figure 6. Spatial distribution of negative correlation regression coefficient between urban spatial development characteristics and carbon balance in Anhui Province. ((a): The GWTR regression coefficient of CA; (b): The GWTR regression coefficient of PLAND; (c): The GWTR regression coefficient of NP).
Land 13 00810 g006
Figure 7. Single-factor detection results.
Land 13 00810 g007
Figure 8. Multi-factor interaction detection results.
Land 13 00810 g008
Figure 9. Zoning control chart of carbon balance in Anhui Province.
Land 13 00810 g009
Table 1. Statistical description of per capita GDP in Anhui Province.
Sample SizeMaximum ValueMinimum ValueMean ValueStandard Deviation
10517.5812.3926.2072.887
medianvariancekurtosisskewnesscoefficient of variation
5.6668.3353.0251.5370.465
Table 2. Quantitative indicators of urban spatial development characteristics.
Rule LayerIndex LevelExplanation
Urban sizeClass Area (CA)The total built-up area of the city is used to describe the overall situation of urban development.
Percent of Landscape (PLAND)The proportion of different patch types is used to describe the proportion of urban land use types.
Urban functional structureNumber of Patches (NP)The greater the number of patches, the more dispersed the urban form, which is used to describe the degree of patch dispersion in urban built-up areas.
Largest Patch Index (LPI)The maximum construction land area index of urban built-up areas is used to describe the dynamic nature of the urban development core and reflect the agglomeration of urban development.
Urban development structureLandscape Shape Index (LSI)It is used to describe the complexity of the internal development form of the urban built-up area. The higher the value, the more complex the internal structure of the city.
Edge Density (ED)The ratio of the perimeter to the area of the edge of the built-up area of the city, which can be used to describe the complexity of the external development pattern of the city.
Disclaimer/Publisher’s Note: The statements, opinions and data contained in all publications are solely those of the individual author(s) and contributor(s) and not of MDPI and/or the editor(s). MDPI and/or the editor(s) disclaim responsibility for any injury to people or property resulting from any ideas, methods, instructions or products referred to in the content.

