Abstract
The digital economy, closely linked to agricultural progress, plays a key role in reducing agricultural carbon emissions. By utilizing panel data between 2011 and 2021 from 30 Chinese provincial-level regions, the present work empirically assesses the direct impact and nonlinear spatial spillover effects of the digital economy on agricultural carbon emissions, where methodologies including fixed effects, threshold models, and spatial econometrics are employed. The results were as follows: (1) The digital economy led to remarkable inhibition of agricultural carbon emissions, which was consistent across various robustness checks. (2) The carbon reduction efficiency of the digital economy presented obvious spatial variation, which had a greater negative effect in eastern regions and major grain-producing regions. (3) The digital economy had a nonlinear impact on agricultural carbon emissions, and technological innovation played a threshold effect, showing an “inverted U-shaped” characteristic of increasing first and then decreasing overall. (4) This emission abatement effect also showed a significant spatial spillover aspect, meaning that the digital economy development in one area prominently abates agricultural carbon emissions in adjacent provinces. Our findings might provide a theoretical and empirical foundation for comprehending and addressing agricultural carbon emissions abatement in China from the digital economy perspective.
1. Introduction
With the increasing intensification of energy consumption and climate change, such as global warming caused by carbon emissions, along with global economic development, sustainable development faces severe challenges to survival and social development [1,2]. Although the crucial position of agriculture in economic development is declining, agricultural carbon emissions cannot be ignored [3]. According to statistics from the FAO, carbon emissions generated by agricultural and forestry activities, as well as the food system, account for approximately 31% of total global carbon emissions, making them one of the major sources of carbon emissions worldwide [4]. The reduction in agricultural carbon emissions has become a major issue facing all countries in the world [5,6]. As the largest developing country and the world’s largest carbon emitter [7], the carbon emissions generated by China’s agriculture and related activities account for approximately 17% of the total carbon emissions in the country [8]. It is urgent to explore the paths for effectively promoting agricultural carbon reduction in China [9].
Against the macro backdrop of global technological and industrial transformations, the digital economy has rapidly emerged with its unique dynamism [10], becoming a leading industry in current economic development [11] and gradually revealing itself as a new engine of growth for the Chinese economy [12,13]. The significance of the digital economy in economic development cannot be overstated, and its multifaceted impact on the environment is increasingly becoming a focal point of academic research [14,15]. According to recent studies, the digital economy has aided in the advancement of low-energy technology research, development, and implementation [16]. It has successfully reduced energy consumption and significantly reduced carbon emissions by improving the intelligence level of environmental monitoring and management and maximizing energy utilization efficiency [17]. Given this, exploring the inherent logical association of the digital economy with agricultural carbon emissions and fully leveraging the digital economy to empower low-carbon agricultural growth hold significant practical significance for promoting agricultural carbon reduction.
Many academics have conducted a great deal of research on the correlation between the digital economy and carbon emissions. Much research has found a considerable negative association between these two variables [18,19]. The digital economy accomplishes efficient resource allocation by utilizing cutting-edge technology [20]. These technologies provide precision agricultural analysis, allowing for rigorous administration of all elements of agricultural production and processing. This considerably minimizes resource and energy waste in agricultural production, resulting in fewer agricultural carbon emissions. The digital economy has promoted the innovation and application of green environmental protection technologies, such as renewable energy technologies and biological environmental protection technologies [21], reducing the consumption of traditional energy and agricultural carbon emissions. The digital economy can effectively integrate resources across various stages of agricultural production, transportation, and consumption, enhancing the transparency of the agricultural supply chain [22], promoting green and low-carbon agricultural development, and reducing carbon emissions. However, the impact of the digital economy on carbon emissions is not a simple linear relationship but a complex nonlinear one [23,24]. Furthermore, some scholars have explored the relationship between the digital economy and agricultural carbon emissions from the perspective of spatial correlation, and their research has shown that the digital economy has a significant spatial spillover effect on carbon emissions [25,26]. Technological innovation is critical for minimizing agricultural carbon emissions. Several studies have looked at the impact of technology innovation on agricultural carbon emissions from various perspectives. One of the main ways to promote agricultural carbon emission reduction is technological innovation. So far, several academic studies have conducted in-depth and detailed discussions and assessments of the specific role of technology innovation in agricultural carbon emissions from various angles [27,28,29].
Some studies have quantified the level of technological innovation using indicators such as R&D investment ratio and total factor productivity and empirically tested the positive role of technological innovation in reducing agricultural carbon emissions [30,31]. Furthermore, experts have demonstrated via extensive research that technical innovation has accelerated the development of resource recycling systems, thereby enhancing energy efficiency. This has resulted in much lower agricultural carbon emissions [32]. Therefore, it can be unequivocally stated that technological innovation is an indispensable and important avenue for promoting agricultural carbon emission reduction [33].
While previous studies have laid a solid foundation, few have explored the inherent logic, nonlinear effects, and spatial spillover effects of the digital economy, technological innovation, and agricultural carbon emissions within the same framework. In the present work, the digital economy, agricultural carbon emissions, and technological innovation are integrated into a comprehensive framework to empirically assess the digital economy’s impact on agricultural carbon emissions, where the provincial panel data of China (2011–2021) are utilized. The spatial spillover and nonlinear impacts of the digital economy are thoroughly assessed, aiming to provide valuable insights into agricultural carbon reduction and the low-carbon green transition of agriculture. The unique contributions of the present study include the following: (1) It offers a novel research perspective on agricultural carbon reduction by integrating the digital economy, carbon emissions, and technological innovation into a comprehensive analytical framework. (2) It examines the nonlinear dynamics of the digital economy’s influence over agricultural carbon emissions under the technological innovation constraint. (3) This study introduces the spatial Durbin model to explore the spatial impact of the digital economy on agricultural carbon emissions.
2. Theoretical Mechanism and Research Hypotheses
2.1. The Direct Impact of the Digital Economy on Agricultural Carbon Emissions
With the integrated development of the digital economy and the agricultural sector, agricultural environmental protection technology, the Internet of Things, and other technologies have emerged, allowing for optimal resource allocation in the agricultural field and opening up new opportunities for reducing agricultural carbon emissions [34,35]. The advancement of the digital economy has brought about major changes and developments in the agricultural sector. These technologies not only connect various links in the agricultural industry chain, including production, processing, and sales, but also optimize resource allocation, further promoting the green transformation of agriculture [36]. The expansion of the digital economy has eased the use of agricultural IoT and smart equipment such as intelligent irrigation, directing agriculture toward intelligence, intensification, and greening. As a result, agricultural production efficiency has improved, while carbon emissions have reduced. In light of this context, this study proposes the following hypothesis:
Hypothesis 1 (HI).
The digital economy exerts a prominent inhibitory effect on agricultural carbon emissions.
2.2. The Nonlinear Impact of the Digital Economy on Agricultural Carbon Emissions
The growth of the digital economy has a substantial impact on increasing production efficiency and resource use efficiency, resulting in carbon emission reductions in the agriculture sector [37]. However, the link between the two is more intricate than a simple linear correlation [38]. Meanwhile, the nonlinear relationship between the digital economy and agricultural carbon emissions can be altered by a tipping point provided by technical innovation. Once technological progress reaches a certain point, the detrimental effects of the digital economy on carbon emissions from agriculture vary [39]. Technological innovation enhances resource exploitation of agricultural waste [40] and minimizes environmental dangers associated with agricultural carbon emissions. As a result, while evaluating the influence of the digital economy on agricultural carbon emissions, the threshold effect induced by technological innovation must be fully recognized in order to more accurately evaluate its impact on carbon emissions. On this premise, the following hypothesis can be proposed:
Hypothesis 2 (H2).
The impact of the digital economy on agricultural carbon emissions displays nonlinear traits, where technological innovation demonstrates a significant threshold influence.
2.3. The Digital Economy’s Spatial Spillover Effects on Agricultural Carbon Emissions
The digital economy transcends time and geography, facilitating the dispersion and expansion of activity across geographies. This feature improves regional interconnectedness and permeability [41]. Research has demonstrated a significant spillover impact in terms of space, proving a connection between carbon emissions from agriculture and the digital economy [42]. Digital technology is distinguished by its potential to overcome spatial and temporal constraints, increasing the interconnection and permeability of activities between regions [43]. The digital economy overcomes spatial and temporal barriers, closely links multiple links in the agricultural industry chain, creates a spatial agglomeration effect, optimizes resource allocation [44], lowers production costs, and thus reduces agricultural carbon emissions. Simultaneously, through information sharing, technology sharing, and cross-regional knowledge flow [45], the digital economy considerably increases regional agricultural production efficiency and energy utilization efficiency, lowering agricultural carbon emissions on a larger scale. As a result, it causes a regional spillover impact on agricultural carbon emissions. Based on this supposition, we suggest the following hypothesis:
Hypothesis 3 (H3).
There is a spatial spillover effect from the way that digital economic development reduces carbon emissions from agriculture.
3. Materials and Methods
3.1. Model Setting
To further explore the impact mechanism of the digital economy on agricultural carbon emissions, this article constructs the following benchmark model based on the previous theoretical analysis:
where is the dependent variable representing agricultural carbon emissions in year t for province i; suggests the core explanatory variable indicating the level of digital economic development in year t for province i; includes a set of control variables, including the degree of openness, agricultural mechanization level, urbanization rate, government intervention, and human capital; and represent the fixed effects for province and year, respectively; refers to the random error term; , and are the coefficients of the variables.
In order to delve deeper into the effect of the digital economy on agricultural carbon emissions at various levels of technological innovation, this study adopts Hansen’s (1999) threshold effect analysis, conducting a dual examination of threshold variables [46]. The model is as follows:
In Formula (2), TI represents the threshold variable; denotes the threshold value being tested; I(·) refers to the indicator function of the threshold model.
Expanding upon Equation (1) and incorporating spatial factors, this study thoroughly assesses the spatial spillover effects of the digital economy on agricultural carbon emissions. By adding spatial interaction terms for the economy and emissions into Equation (1), a spatial econometric model is developed in order to explore the digital economy’s impact on agricultural carbon emissions in greater depth. The spatial Durbin model can be defined as follows:
In Equation (3), signifies the coefficient for spatial autocorrelation; suggests the spatial weight matrix; and indicate the elasticity coefficients for spatial interaction terms of the core explanatory and control variables.
3.2. Variable Selection
(1) Dependent Variable
Agricultural carbon emissions (ACE) indicate the direct or indirect greenhouse gases generated during agricultural production processes, including those from fertilizers, pesticides, fossil fuels, and waste treatment [47]. This study adopts the calculation method for carbon emissions from agriculture as outlined by Ding Baogen et al. (2022) [48]:
The agricultural carbon emissions (ACE), as indicated in Equation (4); represent the carbon emissions from various agricultural inputs; indicates the carbon emission coefficient for different types of agricultural supplies. The subsequent table provides the main carbon emission coefficients for these supplies (Table 1).

Table 1.
Agricultural carbon emission coefficients.
(2) Core Explanatory Variables
The determination of the digital economy (DIG) primarily follows the method proposed by Yi et al. (2022) [49], which thoroughly evaluates the current status of DIG. This assessment includes dimensions such as the internet, mobile phones, technology services, information transfer, and per capita telecommunications services. Following standardization, the DIG is ascertained using the entropy method.
(3) Threshold variable Technological Innovation (TI).
Agricultural technological progress refers to the adoption of new technologies, methods, equipment, and materials in the agricultural production process to improve production efficiency, enhance the quality of agricultural products, reduce resource consumption, and minimize environmental pollution. This study utilizes the approach of Yang et al. (2018) [50], selecting the number of patents granted per capita as the proxy for technological innovation.
(4) Control variables
To enhance the model’s robustness and reliability, the following control variables are selected: Agricultural mechanization level (AM): Agricultural mechanization, which substitutes manual labor and modifies crop planting methods, increases agricultural scale, and has the potential to raise total agricultural carbon emissions. This variable is quantified by taking the logarithm of the overall power of agricultural machinery [51]. Urbanization level (UL): The level of urbanization significantly impacts agricultural development and, consequently, carbon emissions. The urban population is measured as a proportion of the total resident population in the region [52]. Openness level (OP): Opening up to international trade may enhance agricultural product trade, resulting in increased agricultural production size and output, which influences agricultural carbon emissions. This study defines OP as the total value of imports and exports expressed as a percentage of regional GDP. Government involvement (GI): Government involvement has the potential to directly or indirectly influence farmers’ agricultural production operations, hence affecting carbon emissions. The ratio of government fiscal expenditure to fiscal revenue can be used to assess government involvement [53]. Human capital (HR) is an important metric used to assess the quality of a region’s or country’s labor force. When human capital is larger, the pushing factor for reducing agricultural carbon emissions becomes stronger. This article uses the average number of years of schooling as an indication of regional human capital levels [54].
3.3. Data Source and Descriptive
This study examined 30 Chinese provinces in depth, using data from 2011 to 2021 (excluding Hong Kong, Macao, Taiwan, and Tibet). The data were derived from the China Energy Statistical Yearbook, the China Statistical Yearbook, the China Agricultural Statistical Yearbook, and the EPS database. Interpolation methods were employed to impute missing data. Table 2 presents descriptive statistics for the relevant variables.
Table 2.
Descriptive statistics of main variables.
4. Results and Analysis
4.1. Variation in Agricultural Carbon Emissions in Time and Space
The spatial pattern of agricultural carbon emissions in 30 provinces of China in key years is displayed in Figure 1. This paper mainly uses the natural breakpoint method to classify the agricultural carbon emissions of Chinese provinces in 2011, 2015, 2018, and 2020 into levels I–V. From the lowest level I to the highest level V, levels I and II are set as low-carbon-emission areas, level III as medium-emission areas, and levels IV and V as high-emission areas, which can intuitively analyze the trend of agricultural carbon emissions within a variety of regions.
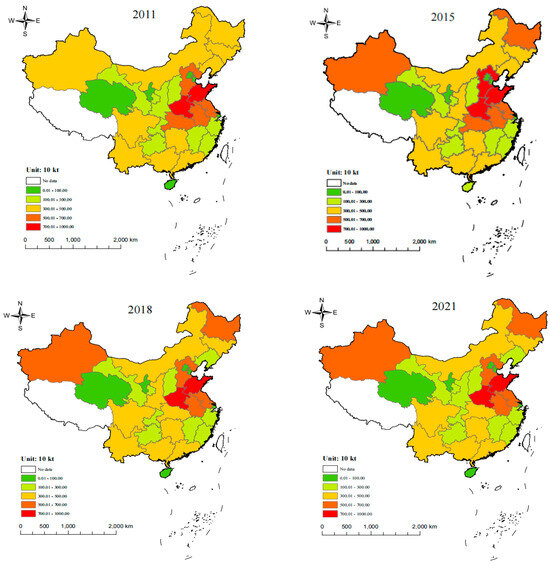
Figure 1.
Trend of agricultural carbon emission across 30 provinces and municipalities in China.
In terms of spatial distribution, significant regional differences exist in the geographical pattern of agricultural carbon emissions in China. These emissions exhibit a distinct trend of being higher in the east and lower in the west, as well as higher in the north compared to the south. More specifically, regions with high and medium agricultural carbon emissions are predominantly located in the central, eastern, and northern parts of the country, whereas low-emitting regions are concentrated mainly in the west and south. The reason for this may refer to the fact that the climate conditions, soil characteristics, and agricultural structure in the central and eastern regions of China are shown to be more suitable, agricultural production is more intensive, and the development foundation is better, resulting in higher agricultural carbon emissions and the formation of carbon emission aggregation areas.
In terms of time dimension, in 2011, China specifically had 10 medium-sized emission zones, 6 high-carbon emission zones, and 14 low-carbon emission zones. By 2015, the number of low-carbon, medium-carbon, and high-carbon emission zones had adjusted to 13, 9, and 8, respectively. By 2018, these numbers had further shifted to 14, 9, and 7. The latest data from 2021 reveal that the number of low-carbon emission zones has increased to 15, medium-carbon emission zones have decreased to 8, and high-carbon emission zones have remained stable at 7. Over the course of the past 11 years, the number of low-emission zones for agricultural carbon emissions in China has shown an increasing trend, while the number of medium-emission zones has decreased. It is worth noting that the number of high-emission areas first increases and then decreases.
4.2. Benchmark Regression Results
Before performing the benchmark regression analysis, an examination was used to ascertain the presence of multicollinearity among the variables. The VIF values were found to be below 10, suggesting an absence of multicollinearity between the variables. Table 3 shows the regression results, with the first column showing the outcomes without the inclusion of control variables, whereas the second, third, and fourth columns illustrate the findings incorporating control variables, utilizing fixed effects, random effects, and time-province two-way fixed effects models, respectively. Moreover, the Hausman test rejected the null hypothesis at a 1% significance level, indicating that the time-province two-way fixed effects model is the most suitable for the benchmark regression.
Table 3.
Benchmark regression results.
Table 3 indicates that the regression coefficient of the digital economy on agricultural carbon emissions is strongly negative, irrespective of the addition of control variables or modification of the model type. The digital economy’s coefficient in Table 3(4)’s benchmark regression results is −0.657. This finding strongly supports our hypothesis (H1), namely that the growth of the digital economy will significantly reduce agricultural carbon emissions. The reason for this may be the rapid process of modern information technologies, including the Internet of Things and cloud, which are being applied to various aspects of agricultural computing production. Through precision management, agricultural productivity is being enhanced in multiple dimensions, resulting in reduced energy consumption and promoting agricultural carbon reduction.
Regarding the control variables, the levels of agricultural mechanization, urbanization, openness, and government intervention on agricultural carbon emissions are 0.210, 1.686, 0.030, and 0.632, respectively, all showing significant positive effects. The reason for this may be that the increase in agricultural mechanization poses a certain threat to the agricultural ecological environment, thereby increasing carbon emissions. The increase in urbanization may mean more rural areas are converted to urban land, leading to agricultural activities shifting towards higher agricultural carbon emissions. A greater degree of openness might strengthen the ties between the agricultural sector and other businesses, increasing carbon emissions. Increased government involvement might result in inefficient resource distribution and higher carbon emissions. A strong negative correlation exists between human capital and agricultural carbon emissions, likely because the improvement of human capital promotes the advancement and innovation of agricultural technology, enhances agricultural production efficiency, and reduces energy and resource consumption, thereby lowering agricultural carbon emissions.
4.3. Robustness Analysis
4.3.1. Replace Core Explanatory Variables
To make the conclusions more robust, the calculation approach for the core explanatory variable, “digital economy”, is changed to principal component assessment for reconducting regression analysis. Column (1) of Table 4 displays the regression results. With the calculation approach for the core explanatory variable being changed, the digital economy (DIG2) still has a prominent inhibitory effect on agricultural carbon emissions.
Table 4.
Results of robustness analysis regression.
4.3.2. Deletion of Some Samples
Given the extensive geographical expanse and uneven economic development across China, the digital economy in the central municipalities notably differs from that in other provinces. To enhance the robustness of the study’s conclusions, regression analysis was reconducted after excluding the sample data from the four central municipalities. As displayed in column (2) of Table 4, the findings indicate that the digital economy is associated negatively with agricultural carbon emissions.
4.3.3. Trimming of Outliers
Acknowledging that outliers can distort regression results, the study further ensured the reliability of the benchmark regression by trimming all variables at the 5% level to smooth the data. The regression results in column (3) of Table 4 reveal that the core explanatory variable, the digital economy, continues to exert a notable inhibitory effect on agricultural carbon emissions. This reinforces the reliability and robustness of the benchmark regression findings.
4.3.4. Instrumental Variables
The study used an instrumental variable (IV) strategy to reduce the possibility of biases resulting from endogeneity problems, such as reverse causality and factors that were left out. Instrumental variables must meet two requirements: they must be exogenous with respect to the dependent variable and connected to the explanatory variable. In the present study, terrain ruggedness was selected as an instrumental variable. It influences the development of the digital economy but does not directly affect agricultural carbon emissions, thus satisfying the conditions of relevance and exogeneity. The regression results in column (4) of Table 4 confirm that the regression coefficient of the digital economy is negative, which means that it significantly reduces agricultural carbon emissions. This discovery not only strengthens the benchmark regression’s resilience but also demonstrates the correctness and dependability of the model.
4.4. Heterogeneity Analysis
4.4.1. Regional Heterogeneity
China, spanning a vast territory, exhibits disparities in regional economic development. Variations in infrastructure and industrial structure across different regions likely influence the progress of the digital economy and agricultural carbon emissions. Thus, this work classifies China into Eastern, Central, and Western regions for sample regression analysis. This division aims to investigate regional heterogeneity regarding the effect of digital economy development on agricultural carbon emissions. Columns (1)–(3) in Table 5 present relevant regression results. It is evident that the digital economy hinders agricultural carbon emissions in all three Chinese regions. It is worth mentioning that when compared to the central and western regions, eastern China exhibits a stronger inhibitory effect. One probable explanation is that eastern China’s solid economic development base provides significant support for the rapid expansion of the digital economy. The integrated progress of the digital economy and agriculture advances the growth of sustainable and intelligent agriculture, thereby further minimizing carbon emissions during agricultural production procedures.
Table 5.
Regression results of heterogeneity analysis.
4.4.2. Functional Zones for Grain Production Heterogeneity
There are significant regional variations in grain yield in China due to its vast size and diversity in topography, climate, and water resource characteristics. This study separates these regions into two groups to examine their heterogeneity: major grain-producing areas, which comprise 13 provinces comprising the basins of the Yangtze, Yellow, and Songhua Rivers, and non-major areas, which comprise 17 provinces. Table 5 displays the appropriate regression findings. The statistics in columns (4)–(5) clearly show that in large grain-producing regions, the digital economy has a greater impact on decreasing agricultural carbon emissions, and its promoting effect is more visible and important. This disparity can be attributed to the more advanced agricultural modernization in the major grain-producing regions, which effectively uses the potential of the digital economy to reduce agricultural carbon emissions, as well as their stronger agricultural foundation. Conversely, non-major grain-producing regions have less of an inhibitory influence on agricultural carbon emissions since agricultural expansion there progresses more slowly, and the rate of digital economy penetration is lower.
4.5. Threshold Effect
Given the close association between technological innovation and agricultural carbon emissions, it is necessary to explore whether there is a threshold effect of technological innovation during the process of the digital economy impacting agricultural carbon emissions. Therefore, Bootstrap was used to conduct 400 self-sampling tests to examine the existence of a threshold effect, and the results can be found in Table 6. In addition, the p-value for a single threshold is 0.000, and for a double threshold is 0.0725, both passing the significance test. Therefore, with technological innovation being applied as a threshold variable, the digital economy has a double threshold effect on agricultural carbon emissions.
Table 6.
Threshold effect test.
Table 7 presents the threshold regression results, indicating that technological innovation imposes a threshold effect on the digital economy’s ability to reduce agricultural carbon emissions. When technical innovation levels do not exceed 3.73, the coefficient for the influence of the digital economy on agricultural carbon emissions is −0.649. This demonstrates how the digital economy significantly reduces carbon emissions from agriculture. The predicted coefficient for the digital economy is −0.401 when technological innovation is between 3.73 and 11.01, indicating a significant rise in its mitigating impact on agricultural carbon emissions. However, it drops to −0.645 when technical innovation surpasses 11.01, implying a slight decrease in the digital economy’s ability to reduce agricultural carbon emissions. Hence, it can be observed that the impact of the digital economy on agricultural carbon emissions demonstrates an “inverted U-shaped” trend, which first gradually increases and then gradually decreases.
Table 7.
Threshold regression results.
4.6. Further Analysis
4.6.1. Spatial Autocorrelation Test
In this study, the spatial autocorrelation test is needed for a deeper exploration of the spatial correlation between the digital economy and agricultural carbon emissions. To ensure the applicability and rationality of the model, Moran’s I is adopted as a spatial autocorrelation measure and can be written as follows:
In Formulas (5) and (6), n represents the total number of spatial units; represents the spatial weight matrix; and suggest the attribute values of the random variable X in spatial units i and j, respectively; is the average of the attribute values for n spatial samples. The value range of the global Moran’s I index is [−1,1]. If the index falls within the range of 0 to 1, it indicates a positive correlation between the observed variables. If it falls between −1 and 0, it represents a negative correlation between the variables. When Moran’s I index is exactly 0, it signifies no spatial correlation between the observed variables. Table 8 illustrates the findings of the worldwide Moran’s I index, with the digital economy and agricultural carbon emissions constantly showing positive values. Based on this, subsequent spatial effect analysis can be conducted.
Table 8.
Regional agricultural carbon emissions and the global Moran’s I index of the digital economy.
The present research further investigates the association between the digital economy and agricultural carbon emissions by adopting the spatial Durbin model (SDM). Prior to this, a correlation test was undertaken, and Table 9 reports the relevant outcomes. The SDM is preferred over the spatial lag model and spatial error model since it does not degrade to these models. Furthermore, in the choice between stochastic and fixed effects, we chose the fixed effects spatial Durbin model on the basis of the Hausman test.
Table 9.
LR and LM test results.
4.6.2. Spatial Durbin Regression Results
According to Table 10, the spatial coefficient ρ for the dependent variable, agricultural carbon emissions, passed the significance test, suggesting that there exists a strong spatial correlation between the digital economy and agricultural carbon emissions. In addition, the digital economy significantly reduces agricultural carbon emissions, evidencing a notable effect on carbon reduction.
Table 10.
Spatial Durbin model regression results.
In order to reduce potential biases, Table 11 displays the baseline regression findings of the spatial Durbin model (SDM), which are further broken down into indirect, direct, and total impacts. Whether it is direct, indirect, or total effects, the regression coefficients of the digital economy are negative, indicating that an increase in the level of the local digital economy significantly reduces agricultural carbon emissions in both local and adjacent areas. The reason for this is that the improvement of the digital economy has continuously penetrated agriculture, promoting the transregional flow of digital and other production factors, realizing agricultural scale production, reducing agricultural energy consumption, promoting sustainable green agricultural growth, and mitigating carbon discharge.
Table 11.
Spatial effect decomposition results.
4.6.3. Spatial Robustness Analysis
With the purpose of validating the reliability of the regression results, this work uses an adjacency matrix and an economic distance matrix for robustness testing. Table 12 outlines the robustness test regression results. The comparison between alternative and baseline model results shows that the core explanatory variable, the digital economy, maintains the same direction and sign as in the baseline regression model, passing the 1% significance test. Moreover, this suggests the robustness and reliability of the spatial Durbin model baseline regression results.
Table 12.
Spatial robustness test regression results.
5. Discussion
5.1. The Mechanism of the Digital Economy’s Impact on Agricultural Carbon Emissions
5.1.1. Direct Effect of the Digital Economy on Agricultural Carbon Emissions
The digital economy and agricultural carbon emissions have a substantial negative association, according to the prior benchmark regression research. Furthermore, studies by Zhao et al. (2023) show that the digital economy successfully cuts greenhouse gas emissions from agriculture [14]. This effect might result from the digital economy’s capacity to use precise and sophisticated technical ways to reduce waste and consumption and maximize resource allocation, which in turn lowers agricultural carbon emissions [55]. Furthermore, integrating the digital economy with agriculture can introduce new environmental protection technologies, enhancing precision agriculture, intelligent planting, and agricultural mechanization, thereby reducing carbon emissions to promote green agriculture and achieve the “dual carbon” goals.
5.1.2. Analysis of Heterogeneity in the Effect of the Digital Economy on Agricultural Carbon Emissions
Although the impact will vary based on location, the heterogeneity study results indicate that enhancing the digital economy has the potential to significantly reduce carbon emissions from agricultural production. The digital economy has a stronger impact on lowering agricultural carbon emissions, especially in China’s eastern provinces and major grain-producing regions. This conclusion is consistent with previous research findings [56]. The difference might be explained by the different ways that China’s eastern and central-western regions, as well as its grain and non-grain areas, have developed the digital economy and agriculture. Due to their greater agricultural basis, the eastern regions and main grain-producing zones have a scale impact that increases the suppressive effect of the digital economy on agricultural carbon emissions.
5.1.3. The Nonlinear Effects of the Digital Economy on Agricultural Carbon Emissions
Based on the previous threshold effect analysis, the digital economy has a nonlinear impact on agricultural carbon emissions, exhibiting an inverted U-shaped curve. This means that the inhibitory effect of the digital economy on agricultural carbon emissions first increases and then decreases [57,58]. The primary cause is that technology innovation is increasingly being used in agriculture, significantly promoting agricultural carbon reduction. However, when technology advances quickly in later phases, it becomes more difficult to resolve earlier technical problems, which makes it challenging for technological innovation to keep cutting carbon emissions.
5.1.4. Spatial Spillover Effect of the Digital Economy on Agricultural Carbon Emissions
After carrying out an extensive examination of the spatial spillover effects, we found that the digital economy has a significant spatial spillover effect on agricultural carbon emissions. In addition to reducing local agricultural carbon emissions, the digital economy also successfully lowers emissions in the surrounding areas [42]. This impact results from the digital economy’s encouragement of technical innovation and application, optimization of resource allocation, and facilitation of cross-regional coordination and collaboration. As a result, it encourages low-carbon and sustainable agricultural development while reducing agricultural carbon emissions.
5.2. Policy Recommendations
First, the development of the digital economy should be promoted. We may achieve intelligent, precise, and environmentally friendly agricultural production. Agriculture and forestry are important carbon-reduction strategies. Platforms in the digital economy should be created to encourage afforestation, improve forest management, promote sustainable forestry practices, and launch forestry carbon sink projects. These measures will increase agriculture and forestry’s carbon sequestration capability, lowering agricultural carbon emissions.
Second, the deep integration of technological innovation and agriculture should be promoted, and support for technological innovation should be enhanced by leveraging agricultural development characteristics. Special funds should be allocated for agricultural technological innovation, improving low-carbon agricultural technology, and creating a scale effect in technological innovation to promote the green development of agriculture. The agricultural sector should fully utilize the digital economy and encourage and guide environmentally friendly production methods, such as using green and clean energy, reducing biofuel consumption, and promoting green agriculture.
Third, the regional coordinated development of the digital economy should be enhanced, in addition to removing administrative barriers, fostering interconnection, and promoting coordinated development across regions. Digital economic development policies should be tailored to local conditions, reducing regional disparities in digital economic development and fully unlocking the vast potential of the digital economy in advancing agricultural carbon reduction. Digital infrastructure construction in diverse regions of China should be combined with agriculture’s status, fully harnessing the empowerment of the digital economy for green agricultural development and lowering agricultural carbon emissions from multiple perspectives.
5.3. Limitations and Future Directions
Although this paper has achieved certain research results, there are still limitations that cannot be ignored. Firstly, the data samples used in this study are limited to the provincial level. Despite their certain representativeness, the broad applicability of the results remains debatable. To delve deeper into the issues, future research should further refine the data granularity and focus on analysis at the municipal or even county level. Secondly, this study neglects the influence of factors such as agriculture and forestry, policy recommendations, and others on agricultural carbon emissions. In future research, we will discuss the factors that influence agricultural carbon emissions.
6. Conclusions
This study employs traditional panel models, panel threshold models, and spatial panel models to conduct a rigorous empirical assessment of the mechanism between the digital economy and agricultural carbon emissions based on provincial-level data in China. The research findings are summarized as follows: (1) The findings of the benchmark regression show that there is a negative relationship between carbon emissions from agriculture and the digital economy. Furthermore, the digital economy continues to show promise in reducing agricultural carbon emissions after passing robustness and endogeneity tests. (2) Heterogeneity denotes notable variations in agricultural carbon emissions, which hinder the effect of the digital economy among various geographies and grain-producing areas. In the central and western regions of China and non-major grain-producing areas, the digital economy has a smaller inhibitory effect on agricultural carbon emissions. (3) It is shown by the threshold effect that technological innovation has a threshold effect and that the digital economy has a nonlinear influence on agricultural carbon emissions. The overall trend shows an “inverted U-shaped” characteristic, with an initial increase followed by a decrease. (4) According to the findings of the geographical effect regression, the digital economy not only reduces agricultural carbon emissions locally but also brings benefits for carbon reduction to neighboring provinces.
Author Contributions
J.L.: Funding acquisition and writing—review and editing. X.S.: Writing—review and editing and methodology. Y.W.: Software and visualization. S.Z.: methodology and writing—original draft. All authors have read and agreed to the published version of the manuscript.
Funding
This research was funded by the Natural Science Foundation Program of Shandong Province, China (Grant No. ZR2020MG044 and Grant No. ZR2022MG042). Research on the Intervention Effect and Driving Mechanism of Ecological Economic Zone Construction on High Quality Development of the Yellow River Delta (ZR2022MG042). Research on the Intervention Effect and Driving Mechanism of China’s Port Integration Reform on Port Ecological Civilization Construction (ZR2020MG044).
Institutional Review Board Statement
Not applicable.
Informed Consent Statement
Not applicable.
Data Availability Statement
The data for this analysis are from publically available sources.
Acknowledgments
The editors and anonymous reviewers are sincerely appreciated for their insightful and constructive feedback, which helped the writers substantially improve the final version of the manuscript.
Conflicts of Interest
The authors declare no conflicts of interest.
References
- Pan, Y.; Feng, D. Dynamic evolution and driving factors of new energy development: Fresh evidence from China. Technol. Forecast. Soc. Chang. 2022, 176, 121475. [Google Scholar] [CrossRef]
- Gabric, A.J. The Climate Change Crisis: A Review of Its Causes and Possible Responses. Atmosphere 2023, 14, 1081. [Google Scholar] [CrossRef]
- Zhang, L.; Pang, J.; Chen, X.; Lu, Z. Carbon emissions, energy consumption and economic growth: Evidence from the agricultural sector of China’s main grain-producing areas. Sci. Total Environ. 2019, 665, 1017–1025. [Google Scholar] [CrossRef]
- Bai, J.; Liu, J.; Ma, L.; Zhang, W. The Impact of Farmland Management Scale on Carbon Emissions. Land 2023, 12, 1760. [Google Scholar] [CrossRef]
- Cai, Y.; Xu, J.; Ahmad, P.; Anwar, A. What drives carbon emissions in the long-run? The role of renewable energy and agriculture in achieving the sustainable development goals. Econ. Res.-Ekon. Istraživanja 2022, 35, 4603–4624. [Google Scholar] [CrossRef]
- Wang, L.; Vo, X.V.; Shahbaz, M.; Ak, A. Globalization and carbon emissions: Is there any role of agriculture value-added, financial development, and natural resource rent in the aftermath of COP21? J. Environ. Manag. 2020, 268, 110712. [Google Scholar] [CrossRef]
- Bruckner, B.; Hubacek, K.; Shan, Y.; Zhong, H.; Feng, K. Impacts of poverty alleviation on national and global carbon emissions. Nat. Sustain. 2022, 5, 311–320. [Google Scholar] [CrossRef]
- Shi, H.; Chang, M. How does agricultural industrial structure upgrading affect agricultural carbon emissions? Threshold effects analysis for China. Environ. Sci. Pollut. Res. 2023, 30, 52943–52957. [Google Scholar] [CrossRef]
- Yu, Y.; Jiang, T.; Li, S.; Li, X.; Gao, D. Energy-related CO2 emissions and structural emissions’ reduction in China’s agriculture: An input–output perspective. J. Clean. Prod. 2020, 276, 124169. [Google Scholar] [CrossRef]
- Qiu, Z.; Zhou, Y. Development of digital economy and regional total factor productivity: An analysis based on national big data comprehensive pilot zone. J. Financ. Econ. 2021, 47, 4–17. [Google Scholar]
- Zhao, T.; Zhang, Z.; Liang, S.K. Digital economy, entrepreneurship, and high-quality economic development: Empirical evidence from urban China. Manag. World 2020, 36, 65–76. [Google Scholar] [CrossRef]
- Li, Z.; Liu, Y. Research on the spatial distribution pattern and influencing factors of digital economy development in China. IEEE Access 2021, 9, 63094–63106. [Google Scholar] [CrossRef]
- Wang, Y.; Li, L. Digital economy, industrial structure upgrading, and residents’ consumption: Empirical evidence from prefecture-level cities in China. Int. Rev. Econ. Financ. 2024, 92, 1045–1058. [Google Scholar] [CrossRef]
- Zhao, L.; Rao, X.; Lin, Q. Study of the impact of digitization on the carbon emission intensity of agricultural production in China. Sci. Total Environ. 2023, 903, 166544. [Google Scholar] [CrossRef]
- Zhao, X.; Ma, X.; Chen, B.; Shang, Y.; Song, M. Challenges toward carbon neutrality in China: Strategies and countermeasures. Resour. Conserv. Recycl. 2022, 176, 105959. [Google Scholar] [CrossRef]
- Zheng, J.; Wang, X. Can mobile information communication technologies (ICTs) promote the development of renewables?-evidence from seven countries. Energy Policy 2021, 149, 112041. [Google Scholar] [CrossRef]
- Wang, W.; Mei, T. Research on the Effect of Digital Economy Development on the Carbon Emission Intensity of Agriculture. Sustainability 2024, 16, 1457. [Google Scholar] [CrossRef]
- Yang, Y.; Cai, J. Carbon emissions and the development of digital economy: A perspective of spatial evolution. J. Environ. Prot. Ecol. 2022, 23, 409–416. [Google Scholar]
- Zhang, J.; Li, J.; Ye, D.; Sun, C. The impact of digital economy of resource-based city on carbon emissions trading by blockchain technology. Comput. Intell. Neurosci. 2022, 2022, 6366061. [Google Scholar] [CrossRef]
- Zhang, W.; Liu, X.; Wang, D.; Zhou, J. Digital economy and carbon emission performance: Evidence at China’s city level. Energy Policy 2022, 165, 112927. [Google Scholar] [CrossRef]
- Alam, I.; Lu, S.; Sarfraz, M.; Mohsin, M. The interplay of green technology and energy consumption: A study of China’s carbon neutrality and sustainable digital economy. Energies 2023, 16, 6184. [Google Scholar] [CrossRef]
- El Bilali, H.; Allahyari, M.S. Transition towards sustainability in agriculture and food systems: Role of information and communication technologies. Inf. Process. Agric. 2018, 5, 456–464. [Google Scholar] [CrossRef]
- Li, Y.; Yang, X.; Ran, Q.; Wu, H.; Irfan, M.; Ahmad, M. Energy structure, digital economy, and carbon emissions: Evidence from China. Environ. Sci. Pollut. Res. 2021, 28, 64606–64629. [Google Scholar] [CrossRef]
- Wu, R.; Hua, X.; Peng, L.; Liao, Y.; Yuan, Y. Nonlinear Effect of Digital Economy on Carbon Emission Intensity—Based on Dynamic Panel Threshold Model. Front. Environ. Sci. 2022, 109, 43177. [Google Scholar] [CrossRef]
- Niu, X.; Ma, Z.; Ma, W.; Yang, J.; Mao, T. The spatial spillover effects and equity of carbon emissions of digital economy in China. J. Clean. Prod. 2024, 434, 139885. [Google Scholar] [CrossRef]
- Cheng, Y.; Zhang, Y.; Wang, J.; Jiang, J. The impact of the urban digital economy on China’s carbon intensity: Spatial spillover and mediating effect. Resour. Conserv. Recycl. 2023, 189, 106762. [Google Scholar] [CrossRef]
- Chen, Y.; Li, M.; Su, K.; Li, X. Spatial-temporal characteristics of the driving factors of agricultural carbon emissions: Empirical evidence from Fujian, China. Energies 2019, 12, 3102. [Google Scholar] [CrossRef]
- Yang, X.; Jia, Z.; Yang, Z.; Yuan, X. The effects of technological factors on carbon emissions from various sectors in China—A spatial perspective. J. Clean. Prod. 2021, 301, 126949. [Google Scholar] [CrossRef]
- Yang, X.; Jia, Z.; Yang, Z.; Yuan, X. Analysis of regional agricultural carbon emission efficiency and influencing factors: Case study of Hubei Province in China. PLoS ONE 2022, 17, e266172. [Google Scholar]
- Huang, J.; Cai, X.; Huang, S.; Tian, S.; Lei, H. Technological factors and total factor productivity in China: Evidence based on a panel threshold model. China Econ. Rev. 2019, 54, 271–285. [Google Scholar] [CrossRef]
- Shen, X.; Lin, B.; Wu, W. R&D efforts, total factor productivity, and the energy intensity in China. Emerg. Mark. Financ. Trade 2019, 55, 2566–2588. [Google Scholar]
- Gao, X.; Liu, N.; Hua, Y. Environmental Protection Tax Law on the synergy of pollution reduction and carbon reduction in China: Evidence from a panel data of 107 cities. Sustain. Prod. Consum. 2022, 33, 425–437. [Google Scholar] [CrossRef]
- Berhanu, Y.; Angassa, A.; Aune, J.B. A system analysis to assess the effect of low-cost agricultural technologies on productivity, income and GHG emissions in mixed farming systems in southern Ethiopia. Agric. Syst. 2021, 187, 102988. [Google Scholar] [CrossRef]
- Jiang, Z.; Guo, Y.; Wang, Z. Digital twin to improve the virtual-real integration of industrial IoT. J. Ind. Inf. Integr. 2021, 22, 100196. [Google Scholar] [CrossRef]
- Jiang, Q.; Li, J.; Si, H.; Su, Y. The impact of the digital economy on agricultural green development: Evidence from China. Agriculture 2022, 12, 1107. [Google Scholar] [CrossRef]
- Weiss, M.; Jacob, F.; Duveiller, G. Remote sensing for agricultural applications: A meta-review. Remote Sens. Environ. 2020, 236, 111402. [Google Scholar] [CrossRef]
- Bai, L.; Guo, T.; Xu, W.; Liu, Y.; Kuang, M.; Jiang, L. Effects of digital economy on carbon emission intensity in Chinese cities: A life-cycle theory and the application of non-linear spatial panel smooth transition threshold model. Energy Policy 2023, 183, 113792. [Google Scholar] [CrossRef]
- Zhang, L.; Mu, R.; Zhan, Y.; Yu, J.; Liu, L.; Yu, Y.; Zhang, J. Digital economy, energy efficiency, and carbon emissions: Evidence from provincial panel data in China. Sci. Total Environ. 2022, 852, 158403. [Google Scholar] [CrossRef]
- Qi, Z.; You, Y. The Impact of the Rural Digital Economy on Agricultural Green Development and Its Mechanism: Empirical Evidence from China. Sustainability 2024, 16, 3594. [Google Scholar] [CrossRef]
- Li, Z.; Wang, J. The dynamic impact of digital economy on carbon emission reduction: Evidence city-level empirical data in China. J. Clean. Prod. 2022, 351, 131570. [Google Scholar] [CrossRef]
- Yilmaz, S.; Haynes, K.E.; Dinc, M. Geographic and network neighbors: Spillover effects of telecommunications infrastructure. J. Reg. Sci. 2002, 42, 339–360. [Google Scholar] [CrossRef]
- Zhong, R.; He, Q.; Qi, Y. Digital economy, agricultural technological progress, and agricultural carbon intensity: Evidence from China. Int. J. Environ. Res. Public Health 2022, 19, 6488. [Google Scholar] [CrossRef]
- Xu, N.; Zhao, D.; Zhang, W.; Liu, M.; Zhang, H. Does digital transformation promote agricultural carbon productivity in China? Land 2022, 11, 1966. [Google Scholar] [CrossRef]
- Wang, L.; Chen, L. Impacts of digital economy agglomeration on carbon emission: A two-tier stochastic frontier and spatial decomposition analysis of China. Sustain. Cities Soc. 2023, 95, 104624. [Google Scholar] [CrossRef]
- Li, G.; Li, X.; Huo, L. Digital economy, spatial spillover and industrial green innovation efficiency: Empirical evidence from China. Heliyon 2023, 9, e12875. [Google Scholar] [CrossRef]
- Hansen, B.E. Threshold effects in non-dynamic panels: Estimation, testing, and inference. J. Econom. 1999, 93, 345–368. [Google Scholar] [CrossRef]
- Yu, Y.; Deng, Y.R.; Chen, F.F. Impact of population aging and industrial structure on CO2 emissions and emissions trend prediction in China. Atmos. Pollut. Res. 2018, 9, 446–454. [Google Scholar] [CrossRef]
- Ding, B.; Zhao, Y.; Deng, J. Research on Measurement, Decoupling Characteristics, and Driving Factors of Carbon Emissions from Crop Farming in China. Chin. J. Agric. Resour. Reg. Plan. 2022, 43, 1–11. [Google Scholar]
- Yi, M.; Liu, Y.; Sheng, M.S.; Wen, L. Effects of digital economy on carbon emission reduction: New evidence from China. Energy Policy 2022, 171, 113271. [Google Scholar] [CrossRef]
- Yang, L.-G.; Gong, S.-H.; Wang, B.; Chao, Z.S. Human capital, technology progress and manufacturing upgrading. China Soft Sci. 2018, 1, 138–148. [Google Scholar]
- Guan, N.; Liu, L.; Dong, K.; Xie, M.; Du, Y. Agricultural mechanization, large-scale operation and agricultural carbon emissions. Cogent Food Agric. 2023, 9, 2238430. [Google Scholar] [CrossRef]
- Chang, H.; Ding, Q.; Zhao, W.; Hou, N.; Liu, W. The digital economy, industrial structure upgrading, and carbon emission intensity—Empirical evidence from China’s provinces. Energy Strategy Rev. 2023, 50, 101218. [Google Scholar] [CrossRef]
- Du, Y.; Liu, H.; Huang, H.; Liu, X. The carbon emission reduction effect of agricultural policy—Evidence from China. J. Clean. Prod. 2023, 406, 137005. [Google Scholar] [CrossRef]
- Huang, C.; Zhang, X.; Liu, K. Effects of human capital structural evolution on carbon emissions intensity in China: A dual perspective of spatial heterogeneity and nonlinear linkages. Renew. Sustain. Energy Rev. 2021, 135, 110258. [Google Scholar] [CrossRef]
- Ge, Y.; Xia, Y.; Wang, T. Digital economy, data resources and enterprise green technology innovation: Evidence from A-listed Chinese Firms. Resour. Policy 2024, 92, 105035. [Google Scholar] [CrossRef]
- Liu, Z.; Zhang, X.X.; Wei, W.G. The Impact of Rural Digital Economy Development on Agricultural Carbon Emissions: A Panel Data Analysis of 29 Provinces. J. Jiangsu Univ. (Soc. Sci. Ed.) 2023, 25, 20–32+47. [Google Scholar]
- Zheng, R.; Wu, G.; Cheng, Y.; Liu, H.; Wang, Y.; Wang, X. How does digitalization drive carbon emissions? The inverted U-shaped effect in China. Environ. Impact Assess. Rev. 2023, 102, 107203. [Google Scholar] [CrossRef]
- Zhou, X.; Li, G.; Wang, Q.; Zhou, D. U-shaped relationship between digitalization and low-carbon economy efficiency: Mediation and spillover effects. J. Clean. Prod. 2024, 458, 142535. [Google Scholar] [CrossRef]

Disclaimer/Publisher’s Note: The statements, opinions and data contained in all publications are solely those of the individual author(s) and contributor(s) and not of MDPI and/or the editor(s). MDPI and/or the editor(s) disclaim responsibility for any injury to people or property resulting from any ideas, methods, instructions or products referred to in the content. |
© 2024 by the authors. Licensee MDPI, Basel, Switzerland. This article is an open access article distributed under the terms and conditions of the Creative Commons Attribution (CC BY) license (https://creativecommons.org/licenses/by/4.0/).