Article

An Assessment of Urban Residential Environment Quality Based on Multi-Source Geospatial Data: A Case Study of Beijing, China

College of Geoscience and Surveying Engineering, China University of Mining and Technology (Beijing), Beijing 100083, China
*
Author to whom correspondence should be addressed.
Land 2024, 13(6), 823; https://doi.org/10.3390/land13060823
Submission received: 22 April 2024 / Revised: 31 May 2024 / Accepted: 5 June 2024 / Published: 7 June 2024
(This article belongs to the Special Issue A Livable City: Rational Land Use and Sustainable Urban Space)

Abstract

:
Assessing the urban residential environment quality (REQ) is essential for advancing sustainable urban development and enhancing urban residents’ living standards. Traditional REQ assessments rely on statistical data, prone to delays and lacking holistic insight. This study takes residential blocks as the analysis units and is conducted within the area of the Sixth Ring Road in Beijing. It synthesizes multi-source geospatial data to devise a comprehensive framework for assessing urban REQ, incorporating facets of environmental health and comfort, housing comfort, transportation convenience, city security, and life convenience. Utilizing the principle of minimal relative informational entropy, this study integrates the Analytic Hierarchy Process (AHP) with the entropy method to determine the weight of each evaluative criterion. Subsequently, a linear weighting technique is employed to ascertain the scores for each evaluative criterion, thus facilitating a detailed examination of the REQ. Finally, the research probes into the complex interrelation between the assessed REQ and the city’s Gross Domestic Product (GDP) and carbon emissions across varying scales. Findings reveal that (1) the overall REQ within Beijing’s Sixth Ring Road is superior at the center and diminishes towards the periphery. (2) The dispersion of environmental health and comfort and city security metrics is relatively uniform, showing minor variations; however, a marked disparity is observed in the distribution of housing comfort metrics. (3) Regions characterized by higher GDP tend to demonstrate relatively higher levels of the REQ. Conversely, areas boasting higher-quality urban REQ are more inclined to exhibit increased levels of carbon emissions.

1. Introduction

With the continuous development of society and the acceleration of urbanization, issues such as housing shortage, population explosion, and traffic congestion significantly impact residential environment quality (REQ) [1] and increasingly making urban livability a focal point of concern [2]. Evaluating urban REQ via a scientific system of indicators can offer valuable insights for urban planning and construction, enhancing the quality of urban living and residents’ well-being, thereby fostering sustainable urban development, furthermore, evaluating the performance of smart cities [3].
Traditionally, the acquisition of data for urban REQ evaluation has relied on specialized statistical data, surveys, interviews, and basic geographical information [4], characterized by slow updates and latency. However, with the advancements in information technology, the advantages of big data and open data have become increasingly apparent, gradually becoming mainstream in urban research [5,6]. Diversified new data sources provide more convenient and reliable information for a more refined evaluation of REQ. These data can be utilized for real-time monitoring and assessment of urban environmental aspects such as air quality [7], noise levels [8], and traffic conditions [9], offering comprehensive support for urban planning and environmental protection.
Existing research on urban REQ evaluation spans various scales, including global, national, provincial, regional, city, community, and building levels [10]. Zanella et al. [11] developed a tool for assessing the livability of cities based on two components (human well-being and environmental impact), analyzing the livability of 120 European cities. Based on a remote sensing perspective, Huang and Liu assessed 101,630 communities in China’s 42 major cities [12]. Xiao et al. [13] focused on the Sustainable Development Goals (SDGs) to analyze the spatiotemporal changes and influencing factors of urban livability in the dry regions of the Loess Plateau. Zhang et al. [14] utilized the TOPSIS technique to evaluate the livability of 1242 communities in the Haidian District of Beijing. Juntti et al. [15] applied and expanded the ecosystem service-based approach to understanding urban environmental quality. They concentrated on the benefits of urban greenspace to residents, while Xiong and Zhang focused on the urban thermal environment [16]. Regarding the construction of evaluation indicator systems, different scholars have emphasized various subdivisions. For instance, a study in Changchun, Jilin Province, China, developed an urban livability index from fifteen land use indicators using a principal component analysis-based approach [17]. Zhan et al. [10] proposed a livability satisfaction evaluation indicator system encompassing six dimensions: city security, the convenience of public facilities, the natural environment, the socio-cultural environment, transportation convenience, and environmental health. Wang et al. [18] developed indicators based on the ecological environment superiority, economic development vitality, and convenience of public services to explore the livability of the REQ in Zhejiang Province. Overall, there is a lack of a comprehensive and detailed set of indicators for evaluating the REQ, and existing studies suffer from issues such as content overlap in the selection of indicators. Furthermore, research on the evaluation of urban REQ at the community scale, which is the primary area of urban residents’ lives, remains limited.
Another key issue in REQ evaluation is the selection of indicator weights. Multi-indicator comprehensive evaluation methods are mainly divided into subjective and objective weighting methods. Currently, most of the work in REQ evaluation relies on one particular approach. Combining subjective and objective weighting methods can reduce the influence of subjective human experience while compensating for the imperfections of objectivity, thus more accurately determining indicator weights. Lazauskaitė et al. [19] demonstrated the importance of combining objective and subjective evaluations in practical applications via case studies, but there is relatively less research on combined subjective and objective weighting methods for REQ evaluation.
According to surveys, residents of cities with higher economic levels exhibit greater social satisfaction [20], and the Gross Domestic Product (GDP) is an important indicator reflecting economic strength. Resident satisfaction, to some extent, mirrors urban livability; therefore, exploring the impact of GDP on REQ can shed light on the correlation and degree of association between economic levels and livability. Against the backdrop of multiple countries setting carbon neutrality goals, achieving low-carbon sustainable development in cities becomes a noteworthy issue. Some studies indicate that changes in the natural geographic landscape and socio-economic factors accompanying urban construction processes affect urban carbon emissions [21,22]. Xie et al.’s research points out that the urbanization process in China has led to an increase in residential energy consumption [23]. In this context, analyzing the impact of REQ on carbon emissions is pertinent for urban construction [24,25]. Additionally, due to the Modifiable Areal Unit Problem (MAUP), different scale research units can affect the correlation between variables [26]. Thus, researching the relationship between the levels of REQ and GDP, as well as its impact on carbon emissions in different scales, holds significant importance for the construction of livable cities.
In summary, the open access to multi-source geospatial data offers new perspectives and methods for the evaluation of urban REQ. However, current research faces several issues: (1) a lower focus on micro-scales, with more attention given to large-scale analyses; (2) the constructed indicator systems lack systematization and comprehensiveness; (3) analysis methods present certain disadvantages, failing to balance the subjectivity and objectivity of evaluations, and the lack of an integrated analysis method that combines both subjective and objective perspectives is a notable gap. Furthermore, the impact of GDP on the REQ and the effect of REQ on carbon emissions are issues of concern in the construction of livable cities. Understanding the correlation between these factors can provide valuable feedback during the advancement of livable city construction efforts.
This study focuses on a micro-scale analysis, using residential blocks within Beijing’s Sixth Ring Road as the research units. By leveraging multi-source geospatial data, the REQ was evaluated under a novel indicator system and a combination of subjective and objective methods. Additionally, the study explored the correlations between the levels of REQ and GDP, as well as carbon emissions. Specifically, the main objectives of this study include (1) the construction of a multidimensional REQ evaluation indicator system to comprehensively assess the quality of residential environments; (2) leveraging open-access geospatial big data and combining subjective and objective evaluation methods to evaluate REQ based on residential block unit; (3) analyzing the multi-scale correlation between REQ, GDP, and carbon emissions to determine the extent of their impact. Via the aforementioned research, new insights are provided for the construction of livable cities.

2. Study Area

Beijing, with a total area of 16,412 square kilometers and a permanent population of 21.843 million in 2022, boasts an urbanization rate of 87.6% for its permanent residents. The city’s urban planning and construction hold significant importance for China’s national image and serve as a model for other cities, contributing valuable insights to the acceleration of livable city construction. Figure 1a showcases the location of the Sixth Ring Road in Beijing, China, and Asia, where the population is most concentrated and facilities are relatively well developed, encompassing several administrative districts and best reflecting the characteristics of Beijing’s urban residential environment. Figure 1b shows the image of the study area and the typical communities selected, and Figure 1c presents residential block data from the EULUC-China dataset [27]. Figure 1(1)–(3) display images of these selected communities. This study selects residential blocks within the Sixth Ring Road as the units of analysis for evaluation and analysis.

3. Methods

3.1. Overview of the Assessment Process

The assessment of REQ in this study combines subjective and objective evaluations, as illustrated by the flowchart framework depicted in Figure 2.
Subsequently, the specific assessment process will be demonstrated.

3.2. Construction of the REQ Assessment System

Previous studies have indicated that the assessment indicator system for urban REQ should reflect the city’s ecological livability, health and comfort, the convenience of transportation, safety resilience, and innovative vitality, among other factors [28]. Other studies have indicated that commute satisfaction and housing satisfaction have a strong positive correlation with residents’ subjective well-being and urban livability, making them suitable indicators for assessing urban livability [29]. The construction of the urban REQ assessment system should combine research on the city’s own economic, ecological, and cultural development characteristics. The selected evaluation indicators should be representative, quantifiable, comparable, etc., capable of fully reflecting the REQ characteristics of the study area. By integrating China’s requirements for livable urban construction and existing research on urban livability indicators [10,11,13,14,18,20,28,30,31], the REQ assessment framework for Beijing was determined, as shown in Table 1, including five aspects: environmental health and comfort, housing comfort, transportation convenience, city security, and life convenience. These 5 primary indicators consider multiple perspectives, encompassing both natural conditions and urbanization impacts, covering factors such as green space, housing conditions, transportation convenience, and public service facilities.
The environmental health and comfort aspect primarily encompasses the ecological environment and urban greening, where the ecological environment is reflected via air quality status, noise index, and comfortability of temperature, indicating the healthiness of the REQ. Urban greening, indicated by the street greening rate and the nearest distance from residential areas to parks, enhances REQ’s comfort. Urban green space coverage can significantly enhance residents’ happiness [32]. Parks and water bodies, as natural landscapes within cities, provide residents with more experience for relaxation and leisure. Given Beijing’s distinct seasons the city’s large area, diverse terrain, and varied land use conditions, along with the urban heat island effect, create substantial differences in perceived temperature across different regions. Therefore, considering temperature comfort is essential. The comfortability of temperature in January and July is comprehensively assessed to gauge climatic suitability [33].
Housing comfort is chiefly indicated by housing affordability and per capita resource availability, measured by the housing-price-to-income ratio and population density. A significant gap between housing prices and income can impose economic burdens on residents, while high population density may lead to crowding and a decrease in per capita resources, diminishing residents’ satisfaction. These factors greatly influence the livability of housing conditions and are closely related to daily life.
Transportation convenience includes road network density, nearest distance to subway stations, and nearest distance to bus stations. Road network density reflects the ease of vehicular travel for residents, while the proximity to subway and bus stations indicates the convenience of using public transportation. Given Beijing’s large area, substantial population, high mobility, and significant commuting demands, the convenience of vehicular travel and public transportation is particularly important.
City security is primarily indicated by the nearest distance from residential areas to fire stations, police stations, and emergency shelters. Generally, Beijing has high overall security, and potential emergencies are managed within the service areas of fire stations, police stations, and emergency shelters. Thus, these three secondary indicators are included.
The aspect of life convenience, encompassing employment, education, medical services, and shopping accessibilities, mirrors the completeness of various public service facilities. This is primarily assessed via company distribution density, nearest distances to kindergartens, primary schools, middle schools, community hospitals, general hospitals, tertiary hospitals, and so on, indicating the ease with which residents can access these facilities. The 15-min living circle is a crucial theoretical framework for evaluating the distribution of public service facilities [34]. This concept typically considers a 1 km radius around residential areas as the primary activity range. Therefore, the number of restaurants within this 1 km radius is selected as a measure of the distribution of dining services.

3.3. Data Acquisition and Indicator Calculation

To facilitate the calculation of the aforementioned indicators, this study extensively leverages multi-source geospatial data for data collection and preprocessing. As indicated in Table 2, the research data primarily consist of open social data and remote sensing images reflecting the ground conditions of the study area. The urban land use type data are derived from the EULUC-China dataset [27]. Points of Interest (POI) data were acquired via the Amap Application Programming Interface (API) to ensure comprehensive urban analysis (https://lbs.amap.com/api/webservice/guide/api/Search, accessed on 9 June 2023). Air quality monitoring data for the year 2020 were acquired based on the analysis results of the Atmospheric Composition Analysis Group at Washington University in St. Louis [35]. Temperature data were sourced from the ERA5-Land [36] dataset published in 2022 by the European Union and the European Centre for Medium-Range Weather Forecasts, among other organizations. Road network and water body data were obtained from OpenStreetMap (https://www.openstreetmap.org/, accessed on 3 March 2023), collected in 2019. Urban green space data (NDVI values) were calculated based on the 2022 Sentinel-2 satellite data using the Google Earth Engine platform. Population data were retrieved from the WorldPop [37]. Housing price data were obtained from mainstream real estate platforms and processed into raster data. GDP data were derived from calculations generated by Xu et al. [38] based on the GWSE model. Carbon emissions data were sourced from the Open Data Inventory for Anthropogenic Carbon dioxide (ODIAC) published by Tomohiro Oda et al. [39].
Among these datasets, certain types such as POI, road network data, urban green space data, water body data, and housing price data can be obtained via real-time data scraping. Conversely, other types of data that are not available or hard to obtain in real time—such as land use types, air pollution levels, temperature data, population data, GDP data, and carbon emissions data—are sourced from the latest publicly available and validated datasets a comprehensive comparative analysis.
This study uses residential blocks delineated by the EULUC-China dataset as the research units (as shown in Figure 1). It is necessary to tailor the processing of each primary indicator to the data characteristics and the geographical features of Beijing, and to standardize data of different formats and resolutions to the residential block units, ensuring the rational normalization of data to the study units.
The NetCDF files were subsequently converted to the more commonly used TIFF format for further analysis. Raster data were utilized to perform zonal statistics of individual residential blocks, and the statistical results were further processed for subsequent calculations.
(1)
For the environmental health and comfort primary indicator, air pollution data are first converted into a grid image with a resolution of 0.01° × 0.01°. Given that some residential blocks are relatively small, making it challenging for the grid images to adequately cover these fine-scale plots, the study employs the Kriging interpolation method for further processing. The interpolated data are then mapped onto every residential block within the study area using zonal statistics. The noise index proximate to residential blocks, predominantly influenced by main roads, is assessed by the shortest distance to these roads. This is measured as the shortest distance between point vector features (the central points of residential blocks) and polyline vector features (the road network). The closer a residential block is to a main road, the higher its noise impact. The street greening rate calculates the NDVI values of the areas of interest using Sentinel-2 images from the Google Earth Engine cloud platform, and then the results were downloaded as TIFF files with a precision of 10 m × 10 m. Higher rates indicate better ecological environments in residential areas. The comfortability of temperatures in July and January is assessed by converting original data into grid data and then calculating the average temperature of those months.
(2)
In measuring housing comfort indicators, population density is defined as the ratio of population count grid data to grid area. The housing-price-to-income ratio is derived by dividing the average housing price per unit by the area’s GDP.
(3)
For indicators reflecting transportation convenience, road network density is calculated as the ratio of the length of the area’s road network to the area’s size. The nearest distance to subway and bus stations is determined by extracting the central points of residential blocks and POI points. Subsequently, the Amap API is employed to accurately calculate network distances, specifically the shortest distance between two different types of points.
(4)
In reflecting city security indicators, the nearest distances to fire stations, police stations, and emergency shelters are accurately obtained via Amap API.
(5)
For indicators reflecting life convenience, the distance to commercial centers and the company distribution density are analyzed using kernel density analysis of relevant POI data points. After conducting kernel density analysis on commercial-related POI data, the centers of Beijing’s business districts can be identified from high-density areas, and this serves as a basis for calculating the nearest distance from residential blocks to these business districts. The count of nearby restaurants is determined by tallying establishments within a 1 km buffer zone around the residential block. The nearest distances to various facilities are likewise measured by fetching network distances via the Amap API, with shorter distances indicating better convenience.

3.4. Determination of Indicator Weights

The comprehensive assessment of urban REQ necessitates the integration of multiple factors. The variation in the weights of different primary indicators significantly influences the overall urban REQ. To ascertain these weights with greater accuracy, this study employs a combined subjective and objective approach to determine the weights of the indicators within the urban REQ assessment system [41]. Subjective analysis utilizes the Analytic Hierarchy Process (AHP), while objective analysis is conducted using the entropy method. The final weights are determined by integrating the outcomes calculated from both methods, ensuring a balanced consideration of subjective and objective insights.
(1)
Analytic Hierarchy Process
The AHP integrates qualitative and quantitative analyses to determine the weights of objectives, and it is extensively applied in management and decision-making domains [42]. This methodology decomposes complex issues into hierarchical levels, constructing a structured framework. This study engaged multiple experts to assign subjective values to the significance of primary and secondary indicators, thereby establishing judgment matrices and conducting consistency checks to derive the weights of each indicator.
First, judgment matrices are constructed and the geometric mean of matrix elements are calculated row-wise, followed by the extraction of the n-th root to normalize w i into weight vectors:
w i = j = 1 n a i j n
w j = w i j = 1 n w j
Second, the largest eigenvalue ( λ m a x ) is calculated according to the formula A w = λ m a x w :
λ m a x = 1 n i = 1 n ( A w ) i w i
Third, the consistency index (C.I.) is constructed, and the consistency ratio (C.R.) is calculated:
C . I . = λ m a x n n 1
C . R . = C . I . R . I .
If the C.R. is less than or equal to 0.1, it indicates that the judgment matrix has passed the consistency test. Conversely, if the C.R. exceeds this threshold, it suggests that the judgment matrix does not meet the consistency criteria, necessitating adjustments or a complete reconstruction of the judgment matrix until it aligns with the consistency standards. Following the successful passage of all consistency checks, the weights obtained via subjective methods are recorded.
(2)
Entropy Method
The entropy method objectively assigns weights by quantifying and integrating information from evaluation units, utilizing information entropy to determine weights based on relative variations of indicators for decision analysis [43,44]. The normalization processing of indicator data includes forward indicator normalization and reverse indicator normalization:
p i j = x i j M i n { x i j } M a x { x i j } M i n { x i j }
p i j = M i n { x i j } x i j M a x { x i j } M i n { x i j }
Normalization processing using formulas to make data dimensionless:
y i j = p i j i = 1 m p i j i = 1 ,   2 , , m ; j = 1 ,   2 , , n
Then, computing the information entropy of the j-th indicator:
e j = 1 l n n j = 1 n y i j l n y i j
Finally, computing the weight of the j-th indicator:
w j = 1 e j n j = 1 n e j
(3)
Calculation of Composite Weights
After deriving weights from both methods, this study applies the principle of minimum relative information entropy to determine composite weights of indicators [45], thus minimizing subjective bias and compensating for the limitations of purely objective methods in terms of flexibility, subjective perception, and life experience. The formula is as follows:
W j = w j w j 0.5 j = 1 n ( w j w j ) 0.5
where W j represents the weight of the j-th indicator. w j and w j represent the weight of the j-th indicator derived from the AHP and the Entropy method, respectively.

3.5. Calculation of the REQ Assessment Indicators

This study employs the linear weighting method to calculate the final REQ score. By multiplying the weights calculated using the AHP–Entropy method with the normalized indicators and then performing summation, the comprehensive score of the REQ and scores for each subsystem can be obtained. The calculation formula is as follows:
z = j = 1 n W j x j
where z represents the REQ score of the residential area, W j represents the weight of the j-th indicator, and x j represents the value of the j-th indicator.

3.6. Pearson Correlation Analysis

In this study, data undergo an initial transformation to conform to a normal distribution, ensuring the applicability of parametric statistical methods. Subsequently, the Pearson correlation analysis method is employed to calculate the correlation coefficients between the REQ and both GDP and carbon emissions [46]. The Pearson correlation coefficient is utilized to measure the linear relationship between variables. In statistics, the Pearson correlation coefficient assesses the strength of the relationship between two variables based on their covariance. In this study, it is used to gauge the correlation between the assessment results of REQ and GDP as well as carbon emissions. The coefficient’s value, a real number between −1 and 1, signifies the correlation’s strength and direction.
r = i = 1 n X i X ¯ Y i Y ¯ i = 1 n X i X ¯ 2 i = 1 n Y i Y ¯ 2
where r represents the correlation coefficient between variables X and Y. r > 0 indicates a positive correlation between X and Y, r < 0 indicates a negative correlation, and the closer r is to ±1, the stronger the correlation. An r value of 0 suggests a lack of linear correlation between the variables, indicating their independence.

4. Results Analysis

4.1. Weight Calculation Results

The combined weights calculated via the AHP–Entropy method reveal significant influencing factors within the primary indicators of environmental health and comfort, housing comfort, transportation convenience, city security, and life convenience (Table 3).
(1)
Environmental health and comfort: The noise index, street greening rate, and comfortability of temperature in July emerge as the most critical factors within this primary indicator. This aligns with Beijing’s ecological conditions characterized by hot and dry summers, heavy traffic volumes, and it reflects the importance of the greening rate.
(2)
Housing comfort: Within housing comfort indicators, population density is notably the predominant factor, reflecting Beijing’s dense population and high plot ratios.
(3)
Transportation convenience: Road network density and nearest distance to bus stations emerge as the most crucial factors within this primary indicator. Nearest distance to subway stations follows closely, reflecting Beijing’s characteristics with high traffic congestion, long commuting times, and extensive coverage of public transportation.
(4)
City security: Nearest distance to fire stations and police stations ranks as the most critical factor within this primary indicator. The impact of nearest distance to emergency shelters follows closely, consistent with Beijing’s low incidence of natural disasters, with emergencies typically handled by fire and police stations, yet it remains significant for city security.
(5)
Life convenience: Company distribution density and nearest distance to medical facilities emerge as the most important influencing factors within this primary indicator. This mirrors Beijing’s commuting challenges due to long travel times, the separation of work and residential areas, and the concentrated distribution and uneven allocation of medical resources.

4.2. Overall Evaluation of REQ in Beijing

The spatial distribution density of various public facilities and related services in Beijing exhibits certain regional disparities. Figure 3 illustrates that the REQ within Sixth Ring Road of Beijing is higher in central areas and diminishes towards the periphery. Additionally, regions along the “cross-shaped” belt formed around the central city center also exhibit relatively high scores.
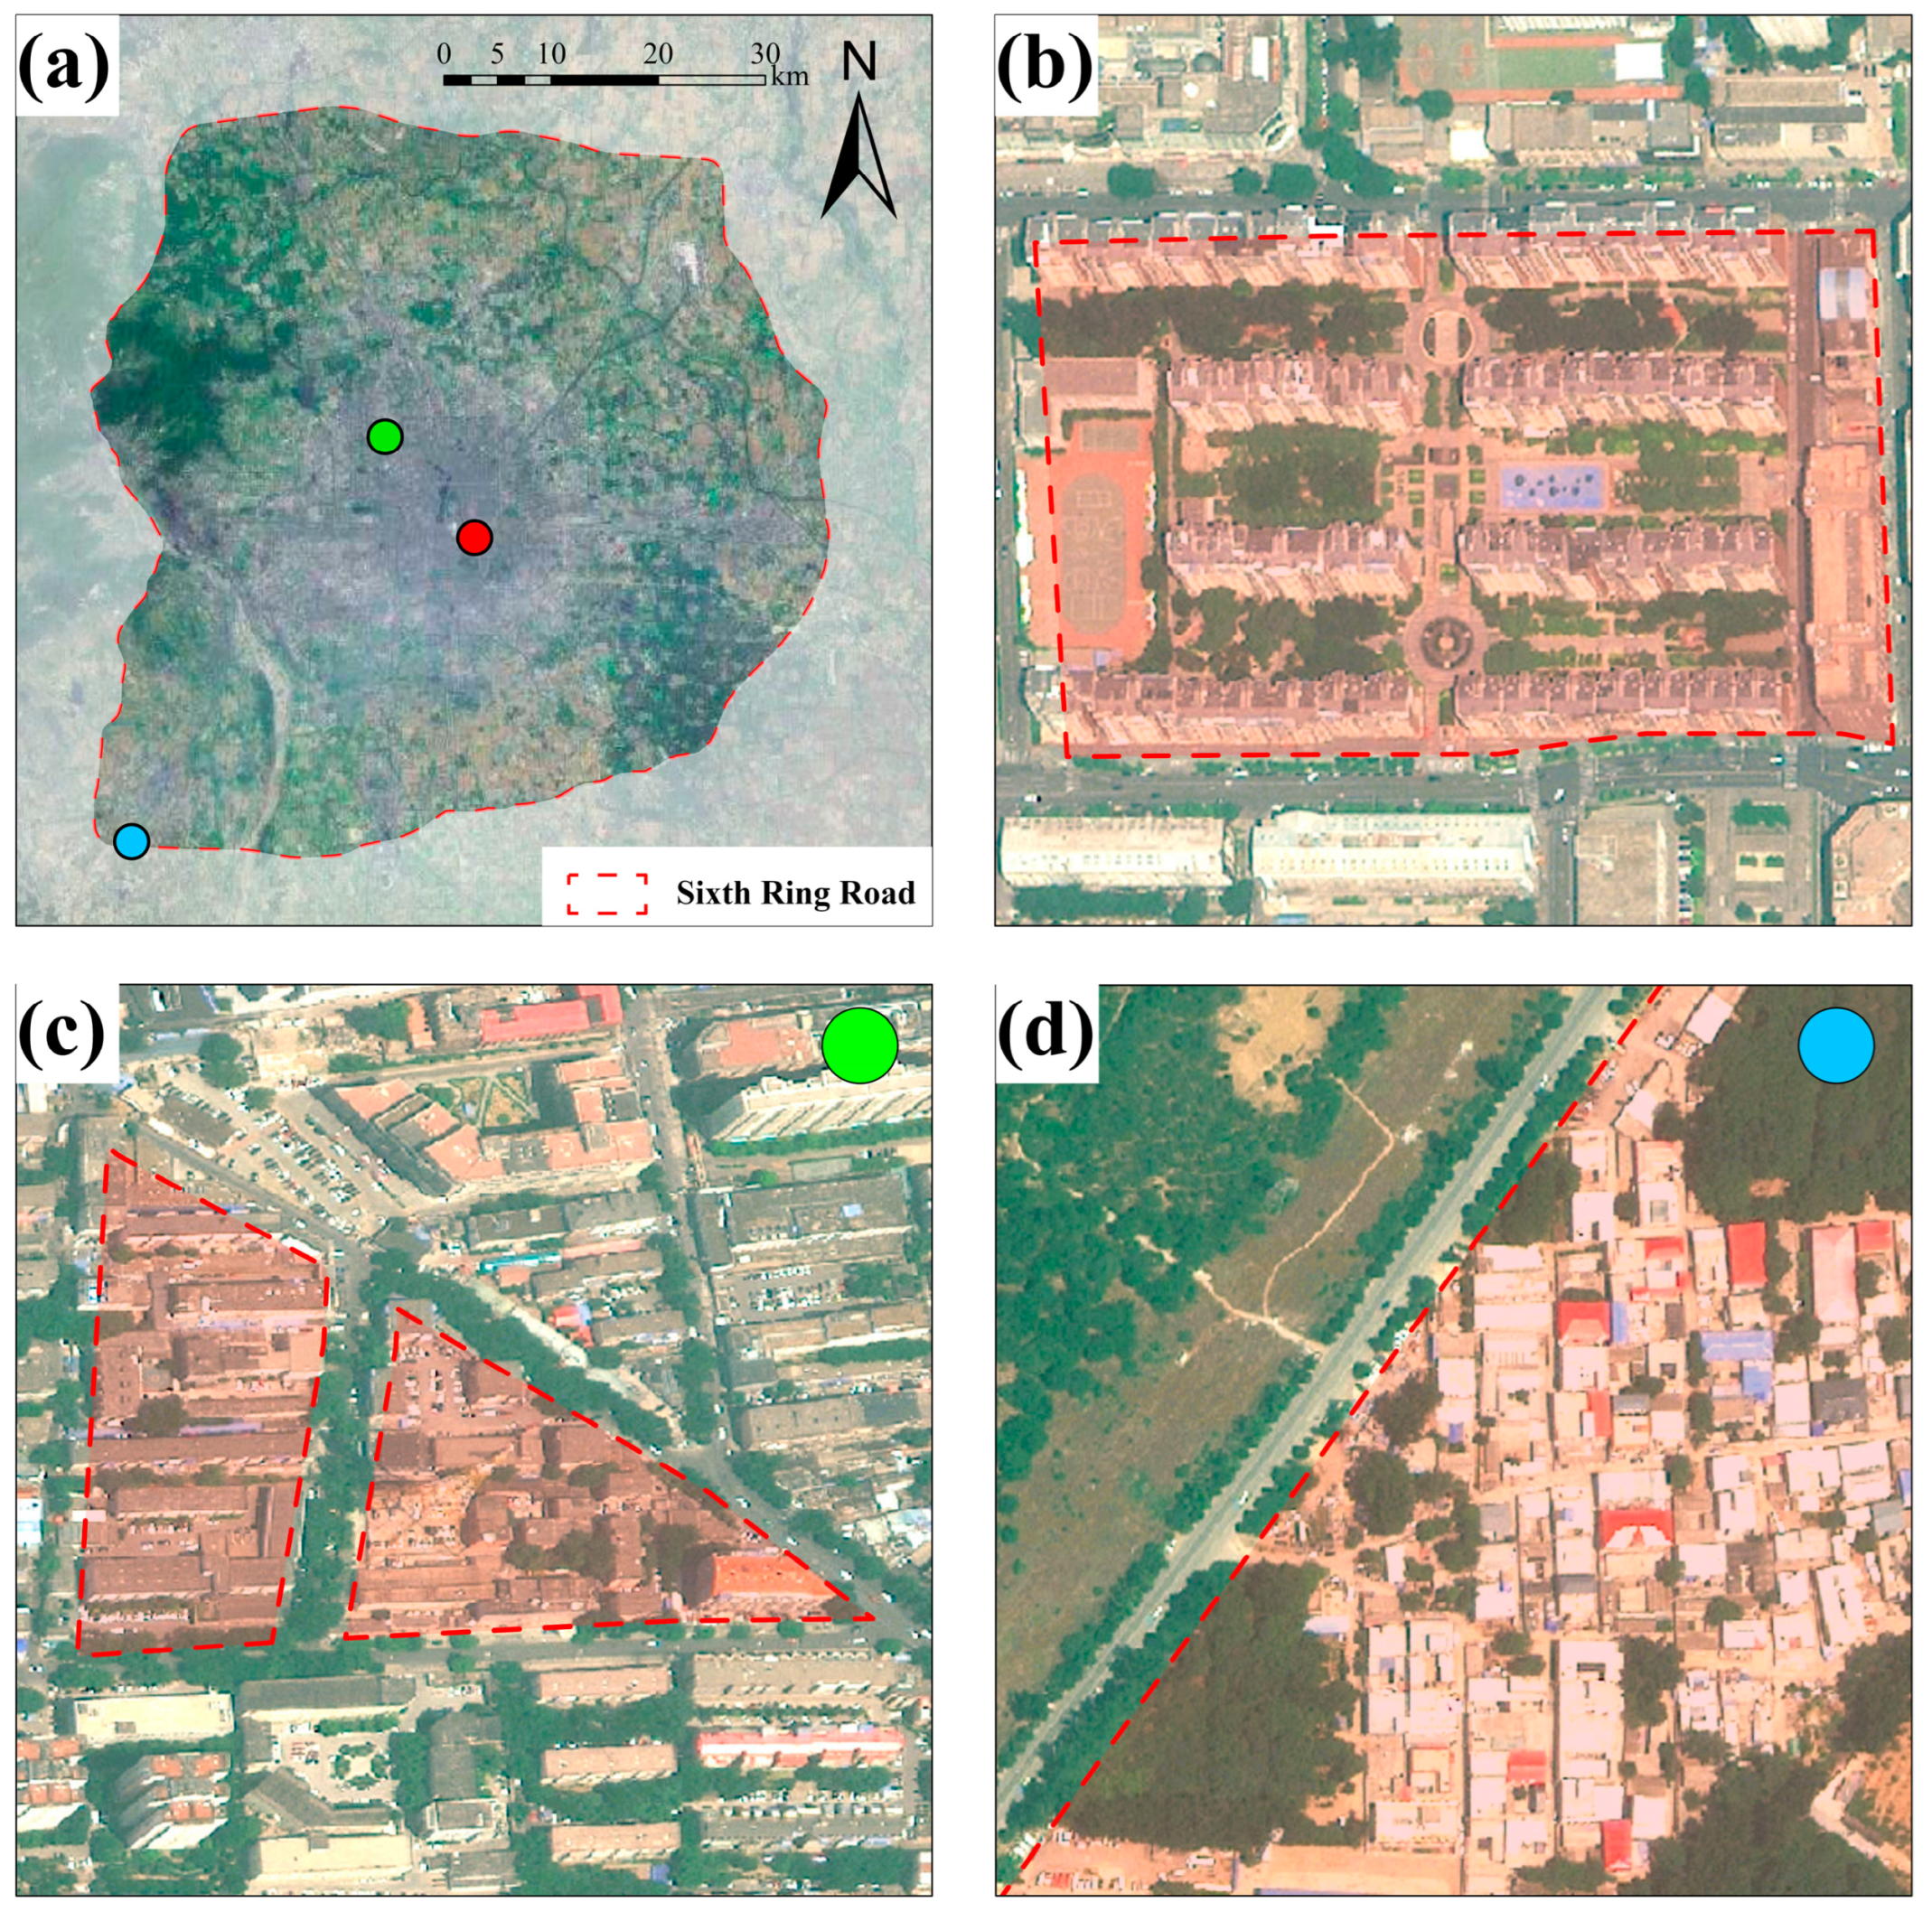
Figure 4 presents typical residential blocks with high, medium, and low levels of REQ. In Figure 4a, the highlighted area represents a high-REQ residential block characterized by orderly and rational building layouts equipped with sports facilities and pools, and high green coverage. The surrounding area features convenient transportation, a high degree of urbanization, and strong life convenience. In Figure 4b, the highlighted area shows a residential block with a medium REQ level. The building layout is somewhat disorganized, but the greenery is well maintained, and the surrounding infrastructure, including transportation facilities, is well developed, offering considerable convenience. In Figure 4c, the highlighted area represents a low-REQ residential block located in a peripheral area within the Sixth Ring Road. This region has densely and chaotically arranged buildings, surrounded by extensive natural woodlands with a good ecological environment. However, it suffers from poor transportation connectivity, a lower degree of urbanization, and underdeveloped facilities.
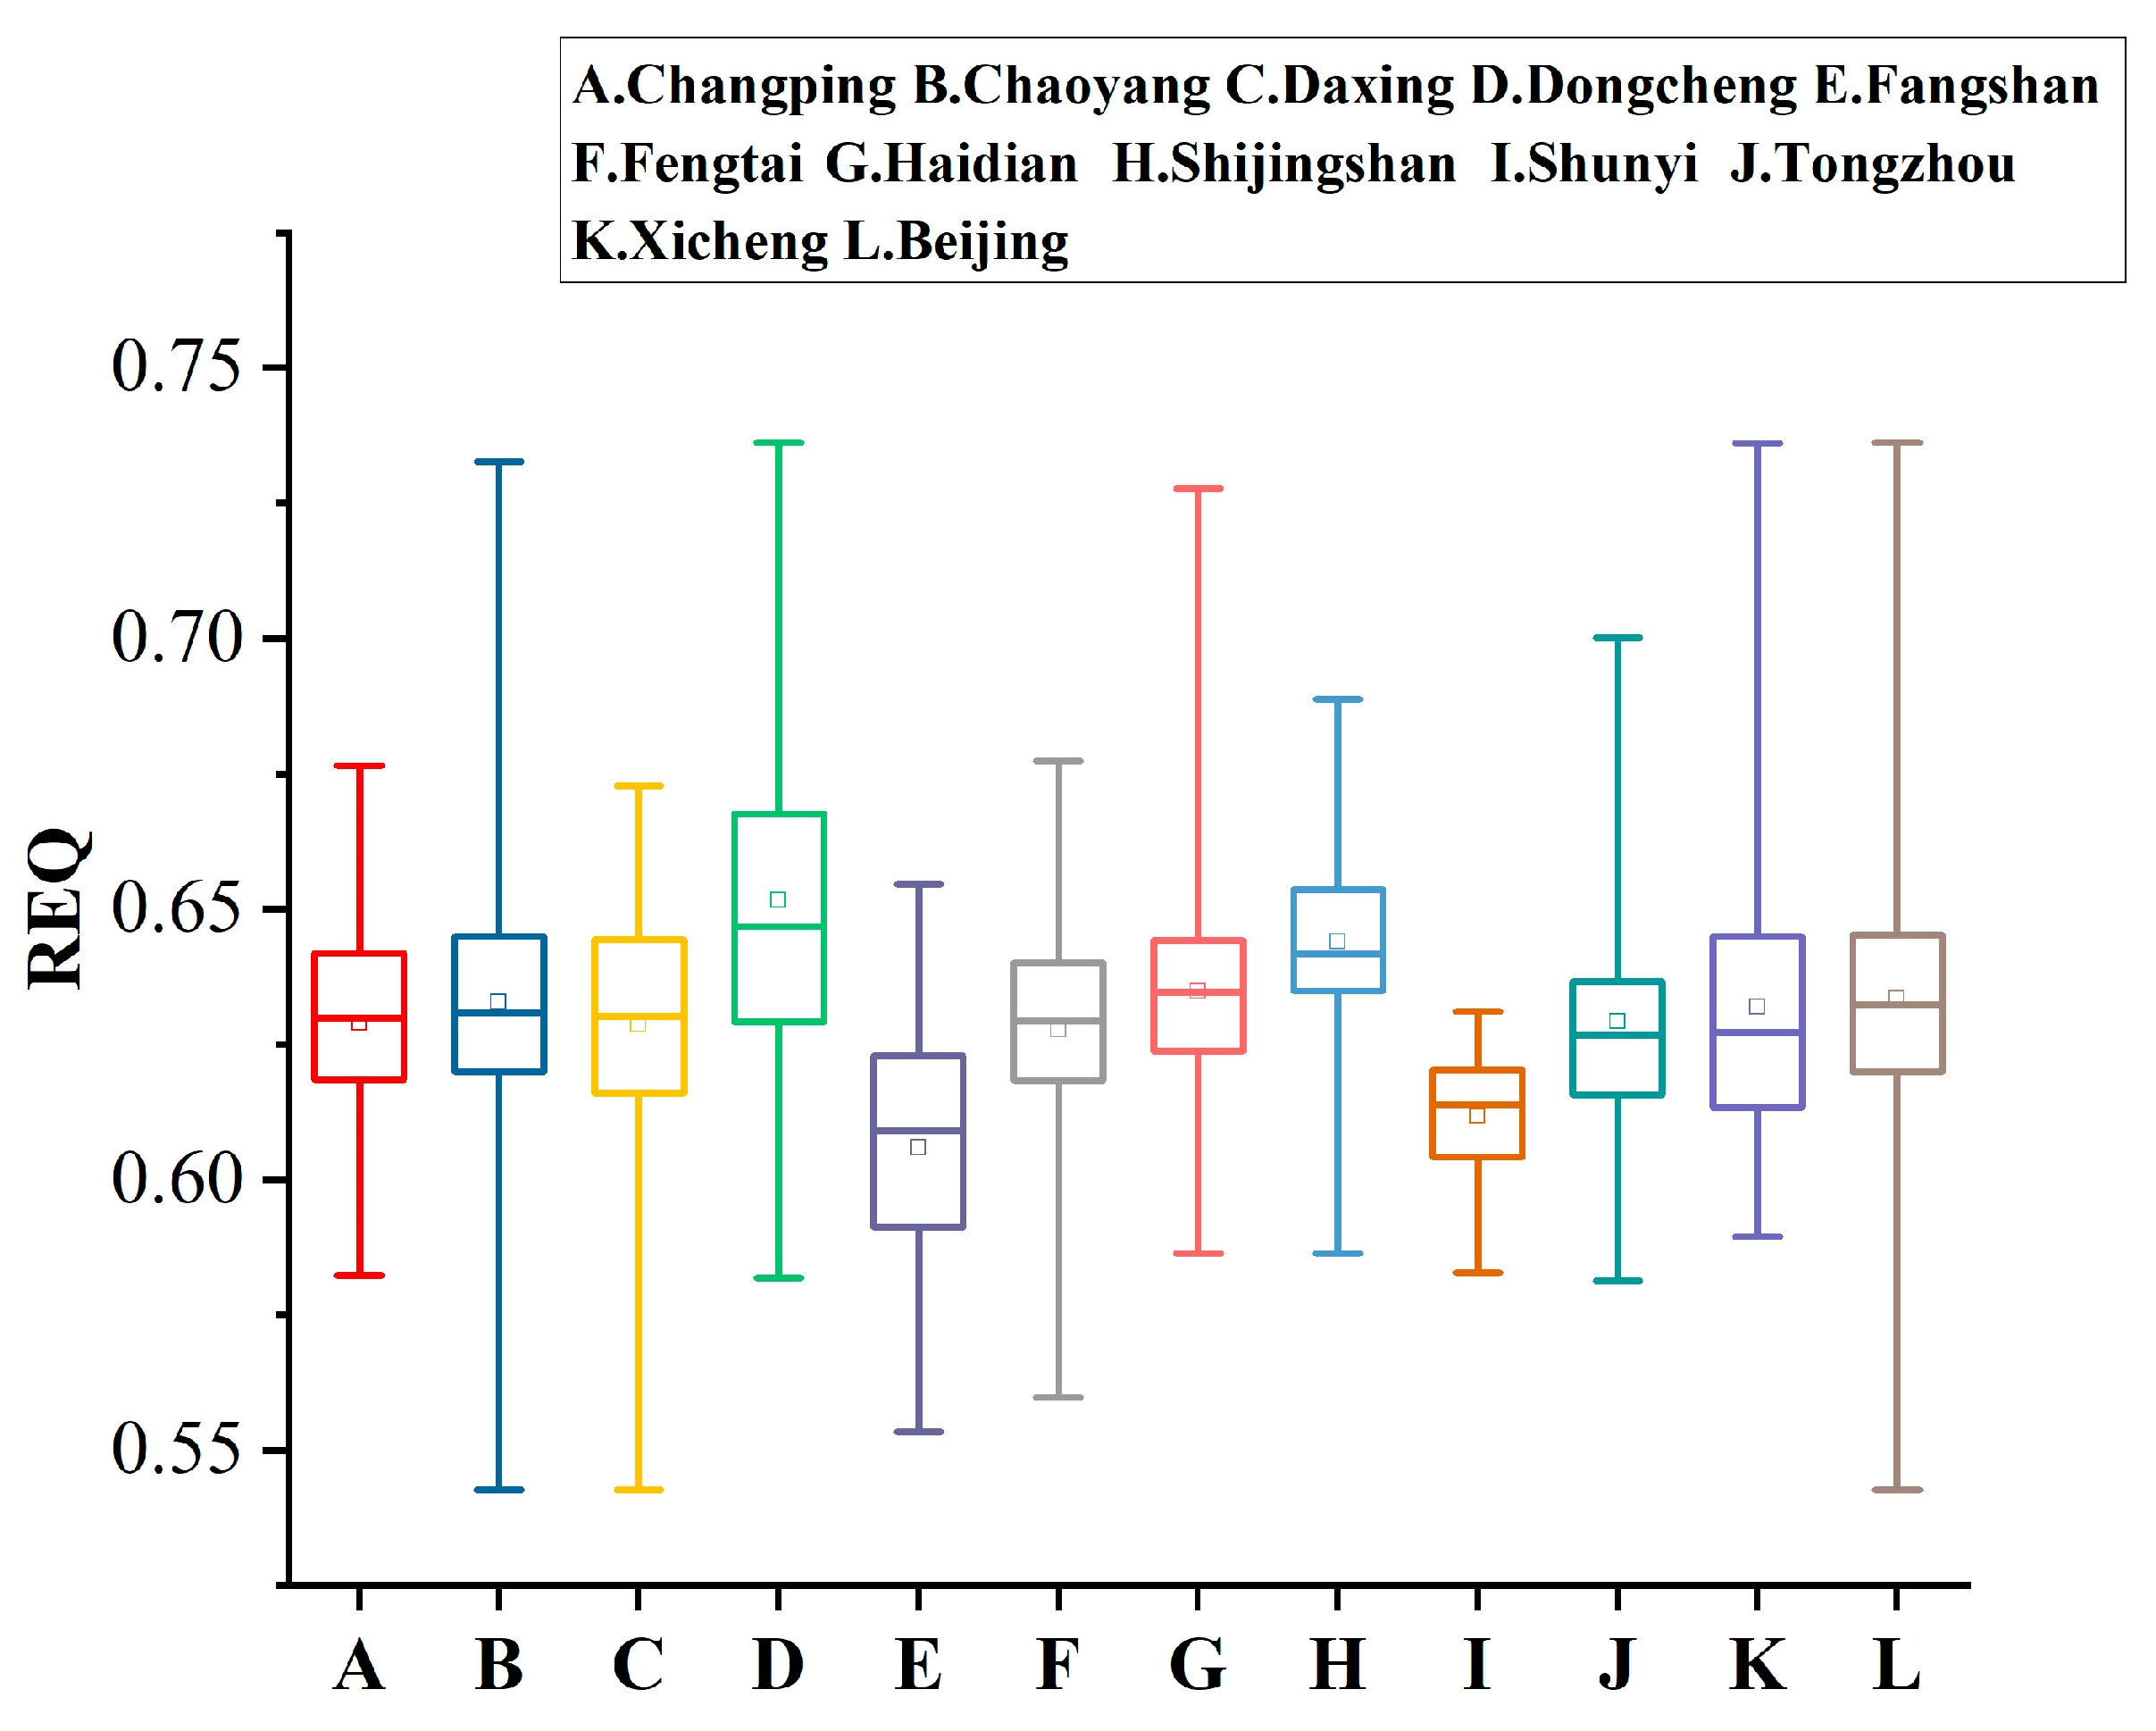
Combining this observation with Figure 5, it is evident that the composite average scores for environmental health and comfort, housing comfort, transportation convenience, city security, and life convenience in Beijing mostly exceed 0.55, indicating minimal overall differences. Regions with average scores below 0.55, indicating lower REQ, are predominantly located in the urban outskirts. Due to geographical factors, these areas exhibit slower urbanization progress and lower population density. Overall, the REQ in Beijing remains at a relatively high level.

4.3. Evaluation of Primary Indicators for REQ

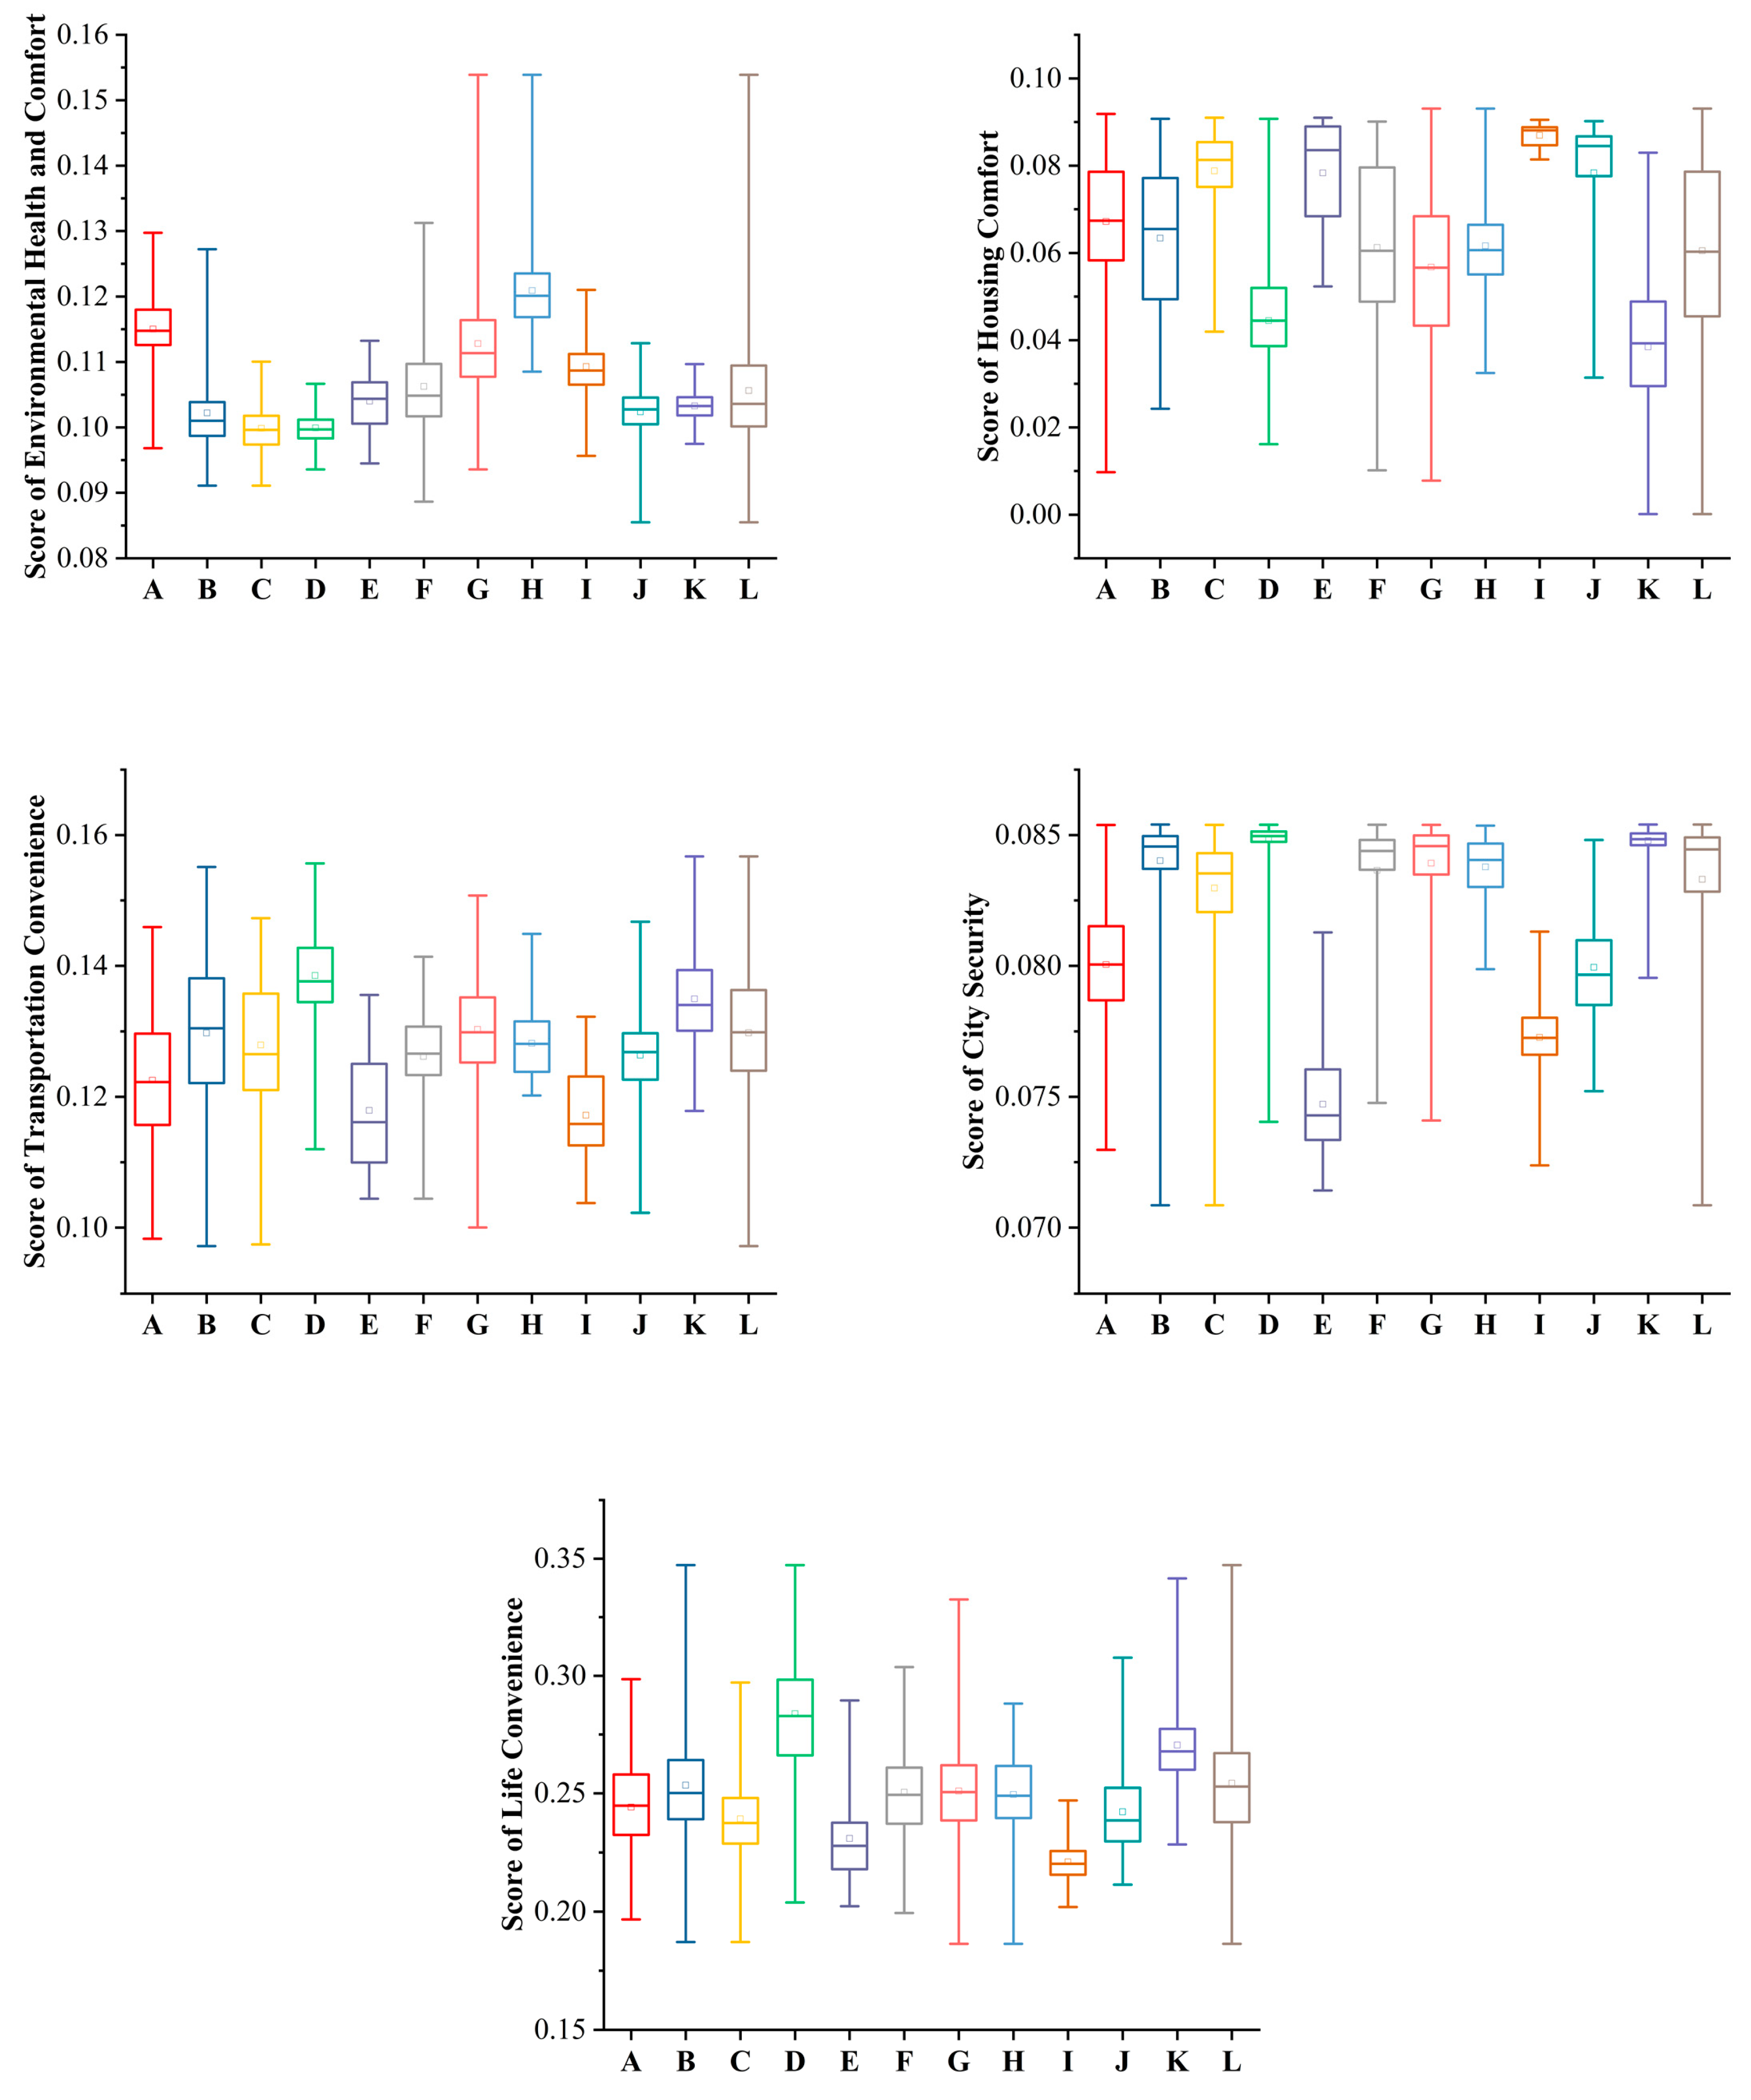
In order to further analyze the primary indicators comprehensively, this study examined the spatial, numerical, and frequency distributions of the five primary indicators across Beijing’s administrative districts. Figure 6, Figure 7 and Figure 8 provide a visual representation of the differences in scores for each primary indicator and across administrative districts.
From Figure 6, it can be observed that environmental health and comfort primarily exhibits a distribution pattern of higher scores in the northwest and lower scores in the southeast. Analysis of Figure 7 and Figure 8 reveals that there is no significant difference in environmental health and comfort indices among administrative districts, with scores concentrated around 0.1. Changping District and Shijingshan District have the highest environmental health and comfort indices, both approaching 0.12, while areas such as Daxing District, Chaoyang District, and Dongcheng District exhibit lower indices, all around 0.1. Significant variations in environmental health and comfort indices are observed within certain administrative districts, with the difference between the highest and lowest values in Haidian District reaching up to 0.06. Statistical data indicate that the air quality throughout Beijing remains excellent throughout the year, with street greening rates generally meeting the standards.
Housing comfort comprises two indicators: the housing-price-to-income ratio and population density. As shown in Figure 6, housing comfort demonstrates a distinct pattern of being lower in the central areas and higher towards the edges. Combining Figure 7 and Figure 8 reveals significant differences in housing comfort scores across Beijing, with values dispersed and notable internal differences within each administrative district. Daxing District, Tongzhou District, and Shunyi District, situated away from the city center with lower population density and housing prices, achieve the highest housing comfort scores, exceeding 0.08. Following closely behind are Chaoyang District, Changping District, Fengtai District, Haidian District, and Shijingshan District, with scores around 0.06. Conversely, Dongcheng District and Xicheng District, located in the city center with higher population density and housing prices, have the lowest scores, only around 0.04, significantly lower than the overall average.
Figure 6 indicates that transportation convenience exhibits a distribution pattern opposite to housing comfort, generally presenting a trend of being higher in the central areas and lower towards the outskirts. However, from Figure 7 and Figure 8, it is evident that there are no significant differences in transportation convenience indices among administrative districts, showing no significant variations in concentration or dispersion among administrative districts. Excluding peripheral regions beyond the Sixth Ring Road, transportation is generally convenient, and related facilities are well developed, with transportation convenience indices mostly above 0.12. Significant internal differences are observed within certain administrative districts, with variations in scores reaching up to 0.07 within Changping District. Given the extensive road network and various transportation modes available throughout Beijing, including dense distributions of bus and subway stations, transportation convenience remains high and generally meets the standards for livable cities.
Combining Figure 6 and Figure 7, it can be observed that city security exhibits a distribution pattern similar to transportation convenience, with higher scores in central areas and lower scores towards the periphery. Moreover, there are no significant differences in city security indices among administrative districts, and the numerical distribution is highly concentrated (Figure 8). Areas such as Chaoyang District, Dongcheng District, Fengtai District, Haidian District, Shijingshan District, and Xicheng District, located in the central part of Beijing, have well-developed security facilities, with security levels far exceeding the overall average. The indices for these areas are as high as 0.08, with minimal internal differences observed in Shijingshan District and Xicheng District. Conversely, areas like Changping District, Fangshan District, Shunyi District, and Tongzhou District exhibit lower development levels, with city security primary indicator scores around 0.07. Overall, the indices for this primary indicator are relatively high, reflecting Beijing’s status as the capital city.
While life convenience also exhibits a pattern of higher scores in central areas and lower scores towards the periphery, there are significant differences in indices among administrative districts, with notable internal differences within each district. As seen in Figure 6, areas with higher life convenience indices are mostly concentrated in the city center, with their highest values approaching the overall maximum of 0.35. The accessibility of residential areas to corresponding service facilities or institutions reflects the convenience and livability of urban life. Dongcheng District and Xicheng District, located in the center of Beijing with a long history and high level of development, have strong capabilities in employment, education, and healthcare, resulting in the highest life convenience indices. Overall, employment, education, and healthcare services in Beijing are mainly concentrated in central areas. However, the accessibility of residential areas to service facilities and institutions within the Sixth Ring Road of Beijing is generally high, ensuring convenience for residents’ daily lives.

4.4. Analysis of the Correlation between REQ and GDP, Carbon Emissions

Zhang [28] noted that one of the key focuses in building a livable city is to establish a sustainable urban economic environment system, ensuring economic development under a low-carbon direction. With the development of urbanization in Beijing, significant disparities in internal urban development have emerged. Haidian and Chaoyang districts rank at the top in terms of GDP, whereas the mountainous areas of Changping and Fangshan, designated as ecological conservation zones, lag behind in economic development, showing some overlap with the distribution of REQ. Against the backdrop of “carbon neutrality and carbon peak”, the overlap between studies on livable cities and low-carbon cities is increasing. Therefore, understanding how urban development influences carbon emissions is pivotal for crafting strategies towards more livable, low-carbon cities.
Based on the preceding context and accounting for the MAUP [26], this study established a grid system using residential area distribution data from Beijing. Employing the Pearson correlation analysis method, we assessed the relationship between GDP, carbon emissions, and the REQ across various spatial scales (Table 4).
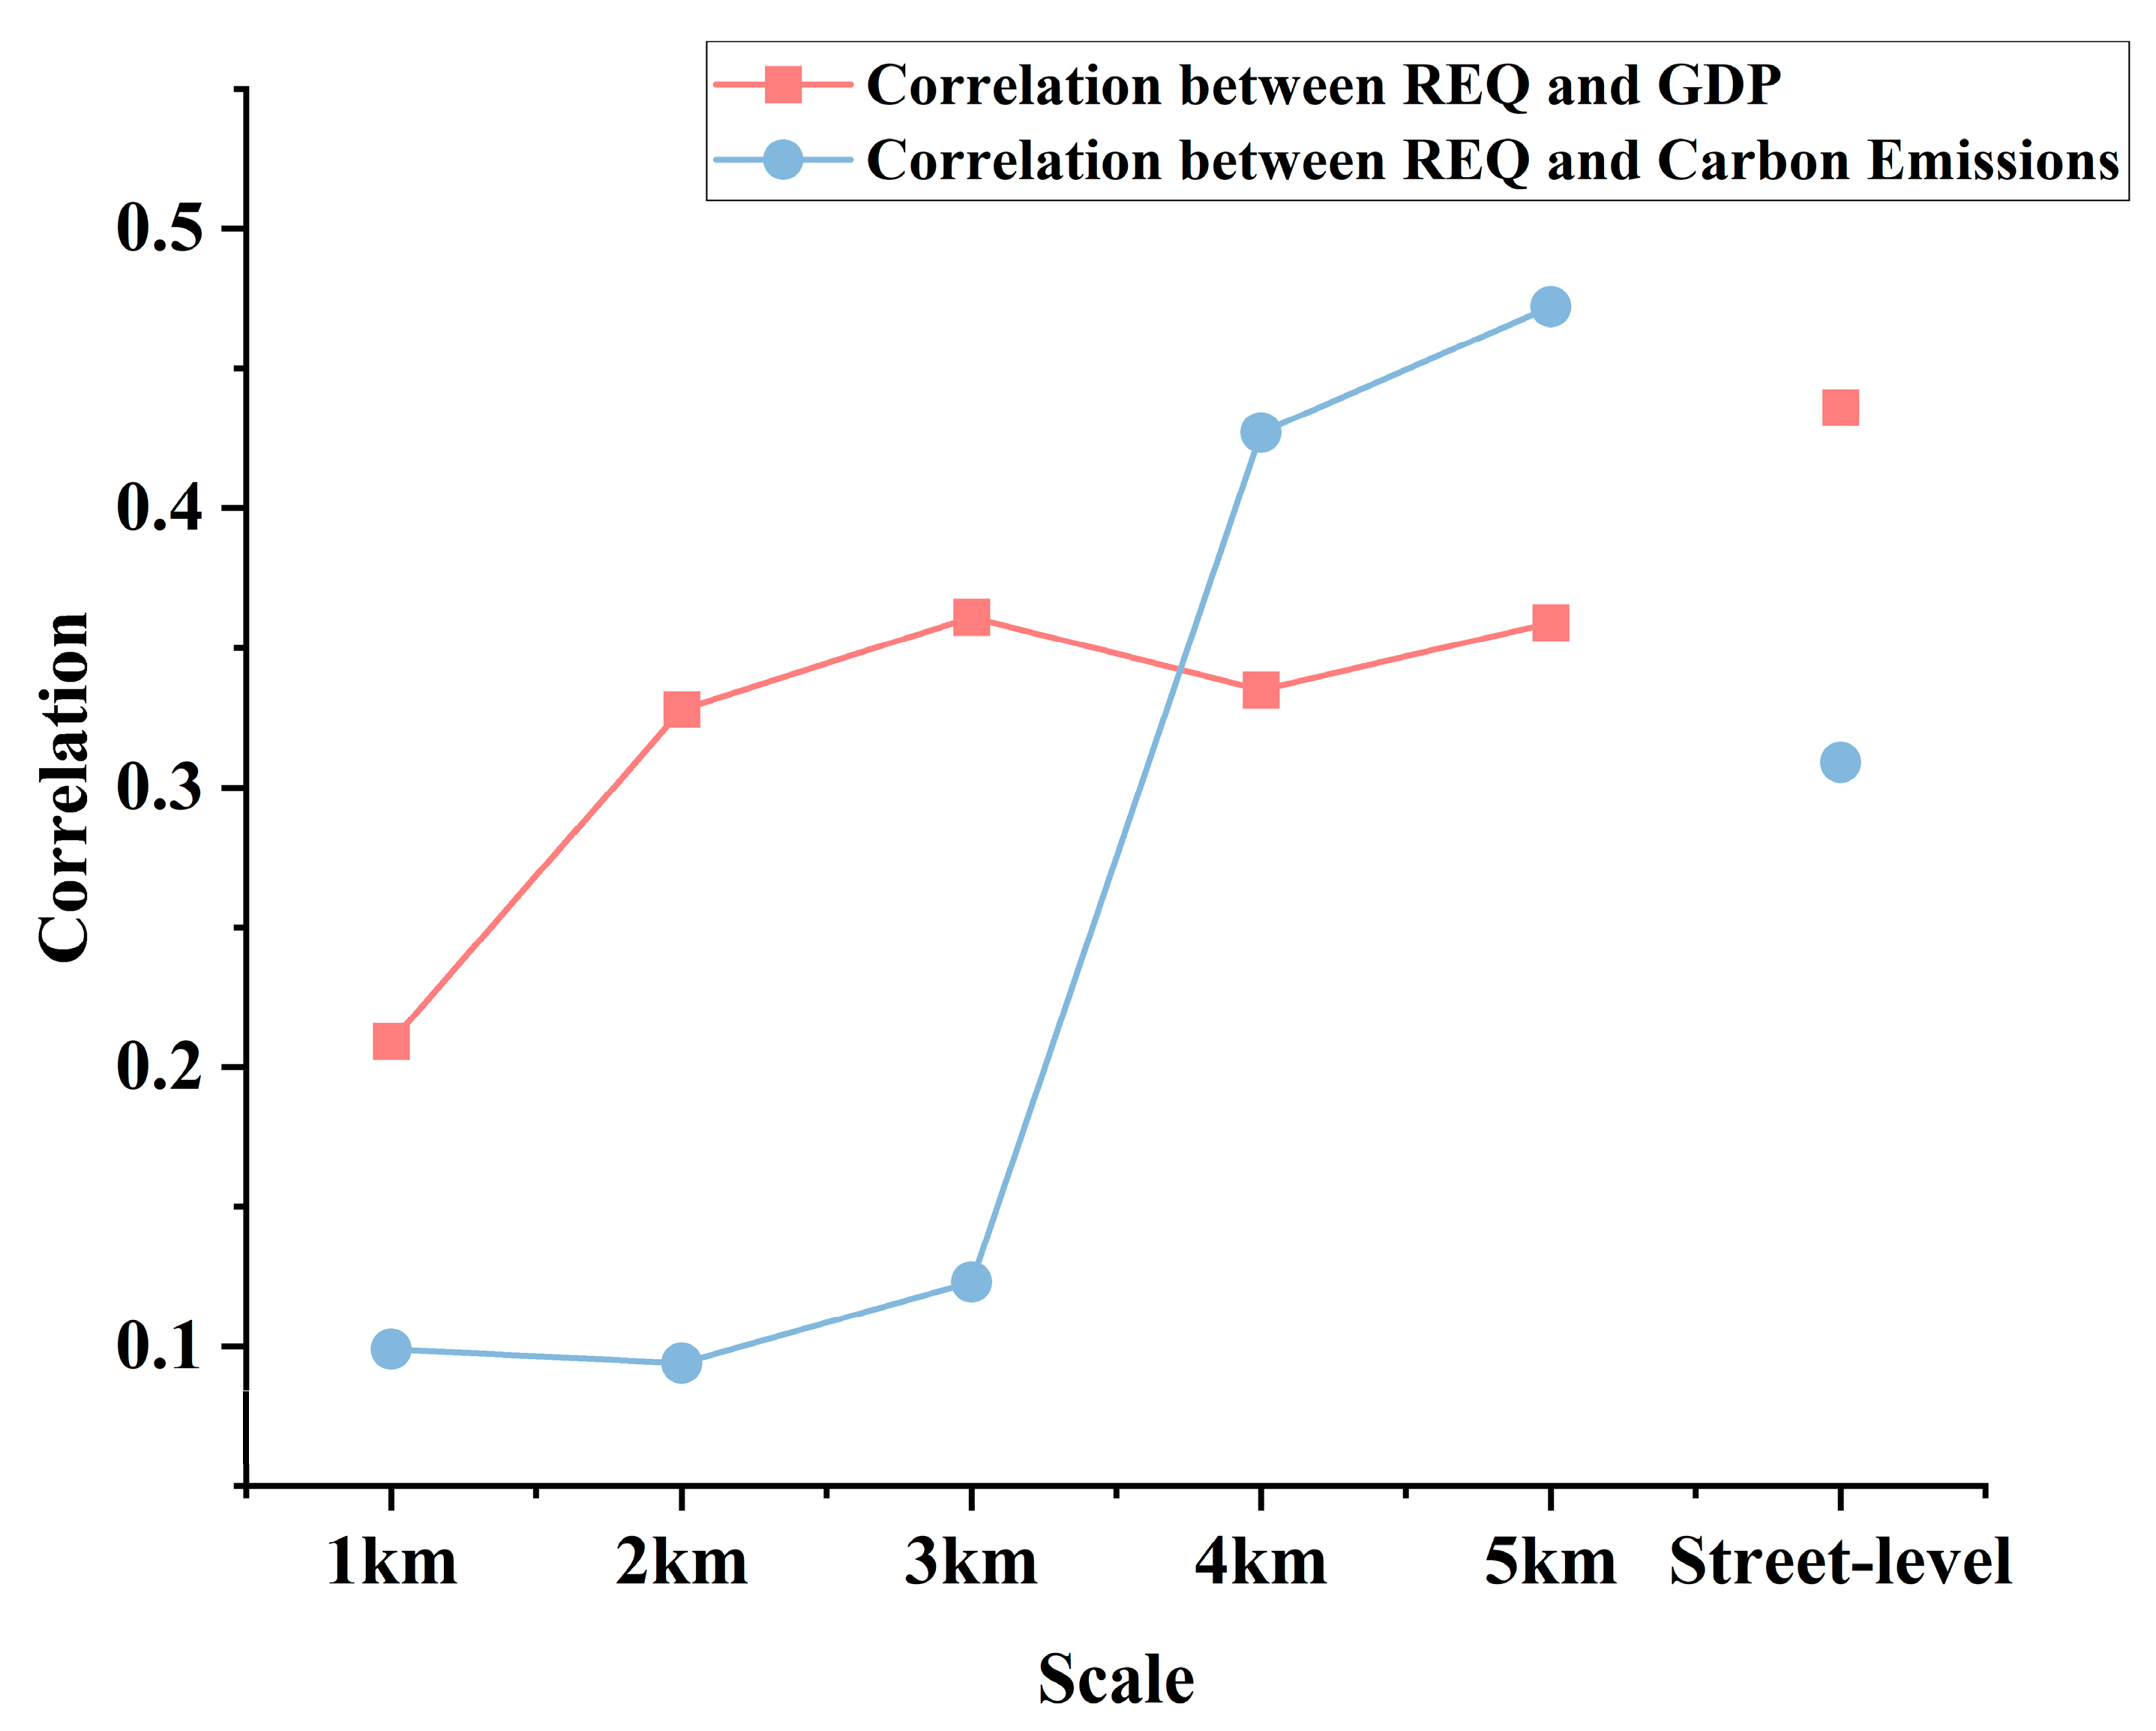
The study partitioned the study area into five distinct scales (1–5 km), while additionally scrutinizing street-level data aligned with the administrative demarcation of Beijing by municipal authorities. The area of street units cannot be measured solely by size, as this scale primarily reflects the correlation within administrative planning units. Table 4 encapsulates the correlation coefficients and significance test outcomes elucidating the connections between the REQ, GDP, and carbon emissions across different scales, whereas Figure 9 provides a visual comparison of these correlations.
Our findings indicate that correlation coefficients across diverse scales exhibit statistical significance, demonstrating a pronounced positive association with the urban residential environment quality index. Notably, both GDP and carbon emissions display a positive trend concerning the 1–5 km scale (Figure 9), suggesting a magnified impact of GDP on the REQ and a concurrent reinforcement of the influence of the REQ on carbon emissions as the scale expands. Specifically, at the street-level scale, the correlation coefficient between GDP and the REQ stands at 0.436, surpassing that observed at the broader 1–5 km grid scale. Conversely, the correlation coefficient between carbon emissions and the REQ at the street-level scale registers at 0.309, indicating a dip compared to the 4 km and 5 km grid scales. This observation partly underscores the proximity of the relationship between GDP within street units and the corresponding REQ, while underscoring a more pronounced correlation between the REQ and carbon emissions at macroscopic scales.
This indicates that economic activities at the street scale have a more pronounced impact on the residential environment quality (REQ). In Beijing, there are significant functional distinctions between different administrative units, such as political functions and economic service functions. The street scale typically corresponds to specific administrative management units, where economic activities and governance exhibit strong coherence. Moreover, street units with higher GDP often boast better public facilities, higher living standards, and superior environmental conditions, with resource allocation closely tied to the street level. In contrast, carbon emissions have a diffusive nature, significantly affecting surrounding areas. Factors influencing carbon emissions, such as the distribution of buildings and traffic conditions, are intricate and multifaceted. Additionally, Beijing experiences substantial daily population mobility with complex movement patterns, enhancing the diffusive characteristic of carbon emissions. These dynamics may attenuate the distinct characteristics unique to street units. Considering these aspects, the relationship between REQ and GDP, as well as between REQ and carbon emissions, differs on the street scale compared to other scales. These relationships manifest distinct patterns when analyzed at grid and street scales.

5. Discussion

5.1. Hotspot Analysis

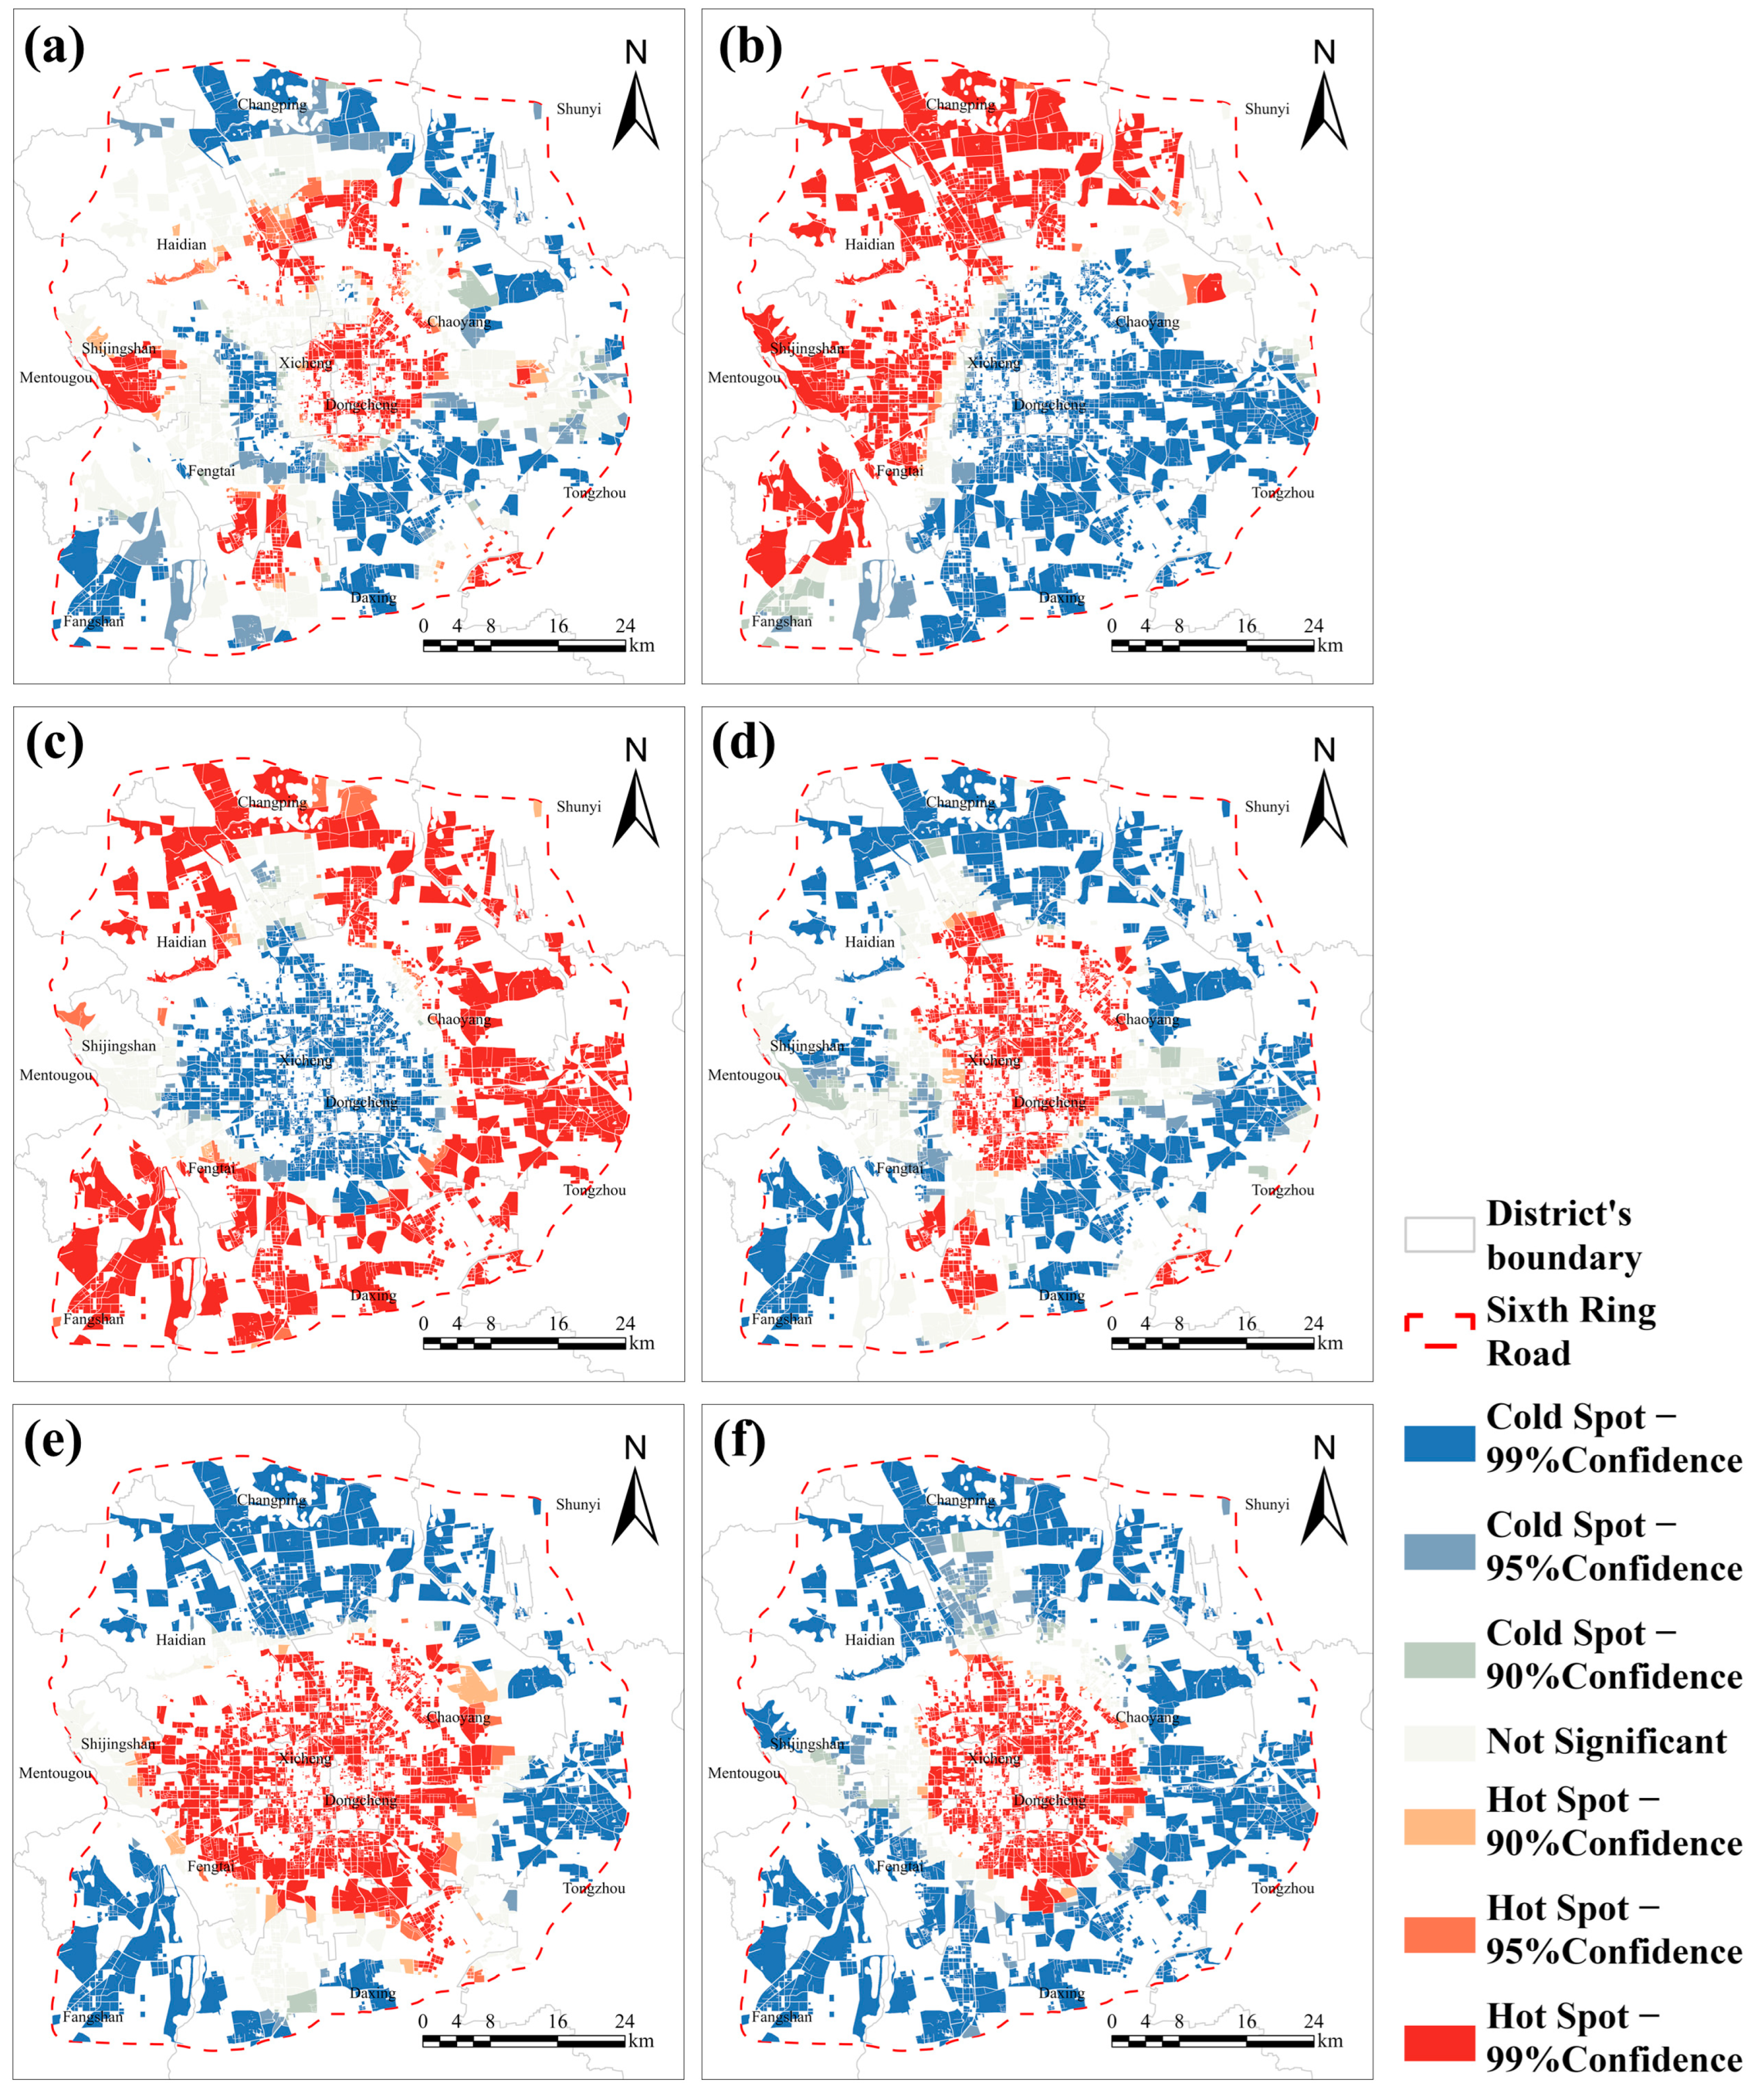
To delve into the current conditions and disparities of the REQ within the Sixth Ring Road of Beijing, and to seek targeted directions and approaches for improving the quality of the REQ, this study conducted a rigorous analysis of the spatial autocorrelation and the degree of correlation associated with the distribution of the REQ in this area. Furthermore, this study clarified REQ interconnection patterns in Beijing and quantified its spatial distribution. This study performed a comprehensive global spatial autocorrelation analysis on the REQ, as detailed in Table 5. The analysis revealed that all Moran’s I indices are positive, consistently exceeding 0. Furthermore, the p-values were found to be less than 0.05 (virtually nearing 0), and the z-scores substantially surpass the critical value of 1.96, indicating a significant spatial autocorrelation within the data. The results indicate that there is a significant spatial autocorrelation in both the overall score of the REQ and the classification scores at each primary indicator, exhibiting notable clustering patterns. Based on this observation, a hotspot analysis of the scores of the REQ assessment in Beijing is conducted, revealing spatial clustering of high and low-quality livable environments (Figure 10).
Integrating Figure 10, the comprehensive analysis of hotspot maps for each primary indicator reveals that the central area (primarily referring to within the Fourth Ring Road) demonstrates relatively higher superiority in infrastructure and public services, while environmental health and comfort and housing comfort are significantly lower compared to the peripheral areas. The northwest areas of Beijing, such as the northern part of Haidian District, are identified as hotspots for environmental health and comfort, indicating a high-quality aggregation of environmental health and comfort. Conversely, the southeastern areas including Chaoyang District and Dongcheng District are identified as cold spots for environmental health and comfort, indicating a low-quality aggregation of environmental health and comfort. Housing comfort exhibits a distinct “central–peripheral” structure, with cold spot aggregation in the central areas. Certain parts of the central areas of Beijing and the northern portion of Daxing District form high-quality aggregations in terms of transportation convenience. The hotspot analysis map of urban safety reveals a multi-central distribution pattern, with significant spatial heterogeneity, yet still demonstrating a characteristic of high in the middle and low on both sides. The central area of Beijing forms a high-quality aggregation zone for life convenience, while the peripheral areas constitute low-quality aggregation zones. Overall, the REQ in Beijing forms high-quality aggregations in areas such as Dongcheng District, Xicheng District, Shijingshan District, the southeastern part of Haidian District, the southern part of Changping District, the western part of Chaoyang District, and the junction of Fengtai District with Daxing District.
Based on the comprehensive conclusions, the overall distribution characteristics of the total REQ score and each primary indicator align with the expected results. Specifically, the overall urban residential environment quality exhibits a pattern of decreasing from the center towards the periphery. There are also significant spatial aggregations among the five primary indicators, with housing comfort and ecological health showing aggregation characteristics opposite to the other three primary indicators.
However, several unexpected results were observed. In the hot and cold spot analysis of the primary indicators, small areas with opposite aggregation characteristics emerged within larger high-quality aggregations of cold or hot spots. For instance, as illustrated in Figure 8, a small hotspot area is identified in the northeastern corner of Chaoyang District for ecological health. Similarly, small hotspot regions are found in the southern part of Daxing District and the western part of Tongzhou District for transportation convenience.
Upon thorough investigation and analysis, the following reasons are hypothesized to explain the unexpected findings. (1) The hotspot area in the northeastern corner of Chaoyang District on the ecological health cold and hot spot analysis map corresponds to the Wenyu River Park along the Wenyu River. This park is large in scale, adjacent to a water system, rich in plant species, and exhibits superior air quality. The absence of parks of similar scale in the surrounding area results in a local hotspot within a generally cold spot region. (2) The hotspot in the northwestern part of Daxing District on the transportation convenience cold and hot spot analysis map is characterized by a high concentration of schools, highways, and well-developed public transportation. The hotspot in the western part of Tongzhou District corresponds to the area around Majuqiao, located on the city’s periphery, where a dense population of migrant workers relies heavily on public transportation. This leads to the emergence of localized hotspots. These analyses and conclusions to some extent validate the scientific robustness of the constructed index, demonstrating its ability to effectively reflect the urban residential environment quality of different areas.

5.2. Recommendations for Urban Development

Regarding environmental health and comfort, in cold spot areas, efforts should be focused on promoting ecological conservation measures, leveraging the experiences of natural environmental protection in hotspot areas, and facilitating the robust development of environmental health and comfort. Cold spot areas of housing comfort are characterized by higher housing prices, smaller per capita housing area, and lower floor area ratio. Therefore, regions with lower housing comfort tend to be concentrated in the central urban areas and their vicinity, whereas areas with relatively lower housing prices and lower population density are clustered as high-comfort housing zones in the periphery. Therefore, strategies should prioritize affordability and spatial efficiency in these areas. Similarly, in areas exhibiting poor concentration of transportation convenience, it is imperative to fully leverage the macro-control role of government and urban planning. This entails comprehensive consideration of the spatial arrangement of transportation infrastructure such as subway stations and bus stops to facilitate access in underserved regions. Continuous efforts should be directed towards advancing the development of urban transportation networks, aiming to achieve a more balanced distribution of urban transportation resources. In regions identified as cold spots for city security, the resilience of urban areas in the periphery is relatively low, and their capacity to withstand risks is weak. Therefore, it is essential to enhance infrastructure and emergency systems, thereby bolstering the ability to respond effectively to unforeseen public events. In peripheral areas identified as cold spots for life convenience, accelerating the development of commercial and service infrastructure is crucial to invigorate community life and meet essential needs.

5.3. Pros and Cons

This study adopts a micro-scale perspective, focusing on residential blocks within Beijing to assess the urban REQ. Building upon previous research and summarizing findings in conjunction with Beijing’s regional characteristics and development status, a more comprehensive evaluation system for REQ was established. The evaluation system employs a hybrid approach, integrating subjective and objective methods to assign weights to the indicators. Leveraging multi-source geospatial data, which are readily available and rapidly updated, this approach effectively meets the requirements for evaluating REQ at a micro-scale. The methodologies and approaches utilized in this study offer insights for urban, regional, national, and even global-scale research.
The study, however, is not without limitations: (1) Due to constraints in data acquisition channels, some micro-scale indicators such as those measuring housing quality and community service quality were not considered. (2) Although subjective factors were taken into account, the study fell short in gathering a larger sample size via surveys and visits, slightly neglecting the evaluation of resident satisfaction. (3) The study did not incorporate additional potential factors related to REQ, such as scenic spots, historical culture, and innovation vitality. These shortcomings will be addressed in future research. Regarding the second point, resident satisfaction will be incorporated into the indicator system. A survey questionnaire will be designed based on the indicator system established in this study. Residential areas will be categorized, and an appropriate number of different types of residential areas will be selected as samples for field surveys. The survey results will be further analyzed and integrated into the calculation of REQ via a specific methodology.
Additionally, this study leverages multi-source geospatial data to assess REQ, but such data come with inherent limitations. For instance, remote sensing data from different sources with varying formats and resolutions require meticulous calibration to ensure consistency. POI data may exhibit biases due to differences in data collection methods or update frequencies. Some areas may have more detailed and frequently updated POI data, while others might suffer from outdated or incomplete information. Moreover, multi-source geospatial data primarily reflect the objective construction of the urban environment and might inadequately capture subjective human experiences. These limitations will be addressed in our future research efforts.

6. Conclusions

This study utilizes a combination of remote sensing data, POI data, meteorological monitoring data, and urban land use data to conduct a multi-dimensional analysis of REQ within the Sixth Ring Road of Beijing, from the perspective of residential blocks. By considering Beijing’s regional characteristics, an REQ evaluation indicator system was constructed, and indicator weights were determined using the AHP–Entropy method. Compared to city-wide analyses, focusing on residential blocks better reflects the differences and characteristics of livability among urban internal residential areas. The AHP–Entropy method, which combines subjectivity and objectivity, not only compensates for the shortcomings of relying too heavily on data in objective analysis methods like the Entropy method but also adjusts for the influence of subjective factors. The conclusions can be summarized as follows:
(1)
The overall quality of Beijing’s REQ exhibits a pattern from the center to the edges, from high to low. Environmental health and comfort scores are higher in the northwest and lower in the southeast; housing comfort scores are higher on the edges and lower in the center; transportation convenience, city security, and life convenience scores all show a pattern of being higher in the center and lower on the edges, with a consistent distribution and scores also being higher within the “cross-shaped” area formed around the city center. Additionally, the analysis reveals distinct spatial clustering within Beijing’s REQ, characterized by the widespread distribution of both high-quality (hot spots) and low-quality (cold spots) areas. These characteristics may relate to the different responsibilities assigned to Beijing’s various administrative districts. The government could develop targeted development policies for each district to promote regional economic development, potentially alleviating population density and economic pressure in the central urban areas and comprehensively improving the quality of life for residents in Beijing.
(2)
The distribution of environmental health and comfort values is relatively concentrated, with low values being clustered and high values dispersed. The distribution of housing comfort values shows significant differences, with high values more dispersed. The difference in city security is less significant, with values concentrated but low-value data dispersed. The values for transportation convenience, life convenience, and the REQ show a clear pattern of central values being concentrated and edge values being dispersed, overall resembling a “mountain shape”.
(3)
The correlation analysis between GDP and the REQ indicates that higher GDP are associated with higher-quality urban environments to a certain extent and within a specific range. The correlation is significant at the street level, and the degree of influence increases with scale. The correlation analysis between carbon emissions and the REQ suggests that regions with higher-quality urban environments tend to exhibit higher levels of carbon emissions to a certain extent. This correlation is similarly significant at the street level and strengthens with scale.
Future research will primarily include two aspects. First, optimizing the REQ assessment system constructed in this research to assess the REQ of major cities nationwide in China. This entails calibrating the system for diverse urban environments and ensuring its adaptability to different urban scales and characteristics. Subsequently, exploring the relationship between REQ and other deeper driving factors, as well as the potential impacts of REQ on certain urban attributes.

Author Contributions

Conceptualization, S.D.; Data curation, S.Z., Y.X. and Z.L.; Formal analysis, S.Z., Y.X., Y.W. and P.L.; Funding acquisition, S.D.; Investigation, Y.W. and P.L.; Methodology, S.Z., Y.X., Z.L., X.L., Y.W., P.L. and S.D.; Project administration, S.Z.; Resources, S.Z., Y.X. and S.D.; Software, S.Z., Z.L. and X.L.; Supervision, S.D.; Validation, S.Z., Z.L., X.L., Y.W. and S.D.; Visualization, S.Z. and Y.X.; Writing—original draft, S.Z., Y.X., Z.L., X.L., Y.W. and P.L.; Writing—review and editing, S.D. All authors have read and agreed to the published version of the manuscript.

Funding

The work was supported by the National Natural Science Foundation of China [42201512], the China Postdoctoral Science Foundation [2021M703511; 2023T160691], and the Fundamental Research Funds for the Central Universities [2024ZKPYDC02].

Data Availability Statement

The data presented in this study are available upon request from the corresponding author.

Conflicts of Interest

The authors declare no conflicts of interest.

References

  1. Zhang, W.; Chen, L.; Yang, Y. Research Progress on Human Settlement Evolution. Prog. Geogr. 2013, 32, 710–721. [Google Scholar]
  2. Park, Y.H. Build Capacity for International Health Agenda on the “Transforming Our World: The 2030 Agenda for Sustainable Development”. Health Policy Manag. 2015, 25, 149–151. [Google Scholar] [CrossRef]
  3. Kutty, A.A.; Kucukvar, M.; Onat, N.C.; Ayvaz, B.; Abdella, G.M. Measuring sustainability, resilience and livability performance of European smart cities: A novel fuzzy expert-based multi-criteria decision support model. Cities 2023, 137, 104293. [Google Scholar] [CrossRef]
  4. Woodman, P.C.; Mitchel, N.C. Human Settlement and Economy of the Lough Neagh Basin. In Lough Neagh: The Ecology of a Multipurpose Water Resource; Springer: Dordrecht, The Netherlands, 1993; pp. 91–111. [Google Scholar] [CrossRef]
  5. Kong, L.; Liu, Z.; Wu, J. A Systematic Review of Big Data-Based Urban Sustainability Research: State-of-The-Science and Future Directions. J. Clean. Prod. 2020, 273, 123142. [Google Scholar] [CrossRef]
  6. Zhu, L.; Guo, Y.; Zhang, C.; Meng, J.; Ju, L.; Zhang, Y.; Tang, W. Assessing community-level livability using combined remote sensing and internet-based big geospatial data. Remote Sens. 2020, 12, 4026. [Google Scholar] [CrossRef]
  7. Khavanin Zadeh, A.R.; Veroustraete, F.; Buytaert, J.A.N.; Dirckx, J.; Samson, R. Assessing Urban Habitat Quality Using Spectral Characteristics of Tilia Leaves. Environ. Pollut. 2013, 178, 7–14. [Google Scholar] [CrossRef] [PubMed]
  8. Ciach, M.; Faraś, H.; Fröhlich, A.; Fedyń, I. Contrasting Effects of Light and Noise Pollution Interact with Natural Vegetation Remnants: Human-Related Indicators of the Habitat Suitability for Ungulates in the Urban Landscape. Ecol. Indic. 2022, 142, 109261. [Google Scholar] [CrossRef]
  9. Yang, X.; Jin, M.; Liu, X. Evaluation of Urban Habitat Quality Based on Theory of Humanistic-A Case Study of HeFei Metropolitan Circle of China. In International Conference on Green Building, Civil Engineering and Smart City; Springer: Berlin/Heidelberg, Germany, 2023; pp. 1013–1029. [Google Scholar] [CrossRef]
  10. Zhan, D.; Kwan, M.-P.; Zhang, W.; Fan, J.; Yu, J.; Dang, Y. Assessment and Determinants of Satisfaction with Urban Livability in China. Cities 2018, 79, 92–101. [Google Scholar] [CrossRef]
  11. Zanella, A.; Camanho, A.S.; Dias, T.G. The Assessment of Cities’ Livability Integrating Human Wellbeing and Environmental Impact. Ann. Oper. Res. 2015, 226, 695–726. [Google Scholar] [CrossRef]
  12. Huang, X.; Liu, Y. Livability assessment of 101,630 communities in China’s major cities: A remote sensing perspective. Sci. China Earth Sci. 2022, 65, 1073–1087. [Google Scholar] [CrossRef]
  13. Xiao, Y.; Li, Y.; Tang, X.; Huang, H.; Wang, R. Assessing Spatial–Temporal Evolution and Key Factors of Urban Livability in Arid Zone: The Case Study of the Loess Plateau, China. Ecol. Indic. 2022, 140, 108995. [Google Scholar] [CrossRef]
  14. Zhang, Y.; Li, Q.; Wang, H.; Du, X.; Huang, H. Community Scale Livability Evaluation Integrating Remote Sensing, Surface Observation and Geospatial Big Data. Int. J. Appl. Earth Obs. Geoinf. 2019, 80, 173–186. [Google Scholar] [CrossRef]
  15. Juntti, M.; Costa, H.; Nascimento, N. Urban environmental quality and wellbeing in the context of incomplete urbanisation in Brazil: Integrating directly experienced ecosystem services into planning. Prog. Plan. 2021, 143, 100433. [Google Scholar] [CrossRef]
  16. Xiong, Y.; Zhang, F. Effect of human settlements on urban thermal environment and factor analysis based on multi-source data: A case study of Changsha city. J. Geogr. Sci. 2021, 31, 819–838. [Google Scholar] [CrossRef]
  17. Fu, B.; Yu, D.; Zhang, Y. The livable urban landscape: GIS and remote sensing extracted land use assessment for urban livability in Changchun Proper, China. Land Use Policy 2019, 87, 104048. [Google Scholar] [CrossRef]
  18. Wang, Y.; Jin, C.; Lu, M.; Lu, Y. Assessing the Suitability of Regional Human Settlements Environment from a Different Preferences Perspective: A Case Study of Zhejiang Province, China. Habitat Int. 2017, 70, 1–12. [Google Scholar] [CrossRef]
  19. Lazauskaitė, D.; Burinskienė, M.; Podvezko, V. Subjectively and objectively integrated assessment of the quality indices of the suburban residential environment. Int. J. Strateg. Prop. Manag. 2015, 19, 297–308. [Google Scholar] [CrossRef]
  20. Zhang, W.; Cao, J.; He, J.; Chen, L. City Health Examination in China: A Methodology and Empirical Study. Chin. Geogr. Sci. 2021, 31, 951–965. [Google Scholar] [CrossRef]
  21. Zhang, Y.; Li, J.; Fath, B.D.; Zheng, H.; Xia, L. Analysis of Urban Carbon Metabolic Processes and a Description of Sectoral Characteristics: A Case Study of Beijing. Ecol. Model. 2015, 316, 144–154. [Google Scholar] [CrossRef]
  22. Jiang, W.; Zhang, Z.; Wen, J.; Yin, L.; Song, B. Spatio-Temporal Variation and Influencing Factors of Industrial Carbon Emission Effect in China Based on Water-Land-Energy-Carbon Nexus. Ecol. Indic. 2023, 152, 110307. [Google Scholar] [CrossRef]
  23. Xie, L.; Yan, H.; Zhang, S.; Wei, C. Does urbanization increase residential energy use? Evidence from the Chinese residential energy consumption survey 2012. China Econ. Rev. 2020, 59, 101374. [Google Scholar] [CrossRef]
  24. Li, J.; Wei, X.; Shen, L. Analysis on the Synchronized Development between Urbanization Process and Eco-Efficiency through the Sustainability Lens. Environ. Sci. Pollut. Res. 2023, 30, 80828–80843. [Google Scholar] [CrossRef] [PubMed]
  25. Wang, K.; Ma, H.; Fang, C. The relationship evolution between urbanization and urban ecological resilience in the Northern Slope Economic Belt of Tianshan Mountains, China. Sustain. Cities Soc. 2023, 97, 104783. [Google Scholar] [CrossRef]
  26. Openshaw, S. A Million or so Correlation Coefficients: Three Experiments on the Modifiable Areal Unit Problem. In Statistical Applications in the Spatial Sciences; Pion: London, UK, 1979; pp. 127–144. [Google Scholar]
  27. Gong, P.; Chen, B.; Li, X.; Liu, H.; Wang, J.; Bai, Y.; Chen, J.; Chen, X.; Fang, L.; Feng, S.; et al. Mapping Essential Urban Land Use Categories in China (EULUC-China): Preliminary Results for 2018. Sci. Bull. 2020, 65, 182–187. [Google Scholar] [CrossRef] [PubMed]
  28. Zhang, W. The core framework of the livable city construction. Geogr. Res. 2016, 35, 205–213. [Google Scholar] [CrossRef]
  29. Mouratidis, K. Commute satisfaction, neighborhood satisfaction, and housing satisfaction as predictors of subjective well-being and indicators of urban livability. Travel Behav. Soc. 2020, 21, 265–278. [Google Scholar] [CrossRef]
  30. Tan, M.; Hua, Z.; Li, G.; Qu, J. Assessment of Potentially Toxic Pollutants and Urban Livability in a Typical Resource-Based City, China. Environ. Sci. Pollut. Res. 2020, 27, 18640–18649. [Google Scholar] [CrossRef]
  31. Cao, Y.; Li, F.; Xi, X.; van Bilsen, D.J.C.; Xu, L. Urban Livability: Agent-Based Simulation, Assessment, and Interpretation for the Case of Futian District, Shenzhen. J. Clean. Prod. 2021, 320, 128662. [Google Scholar] [CrossRef]
  32. Liu, Y.; Wang, R.; Xiao, Y.; Huang, B.; Chen, H.; Li, Z. Exploring the linkage between greenness exposure and depression among Chinese people: Mediating roles of physical activity, stress and social cohesion and moderating role of urbanicity. Health Place 2019, 58, 102168. [Google Scholar] [CrossRef]
  33. Liu, Y.; Huang, X.; Yang, Q.; Jing, W.; Yang, J. Effects of Landscape on Thermal Livability at the Community Scale Based on Fine-Grained Geographic Information: A Case Study of Shenzhen. Sci. Total Environ. 2023, 905, 167091. [Google Scholar] [CrossRef]
  34. Wu, H.; Wang, L.; Zhang, Z.; Gao, J. Analysis and optimization of 15-min community life circle based on supply and demand matching: A case study of Shanghai. PLoS ONE 2021, 16, e0256904. [Google Scholar] [CrossRef] [PubMed]
  35. Van Donkelaar, A. Satellite-derived PM2.5 - Washington University in St. Louis. Available online: https://sites.wustl.edu/acag/datasets/surface-pm2-5/#V5.GL.02 (accessed on 23 September 2023).
  36. Muñoz Sabater, J. ERA5-Land monthly averaged data from 1950 to present. Available online: https://cds.climate.copernicus.eu (accessed on 23 September 2023).
  37. Worldpop. Available online: https://hub.worldpop.org/ (accessed on 25 September 2023).
  38. Xu, Z.; Wang, Y.; Sun, G.; Chen, Y.; Ma, Q.; Zhang, X. Generating Gridded Gross Domestic Product Data for China Using Geographically Weighted Ensemble Learning. ISPRS Int. J. Geo-Inf. 2023, 12, 123. [Google Scholar] [CrossRef]
  39. ODIAC Fossil Fuel Emission Dataset|Center for Global Environmental Research. db.cger.nies.go.jp. Available online: https://db.cger.nies.go.jp/dataset/ODIAC/DL_odiac2022.html (accessed on 26 January 2024).
  40. Yangtze River Delta Science Data Center, National Earth System Science Data Center, National Science & Technology Infrastructure of China. Available online: http://geodata.nnu.edu.cn/ (accessed on 21 January 2024).
  41. Zhong, C.; Yang, Q.; Liang, J.; Ma, H. Fuzzy Comprehensive Evaluation with AHP and Entropy Methods and Health Risk Assessment of Groundwater in Yinchuan Basin, Northwest China. Environ. Res. 2022, 204, 111956. [Google Scholar] [CrossRef] [PubMed]
  42. Lu, Y.; Xie, D.; Xu, X. Environmental Suitability Evaluation for Human Settlements of Rural Residential Areas in Hengshui. Hebei Province. Land 2022, 11, 2112. [Google Scholar] [CrossRef]
  43. Ni, X.; Quan, Y. Measuring the Sustainable Development of Marine Economy Based on the Entropy Value Method: A Case Study in the Yangtze River Delta, China. Sustainability 2023, 15, 6719. [Google Scholar] [CrossRef]
  44. Zhang, J.; Wang, Y. The Construction of the Landscape- and Village-Integrated Green Governance System Based on the Entropy Method: A Study from China. Agriculture 2023, 13, 1821. [Google Scholar] [CrossRef]
  45. Wu, K.; Jin, J. Attribute recognition method of regional ecological security evaluation based on combined weight on principle of relative entropy. Sci. Geogr. Sin 2008, 28, 754–758. [Google Scholar]
  46. Fieller, E.C.; Pearson, E.S. Tests for Rank Correlation Coefficients. II. Biometrika 1961, 48, 29–40. [Google Scholar] [CrossRef]
Figure 1. Study area in Beijing. (a) The location of the Sixth Ring Road in Beijing, China, and Asia; (b) image of the study area and the typical communities selected; (c) residential blocks in the study area (data from EULUC-China: https://data-starcloud.pcl.ac.cn/zh/resource/7, accessed on 3 March 2023); (1), (2), and (3) display different types of residential communities; the labels in (a) denote the names of the administrative districts of Beijing.
Land 13 00823 g001
Figure 2. The flowchart framework of assessment.
Land 13 00823 g002
Figure 3. REQ assessment results within the Sixth Ring Road of Beijing.
Land 13 00823 g003
Figure 4. Typical residential blocks with different levels. (a) Blocks selected; (b) blocks with high level of REQ; (c) blocks with medium level of REQ; (d) blocks with low level of REQ.
Land 13 00823 g004
Figure 5. The scores of the REQ in each administrative district.
Land 13 00823 g005
Figure 6. The REQ of each primary indicator within the Sixth Ring Road of Beijing. (a) Environmental health and comfort; (b) housing comfort; (c) transportation convenience; (d) city security; (e) life convenience.
Land 13 00823 g006
Figure 7. The scores of each primary indicator in different administrative districts. A. Changping District; B. Chaoyang District; C. Daxing District; D. Dongcheng District; E. Fangshan District; F. Fengtai District; G. Haidian District; H. Shijingshan District; I. Shunyi District; J. Tongzhou District; K. Xicheng District; L. Beijing.
Land 13 00823 g007
Figure 8. The frequency distribution of different primary indicators.
Land 13 00823 g008
Figure 9. Comparison of the correlation between REQ and GDP, carbon emissions at different scales.
Land 13 00823 g009
Figure 10. Hotspot analysis results of each primary indicator. (a) REQ; (b) environmental health and comfort; (c) housing comfort; (d) transportation convenience; (e) city security; (f) life convenience.
Land 13 00823 g010
Table 1. REQ assessment system constructed in this study.
Primary IndicatorSecondary IndicatorNote
Environmental health and comfort
(ecological environment and urban greening)
Air Quality StatusReflecting PM2.5 Pollution
Noise IndexReflecting Noise Impact from Main Roads
Street Greening RateReflecting Green Space Coverage
Nearest Distance to ParksReflecting Proximity to Nature
Nearest Distance to Water Bodies
Comfortability of Temperature in JulyReflecting Heat Weather Conditions
Comfortability of Temperature in JanuaryReflecting Cold Weather Conditions
Housing comfort
(housing affordability and per capita resource availability)
Population DensityReflecting Per Capita Resource Availability
Housing Price to Income RatioReflecting Economic Burden and Degree
Transportation convenience
(the convenience of using vehicle and public transportation)
Road Network DensityReflecting Convenience of Vehicular Travel
Nearest Distance to Subway StationsReflecting Convenience of Public Transportation
Nearest Distance to Bus Stations
City security
(the proximity of residential areas to key emergency facilities)
Nearest Distance to Fire StationsReflecting Coverage of Fire Stations
Nearest Distance to Police StationsReflecting Coverage of Police Stations
Nearest Distance to Emergency SheltersReflecting Emergency Response Capability
Life convenience
(the comprehensiveness of public service infrastructure)
Company Distribution DensityReflecting Commuting Time to some extent
Nearest Distance to Convenience StoresReflecting Coverage of Shopping Services
Nearest Distance to Supermarkets
Nearest Distance to Vegetable Markets
Nearest Distance to KindergartensReflecting Coverage of Education Services
Nearest Distance to Primary Schools
Nearest Distance to Middle Schools
Nearest Distance to Community HospitalsReflecting Coverage of Medical Services
Nearest Distance to General Hospitals
Nearest Distance to Tertiary Hospitals
Nearest Distance to Pharmacies
Nearest Distance to Clinics
Number of Nearby RestaurantsReflecting Coverage of Dining Services
Nearest Distance to BanksReflecting Coverage of Financial Services
Nearest Distance to Sports FacilitiesReflecting Coverage of Sports Facilities
Nearest Distance to Charging StationsReflecting Coverage of Automotive Services
Nearest Distance to Gas Stations
Table 2. Multi-source data used for REQ assessment.
Data TypeData ResourceData FormatTime RangeResolution
Land Use TypesEssential Urban Land Use Categories in China (EULUC-China) [27]ESRI Shapefile2018/
Point of Interest (POI)Amap Map API CrawlingMicrosoft Excel2022/
Air Pollution Levels (PM2.5)Atmospheric Composition Analysis Group at Washington University in St. Louis [35]NetCDF20200.01° × 0.01°
Temperature Data (2 m)ERA5-Land Dataset [36]NetCDF20220.1° × 0.1°
Road Network DataOpenStreetMapESRI Shapefile2019/
Urban Green Space DataSentinel-2 Satellite Remote Sensing ImageTIFF202210 m × 10 m
Water Body DataOpen Street MapESRI Shapefile2023/
Population DataWorldPopTIFF2020100 m × 100 m
Housing Price DataReal Estate PlatformTIFF2023200 m × 200 m
GDP DataYangtze River Delta Science Data Center, National Earth System Science Data Sharing Infrastructure, National Science & Technology Infrastructure of China (http://geodata.nnu.edu.cn/) [40]TIFF20201 km × 1 km
Carbon Emissions DataODIAC [39]TIFF20191 km × 1 km
Table 3. Results of weight calculation.
Primary IndicatorsSecondary IndicatorsWeight
Environmental health and comfortAir Quality Status0.04719
Noise Index0.06906
Street Greening Rate0.05424
Nearest Distance to Parks0.00841
Nearest Distance to Water Bodies 0.01335
Comfortability of Temperature in July0.07862
Comfortability of Temperature in January0.01860
Housing comfortPopulation Density0.09449
Housing Price to Income Ratio0.01177
Transportation convenienceRoad Network Density0.06044
Nearest Distance to Subway Stations0.04436
Nearest Distance to Bus Stations0.06054
City securityNearest Distance to Fire Stations0.03342
Nearest Distance to Police Stations0.02985
Nearest Distance to Emergency Shelters0.02649
Life convenienceDistance to Commercial Centers0.00410
Company Distribution Density0.07063
Nearest Distance to Convenience Stores0.00715
Nearest Distance to Supermarkets0.00736
Nearest Distance to Vegetable Markets0.01272
Nearest Distance to Kindergartens0.01209
Nearest Distance to Primary Schools0.00767
Nearest Distance to Middle Schools0.00967
Nearest Distance to Community Hospitals0.02701
Nearest Distance to General Hospitals0.01966
Nearest Distance to Tertiary Hospitals0.01902
Nearest Distance to Pharmacies0.02428
Nearest Distance to Clinics0.02081
Number of Nearby Restaurants0.05297
Nearest Distance to Banks0.01314
Nearest Distance to Sports Facilities0.01146
Nearest Distance to Charging Stations0.01303
Nearest Distance to Gas Stations0.01640
Table 4. Correlation between REQ and GDP, carbon emissions at different scales.
VariableScale
1 km2 km3 km4 km5 kmStreet-Level
GDP0.209 **0.328 **0.361 **0.335 **0.359 **0.436 **
Carbon Emissions0.099 **0.094 *0.123 *0.427 **0.472 **0.309 **
** indicates significance at the 0.01 level (two-tailed); * indicates significance at the 0.05 level (two-tailed).
Table 5. Spatial autocorrelation analysis results.
Environmental Health and ComfortHousing ComfortTransportation ConvenienceCity SecurityLife Convenience
Moran’s Index0.860.540.340.430.59
z-score263.25202.90103.82162.74178.794
p-values00000
Disclaimer/Publisher’s Note: The statements, opinions and data contained in all publications are solely those of the individual author(s) and contributor(s) and not of MDPI and/or the editor(s). MDPI and/or the editor(s) disclaim responsibility for any injury to people or property resulting from any ideas, methods, instructions or products referred to in the content.