Abstract
This study explores the correlation between residents’ subjective assessments of urban neighbourhoods, obtained through virtual walkthroughs, and objective measures of deprivation. Our study was set within a specific city in the United Kingdom, with neighbourhoods selected based on Indices of Multiple Deprivation (IMD). We invited residents in the UK through Prolific, a crowdsourcing platform. Employing complete case analysis, TF-IDF keyword extraction, the Kruskal–Wallis test, and Spearman’s rank-order correlation, our study examines the alignment between subjective assessments and existing deprivation measures (IMD). The results reveal a nuanced relationship, suggesting potential subjective biases influencing residents’ perceptions. Despite these complexities, the study highlights the value of virtual walkthroughs in offering a holistic overview of neighbourhoods. While acknowledging the limitations posed by subjective biases, we argue that virtual walkthroughs provide insights into residents’ experiences that potentially complement traditional objective measures of deprivation. By capturing the intricacies of residents’ perceptions, virtual walkthroughs contribute to a more comprehensive understanding of neighbourhood deprivation. This research informs future endeavours to integrate subjective assessments with objective measures for robust neighbourhood evaluations.
1. Introduction
The massification of information technology and the emergence of digital platforms are offering new participatory channels for studying citizens’ perceptions [1] to enhance community engagement [2] in the equitable and impartial distribution of facilities and services. Citizen perception surveys play a vital role towards social and urban resilience of a neighbourhood, offering unique insights into how communities experience daily living. There are a range of indices that can provide researchers with high-level aggregated overviews of populations, such as the Human Development Index [3], Physical Quality of Life Index (PQLI) [4], Index of Multiple Deprivation [5], etc. However, citizen perception surveys can offer much more fine-grained understanding of populations [6], beyond standard measures of such indices. Ref. [7] highlighted the use of citizen perception on a case study of Municipal Solid Waste Management System in Guimaraes, revealing a significant positive relationship between Public Service Delivery and Citizen Satisfaction. Ref. [8] explored the multifaceted role of citizens’ perceptions in predicting neighbourhood environments, social support, and self-efficacy, thereby enhancing societal well-being through increased civic and community engagement. Similarly, [9,10] highlighted the need for incorporating citizen feedback for effective governance and service delivery.
A range of factors are typically used for evaluating built environment features of a neighbourhood. These assessments could be based on objective (e.g., household disposable income, employment, education, etc.) [11] and subjective (e.g., life satisfaction, job satisfaction, social cohesion, sense of community, sense of safety, happiness, etc.) indicators [12]. Objective aspects of a neighbourhood refer to quantifiable and measurable characteristics that can be assessed independently of the subjective perception of the residents, such as socioeconomic indicators [13] (e.g., median income and unemployment rate). Subjective aspects of a neighbourhood refer to the personal and emotional experiences, perceptions, and interpretations that individuals have about a neighbourhood [14]. These aspects are influenced by an individual’s feelings, attitudes, beliefs, and cultural background and are not easily quantifiable. Traditionally, economists and policymakers considered the GDP as a good indicator for assessing the well-being of a society, since it is strongly correlated with the standard of living indicators [14], but it alone may not capture the full spectrum of well-being, as it overlooks many qualitative aspects of people’s lives [15]. Hence, for more informed policy making, composite indices of human development and well-being [3,4,5] should be aligned with qualitative life experiences for capturing the intricate realities of individuals and communities at the local level [16]. Ref. [17] underscored the significance of integrating citizens’ perceptions with objective data in urban planning, focusing on the impact of environmental deprivation on urban liveability. Ref. [18] utilised the Index of Multiple Deprivation deciles to categorise neighbourhoods based on levels of deprivation, facilitating the analysis of greenspace exposure variations across socioeconomically diverse areas. By considering IMD deciles, the study was able to assess how greenspace exposure relates to socioeconomic status and its impact on premature mortality, providing valuable insights for targeted urban planning and public health interventions. Therefore, it is important to triangulate both qualitative assessments, providing insights into their subjective perceptions and the objective measures of deprivation in urban neighbourhoods to capture a nuanced understanding of housing [19,20] and community well-being [21].
Traditional methods like census data are expensive and infrequent to accurately measure socioeconomic deprivation in cities due to rising urbanisation and resultant inequalities [22]. Digital platforms can facilitate real-time communication, data collection, and analysis, which can lead to more informed decision-making, encouraging greater community engagement in civil society [23]. Ref. [22] proposed a novel method leveraging freely available user-generated content, such as Foursquare and OpenStreetMap, to quantitatively describe neighbourhoods using the “Offering Advantage” metric. This aims to capture distinctive urban elements present in each area. Moreover, in recent years, Street View Imagery (SVI), a mapping and navigation platform, has been considered as a rich source of data on cities from which geographic information can be derived [24] to construct the complex physical reality of cities. Ref. [25] systematically reviewed the effectiveness of Street View imagery (SVI) for automated research; assessed its functionality in quantifying spatial perceptions and semantic speculation; and identified challenges related to image acquisition, quality, and accuracy. Google Street View [26], the most well-known example of SVI utilisation [24], allows users to remotely explore streetscapes through 360° panoramic spatial information and observations of the real world from the perspectives of pedestrians [27]. It often supports activities such as estimating green space [28], the quality of streets, cleanliness, etc. Ref. [29] explored the association between urban green space and health outcomes, focusing on the visual perception of green space using Google Street View (GSV) panorama images from Portland, Oregon, since existing measures often overlook street-level exposures. Ref. [30] explained the use of unsupervised machine learning (ML) models and open geospatial data to capture the intra-urban diversity of deprived areas so as to address the challenge of managing deprived areas in cities of Low- to Middle-Income Countries (LMICs), focusing on São Paulo. Google Earth and Street View images were used in this study for validating and refining the results of the spatial analysis, particularly when assessing the characteristics of deprived areas in urban environments. Ref. [31] highlighted the importance of integrating street-level imagery with conventional data sources to monitor urban inequalities and evaluate policy effectiveness, stressing the need for enhanced data access and city resources, demonstrating the potential to complement traditional data and aiding urban surveillance to measure inequalities and monitor policy impacts. Ref. [32] showed GSV images as a valuable resource for studying neighbourhood influences on community health outcomes nationwide by analysing over 16 million GSV images of street intersections. This study utilised Google Street View (GSV) images and computer vision to characterise neighbourhood built environments across the United States, addressing a lack of data for many areas and a dearth of research on nonmetropolitan locations. Data collection using street view imagery is a relatively time- and cost-effective method to analyse the real-world dynamics of urban physical environments compared to traditional in-person assessments [33]. The utilisation of street view images was systematically reviewed by [34] in public health studies to sense urban environments. Street view images have been used to measure several neighbourhood attributes such as safety [35], house prices [36], greenness [37], urban landscape [38], etc., demonstrating that such resources are increasingly being used for observing and assessing the built environment. They provide a tangible and detailed perspective that complements quantitative assessments. The combination of computer vision techniques and human perception analysis offers a promising approach to bridge the gap between objective indicators and subjective experiences, ultimately leading to more effective urban planning. Ref. [39] illustrated how SVI captures both objective physical attributes and subjective human perceptions of neighbourhoods, offering valuable insights for urban designers and policymakers. These approaches highlight the broader implications and benefits for urban planning, community development, and civic engagement.
Assessing subjective factors such as safety, sense of belonging, and aesthetics for decision-making purposes might seem like an unusual choice; however, anecdotally, we often find ourselves visiting unfamiliar neighbourhoods for the better orientation of routes, surveying locations before buying or renting a property, looking at local shops and amenities, or even surveying for parking spaces to get a ‘feel’ for the space. In doing so, one might ask how realistic are these assessments, and do people have a general sense among themselves while they conduct these assessments? This is the primary driver for our research. Despite the wide range of applications of GSV, there is a lack of comprehensive studies that integrate participants’ qualitative assessments, providing insights into their subjective perceptions with existing objective measures of deprivation in urban neighbourhoods. While the standard metrics provide quantitative data, they often overlook the nuanced experiences and perceptions of residents. On the other hand, qualitative methods such as virtual walkthroughs capture subjective experiences but may lack the rigour and standardisation of quantitative measures. There is, therefore, a gap in the research that systematically compares and integrates these two approaches to provide a holistic understanding of urban neighbourhoods. This study aims to bridge this gap by conducting a comparative analysis to explore the relationship between the evaluations conducted through virtual walkthroughs, capturing participants’ qualitative experiences, and conventional objective measures of deprivation, highlighting the importance of incorporating both for a more thorough evaluation of the built-in characteristics of a neighbourhood. Hence, we seek to answer the following research questions:
- -
- RQ1: Is there a general sense of agreement amongst people when they virtually assess a range of qualitative aspects (affordability, social inclusion, social cohesion, attitude, and overall assessment) of urban neighbourhoods?
- -
- RQ2: What kind of visual characteristics do people observe while assessing urban neighbourhoods using virtual walkthroughs?
- -
- RQ3: How do participants’ perceptions of aesthetics, social cohesion, and other relevant factors, as captured through virtual walkthroughs, correlate with the standard objective measures of deprivation?
This paper is organised as follows: Section 2 presents the methodology we employed in conducting the virtual walkthrough, presenting an overview of the participants and tasks involved and how we analysed the data collected. Section 3 presents the results of our experiments, sharing our key findings. Section 4 presents discussions on our findings and concludes the paper.
2. Materials and Methods
2.1. Study Design and Survey
A questionnaire survey for 10 selected neighbourhoods through virtual walkthrough was conducted using Google Street View (Appendix A: Survey Questionnaire), where participants were invited to share their views on several factors of the neighbourhoods. The regions selected were from the same city (Sheffield, England) but captured a range of different levels of deprivation. The nature of the city (as described in Appendix B) offered an excellent opportunity to explore the physical characteristics of different regions with a wide range of deprivation profiles, which informed our choice of the city. The neighbourhoods selected for the virtual walkthroughs were residential streets, without any historical or natural landmarks. The streets also did not have any waterfronts, listed buildings, parks, or public squares. Our focus was to study primarily residential areas, so we chose streets that had only residential buildings to avoid the inclusion of additional contextual factors. Owing to the observations made by participants on the locations, and to avoid risks of identifying place and street names, the neighbourhoods will be referred to as Places 1–10.
The survey, designed in Qualtrics, was carried out by Prolific workers who are residents in the United Kingdom to gain an informed overview about the neighbourhood, given their knowledge and familiarity with the structure and organisation of cities and neighbourhoods in the UK. Prolific is a platform for the online recruitment of subjects, explicitly catering to researchers, follows good practice in recruitment, and explicitly informs participants that they are recruited for participation in research [40]. In setting the survey, the following selection criteria were set for participants:
- (i)
- participants must be located in the UK,
- (ii)
- participants should have an approval rate of 95–100,
- (iii)
- participants should be using a tablet or desktop to access the survey.
We chose a balanced sample for our study distribution, which aimed to ensure a gender balance among participants.
The survey involved the following set of tasks for participants:
- (i)
- Participants were required to read an information sheet and provide consent, as required by the ethics process at the primary authors’ institution.
- (ii)
- Participants were shown 1 location (of 10, randomly selected for each participant) on Google Street View (Figure 1, left) that focussed on a specific section of a road.
- (iii)
- As a control question, participants were asked to go up and down the road they were assigned (on Street View) and count the number of cars parked on either side of the road while observing the neighbourhood [41].
- (iv)
- Participants were then asked to answer a set of questions designed to capture their perception of the different aspects of the neighbourhood.
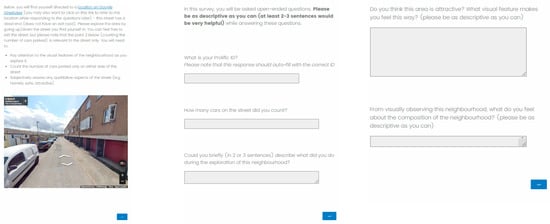
Figure 1.
Initial three screens of the virtual walkthrough survey, where the survey begins with a random location chosen from the ten selected neighbourhoods. To preserve the identity of the location, the location shown on this image is an example location.
Figure 1.
Initial three screens of the virtual walkthrough survey, where the survey begins with a random location chosen from the ten selected neighbourhoods. To preserve the identity of the location, the location shown on this image is an example location.
The survey was designed as follows:
- (i)
- Questions included both open-ended and closed-ended questions, and most of the questions assessed qualitative perspectives of being in the neighbourhood.
- (ii)
- In order to ensure that the survey would not be too intense for participants, participants were provided with a random selection of five open-ended questions (of nine). These questions, derived from factors that have an influence on planning outcomes [42], were aimed at assessing the following aspects of the neighbourhood:
- a.
- general attractiveness (Q3.1),
- b.
- composition of neighbourhoods (Q3.2),
- c.
- local ownership of community (Q3.3),
- d.
- community spirit (Q3.4),
- e.
- aesthetic value (Q9.1),
- f.
- level of comfort (Q9.2),
- g.
- level of satisfaction (Q9.3),
- h.
- sense of belonging (Q9.4),
- i.
- sense of security (Q9.5).
These factors are difficult to quantify, are qualitative in nature, and do not appear in the standard quantitative metrics and, hence, were deemed appropriate for inclusion in the study. - (iii)
- In addition to the open-ended questions, participants were asked questions on their assessment of:
- a.
- affordability of the neighbourhood (Q4),
- b.
- social inclusion (Q5),
- c.
- social cohesion (Q6),
- d.
- overall assessment (Q7),
- e.
- positive attitude (Q8).
Ministry of Housing, Communities & Local Government about English indices of deprivation 2019 data were considered for studying correlations between the subjective assessments carried out and the standard indicators of life to validate the use of virtual walkthroughs in assessing citizens’ perception of being in a neighbourhood. Hence, the Index of Multiple Deprivation (IMD, a statistical measure used in the United Kingdom used for assessing the relative deprivation of different areas) was used in this study to provide a comprehensive picture of deprivation across various the domains. IMD deciles were considered because of their granularity, their ability to consider a range of socioeconomic aspects for identifying substantial inequalities more explicitly, and to understand the alignment of participants’ perception (measured on a Likert Scale) with relative deprivation indices.
2.2. Participant Information
Survey responses were collected in two batches, spaced a few weeks apart. In total, 1135 valid questionnaire responses were received, after removing non-consented and incomplete submissions. We noted that some participant demographic data had expired at the time of analysis of the participants, which meant that our analysis had a handful of data points missing (this was due to either the participant deleting their profile or revoking access to the information or the profile being made unavailable by the platform). Participants, on average, had 1064 approvals for previous contributions (participant contributions are approved by the task designer), one participant with 4120 approvals (maximum), and another with 34 approvals (minimum). The average age of the participants was around 41 years, the oldest participant being between 84 and 89 years, while the youngest was between 19 and 24 (Figure 2, top left) (precise ages of participants withheld for anonymity).
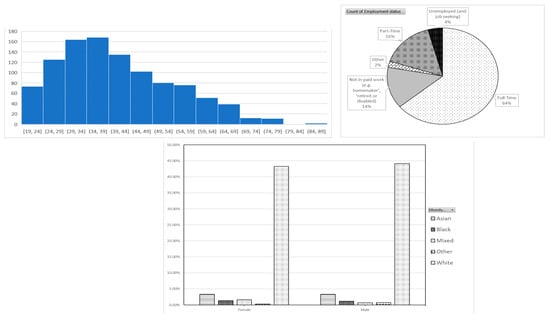
Figure 2.
Distribution of participant demographics: Top left: age distribution, Top right: employment, and Bottom: ethnicity grouped by gender—49.9% of our participants were female, while 50.1% were male—for either gender, the most common ethnicity was White, while Asian was the second-most common (Figure 1, bottom left). The nationality of the participants was mostly the United Kingdom (88.44%), followed by Italy (1.36%), Ireland (0.87%), Nigeria (0.78%), and the United States (0.78%). Besides these most common nationalities, participants from 31 other nationalities submitted their responses.
2.3. Data Collection
Two forms of data were collected:
- (a)
- Virtual walkthrough data—The participant responses from the virtual walkthrough survey included textual, nominal, and ordinal data and were completely anonymised. The data included participants’ subjective assessments on different parameters such as safety, aesthetic appeal, community spirit, local ownership of the community, affordability, social inclusion and cohesiveness, comfort and satisfaction level of residents, and sense of belonging for ten urban neighbourhoods. The regions were selected based on different demographic profiles and Indices of Multiple Deprivation. Respondents provided their subjective assessments using Google Street View and the overall ratings of the neighbourhood they ‘visited’. Each participant was only allowed one virtual visit, and repeat contributions were disabled.
- (b)
- English indices of deprivation—This secondary dataset [43] consisted of the Lower-layer Super Output Area (LSOA) that each postcode fell within and the deprivation data for that LSOA. This included ranks and deciles of the Index of Multiple Deprivation and its seven domains—Income, Employment, Education, Skills and Training, Health and Disability, Crime, Barriers to Housing and Services, and Living Environment. Indices for Income Deprivation affecting children and older people (IDACI and IDAOPI) were used alongside other measures of deprivation to focus on specific age groups. We expected this to address age-related vulnerabilities and provide a comprehensive understanding of the socioeconomic landscape. Table 1 provides an overview of the socioeconomic profile of these regions, demonstrating the range of different locations selected for the walkthroughs.
 Table 1. Index of Multiple Deprivation ranking and deciles.
2.4. Analysis
- (a)
- Data Preprocessing
Data collected through the Prolific platform were noisy and contained a considerable number of missing values due to withdrawal consent, access revocation, platform restrictions, entry errors, and system failures. It was assumed that locations of missing values in the dataset were purely random, and since the data included less than 5% missing values, complete case analysis was used as a rule of thumb [44]. Text data were pre-processed, which included tokenisation, stop word and punctuation marks removal, and lemmatisation [45]. Python NLTK was used for the removal of stop words, tokenisation, and lemmatisation, since it provides WordNet Lemmatizer, which uses the WordNet Database to look up the lemma of words [46].
- (b)
- Kruskal–Wallis Test
The non-parametric statistical test [47] was used to test if there was agreement amongst participants when they used virtual walkthroughs to subjectively assess urban neighbourhoods [48]. The test was conducted for the ordinal attributes: affordability, socially inclusive, socially cohesive, positive attitude, and overall assessment of the neighbourhood. Ordinal attributes were recoded as numerical values (e.g., definitely not as 1, probably not as 2, might or might not as 3, probably yes as 4, and definitely yes as 5). The results of this test help answer RQ1 (‘Is there a general sense of agreement amongst people when they virtually assess a range of qualitative aspects (affordability, social inclusion, social cohesion, attitude, and overall assessment) of urban neighbourhoods?’)
The null and the alternative hypotheses are as follows:
H0.
There is no significant difference in the distributions of the ordinal attributes across the different groups (urban neighbourhoods).
H1.
There is a significant difference in the distributions of the ordinal attributes across the different groups (urban neighbourhoods).
If the results of the Kruskal–Wallis test were statistically significant, then Dunn’s test would be performed to determine exactly which groups were different. Dunn’s test performs pairwise comparisons between each independent group to determine which groups are statistically significantly different at the α level of significance [49]
- (c)
- Keyword extraction
Keyword extraction is a text analysis technique that extracts frequently used and most relevant words from a text to summarise the content of texts and recognise the main features discussed. In this study, TF-IDF (Term Frequency-Inverse Document Frequency) scores were used to analyse the text descriptions that participants used while assessing their neighbourhoods through virtual walkthroughs [50]. The results of this analysis helped answer RQ2 (‘What kind of visual characteristics do people observe while assessing urban neighbourhoods using virtual walkthroughs?’).
TF-IDF measures the importance of a word by considering its frequency within a specific document relative to its frequency across the entire corpus. Key qualitative features with high TF-IDF scores with the ngram_range = (2, 2) parameter were identified for each document. Extracting significant bi-gram phrases from the textual descriptions provided more context and nuanced understanding compared to single words. Moreover, due to the high volume of data, the top 5 bi-gram phrases based on their TF-IDF scores were analysed to gain insights into the descriptions participants used to assess their urban neighbourhoods. The identified key qualitative features were aligned with the standard IMD metrics to assess whether there was an alignment between participants’ emphasis on certain attributes and IMD metrics. This helped to determine how participants’ perceptions of aesthetics, composition, attractiveness, local ownership, sense of security, level of comfort, level of satisfaction, sense of belonging, and community spirit provided insights into subjective perceptions aligned with objective measures of deprivation (IMD). This helped partially answer RQ3 (‘‘How do participants’ perceptions of aesthetics, social cohesion, and other relevant factors, as captured through virtual walkthroughs, correlate with the standard objective measures of deprivation?’).
- (d)
- Spearman Rank Correlation
Spearman’s rank-order correlation (rs), a non-parametric correlation coefficient, was used to study the relationship between the subjective perceptions collected through virtual walkthroughs and the objective measures of deprivation to determine whether virtual walkthroughs can effectively capture and assess citizens’ perceptions of a neighbourhood’s qualities, as indicated by their correlation with established measures of deprivation [51,52]. This test also helped to understand if perceptions of affordability, social inclusion, social cohesion, positive attitude, and overall rating, as captured through virtual walkthroughs, correlate with the objective measures of deprivation used in standard governmental measures, further contributing to partially answer RQ3 (‘How do participants’ perceptions of aesthetics, social cohesion, and other relevant factors, as captured through virtual walkthroughs, correlate with the standard objective measures of deprivation?’) To determine whether the Spearman’s rank-order correlation was significant or not, either a t-test (n < 30) or z-test (n ≥ 30) was performed.
The null and the alternative hypothesis are as follows:
H0.
There is no significant correlation between the qualitative attributes (affordability, social inclusion, social cohesion, positive attitude towards the neighbourhood, and overall perception of the neighbourhood) and IMD dimensions.
H1.
There is a significant correlation between the qualitative attributes and IMD dimensions.
3. Results
3.1. Perception of the Participants
The overall perception of being in a neighbourhood along with other qualitative attributes like affordability of a neighbourhood, social inclusion, and cohesion within a neighbourhood and positive attitude towards a neighbourhood were rated on a 5-point Likert Scale. Table 2 illustrates the median ratings for overall perception. Based on the assessments of overall perception, Places 1, 3, 5, 6, 8, and 10 were perceived to be lower than Places 2, 4, 7, and 9. This, to some extent, aligns with the overall IMD deciles of Places 2, 4, 7, and 9 being higher scores than 1, 3, 5, 6, 8, and 10. Figure 3 shows that participants were more likely to rate the places as 2, 3, and 4 and less likely to rate the places as 1 and 5, i.e., skewed towards the middle range. This indicates a general tendency towards a moderate level of satisfaction reflecting a balanced perception of the neighbourhoods and avoiding extreme opinions.
Table 2.
Median ratings for overall perception.

Figure 3.
Raw rating counts by neighbourhood: perception on a scale of 1 to 5 (a rating of 1 indicates a negative perception, while 5 indicates positive); purple (fewest ratings) to yellow (most ratings).
The underlying distribution of the ordinal data collected on various qualitative attributes (affordability, social inclusion, social cohesion, positive attitude, and overall perception) is illustrated in Figure 4. The stacked box plots depict the distribution of participants’ perceptions of these attributes. Some places depict a skewed distribution, while others show a more balanced spread of perceptions. For example, social inclusion within Places 1 and 5, social cohesion within Place 1, and positive attitude towards Places 6 and 8 depicts a more balanced spread of perceptions. Contrarily, Place 1 for the attribute affordability appears to be positively skewed, suggesting that most respondents perceive the affordability of the place to be high, with only a few perceiving it as low, whereas the distribution for Place 5 for affordability of the neighbourhood appears to be negatively skewed, suggesting that most respondents perceived the affordability of the place to be low, with only a few perceiving it as high. However, these interpretations are based on observing visual cues in the box plots, although there might be ambiguity due to the inherent limitations of box plots in fully capturing the complexities of the data distributions. Furthermore, a significant amount of variability is also observed within each area, along with outliers in nearly every location, possibly due to specific unique characteristics of a neighbourhood that influence participants’ perceptions. Particularly noteworthy is the atypical distribution observed for the affordability of Place 6 and Place 8, where there is a concentration of data in the lower range, with few data points significantly deviating from the norm. This illustrates a perception of homogeneity within these neighbourhoods. Although, the perception of homogeneity is influenced by factors like the data collection methods, sample size, or specific variables being measured and might not reflect the entire diversities and complexities that often exist within a neighbourhood.

Figure 4.
Perception variability amongst the respondents about being in an urban neighbourhood: (a) affordability; (b) social inclusion; (c) social cohesion; (d) positive attitude; (e) overall perception.
Hence, it reveals that there are varying patterns in participants’ perceptions across different neighbourhoods, with some places showing more balanced opinions while others display skewed distributions.
Furthermore, the Kruskal–Wallis test (Table 3) determines that there is a statistically significant difference in how people perceive each attribute (affordability, socially inclusive, socially cohesive, and positive attitude of a neighbourhood) across ten urban neighbourhoods, since the Asymp. Sig. (two-sided) is 0 (0 < 0.01). This provides a more comprehensive understanding of the variations in perceptions within each attribute category.
Table 3.
Kruskal–Wallis test of people’s perceptions.
Since the results are significant for each category, a post hoc Dunn’s test was conducted with Bonferroni-corrected alpha (0.0011) for multiple comparisons. Table A1 (Appendix C) represents a comparison of different places based on various qualitative aspects, such as affordability, social inclusion, social cohesion, positive attitude, and overall ratings. The “✓” marks indicate which qualitative aspects are significantly different between the two places being compared. Hence, this identifies the specific pairs of neighbourhoods that have significantly different perceptions for each attribute. For instance, Place 1 is significantly different from Place 2, Place 3, Place 4, Place 5, Place 6, Place 7, Place 8, Place 9, and Place 10 in terms of affordability, social inclusion, social cohesion, positive attitude, and overall ratings. Hence, we conclude that differences in perception are not random and can be attributed to the unique characteristics present within each neighbourhood. For example:
- Affordability: Significant variations in perception about the affordability of different places could be attributed to factors such as local economic conditions, housing policies, or demographic characteristics.
- Social Inclusion and Social Cohesion: Significant differences in perceptions for these attributes may suggest variations in community demographics, levels of diversity, social programs, or community engagement initiatives.
- Positive Attitude and Overall Ratings: Significant differences in positive attitude and overall ratings between neighbourhoods may indicate variations in factors such as residents’ perceptions of safety, amenities, public services, and overall quality of life.
Our analysis of the perceptions of the participants therefore reveals statistically significant variations in their perceptions across various urban neighbourhoods. The identified significantly different mean ranks for attributes such as affordability, social inclusion, social cohesion, positive attitude, and overall neighbourhood ratings emphasise the nuanced distinctions in how residents perceive their living environments.
3.2. Comparison of Participant Perception with IMD Scores
An analysis based on the data presented in Figure 5, compares participants’ ratings of different neighbourhoods and their alignment with the Index of Multiple Deprivation (IMD) deciles. The findings illustrated that there are both agreements and disagreements between participants’ perceptions and the Indices of Multiple Deprivation:
- (1)
- Place 5 (IMD decile 2): Despite being identified as the most deprived neighbourhood according to the IMD, a small percentage of participants rated it 1 (1.02%) and 2 (9.18%) on the Likert Scale. This indicates that some individuals have a more positive qualitative perception of this neighbourhood compared to what the IMD decile suggests.
- (2)
- Place 1 (IMD decile 3): This neighbourhood is identified as one of the deprived regions. Only 5.56% of people rated this place as 4, and none of the participants rated it as 5 (least deprived), which indicates that participants’ subjective evaluations align with the objective measure of deprivation in the identified neighbourhood.
- (3)
- Place 3 and Place 8 (IMD decile 3): These neighbourhoods, despite being identified as deprived according to the IMD, received higher ratings from a considerable number of participants. This suggests that there might be visual features of these neighbourhoods that offer a more favourable perception among certain participants.
- (4)
- Place 6 and Place 10 (IMD decile 5): These neighbourhoods are moderately deprived, and most of the participants rated them as 2, 3, and 4, which reflects a balanced perception of the neighbourhood, acknowledging both positive and negative aspects associated with moderate deprivation.
- (5)
- Place 2, Place 9, Place 4, and Place 7 (IMD deciles 7, 7, 9, and 10, respectively): These neighbourhoods, which are considered the least deprived regions based on the IMD deciles, align well with participants’ perception of being favourable neighbourhoods. This alignment indicates that participants’ perceptions are consistent with the low levels of deprivation indicated by the governmental index.

Figure 5.
Alignment of perception with relative deprivation indices, where a participant rating of 1 indicates the least positive (most deprived) and 5 indicates the most positive (least deprived). The question for these responses is Q7 (On a scale of 1–5, how would you rate this neighbourhood?).
Figure 5.
Alignment of perception with relative deprivation indices, where a participant rating of 1 indicates the least positive (most deprived) and 5 indicates the most positive (least deprived). The question for these responses is Q7 (On a scale of 1–5, how would you rate this neighbourhood?).
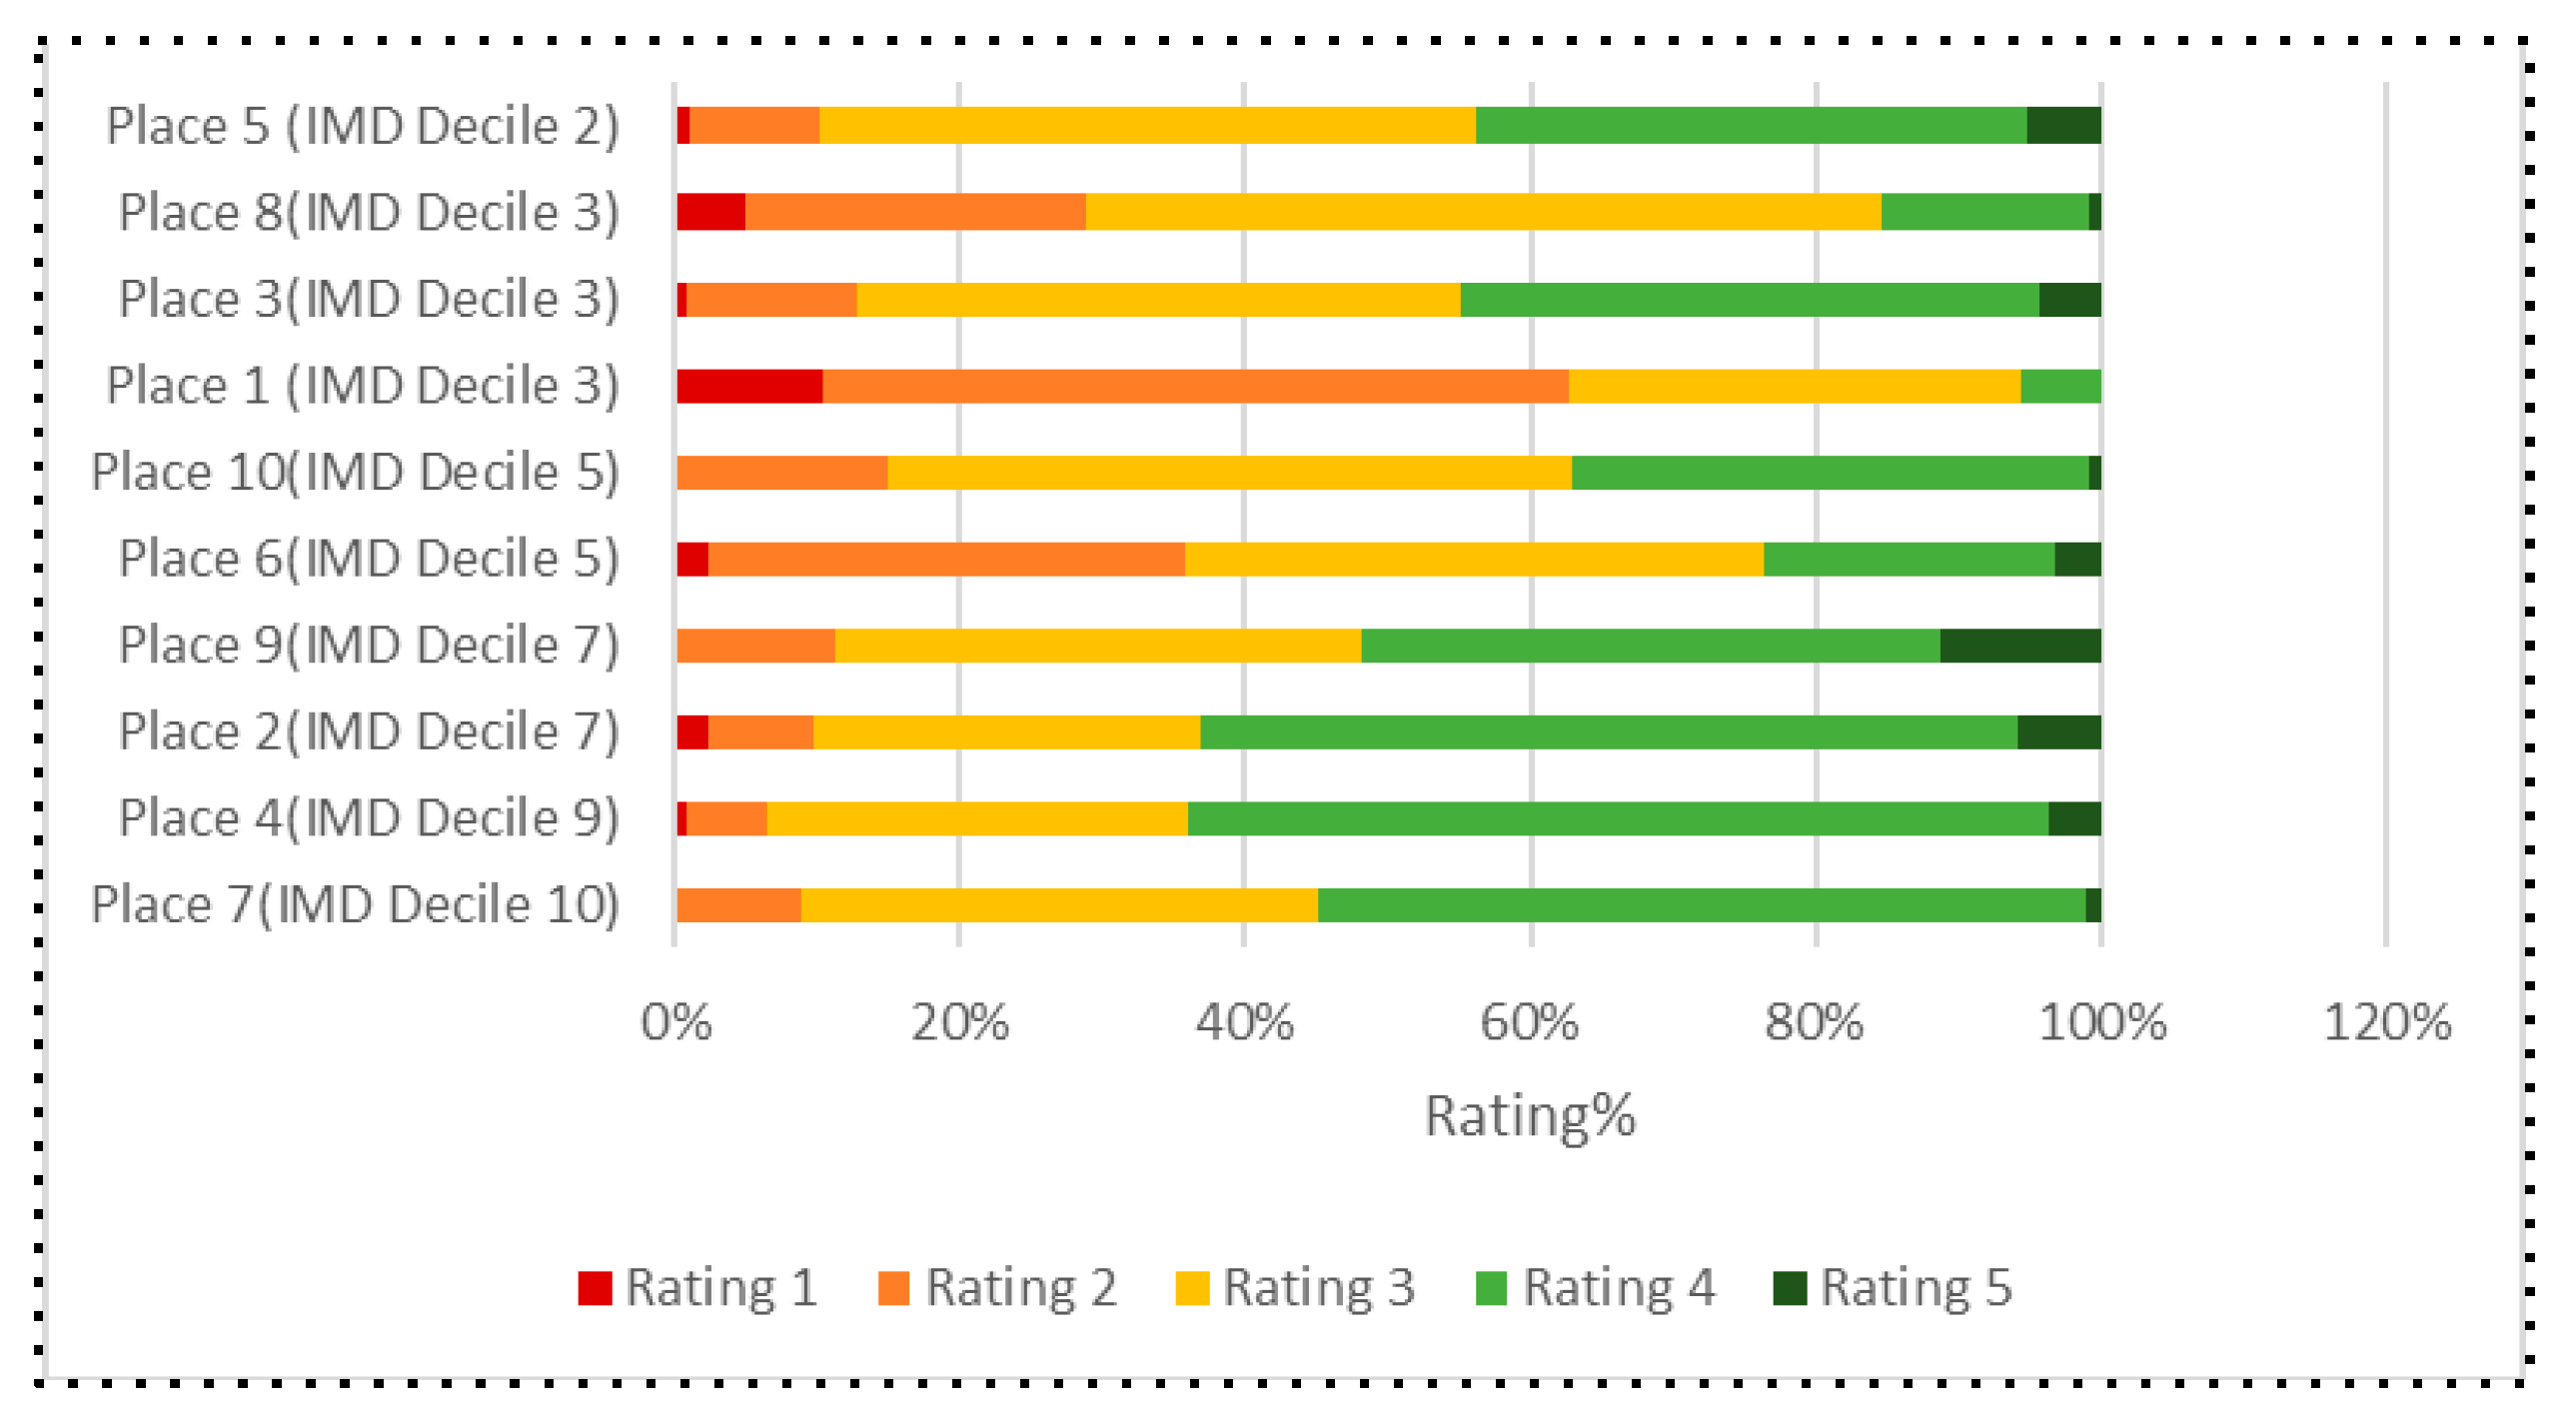
In conclusion, the exploratory analysis shows that participants have varied perceptions about different neighbourhoods, and these perceptions are, to some extent, compatible with the Index of Multiple Deprivation. However, there are instances where participants’ perceptions differ from the IMD scores, highlighting the complexity and the importance of subjective perceptions alongside objective measures.
Furthermore, the correlation tests (Table 4) identify statistically significant relationships between some of the qualitative attributes and different dimensions of the Index of Multiple Deprivation (IMD), illustrating a complex interplay between qualitative attributes and IMD dimensions. Significant correlations are as follows:
- (a)
- Significant Negative Correlations with Affordability (p-Value ≤ 0.05):
Participants’ assessments of affordability are significantly negatively correlated with the following IMD dimensions: Education and Skills, Health and Disability, IDACI (Income Deprivation Affecting Children Index), and overall IMD. The results suggest that lower affordability, as perceived by participants, is associated with higher levels of deprivation in various dimensions of the Index of Multiple Deprivation, including education, health, income affecting children, and overall deprivation. For example, on average, as people perceive affordability to be lower, there tends to be a higher level of deprivation in terms of education and skills in the corresponding areas.
- (b)
- No Significant Correlations with Social Inclusion, Social Cohesion, and Positive Attitude (p-Value > 0.05):
The assessment of social inclusion, social cohesion, and positive attitude towards the neighbourhoods are not significantly correlated with any of the IMD dimensions. This means that these qualitative attributes do not show a clear relationship with the dimensions of deprivation. This suggests that visual indicators in the selected neighbourhoods were not sufficient to offer insights into these factors.
- (c)
- Significant Correlations with Overall Perception (p-Value ≤ 0.05):
Overall perception about the neighbourhood is significantly correlated with multiple IMD dimensions: Income, Employment, Education and Skills, Health and Disability, Crime, IDACI, and overall IMD. This suggests that, for our participants, the overall perception of a neighbourhood aligns with various socioeconomic IMD dimensions, such as income, education, health, and crime.
Table 4.
Spearman’s rank correlation (two-tailed values).
Table 4.
Spearman’s rank correlation (two-tailed values).
| Income | Employment | Education and skills | Health and Disability | Crime | Barriers to Housing and Service | Living Environment | IDACI | IDAOPI | IMD Decile | |
|---|---|---|---|---|---|---|---|---|---|---|
| Affordability | −0.58 | −0.62 | −0.77 | −0.74 | −0.62 | −0.35 | −0.15 | −0.58 | −0.38 | −0.77 |
| p = 0.08 >0.05 | p = 0.06 >0.05 | p = 0.01 <0.05 | p = 0.02 <0.05 | p = 0.06 >0.05 | p = 0.32 >0.05 | p = 0.67 >0.05 | p = 0.01 <0.05 | p = 0.27 >0.05 | p = 0.01 <0.05 | |
| Social inclusion | −0.02 | 0.022 | 0.14 | −0.11 | 0.32 | 0.04 | −0.5 | −0.16 | −0.21 | −0.02 |
| p = 0.96 >0.05 | p = 0.95 >0.05 | p = 0.70 >0.05 | p = 0.75 >0.05 | p = 0.37 >0.05 | p = 0.92 >0.05 | p = 0.14 >0.05 | p = 0.66 >0.05 | p = 0.56 >0.05 | p = 0.96 >0.05 | |
| Social cohesion | −0.22 | −0.07 | 0.04 | −0.07 | 0.47 | 0.11 | 0.145 | 0 | −0.32 | 0.04 |
| p = 0.55 >0.05 | p = 0.84 >0.05 | p = 0.92 >0.05 | p = 0.84 >0.05 | p = 0.17 >0.05 | p = 0.76 >0.05 | p = 0.69 >0.05 | p = 1 >0.05 | p = 0.36 >0.05 | p = 0.92 >0.05 | |
| Positive attitude | 0.18 | 0.3 | 0.04 | −0.7 | 0.47 | 0.11 | 0.14 | 0 | −0.32 | 0.04 |
| p = 0.62 >0.05 | p = 0.39 >0.05 | p = 0.92 >0.05 | p = 0.84 >0.05 | p = 0.17 >0.05 | p = 0.76 >0.05 | p = 0.69 >0.05 | p = 1 >0.05 | p = 0.36 >0.05 | p = 0.92 >0.05 | |
| Overall rating | 0.67 | 0.72 | 0.75 | 0.74 | 0.72 | 0.4 | −0.05 | 0.76 | 0.55 | 0.84 |
| p = 0.03 <0.05 | p = 0.02 <0.05 | p = 0.01 <0.05 | p = 0.01 <0.05 | p = 0.02 <0.05 | p = 0.26 >0.05 | p = 0.89 >0.05 | p = 0.01 < 0.05 | p = 0.10 >0.05 | p = 0.002 <0.05 |
3.3. Analysis of Open-Ended Responses
As can be observed in the Questionnaire (Appendix A), the participants were also asked to elaborate on their perceptions of the neighbourhood through open-ended questions. Given the high volume of responses, the analysis of the open-ended responses involved analysing the key terms extracted from the text. Term analysis drew significance from the kind of descriptions participants used while assessing their urban neighbourhoods using virtual walkthroughs. The key qualitative attributes that were most relevant for determining the qualitative indicators in these urban neighbourhoods were identified using the TF-IDF scores with the ngram_range = (2, 2) parameter.
3.3.1. Most Deprived Places
Table A2 (Appendix C) presents the most significant key terms from the text responses of the open-ended questions of the most deprived places.
Place 5, which belongs to 20% of the most deprived areas within the UK, received a considerable number of high ratings on the Likert Scale (43.88%). Participants’ associated descriptors contributed to their positive perceptions, which included aesthetically pleasing, tidy spacious, neighbourhood clean, feels secure, boundaries fenced, and street clean. For example, participants mentioned:
“… the houses look nice, most of them were well-maintained. There was lots of green space. It didn’t seem cramped, it wasn’t too full of cars.”
“… how safe and calm it is.”
“Well manicured gardens with plenty of evidence of civic pride in neighbourhoods, elderly housing was evident with a large number of family dwelling.”
These comments highlight the neighbourhood’s aesthetic appeal and attractiveness, indicating a good living environment.
Furthermore, participants who provided low ratings on the Likert Scale (10.2%) identified some visible characteristics that contributed to their negative perceptions, like low class, looks poor, poor strangers, depressing area, feel unsafe, etc. For example, participants mentioned:
“lower class families. just from looking at the cars and the houses. very small houses. old cars.”
“… would feel unsafe there because it feels like a poor or deprived area. This is because of the small terraced houses.”
“… not my sort of attractive area but it is ok to live in. It looks like it is made up of council houses and usually people in council houses are poor and there might be a high rate of crime in such an area”.
This suggests that these participants associate the area with a lack of vibrancy, a sense of danger, and believe that there is a significant presence of financially disadvantaged residents. The relative deprivation for Place 1, Place 3, and Place 8 (30% of the most deprived areas within the UK) illustrates there is almost the same level of deprivation in all the sectors of societal development.
Participants who provided high ratings associated specific features with their positive perceptions. These features included terms like well looked, rubbish street, green clean, working class, sense pride, feels claustrophobic, tidy spacious, and trouble street. The analysis also revealed substantial differences in opinions among participants regarding the places being assessed. Notably, none of the participants rated Place 1 with a rating of 5. Additionally, only a small percentage of participants (4.2% for Place 3 and 0.8% for Place 8) assigned a rating of 5 to these places, indicating that these places might have specific characteristics that are particularly appealing to only a subset of participants.
For example, participants of Place 1 mentioned:
“… low income neighbourhood with small households.”
“… well maintained much litter and well kept houses. The appearance suggests that residents have local ownership.”
whereas Place 3 and Place 8 participants mentioned:
“… clean and tidy but not attractive, the street lighting is minimal but there is rails to help the elderly.”
“… great but it feels claustrophobic.”
“… wouldn’t say a strong community spirit but the houses are all well keeps, and the area is clean and tidy so some level of care has gone into the area from the community.”
Participants who provided low ratings on the Likert Scale identified some visible characteristics, like neighbourhood appealing, depressing live, poor strangers, unappealing street, no rubbish visible, etc.
For example, a participant writing about Place 1 observed:
“… little rough and a bit derelict. It looks quite damp and sad and there isn’t much around it like shops or parks…”
A participant observed about Place 3:
“Isolated, lonely, not very attractive.”
Another participant observed about Place 8:
“… not the best example of an attractive residential area but there are plenty of worse examples in this country. The public areas were free of rubbish and the houses appeared to be in a decent state…”
Despite the same level of overall deprivation, these places exhibited unique characteristics that resonated differently with participants, leading to diverse ratings and perceptions.
3.3.2. Medium Level of Deprivation
Table A3 (Appendix C) describes how participants observed Places 6 and 10, which constitute a medium level of deprivation, as per the Indices of Multiple Deprivation.
The comparative analysis between Place 6 and Place 10 revealed intriguing differences in citizens’ perceptions of these neighbourhoods, despite both having the same level of relative deprivation. This contrast became evident when considering the IMD aspects in which these places were relatively better off:
For Place 6:
- Income,
- Employment,
- Education and Skills,
- Health and Disability.
For Place 10:
- Crime,
- Barriers to Housing and Society,
- Living Environment.
While both neighbourhoods experienced similar overall relative deprivation, the distinct sectors in which they showed comparative advantages appeared to drive differing perceptions among citizens.
The perceptions of citizens who provided high ratings for Place 6 on the Likert Scale associated specific descriptors with their positive perception. Some of the key features they identified as having high predictive value for the relative identification of quantitative metrics included attractive area, little cramped, tidy properties, litter graffiti, aesthetically pleasing, tidy spacious, and security high.
In contrast, for Place 10, participants who provided high ratings highlighted a different set of features that they found most relevant for their perceptions of the neighbourhood. These features included poor working, front yards, homely neighbourhood, semi-detached, sense pride, and safe street. It is evident that their evaluations were influenced by factors such as the neighbourhood’s character, the presence of families and children, the type of housing, and a sense of safety and pride.
For example, participants of Place 6 mentioned:
“… very aesthetically pleasing. There are a lot of trees and shrubbery, greenery brightens up streets and neighbourhoods. The grassy areas are well tended and the houses/flats look well maintained.”
“I sense security is high in the area again due to the appearance of the area being nice and tidy. I would suspect a very close neighbourhood where everyone looks out for each other”
Whereas, for Place 10, participants mentioned:
“… a poor working class living there, not much social houses.”
“… no indication of any vandalism or anything. The street seemed well kept. This also gives people pride about living there which evokes a happy lifestyle.”
Participants who gave low ratings on the Likert Scale for Place 6 associated their perceptions with descriptors such as lower class, well kept, socialising street view, poor strangers, comfortable fairly, depressing area, and feel unsafe. For example, participants of Place 6 mentioned:
“… looks neglected. I appreciate that if the houses are social housing then the council are at fault, but there is very little planting or decor to suggest any pride in their home.”
“block of flats definitely feels unsafe to me as a small woman.”
“… relatively poor neighbourhood. Therefore, I think there is a higher risk of crime there.”
On the other hand, for Place 10, descriptors such as working class, cramped narrow, young families, clean looked, aesthetically pleasing, and neighbourhood suburban were relevant to participants’ perceptions and played a significant role in their assessments. For example, they mentioned:
“working class families”.
“It’s very residential and safe for young families”.
“Some of the home owners have made efforts to enhance the appearance of their property and provide off street parking, which is aesthetically pleasing”.
The comparative analysis between Place 6 and Place 10 illustrates the complexity of subjective perceptions within neighbourhoods of similar relative deprivation levels. These further emphasise the multifaceted nature of how individuals perceive and evaluate their living environment by a combination of tangible attributes, visual cues, and intangible factors.
3.3.3. Least-Deprived Places
Table A4 (Appendix C) represents the most significant key terms from the text responses of the open-ended questions for the least-deprived places.
The IMD score for Place 2 (decile 7), Place 4 (decile 9), Place 7 (decile 10), and Place 9 (decile 7) suggests a high standard of living.
However, specific sectors within these neighbourhoods, such as Living Environment for Place 2; Income and Employment for Place 4; Income, Education, Barriers to Housing, and Society and Employment for Place 7; and Income, Barriers to Housing and Society, and Living Environment for Place 9 exhibit higher levels of deprivation compared to other sectors. This discrepancy highlights the need to consider individual aspects within neighbourhoods, as, even in relatively well-off areas, certain sectors might still face challenges. These highlight the need for combining governmental index and subjective assessments to gain a more comprehensive understanding of the standard of living and the unique characteristics of different neighbourhoods.
The subjective assessment of these neighbourhoods further reveals differences in citizens’ perceptions. It is notable that a similar percentage (approximately 63%) of people gave high ratings for Place 2, Place 4, and Place 7, while slightly fewer participants (51.87%) provided high ratings for Place 9.
Participants who provided low ratings on the Likert Scale for the least-deprived places focused on a range of descriptors to express their perceptions. These descriptors included terms like new build, planting gardens, middle class, working class, privately owned, litter clean, socialising street view, little rough, comfortable area, and feel unsafe. These features were considered highly relevant by participants for identifying quantitative metrics related to the relative quality of these neighbourhoods.
This analysis underscores that, even in areas with a generally high standard of living, individuals’ perceptions are shaped by a combination of factors, both physical and social. The presence of terms like new build and privately owned and descriptors related to the condition of the neighbourhood, such as litter clean and little rough, indicates the importance of the physical environment and the overall appearance of the neighbourhood to residents.
For example, participants of these places mentioned:
“White, middle aged, lower middle class/working class, in employment.”
“It felt like a very busy road with not much garden or space for cars.”
The descriptors poor area and looks poor were two phrases with high TF-IDF scores for Place 7 and Place 9, depicting low standards of living, which was contradictory with their Income deciles, which were 10 and 8, respectively.
For example, participants mentioned:
“… well presented houses and plenty of trees/bushes. The houses are a good size with driveways/parking, however the quality of the road itself looks poor and needs upkeep—suspect it’s lacking attention or not a priority for the local council.”
“level of satisfaction would be low because it feels like a poor area and the place doesn’t look that good so.”
Citizens who provided high ratings on the Likert Scale mostly perceived that, for the least-deprived places, neighbourhood attractive, nicely spaced, liked greenery, rubbish street, safe welcoming, secure boundaries, security high, security cameras, little cramped, well maintained, etc. were the most relevant features.
For example, participants mentioned:
“… looks orderly; this invokes a sense of security. Residents have private space to park their cars.”
“… looks pleasant so has a good aesthetic value. It is tidy and quiet which makes it seem like a nice and safe place to be.”
“… attractive area, the houses are well kept with tidy gardens. The area is specious and there are plenty of trees.”
3.4. Key Findings
In conducting the assessment of neighbourhood walkthroughs using Google Street View, our findings indicate that:
- There is a prevailing inclination towards a moderate level of satisfaction among participants, indicating a balanced perception of the neighbourhoods under investigation. This suggests that individuals tended to avoid expressing extreme opinions, whether overtly positive or negative, and instead, their feedback or responses fell within a more moderate and balanced range. This balanced perspective might indicate a nuanced and thoughtful evaluation of the neighbourhoods, possibly considering both positive and negative aspects without leaning towards extreme judgments.
- The distribution of participants’ perceptions regarding attributes such as affordability, social inclusion, social cohesion, positive attitude, and overall perception appeared to be skewed, with the exception of a few places where a more balanced spread of perceptions was observed. The skewed distribution of the respondents were positive (a higher perception or rating) and negative (a lower perception or rating). These interpretations were, however, based on observing visual cues in the box plots (Figure 4), and there might have been ambiguity due to the inherent limitations of box plots in fully capturing the complexities of the data distributions.
- There was some evidence that the overall subjective assessments of the neighbourhoods were aligned with certain Indices of Multiple Deprivation factors, such as income, employment, education and skills, health and disability, crime, and IDACI (Income Deprivation Affecting Children Index). However, while assessing specific qualitative attributes (e.g., social inclusion, social cohesion, and positive attitude) of the neighbourhoods with respect to the IMD factors, our analysis revealed that the perceptions were, to some extent, compatible with the Index of Multiple Deprivation but not significantly correlated with any of the IMD dimensions. Participant assessments of affordability were significantly negatively correlated with Education and Skills, Health and Disability, IDACI (Income Deprivation Affecting Children Index), and overall IMD.
- In assessing the most deprived places, participants tended to observe characteristics such as aesthetically pleasing, tidy spacious, neighbourhood clean, feels secure, boundaries fenced, and street clean for their positive assessments, while observing characteristics such as well looked, rubbish street, green clean, working class, sense pride, and feels claustrophobic for their negative assessments.
- In assessing moderately deprived places, participants tended to observe characteristics such as attractive area, little cramped, tidy properties, litter graffiti, aesthetically pleasing, security high, homely neighbourhood, semi-detached, and sense pride for their positive assessments, while observing characteristics such as lower class, well kept, socialising street view, poor strangers, comfortable fairly, depressing area, and feel unsafe for their negative assessments.
- In assessing the least-deprived places, participants tended to observe characteristics such as neighbourhood attractive, nicely spaced, liked greenery, rubbish street, safe welcoming, secure boundaries, security high, security cameras, little cramped, and well maintained for their positive assessments, while observing characteristics such as new build, planting gardens, middle class, working class, privately owned, litter clean, and socialising street view for their negative assessments.
4. Discussion
The discrepancies in how participants rated these places underscore the need to consider a diverse range of factors that contribute to individuals’ perspectives and perceptions. These factors could include personal experiences, cultural backgrounds, socioeconomic status, and other contextual elements that shape how people interpret and assess their surroundings. Hence, to highlight the complex and multifaceted nature of urban neighbourhoods’ perceptions, a comprehensive analysis of perceptions across ten urban neighbourhoods was conducted. While certain areas exhibited characteristics associated with higher levels of deprivation, others excelled in fostering social inclusion, cohesion, and positive attitudes. The statistical analyses further emphasised the significance of these variations and provided a deeper insight into the diversity of the perceptions across neighbourhoods using exploratory analysis and non-parametric tests. Similarly, [17] underscored the importance of understanding variations in perceptions across different neighbourhoods and demographic groups regarding environmental deprivation and its contributing factors using techniques like exploratory analysis and one-way ANOVA, highlighting the need for targeted interventions and policy measures to address specific concerns within these neighbourhoods. Hence, this research was primarily motivated by the absence of a unified understanding of theoretical and methodological approaches for comprehensively capturing the holistic experience of belonging to a neighbourhood through virtual walkthroughs. Our results suggest that, while virtual walkthroughs offer unique, scalable, and affordable opportunities to assess qualitative factors in urban neighbourhoods, the range of factors that can be assessed needs careful and balanced consideration. In the future, we aim to use these results to develop a framework for virtual walkthroughs that can be applied to wider contexts.
The varied perceptions amongst participants, whether they are skewed or more balanced spreads of perceptions or perceptions of homogeneity about different aspects of the neighbourhoods, reflect all the diversities and complexities that often exist within a neighbourhood. This variability emphasises the importance of taking a comprehensive and nuanced approach when evaluating and addressing the quality of different urban areas.
While objective measures provide valuable insights, they may not capture the full range of individual experiences and perspectives highlighting the complexity of assessing qualitative aspects of neighbourhoods. Refs. [19,20,21] also highlighted the need for integrating objective measures of deprivation with subjective perceptions to capture a nuanced understanding of urban neighbourhoods. Henceforth, in this study, it has been evident that participants’ perceptions of urban neighbourhoods were both in agreement and disagreement with the Index of Multiple Deprivation, capturing the lived experiences and subjective viewpoints of participants for a more holistic understanding of the neighbourhood dynamics. This comprehensive approach can potentially contribute to more effective policy making and community development efforts that will aim to consider the unique characteristics of each neighbourhood. This can address disparities and enhance the overall neighbourhood well-being by considering these insights. The correlation between subjective perceptions and objective IMD dimensions underscores the intricate interplay between socioeconomic factors and qualitative attributes. While certain dimensions of the IMD show significant correlations with perceptions (e.g., affordability), other attributes like social inclusion, social cohesion, and positive attitude exhibit more nuanced relationships. Subjective assessments by the participants revealed the intricate interplay between individual perception and the specific characteristics associated with different sectors within these neighbourhoods. Participants’ comments and the differences in their assessments suggest that various aspects, ranging from social dynamics to physical aesthetics, contribute to how they perceived and evaluated these places.
In essence, term analysis enriches our understanding of how residents evaluate their urban neighbourhoods. It highlights the convergence and divergence between quantitative metrics and subjective perceptions, emphasising the importance of both in comprehensively assessing the quality of neighbourhoods. These insights offer a valuable foundation for informed decision-making in urban planning, community development efforts, etc. For example, even in regions where objective measures suggest low deprivation levels, subjective perceptions are shaped by a combination of physical and social factors. The presence of specific terms such as new build and privately owned and descriptors related to the condition of the neighbourhood, like litter clean and little rough, underscores the significance of the physical environment and overall appearance in shaping participant perceptions. Similarly, [49] also highlighted the significance of using TF-IDF for extracting features to understand the perception of COVID-19 vaccination for a Middle East case study. By addressing the specific attributes and concerns identified by residents, policymakers can work towards creating more vibrant, inclusive, and liveable urban environments that reflect the diverse needs and aspirations of their inhabitants.
It is worth noting that, in conducting this study, we made certain assumptions. Our primary assumption was that crowd workers on Prolific who were based in the UK were able to observe urban neighbourhoods and could assess them subjectively. While this might be the case for many UK residents, it is possible that crowd workers new to the country may have less familiarity with the physical characteristics of cities. It is also possible that crowd workers outside the UK may have been offered the task if they accessed Prolific using a VPN. Another assumption was that all participants had a similar way of assessing neighbourhoods through Google Street View and were familiar with the tool. Although the tool is highly popular, it is possible that some participants may have been unfamiliar with the interface and interaction mechanism. A further assumption was that the interaction experience was the same for all device types, which may not hold true. However, the data collected (substantial inputs from participants and sufficient time taken to perform the tasks) did not indicate these possibilities. Another assumption of our study was that our participants were not necessarily residents in the neighbourhood they conducted their walkthrough. While this reduced biases from our study, we should also note that our findings might not reflect the true observations that residents might have.
Our final assumption was that streets serve as visible indicators of a neighbourhood’s socioeconomic status, reflecting its relative deprivation through factors like housing conditions, commercial activity, social dynamics, safety measures, etc., thus affirming the accuracy of the Index of Multiple Deprivation (IMD) levels assigned to Lower-layer Super Output Areas (LSOAs) in depicting the physical characteristics of different places surveyed. Although residents and citizens are already engaged in designing urban planning and design interventions, we believe our findings highlight certain factors that can be assessed by non-residents. This offers us an approach towards scaling up to engage a large number of members of the public to assess neighbourhoods over different time periods. This might not only offer insights into designing interventions but also assess the visual impact of interventions over time and space. Such approaches can be invaluable to urban planning and design and also other areas such as environmental studies, smart cities, and social sciences.
The study also suffered from some limitations, as we assessed a range of qualitative characteristics only through a virtual survey. While on a day-to-day basis, Google Street View serves as an irreplaceable tool for learning more about a place, it does not offer the same understanding and experience as an in-person visit. Another limitation was that, while our statistical methods in text analysis used TF-IDF scores to ensure the most significant words that contributed to characterising participant responses, we did not employ deeper natural language understanding methods (for example, dealing with sarcasm, similar words, jokes, etc.). The detailed text analysis showed us a holistic overview of the neighbourhoods, but a considerable amount of subjective bias was found in the study when the data were grouped according to the ratings. This was prominent for most of the ratings, as no conclusive overview could be drawn, as the respondents just used stop words while expressing their opinions about the neighbourhoods. Some of the visible characteristics also lost their relevance due to potential spelling mistakes like ‘peopit tidyle’ and ‘knowing peopit’. Finally, it is worth noting that Google Street View is not a dynamic, real-time representation of how a neighbourhood looks but a snapshot of neighbourhoods captured at distinct times. It is, however, possible for participants to observe previous images of neighbourhoods to gain a sense of the dynamic changes; in our present study, our participants only observed the most recent imagery.
In future works, we aim to further analyse the text content in more depth, including more qualitative methods to interpret participant responses. We also aim to extend our study to other cities in the UK and beyond, with larger participant numbers to further verify our findings.
Author Contributions
Conceptualisation, S.M., S.R., A.C., D.T. and V.L.; methodology, S.M., D.T., A.C. and V.L.; formal analysis, S.R., S.M., B.G., A.C., D.T. and V.L.; writing—original draft preparation, S.R. and S.M.; writing—review and editing, D.T., V.L., A.C. and B.G.; supervision, S.M. and B.G.; funding acquisition, S.M. and B.G. All authors have read and agreed to the published version of the manuscript.
Funding
EPSRC Researcher in Residence project UrbanMapper (project reference: EP/T517264/1). For the purpose of open access, the authors applied a Creative Commons Attribution (CC BY) licence to any Author Accepted Manuscript version arising.
Data Availability Statement
The original contributions presented in the study are included in the article, further inquiries can be directed to the corresponding author.
Acknowledgments
The authors would like to thank the participants of the survey for their valuable contributions to this research.
Conflicts of Interest
The authors declare no conflicts of interest. The funders had no role in the design of the study; in the collection, analyses, or interpretation of the data; in the writing of the manuscript; or in the decision to publish the results.
Appendix A. Virtual Walkthrough for Assessing Urban Quality
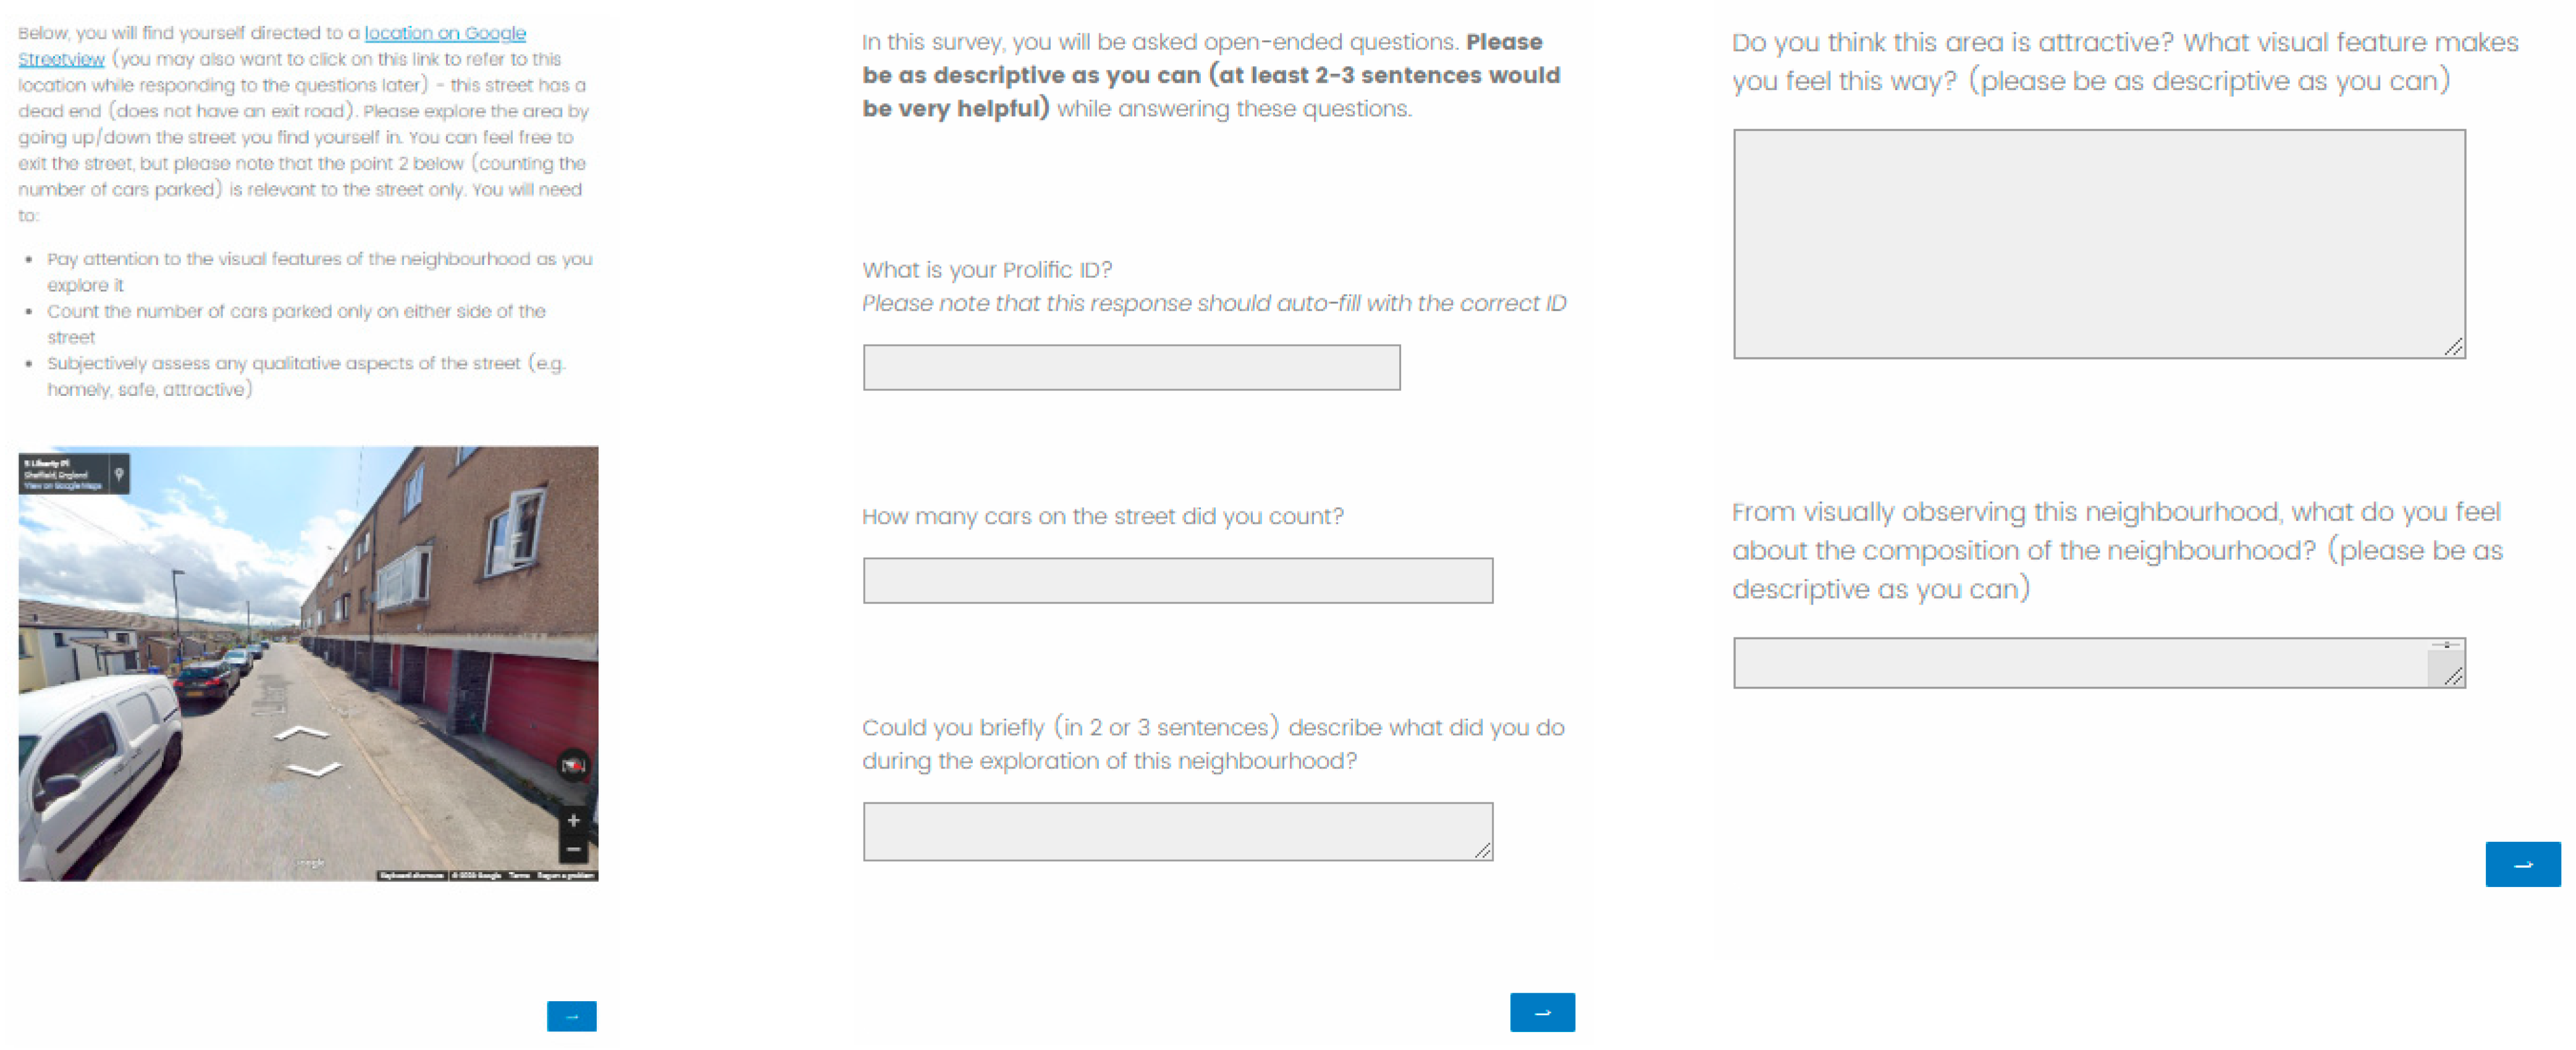
Below, you will find yourself directed to a location on Google Street View (you may also want to click on this link to refer to this location while responding to the questions later)—this street has a dead end (does not have an exit road). Please explore the area by going up/down the street you find yourself in. You can feel free to exit the street, but please note that the point 2 below (counting the number of cars parked) is relevant to the street only. You will need to:
- -
- Pay attention to the visual features of the neighbourhood as you explore it
- -
- Count the number of cars parked only on either side of the street.
- -
- Subjectively assess any qualitative aspects of the street (e.g., homely, safe, attractive)
- <Embedded Google Street View Location (1 randomly selected from 10)>
In this survey, you will be asked open-ended questions. Please be as descriptive as you can (at least 2–3 sentences would be very helpful) while answering these questions.
- Q25 What is your Prolific ID?
- Please note that this response should auto-fill with the correct ID
- ________________________________________________________________
- How many cars on the street did you count?
- ________________________________________________________________
- 2.
- Could you briefly (in 2 or 3 sentences) describe what did you do during the exploration of this neighbourhood?
- ________________________________________________________________
- ________________________________________________________________
- ________________________________________________________________
- ________________________________________________________________
- ________________________________________________________________
- Start of Block: Please answer the following 2 questions (Randomly selected 2 of 4)
- Q3.1 Do you think this area is attractive? What visual feature makes you feel this way? (please be as descriptive as you can)
- ________________________________________________________________
- ________________________________________________________________
- ________________________________________________________________
- ________________________________________________________________
- ________________________________________________________________
- Q3.2 From visually observing this neighbourhood, what do you feel about the composition of the neighbourhood? (please be as descriptive as you can)
- ________________________________________________________________
- ________________________________________________________________
- ________________________________________________________________
- ________________________________________________________________
- ________________________________________________________________
- Q3.3 From visually observing this neighbourhood, do you feel there is a local ownership of the community living here? (please be as descriptive as you can)
- ________________________________________________________________
- ________________________________________________________________
- ________________________________________________________________
- ________________________________________________________________
- ________________________________________________________________
- Q3.4 Do you think this neighbourhood has a strong community spirit? What visual features make you think this way? (please be as descriptive as you can)
- ________________________________________________________________
- ________________________________________________________________
- ________________________________________________________________
- ________________________________________________________________
- ________________________________________________________________
- Start of Block: Please answer the following questions:
- Q4 Do you think this is an affordable neighbourhood?
- o
- Definitely not (1)
- o
- Probably not (2)
- o
- Might or might not (3)
- o
- Probably yes (4)
- o
- Definitely yes (5)
- Q5 Do you think this area is socially inclusive? (Social inclusion is the act of making all groups of people within a society feel valued and important)
- o
- Definitely not (1)
- o
- Probably not (2)
- o
- Might or might not (3)
- o
- Probably yes (4)
- o
- Definitely yes (5)
- Q6 Do you think this area is socially cohesive? (Social cohesion refers to the strength of relationships and the sense of solidarity among members of a community)
- o
- Definitely not (1)
- o
- Probably not (2)
- o
- Might or might not (3)
- o
- Probably yes (4)
- o
- Definitely yes (5)
- Q7 On a scale of 1–5, overall, how would you rate this neighbourhood?
- o
- 1 (1)
- o
- 2 (2)
- o
- 3 (3)
- o
- 4 (4)
- o
- 5 (5)
- Q8 Do you think this neighbourhood promotes a positive attitude?
- o
- Definitely not (1)
- o
- Probably not (2)
- o
- Might or might not (3)
- o
- Probably yes (4)
- o
- Definitely yes (5)
- Start of Block: Please answer the following 3 questions (Randomly selected 3 of 5)
- Q9.1 What do you feel about the aesthetic value of this neighbourhood? What aspects of this neighbourhood that you observed makes you feel this way? (please be as descriptive as you can)
- ________________________________________________________________
- ________________________________________________________________
- ________________________________________________________________
- ________________________________________________________________
- ________________________________________________________________
- Q9.2 What do you feel about the level of comfort of being in this neighbourhood? What aspects of this neighbourhood that you observed makes you feel this way? (please be as descriptive as you can)
- ________________________________________________________________
- ________________________________________________________________
- ________________________________________________________________
- ________________________________________________________________
- ________________________________________________________________
- Q9.3 Overall, what do you feel about your level of satisfaction being in this neighbourhood? What aspects of this neighbourhood that you observed makes you feel this way? (please be as descriptive as you can)
- ________________________________________________________________
- ________________________________________________________________
- ________________________________________________________________
- ________________________________________________________________
- ________________________________________________________________
- Q9.4 What do you feel about the sense of belonging in this neighbourhood? What aspects of this neighbourhood that you observed makes you feel this way? (please be as descriptive as you can)
- ________________________________________________________________
- ________________________________________________________________
- ________________________________________________________________
- ________________________________________________________________
- ________________________________________________________________
- Q9.5 What do you feel about the sense of security of being in this neighbourhood? What aspects of this neighbourhood that you observed makes you feel this way? (please be as descriptive as you can)
- ________________________________________________________________
- ________________________________________________________________
- ________________________________________________________________
- ________________________________________________________________
- ________________________________________________________________
- Start of Block: End of survey message
- Q26 Thank you for taking part in this survey. Please click the button below to be redirected to Prolific and register your submission
Appendix B. Geographical Description of Sheffield
Sheffield is one of the largest cities in the UK, with a growing population of half a million residents [53]. It is one of the most sharply divided cities in the UK in terms of income and occupation. Historically a mining and industrial town, predominantly centred around coal mining, steel manufacturing and cutlery, Sheffield suffered from rapid de-industrialisation post-1979, which led to the loss of thousands of jobs [54]. Unemployment disproportionately affected the eastern part of the city, as compared to a more affluent south-west, and a range of interventions were designed by successive local governments to bridge these gaps [55]. Much of the reasons for the inequalities arose from the geography of the city (low-lying regions close to rivers providing ideal industrial sites resulted in housing workforce, while hills and easy access to the country were mostly preferred by the wealthier residents) and the subsequent industrial grassroots. Despite significant investments and a growth in jobs in public administration, education, and health [56], Sheffield still persists as a sharply divided city.
Appendix C. Detailed Results
Table A1.
Post hoc Dunn’s test using a Bonferroni-corrected alpha of 0.0011.
Table A1.
Post hoc Dunn’s test using a Bonferroni-corrected alpha of 0.0011.
| Significantly Different Mean Ranks | Affordability | Social Inclusion | Social Cohesion | Positive Attitude | Overall Ratings |
|---|---|---|---|---|---|
| Place 1–Place 2 | ✓ | ✓ | ✓ | ✓ | |
| Place 1–Place 3 | ✓ | ✓ | ✓ | ✓ | ✓ |
| Place 1–Place 4 | ✓ | ✓ | ✓ | ✓ | ✓ |
| Place 1–Place 5 | ✓ | ✓ | ✓ | ✓ | ✓ |
| Place 1–Place 6 | ✓ | ✓ | ✓ | ||
| Place 1–Place 7 | ✓ | ✓ | ✓ | ✓ | |
| Place 1–Place 8 | ✓ | ✓ | ✓ | ✓ | |
| Place 1–Place 9 | ✓ | ✓ | ✓ | ✓ | |
| Place 1–Place 10 | ✓ | ✓ | ✓ | ✓ | |
| Place 2–Place6 | ✓ | ✓ | |||
| Place 2–Place 8 | ✓ | ✓ | ✓ | ||
| Place 2–Place 10 | ✓ | ✓ | ✓ | ||
| Place 3–Place 6 | ✓ | ✓ | ✓ | ||
| Place 3–Place 8 | ✓ | ✓ | |||
| Place 4–Place 6 | ✓ | ✓ | ✓ | ✓ | |
| Place 4–Place 8 | ✓ | ✓ | ✓ | ✓ | |
| Place 4–Place 10 | ✓ | ✓ | ✓ | ||
| Place 5–Place 6 | ✓ | ✓ | ✓ | ✓ | |
| Place 5–Place 8 | ✓ | ✓ | |||
| Place 6–Place 9 | ✓ | ✓ | |||
| Place 7–Place 8 | ✓ | ||||
| Place 8–Place 9 | ✓ | ✓ | |||
| Place 8–Place 10 | ✓ | ✓ |
Table A2.
Most significant key terms from text responses for Place 5 (IMD decile 2) and Place 1, Place 3, and Place 8 (IMD decile 3).
Table A2.
Most significant key terms from text responses for Place 5 (IMD decile 2) and Place 1, Place 3, and Place 8 (IMD decile 3).
| Attributes | Ratings | Place5 | Place 1 | Place 3 | Place 8 |
|---|---|---|---|---|---|
| Attractive | 1 | empty vocabulary | rundown rough, rough hell, looks rundown | empty vocabulary | empty vocabulary |
| 2 | untidy dated, scenic views, unattractive road | run scruffy, unattractive houses, rubbish visible | |||
| 3 | street England, normal street, like normal | quite busy, neater everyone, driveways cars | |||
| 4 | really buildings, look nice, buildings look | looks lovely, gardens looks, well looked | |||
| 5 | NOT RATED | well looked, rubbish street, neat tidy | |||
| Composition | 1 | houses flats, appears council, council houses | really grim, visually unappealing, unappealing street | empty vocabulary | houses flats, council houses, local authority |
| 2 | lower class, slightly kilter, composition straight | busy neighbourhood, social housing, looks cheap | safe unwelcoming, lonely attractive, isolated lonely | lower class, well kept, residential area | |
| 3 | think poor, poor neighbourhood, neighbourhood attractive | claen quiet, regular neighbourhood, like regular | general housing, housing estate, people together | poor neighbourhood, neighbourhood attractive, social house | |
| 4 | quiet attractive, attractive area, area communal | people low, low incomes, incomes live | green clean, good neighbourhood, working class | attractive area, area communal little cramped | |
| 5 | empty vocabulary | NOT RATED | empty vocabulary | empty vocabulary | |
| Local Ownership | 1 | empty vocabulary | empty vocabulary | empty vocabulary | empty vocabulary |
| 2 | community ownership, ownership community, believe much | think council, council property, property houses | community ownership, community living, shape pavement | ||
| 3 | tight neighbourhood | well cared, looks well, area looks | evidence case, sure honest, houses cars | tight neighbourhood, like area | |
| 4 | tidy properties, looks neat, front garden | well maintained, well kept, much litter | housing area, locals see, sense pride | tidy properties, looks neat, front garden | |
| 5 | empty vocabulary | NOT RATED | ownership community, community living, feel local | empty vocabulary | |
| Community Spirit | 1 | empty vocabulary | tightly packed, packed neighbourhood, houses tightly | empty vocabulary | empty vocabulary |
| 2 | run neglected, little rough | maybe honestly, honestly idea | seemed cramped, cramped urban, conservatories likely | feels like, socialising streetview, little rough | |
| 3 | neighbourhood strong, good relations, neighbors good | together tending, tending gardens, know living | possibly cul-de sac, parked manner | neighbourhood strong, good relations, spirit street | |
| 4 | cul de, street clean, litter graffiti | together easy, plus community, people interact | space community, cars space, care community | well kept, street clean, litter graffiti | |
| 5 | think communal, clothes drying | NOT RATED | tidy community, street tidy, community respect | think communal, general tidiness, drying racks | |
| Aesthetic Value | 1 | little aesthetic, individuality, flats outdated | really messy, messy unattractive, road narrow | empty vocabulary | value houses little aesthetic individuality flats |
| 2 | unkempt slightly, slightly neglected, looks poor | really pleasing, english houses, graffiti rubbish | houses fine, gardens reasonable, fine poor | THE litter looks poor low homes | |
| 3 | ordinary looking, looking estate, green space | aesthetically pleasing, look generic, views countryside | well build, tight cars, clean tidy | ordinary looking looking estate green space | |
| 4 | look nice, side congested, parking cars | would happy, cant look, people houses | great feels feels claustrophobic maintained houses | look nice side congested parking can | |
| 5 | tidy spacious, neighbourhood clean, aesthetically pleasing | NOT RATED | attractive every style personalised kept tidy | tidy spacions. neighbouthood clean, aesthetically pleasing | |
| Level of Comfort | 1 | run poor, poor strangers, greeted suspicion | empty vocabulary | empty vocabulary | poor strangers feel comfortable—poer |
| 2 | comfortable area, feel comfortable | comfort neighbourhood. ove friendly quiet safe | comfortable area world contained comfortable fairly | ||
| 3 | really boasting, boasting comfort, may comfort | look big looking bricks comfort looking | neighbourhood beating boasting comfort beaten track | ||
| 4 | nice place, looked nice, size cramped | noise free, free area, driving noise | nice place size cramped looked nice | ||
| 5 | empty vocabulary | NOT RATED | empty vocabulary | empty vocabulary | |
| Level of Satisfaction | 1 | long neighborhood, nothing interest | satisfied neighborhood, neighbourhood appealing, depressing live | empty vocabulary | stay long Jong neighborhood improve houses |
| 2 | quite depressing, depressing area | low level, level satisfaction, better areas | live unstractive looks satisfying satisfaction high | quite depressing pretty average depressing area | |
| 3 | pretty clean, clean neighbourhood, always satisfying | satisfied attractive, attractive neighbourhood, nice lock | particularly attractive ok neighbourhood really ok | pretty clean always satisfying clean neighbourhood | |
| 4 | safe quiet, felt safe, attractive neighbourhood | unkeep houses, residents satisfied, shows residents | good clean clean tids relatively happy | safe quiet, attractive neighbourhood threatened crowded | |
| 5 | feels nice, access cleanliness, strong community | NOT RATED | well kept neighbouhood well feel satisfied | access cleaniness. stro community satisfied area | |
| Sense of Belonging | 1 | empty vocabulary | uninviting doubt, looks uninviting, doubt people | empty vocabulary | empty vocabulary |
| 2 | know maybe, feel excluded, excluded neighbourhood | belonging street, open space neighborhood surrow | think sense think people people - | ||
| 3 | feel belonging | well cared, neighbourhood hard. look well | gardens everyone well kept kept gardens | feel belonging belonging opposite | |
| 4 | empty vocabulary | surrounding clean | stands belonging belonging neighbourhood working class | included respect houses similar feel included | |
| 5 | NOT RATED | well conjuntained street gardens houses well | empty vocabulary | ||
| Sense of Security | 1 | empty vocabulary | unsafe opinion. street garages, rough unsafe | empty vocabulary | empty vocabulary |
| 2 | secure lots, open space, unsafe small | ground floor | people unlikeh safer everything, eventhing cramped | secure lots, open space feels unsafe | |
| 3 | feel safe, safety security | street lighthing lighting cameras property unlikely | feel conforable conforable cars. concerned sobberies | feel safe safety security security area | |
| 4 | secure boundaries, boundaries fenced, feels secure | closeness house helps people secure neighbour | houses drives secure quite quite secure | secure boundaries feels secure boundaries fenced | |
| 5 | security high, nice tidy, high area | NOT RATED | trouble street good obviously good | security high suspect close. close neighbourhood |
Table A3.
Most significant key terms from text responses for Place 6 and Place 10 (IMD decile 5).
Table A3.
Most significant key terms from text responses for Place 6 and Place 10 (IMD decile 5).
| Attributes | Ratings | Place 6 | Place 10 |
|---|---|---|---|
| Attractive | 1 | empty vocabulary | NOT RATED |
| 2 | empty vocabulary | ||
| 3 | |||
| 4 | |||
| 5 | |||
| Composition | 1 | houses flats, council houses, local authority | NOT RATED |
| 2 | lower class, well kept, residential area | working class, spacious neighbourhood, cramped narrow | |
| 3 | poor neighbourhood, neighbourhood attractive, social house | young families, residential safe, safe young | |
| 4 | attractive area, area communial, little cramped | class area, social houses, poor working | |
| 5 | empty vocabulary | empty vocabulary | |
| Local Ownership | 1 | empty vocabulary | NOT RATED |
| 2 | community ownership, community living, shape pavement | type families, take pride, properties road | |
| 3 | tight neighbouhood, like area | know local, maintenance street, yes street | |
| 4 | tidy properties, looks neat, front grades | understanding people, street understanding, nice live | |
| 5 | empty vocabulary | empty vocabulary | |
| Community Spirit | 1 | empty vocabulary | NOT RATED |
| 2 | feels like, socialising streetview, little rough | upkeep renovation, clean looked, think street | |
| 3 | neighbourhood strong, good relations, sprit street | looked people, determined street, think strong | |
| 4 | well kept, street clean, litter graffiti | people work, street front, front yards | |
| 5 | think communal, general tidiness, drying racks | empty vocabulary | |
| Aesthetic Value | 1 | value houses, little aesthetic, individuality flats | NOT RATED |
| 2 | run litter, looks poor, low houses | quite cheap, houses look, road attractive | |
| 3 | ordinary looking, looking estate, green space | average houses, street honest, much greenery | |
| 4 | look nice, side congested, parking cars | style houses, neighborhood cars, homely neighborhood | |
| 5 | tidy spacious, neighbourhood clean, aesthetically pleasing | empty vocabulary | |
| Level of comfort | 1 | poor strangers, feel comfortable, run poor | NOT RATED |
| 2 | comfortable area, small contained, comfortable fairly | think comfortable, security would | |
| 3 | neighbourhood beaten, boasting comfort, beaten track | neighbourhood aesthetically, aesthetically pleasing, quite clean | |
| 4 | nice place, size cramped, looked nice | street neighbourhood, kids played, terraces flats | |
| 5 | empty vocabulary | empty vocabulary | |
| Level of Satisfaction | 1 | stay long, long neighborhood, improve homes | NOT RATED |
| 2 | quite depressing, pretty average, depressing area | people area, area look, neighborhood sburban | |
| 3 | pretty clean, always satisfying, clean neighbourhood | satisfied comfortable, comfortable looking, unsatisfied street | |
| 4 | safe quiet, attractive neighbourhood, threatened crowded | satisfied extent, feels safe, nice street | |
| 5 | access cleanliness, strong community, satisfied area | empty vocabulary | |
| Sense of Belonging | 1 | empty vocabulary | NOT RATED |
| 2 | think sense, think people, people sense | feel belonging, personally feel, seem cared | |
| 3 | feel belonging, belonging opposite | belonging visuals, assess belonging | |
| 4 | included respect, house similar, feel included | tell neighbours, semi-detached, big houses | |
| 5 | empty vocabulary | empty vocabulary | |
| Sense of Security | 1 | empty vocabulary | NOT RATED |
| 2 | secure lots, open space, feels unsafe | security hard, impact security, unsafe area | |
| 3 | feel safe, safety security, security area | determine street, reasonably safe, secure street | |
| 4 | secure boundaries, feels secure, boundaries fenced | strong feelings, sense pride, safe street | |
| 5 | security high, suspect close, close neighbourhood | empty vocabulary |
Table A4.
Place 2 and Place 9 (IMD decile 7), Place 4 (IMD decile 9), and Place 7 (IMD decile 10).
Table A4.
Place 2 and Place 9 (IMD decile 7), Place 4 (IMD decile 9), and Place 7 (IMD decile 10).
| Attributes | Ratings | Place 2 | Place 9 | Place 4 | Place 7 |
|---|---|---|---|---|---|
| Attractive | 1 | empty vocabulary | NOT RATED | empty vocabulary | NOT RATED |
| 2 | new build, way attractive, planting gardens | empty vocabulary | empty vocabulary | empty vocabulary | |
| 3 | yes houses, quite nice, houses quite | trees plants, stone walls, looked tidy | |||
| 4 | organisation neighbourhood, neighbourhood attractive, tidy houses | liked greenery, street clean, rubbish street | |||
| 5 | spaced small, small neighbourhood, nicely spaced | structure buildings, stone bricks, trees flowers | |||
| Composition Local Ownership | 1 | empty vocabulary | NOT RATED | empty vocabulary | NOT RATED |
| 2 | houses fairly, fairly spaced | lower class, well kept, residential area | working class, center town, class area | lower class, well kept, residential area | |
| 3 | quiet looking, middle class, family neighbourhood | poor neighbourhood, neighbourhood attractive, social house | average middle, suburban area, private housing | poor neighbourhood, neighbourhood attractive, social house | |
| 4 | good looking, safe welcoming, middle class | attractive area, area communal, little cramped | lovely street, nice friendly, looked nice | attractive area, area communal, little cramped | |
| 5 | neat passers, nicely designed, well thought | empty vocabulary | felt safe, peaceful neighbourhood, working class | empty vocabulary | |
| Community Spirit | 1 | privately owned, people rent, newbuilds assume | NOT RATED | empty vocabulary | NOT RATED |
| 2 | looked close, fences separating, community living | community ownership, community living, shape pavement | tidy gardens, space cars, litter clean | white cladding, red brick, feels narrow | |
| 3 | fairly clean, proud houses, notice people | tight neighbourhood, like area | ownership view, sense local, nice enough | tight neighbourhood, like area | |
| 4 | well cared, looks well, houses next | tidy properties, properties distinctive, front garden | seems peaceful, many houses, nice neighbourhood | tidy properties, properties distinctive, front garden | |
| 5 | include unemployment, seems affluent, information economy | empty vocabulary | empty vocabulary | empty vocabulary | |
| Aesthetic Value | 1 | empty vocabulary | empty vocabulary | NOT RATED | |
| 2 | roads fence, parking issues, fence seperating | feels like, socialising streetview, little rough | ordinary street, good community, cars parked | feels like, socialising streetview, little rough | |
| 3 | think gardens, personalised houses, clean tidy | neighbourhood strong, good relations, spirit street | yes terraced, houses likely, tidy litter | neighbourhood strong, good relations, spirit street | |
| 4 | kept clean, gardens kept, yes clean | well kept, strret clean, litter graffiti | well maintained, looked tidy, tidy well | well kept, strret clean, litter graffiti | |
| 5 | small culdesac, culdesac people, seems small | think communal, general tidiness, drying racks | empty vocabulary | empty vocabulary | |
| Level of comfort | 1 | empty vocabulary | NOT RATED | empty vocabulary | NOT RATED |
| 2 | much individuality, individuality houses, colour gardens | run litter, looks poor, low houses | street appeal, private land, crowded area | run litter, looks poor, low houses | |
| 3 | colour houses, tidy trees, pleasant enough | ordinary looking looking estate, green space | well maintained, looked attractive, trees aesthetically | ordinary looking looking estate, green space | |
| 4 | calming tidy, houses gardens, ways clean | look nice, side congested, parking cars | looks okay, looked gardens, clean area | look nice, side congested, parking cars | |
| 5 | spaced apart, nicely spaced, gardens space | tidy spacious, neighbourhood clean, aesthetically pleasing | empty vocabulary | empty vocabulary | |
| Level of Satisfaction | 1 | empty vocabulary | NOT RATED | empty vocabulary | NOT RATED |
| 2 | comfortable look, cheap 80’s, small compact | comfortable area, small contained, comfortable fairly | fairly comfortable, trees general, gardens make | comfortable area, feel comfortable, fairly small | |
| 3 | seemed quiet, comfortable nice, feel uneasy | neighbourhood beaten, boasting comfort, beaten track | suburban area, reasonable clean, litter graffiti | really boasting, boasting comfort, beaten track | |
| 4 | quiet, clean secure, modern houses | nice place, size cramped, looked nice | cleanliness damage, comfortable welcoming, safe neighbourhood | range properties, nice place, size cramped | |
| 5 | fences observe, would safe, walking street | empty vocabulary | nice looked, feel comfortable, trees gardening | empty vocabulary | |
| Sense of Belonging | 1 | empty vocabulary | NOT RATED | empty vocabulary | NOT RATED |
| 2 | live neighbourhood, especially strangers, neighbourhood like | quite depressing, pretty average, depresing area | satisfying neighbourhood, parked outside, people decent | quite depressing, pretty average, depressing area | |
| 3 | happy live, would disappointed, clean area | pretty clean, always satisfying, clean nighbourhood | living cramped, satisfied living, little crowded | pretty clean, always satisfying, clean neighbourhood | |
| 4 | living area, seems pleasant, pleasant prosperous | safe quiet, attractive neighbourhood, theatened crowded | warm inviting, scenery trees, enjoyed neighbourhood | safe quiet, attractive neighbourhood, threatened crowded | |
| 5 | good thing, satisfied living, sense community | acess cleanliness, strong community, satsfied area | nice community, welcomes people, safe could | acess cleanliness, strong community, satisfied area | |
| Sense of Security | 1 | empty vocabulary | NOT RATED | NOT RATED | NOT RATED |
| 2 | hate people, belong hate, sense identity | think sense, think people, people sense | counting cars, belonging focussed, focussed counting | think sense, think people, people sense | |
| 3 | relate aspects, belonging houses, aspects neighbourhood | feel belonging, belonging opposite | white fairly, stood either | feel belonging, belonging opposite | |
| 4 | looks calm, calm inviting, neighbourhood interesting | included respect, houses similar, feel included | get feelings, look nice, feelings belonging | included respect, houses similar, feel included | |
| 5 | people similar, belong people, amount income | empty vocabulary |
References
- Delpino-Chamy, M.; Albert, Y.P. Assessment of Citizens’ Perception of the Built Environment throughout Digital Platforms: A Scoping Review. Urban Sci. 2022, 6, 46. [Google Scholar] [CrossRef]
- Tan, R.K.J.; Wu, D.; Day, S.; Zhao, Y.; Larson, H.J.; Sylvia, S.; Tang, W.; Tucker, J.D. Digital approaches to enhancing community engagement in clinical trials. npj Digit. Med. 2022, 5, 27. [Google Scholar] [CrossRef] [PubMed]
- Herre, B.; Arriagada, P. The Human Development Index and Related Indices: What They Are and What We Can Learn from Them. Our World in Data. 12 February 2024. Available online: https://ourworldindata.org/human-development-index (accessed on 22 February 2024).
- ICOI. What Is the Quality of Life Index|ICOI. 2 May 2019. Available online: https://www.icoi.org/glossary/quality-of-life-index (accessed on 22 February 2024).
- GOV.UK. English Indices of Deprivation 2019. 26 September 2019. Available online: https://www.gov.uk/government/statistics/english-indices-of-deprivation-2019 (accessed on 22 February 2024).
- Wang, Z.; Chan, K.Y.; Poon, A.N.; Homma, K.; Guo, Y. Construction of an area deprivation index for 2869 counties in China: A census-based approach. J. Epidemiol. Community Health 2021, 75, 114–119. [Google Scholar] [CrossRef] [PubMed]
- Arfeen, M.I.; Sarantis, D.; Pereira, A.F. Assessment of Citizen Perception: A Case Study of Municipal Solid Waste Management System in Guimaraes. In Proceedings of the International Conference on Innovation & Entrepreneurship, Washington, DC, USA, 5–6 March 2018. [Google Scholar]
- Hoehner, C.M.; Brennan Ramirez, L.K.; Elliott, M.B.; Handy, S.L.; Brownson, R.C. Perceived and objective environmental measures and physical activity among urban adults. Am. J. Prev. Med. 2005, 28, 105–116. [Google Scholar] [CrossRef] [PubMed]
- City of Xenia Citizen Perception Survey. 2009. Available online: https://www.cityofxenia.org/Archive/ViewFile/Item/87 (accessed on 22 February 2024).
- Gumah, B.; Aziabah, M.A. Our Lives Are Affected by Government Agencies: Citizens’ Perception Survey as a Measure of Public Service Efficiency in Ghana. SAGE Open 2020, 10, 2158244020935900. [Google Scholar] [CrossRef]
- Kubiszewski, I.; Zakariyya, N.; Costanza, R. Objective and subjective indicators of life satisfaction in Australia: How well do people perceive what supports a good life? Ecol. Econ. 2018, 154, 361–372. [Google Scholar] [CrossRef]
- Petrosillo, I.; Costanza, R.; Aretano, R.; Zaccarelli, N.; Zurlini, G. The use of subjective indicators to assess how natural and social capital support residents’ quality of life in a small volcanic island. Ecol. Indic. 2013, 24, 609–620. [Google Scholar] [CrossRef]
- Weden, M.M.; Carpiano, R.M.; Robert, S.A. Subjective and objective neighborhood characteristics and adult health. Soc. Sci. Med. 2008, 66, 1256–1270. [Google Scholar] [CrossRef]
- Voukelatou, V.; Gabrielli, L.; Miliou, I.; Cresci, S.; Sharma, R.; Tesconi, M.; Pappalardo, L. Measuring objective and subjective well-being: Dimensions and data sources. Int. J. Data Sci. Anal. 2021, 11, 279–309. [Google Scholar] [CrossRef]
- Gray, M.; Lobao, L.; Martin, R. Making space for well-being. Camb. J. Reg. Econ. Soc. 2012, 5, 3–13. [Google Scholar] [CrossRef]
- Fiona, M. Understanding regional cities: Combining quantitative and qualitative methods in case studies of Orange and Goulburn, NSW. Australas. J. Reg. Stud. 2015, 21, 303–322. [Google Scholar]
- Ho, H.C.; Man, H.Y.; Wong, M.S.; Shi, Y.; Walker, B.B. Perceived differences in the (re) production of environmental deprivation between sub-populations: A study combining citizens’ perceptions with remote-sensed and administrative data. Build. Environ. 2020, 174, 106769. [Google Scholar] [CrossRef]
- Labib, S.M.; Lindley, S.; Huck, J.J. Estimating multiple greenspace exposure types and their associations with neighbourhood premature mortality: A socioecological study. Sci. Total Environ. 2021, 789, 147919. [Google Scholar] [CrossRef] [PubMed]
- Ambrose, A.; Goodchild, B.; O’flaherty, F. Understanding the user in low energy housing: A comparison of positivist and phenomenological approaches. Energy Res. Soc. Sci. 2017, 34, 163–171. [Google Scholar] [CrossRef]
- Stiglitz, J.E.; Sen, A.; Fitoussi, J.P. Report by the Commission on the Measurement of Economic Performance and Social Progress. 2009. Available online: https://ec.europa.eu/eurostat/documents/8131721/8131772/Stiglitz-Sen-Fitoussi-Commission-report.pdf (accessed on 22 February 2024).
- Sirgy, M.J.; Widgery, R.N.; Lee, D.-J.; Yu, G.B. Developing a measure of community well-being based on perceptions of impact in various life domains. Soc. Indic. Res. 2010, 96, 295–311. [Google Scholar] [CrossRef]
- Venerandi, A.; Quattrone, G.; Capra, L.; Quercia, D.; Saez-Trumper, D. Measuring urban deprivation from user generated content. In Proceedings of the 18th ACM Conference on Computer Supported Cooperative Work & Social Computing, Vancouver, BC, Canada, 14–18 March 2015; pp. 254–264. [Google Scholar]
- McNutt, K. Public engagement in the Web 2.0 era: Social collaborative technologies in a public sector context. Can. Public Adm. 2014, 57, 49–70. [Google Scholar] [CrossRef]
- Mahabir, R.; Schuchard, R.; Crooks, A.; Croitoru, A.; Stefanidis, A. Crowdsourcing street view imagery: A comparison of mapillary and OpenStreetCam. ISPRS Int. J. Geo-Inf. 2020, 9, 341. [Google Scholar] [CrossRef]
- Li, Y.; Peng, L.; Wu, C.; Zhang, J. Street View Imagery (SVI) in the built environment: A theoretical and systematic review. Buildings 2022, 12, 1167. [Google Scholar] [CrossRef]
- Li, Y. Using Google Street View to investigate the association between street greenery and physical activity. Landsc. Urban Plan. 2019, 191, 103435. [Google Scholar]
- Cinnamon, J.; Jahiu, L. 360-degree video for virtual place-based research: A review and research agenda. Comput. Environ. Urban Syst. 2023, 106, 102044. [Google Scholar] [CrossRef]
- Wang, Z.; Zhu, Z.; Xu, M.; Qureshi, S. Fine-grained assessment of greenspace satisfaction at regional scale using content analysis of social media and machine learning. Sci. Total. Environ. 2021, 776, 145908. [Google Scholar] [CrossRef] [PubMed]
- Trento Oliveira, L.; Kuffer, M.; Schwarz, N.; Pedrassoli, J.C. Capturing deprived areas using unsupervised machine learning and open data: A case study in São Paulo, Brazil. Eur. J. Remote Sens. 2023, 56, 2214690. [Google Scholar] [CrossRef]
- Larkin, A.; Hystad, P. Evaluating street view exposure measures of visible green space for health research. J. Expo. Sci. Environ. Epidemiol. 2019, 29, 447–456. [Google Scholar] [CrossRef] [PubMed]
- Suel, E.; Polak, J.W.; Bennett, J.E.; Ezzati, M. Measuring social, environmental and health inequalities using deep learning and street imagery. Sci. Rep. 2019, 9, 6229. [Google Scholar] [CrossRef] [PubMed]
- Nguyen, Q.C.; Khanna, S.; Dwivedi, P.; Huang, D.; Huang, Y.; Tasdizen, T.; Brunisholz, K.D.; Li, F.; Gorman, W.; Nguyen, T.T.; et al. Using Google Street View to examine associations between built environment characteristics and US health outcomes. Prev. Med. Rep. 2019, 14, 100859. [Google Scholar] [CrossRef] [PubMed]
- Kang, Y.; Zhang, F.; Gao, S.; Lin, H.; Liu, Y. A review of urban physical environment sensing using street view imagery in public health studies. Ann. GIS 2020, 26, 261–275. [Google Scholar] [CrossRef]
- Porzi, L.; Rota Bulò, S.; Lepri, B.; Ricci, E. Predicting and understanding urban perception with convolutional neural networks. In Proceedings of the 23rd ACM International Conference on Multimedia, Brisbane, Australia, 26–30 October 2015. [Google Scholar]
- Law, S.; Paige, B.; Russell, C. Take a look around: Using street view and satellite images to estimate house prices. ACM Trans. Intell. Syst. Technol. 2019, 10, 1–19. [Google Scholar] [CrossRef]
- Li, X.; Zhang, C.; Li, W.; Ricard, R.; Meng, Q.; Zhang, W. Assessing street-level urban greenery using Google Street View and a modified green view index. Urban For. Urban Green. 2015, 14, 675–685. [Google Scholar] [CrossRef]
- Nan, H.; Li, G. Urban neighbourhood environment assessment based on street view image processing: A review of research trends. Environ. Chall. 2021, 4, 100090. [Google Scholar]
- Wang, L.; Han, X.; He, J.; Jung, T. Measuring residents’ perceptions of city streets to inform better street planning through deep learning and space syntax. ISPRS J. Photogramm. Remote. Sens. 2022, 190, 215–230. [Google Scholar] [CrossRef]
- Zhu, J.; Gong, Y.; Liu, C.; Du, J.; Song, C.; Chen, J.; Pei, T. Assessing the Effects of Subjective and Objective Measures on Housing Prices with Street View Imagery: A Case Study of Suzhou. Land 2023, 12, 2095. [Google Scholar] [CrossRef]
- Aditya, S. Is street design and infrastructure perceived differently by persons of different ages, genders, and hierarchy of street? Innov. Infrastruct. Solut. 2022, 7, 278. [Google Scholar]
- Larkin, A.; Krishna, A.; Chen, L.; Amram, O.; Avery, A.R.; Duncan, G.E.; Hystad, P. Measuring and modelling perceptions of the built environment for epidemiological research using crowd-sourcing and image-based deep learning models. J. Expo. Sci. Environ. Epidemiol. 2022, 32, 892–899. [Google Scholar] [CrossRef] [PubMed]
- Mazumdar, S.; Qi, J.; Thakker, D.; Goodchild, B. Understanding Urban Planning Outcomes in the UK: Practitioner Perspectives in Outcome Assessment. Int. J. E-Plan. Res. IJEPR 2023, 12, 1–40. [Google Scholar] [CrossRef]
- English Indices of Deprivation 2019: Postcode Lookup. Available online: https://imd-by-postcode.opendatacommunities.org/imd/2019 (accessed on 22 February 2024).
- Hannah, R. Smart Handling of Missing Data in R—Towards Data Science. Medium. 10 September 2022. Available online: https://towardsdatascience.com/smart-handling-of-missing-data-in-r-6425f8a559f2 (accessed on 24 February 2024).
- Daniel, J. Stemming and Lemmatization in Python NLTK with Examples. Guru99. 13 December 2023. Available online: https://www.guru99.com/stemming-lemmatization-python-nltk.html (accessed on 25 February 2024).
- Juan, R. Using tf-idf to determine word relevance in document queries. In Proceedings of the First Instructional Conference on Machine Learning, Los Angeles, CA, USA, 23–24 June 2003; Volume 242. [Google Scholar]
- Piwowarczyk, T.C.; Oliveira, G.; Lourenço, L.; Behlau, M. Vocal symptoms, voice activity, and participation profile and professional performance of call center operators. J. Voice 2012, 26, 194–200. [Google Scholar] [CrossRef] [PubMed]
- Badowski, D.; Rossler, K.L.; Reiland, N. Exploring student perceptions of virtual simulation versus traditional clinical and manikin-based simulation. J. Prof. Nurs. 2021, 37, 683–689. [Google Scholar] [CrossRef] [PubMed]
- Bobbitt, Z. Dunn’s Test for Multiple Comparisons. Statology. 30 September 2020. Available online: https://www.statology.org/dunns-test (accessed on 25 February 2024).
- Aljedaani, W.; Abuhaimed, I.; Rustam, F.; Mkaouer, M.W.; Ouni, A.; Jenhani, I. Automatically detecting and understanding the perception of COVID-19 vaccination: A middle east case study. Soc. Netw. Anal. Min. 2022, 12, 128. [Google Scholar] [CrossRef] [PubMed]
- García-Ceberino, J.M.; Gamero, M.G.; Ibáñez, S.J.; Feu, S. Are Subjective Intensities Indicators of Player Load and Heart Rate in Physical Education? Healthcare 2022, 10, 428. [Google Scholar] [CrossRef] [PubMed]
- Puth, M.T.; Neuhäuser, M.; Ruxton, G.D. Effective use of Spearman’s and Kendall’s correlation coefficients for association between two measured traits. Anim. Behav. 2015, 102, 77–84. [Google Scholar] [CrossRef]
- Dario, F. Crime, Housing Tenure, and Urban Space: A study of Sheffield. Ph.D. Thesis, University of Sheffield, Sheffield, UK, 2022. [Google Scholar]
- Deans, J. Steel in the UK: A Timeline of Decline. The Guardian. 2016. Available online: https://www.theguardian.com/business/2016/mar/30/steel-in-the-uk-a-timeline-of-decline (accessed on 24 February 2024).
- Palan, S.; Schitter, C. Prolific. ac—A subject pool for online experiments. J. Behav. Exp. Financ. 2018, 17, 22–27. [Google Scholar] [CrossRef]
- Bolton, T.; Larkin, K.; Swinney, P. Advancing Ambitions: Creating a Sustainable Economic Future for Sheffield—Centre for Cities. Centre for Cities. 2 September 2014. Available online: https://www.centreforcities.org/publication/advancing-ambitions-creating-a-sustainable-economic-future-for-sheffield (accessed on 24 February 2024).

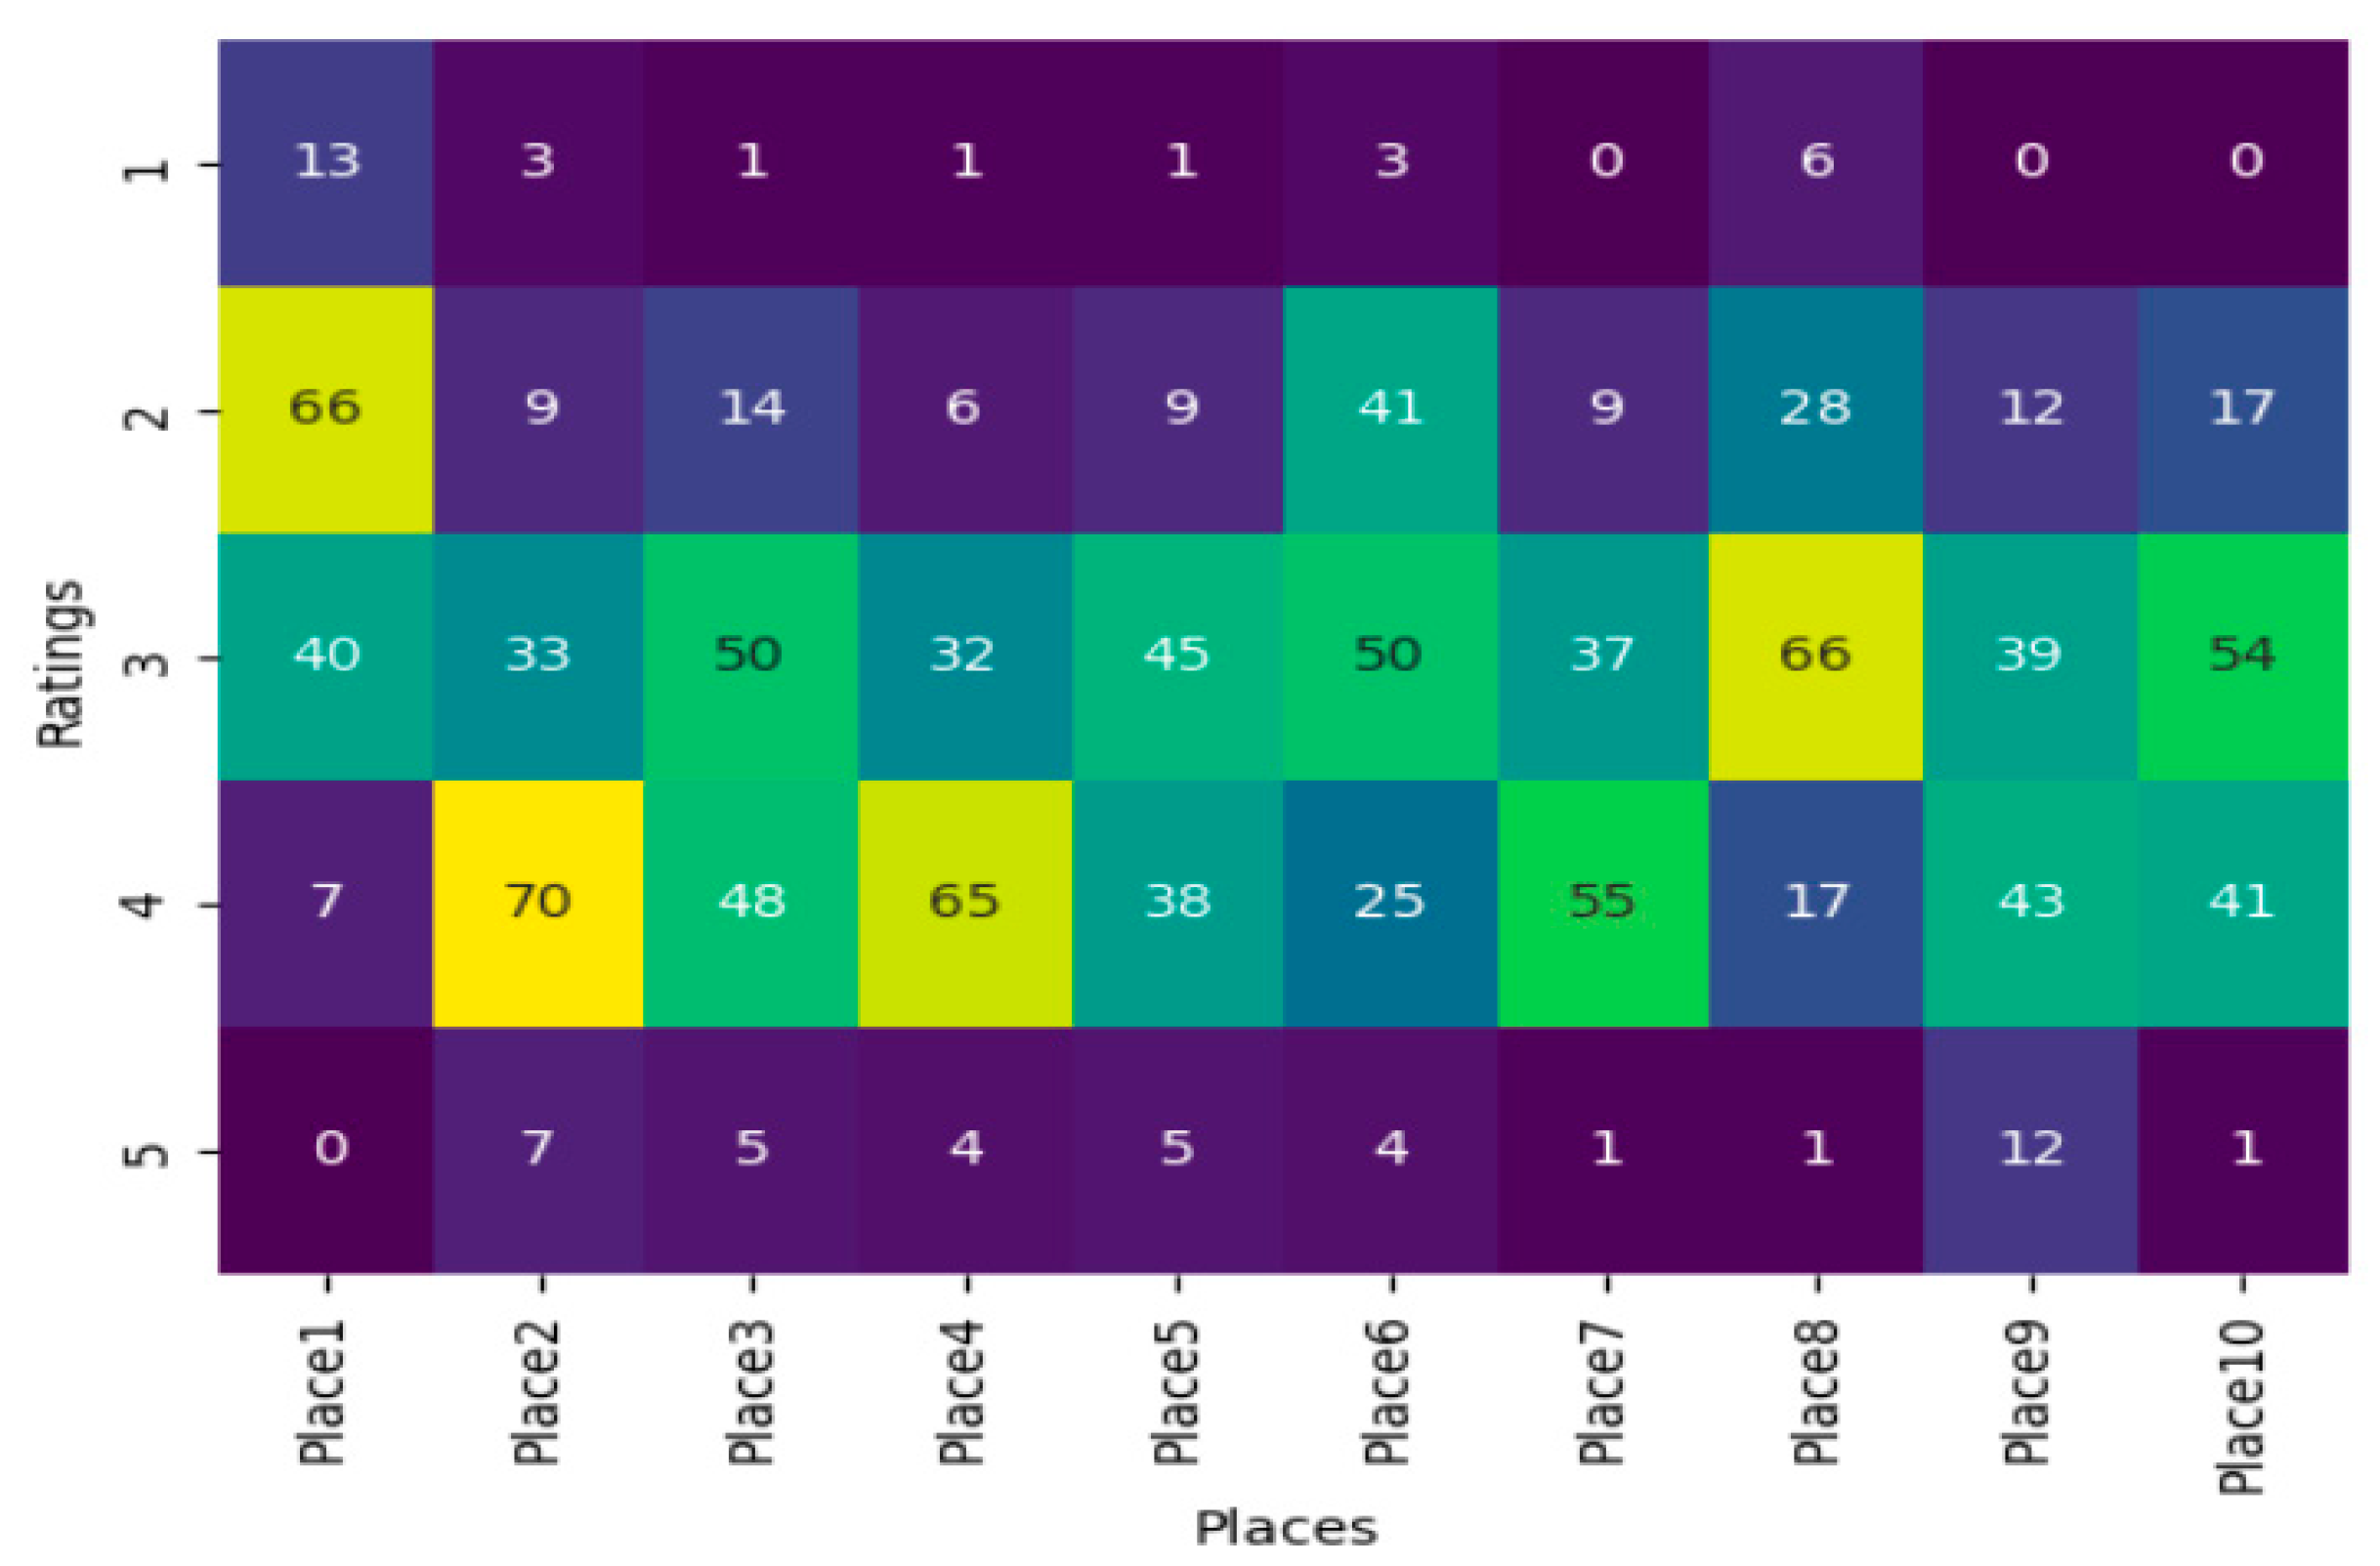
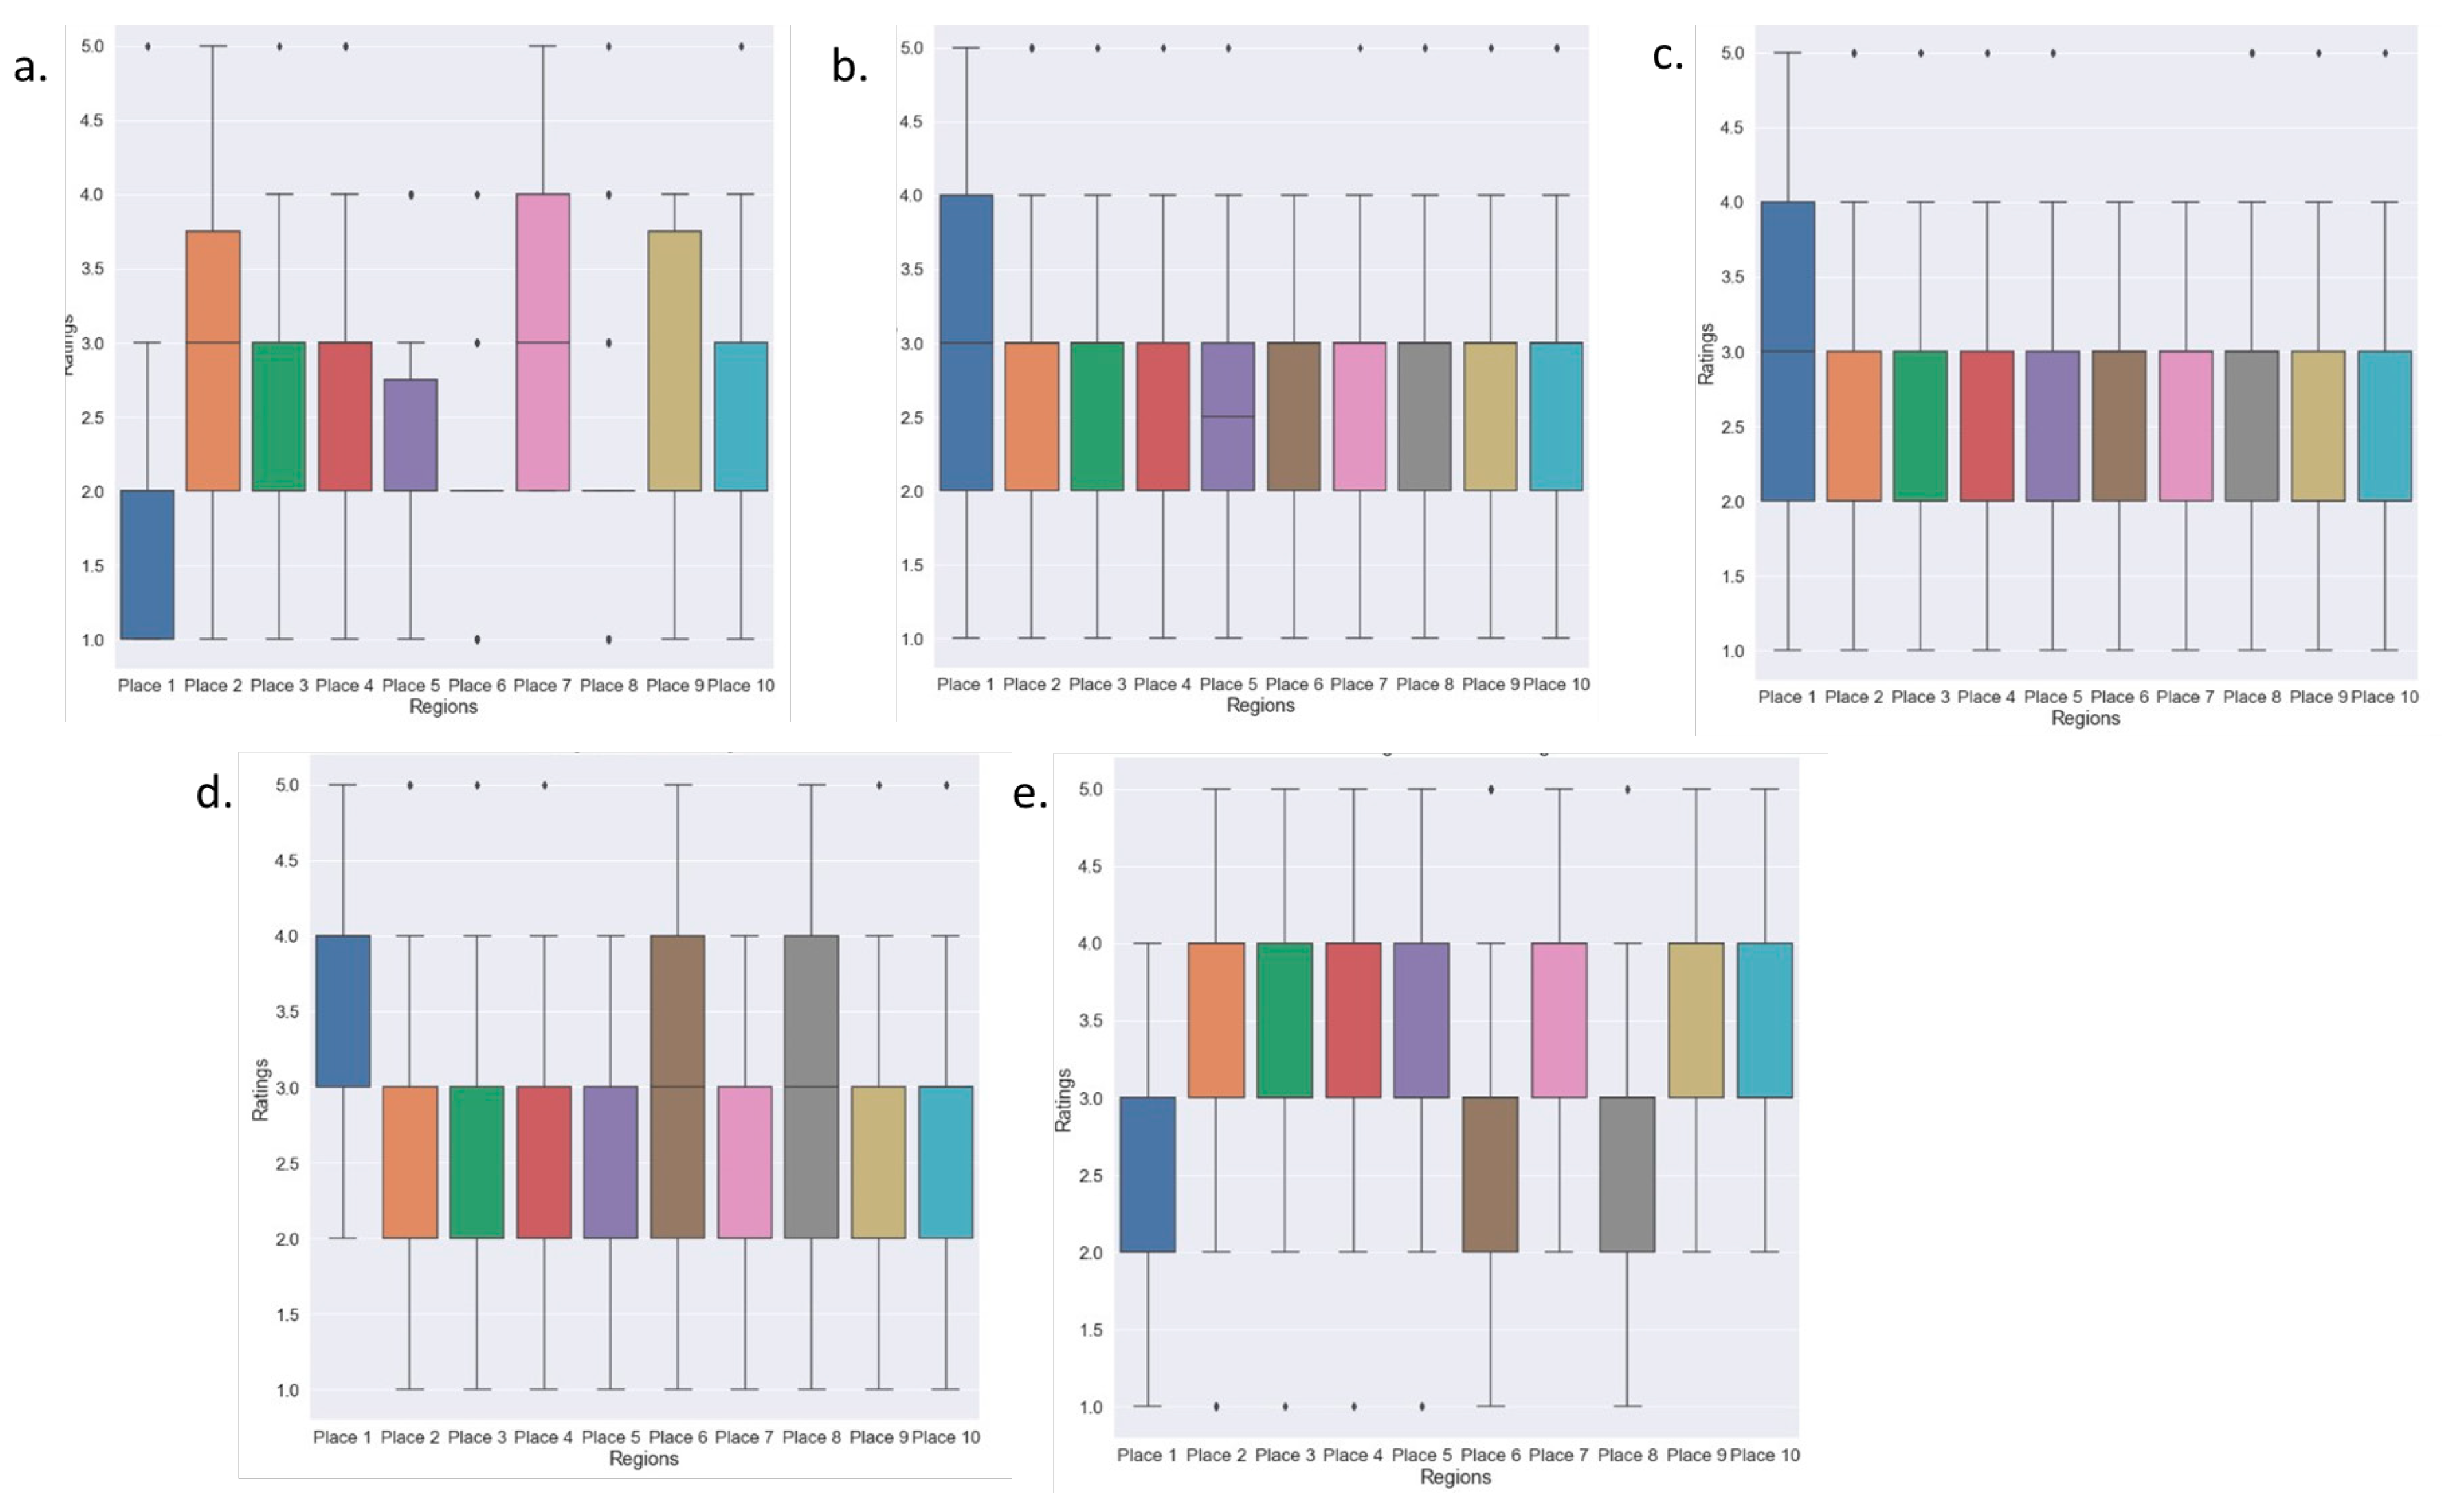
Disclaimer/Publisher’s Note: The statements, opinions and data contained in all publications are solely those of the individual author(s) and contributor(s) and not of MDPI and/or the editor(s). MDPI and/or the editor(s) disclaim responsibility for any injury to people or property resulting from any ideas, methods, instructions or products referred to in the content. |
© 2024 by the authors. Licensee MDPI, Basel, Switzerland. This article is an open access article distributed under the terms and conditions of the Creative Commons Attribution (CC BY) license (https://creativecommons.org/licenses/by/4.0/).