Article

Research on the Value of Water-Related Cultural Heritage Architecture from Historical Environmental Records: Evidence from the Li River Basin in China

1
School of Art and Media, China University of Geosciences (Wuhan), Wuhan 430074, China
2
School of Art and Design, Wuhan University of Technology, Wuhan 430070, China
3
Bartlett School of Architecture, University College London, London WC1E 6BT, UK
4
Hubei Provincial Urban Planning and Design Institute, Wuhan 430071, China
5
State Key Laboratory of Biogeology and Environmental Geology, China University of Geosciences, Wuhan 430074, China
6
Hubei Key Laboratory of Wetland Evolution & Eco-Restoration, China University of Geosciences, Wuhan 430074, China
*
Authors to whom correspondence should be addressed.
Land 2024, 13(6), 838; https://doi.org/10.3390/land13060838
Submission received: 5 March 2024 / Revised: 2 June 2024 / Accepted: 4 June 2024 / Published: 12 June 2024

Abstract

:
Water-related cultural heritage architecture (WRCHA) represents a globally significant and potentially hybrid heritage found across river basins worldwide. Its spatial and temporal evolution characteristics offer insight into the development trends of river basin environments, yet their value within water-related cultural and environmental systems remain incompletely assessed. This study undertakes qualitative and quantitative analyses of the historical spatial and temporal distributions, influencing factors, and environmental changes affecting the water-related culture, climate, population, and urban areas of 295 WRCHA sites in the Li River Basin of China, employing drought–flood indices, GIS analyses, random forest algorithms, and other methodologies. The results reveal that (1) the Lishui Basin contains a significant distribution pattern of agglomeration for WRCHA within the river basin, concentrated along the river, at low altitudes, with minimal terrain variation, and radiating around ancient governance centers, with varying increases observed across different periods and aggregation zones and with significant spatial and temporal heterogeneities; (2) the distribution pattern is influenced by joint natural and human factors, closely tied to variables such as the river network density, DEM, population changes, and distance to ancient government sites; (3) the combination of the architecture’s location and elevation, along with drought–flood curves, reflects the position of the ancient riverbed of the Lishui River and its historical maximum water level. The quantity of new constructions, in conjunction with the distance from ancient government centers and the trends in population change, thus indicates the urban scale and the frequency and severity of disasters. This study provides a research paradigm and historical reference model for investigating environmental changes in watershed systems, aiding in clarifying the historical human–water symbiosis pattern in the middle reaches of the Yangtze River. Such insights will furnish a scientific basis for future regional ecological planning and watershed environmental management.

1. Introduction

The 1972 “Convention Concerning the Protection of the World Cultural and Natural Heritage” defines “WRCHA” as tangible cultural heritage related to water, including artifacts, architecture, and landscapes, as well as intangible cultural heritage, such as spiritual beliefs, conceptual understandings, and systems of water conservancy rights formed by human activities, including water management and usage. It also encompasses natural and cultural hybrid heritages, with core components such as hydraulic engineering, water management techniques, water–soil management models, hydraulic structures and facilities, and water culture ideologies [1]. Within the UNESCO World Heritage List, there are 513 entries containing the keyword “water”, comprising 325 cultural heritage sites, 161 natural heritage sites, and 27 mixed heritage sites [2]. WRCHA can generally be categorized into the following four types based on its purpose: water transportation, water conservancy, water faith (a water-related ideology that can guide our behavior), and water records. This includes tangible remnants such as ancient docks, ferry crossings, bridges, hydraulic engineering projects, water temples, water transportation clubhouses (i.e., a water transport guild hall with multiple public service functions), stone carvings, water-level stakes, dams, isoheads (short structures that can protect riverbanks, levees, and beaches), rocky outcrops, and water suppression artifacts. In this study, the most common types of WRCHA are represented by water temples, docks, and bridges. Therefore, conducting research related to water heritage can help in overcoming the cultural–natural divide to understand the historical role of heritage and protect it. As a result, it lays a foundation for studying the evolution of people–water–city environments.
The Venice Charter articulates the historical value of ancient buildings, stating that “historical monuments, buildings and sites, handed down from the past, are witnesses to the events of history and the expression of a people’s long-established traditions”. This sentiment encapsulates the historical significance of ancient architecture. Similarly, ancient buildings related to water culture are also important human water activities in historical periods, which have always been intertwined with the occurrences of floods and droughts in river basins. These activities include shipping and trade, port distribution, urban development, flood and drought management, water rights systems, and the ecological cycles and evolution of river basins [3]. Furthermore, the structures exhibit good cultural transmission, strong temporal continuity, widespread spatial distribution, empirical stability, and a combination of human and natural attributes. As a result, they possess essential conditions for recording historical changes in water, climate, and urban environments during different historical periods [4,5,6]; a thorough and effective study of them constitutes an important framework for studying the evolution of people–water–city environments.
Current research on WRCHA primarily emphasizes its historical, cultural, social–folklore, hydro-agriculture, architectural, and artistic values [7]. There is substantial literature regarding the spatial distribution patterns of water-related cultural heritage development systems [8]. Wang et al. [9] studied the historical perception and symbolic significance of water heritage and its crucial role in shaping the perceptions of the state, urban location, and landscape distribution, and they further studied the evolution of polder landscapes in the Taihu Basin using proximity and correlation analysis methods. Pearson et al. [10] considered the use of water cultural heritage to promote biodiversity conservation, conducting correlation and kernel density analyses to show the overlap of sea areas with high cultural and natural values, and, finally, they identified three potential synergies, which are of great significance for the conservation of water cultural heritage and marine biodiversity. Geraldi et al. [11] focused on the cultural heritage of lagoon water bodies and used a variety of spatial analysis methods (regression analysis and correlation analysis) to explore the potential relationship between it and local tourism. Dai et al. [2] understand and protect heritage from the perspective of water systems, linking heritage protection with water systems. A new method was established to collect, code, and classify different world heritage sites to better understand the role that water systems play in the identification and conservation of heritage sites.
However, the environmental indicators value of WRCHA in the field of human–water–urban environment changes is not prominently featured [12]. There are still significant research gaps and limitations, as follows: (1) most studies chose remote sensing interpretation methods to identify changes in water body characteristics within the last 100 years or reconstructed historical water level data through deposition, interpolation, and inversion algorithms [4], but very few have used humanistic data as a substitute index to characterize changes in ancient hydrological environments; (2) there are few correlation analyses of WRCHA with factors such as droughts, floods, and population in the same period, and there is a lack of dual human–natural systems, as well as a combination of qualitative and quantitative methods, to analyze the spatial and temporal couplings of human, water, and the historical environment of the city.
In this study, we chose the Li River Basin in Hunan Province, China, as the research area to examine the interaction and development patterns between WRCHA and the human–water–urban environment from the perspectives of architecture, historical geography, and environmental water culture. Furthermore, we try to clarify the correlation and characterization of the relationships between water-related architecture and the ancient water environments, thereby offering a fresh perspective and significant reference for reconstructing environmental changes and human–environmental relationships in river basins worldwide. Additionally, it supplements variable modules for basin ecological water culture and coupled socioeconomic modeling.

2. Study Area and Data Sources

2.1. Study Area

According to Figure 1, The Li River, located in the northwest of Hunan Province, China, is the fourth largest river in the province and is a tributary of the Yangtze River. Originating from the northern mountainous areas of Sangzhi County, it eventually flows into West Dongting Lake. The administrative divisions within the Li River Basin have undergone multiple changes throughout history. During the Ming and Qing dynasties in ancient China, the basin primarily consisted of the following seven ancient prefectures and counties: He Feng Prefecture (now He Feng County) and Sangzhi County in the upstream region, Da Yong County (now Yong Ding District) and Ci Li County (including the present-day Wu Ling Yuan District) in the midstream region, and Shi Men County, Li Prefecture (now Li County and Jinshi City), and An Fu County (now Lin Li County) in the downstream region. The Li River Basin is an important cradle of human civilization in the Yangtze River Basin. Situated in the mid–lower reaches of the Li River, more than 400 prehistoric sites have been discovered in the Liyang Plain. Among them, Chengtoushan is the only ancient city site discovered in China to date, acclaimed as “the earliest city in China”, with the earliest period, richest cultural relics, and most complete preservation.
In the upper reaches of the Li River Basin, high mountains and valleys are interspersed. In the middle reaches, hills and basins are distributed alternately, with a comb-shaped distribution of runoff. The eastern lower reaches consist of hills and plains with distributed polders. At the tail end, plains, lakes, and polders are scattered. The Li River Basin receives an average annual precipitation of around 1600 mm, with a decreasing trend from the northwest high mountains and hills to the southeast lake plains. For every 100 m decrease in elevation, the annual precipitation decreases by 137.76 mm [13]. The Li River spans a length of 407 km, with a high river specific drop. The downstream areas are quickly threatened by floods after heavy rainfall in the upstream regions, leading to frequent water disasters. In the process of managing complex human–water relationships such as flood control, navigation, and water rights, the people of the Li River Basin have developed a rich regional water-related cultural heritage. This area serves as a typical microcosm of the mid-Yangtze River region in China. In 2023, the provincial water resources department of the Li River Basin responded to national water resources policies by officially incorporating water culture aspects into the overall water resources reform and development plans, thereby emphasizing the importance of WRCHA in water resources, agriculture, cultural construction, and ecological tourism development.

2.2. Data Sources

In this study, ancient architectural forms closely related to water in the Li River Basin were uniformly categorized as WRCHA. Through the study of historical documents and historical maps, as well as four years of field research and expert interviews, a series of datasets on this architecture, focusing on water temples and wharves, were summarized.

2.2.1. Historical Geographic Information Data on WRCHA

In the Li River Basin, a number of water-related cultural heritage structures still exist as remains or sites today, some of which have been repaired or reconstructed on the basis of old sites, and they are an important basis for identifying historical places and time periods. (Figure 2) A total of 410 cultural objects and sites related to water cultural heritage in the Li River Basin have been identified through a combination of field surveys and analysis of a wide range of historical data, using conventional standard hand-held GPS and equipment such as mobile track records and laser range finders. Among them, 295 sites are centered on water culture, and 198 sites have clear information on construction date, coordinates, elevation, function and related events. For some of them, we can even trace the time of their collapse and reconstruction.

2.2.2. Multisource Data Integration and Processing

By analyzing historical documents preserved from China’s Ming and Qing dynasties, this study reconstructed ancient climate change sequences with a resolution of 10 years, demonstrating strong validity and consistency [14]. Building upon previous research and considering the availability of historical data, we used various sources of natural and human-related data (Table 1), such as records in historical journals and materials in atlases, and based on the WGS-84 coordinate system, we conducted the translation, summarization, supplementation, and repeated verification of temporal and drought/flood-grade data using ArcGIS 10.8 software.

3. Research Methodology

On the basis of the fieldwork and data processing work, this study quantitatively describes the characteristics of the spatial distribution of temples and the factors affecting them in different time periods using spatial analysis, cluster analysis, and drought and flood sequence analysis. And regression analysis, correlation analysis, random forest, and other methods were used to quantify the relationship and degree between independent variables and dependent variables.

3.1. Average Nearest Neighbor Index

The index was used to compare the average nearest neighbor distances of different water heritage site categories in the study area and observe how they changed over time in spatial clustering. Calculating the nearest neighbor index (Ann) can elucidate the dispersed, random, or clustered distribution status of a set of elements. Computed as the average distance between each point element and its nearest neighbor, Ann can reflect the distribution pattern of WRCHA and quantitatively describe the degree of its aggregation or dispersion.
The formula for its calculation is as follows:
A n n = D O ¯ D E ¯
D O ¯ = i = 1 n d i n
D E ¯ = 0.5 n / A
where D O ¯ represents the average distance between each element and its nearest neighboring element, D E ¯ represents the expected average distance under a random distribution pattern, n denotes the quantity of the WRCHA, and A is the minimum bounding rectangle area of all elements. If the Ann is less than 1, this indicates that the average nearest neighbor distance is less than the stochastic expected distance, thus indicating a clustered distribution. Conversely, if the Ann is greater than 1, it indicates a dispersed distribution. If Ann equals 1, it suggests an even distribution.

3.2. Kernel Density Analysis

The kernel density is a nonparametric estimation method that calculates the value of a unit area near a point feature using a kernel function and fits it into a smooth conical surface. This estimation is then used to determine the density magnitude at other locations; it can help us understand the overall density distribution and possible spatial distribution patterns of the water architectural heritage. For a location (x, y), the predicted density is determined by the following formula:
D = 1 R i = 1 n 3 π 1 d i s t i R 2 2
where D represents the kernel density estimation value; i = 1 , , n denotes the input point; d i s t i is the distance between point i and the location (x, y); R is the search radius; and n is the quantity of the WRCHA within the search range. Using ArcGIS 10.8, the kernel density method can effectively visualize the specific concentration and dispersibility of WRCHA within a region; the higher the kernel density value, the denser the distribution.

3.3. Relevance Analysis

In order to further verify the relationship between the influencing factors (DEM, river network density, distance to administrative centers, etc.) and the spatial distribution of the WRCHA, this study utilized the Pearson correlation coefficient to explore the correlation among variables. Correlation analysis can identify variables with similar distribution trends, with the calculation formula as follows:
r x 1 , x 2 = cov x 1 , x 2 v a r x 1 v a r x 2
where cov x 1 , x 2 represents the covariance between x 1 a n d x 2 , v a r x 1 t is the variance of x 1 t ,   v a r x 2 t is the variance of x 2 t , and the correlation coefficient ranges from +1 to −1, where a positive correlation indicates a direct relationship between the two factors, meaning that as one set of values increases, the other set of values may also increase. A negative correlation indicates that one variable varies inversely with another variable. A correlation of zero indicates that there is no interdependence between the two variables.

3.4. Drought–Flood Classification Method and Sequence Reconstruction

As an ideal quantitative approach for handling qualitative descriptions of drought–flood data, the drought–flood classification method is used to facilitate the spatiotemporal distribution relationship analysis between the river network and WRCHA. The drought–flood disaster information was reconstructed using a five-level drought–flood method, and they were as follows: −2 for severe drought, −1 for drought, 2 for flood, 1 for severe flood, and 0 for normal years. The formula for calculating the drought–flood index is as follows:
I = 2 C 2 + C 1 C o u n t
where I is the drought–flood index, C 2 is the frequency of severe drought or severe flood events, C 1 is the frequency of drought–flood events, and C o u n t is the total number of occurrences. A higher I value indicates more severe drought–flood disasters in the area.

3.5. Random Forests Regression

The random forest regression is a representative machine learning algorithm. It is also used to analyze the relationship between different variables, such as population, river network density, and DEM. As an integrated learning algorithm, it randomly samples features and simultaneously samples and trains multiple decision tree classifiers. The final classification result is obtained by statistically counting the votes of all decision trees’ results. The random forest algorithm effectively reduces the overfitting and low accuracy issues that may exist in a single decision tree, improves the accuracy and robustness of the model, and has a good fitting effect on large datasets with many features and nonlinearity.
This study investigates the influence of multiple factors on the distribution of WRCHA using random forest regression. A comparison with the results from geographical detectors was conducted to explain the mechanisms through which different factors affect the distribution of the sites. By integrating these findings, the distribution characteristics of this architecture in the Li River Basin were comprehensively analyzed.

4. Results and Discussion

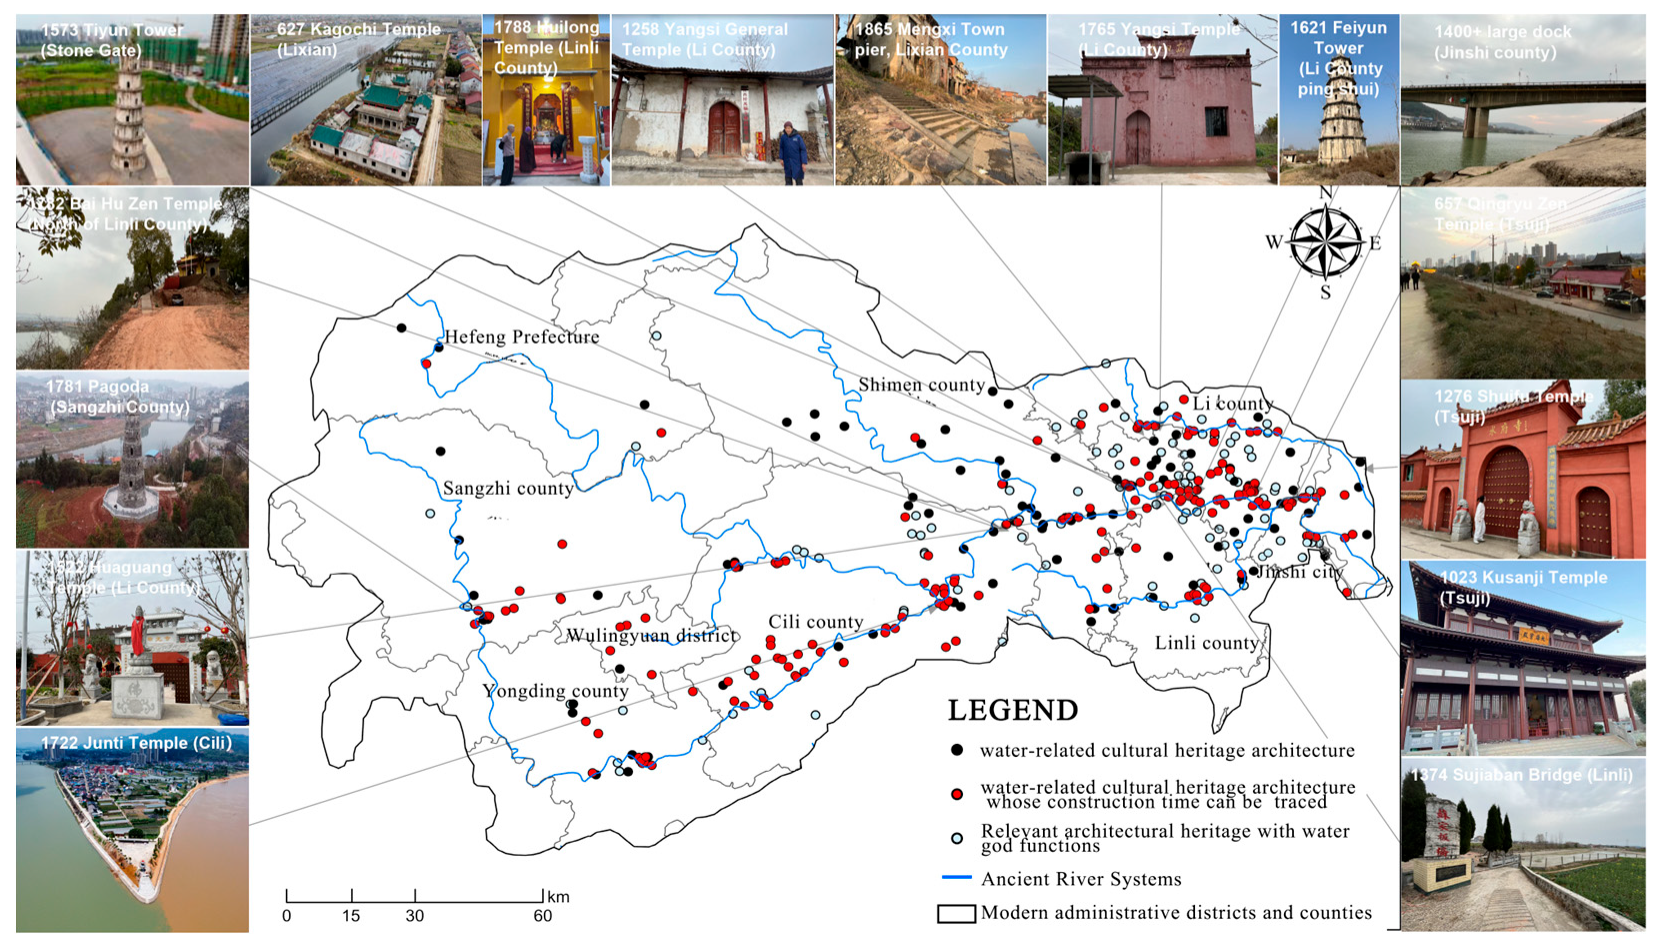
4.1. Analysis of the Spatial and Temporal Distribution Characteristics and Patterns of WRCHA

The distribution of this architecture, on the basin scale, exhibited evident agglomeration and spatial variations (Figure 3a). In the upper and middle reaches of the Li River Basin, the WRCHA exhibited a “bead–string-shaped” distribution pattern centered around administrative centers but with limited coverage. In the lower reaches, it showed a “central radiation-type core density zone with a belt-like distribution along the main and tributary streams”. This architecture is primarily concentrated in the Liyang Plain in the lower reaches of the Li River, with the most numerous sites in Li County, accounting for 27.43% of the total, followed by Shimen County, Cili County, Anfu County, Dayong County, Sangzhi County, and Hefeng Prefecture. The nearest neighbor ratio for the distribution of WRCHA is 0.56, with a p-value less than 0.001, indicating a clustered distribution. From the Tang dynasty to the Ming dynasty, it exhibited a single core cluster in the lower reaches, which was continuously reinforced. By the Qing dynasty, it developed into a single core cluster in the lower reaches, with a “bead–string-shaped” secondary core distribution pattern in the middle and upper reaches.
Based on the historical time range of the construction of the WRCHA across the entire Li River Basin, the analysis was divided into the following three temporal segments: the Tang–Song–Yuan period (618–1368 AD), the Ming period (1368–1644 AD), and the Qing period (1644–1911 AD). According to Figure 3, there were 30 water-related sites in the Tang–Song–Yuan period, with 83.33% concentrated in the Liyang Plain area on the north bank of the lower reaches of the Li River, and only five sites in the middle and upper reaches. In the Ming period, the number of water-related sites increased to 45, mainly distributed in the main stream area from Cili to Lizhou along the Li River and in the Sangzhi County and Loushui South Source areas in the upper reaches. In the Qing period, the number of water-related sites increased by 57, reaching a total of 102, which was 2.27 times that of the Ming period. They were mainly concentrated in the lower reaches of Lizhou and the middle reaches of Cili.
In summary, the number of water-related cultural heritage architectural sites gradually increased over the three historical periods, with the core always concentrated in the Liyang Plain where the Li River, Dan River, and Qian River converge. Temporally, there were different growth rates in each period, and the spatial distribution patterns exhibited developmental differences, demonstrating significant spatiotemporal heterogeneity. The changing development of this heterogeneity, combined with the results of the kernel density analysis, reflect the spatiotemporal dynamics of the WRCHA and the evolution of the historical people–water–city interaction, as follows: ① The clustering effect of this architecture in the Liyang Plain remained the strongest throughout history, reflecting the high status of Lizhou, as the only prefectural-level administrative center in the Li River Basin, and its economic advantages as a navigable urban center. ② From the Tang to Qing dynasties, the water-related architecture along the Li River gradually expanded westward to the upper and middle reaches. This trend corresponded to the shift in the economic center of ancient China from the Yellow River Basin to the Yangtze River Basin during the Tang and Song dynasties. As the river closest to the Yangtze River in Hunan Province, the Li River Basin experienced an earlier climax in reclamation and urban development processes [33]. ③ In the Qing period, the population migration associated with the “Jiangxi moved to Hugaung (Hubei and Hunan regions)” policy promoted the development and growth of the Dongting Lake urban agglomeration [34]. The population growth in Lizhou, Shimen County, and Cili County led to upgrades in navigation and contributed to the increase in the number of newly constructed water-related architectural sites.

4.2. Analysis of the Spatial and Temporal Distributions of the WRCHA Related to the Environment

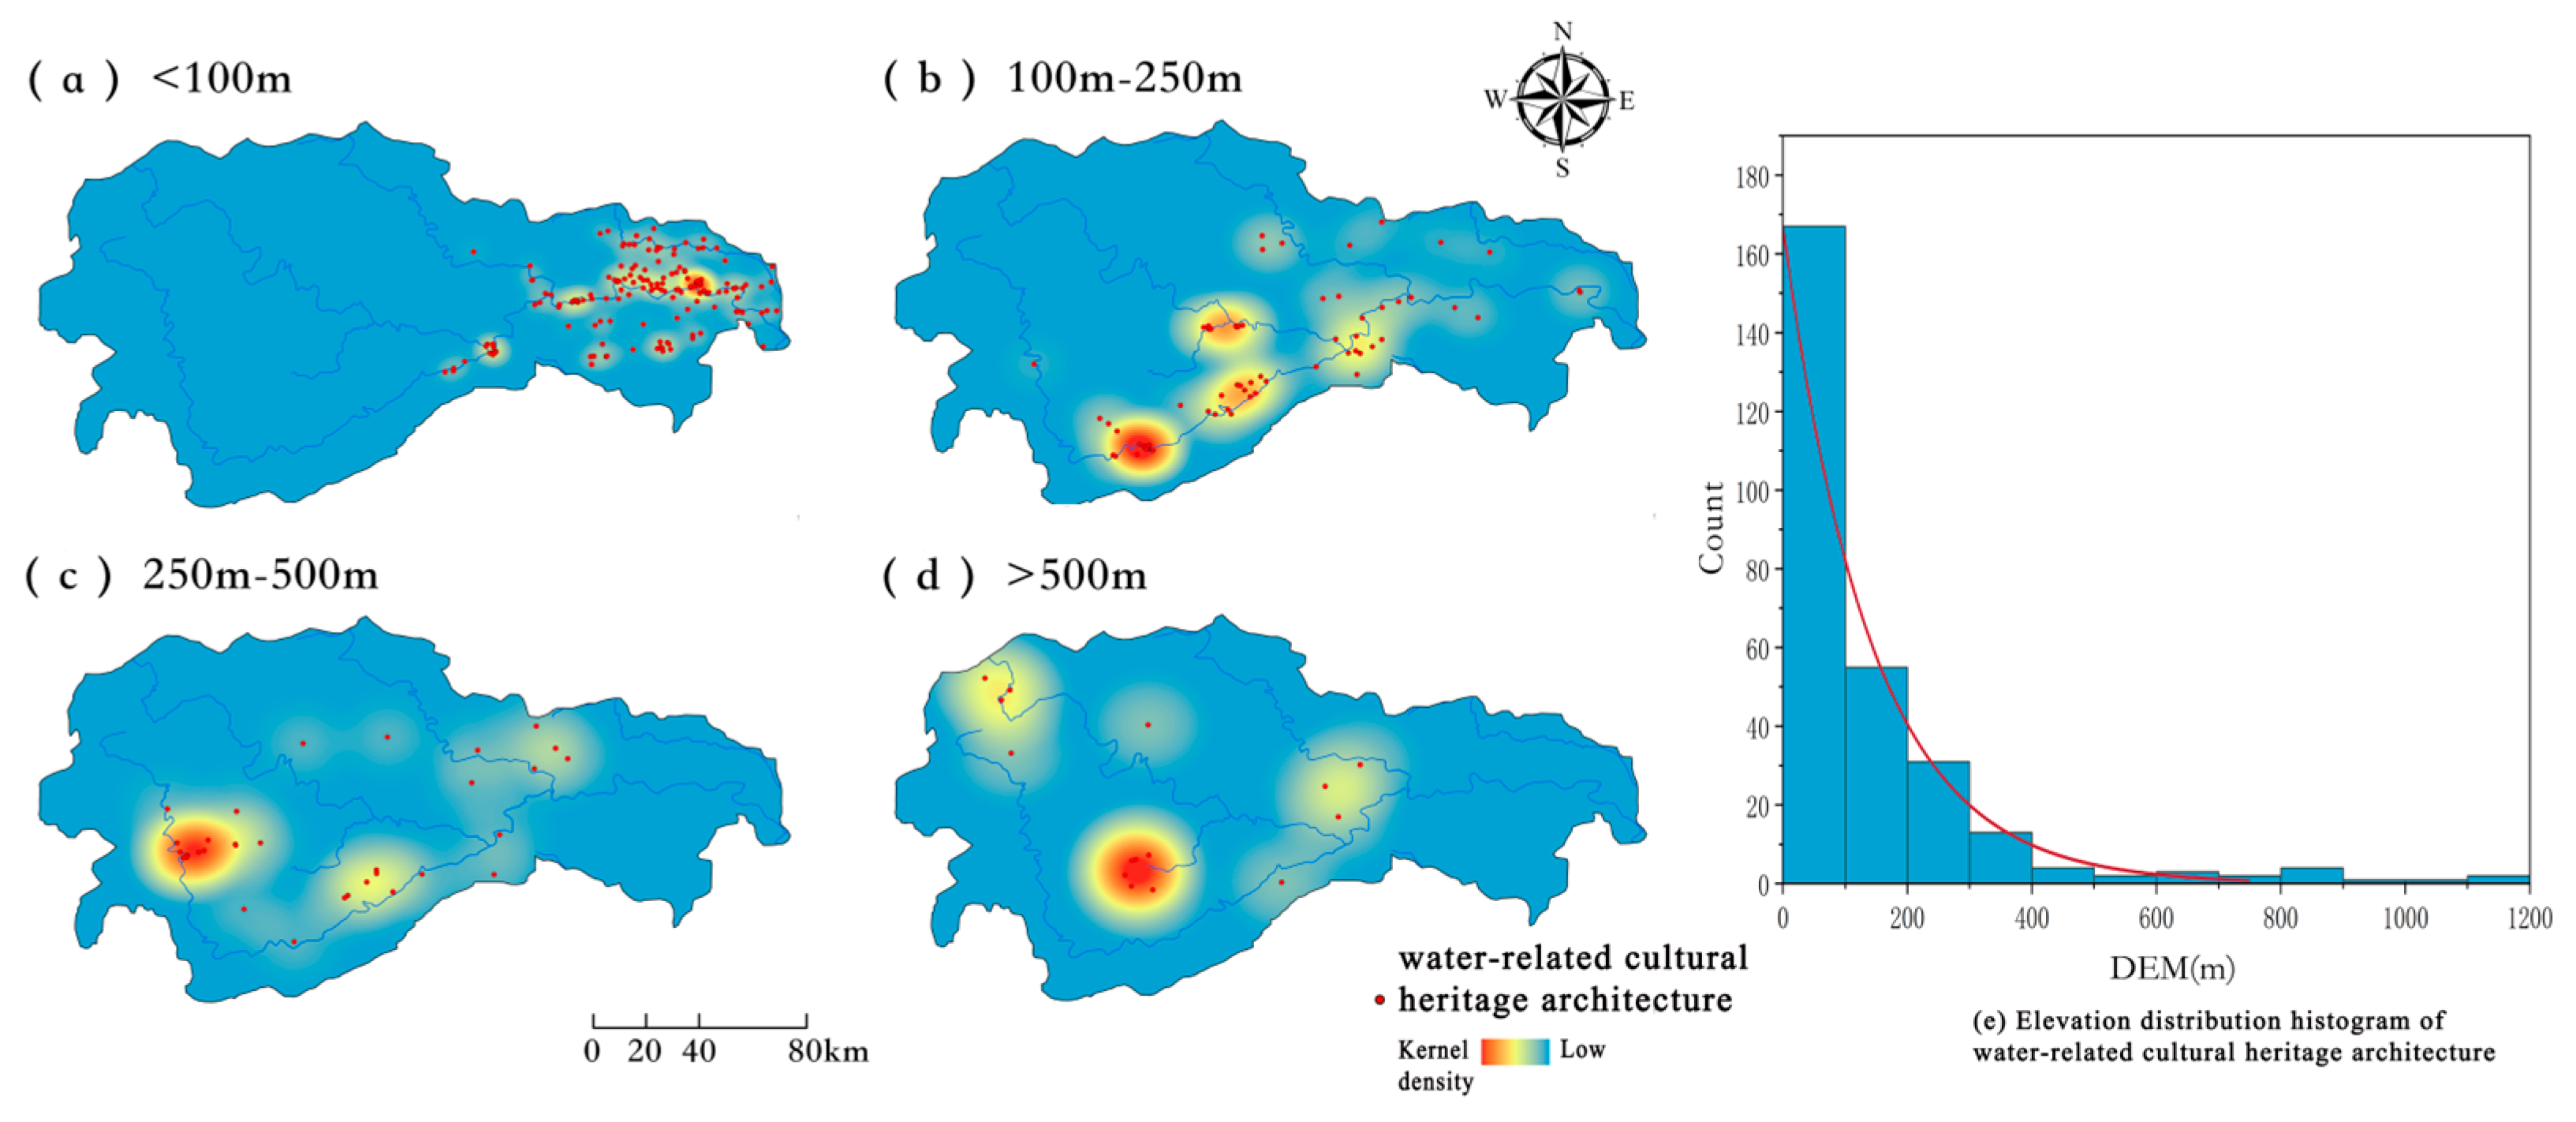
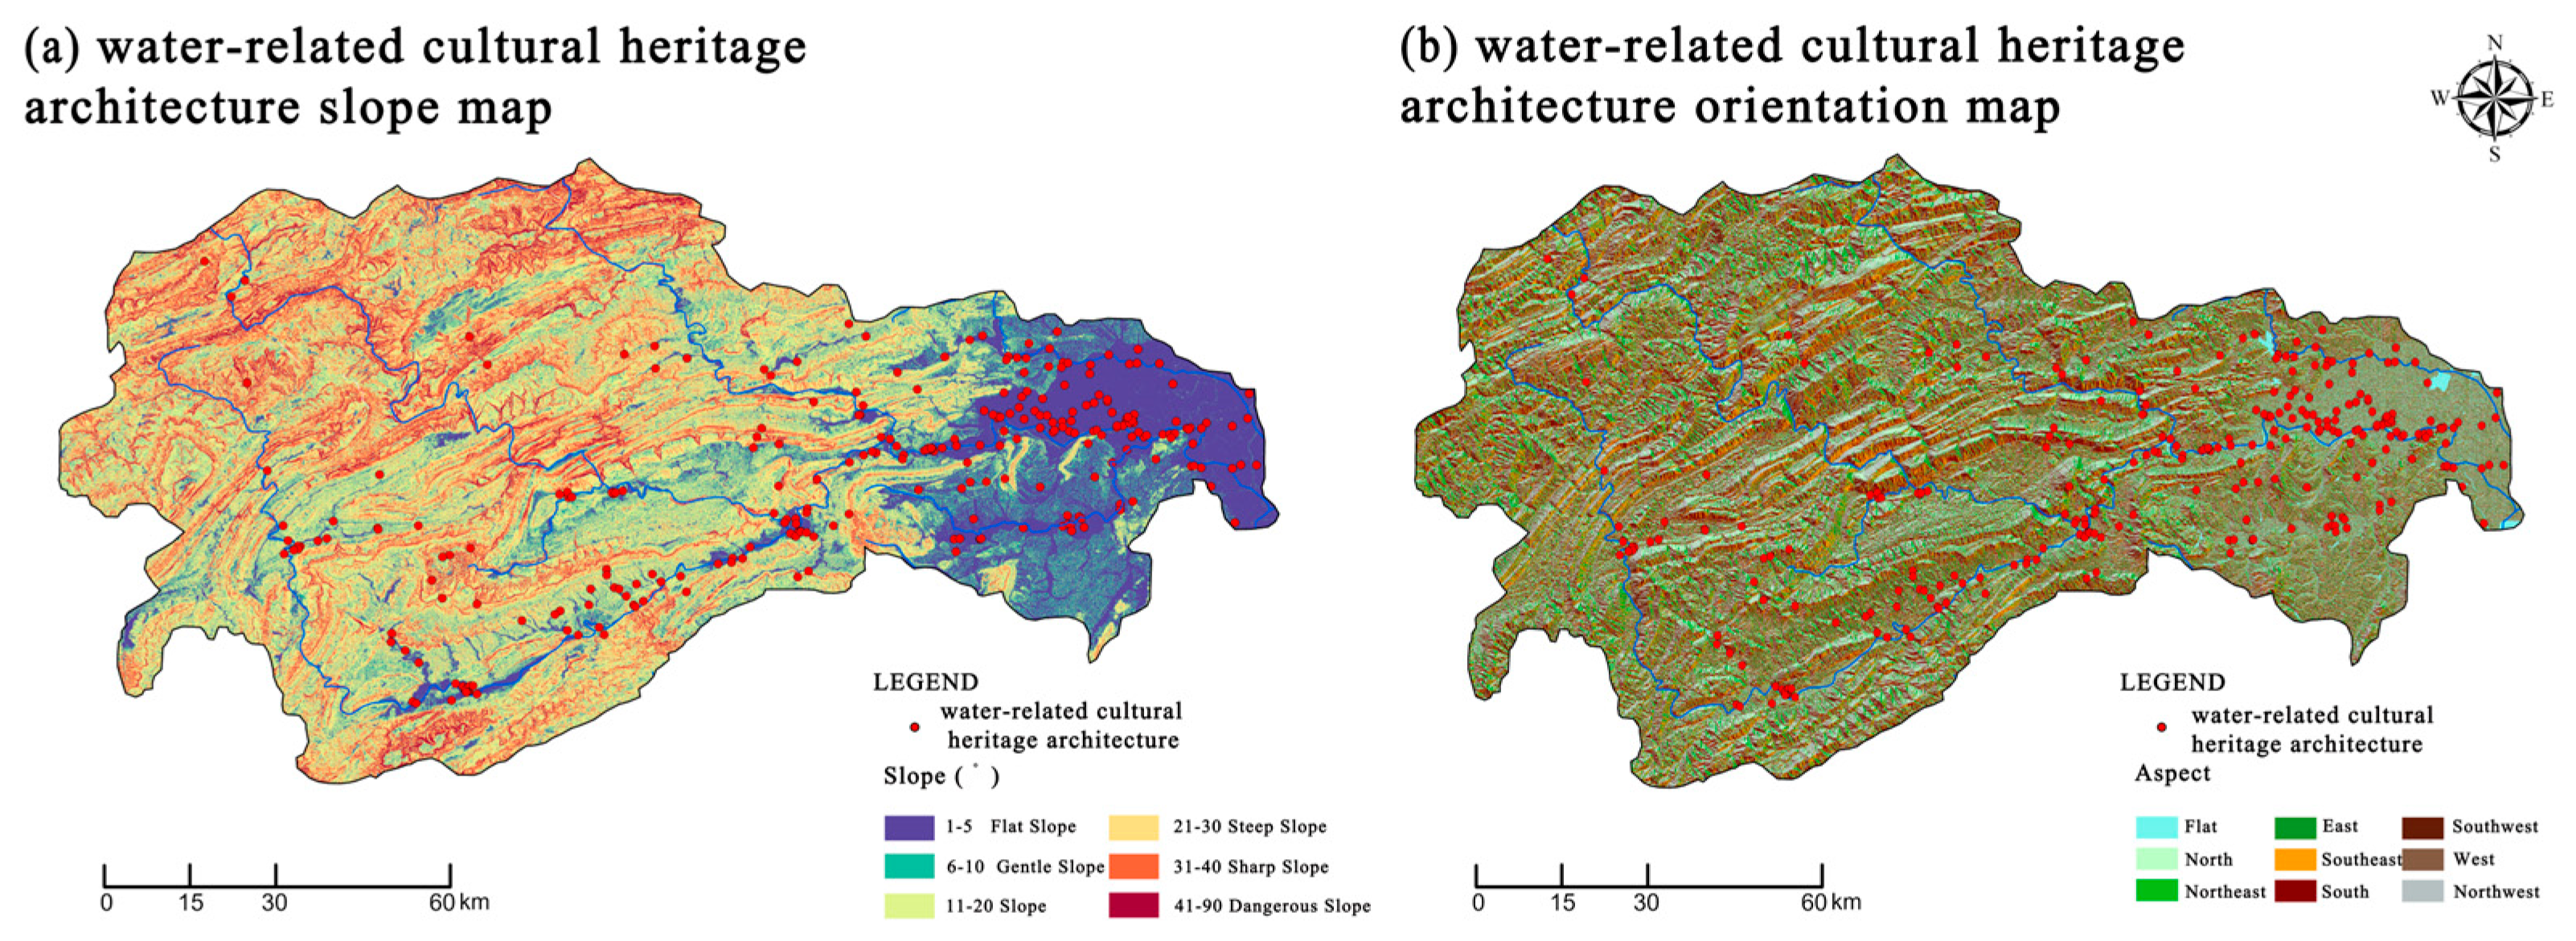
4.2.1. Elevation and Terrain Cluster Analyses

The terrain and elevation directly influence the local climate, soil, river morphology, and other living conditions. Plain areas have more arable land and conditions for navigation, while rugged mountainous terrain limits agricultural, water transportation, and population activities, thereby affecting the distribution of water-related architecture. Figure 4 shows that the overall topography of the Li River Basin is higher in the west and lower in the east, with the terrain in the western region being higher in the north and lower in the south. Overlaying the distribution data of the WRCHA from the Tang–Song–Yuan, Ming, and Qing periods with the digital elevation model (DEM), we observed that these heritage sites were predominantly concentrated in the eastern plain areas and along the rivers. During the Ming and Qing periods, the concentration in the eastern region was gradually reinforced, and the development gradually extended along the rivers toward the west, reflecting the possibility of people migrating downstream to the middle and upper reaches with higher elevations to avoid water disasters and seek development opportunities.
To display the spatial information of the water-related architecture in different periods and the results of different types of analyses [35], the natural intermittent point method (NIP) was used in ArcGIS 10.8 to divide the DEM data of the Li River Basin into four levels. The elevation data of the 295 sites were classified into the following four categories: <100 m, 100–250 m, 250–500 m, and >500 m. Overlay analysis was conducted to examine the elevation influence and spatial evolution of these sites in the Li River Basin. As shown in Figure 5, there was a close correlation between the elevation and the distribution of the sites. Specifically, as the elevation values increased, the number of sites decreased, indicating a negative correlation between the two.
Combining the histograms of the elevation distributions of the WRCHA, approximately 58.8% of the sites were located below 100 m in elevation, primarily along the Cen River, Li River main stream, and Dao River, forming three parallel bands distributed horizontally in the downstream plain area of the Li River. The sites within 100–250 m elevation were mainly distributed along the Li River, Lou River, and Shao River in the middle to upper reaches of the Li River Basin. Within the 250–500 m elevation range, there were two aggregation areas in Sangzhi and Wulingyuan. The sites below 250 m accounted for 83.45% of the total. Overall, the WRCHA exhibited a significant distribution pattern characterized by “proximity to water, low altitude, and gentle terrain”.
As elevation data cannot fully reflect the terrain characteristics of the areas where this architecture is located, we identified the slope classification modulus of the Li River using the natural breaks method and overlaid different slope layers with heritage sites for analysis (Figure 6a). It was found that 4.56% of the sites were situated in steep and rugged slope areas, while 55.09% were located on slopes ranging from 1 to 5°. The low-lying river areas in the eastern part of the Li River are more conducive to the influx of moist maritime air from the east, resulting in abundant precipitation, which is beneficial for agricultural development and transportation. Consequently, the heritage sites were mainly concentrated in the main river valleys and the plains of Liyang.
Figure 6b reflects the relationship between the slope aspect and WRCHA. The kernel density distributions on the shady and sunny slopes were nearly identical. Through statistical analysis, it was found that the number of sites on shady slopes accounted for 51.2% of the total, with a minimal difference compared to sunny slopes. This observation reflects the difference in site selection between the WRCHA and historical dwellings, indicating a preference for proximity to water over orientation toward sunlight, without discriminating on the basis of slope aspect.

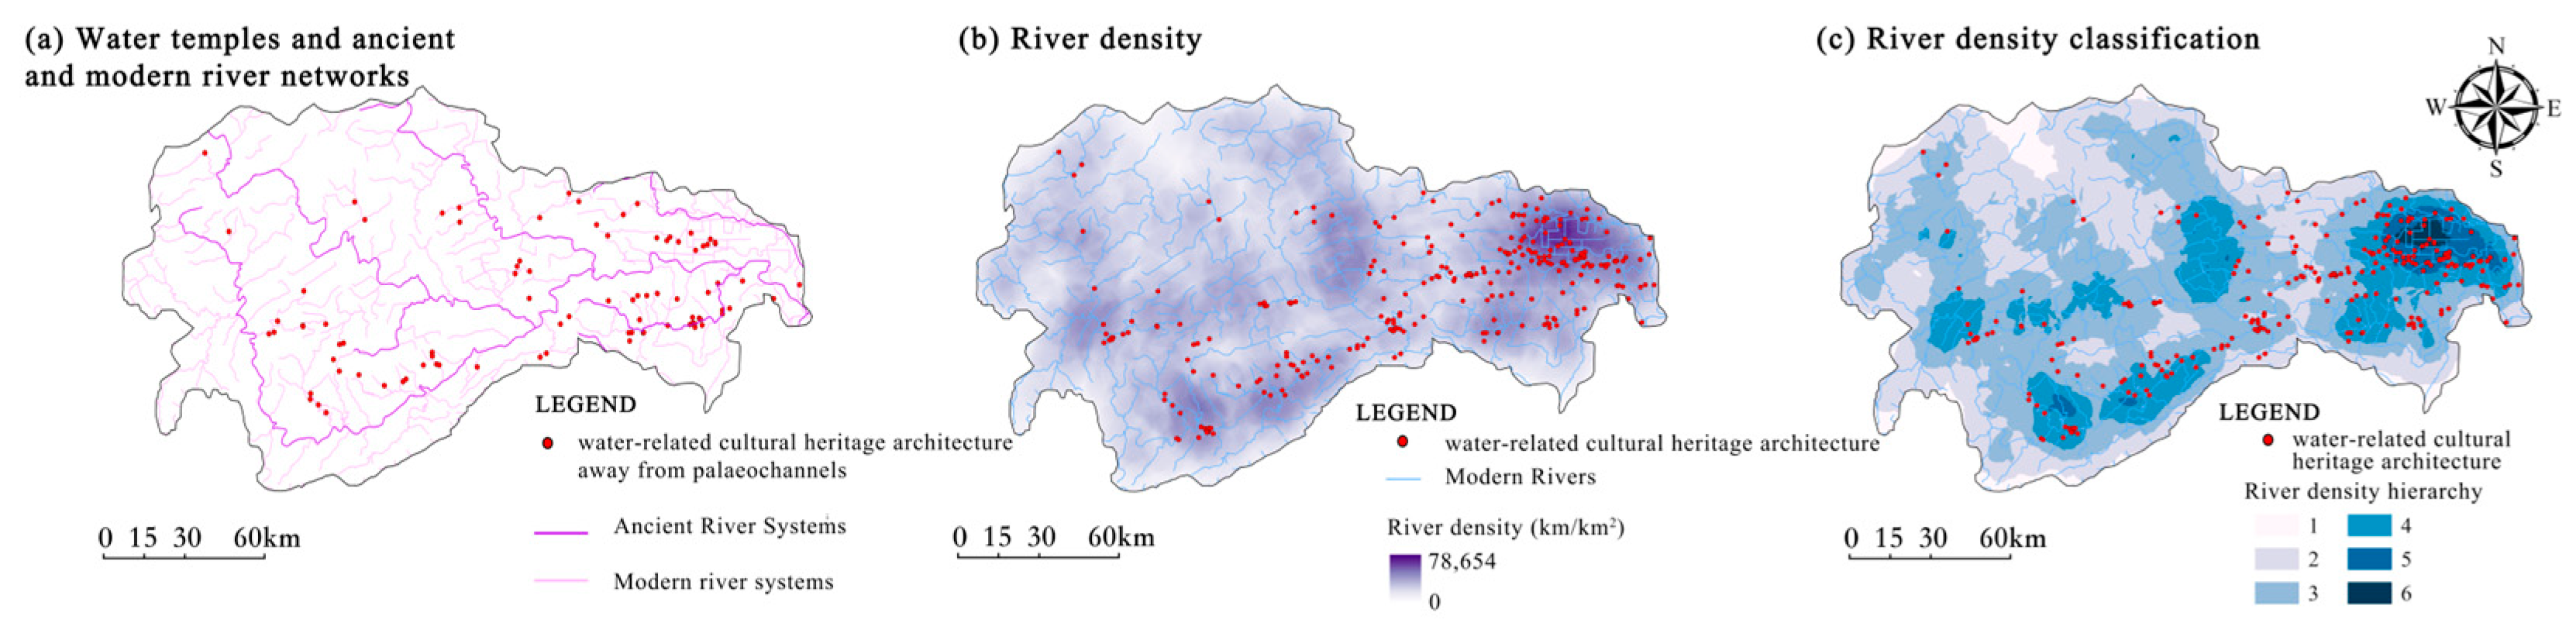
4.2.2. Relationships with River Network Systems and Distribution Patterns

During the Ming and Qing dynasties, there was no significant evidence of geological changes or corresponding changes in river channels in the Dongting Lake Basin and the Li River Basin [36,37]. The grid of the Li River network showed no strong variations. In this section, to further investigate the relationship between the WRCHA and rivers, the modern river networks and vector data of water systems from CHGIS in 1820 were overlaid with the coordinates of the water-related sites for analysis (see Figure 7).
The results reveal that these sites were mainly distributed in areas with a river density of levels 4–6, accounting for over 85%. This indicates that the denser the river network, the more heritage sites there were, demonstrating the significant characteristic of distribution along riversides. The correlation between the river network density and the distribution of this architecture was 0.63791, confirming that the river density was an important factor influencing its distribution. The data show that the average distance between the 295 water-related sites and the nearest river was 1.38 km, with over 92.3% of the sites located within 0.87 km of the river, while the remaining 13.7% of the sites were located over 6 km away from the river. This indicates a significant negative correlation between the number of sites and the distance from the nearest river, meaning the closer to the river, the more WRCHA sites are present.
The water-related cultural heritage sites in the Li River Basin were typically closer to the river than urban settlements and were located in areas with a relatively high river density, with the river network playing a crucial role in the distribution of the sites. Figure 8 shows an aerial photograph of the town of Hekou in Li County, downstream of the Li River, which is a crucial passage from upstream to Dongting Lake. Tangye Dam in the image is 2.63 km away from the present Li River channel, and the direction of the river bend is consistent. On its concave bank stands the Longchi Ancient Temple, built in 627 AD during the Tang dynasty. Combined with the historical description of the temple, it was built by people with the hope of controlling floods. Many villages around it are also named with “Dragon”, symbolizing this water deity in Chinese history. From this comprehensive assessment, it is inferred that this water body follows the ancient course of the Li River, thus validating the function of the WRCHA in marking the ancient riverbank lines.
The curve showing the average change in the distance from the heritage sites to rivers, according to the county (Figure 9), showed a negative correlation with the frequency of heritage sites within 3 km from the river. The distribution was relatively random in the 3–8 km range, and above 8 km, there was a positive correlation. Specifically, within 3 km of the ancient water system, especially in the case of Li County, the closer to the river, the more heritage sites there were. However, the curves for Anfu County, Sangzhi County, and Shimen County showed an upward trend in the 4–8 km range, indicating that there were more heritage sites farther from the river. At the same time, the examination of the distribution of the heritage sites far from the modern river network shows four possibilities, as follows: ① beyond 4–8 km from the ancient Li River main stream, there may be multiple extinct tributary river systems or palaeohydrological system data not recorded in CHGIS 1820 (such as the Dao River tributary of the Li River); ② the upstream urban area of Sangzhi County presented a narrow band distribution, showing a clear tendency for heritage sites to be located either near or far from the main Li River; ③ the trend in downstream Anfu County reflects that the water-related sites may have been severely affected by disasters such as floods, and these sites gradually moved away from the flood-prone areas of tributary rivers; ④ some water-related sites may have been located in nonwaterfront settlement cities or distant mountainous areas, built to ensure the safety of daily travel or the transportation of goods.

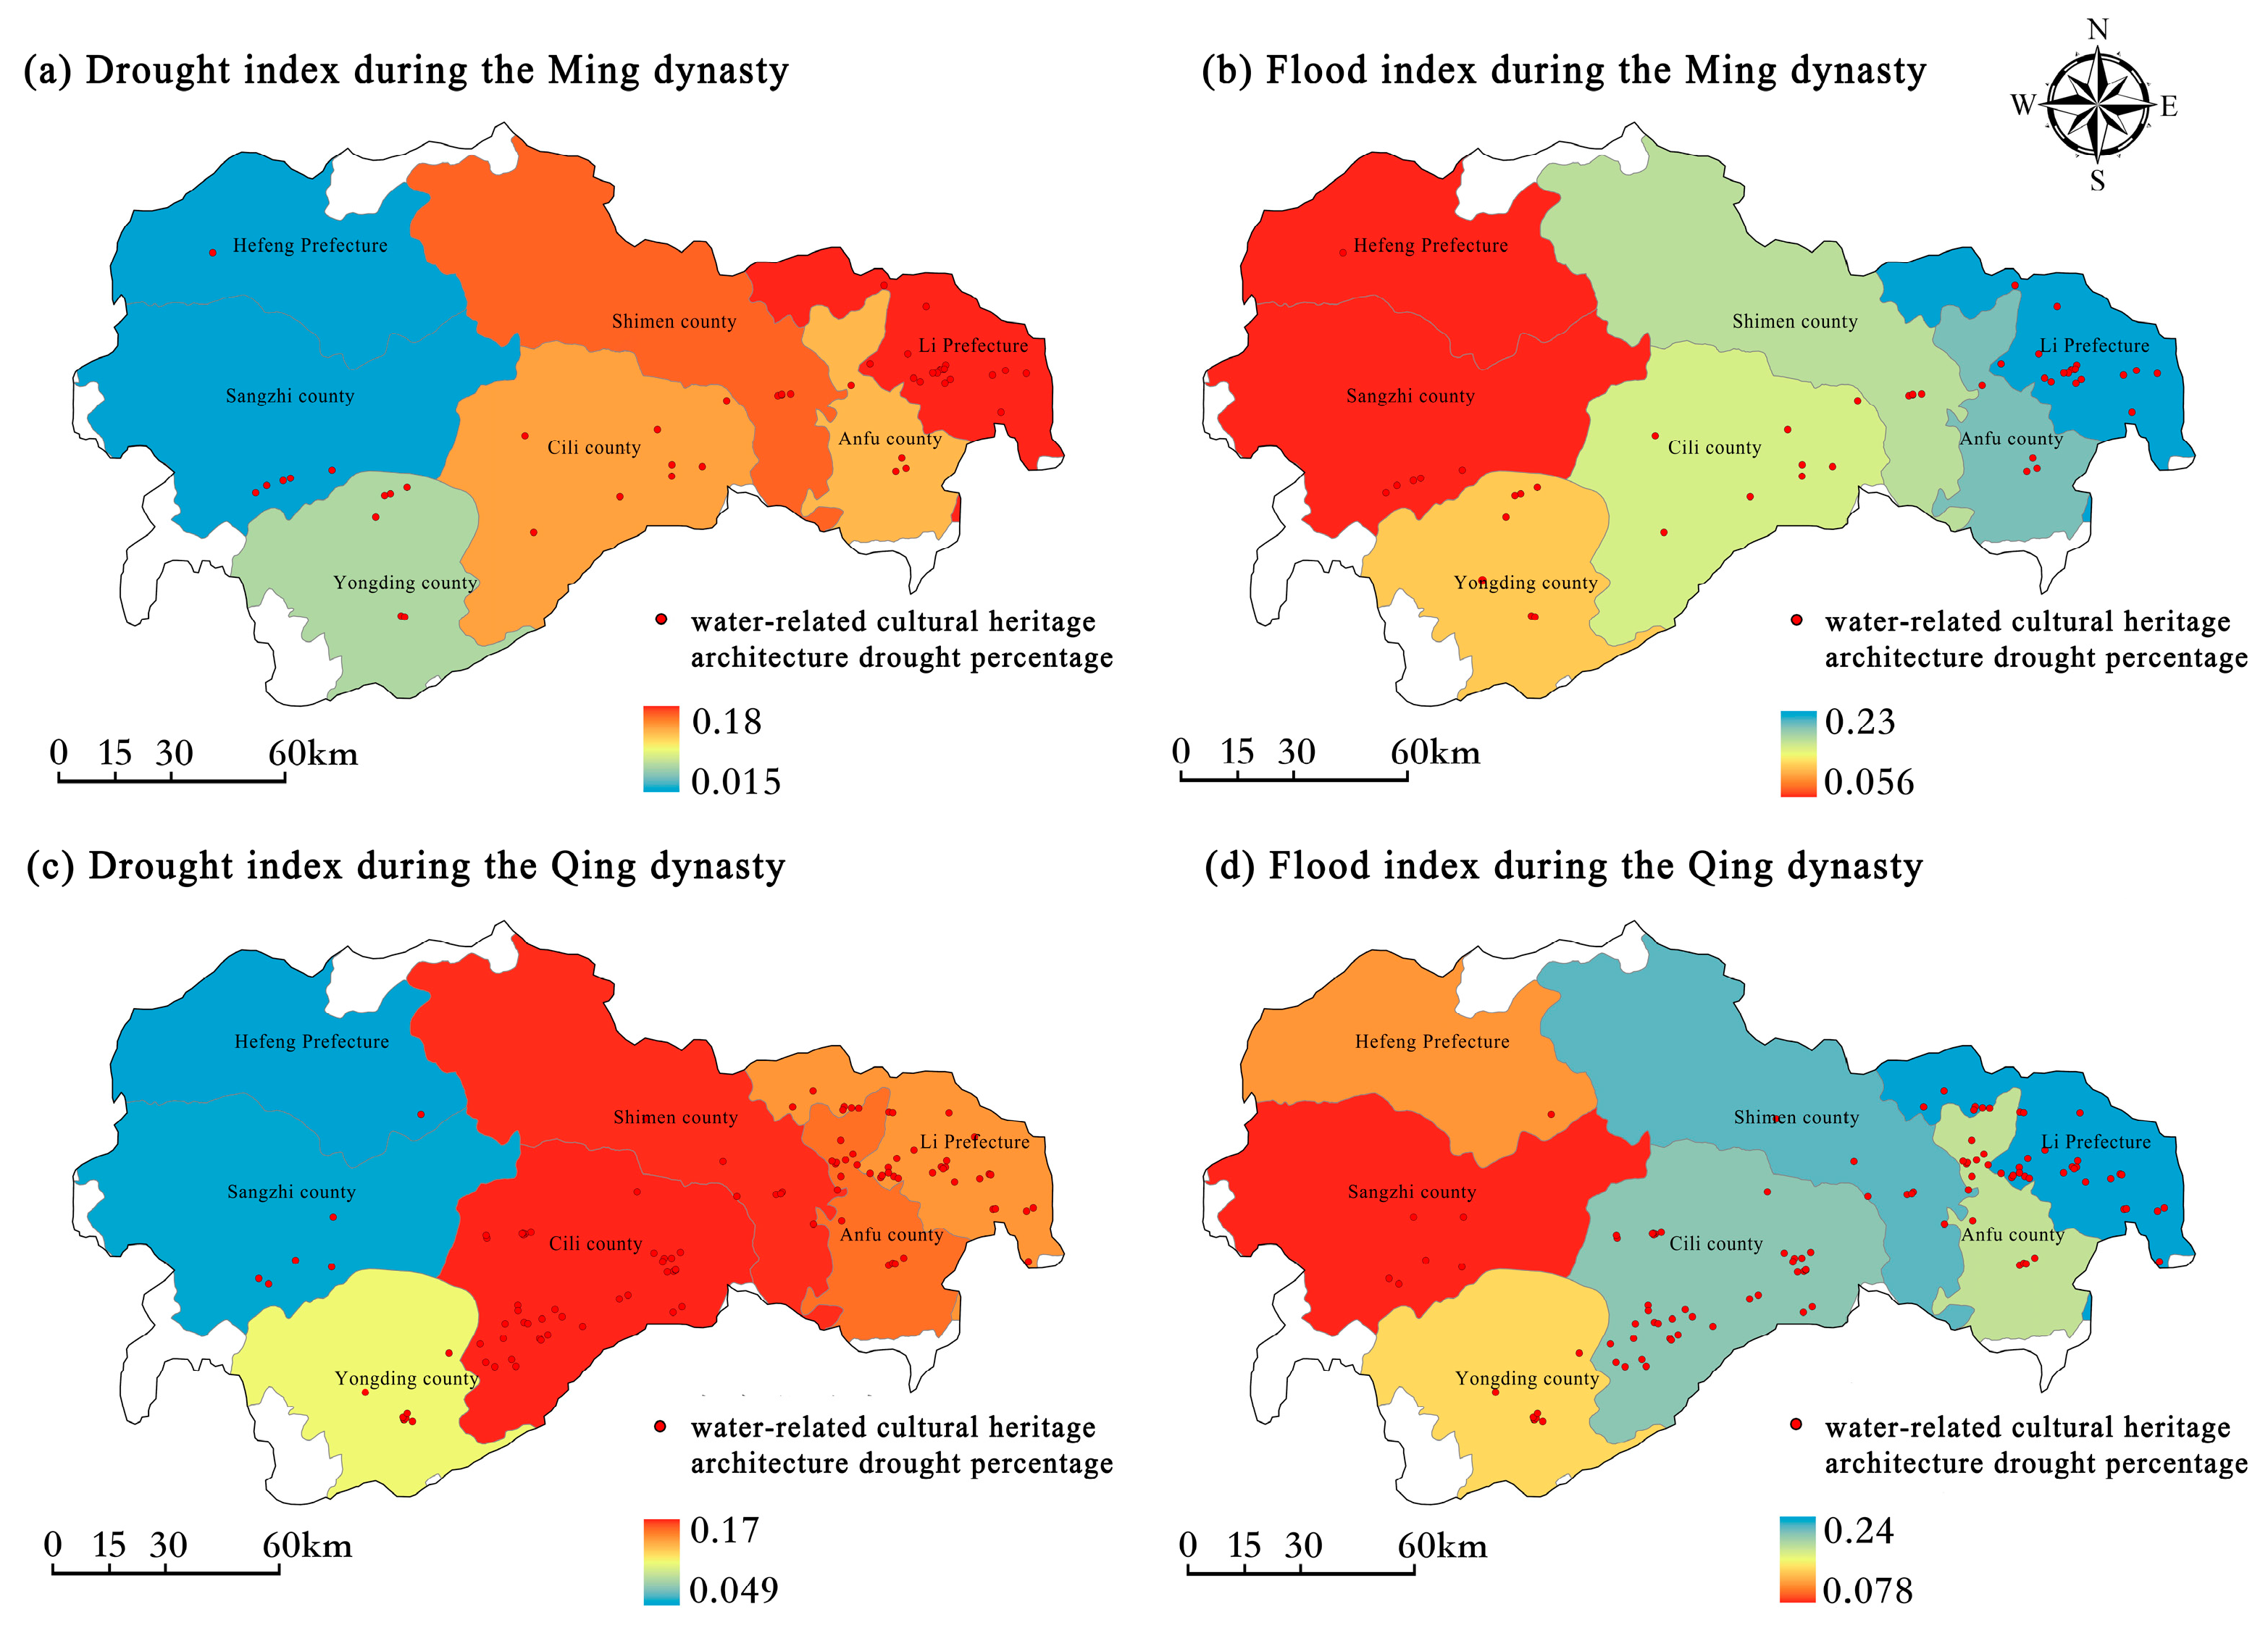
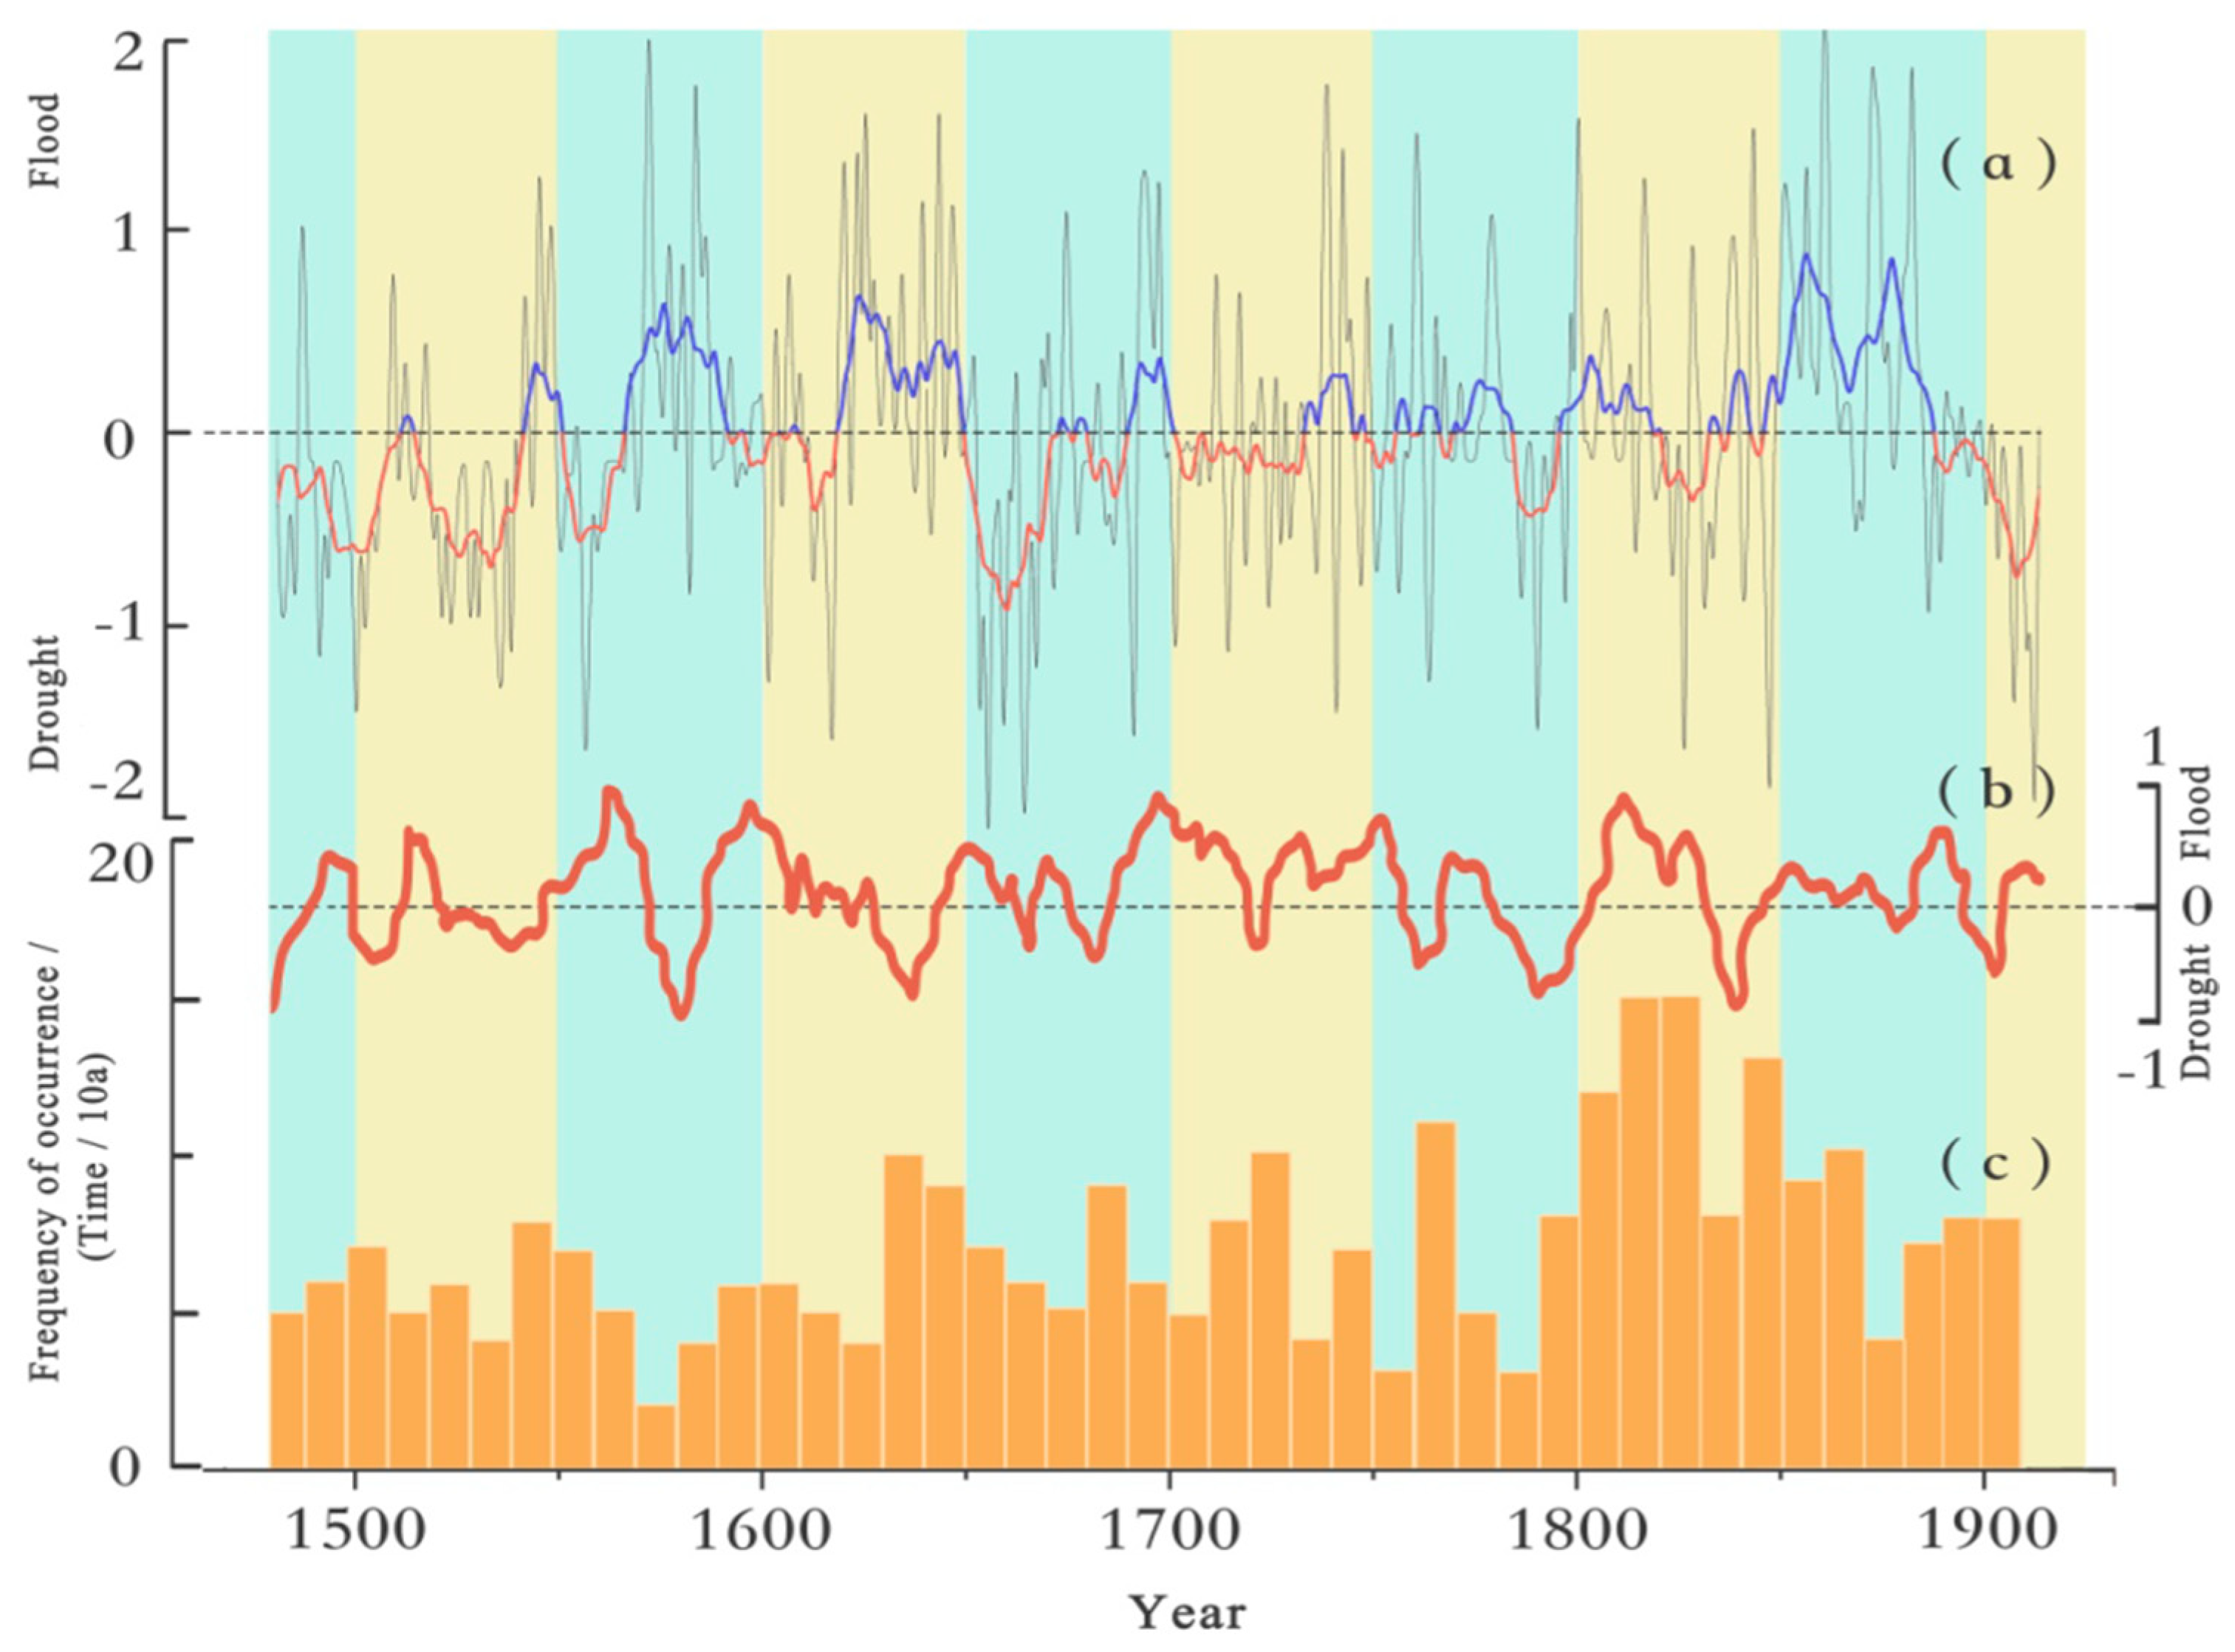
4.2.3. Analysis of the Variability in the Hydroclimatic Environment

In this study, the number and severity of drought–flood events recorded in each county of the Li River Basin from 1468 to 1911 were statistically analyzed. When the number of consecutive missing records was ≤3 years, we considered them years without drought–flood disasters and rated them as level 0. If the consecutive missing years exceeded 3 years, and there was no data interpolation, the years were considered dubious and not rated [38]. On the basis of this calculation, the Li River drought–flood index was derived. Subsequently, the relationship distribution map between the water-related sites and the drought–flood index during the Ming and Qing dynasties was overlaid to obtain Figure 10, as well as the sequence of the drought–flood levels (Figure 11a).
Hydro-climatic conditions constitute the most crucial aspect influencing the development of basin-type cities. It is only by clearly understanding the historical climate, river channel changes, and the causes, processes, and impacts of flood and drought disasters in the basin that scientifically effective strategies for ecoplanning involving human–water–city coexistence can be formulated. According to Figure 10, ① during the Ming period, in terms of the overall distribution pattern of drought–flood situations in the Li River Basin, higher elevations corresponded to lower drought–flood indices and fewer WRCHA sites. ② During the Ming and Qing periods, frequent droughts occurred in areas including Cili County, Shimen County, Linli County, and Lizhou, with drought indices far exceeding those of Dayong County, Sangzhi County, and Hefeng Prefecture. Flood disasters mainly occurred in the Lizhou area during the Ming and Qing periods. During the Qing period, Cili County and Shimen County experienced significantly more flood disasters than during the Ming period. ③ Correlation analysis conducted in conjunction with the kernel density results of the heritage sites yielded a correlation coefficient of 0.43056. Specifically, when the drought–flood index was −2 or 2, the distribution of heritage sites increased accordingly. When the drought–flood index was 0, the distribution of heritage sites was uniform. This further illustrates that during periods of frequent droughts and floods, humans engaged in more activities in response to environmental changes, such as constructing buildings or facilities for flood control and navigation during flooding periods and constructing structures to pray for good weather and agricultural abundance during drought periods. Even today, events like the dragon king procession and Bodhisattva ceremonies held in the Li River Basin remain important spiritual anchors and communication tools between people, local culture, and the natural environment.
Figure 10. Analysis of drought–flood indices superimposed on water culture architectural heritage in different time periods.
Land 13 00838 g010
The mean smoothed curve of the drought–flood sequence, as shown in Figure 11a, for the Li River Basin reflected periods of high flood indices during 1555–1575, 1610–1640, 1670–1680, 1725–1735, 1765–1770, 1785–1805, 1840–1875, and 1905–1911. Conversely, periods of high drought indices occurred during 1480–1495, 1510–1525, 1640–1660, and 1890–1900. The comparison between the water-related sites’ drought–flood curve of the Li River Basin and the drought–flood index of the Yangtze River Basin (Figure 11b) and the historical frequency sequence of floods in the middle reaches of the Yangtze River (Figure 11c) revealed a consistent overall pattern of variation. Additionally, comparisons were made with regional temperature curve sequences [39,40], which showed a generally corresponding relationship between cold and drought and warm and flood periods, except for the period of 1850–1880, in which the flood period of the Li River coincided with a cold period regionally, and the period of 1885–1911, in which the drought period of the Li River coincided with a relatively warm period regionally. In conclusion, considering the drought–flood curve of the Li River Basin as a water culture signal and overlaying it with the building of water-related sites and elevation data effectively confirmed the sites’ positive correlation with the water level of the corresponding river section in terms of elevation. Specifically, the elevation of the WRCHA was usually equal to or higher than the highest historical flood level during flood periods and lower during drought periods. Combining this with modern observed data of the siltation deposition in the Li River, which is approximately 8 cm/year, allows for the inference of the corresponding historical flood levels during different historical periods. Additionally, determining the time of collapse can reflect the minimum flood level and the corresponding flood period.
Figure 11. Comparison of drought–flood hydrological series: (a) Smoothed curves of riverine drought and flood class series from 1468 to 1911; (b) Drought–flood class sequence of the Yangtze River Basin over the past 400 years [41]; (c) Frequency of historical flood events in the middle reaches of the Yangtze River (times/10a) [42].
Land 13 00838 g011

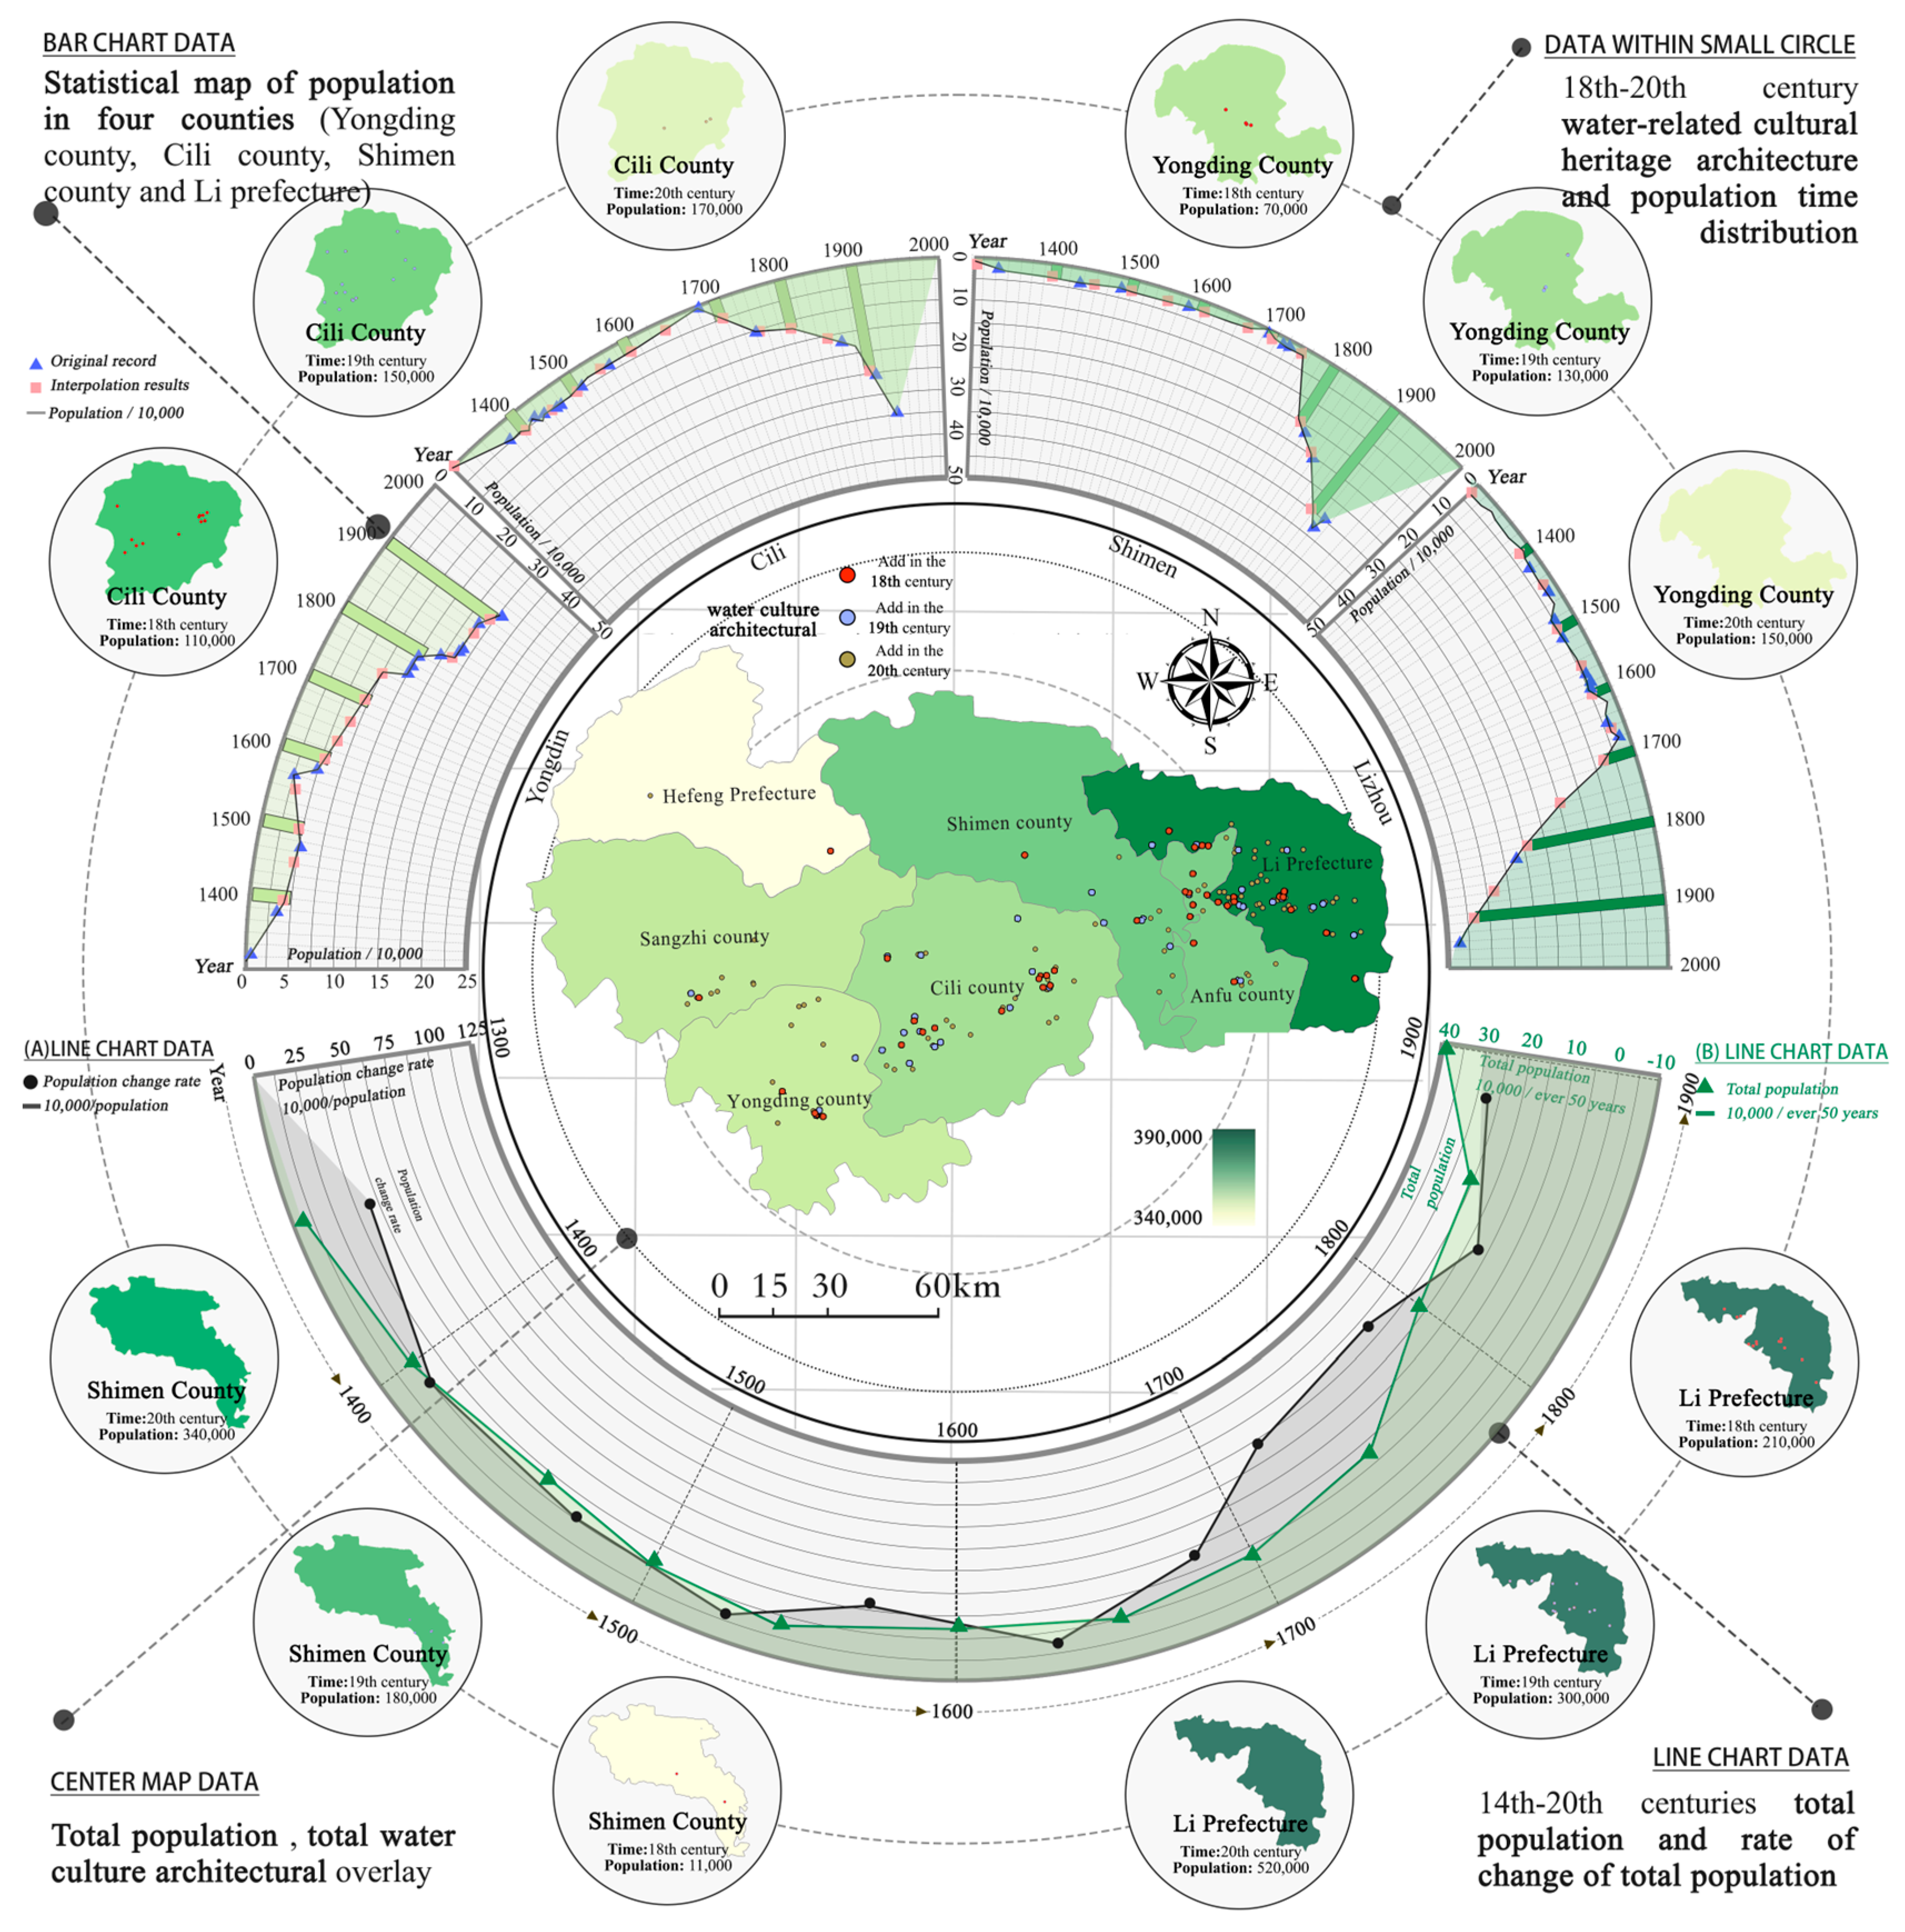
4.2.4. Analysis of the Documentation of WRCHA in Relation to Socioenvironmental Change

Ancient settlements and population are important underlying factors influencing the distribution of WRCHA. Correlation analysis between the distance from the administrative center (the seat of government) and the distribution of water-related sites yielded a correlation coefficient of −0.54195; hence, the greater the distance from the administrative center, the fewer the WRCHA sites. Typically, water-related sites were established around regional political, economic, and transportation trade centers. Some of the water-related sites located far from the administrative center may be situated in areas prone to navigational hazards along the upstream and downstream sections of the river. These sites serve as navigational aids and as flood control measures. For instance, in the areas of Ganbian Township and Yichongqiao Township, which lie at the midpoint between Cili and Dayong, the Li River receives various tributaries entering the mountain basin, and the river flows downstream into the gorge, where the water currents become rapid and turbulent. The narrow and swift-flowing river poses extreme dangers for transportation and shipping, particularly in the Sandao Bay area. It is only after passing through Yanbo Town that the river gradually exits the gorge and enters the plains of Cili. This stretch of the Li River was a vital waterway for ancient northwest Hunan, and people had to rely on water-related sites such as water temples for protection and guidance to avoid these dangers. On the other hand, although these areas are far from the administrative center, the northern bank comprises extensive northwest–southeast-oriented parallel combed hills and valleys, which possess relatively fertile land, water sources, and connecting revetments compared to surrounding areas. Consequently, these areas have a higher concentration of population and water-related sites.
The distribution characteristics of the water-related sites can also reflect the changes in the functional status of urban areas along the river. Specifically, a decrease or increase in the number of newly constructed water-related facilities near the administrative center of a city during a certain period may indicate the weakening or strengthening of its navigational grade, water transport distribution function, and other types of status. For example, interference and diversion from the convergence of the Yuan River, Dongting Lake floodway, and Jing River in the lower reaches of the Li River have led to continuous changes in the Li River floodway and shipping network entering Dongting Lake. When the Li River floodway could directly divert south to the Changde urban area, thereby opening up the waterway between Li County and Changde, the number of water-related facilities along the route increased. Meanwhile, as the power of the Li River weakened in the Song–Li floodway, the extensive polder between the tailgate of the Li River and Dongting Lake was also affected by the flood discharge of the Yangtze River, leading to corresponding gradual changes in the pattern of water-related sites such as embankment and temples, as well as urban development patterns.
Furthermore, the significant changes in the quantity of WRCHA within specific geographical spaces are also caused by the comprehensive impact of social and demographic changes [34]. Population is a direct factor influencing the scale of cities and the level of development of water-related facilities. Converting population units such as “households”, “population”, and “adult males” from the Ming and Qing dynasty records into modern units and dividing them into three time frames of the 18th, 19th, and 20th centuries for overlay analysis with the distribution of the WRCHA in the basin, as shown in Figure 11a, reveal that the closer proximity to the downstream areas corresponded to a higher total population and more heritage sites. The most concentrated areas were in the economically developed region of Li County, followed by Cili County, Anfu County, and Shimen County, with the lowest population growth in Hefeng Prefecture. The correlation between the average population distribution in each county and the WRCHA core density results was 0.41015, indicating a significant facilitating role of the population distribution in the construction of water-related sites in the region during the same period.
The implementation of policies, such as immigration and cultivation, the exemption of additional taxes for population growth, and land allocation per capita in the Huguang region during the 18th and 19th centuries facilitated a significant increase in the number of migrants from other provinces, as well as in the local birth rate in the Dongting Lake Basin [33]. Consequently, the WRCHA in the Li River Basin gradually expanded and developed upstream. However, entering the 20th century, political upheavals and wars had a widespread negative impact on population migration, folk beliefs, and shipping conditions, leading to a sharp decrease in the construction of water-related facilities.
To refine the relationship between population and WRCHA and observe the representation of social change, population data for four counties in the Li River Basin, namely, Dayong, Cili, Shimen, and Lizhou, from 1400 to 1900 were collected and supplemented by interpolation, resulting in population change line graphs for each county (Figure 12).
Further quantitative analysis and linear fitting calculations were performed on the data using MATLAB (Figure 13). It was found that the trend of an increase in the population during the Ming and Qing dynasties was generally consistent with the trend in the number of newly built water-related structures. However, there was an anomalous relationship observed between 1724 and 1730, where there was a significant decrease in the number of newly built water-related structures despite an increase in the population.
The historical records indicate the following during this period: ① the early Qing dynasty witnessed a peak in immigration to the west bank of Dongting Lake from Jiangxi Province, resulting in significant population growth; ② according to ancient texts, such as the “Zhili Lizhou Chronicles—School Note”, “Shimen County Water Conservancy Chronicle”, “Cili County Chronicle”, and other ancient records, the Li River Basin in these four states and counties experienced “extreme water, starvation, and road and dike collapse, with much of the area flooded”, as well as other extreme drought–flood events over the six years. This indicates extremely unfavorable conditions for the construction of water-related structures during this period. After this time, there was an urgent need to ask the water gods to play a role in rainfall regulation and flood control, leading to a rapid increase in the number of newly built water-related structures, reaching a peak value. In conclusion, each anomalous relationship and difference value can be considered as a historical flood disaster of varying degrees. By increasing the resolution of the time and population records of water-related cultural heritage sites, it is possible to reconstruct the frequency and severity of historical flood disasters. Including these anomalous points in the correlation analysis yielded a correlation coefficient of 0.71, while excluding them yielded a correlation coefficient of 0.84. The linear fitting curve adequately demonstrated a strong positive correlation between the increase in the population and the number of newly water-related cultural architecture sites.

4.2.5. Analysis of the Significance of Influencing Factors

The random forest modelconsisted of 100 random trees, each with five leaf nodes and a depth of five. It used 80% of the data for training and 20% for validation, with 10% of the total dataset excluded for testing. Each tree randomly selected four features for training. The final model had an R2 value of 0.9 and an RMSE of 0.01, indicating a good fit (Figure 14). Table 2 shows the factors’ importance.
This study comprehensively analyzed the influence of various factors on the distribution of WRCHA using a combination of Pearson correlation and random forest models. In the random forest model, the DEM (digital elevation model) exhibited the highest importance, followed by the river network density and the distance to administrative centers; the other factors had relatively weaker impacts. In the correlation analysis, the population change showed the highest correlation coefficient, reaching 0.71, followed by the river network density at 0.63791, the distance to administrative centers at −0.54195, the water culture index at 0.43056, and the population distribution at 0.41015, all indicating strong or close correlations. Integrating the two analyses, the elevation, population, river network, administrative distribution, and water culture index emerged as the most significant variables influencing the distribution of the water-related sites. This suggests that the spatiotemporal distribution of heritage sites is jointly influenced by historical human and natural factors, which are closely interrelated and interactive [43].

5. Conclusions

This study qualitatively and quantitatively analyzed the spatiotemporal distribution characteristics of WRCHA in the Li River Basin and its interaction with relevant influencing factors. Furthermore, this study delved into the interactive effects between the social–human environment and the water-related environment in the Li River Basin, demonstrating the systematic dating and validation values of water-related sites in dual human–nature environments. Specifically, the main research results include the following two aspects:
(1)
Spatial and Temporal Distribution Patterns of the WRCHA in the Li River Basin
In the Li River Basin, the distribution of the WRCHA exhibits high stability and local continuity, with the following characteristics: (1) The spatial distribution is uneven, with strong aggregation observed in the Lixiang Plain on the north bank of the lower reaches of the Li River. The upper and middle reaches of the river are distributed in “bead-like clusters along the main streams and tributaries, centered on the town halls”, but the area covered is limited. The lower part of the river is a “central radial nuclear density zone”, and there is “a band along the main tributaries of the river”. (2) It displays distinct characteristics of aggregation, proximity to water bodies, low elevation, gentle terrain, and minimal topographical fluctuations. (3) From the Tang dynasty to the Qing dynasty, the water-related sites centered around the Lixiang Plain and gradually spread along the Li River and its tributaries to the middle and upper reaches, including Shimen County, Cili County, and Gangyan Township. However, the growth rates and aggregation areas varied in different periods, indicating significant spatiotemporal heterogeneity.
(2)
Spatial and temporal distributions of the WRCHA and the factors affecting them
The clustering pattern of the water-related sites’ distribution was jointly influenced by various factors. In the complex temporal and spatial contexts, the explanatory power of each factor was not an absolutely quantifiable relationship. Natural factors primarily had a direct impact on the spatial distribution of the sites, while the human factors enhanced the explanatory power in terms of the construction period. This study comprehensively examined the influencing factors of the water-related sites’ distribution through Pearson correlation analysis and random forest modeling. In the correlation analysis, the population change had the highest correlation coefficient, reaching 0.71, followed by the river network at 0.63791, the distance from ancient government sites at −0.54195, drought–flood indices at 0.43056, and the population distribution at 0.41015, all showing strong and close relationships, consistent with the overall importance ranking from the random forest model. It is concluded that the elevation, population, river network, distance from ancient government sites, and drought–flood indices are the most important variables affecting the spatiotemporal pattern of the WRCHA, indicating that it is jointly influenced by historical human and natural factors and their mutual interactions [43].
However, modern vector data, such as precipitation, temperature, roads, and GDP, were not used to create a more historically comprehensive model study. On the basis of this study, the following could be further explored: (1) Enhancement of the archaeological research—strengthening the investigation of the spatial distribution points, as well as the collapse and reconstruction times of water-related sites can further improve the resolution of ancient environmental changes. This can establish a new paradigm for dating, with advantages such as a low cost, wide scope, strong empirical evidence, and high resolution compared to methods like relative sedimentation and optically stimulated luminescence [44]. (2) Value of human proxies—quantifying the specific magnitude of urbanization in each county of the basin through the segmented fitting of local population changes and tax records’ nonlinear relationships can help refine the historical events of a watershed’s environmental and social changes.
The current excavation and examination of WRCHA are significantly undervalued and under-researched. Each watershed has its own unique water deities, WRCHA, and corresponding cultural heritage. Examples include Yangsi and Dongting Wangye as the water deities of Dongting Lake in China; Xiangfei as the goddess of the Xiao River and Xiang River; the Goddess Sulis in the city of Bath, England; Dewi Danu as the coastal water deity in Bali; and Isis as the deity of the Nile River. These deities have corresponding heritage sites in their respective watersheds. Following the approach of this study, comprehensively collating information on WRCHA from other watersheds and establishing a spatiotemporal database of this architecture would facilitate the advancement of its conservation and development efforts. It would also effectively promote research on reconstructing the historical changes in the watershed’s hydroenvironmental and socioenvironmental conditions. This, in turn, would provide a scientific basis for clarifying the symbiotic relationship between humans and water in watersheds, as well as future water heritage conservation and related urban and ecological planning. Furthermore, it would contribute to the development of bidirectional coupling models of ecological water culture and socioeconomics, as well as to future climate change predictions by providing positive feedback modules and contributions.

Author Contributions

Conceptualization and methodology, Q.D., Y.G. and Q.W.; software, Y.W. and Y.H.; validation, Y.G. and Q.W.; formal analysis, Q.D. and T.C.; investigation and data curation, Q.D. and Y.W.; resources, Q.D. and Y.Y.; writing—original draft preparation, Q.D.; writing—review and editing, Y.G. and Q.W.; visualization, Y.W. and Y.H.; supervision, Y.G. and Q.W.; project administration, Q.D. All authors have read and agreed to the published version of the manuscript.

Funding

This research was funded by the National Social Science Foundation of China’s Arts Programme “Research on the Value Interpretation and Synergy Path of Rural Planning in Cultural Landscape Heritage Areas” and Wuhan Research Institute’s open project “Research on Heritage Value Identification of Historic Cultural Neighbourhoods in Wuhan Based on Historic Urban Landscape (HUL)” (grant numbers: “21BH1607” and “IWH20212032”) and Chinese Historical and Cultural Neighbourhoods” (grant numbers: “21BH1607” and “IWH20212032”).

Data Availability Statement

The original contributions presented in the study are included in the article, further inquiries can be directed to the corresponding authors.

Acknowledgments

This paper honors academic ethics and is free from academic misconduct. The authors would like to express their gratitude to all those who shared their helped, such as Zhao Bing, Qi Shihua, Gu Yansheng, Wang Qi, Yu Zhiguang, and Du Longjiang, as well as the help of Gao Shouquan, Tang Mingzhe, Dai Chuzhou, Wan Nianyue, Wang Liangquan, Yu Yadong, Yue Pengyu, and Sun Wenhui, for their help with the research and study tours.

Conflicts of Interest

The authors declare no conflicts of interest.

References

  1. Fanen, K.; Hailong, L.I.U. Value characteristics and cognitive development of “water cultural heritage”. Landsc. Archit. 2022, 29, 59–64. [Google Scholar] [CrossRef]
  2. Dai, T.; Hein, C. Exploring the descriptions of World Heritage properties through the perspective of water using a narrative approach. Int. J. Herit. Stud. 2023, 29, 1315–1338. [Google Scholar] [CrossRef]
  3. Gu, Y.S.; Li, K.J.; Qin, Y.M.; Qi, S.H.; Ge, J.W.; Li, W. Human activities and the ecological environment evolution of Jianghan Lake Group during historical periods. Earth Sci. 2013, 38, 133–144. [Google Scholar]
  4. Suganya, K.; Harshavardhan, M.; Rajani, M.B. Hydrological maps as a tool for the exploration of historical water systems at Badami, Karnataka, India. Water Hist. 2022, 14, 309–333. [Google Scholar] [CrossRef]
  5. Brokerhof, A.W.; van Leijen, R.; Gersonius, B. Protecting Built Heritage against Flood: Mapping Value Density on Flood Hazard Maps. Water 2023, 15, 2950. [Google Scholar] [CrossRef]
  6. Kawanabe, H. Cultural associations in an ancient lake: Gods of water in Lake Biwa and the River Yodo basin, Japan. Hydrobiologia 2003, 500, 213–216. [Google Scholar] [CrossRef]
  7. Wang, W.; Wang, L. The influence of witchcraft culture on ancient Chinese water relations-a case study of the Yellow River Basin. Eur. J. Remote Sens. 2020, 53 (Suppl. S1), 93–103. [Google Scholar] [CrossRef]
  8. Appiotti, F.; Assumma, V.; Bottero, M.; Campostrini, P.; Datola, G.; Lombardi, P.; Rinaldi, E. Definition of a risk assessment model within a European interoperable database platform (EID) for cultural heritage. J. Cult. Herit. 2020, 46, 268–277. [Google Scholar] [CrossRef]
  9. Wang, Y.W.; Pendlebury, J.; Nolf, C. The water heritage of China: The polders of Tai Lake Basin as continuing landscape. Plan. Perspect. 2023, 38, 949–974. [Google Scholar] [CrossRef]
  10. Pearson, N.; Thompson, B.S. Saving two fish with one wreck: Maximizing synergies in marine biodiversity conservation and underwater cultural heritage protection. Mar. Policy 2023, 152, 105613. [Google Scholar] [CrossRef]
  11. Geraldi, A.M. Natural and cultural heritage of lagoon water bodies. The origin of tourism in Carhué, Buenos Aires, Argentina. PASOS Rev. Tur. Patrim. Cult. 2023, 21, 177–193. [Google Scholar] [CrossRef]
  12. Du, L.; Peng, X.; Zhao, Y.; Lyu, J.; Pan, M. From nature-based to engineering-based: The interaction process and turning point of the city-water system relationship in the North China plain. Appl. Geogr. 2021, 135, 102556. [Google Scholar] [CrossRef]
  13. Hu, D.; Yao, B.; Sun, S.; Xu, H. Spatiotemporal distribution characteristics of precipitation in the Li River Basin. J. Hunan Agric. Univ. 2011, 37, 558–561. [Google Scholar]
  14. Ge, Q.; Zheng, J.; Tian, Y.; Wu, W.; Fang, X.; Wang, W.-C. Coherence of climatic reconstruction from historical documents in China by different studies. Int. J. Climatol. 2008, 28, 1007–1024. [Google Scholar] [CrossRef]
  15. Hunan Provincial Water Conservancy Journal Compilation Office. Hunan Water Conservancy Construction; Hunan Provincial Water and Electricity Office: Changsha, China, 1990. [Google Scholar]
  16. Shu, T. Dongting Lake Journal; YueLu Press: Changsha, China, 2003. [Google Scholar]
  17. Xianlie, Y.; Kaili, C. Jiaqing Changde Prefectural Records; YueLu Press: Changsha, China, 2008. [Google Scholar]
  18. Sangzhi County Local History Editorial Committee. Sangzhi County Record; Hubei People’s Publishing House: Wuhan, China, 1990. [Google Scholar]
  19. Editorial Committee of Dayong County Local History. Dayong County Record; SanLian Publishing House: Shanghai, China, 1995. [Google Scholar]
  20. Cili County Compilation Committee. Cili County Record; Agricultural Publisher: Pyrmont, NSW, Australia, 1990. [Google Scholar]
  21. ShiMen County Water Resources and Water Conservancy Bureau. Shimen County Water Conservancy Journal; China Literature and History Press: Beijing, China, 1993. [Google Scholar]
  22. Yufen, H.; Shi, W. TongZhi Govern Directly Li Province Local Records; YueLu Press: ChangSha, China, 2010. [Google Scholar]
  23. Shouquan, G. A Commentary on the “Li Ji”; Famous Publishing House: London, UK, 2010. [Google Scholar]
  24. Jin City Records Compilation Committee. Jin County Record; Educational Science Publishing House: Shanghai, China, 1993. [Google Scholar]
  25. Linli County Historical Records Editorial Committee. Linli County History; China Social Press: Beijing, China, 1992. [Google Scholar]
  26. Wen, K.G. Dictionary of Meteorological Disasters in China. Hunan Volume; Meteorological Press: Beijing, China, 2006. [Google Scholar]
  27. Institute of Meteorology, Central Meteorological Administration. Atlas of the Distribution of Droughts and Floods in China in the Last 500 Years; Map Press: Baltimore, MD, USA, 1981. [Google Scholar]
  28. Hunan Institute of History and Archaeology. Chronology of Natural Disasters in Hunan; Hunan People’s Publishing House: Changsha, China, 1961. [Google Scholar]
  29. Li, X. Daming Yitongzhi; Sanqin Publishing House: Xi’an, China, 1990. [Google Scholar]
  30. Xue, G.; Wu, T. Jiajing Huguang Tujing Zhi Shu; Bibliographic Literature Press: New Haven, CT, USA, 1991. [Google Scholar]
  31. Xue, G. Hunan and Guangdong General Records; Jiangsu Guangling Ancient Books Engraving and Printing Society: New Haven, CT, USA, 1991. [Google Scholar]
  32. Xu, X. Spatial Distribution of GDP in China km Grid Dataset. Data Registration and Publishing System of the Center for Resource and Environmental Science and Data, Chinese Academy of Sciences. 2017. Available online: https://www.resdc.cn/DOI/doi.aspx?DOIid=33 (accessed on 1 June 2022).
  33. Li, Y. A Brief History of the Evolution, Development and Governance of Dongting Lake; Hunan Province Dongting Lake Regional Economic and Social Development Research Association: Changsha, China, 2014; p. 67. [Google Scholar]
  34. Ge, Q.S.; Wang, W.Q. Population pressure, climate change and the Taiping Rebellion. Geogr. Res. 1995, 14, 32–41. [Google Scholar]
  35. Xue, W. Spss Statistical Analysis Method and Application; Electronic Industry Press: Beijing, China, 2009; p. 484. [Google Scholar]
  36. Renquan, Z.; Xing, L.; Lianfa, S.; Menggui, J.; Zhenhua, L.; Guoliang, Z.; Jiangao, P.; Mingfu, W.; Wenzhong, D. The contribution of tectonic subsidence to the evolution of the Dongting Lake area in modern times—Answer to Mr. Li Chunchu’s question on the “Analysis of the Geological Environment System of Dongting Lake”. In Ocean Lake; CRC Press: Boca Raton, FL, USA, 2001; pp. 690–696. [Google Scholar]
  37. Yang, G.; Chen, Z.; Jiang, J. Drainage morphometry of the Lishui catchment in the middle Yangtze basin, China: Morphologic and tectonic implications. Arab. J. Geosci. 2020, 13, 561. [Google Scholar] [CrossRef]
  38. Zhang, J. Reconstruction and characteristic diagnosis of drought and flood sequence in the middle reaches of the Yellow River from 1644 to 2009. Geogr. Res. 2013, 32, 1579–1590. [Google Scholar]
  39. Wang, S.; Ye, J.; Gong, D. Climate of the Little Ice Age in China. Quat. Res. 1998, 54–64. [Google Scholar]
  40. Yang, B.; Braeuning, A.; Johnson, K.R.; Yafeng, S. General characteristics of temperature variation in China during the last two millennia. Geophys. Res. Lett. 2002, 29, 38-1–38-4. [Google Scholar] [CrossRef]
  41. Jiang, T.; Zhang, Q.; Wang, S. Relationship between droughts and floods and climate change in the middle and lower reaches of the Yangtze River in the past 1000 years. Quat. Res. 2004, 518–524. [Google Scholar]
  42. Li, Y.; Zhou, L.; Yu, S.; Zhang, D.; Wang, P. Research on spatiotemporal changes in historical flood events in the Yangtze River main stream in the past two thousand years. Earth Environ. 2022, 50, 241–251. [Google Scholar] [CrossRef]
  43. Zhang, C. Research on the Interaction between Natural Disasters and the Social Economy of the Jianghuai Region during the Ming and Qing Dynasties. Ph.D. Thesis, Xiamen University, Xiamen, China, 2004. [Google Scholar]
  44. Yu, G.; Hu, S.; Li, C. Discussion on the occurrence years and water level elevation of historical extreme floods in Taihu Lake. Quat. Res. 2013, 33, 167–178. [Google Scholar]
Figure 1. Li River Basin location and water system map. Note that the national map is based on the map from the Ministry of Natural Resources of China (Revision No. GS (2023)2764).
Land 13 00838 g001
Figure 2. Spatial distribution of the 295 highlighted water culture architectural heritage buildings and some research photos.
Land 13 00838 g002
Figure 3. Characteristics of the nuclear density distribution of water culture architectural heritage in the Li River Basin.
Land 13 00838 g003
Figure 4. Spatial and temporal distributions of water culture architectural heritage in superimposed elevations.
Land 13 00838 g004
Figure 5. Kernel density analysis and distribution statistics of water culture architectural heritage at different elevations.
Land 13 00838 g005
Figure 6. Analysis of the superposition of the slope and orientation of water culture architectural heritage buildings.
Land 13 00838 g006
Figure 7. Overlay analysis of water culture architectural heritage and river network.
Land 13 00838 g007
Figure 8. Spatial relationship between Niuyue Lake, Longchi Temple, and the river.
Land 13 00838 g008
Figure 9. Distance index of water culture architectural heritage from the river.
Land 13 00838 g009
Figure 12. Analysis of the relationship between water culture architectural heritage and the spatial and temporal scattered line graphs of population change.
Land 13 00838 g012
Figure 13. Mean curve fit between the population increase and the number of new water-related structures in the four counties of the river basin.
Land 13 00838 g013
Figure 14. Random forest model.
Land 13 00838 g014
Table 1. Data description and summary of sources.
Data NameDescription of Data ContentData Sources
Ming and Qing populationsAverage population data for the river subcounties in the 18th–20th centuriesAncient texts and modern summary materials, as well as historical records from various counties in the Li River Basin during the Ming and Qing dynasties; interpolation and supplementation [15,16,17,18,19,20,21,22,23,24,25,26,27,28,29,30,31]
Drought–flood levelsSequence of drought–flood levels in the river, 1468–1911
Information on WRCHA dataHistorical spatial location, time of construction and collapse, elevation, latitude and longitude, and rasterizationCounty records, ancient books, ancient maps, archaeology, and research interviews [15,16,17,18,19,20,21,22,23,24,25,26,27,28,29,30,31]
Li River Basin base mapLi River Basin water system and water conservancy engineering mapHunan Li River Basin Water Conservancy and Water Conservancy Development Limited Liability Company
Modern river networkIncludes multilevel water systems within the Li River BasinGeographic Data Sharing Platform, School of Urban Environmental Studies, PKU
Ancient prefectures, governorships, and water systemsRiver channel data for the main stream of the river and its first-order tributaries in 1820 (projection of supplementary channel water)China Historical Geographic Information System (CHGIS); ArcGIS 10.8 extraction calculations
Distance from the riverEuclidean metric between the WRCHA and the main tributaries of the riverCAS Resource and Environmental Science Data Registration and Publication System [32]; ArcGIS 10.8 extraction
Distance from the ancient seatEuclidean metric between the WRCHA and ancient county administrative centers
Altitude30 m elevation data for Li River Basin
Slope direction, gradientFine-tuning the slope modulus to classify 0–40° slope data into five categories slope direction was classified into positive (135–315°) and negative (0–135° and 315–360°) slopes
Table 2. Random forest factors’ significance.
VariableImportance
Population0.030908
DEM0.178720
Slope direction0.000020
Distance from river0.026117
Gradient0.000415
Distance to ancient government site0.159007
River densityAncient River0.069077
Modern River0.172525
Disclaimer/Publisher’s Note: The statements, opinions and data contained in all publications are solely those of the individual author(s) and contributor(s) and not of MDPI and/or the editor(s). MDPI and/or the editor(s) disclaim responsibility for any injury to people or property resulting from any ideas, methods, instructions or products referred to in the content.

