Article

Study of the Decoupling Patterns between Agricultural Development and Agricultural Carbon Emissions in Beijing Tianjin Hebei Region from 2000 to 2020

1
Institute of Plant Nutrition, Resources and Environment, Beijing Academy of Agriculture and Forestry Sciences, Beijing 100097, China
2
Information Technology Research Center, Beijing Academy of Agriculture and Forestry Sciences, Beijing 100097, China
3
National Engineering Research Center for Information Technology in Agriculture, Beijing 100097, China
*
Author to whom correspondence should be addressed.
Land 2024, 13(6), 839; https://doi.org/10.3390/land13060839
Submission received: 18 April 2024 / Revised: 30 May 2024 / Accepted: 6 June 2024 / Published: 12 June 2024
(This article belongs to the Section Land, Biodiversity, and Human Wellbeing)

Abstract

:
The coordination and balance between agricultural development (AD) and agricultural carbon emissions (ACE) is one of the most important ways to boost the high-quality development of agriculture in the Beijing-Tianjin-Hebei region. Taking 13 prefecture-level cities in the Beijing-Tianjin-Hebei region as the research object, this study uses the comprehensive evaluation method and Tapio decoupling model to analyze the decoupling effect between the AD level and the Agricultural Carbon emissions intensity (ACEI) from 2000 to 2020, based on the assessment of AD status and the calculation of Agricultural Carbon emissions quantities (ACEQ) and ACEI. It found that: (1) From 2000 to 2020, the AD in the Beijing-Tianjin-Hebei region generally showcased a gradual increase trend, and demonstrated a basic feature that AD in the northern areas was higher than that in the southern ones. (2) From 2000 to 2020, the ACEQ in the Beijing-Tianjin-Hebei region showed a trend of first increasing and then decreasing, with a spatial distribution feature that the ACEQ in the southern cities was higher than that in the northern ones. Regarding the source of ACE, the livestock and poultry farming took the highest proportion. ACEI was decreasing year by year, higher in the southern areas than in the northern ones. (3) The main types of decoupling in the Beijing-Tianjin-Hebei region were strong decoupling, recession decoupling, strong negative decoupling, weak negative decoupling, recession coupling, and expansion negative coupling. The decoupling relationship between AD and ACEI were in dynamic change, but the change trend of the decoupling relationship was optimistic. The results of this study deliver certain deployable practice value for improving the sustainability of regional agricultural green development and ecological environmental protection.

1. Introduction

The global challenges of climate change, including events such as droughts, floods, extreme weather conditions, and the spread of diseases caused by greenhouse gas emissions, have had significant impacts on both human society and production systems. As a result, finding effective ways to reduce carbon emissions and enhance the efficiency of carbon emissions has emerged as a prominent international concern and a crucial area of research [1,2]. According to IPCC’s research reports, agricultural production is one of the major sources of greenhouse gas emissions [3,4]. The “Special Report on Climate Change and Land” issued by IPCC states that the carbon emissions caused by agricultural production accounts for 23% of the total global anthropogenic carbon emissions [5]. Therefore, the issue of carbon emissions in the agricultural sector has attracted increasingly more attention, and scholars have explored the factors affecting ACE from various aspects. Research on the factors affecting carbon emissions can be traced back to 1991, when Grossman and Krueger [6] surveyed the impacts of economic growth on changes in carbon emissions. In the early period, the research on ACE was focused more on the process of agricultural production, mainly covering crop varieties, planting patterns, inputted materials, and waste, among others [7,8]. Later, research on the factor’s affecting ACE has become increasingly extensive, mainly involving such dimensions as agricultural technology development, economy, society, and agricultural land itself. Several studies, including those conducted by Li et al. [9], Mohanad et al. [10], and Arun et al. [11], have found that the level of agricultural technology development has a significant effect on agricultural carbon emissions (ACE). These studies highlight the importance of technological advancements in agriculture for reducing carbon emissions and promoting sustainable practices.
Previously, China’s agricultural development depended mostly on high carbon emissions [12]. Therefore, guiding the agricultural sector to reduce its carbon emission is of great significance in facilitating the green transformation and high-quality development of agriculture and helping to realize the goals of “carbon peak and carbon neutrality”. The “Implementation Plan for Emission Reduction and Carbon Sequestration in Agriculture and Rural Areas” put forward by China gives an in-depth interpretation of the importance and necessity of low-carbon agricultural development. In order to reduce the emissions of greenhouse gases and lower the intensity of carbon emissions in agriculture, it proposes the implementation of 10 major actions, including: reducing fertilizer usage and boosting its efficiency, decreasing carbon emissions in livestock and poultry farming, the comprehensive utilization of straws, etc. Since 2014, Beijing-Tianjin-Hebei Cooperative Development has been promoted to an important national strategy in China [13]. Taking a unique position, the Beijing-Tianjin-Hebei region has a cooperation condition and strong economic foundation for carbon emission reduction; and Beijing, Tianjin and Hebei may deliver focused breakthroughs in the field of high-quality development of agriculture. However, the three areas vary in terms of AD and carbon emission levels. What is the level of ACE in the Beijing-Tianjin-Hebei region in recent years? What is the AD gap? What is the relationship between AD and ACE? The above analysis shows that, in the context of Beijing-Tianjin-Hebei coordinated development, there are remarkable geographical differences and large gaps in terms of AD and ACE. With the Beijing-Tianjin-Hebei region as its research object, and taking the years of 2000–2020 as the evaluation point of time, this study will, based on decoupling models, analyze the decoupling effects of AD and ACEI in the Beijing-Tianjin-Hebei region on the basis of evaluating AD, measuring ACEQ and accessing ACEI, with the view of providing provide some scientific references for formulating policies to boost AD and reduce ACE in the Beijing-Tianjin-Hebei region.

2. Literature Review

Currently, the hotspots of ACE-related research results are focused on the following several aspects: first, the measurement of agricultural carbon sources and sinks, and the study of their spatial characteristics. For example, Mosier et al. [14] state that crops and animals are the main sources of agricultural emissions of methane; Johnson [8] divided ACE into agricultural energy utilization, enteric fermentation, manure management, rice cultivation, agricultural wastes, and biofuels; He Huishuang and Fu Bangjie [15] conducted a study to measure the ACE in major grain-producing areas. Their findings revealed that, while the total amount of ACE is increasing at a slow rate, the carbon intensity is decreasing year by year. Fan Ziyue et al. [16] have constructed an inventory of GHG (Green House Gas) emissions from the agricultural system, including planting and breeding, finally concluding that China’s GHG emissions from the agricultural system in the past 40 years generally showcase a fluctuating and increasing trend; Yin Minhao et al. [17] have analyzed the current status of ACE and its regional variations across China based on carbon emissions at three levels: material inputs, energy consumption, and agricultural production. Second, the driving factors for ACE. For instance, Monchuk et al. [18] and Zhang et al. [19] believe that industrial development and energy consumption have promoted ACE; Ahmed et al. have analyzed the impact of food production on ACE in two countries: China and Pakistan [20], revealing a negative relationship between ACE and food production. Dumont [21] pointed out that changes in dietary structures, especially the increase in consumption of livestock products, would cause ACE to rise; René Verburg et al. [22] found that trade liberalization has a significant positive effect on ACE. Balogh et al. [23] and Fortune [24],, among others, discovered that economic factors, such as agricultural subsidies, contribute to ACE to a certain extent. Baumann et al. [25] have investigated the effect of agricultural land’s expansion and intensification on ACE in the Jammu and Kashmir regions; and research by Jaroslaw et al. [26] demonstrates that land consolidation can reduce energy consumption and thus diminish ACE. He Yanqiu and Dai Xiaowen [27] maintain that in the temporal dimension, the dominant factor of ACE in China has changed from the dominance of agricultural economic structure to the dominance of agricultural mechanization; in the spatial dimension, there are also some significant differences; and the influence of agricultural economic development and agricultural economic structure varies across regions. Zhao Yu [28] believes that economic factors, such as agricultural energy consumption and rural gross value of production per capita, are positive drivers, while agricultural technical development factors, such as the number of agricultural technological personnel, are negative drivers. Li Kuan [9] and others have pointed out that innovation in agricultural technology would deliver a significant negative effect on ACE. Third, analysis on the coupling or decoupling between ACE and the economic development, urbanization and other factors. For example, Bai Fuchen et al. [29] have explored the decoupling effect between the carbon footprint of farmland ecosystems and the grain yields in the main grain producing areas; Xu Yue et al. [30] have investigated the decoupling relationship between ACE and agricultural economic development in Xuzhou, an energy resources based city; Tian Yun et al. [31] have analyzed the spatiotemporal coupling relationship between ACE efficiency and economic growth in the provinces of China; Yu Zhuohui and Mao Shiping [32] have analyzed the decoupling relationship between net agricultural carbon emissions and economic growth in China. As a large agricultural country, China has a large base and rapid growth of agricultural activities; therefore, if corresponding emission reduction measures are not taken, GHG generated in the agricultural activities will further go up. The emission proportion of GHG generated in China’s agricultural production activities falls in a range of 16% to 17%, and the level of emissions has been growing at an annual speed of 5% on average, which is higher than the world’s average level of carbon emissions from agricultural production activities [33].

3. Study Area and Research Methods
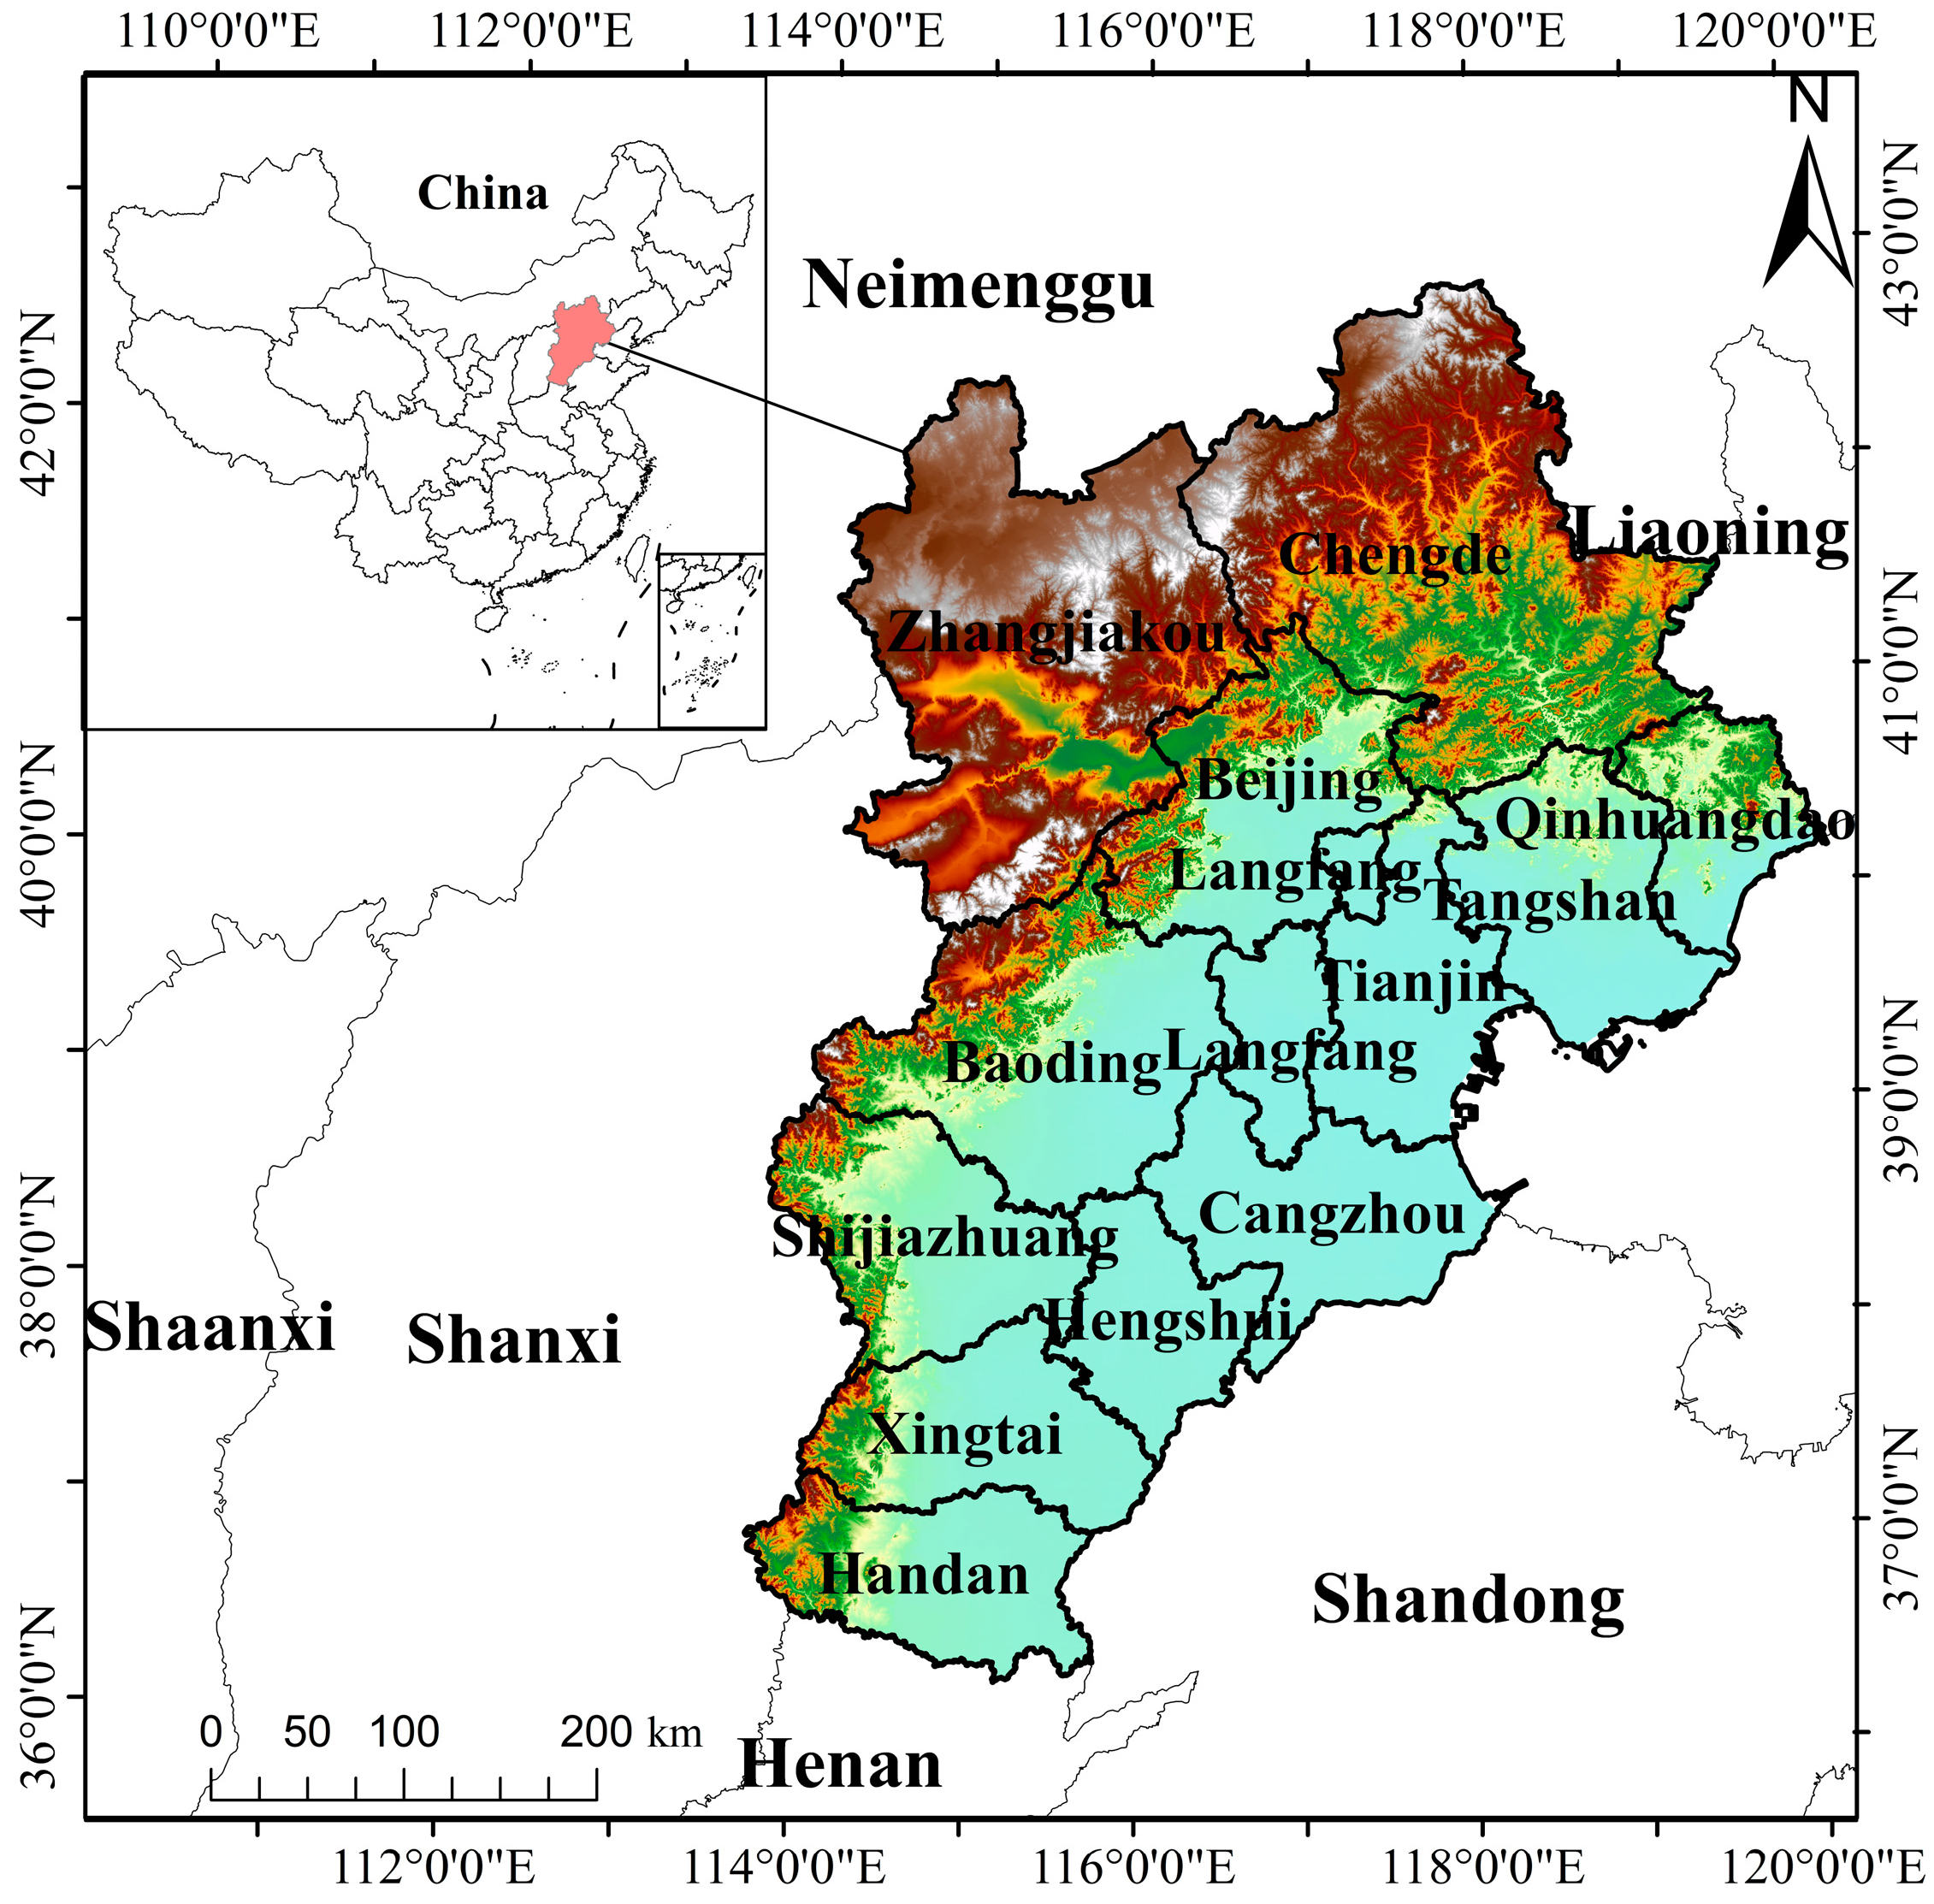
3.1. Study Site

Located in the heart of the Bohai Sea Rim, the Beijing-Tianjin-Hebei region is bordered by the Yanshan Mountains to the north, the fertile North China Plain to the south, the Taihang Mountains to the west, and the vast Bohai Bay to the east. It encompasses the territories of two municipalities (Beijing and Tianjin) and a province (Hebei), spanning an area of approximately 220,000 square kilometers and housing a population of roughly 110 million. This region serves as China’s preeminent political and cultural hub, while also representing the largest and most economically advanced core area in northern China. Furthermore, it stands as the country’s third economic growth pole, trailing only the Yangtze River Delta and the Pearl River Delta. The Beijing-Tianjin-Hebei region boasts significant scale and robust momentum in its development. The announcement of the coordinated development strategy for this region has propelled its economic growth to new heights. However, the presence of significant disparities in agricultural development (AD) within the region has led to prominent conflicts between AD and carbon missions. Reducing the ACE has become a fundamental prerequisite for the region’s agriculture sector to pursue a green and low-carbon development path. Therefore, examining the decoupling effect between AD and ACE in the Beijing-Tianjin-Hebei region holds immense significance for the sustainable development of agriculture in this vital region (Figure 1).

3.2. Data Sources

The data related to the measurement of AD and ACE in the Beijing-Tianjin-Hebei region in 2000–2020 stem from: Beijing Statistical Yearbook (2000–2020); Tianjin Statistical Yearbook (2000–2020); Hebei Statistical Yearbook (2000–2020); Beijing Regional Economic Statistics Yearbook (2000–2020); China Rural Statistics Yearbook (2000–2020), and others.

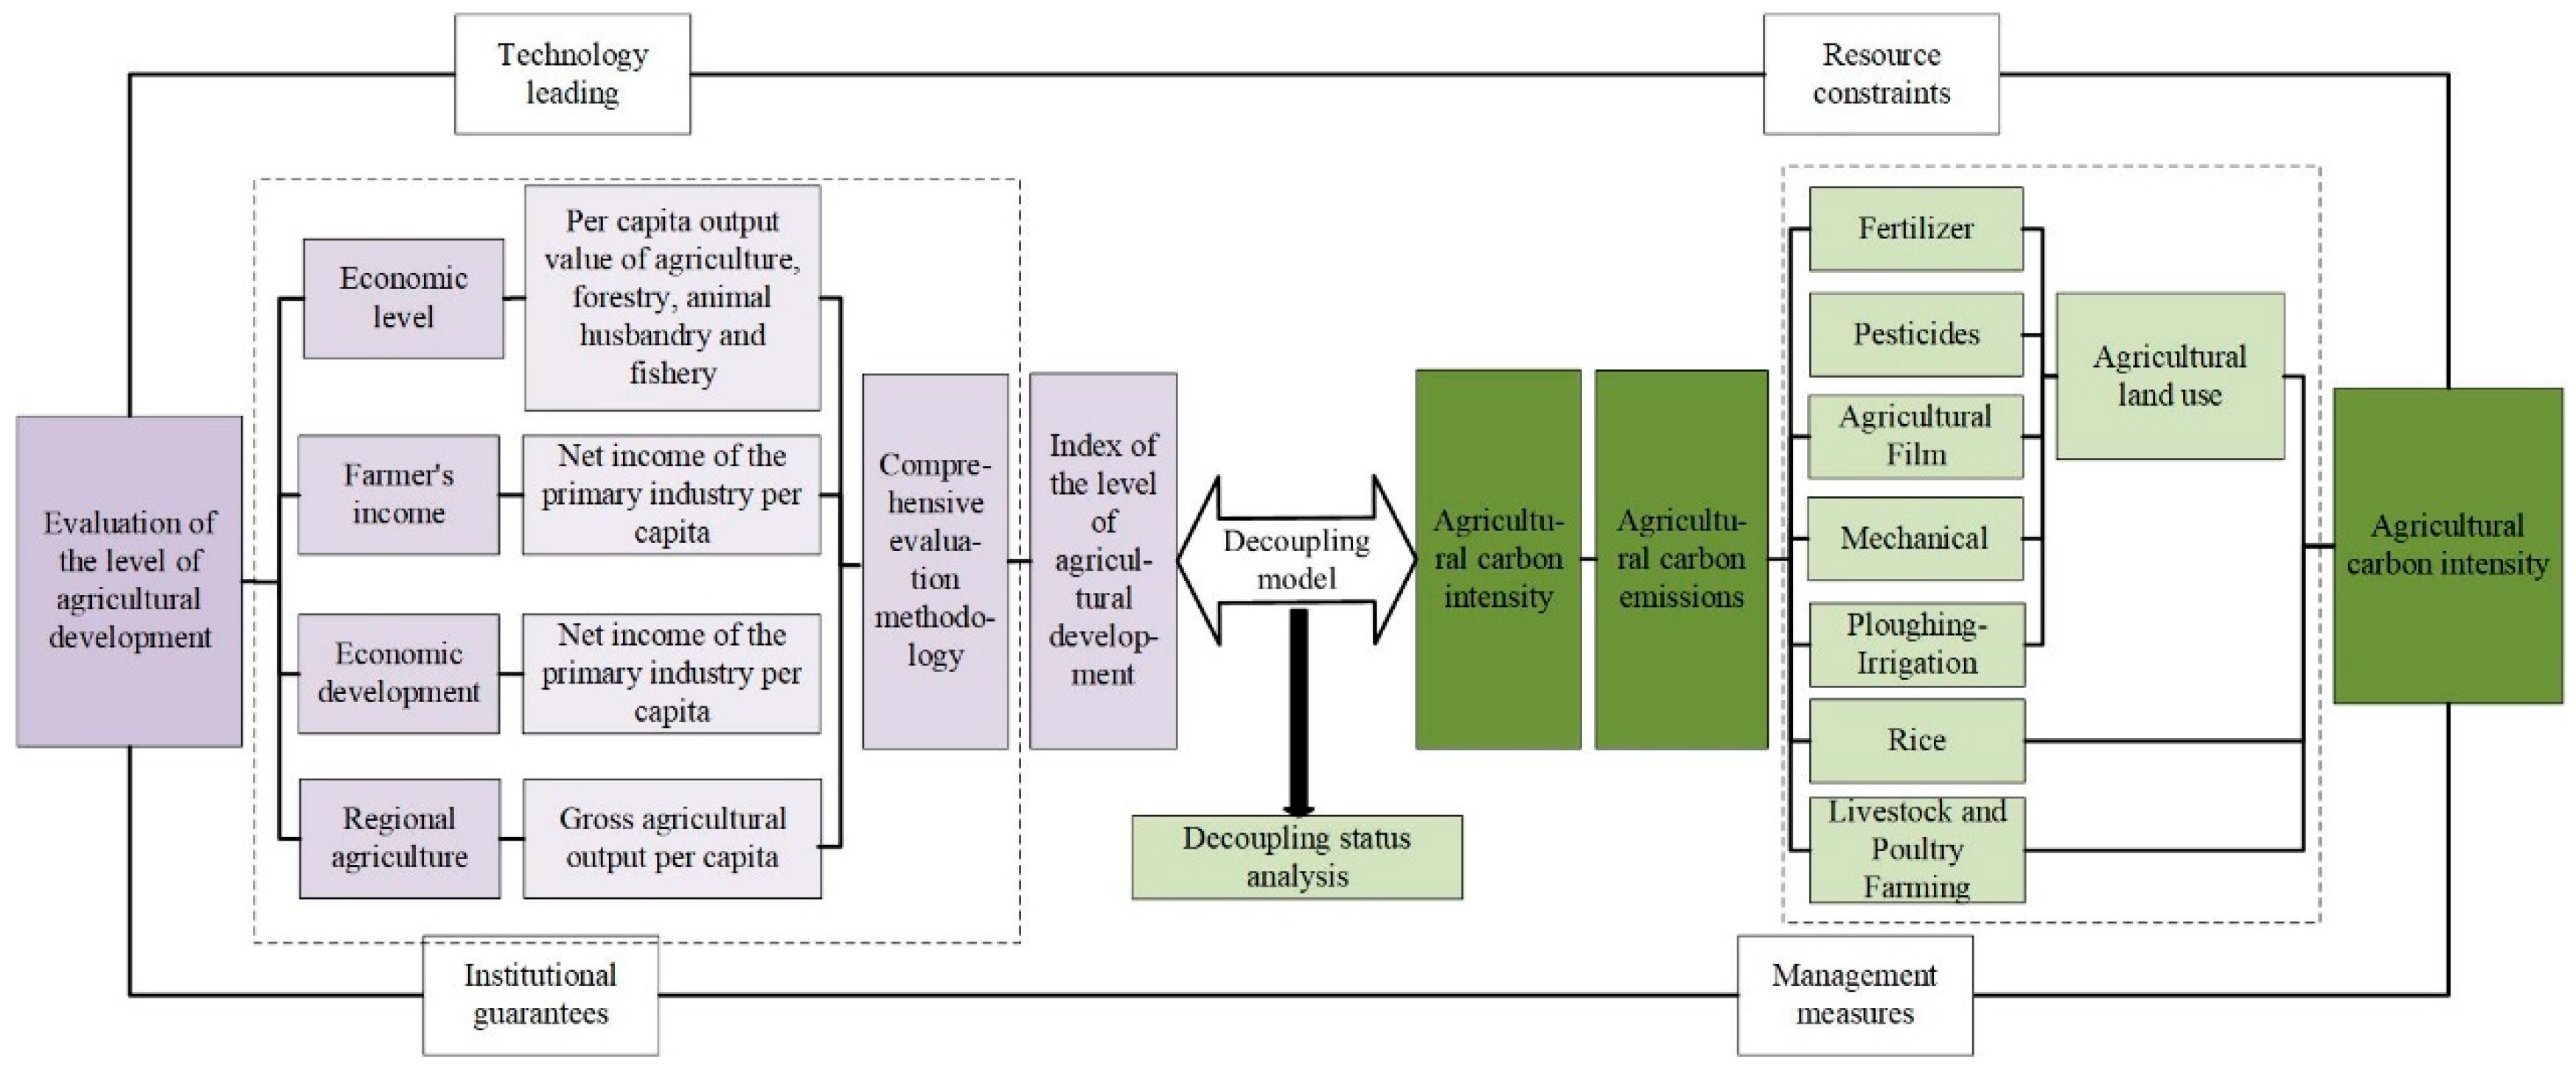
3.3. Research Framework and Methods

There is a strong relationship between AD and ACE. The relationships between AD and ACE levels are different at different stages. In the stage of extensive agricultural development, the enhancement of both agricultural outputs and yields are dependent on more agricultural inputs, including fertilizers, pesticides, and other agricultural materials, as well as labors; as a result, the higher the AD, the higher the ACEQ, with a synchronous growth state between the two. Later, as the AD increases, agriculture demonstrates scale efficiency, and agricultural production does not rely on the input of agricultural materials and labors, which prompts the green AD: as the AD is boosted, the carbon emissions do not change significantly, or may even decrease; in other words, AD and ACE are in a “decoupling” state, which is a desirable state. The above is a simple description of AD and ACE. Of course, the actual situation is more complex than the above two situations; actually, AD and ACEI in different regions present a variety of different situations. Based on different relationships between the two, certain guidance and recommendations on AD and ACE can be put forward, so as to facilitate the green development of regional agriculture (Figure 2).
This study selects evaluation indicators from the following four aspects: per-capita agricultural output value, per-area agricultural output value, farmers’ income level, and growth of agricultural output value. If a comprehensive evaluation method is adopted to assess the AD status in the Beijing-Tianjin-Hebei region from 2000 to 2020, an integrated assessment can be made for the AD situation in this region over a period of 20 years, and the factors for the changes in the AD status in different areas can be analyzed. The results about AD acquired in this study are more authoritative and representative than those acquired from single factors, and can demonstrate the comprehensive patterns of AD. Regarding ACE, this study measures the total ACEQ in three aspects: agricultural land use, rice, and livestock and poultry farming (Figure 3, Table 1).

3.3.1. Agricultural Development Evaluation

The polarization method is used to process the raw data of the indicators; the hierarchical analysis method is used to determine the weights; and a multi-factor comprehensive evaluation model is adopted to calculate the comprehensive index of the two. The calculation formula is:
U = j = 1 n u j = j = 1 n X j W j
where U j denotes the index of the j-th indicator; X j denotes the standardized value of the j-th indicator; and W j denotes the weight of the j-th indicator.

3.3.2. Agricultural Carbon Emissions Evaluation

Based on the summary of the calculation approaches of ACE in the existing research [30], the calculation method of ACEQ is determined.
ACEQ = ΣEi = ΣTi × δi
where ACEQ denotes “Agricultural carbon emissions quantity”; Ei denotes the i-th category of ACE; Ti denotes the specific value of the i-th category of agricultural carbon source; and δi denotes the carbon emission coefficient of each agricultural carbon source (Table 2).
This study determines the corresponding carbon sources and carbon emission coefficients from the following aspect: agricultural land use, rice, and livestock and poultry farming. Specifically, the carbon emissions in agricultural land use mainly come from: fertilizers, pesticides, agricultural films, agricultural mechanical, ploughing and irrigation; as to the carbon emissions from rice, based on the references [34], the C emission coefficients is calculated from the Beijing-Tianjin-Hebei region’s rice varieties (early-, late-, and mid-season rice), and then the carbon emissions from rice are calculated for different areas; and for the carbon emission coefficients of various types of livestock and poultry [34,35,36], the carbon emissions from gastrointestinal fermentation and excreta of livestock and poultry in the region will be calculated.
Based on the calculation of ACEQ, the ACEI is calculated as follows:
ACEI = ACEQ/GDPA
where ACEI denotes the “Agricultural carbon emissions intensity” in the region, and GDPA denotes the regional gross agricultural production.

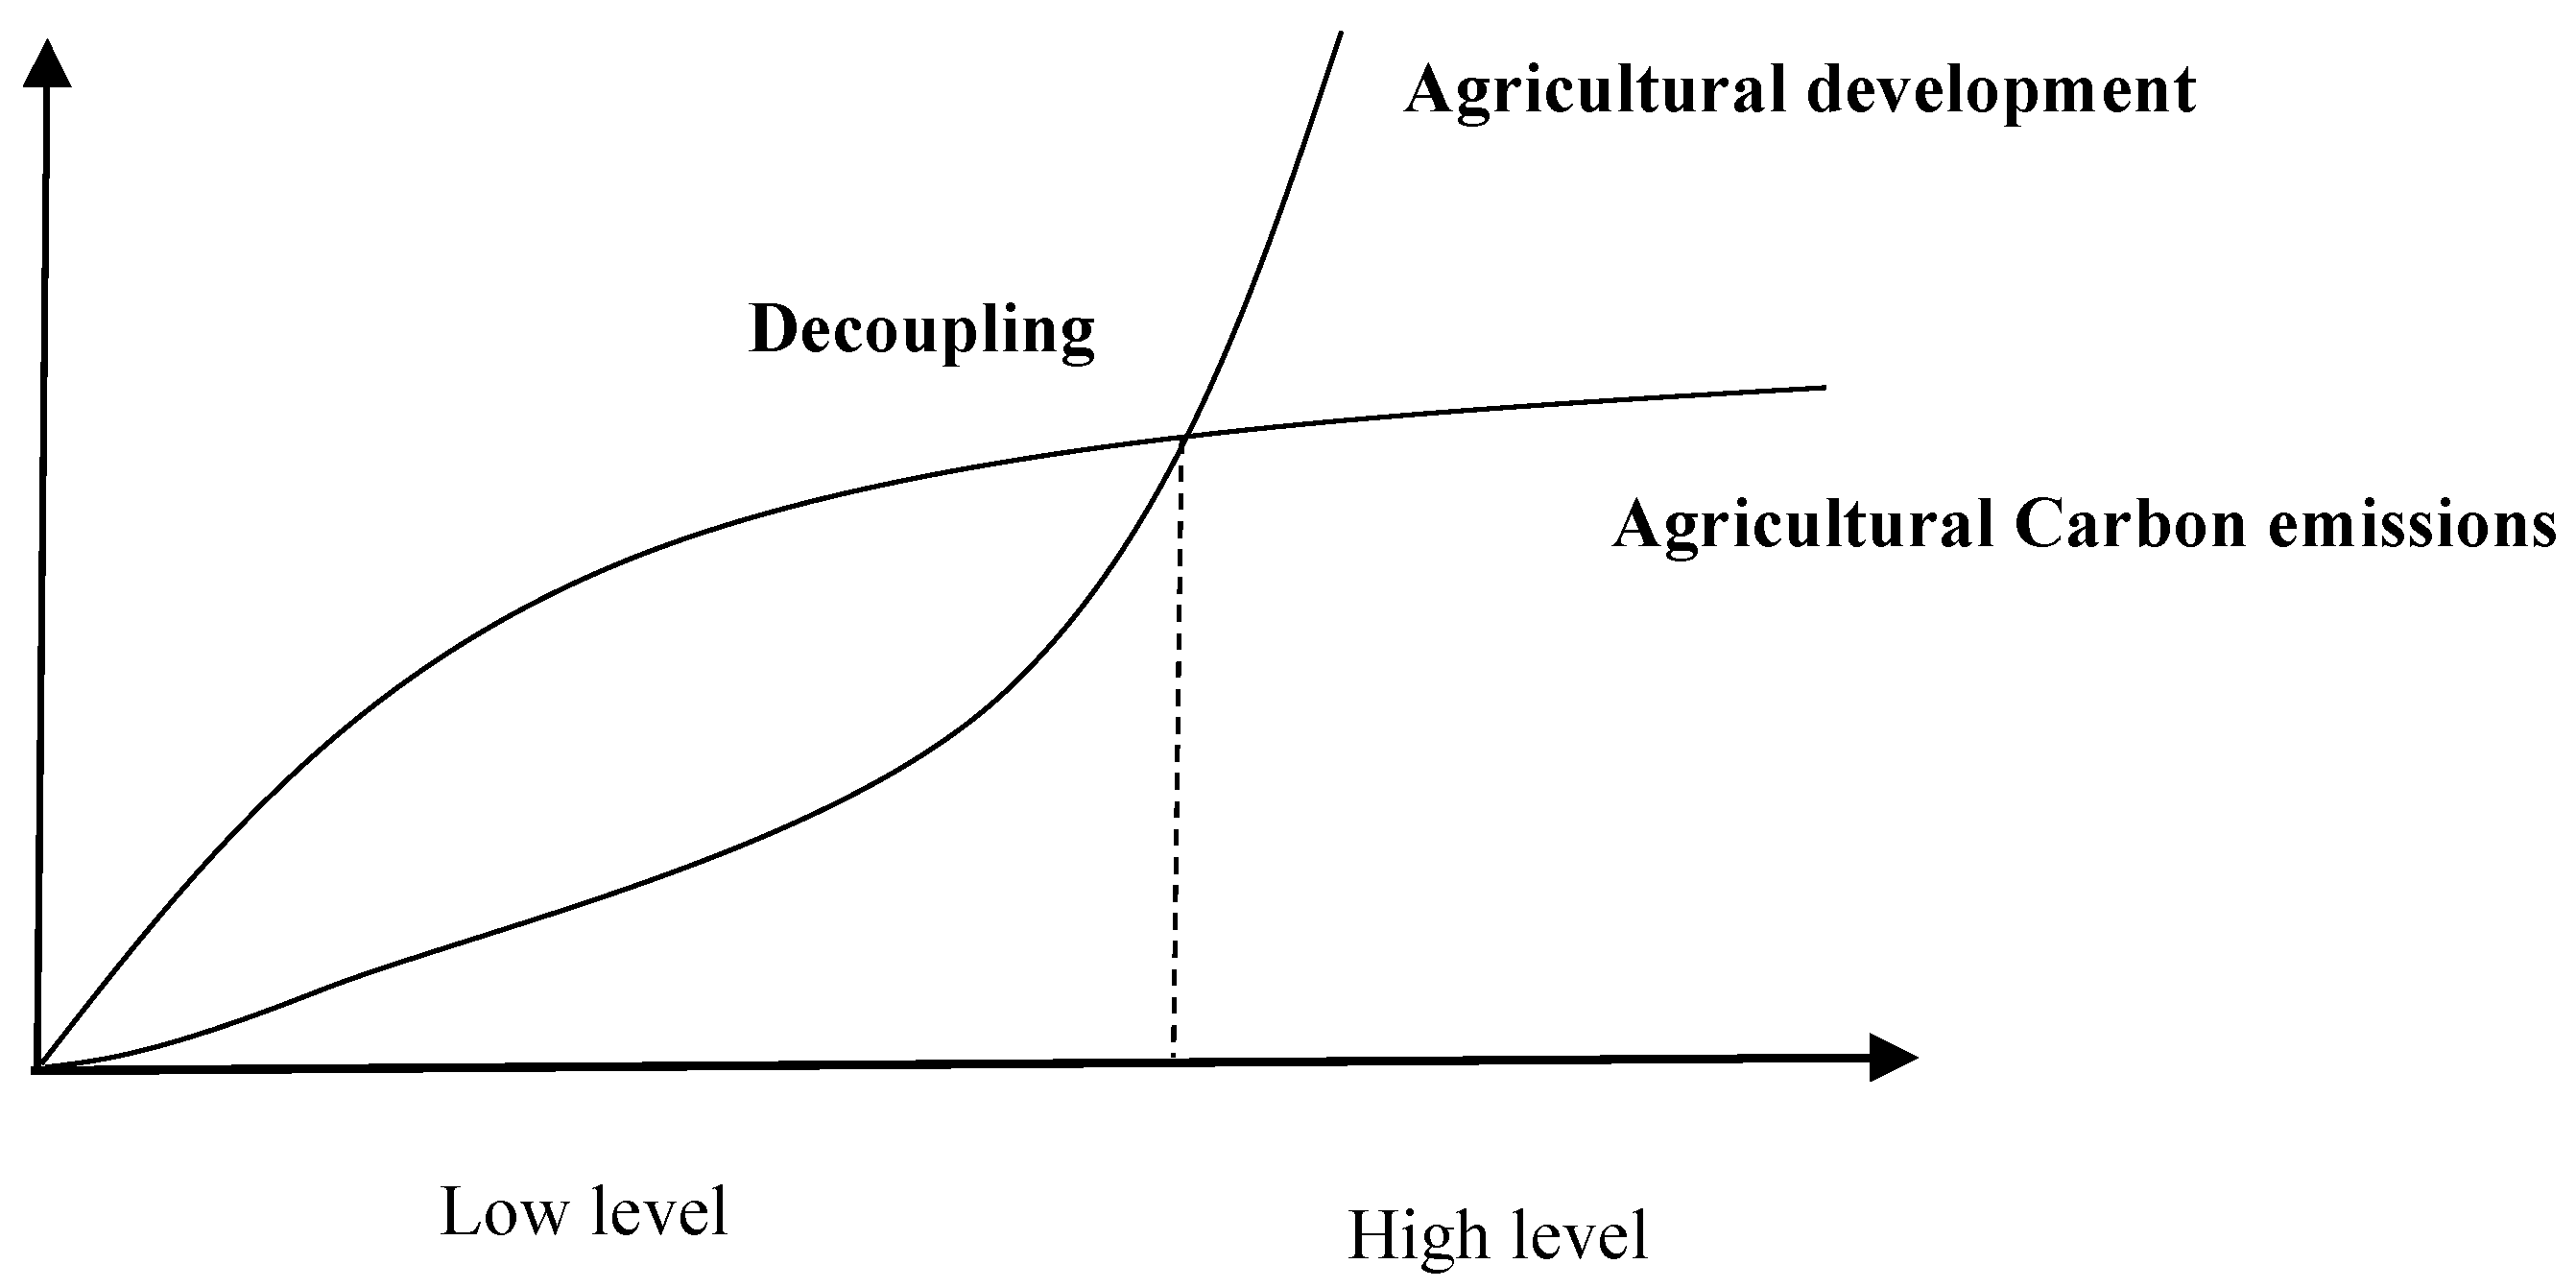
3.3.3. Decoupling Model

Originating from physics, the concept of “decoupling” indicates that the corresponding relationships that previously existed between two or more physical quantities no longer exist. Later, this concept was proposed by the Organization for Economic Cooperation and Development (OECD) to study the relationship between economic development and environmental pollution. At present, this concept has been widely used in research on different spatial scales, including national, provincial, and county levels, as well as in the evaluation of the relationship between economic development and carbon emissions in different industries [12,37,38,39]. The model is as follows:
T = A C E I / A C E I A G / A G
where T denotes the decoupling elasticity between AD and ACE; A C E I A C E I and A G A G are the relative change amount of ACEI and AD, respectively. According to research by Tapio [40] and other scholars [32], the elasticity indexes of 0.8 and 1.2 are used as the critical points for deciding the decoupling states; then, with reference to the magnitudes of the change rates of AD and ACEI, eight states are further identified (Table 3).

4. Results and Analysis

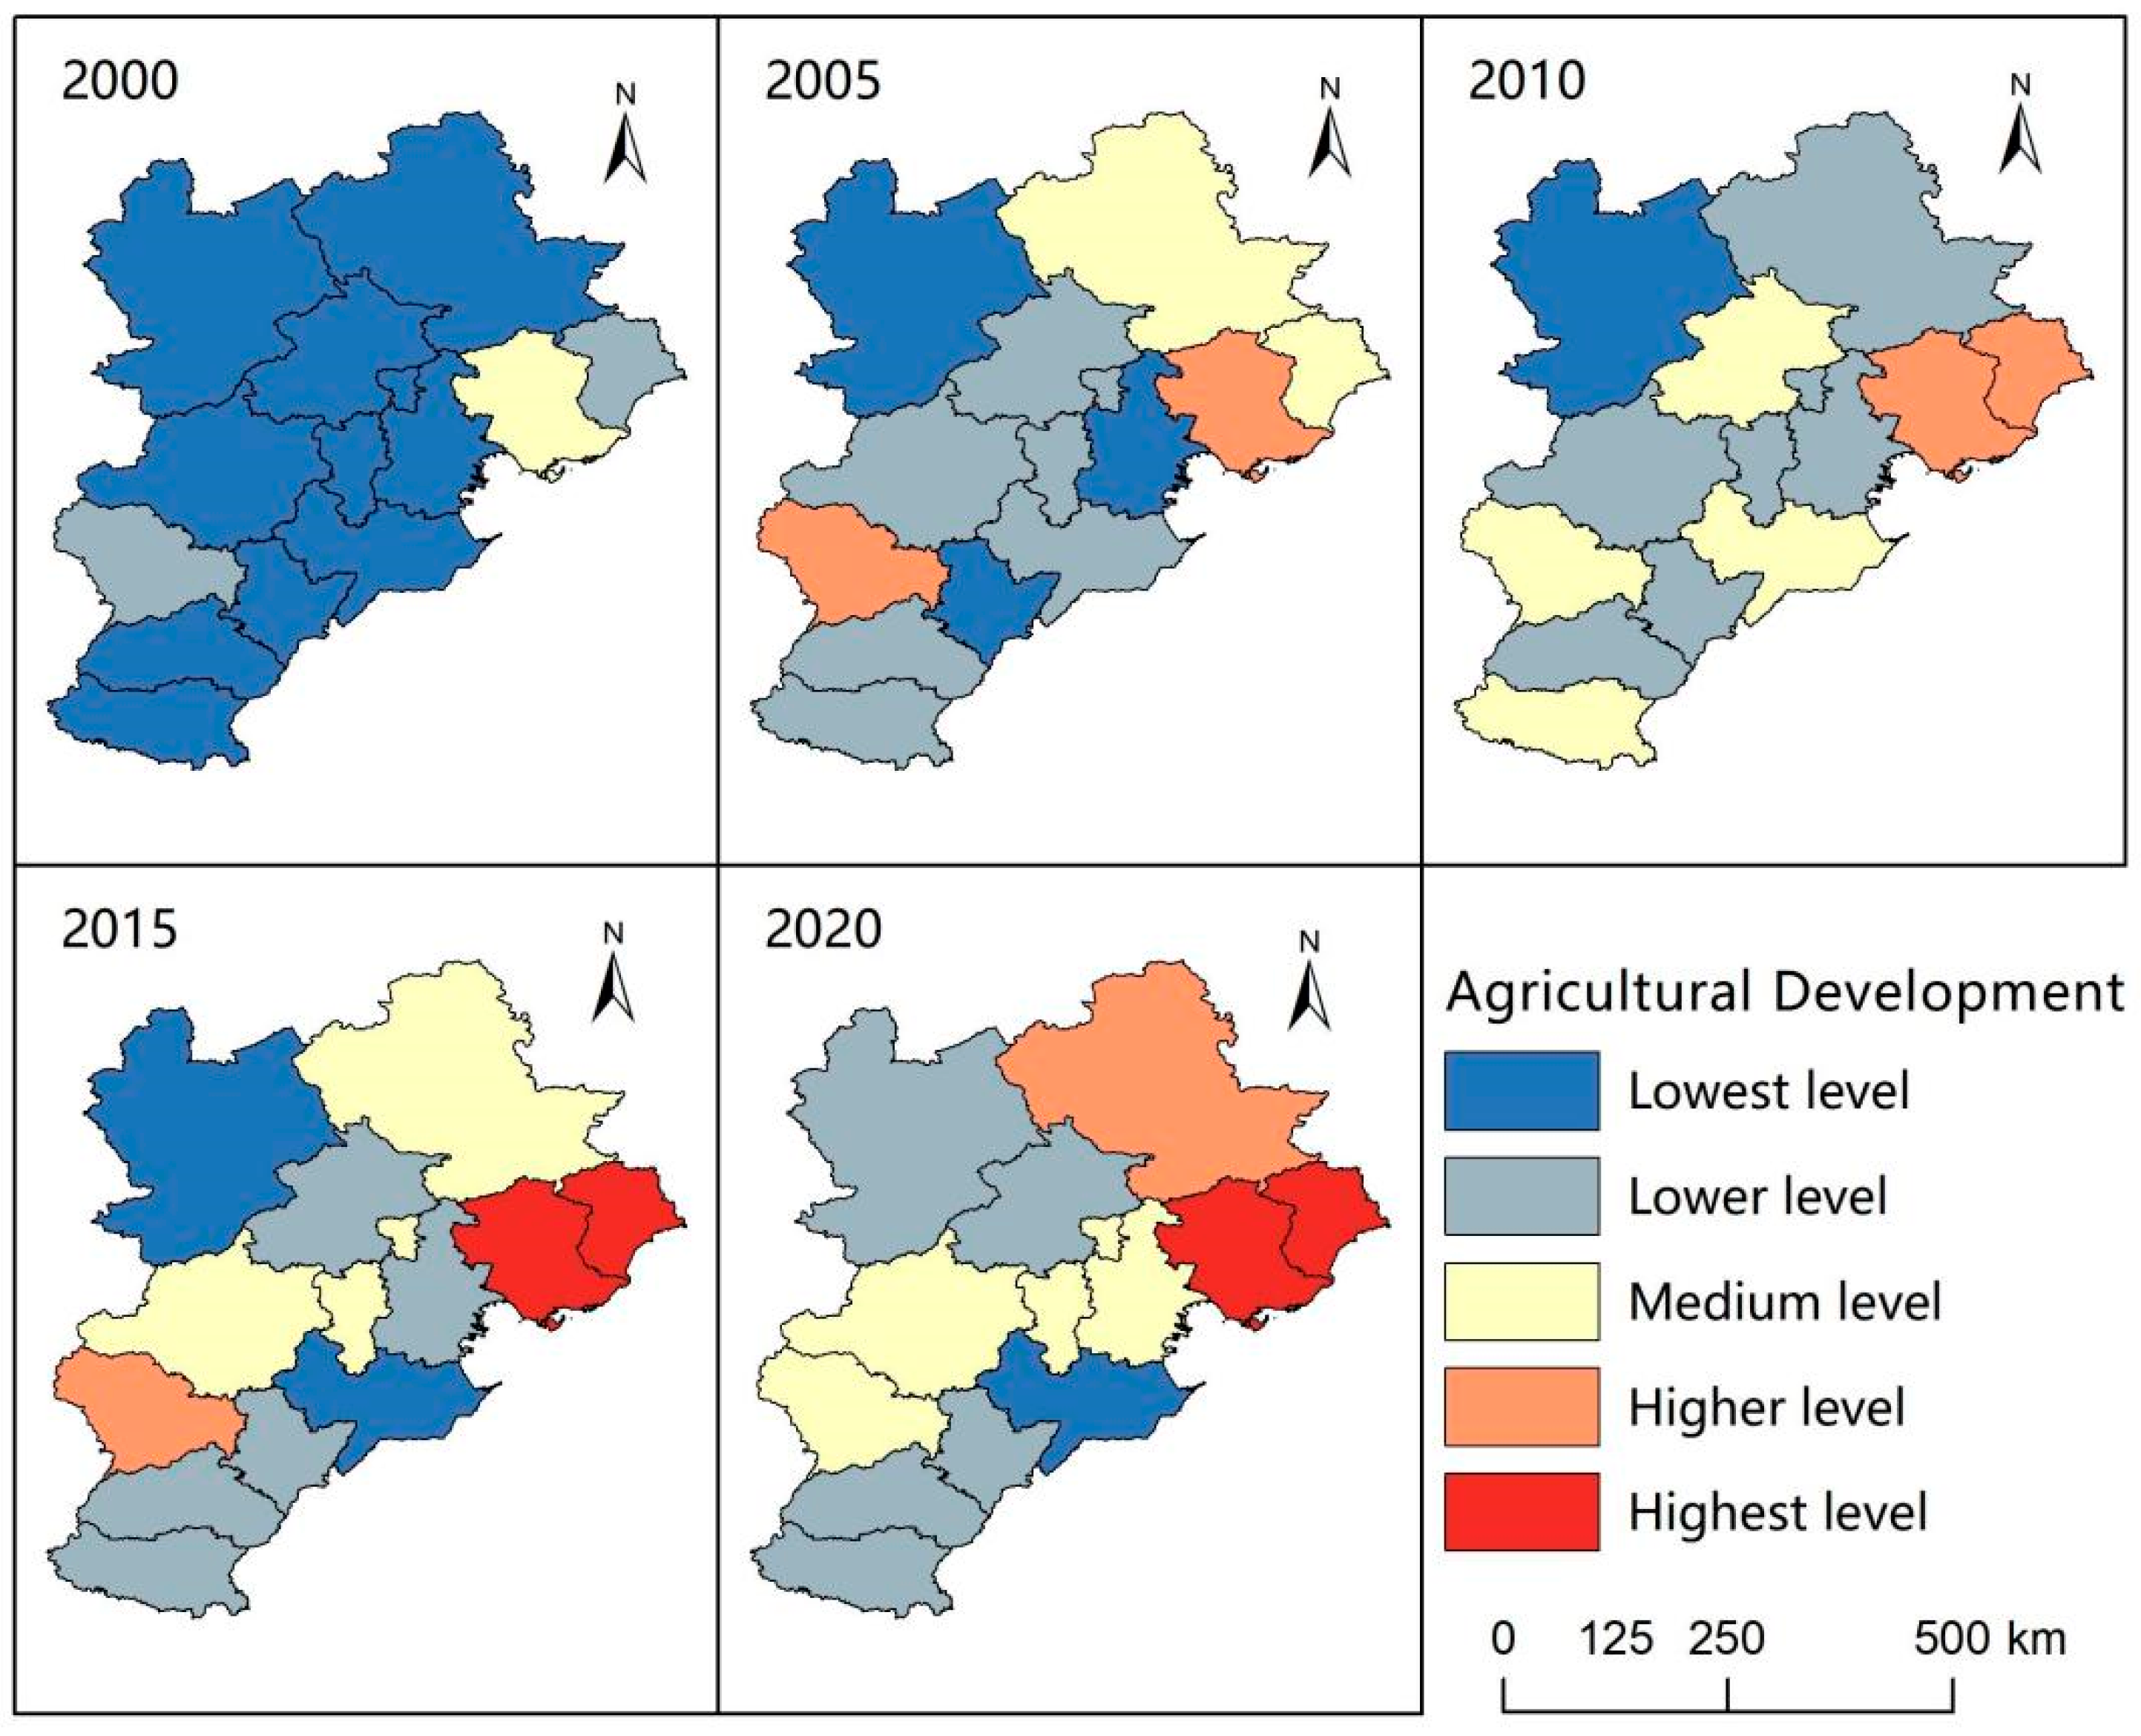
4.1. Agricultural Development Evaluation

The comprehensive evaluation method is adopted to assess the changes of AD in the Beijing-Tianjin-Hebei region from 2000 to 2020. Given the large number of years, Figure 4 presents the evaluation results at five-year intervals. As shown in the evaluation results, the AD of the Beijing-Tianjin-Hebei region generally showed a gradual increasing trend from 2000 to 2020, with a basic feature that AD in the northern region was higher than in the southern region. Specifically, in 2000, AD in the Beijing-Tianjin-Hebei region was generally at the lowest level; AD in most areas was at the lowest level, only AD in Qinhuangdao and Shijiazhuang was at a lower level, and AD in Tangshan was at a medium level. In 2005, AD in the Beijing-Tianjin-Hebei region was improved significantly; only AD in three cities, i.e., Zhangjiakou, Tianjin and Hengshui, was still at the lowest level, AD in other cities was significantly improved compared to that in 2000, and Tangshan and Shijiazhuang reach a higher level. In 2010, AD in the Beijing-Tianjin-Hebei region was obviously boosted; generally, AD in all cities reached lower level or above, and only AD in Zhangjiakou was at the lowest level. In 2015, AD in Tangshan and Qinhuangdao reached the highest level. In 2020, AD in more than half of the cities reached the medium level or above, and only AD in Cangzhou was at the lowest level.

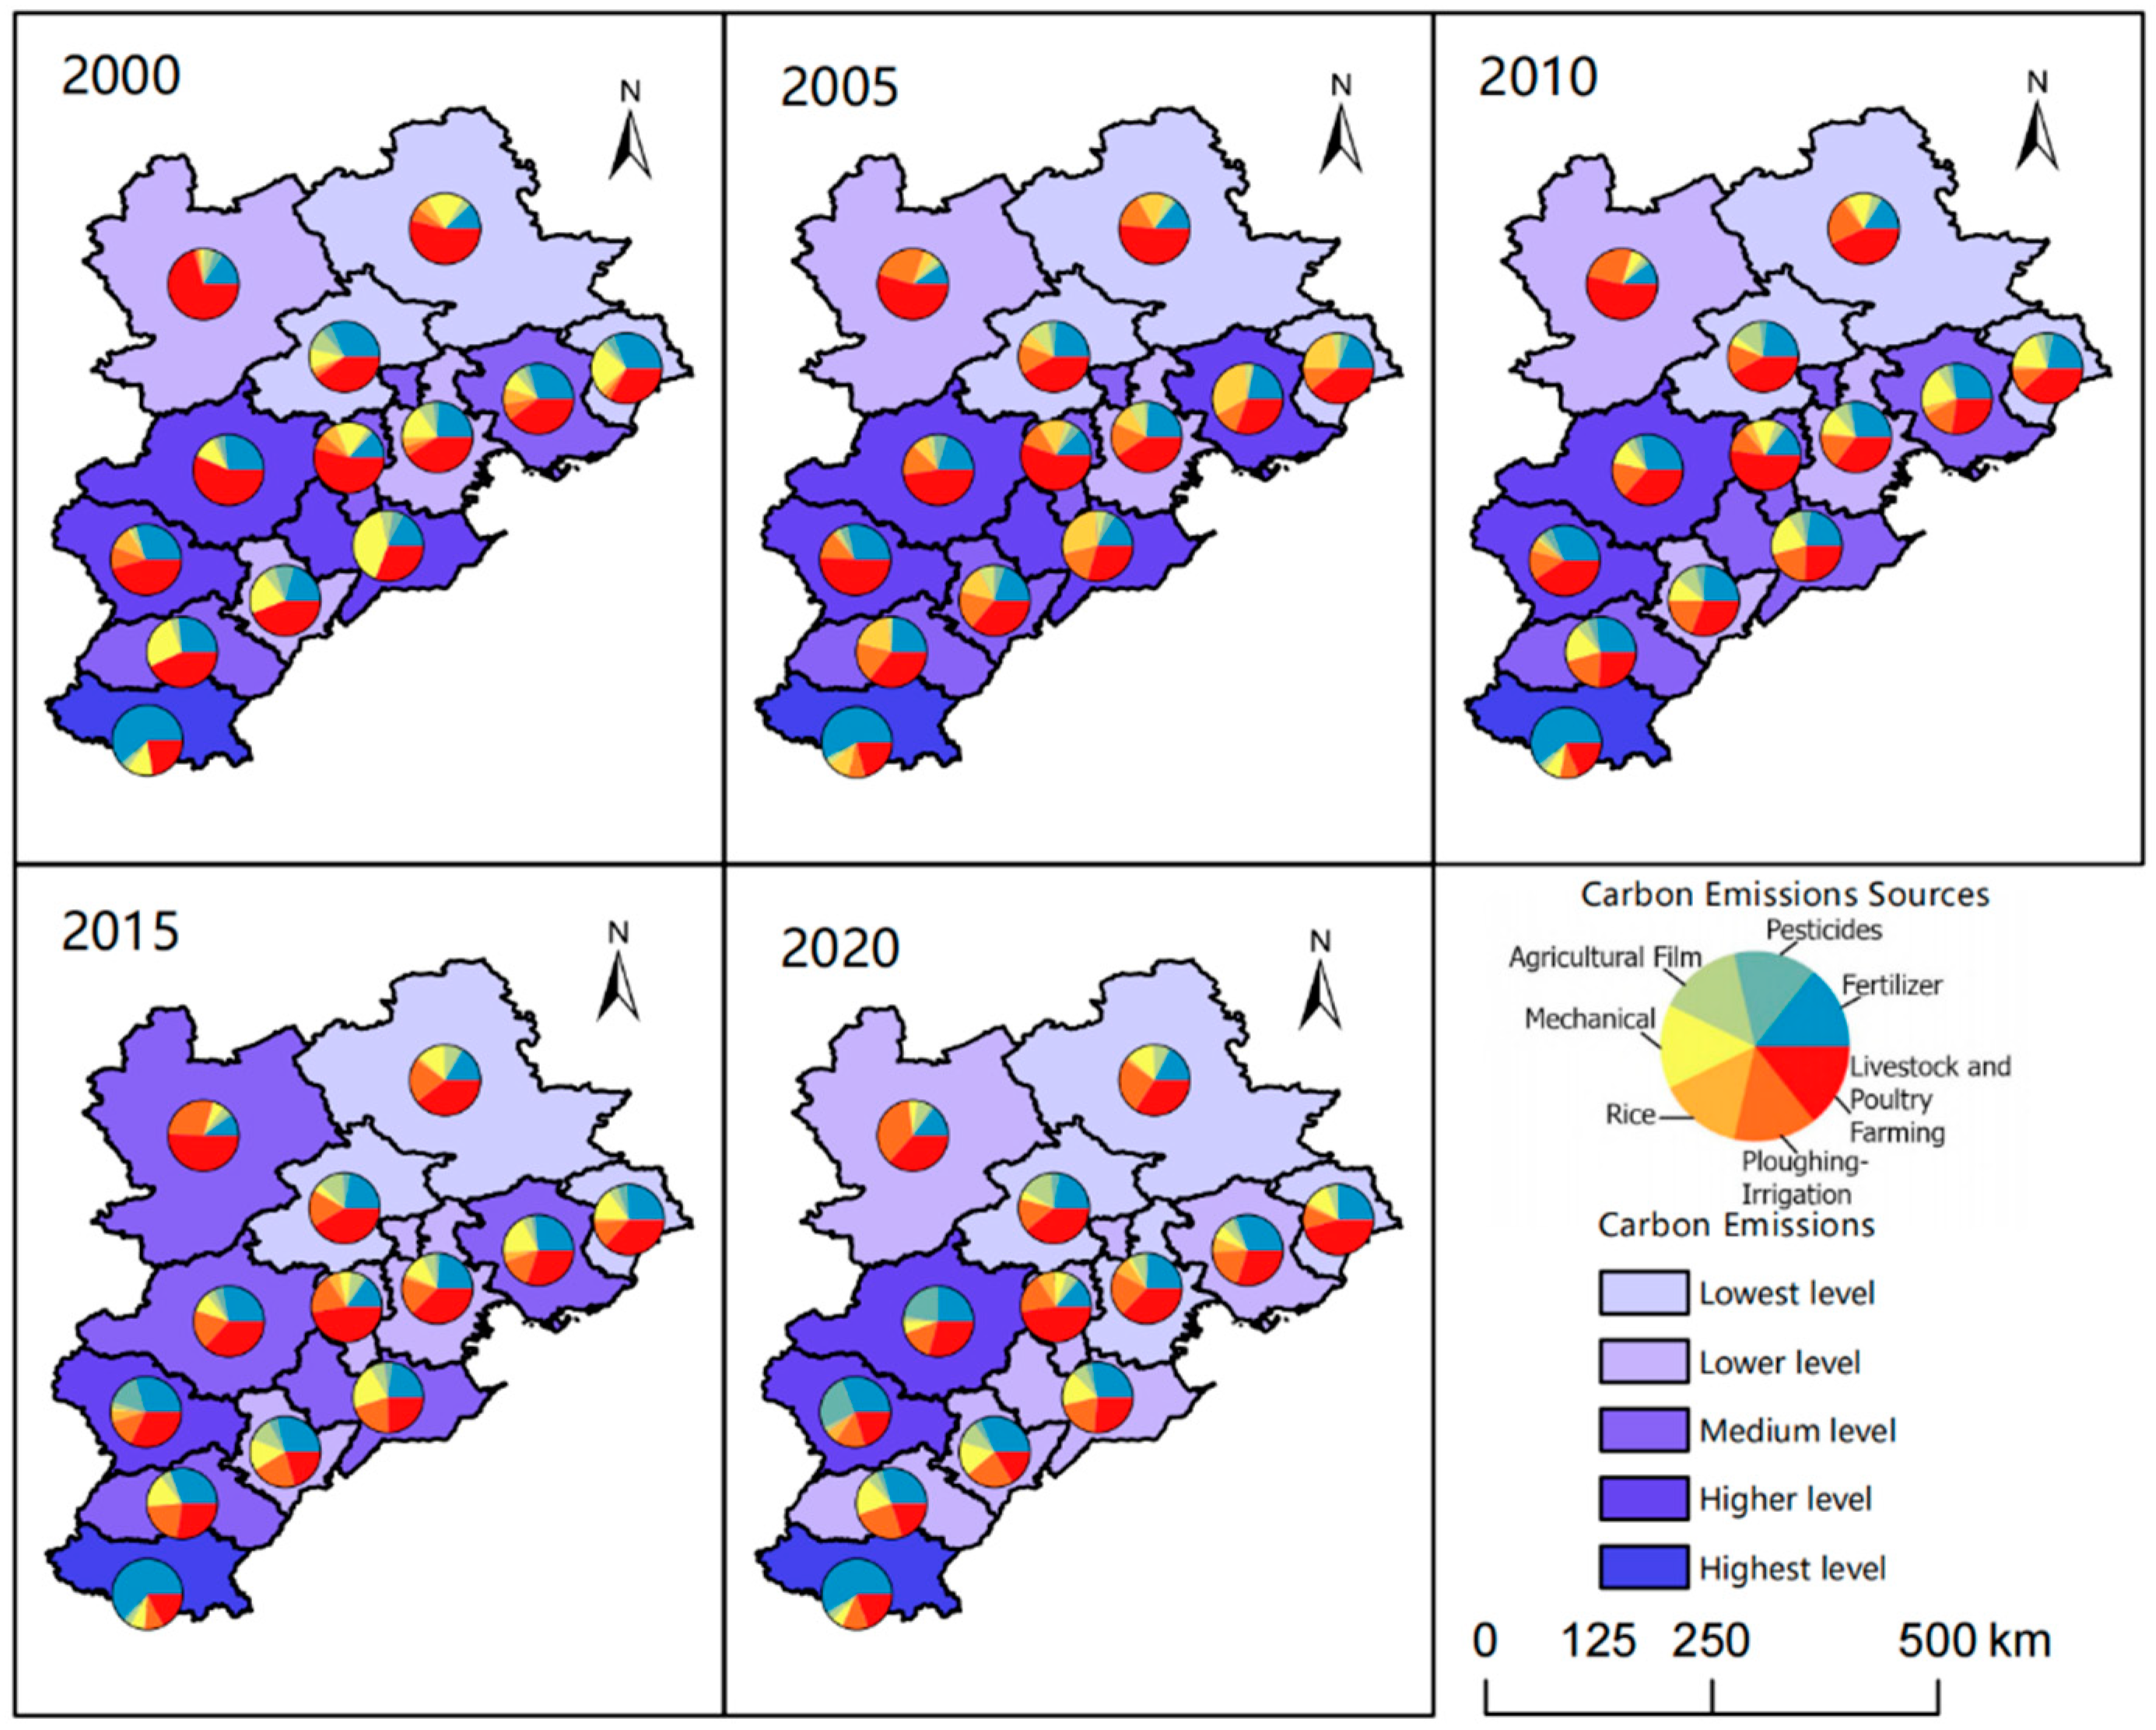
4.2. Agricultural Carbon Emissions

The method described in Section 3.3 is used to measure the changes in ACEQ, emission sources and ACEI in the Beijing-Tianjin-Hebei region from 2000 to 2020. In terms of ACEQ and emission sources (Figure 5), ACEQ in the Beijing-Tianjin-Hebei region increased first and decreased later from 2000 to 2020, with a spatial distribution feature that ACEQ in the southern cities were higher than in the northern ones. From 2000 to 2005, the total ACEQ was increased from 1516.01 tons to 1647.83 tons; in 2010, the total ACEQ began to decline, reaching 1467.99, 1436.37 and 1155.88 tons in 2010, 2015 and 2020, respectively; from 2010 to 2015, the decline was slow; and a remarkable decline occurred from 2015 to 2020. From 2000 to 2020, the city with the highest ACEQ was always Handan, with 264.34, 277.19, 260.58, 253.57 and 169.58 tons, respectively, which also showcases a trend of first increasing and then decreasing. In contrast, ACEQ in Beijing, Qinhuangdao, Tianjin and Chengde had been kept at a low level for long, with the total ACEQ being below 90 tons for several years. In terms of the sources of ACE, from 2010 to 2020, the highest source in most cities in the Beijing-Tianjin-Hebei region was the livestock and poultry farming, but the percentage showcased a decreasing trend; and the next major sources were fertilizers, ploughing-irrigation, and the use of agricultural mechanical. In Handan, the main source of ACE is fertilizers, with a percentage kept at above 60% for long.
ACEI (Figure 6) in the Beijing-Tianjin-Hebei region decreased year by year from 2000 to 2020. In 2000, the average ACEI in the Beijing-Tianjin-Hebei region was 1.12, with the highest value appearing in Handan, reaching 2.35, and the lowest value in Tangshan, which was 0.38. In 2005, the average ACEI in the Beijing-Tianjin-Hebei region was 0.85, with the highest value appearing in Handan, reaching 1.80, and the lowest value in Shijiazhuang, which was 0.36. In 2010, the average ACEI in the Beijing-Tianjin-Hebei region was 0.43, with the highest value appearing in Zhangjiakou, reaching 0.68, and the lowest value in Tangshan, which was 0.20. In 2015, the average ACEI in the Beijing-Tianjin-Hebei region was 0.40, with the highest value appearing in Cangzhou, reaching 1.29, and the lowest value in Tangshan, which was 0.14. In 2020, the average ACEI in the Beijing-Tianjin-Hebei region was 0.28, with the highest value appearing in Handan, reaching 0.48, and the lowest value in Qinhuangdao, which was 0.09.

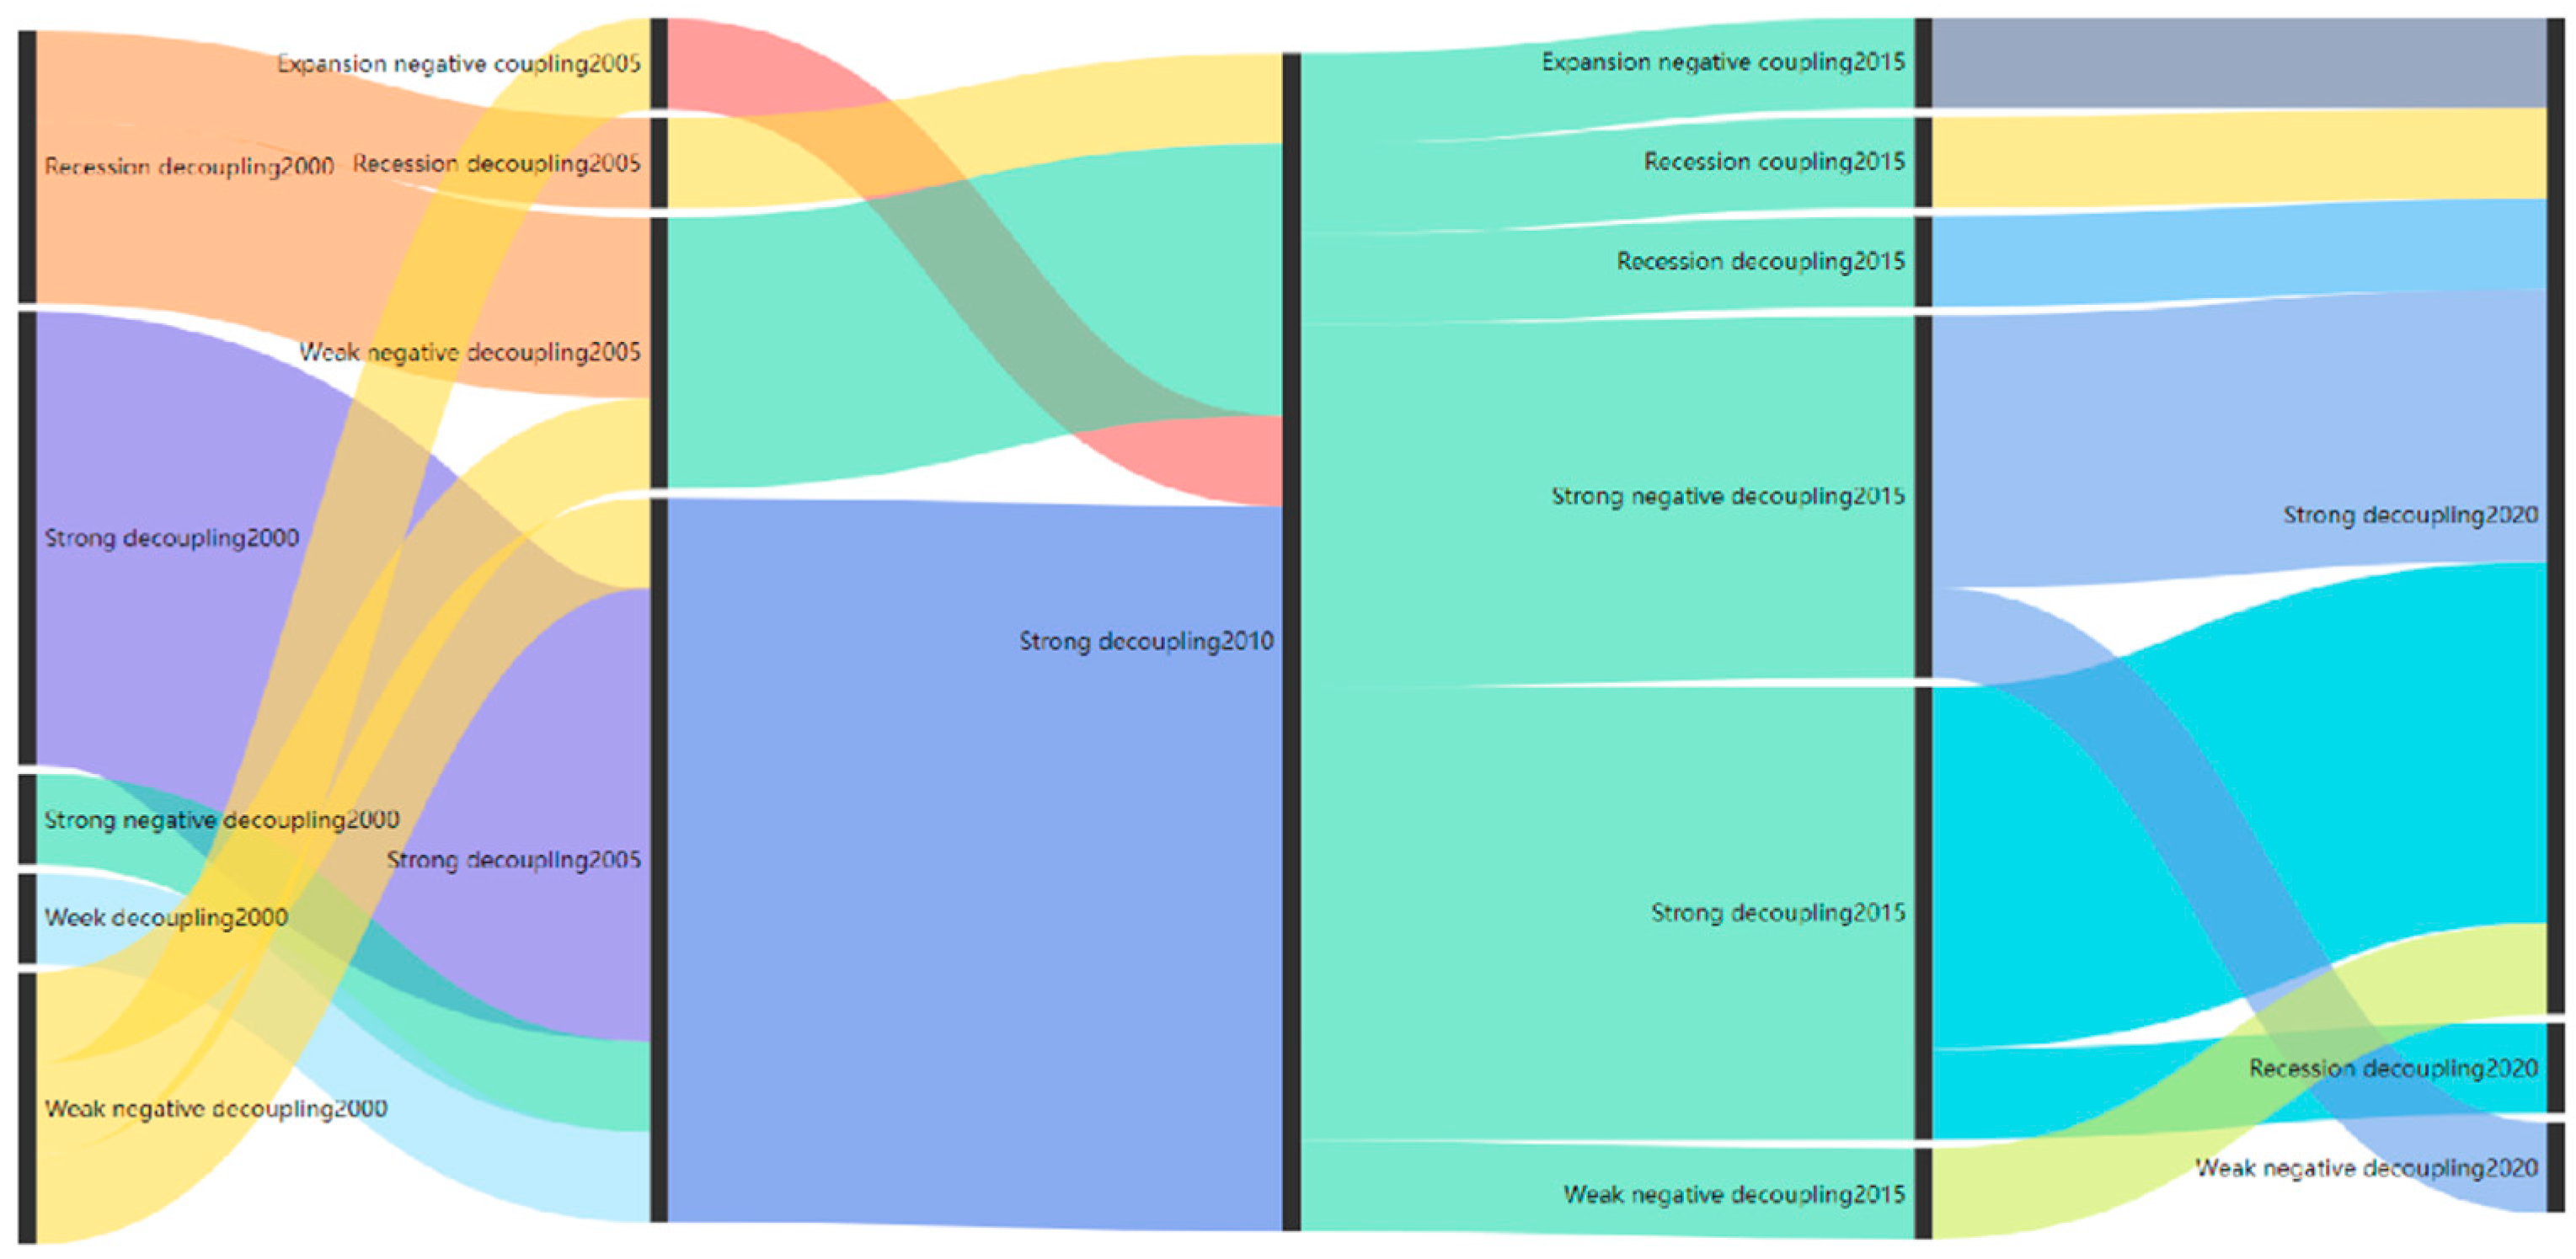
4.3. Decoupling of Agricultural Development and Agricultural Carbon Emissions Intensity

Table 4 shows the decoupling patterns between AD and ACEI in 13 prefecture-level cities in the Beijing-Tianjin-Hebei region from 2000 to 2020. As can be seen, there were large gaps in the decoupling relationship between AD and ACEI in the Beijing-Tianjin-Hebei region between 2000 and 2020. Overall, most of the cities were in the state of the SD. The cities with the most years of the SD state included Baoding, Chengde, Tangshan and Qinhuangdao, which had kept the SD state for more than 15 years in the 20-year period, while standing in the states of ENC or RC in other years of the period. The cities with the next most years of the SD state included Tianjin, Shijiazhuang, Beijing, and Zhangjiakou, which had kept the SD state for more than 12 years in the 20-year period. The cities of Langfang, Cangzhou, Hengshui, Xingtai and Handan had kept the SD state for about 10 years in the 20-year period. In terms of years, most of the cities were in the decoupling state during the period of 2003–2007, during the period of 2008–2011, and after 2018.
Figure 7 showcases the changes in the decoupling relationship between AD and ACEI in the Beijing-Tianjin-Hebei region for each five-year period. As observed, the decoupling relationship between AD and ACEI in the Beijing-Tianjin-Hebei region had experienced big changes. In 2000–2001, the relationship between AD and ACEI in the Beijing-Tianjin-Hebei region was complex, with five cities in the SD state, one in the WD state, three in the RD state, three in the WND state, and one in the SND state. In 2004–2005, eight cities were in the SD state, three in the WND state, one in the RD state, and one in the ENC state. In 2009–2010, all the 13 cities were in the SD state. In 2014–2015, five cities were in the SD state, one in the RD state, four in the SND state, one in the ENC state, and one in the RC state. In 2019–2020, 11 cities were in the SD state, one in the RD state, and one in the SND state.
Figure 8 illustrates the changes in the decoupling types between AD and ACEI in the Beijing-Tianjin-Hebei region from 2000 to 2020. As can be seen, the main decoupling types in the Beijing-Tianjin-Hebei region are SD, RD, SND, WND, RC and ENC. From 2000 to 2005, seven cities kept their decoupling states unchanged, with five keeping the SD state, one keeping the WND state, and one keeping RD. Among the other cities, three changed their states from SND, WND and WD to SD; in the other three cities, two changed their states from RD to WND, and one changed from WND to ENC. From 2005 to 2010, all of the cities reached the SD state. From 2010 to 2015, five cities maintained the SD state, four changed their states to SND, and the remaining four cities transformed their states from SD to WND, RD, ENC and RC, respectively. By 2020, a total of 11 cities (84.6%) in the Beijing-Tianjin-Hebei region reached the state of SD. Although the decoupling relationship between AD and ACEI in the Beijing-Tianjin-Hebei region had long been in a dynamic change process, the overall change trend of the decoupling relationship is generally optimistic.

5. Discussion and Conclusions

5.1. Discussion

The primary problem and challenge in China’s low-carbon agricultural and rural development lie in reducing ACE while maintaining agricultural output. China has proposed a comprehensive “Implementation Plan for Emission Reduction and Carbon Sequestration in Agriculture and Rural Areas”, aimed at promoting synergistic development of high yields, productivity enhancements, and low-carbon practices. The plan facilitates the utilization of agroecological values, maximizes the substitutive role of renewable energy, enhances the resilience of AD, improves long-term incentives for low-carbon agriculture, and upgrades carbon-emission monitoring networks as well as the accounting and evaluation systems for emission reduction and carbon sequestration [1]. The findings of this study will assist the Beijing-Tianjin-Hebei region in accurately understanding the relationship between AD and ACE from strategic, operational, technological, and policy perspectives. This will further boost confidence in the comprehensive and coordinated implementation of stable grain production, emission reduction, and carbon sequestration goals, leading to concrete actions aligned with the critical directives for the development of ecological and low-carbon agriculture [2].
(1) To formulate tailored measures for AD and emission reduction based on local conditions. The Beijing-Tianjin-Hebei region comprises areas and cities with diverse natural conditions and social development patterns, resulting in varying AD and ACE situations. Each region should, according to its unique characteristics, accurately assess its current developmental challenges and future trends, and formulate a development strategy tailored to its needs [20]. When considering carbon emissions intensity, regions like Chengde, Qinhuangdao, and Tangshan exhibit a low ACE Index, indicating relatively less pressure to reduce agricultural carbon emissions. In contrast, areas like Handan and Cangzhou have a high ACEI, indicating a greater need to prioritize carbon emission reduction. Supervision of carbon reduction in high-emission areas should be strengthened. Most carbon emissions in the Beijing-Tianjin-Hebei region originate from livestock and poultry farming, especially the animal husbandry sector. Therefore, carbon reduction efforts should be prioritized in this sector. Future reduction efforts should focus on optimizing livestock and poultry manure management systems, fostering new breeds of livestock and poultry, and enhancing the overall low-carbon development of this farming sector. In regions like Handan and Shijiazhuang, where fertilizers, plowing, and other practices are major sources of ACE, the focus of reduction should be on implementing green agricultural practices, optimizing the use of agricultural materials, reducing the application of fertilizers, pesticides, agricultural films, and other chemicals, adopting low-carbon fertilizers and pesticides, substituting some fertilizers with organic alternatives, improving the utilization efficiency of fertilizers and pesticides, and minimizing agricultural waste.
(2) It is crucial to actively adjust the agricultural industry structure in the Beijing-Tianjin-Hebei region, which is currently dominated by animal husbandry and crop farming. Over the past two decades, the pace of agricultural structural adjustment has been slow, resulting in a disjointed cycle between planting and breeding. Furthermore, the ratio between grains, economic crops, and fodder crops is imbalanced, lacking proper synchronization between the planting and breeding sectors. Additionally, two major issues coexist: a decline in soil fertility and the inefficient utilization of manure from the animal husbandry sector. Crop residues are also not being utilized comprehensively. These factors have contributed significantly to the accumulation of ACE. Currently, the resource conditions in the Beijing-Tianjin-Hebei region are strained, with heavy metal contents in some arable lands exceeding safe standards, and groundwater being overexploited. It is imperative to address these issues to promote sustainable agricultural development in the region. Among the numerous challenges facing the Beijing-Tianjin-Hebei region, a prominent issue is the mismatched spatiotemporal distribution of agricultural production and water resources [9]. To address this, the region should pursue low-carbon agriculture based on its specific conditions while rationalizing the proportion of agriculture, forestry, animal husbandry, and fishery according to market demands. Guided by market forces and ensuring stable grain production, agricultural technology should be harnessed to promote the cultivation of new varieties of high-yield and low-pollution crops. Furthermore, the internal structure of the planting sector must be adjusted to select crop types rationally, thereby enhancing plant productivity and carbon sequestration capacity. Moreover, it is essential to leverage the comprehensive advantages of each area to facilitate a reasonable distribution of animal husbandry, aquaculture, and agricultural product processing industries. This approach aims to accelerate the agricultural industrialization process in the Beijing-Tianjin-Hebei region, fostering sustainable development and environmental resilience.
(3) To strengthen agricultural technology innovation under regional collaboration, it is imperative to recognize its pivotal role in elevating the level of agricultural modernization and achieving the low-carbon transformation of agriculture [8]. Modern science and technology should be harnessed to foster the development of agricultural mechanization, intelligence, and digitalization. To expedite the process of agricultural modernization and large-scale transformation, several key measures should be taken: Firstly, boosting the penetration rate of agricultural machinery will mechanize farming practices, enhancing efficiency and productivity. Secondly, strengthening agricultural information management through data analytics and precision agriculture techniques will enable smarter decision-making, resource allocation, and disease prevention. Lastly, perfecting the “Internet+” agricultural industry system by integrating digital technologies into all aspects of agriculture will enable farmers to access timely market information, enhance supply chain transparency, and reduce waste. These measures, among others, will contribute significantly to the advancement of agricultural technology innovation and its positive impact on the Beijing-Tianjin-Hebei region. To reduce reliance on traditional fossil fuels, it is essential to prioritize the development and utilization of new, clean energy sources. This includes promoting and expanding the use of existing clean energy technologies such as biogas, solar energy, and wind energy. By doing so, we can significantly reduce greenhouse gas emissions stemming from agricultural energy consumption, thereby enhancing carbon emission efficiency [13]. Given the significant internal disparities within the Beijing-Tianjin-Hebei region, it is crucial to develop advantageous industries tailored to local conditions while also establishing robust inter-regional cooperation mechanisms. Through industrial linkages, project collaborations, and technical exchanges, we can learn from the experiences of advanced regions in agricultural industrialization and large-scale development. This approach will facilitate green and high-quality growth in the agriculture sector of the Beijing-Tianjin-Hebei region. Maintaining the current state of SD decoupling is vital. We must enhance emission reduction and carbon sequestration capabilities in terms of WD to achieve a sustainable development state in AD and ACE in the Beijing-Tianjin-Hebei region. This is imperative to delivering on China’s carbon peak and carbon neutrality goals.

5.2. Conclusions

As the basic industry supporting the national economy in China, agriculture is an important guarantee of national security. AD is related to people’s well-being, and ACE is a fundamental and survival-related emission. Therefore, it is worth exploring how to ensure a stable and safe supply of food and other important agricultural produce at a low level of ACEI. Based on assessing AD and calculating ACEQ and ACEI, this study uses a decoupling model to analyze the relationships between AD and ACEI in the Beijing-Tianjin-Hebei region in the period from 2000 to 2020. Its main conclusions are as follows: (1) from 2000 to 2020, AD in the Beijing-Tianjin-Hebei region generally presented a gradual improvement trend, with a feature that the northern areas performed generally better than the southern ones. (2) From 2000 to 2020, ACEQ in the Beijing-Tianjin-Hebei region showcased a trend of first increasing and then decreasing, with a spatial distribution feature that the southern cities performed better than the northern ones. As to the ACE sources, livestock and poultry farming took the highest proportion. ACEI was decreased year by year. (3) The main decoupling types in the Beijing-Tianjin-Hebei region were SD, RD, SND, WND, RC, and ENC. The decoupling relationship between AD and ACE in the Beijing-Tianjin-Hebei region had been in a dynamic change process, but with an optimistic changing trend of the decoupling relationship. Overall, AD in the Beijing-Tianjin-Hebei region was gradually improved; ACEQ and ACEI generally showed a declining trend, and the decoupling relationship between the two gradually developed towards the optimism direction, manifesting the SD state step by step. From 2000 to 2020, the Beijing-Tianjin-Hebei region had implemented a series of policies, measures and special actions to stabilize agricultural production. These measures and actions delivered a significant synergistic effect for boosting agricultural production and curbing agricultural carbon emissions. Nevertheless, large gaps in AD and ACE were observed in the Beijing-Tianjin-Hebei region, so corresponding measures to diminish agricultural carbon emissions shall be formulated based on different regional characteristics.

Author Contributions

X.T.: conceptualization, methodology, software, visualization, and writing—original draft. H.H.: data curation, software, and formal analysis. L.L.: software, validation, visualization, funding acquisition, and writing—review and editing. H.W.: data curation, formal analysis, and writing—original draft. All authors have read and agreed to the published version of the manuscript.

Funding

This research was funded by Beijing Industrial Economy and Policy Innovation Team (BAIC11) and the National Key R&D Program of China (2022YFC3802805).

Data Availability Statement

The data used have been explained in this paper.

Conflicts of Interest

The authors declare that they have no known competing financial interests or personal relationships that could have appeared to influence the work reported in this paper.

References

  1. Fang, J.Y.; Zhu, J.L.; Wang, S.P.; Yue, C.; Shen, H.H. Global warming, human-induced carbon emissions, and their uncertainties. Sci. China Earth Sci. 2011, 54, 11. [Google Scholar] [CrossRef]
  2. Zhang, J.B.; He, K. Research on low-carbon development of agriculture under the “dual carbon” goal: Current situation, misconceptions, and prospects. Agric. Econ. Issues 2022, 513, 12. [Google Scholar]
  3. Cai, B.F.; Zhu, S.L.; Yu, S.M.; Dong, H.M.; Zhang, C.Y.; Wang, C.K. Interpretation of ‘IPCC 2006 National Greenhouse Gas Inventories Guidelines 2019 Revision’. Environ. Eng. 2019, 37, 11. [Google Scholar]
  4. Tian, S.; Wang, S.; Bai, X.; Luo, G.; Li, Q.; Yang, Y. Global patterns and changes of carbon emissions from land use during 1992–2015. Environ. Sci. Ecotechnol. 2021, 7, 100108. [Google Scholar] [CrossRef] [PubMed]
  5. Li, S.L.; Wang, Z.Z. The Effects of Agricultural Technology Progress on Agricultural Carbon Emission and Carbon Sink in China. Agriculture 2023, 13, 793. [Google Scholar] [CrossRef]
  6. Grossman, G.M.; Krueger, A.B. Environmental impacts of a north American free trade agreement. CEPR Discuss. Pap. 1992, 8, 223–250. [Google Scholar]
  7. Vleeshouwers, L.M.; Verhagen, A. Carbon emission and sequestration by agricultural land use: A model study for Europe. Glob. Chang. Biol. 2010, 8, 519–530. [Google Scholar] [CrossRef]
  8. Johnson, M.F.; Franzluebbers, A.J.; Weyers, S.L.; Reicosky, D.C. Agricultural opportunities to mitigate greenhouse gas emissions. Environ. Pollut. 2007, 150, 107–124. [Google Scholar] [CrossRef]
  9. Li, K.; Zhang, H.; Shi, L. An empirical test of the spatial spillover effect of agricultural scientific and technological progress on agricultural carbon emissions. Stat. Decis. Mak. 2023, 39, 52–57. [Google Scholar]
  10. Mohanad, I.; Fathi, S.; Amine, M.B. Agricultural technologies and carbon emissions: Evidence from Jordanian economy. Environ. Sci. Pollut. Res. Int. 2018, 25, 10867–10877. [Google Scholar]
  11. Arun, K.C.; Tek, B.S.; Sofina, M.; Noufa, C.K.; Paresh, S. Agricultural emissions reduction potential by improving technical efficiency in crop production. Agric. Syst. 2023, 207, 103620. [Google Scholar]
  12. Wang, M.; Feng, C. Decoupling economic growth from carbon dioxide emissions in China’s metal industrial sectors: A technological and efficiency perspective. Sci. Total Environ. 2019, 691, 1173–1181. [Google Scholar] [CrossRef] [PubMed]
  13. Yang, Q.L.; Zhao, R.Q.; Hu, Y.M.; Xiao, L.G.; Xie, Z.X.; Chuai, X.W.; Xie, Y.K. The spatio-temporal coupling relationship between economic and social factors and carbon emission in Beijing-Tianjin-Hebei region. J. Ecol. 2023, 43, 3458–3472. [Google Scholar]
  14. Mosier, A.R.; Duxbury, J.M.; Freney, J.R.; Heinemeyer, O.; Minami, K.; Johnson, D.E. Mitigating agricultural emissions of methane. Clim. Chang. 1998, 40, 39–80. [Google Scholar] [CrossRef]
  15. He, H.S.; Fu, B.J. Research on agricultural carbon emission measurement and emission reduction pressure in major grain producing areas in China. Eco-Economy 2019, 35, 99–104. [Google Scholar]
  16. Fan, Z.Y.; Qi, X.B.; Zeng, L.L.; Wu, F. Accounting of greenhouse gas emissions in China’s agricultural system in the past 40 years. Chin. J. Ecol. 2022, 42, 9470–9482. [Google Scholar]
  17. Yin, M.H.; Tian YLu, Y.H. Regional differences and spatial differentiation mechanism of agricultural carbon emissions in China. Reform 2023, 10, 130–145. [Google Scholar]
  18. Monchuk, D.C.; Chen, Z.; Bonaparte, Y. Explaining production inefficiency in China’s agriculture using data envelopment analysis and semi-parametric bootstrapping. Soc. Sci. Electron. Publ. 2010, 21, 346–354. [Google Scholar] [CrossRef]
  19. Zhang, L.; Pang, J.; Chen, X.; Lu, Z. Carbon emissions, energy consumption and economic growth: Evidence from the agricultural sector of China’s main grain-producing areas. Sci. Total Environ. 2019, 665, 1017–1025. [Google Scholar] [CrossRef]
  20. Ahmed, K.M.; Noshaba, A.; Tan, Z.X.; Yang, S.X.; Kashif, R.A.; Kong, R. Green growth of cereal food production under the constraints of agricultural carbon emissions: A new insights from ARDL and VECM models. Sustain. Energy Technol. Assess. 2021, 47, 101452. [Google Scholar]
  21. Dumont, B.; Ryschawy, J.; Duru, M.; Benoit, M.; Chatellier, V.; Delaby, L. Review: Associations among goods, impacts and ecosystem services provided by livestock farming. Anim. Int. J. Anim. Biosci. 2019, 13, 1773–1784. [Google Scholar] [CrossRef] [PubMed]
  22. René, V.; Stehfest, E.; Woltjer, G.; Eickhout, B. The effect of agricultural trade liberalization on land-use related greenhouse gas emissions. Glob. Environ. Chang. 2009, 19, 434–446. [Google Scholar]
  23. Balogh, J.M. The impacts of agricultural subsidies of Common Agricultural Policy on agricultural emissions: The case of the European Union. Agric. Econ. 2023, 69, 140–150. [Google Scholar] [CrossRef]
  24. Fortune, G. The influence of agricultural policy on carbon emissions in selected OECD countries. Heliyon 2023, 9, e19881. [Google Scholar]
  25. Baumann, M.; Gasparri, I.; María, P.R.; Pizarro, G.G.; Griffiths, P.; Hostert, P. Carbon emissions from agricultural expansion and intensification in the chaco. Glob. Chang. Biol. 2017, 23, 1092–1916. [Google Scholar] [CrossRef] [PubMed]
  26. Jaroslaw, J.; Ela, E. Impact of land consolidation on agricultural decarbonization: Estimation of changes in carbon dioxide emissions due to farm transport. Sci. Total Environ. 2023, 873, 162391. [Google Scholar]
  27. He, Y.Q.; Dai, X.W. Spatial and temporal characteristics of driving factors of agricultural carbon emissions in China. Resour. Sci. 2016, 38, 1780–1790. [Google Scholar]
  28. Zhao, Y. Analysis of influencing factors and prediction of trend of agricultural carbon emission in Jiangsu province. Agric. Resour. Reg. China 2018, 39, 97–102. [Google Scholar]
  29. Bai, F.C.; Gao, P.; Zheng, W.L. Spatio-temporal evolution and decoupling effect of farmland ecosystem carbon footprint in major grain-producing areas. Eco-Economy 2023, 39, 107–116. [Google Scholar]
  30. Xu, Y.; Wang, H.; Han, Q.F. Spatio-temporal characteristics of agricultural carbon emissions in Xuzhou and decoupling effects. Circ. Soil Water Conserv. 2023, 43, 395–403. [Google Scholar]
  31. Tian, Y.; Lin, Z.J. The coupling and coordination between agricultural carbon emission efficiency and economic growth in China’s provinces. Popul. Resour. Environ. China 2022, 32, 13–22. [Google Scholar]
  32. Yu, Z.H.; Mao, S.P. Analysis of the decoupling of China’s agricultural net carbon emissions from its economic growth. Popul. Resour. Environ. China 2022, 32, 30–42. [Google Scholar]
  33. FAO. The State of Food and Agriculture 2016: Climate Change, Agriculture and Food Security; United Nations: New York, NY, USA, 2016. [Google Scholar]
  34. Min, J.S.; Hu, H. Estimation of greenhouse gas emissions from agricultural production in China. Popul. Resour. Environ. China 2012, 22, 21–27. [Google Scholar]
  35. Xie, T.; Zhang, H.; Miao, J.; Song, M.W.; Zeng, Y.Q. Emission characteristics and source/sink analysis of greenhouse gases from farmland ecosystem in Hubei province. J. Agric. Resour. Environ. 2021, 38, 839–848. [Google Scholar]
  36. Ning, J.; Yang, N.; Du, G.M.; Sun, T.C.; Hu, M.J.; Wang, L. A Study on the Temporal and Spatial Evolution of Carbon Footprint in Regional Farmland Ecosystems: A Case Study of Heilongjiang Province. J. China Agric. Univ. 2023, 28, 98–112. [Google Scholar]
  37. Xu, W.H.; Xie, Y.L.; Xia, D.H.; Ji, L.; Huang, G.H. A multi-sectoral decomposition and decoupling analysis of carbon emissions in Guangdong province, China. J. Environ. Manag. 2021, 298, 113485. [Google Scholar] [CrossRef]
  38. Raza, M.Y.; Lin, B. Decoupling and mitigation potential analysis of CO2 emissions from pakistan’s transport sector. Sci. Total Environ. 2020, 730, 139000. [Google Scholar] [CrossRef]
  39. Xie, P.; Gao, S.; Sun, F. An analysis of the decoupling relationship between CO2 emission in power industry and GDP in China based on lmdi method. J. Clean. Prod. 2019, 211, 598–606. [Google Scholar] [CrossRef]
  40. Tapio, P. Towards a theory of decoupling: Degrees of decoupling in the EU and the case of road traffic in Finland between 1970 and 2001. Transp. Policy 2005, 12, 137–151. [Google Scholar] [CrossRef]
Figure 1. Study area.
Land 13 00839 g001
Figure 2. Mutual coupling mechanism between agricultural development and agricultural carbon emissions.
Land 13 00839 g002
Figure 3. Research technical route.
Land 13 00839 g003
Figure 4. Agricultural development in the Beijing-Tianjin-Hebei region from 2000 to 2020.
Land 13 00839 g004
Figure 5. Agricultural carbon emissions and emission sources in the Beijing-Tianjin-Hebei region from 2000 to 2020.
Land 13 00839 g005
Figure 6. Agricultural carbon emissions intensity in Beijing-Tianjin-Hebei region from 2000 to 2020.
Land 13 00839 g006
Figure 7. Decoupling patterns between agricultural development and agricultural carbon emissions intensity in Beijing-Tianjin-Hebei region from 2000 to 2020.
Land 13 00839 g007
Figure 8. Decoupling patterns between agricultural development and agricultural carbon emissions intensity in Beijing-Tianjin-Hebei region from 2000 to 2020.
Land 13 00839 g008
Table 1. Index system and weight of agricultural development in Beijing-Tianjin-Hebei region.
Agricultural DevelopmentIndexCalculational MethodWeight
Per capita agricultural output valuePer capita output value of agriculture, forestry, animal husbandry and fisheryTotal output value of agriculture, forestry, animal husbandry and fishery/Total Agricultural Population0.35
Average agricultural output value per landGross agricultural output per capitaTotal agricultural output value/Total area of agricultural land0.30
Farmer income levelNet income of the primary industry per capitaNet income of the primary industry/Total Agricultural Population0.25
Growth in agricultural output valueGrowth rate of total output value of agriculture, forestry, animal husbandry and fisheryIncrease in total output value of agriculture, forestry, animal husbandry, and fishery/Total output value of agriculture, forestry, animal husbandry and fishery in the previous year0.10
Table 2. Carbon emission coefficients of each carbon emission type.
Carbon SourceCarbon Emission FactorCarbon SourceCarbon Emission Factor
Agricultural land useNitrogenous fertilizer2.10 kg/kgLivestock and poultry farmingMilk cow653.93 kg/head
Phosphate fertilizer0.64 kg/kgYellow cow445.92 kg/head
Potash fertilizer0.18 kg/kgBuffalo497.49 kg/head
Compound fertilizer1.77 kg/kgSheep61.99 kg/head
Pesticide4.93 kg/kgPig43.48 kg/head
Plastic sheeting5.18 kg/kgHorse246.85 kg/head
Agricultural machinery diesel0.59 kg/kgDonkey187.27 kg/head
Agricultural irrigation266.48 kg/km2Mule187.27 kg/head
Ploughing312.60 kg/hm2Camel439.65 kg/head
RiceRice1045.12 kg/hm2Rabbit3.9 kg/head
Fowl1.76 kg/head
Table 3. Decoupling status and decoupling indicator range of agricultural development and agricultural carbon emissions intensity.
Decoupling State∆AG∆ACEITn+1Decoupling StateCode
Strong Decoupling>0<0<0AD increase and ACEI decreaseSD
Recession decoupling<0<0>1.2The decline rate of AD is greater than the increase rate of ACEIRD
Recession coupling<0<00.8 < T < 1.2AD and ACEI synchronous reductionRC
Weak negative decoupling<0<00 < T < 0.8AD reduction speed is smaller than ACEI WND
Strong negative decoupling <0>0<0AD decrease and ACEI increaseSND
Expansion negative coupling>0>0>1.2The speed of AD increase is smaller than ACEIENC
Expansion coupling>0>00.8 < T < 1.2AD and ACEI synchronized improvementEC
Weak Decoupling>0>00 < T < 0.8AD increase speed is higher than ACEI WD
Table 4. Decoupling patterns between agricultural development and agricultural carbon emissions intensity in Beijing-Tianjin-Hebei region from 2000 to 2020.
YearBeijingTianjinBaodingTangshanShijiazhuangLangfangQinhuangaoZhangjiakouChengdeCangzhouHengshuiXingtaiHandan
2000–2001WDWNDSDDSDSDSDSNDSDRDRDRDWND
2001–2002WDSNDSDWDENCSNDRDSDWNDWNDSDSDSD
2002–2003ENCSDSNDWDSDSDSNDWNDSDSDSDSDSND
2003–2004SDSNDSDSDSDSNDSDSDSDSDSNDSDSD
2004–2005SDSDSDENCSDSDSDSDSDWNDWNDRDWND
2005–2006SDSDSDSDSDSDSDSDSDSDSDSDSD
2006–2007SDSDSDSDRDSNDSDWNDSDSDSDSDSD
2007–2008SDWDECSDSDWNDSDRDSDSDSDRDWND
2008–2009SDSDSDSDSNDSDSDWNDWNDRDRDWDSD
2009–2010SDSDSDSDSDSDSDSDSDSDSDSDSD
2010–2011SDSDSDSDSDSDSDWNDSDSDSDSDWND
2011–2012SDSDSDENCSDSDSDSDSDRDSDWNDSD
2012–2013SDSDSDSDSDWDSDSDSDSNDRDSNDRD
2013–2014WNDSDSDSDSNDWNDRDWDSDRDSDSDSND
2014–2015RCSDENCSDSNDSDRDSNDSNDSDSNDWNDSD
2015–2016SNDSNDSDSDSNDWNDSDRCRDWNDWNDSNDSD
2016–2017SDRDSDSNDSDWDRDWNDSDSDWDSNDSD
2017–2018WNDSDSNDSDSDSNDSDENCSDSDRDSDWND
2018–2019SNDSDSDSDSDSDSDSDSDWNDSDRDSND
2019–2020SDSDSDSDWNDRDSDSDSDSDSDSDSD
Disclaimer/Publisher’s Note: The statements, opinions and data contained in all publications are solely those of the individual author(s) and contributor(s) and not of MDPI and/or the editor(s). MDPI and/or the editor(s) disclaim responsibility for any injury to people or property resulting from any ideas, methods, instructions or products referred to in the content.

