Article

Dynamic Integrated Ecological Assessment along the Corridor of the Sichuan–Tibet Railway

by
Cuicui Ji
1,2,3,4,
Hengcong Yang
1,*,
Xiangjun Pei
2,3,*,
Xiaochao Zhang
3,
Lichuan Chen
4,
Dan Liang
4,
Yiming Cao
1,
Jianping Pan
1 and
Maolin Chen
1
1
School of Smart City, Chongqing Jiaotong University, Chongqing 400074, China
2
State Key Laboratory of Geohazard Prevention and Geo-Environment, Chengdu University of Technology, Chengdu 610059, China
3
State Environmental Protection Key Laboratory of Synergetic Control and Joint Remediation for Soil & Water Pollution, Chengdu University of Technology, Chengdu 610059, China
4
Chongqing Institute of Geology and Mineral Resources, Chongqing 400042, China
*
Authors to whom correspondence should be addressed.
Land 2024, 13(6), 857; https://doi.org/10.3390/land13060857
Submission received: 3 June 2024 / Revised: 12 June 2024 / Accepted: 12 June 2024 / Published: 14 June 2024
(This article belongs to the Special Issue Land Degradation and Soil Mapping)

Abstract

:
Engineering activities along the Sichuan–Tibet Railway (STR) could cause land degradation and threaten the surrounding ecological security. It is crucial to evaluate the integrated land ecology during and after the construction of this project. This study assesses the land ecology along the STR corridor from 2000 to 2022 using a transfer matrix, the analytic hierarchy process (AHP), and the PSR-TOPSIS model. The main results are as follows: (1) The novel comprehensive ecological assessment process including nine indicators is feasible. (2) The high-quality land ecological, surface vegetation, and environmental regions were concentrated in Ya’an and Nyingchi, whereas the low-quality regions were situated in Qamdo and Garze Tibetan Autonomous Prefecture. (3) There was an overall decline in the integrated land ecological quality along the STR from 2000 to 2022. While it steadily improved in the Ya’an and Nyingchi regions from 2010 to 2022, it continued to decline around the Qamdo region. (4) The most degraded land-use type during the 22 years was grassland, and farmland was the most secure land-use type. Overall, spatial analyses and examinations of residue disposal sites suggested that these locations have negatively impacted integrated land ecology since the beginning of the STR construction project. Our findings have implications for preserving the ecological ecosystem and ensuring the sustainability of the STR construction project.

1. Introduction

An ecological quality assessment is a comprehensive analysis of ecosystem health and functioning, covering various ecological elements and their interactions, and reflecting the overall suitability and sustainability of ecosystems [1]. It includes not only the ecological quality of the land but also an evaluation of aspects such as water bodies, air quality, biodiversity, and ecological service functions [2,3,4]. However, engineering construction and human activities have increased environmental pressures in the eco-fragile Qinghai–Tibet Plateau region, exposing its ecological systems to multiple threats, such as climate change, land use change, biodiversity loss, resource overexploitation, and soil degradation [5,6,7,8]. Ecological quality assessments help us to understand the overall condition of ecosystems and provide a scientific foundation for environmental protection and resource management.
Launched in 2020, the large-scale Sichuan–Tibet Railway (STR) construction project encompasses two provincial-level administrative areas, Sichuan and Tibet. The construction of the railroad will significantly boost resource development in Sichuan and Tibet and offer substantial support for regional industrial growth. Simultaneously, the inauguration of the railroad will usher in significant changes for the residents of cities along the route, leading to considerable improvements in urban infrastructure and living standards. The entire railroad line, encompassing bridges, tunnels, and flat tracks, traverses a diverse array of soil and ecosystem types, such as tundra, woodland, scrub, and grassland. However, due to its location in the rapidly changing topography of the eastern Qinghai–Tibet Plateau, characterized by frequent plate collisions and tectonic activities giving rise to complex geological structures and frequent earthquakes, there is a heightened risk of geological hazards along the railroad line [9]. This presents significant challenges for the planning and construction of the project [10]. At the same time, due to the arid environment and delicate ecology, the region is one of China’s locations with particularly significant land degradation [11]. It is imperative to conduct regular evaluation of the land’s ecological quality along the STR.
Research into the area of integrated land ecological evaluation began in the nineteenth century, with the introduction of theories such as mineral nutrient theory, land nutrient theory, and the principle of designing in harmony with nature [12,13,14]. Currently, land ecological evaluation focuses on several aspects, including land degradation evaluation, land suitability evaluation, land quality evaluation, land ecological security evaluation, and land resource evaluation. The integrated land ecological assessment focuses on the construction of the evaluation indicator system. There are three types of indicator systems, which are improved based on the FAO “Sustainable Land Use Evaluation Framework” [15], established based on the “Pressure-State-Response (PSR)” model [16,17,18,19], and constructed based on the “Economy-Environment-Society” model [20]. The main research methods include the composite index method [21], the ideal point method [22], the ecological footprint model [23], and the neural network method [24]. For instance, Hamad and Surucu [25] employed the composite index method and the MEDALUS model to identify 14 environmentally sensitive areas prone to desertification in the Hari region of northern Iraq. Moisa et al. [26] selected slope, land use and land cover, soil texture, land surface temperature, and precipitation as the evaluation indicators. They employed the AHP to calculate the land suitability composite index and then completed an evaluation of the moringa cultivation in the Dhidhessa watershed of Abay basin, Ethiopia. Alwan and Aziz [27] monitored the ecological changes in the surface of the Al-Hawizeh marshes in southern Iraq with a remote sensing ecological index (RSEI). Akadiri et al. [28] examined the impact of the ecological footprint on environmental degradation in the United States over the period of 1960–2016 and showed that the ecological footprint exacerbated environmental degradation. Wolfslehner et al. [29] combined sustainable forest management (SFM) indicators with the PSR framework to evaluate SFM strategies in the North-Eastern Limestone Alps in Austria. Aytun et al. [30] used the classified ecological footprint method to link the environmental quality, human capital, financial development, and technological innovation of middle-income countries, providing solutions for improving the environmental quality of these countries.
In this study, we evaluate the land ecology along the STR from 2000 to 2022 by analyzing changes in the four aspects of land use/land cover, surface vegetation, environment, and land ecological security, with the indicators being land use/land cover (LULC), gross primary productivity (GPP), net primary productivity (NPP), normalized vegetation index (NDVI), leaf area index (LAI), land surface temperature (LST), wetness (WET), evapotranspiration and transpiration (ET), and precipitation (PRE).
Overall, this study’s aims are (1) to investigate the integrated land ecological distribution along the STR, (2) to explore the integrated land ecological changes along the STR from 2000 to 2022, and (3) to provide references for the sustainability of the STR construction project as well as land ecological environment protection and restoration.

2. Study Area and Datasets
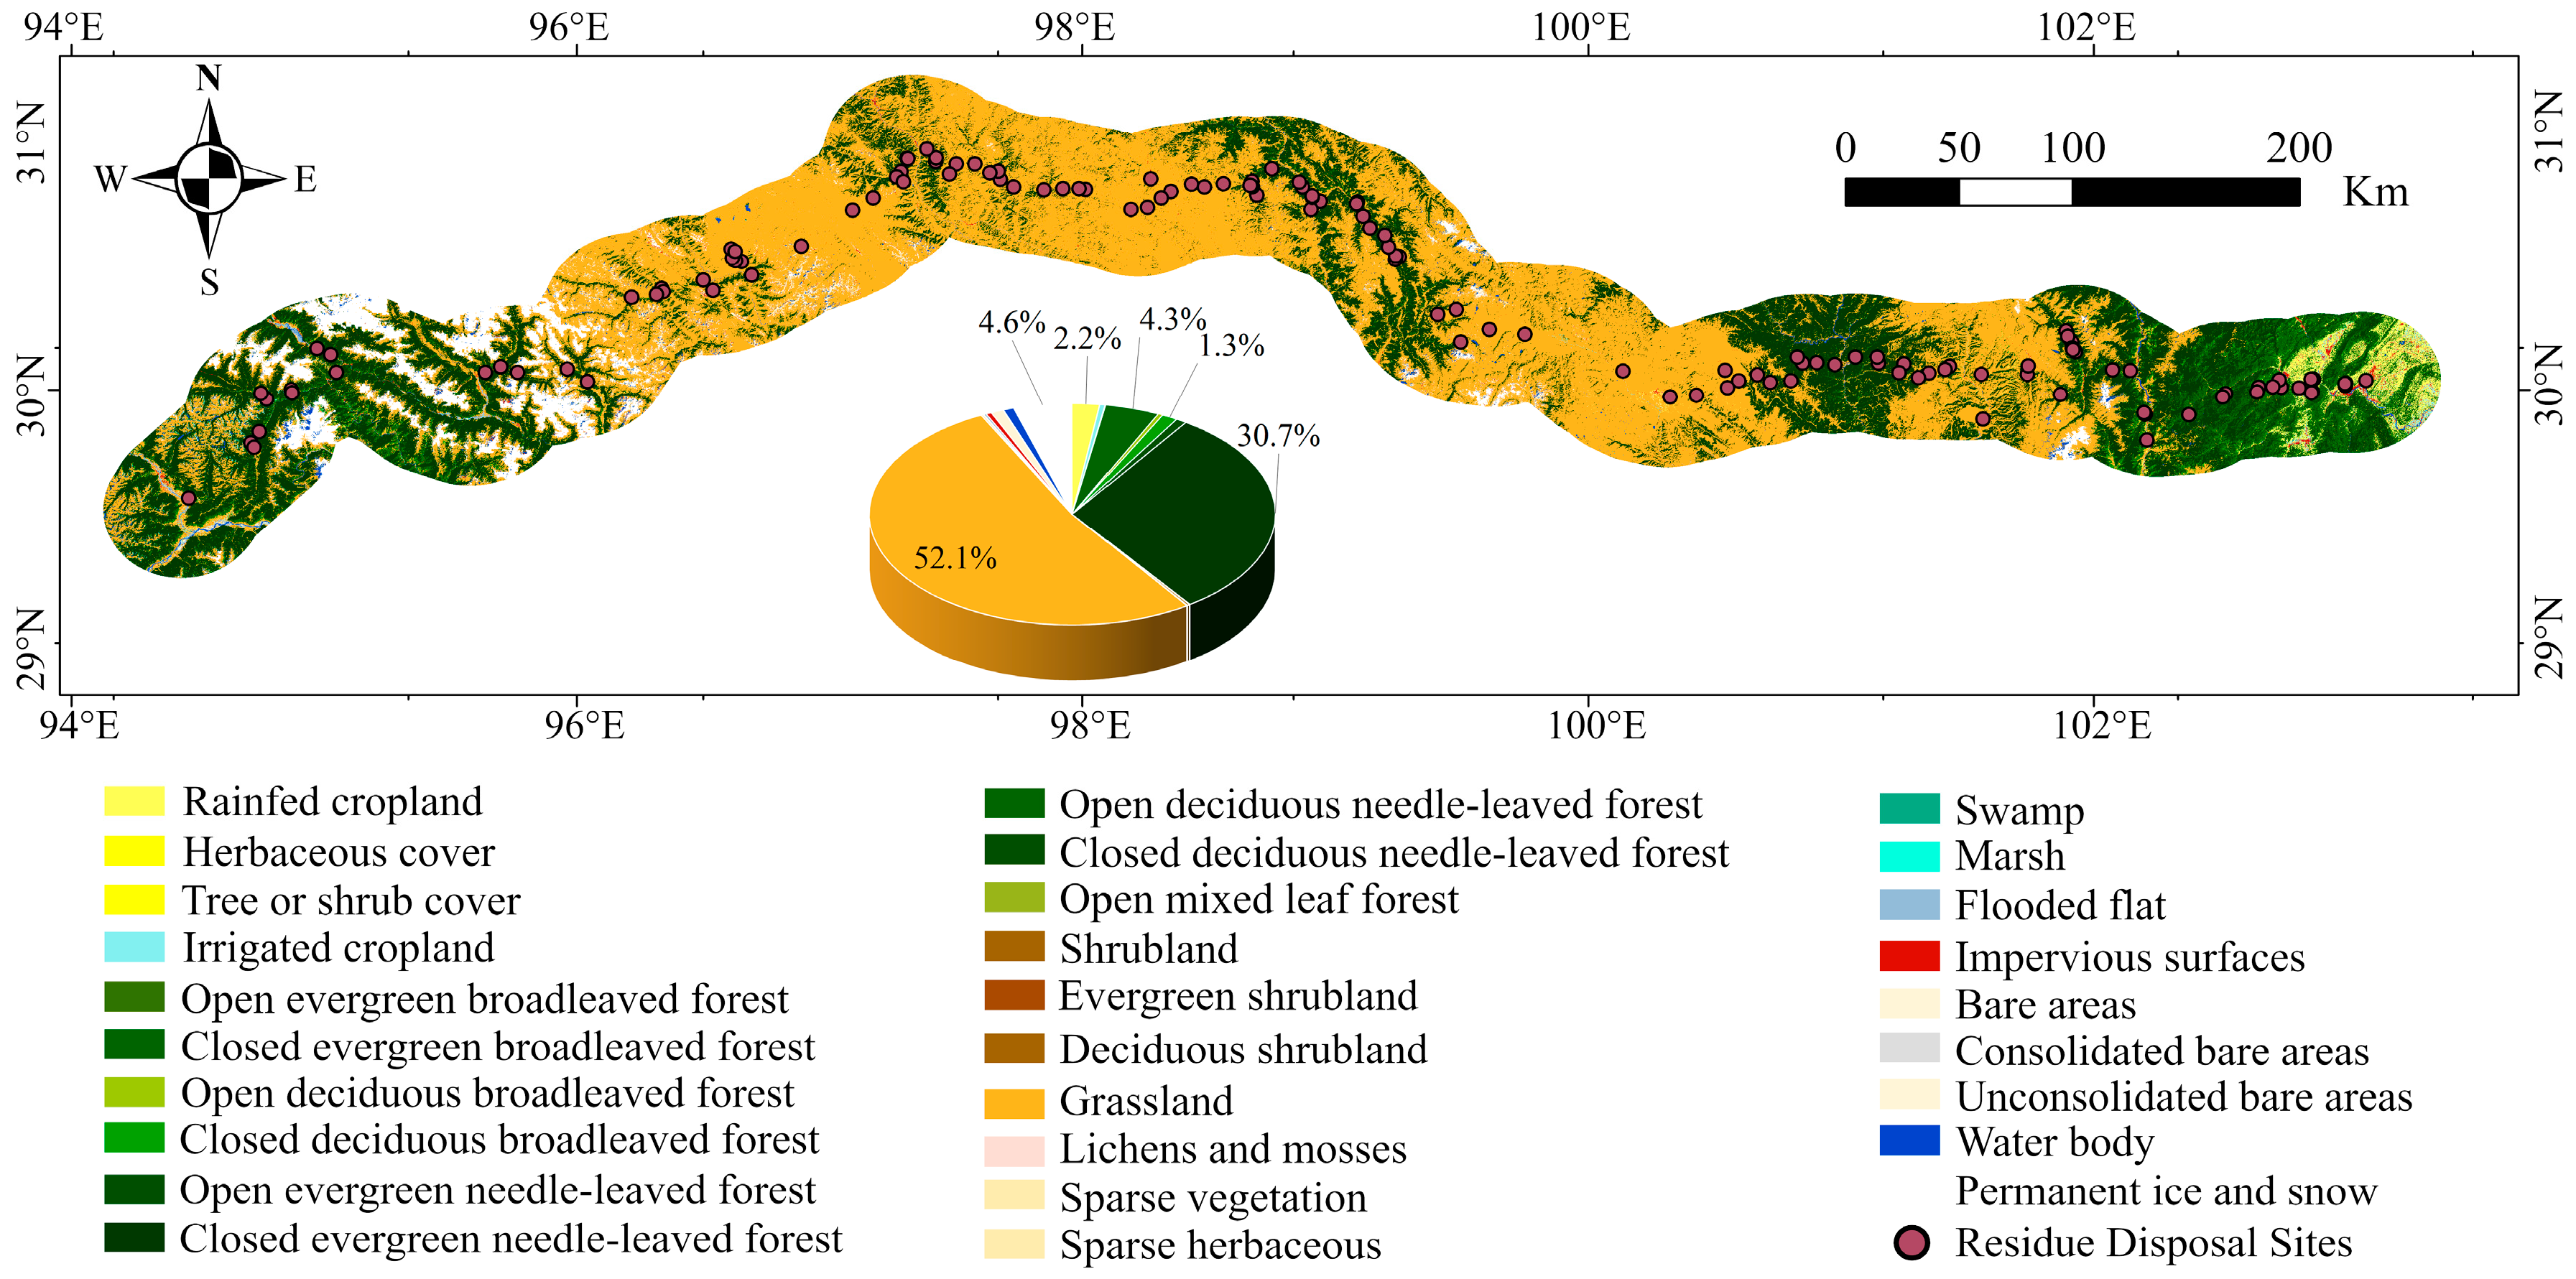
2.1. Study Area

The STR starts in Sichuan province and terminates in the Tibet Autonomous Region. The railway ranges from 94°13′ to 103°38′ longitude, with a total length of approximately 1000 km (Figure 1). The STR contains 26 counties, including 16 in Sichuan and 10 in the Tibet Autonomous Region. The average annual precipitation is 40 to 160 mm, the average annual maximum temperature is 30 °C, and the average annual minimum temperature is −14 °C [31]. The climate along the railway is characterized by a plateau temperate monsoon with semi-humid and semi-arid conditions. This region’s vegetation is overwhelmingly made up of coniferous woods, highland meadows, and shrublands [32]. The STR, a key railroad project connecting Sichuan and Tibet, has caused serious damage to the land ecosystem, which is already degraded due to climate change, overgrazing, and excessive logging. Since the inception of the STR construction project in 2020, the land ecology of the region has suffered further deterioration [11,31].

2.2. Data Source and Processing
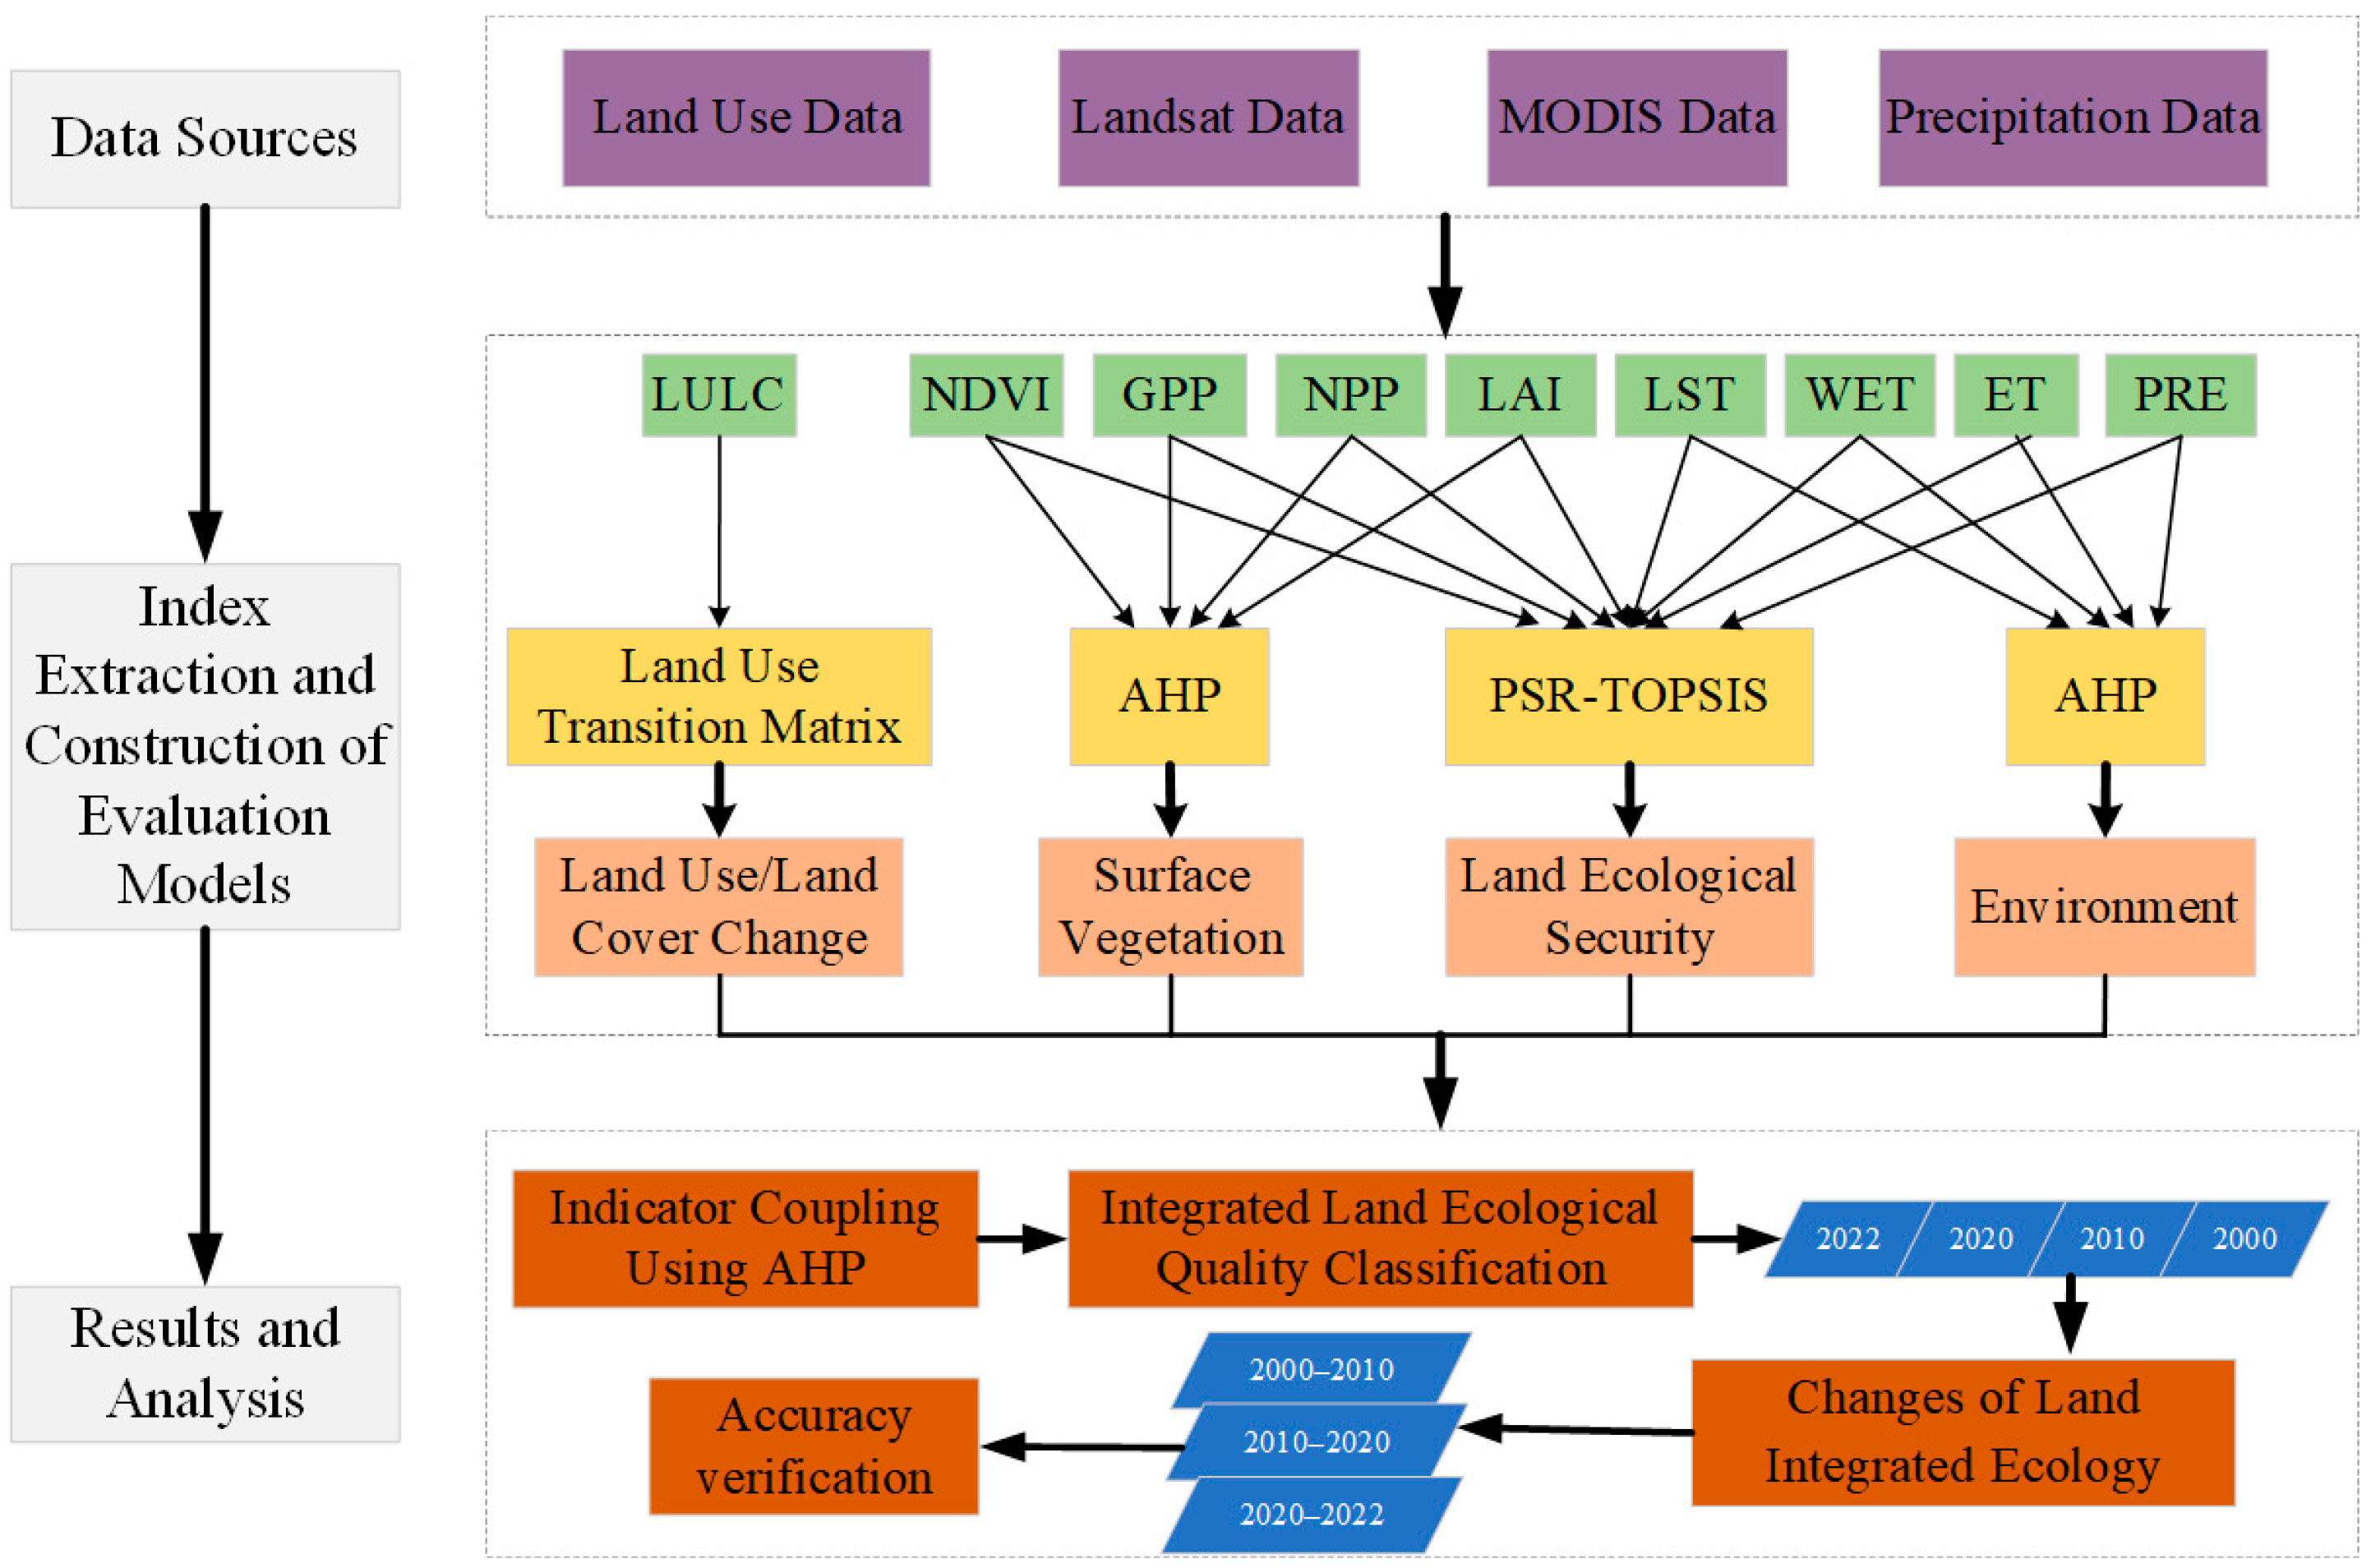
For our research, we employed the China Land Cover Dataset (CLCD) as a source of land use data, covering four periods: 2000, 2010, 2020, and 2022 (https://zenodo.org/records/8176941 (accessed on 6 April 2023)). This dataset is the first Landsat-derived annual land cover product of China from 1985 to 2022 [33]. The CLCD has a resolution of 30 m, and it can be categorized into nine types: cropland, forest, shrub, grassland, water, snow/ice, barren, impervious, and wetland. Additionally, our precipitation data were obtained from A Big Earth Data Platform for Three Poles (https://poles.tpdc.ac.cn/en/ (accessed on 23 April 2023)). This dataset has a temporal resolution of 30 days and a spatial resolution of 0.5° to 1°. Using tools available in ArcGIS Pro3.0, we calculated the annual precipitation data for the study area for the years 2000, 2010, 2020, and 2022.
For the NDVI and WET data, we utilized Landsat 5 surface reflectance (SR) and Landsat 8 SR images for the years 2000, 2010, 2020, and 2022. These images, sourced from the United States Geological Survey (USGS), were downloaded from the Google Earth Engine (GEE) platform (https://earthengine.google.com (accessed on 6 March 2023)). After acquiring these images, we used the raster calculator in ENVI 5.3, employing Equations (1) and (2), to derive the NDVI and WET data [34,35]. Moreover, for the remaining indicators, including GPP, NPP, LAI, ET, and LST, as introduced in Table 1, we relied on MODIS series data. These datasets were already processed and were generated at 8-day intervals or daily, having a spatial resolution of either 500 m or 1000 m. These datasets were obtainable via the GEE platform.
N D V I = ρ N I R ρ R e d ρ N I R + ρ R e d
W E T = 0.1509 ρ B l u e + 0.1973 ρ G r e e n + 0.3279 ρ R e d + 0.3406 ρ N I R 0.7112 ρ S W I R 1 0.4572 ρ S W I R 2  
where ρ B l u e means reflectance of bule band, ρ G r e e n means reflectance of green band, ρ R e d means reflectance of red band, ρ N I R means reflectance of near-infrared band, ρ S W I R 1 means reflectance of shortwave infrared 1 band. ρ S W I R 2 means reflectance of shortwave infrared 2 band.

3. Methods

The study was conducted with the following three steps (Figure 2):
Step 1: Establishing the integrated ecological evaluation system. Evaluation indicators were selected from the land degradation, land suitability, land resources, land quality, and land ecological security evaluation indicator systems.
Step 2: Analyzing changes in the four aspects of land use/land cover, surface vegetation, environment, and land ecological security based on the land use transfer matrix, hierarchical analysis, and PSR-TOPSIS, then mapping the integrated land ecological distribution with the hierarchical analysis method coupled with these four aspects.
Step 3: Conducting an analysis of the integrated land ecology along the STR from a temporal and a spatial perspective.

3.1. Land Ecological Evaluation System Establishment

The land ecological evaluation system involves multiple areas, including land ecological security, land suitability, land ecological quality, and other relevant areas [36]. Therefore, by referencing the research findings of other scholars [37,38,39], we decided to select reliable indicators in these areas to establish a complete and reliable land ecological evaluation system. We selected nine indicator factors: LULC, GPP, NPP, NDVI, LAI, LST, WET, ET, and PRE. We analyzed changes in land use/land cover, surface vegetation, environment, and land ecological security in the study area, and finally evaluated the land ecology along the STR from 2000 to 2022.

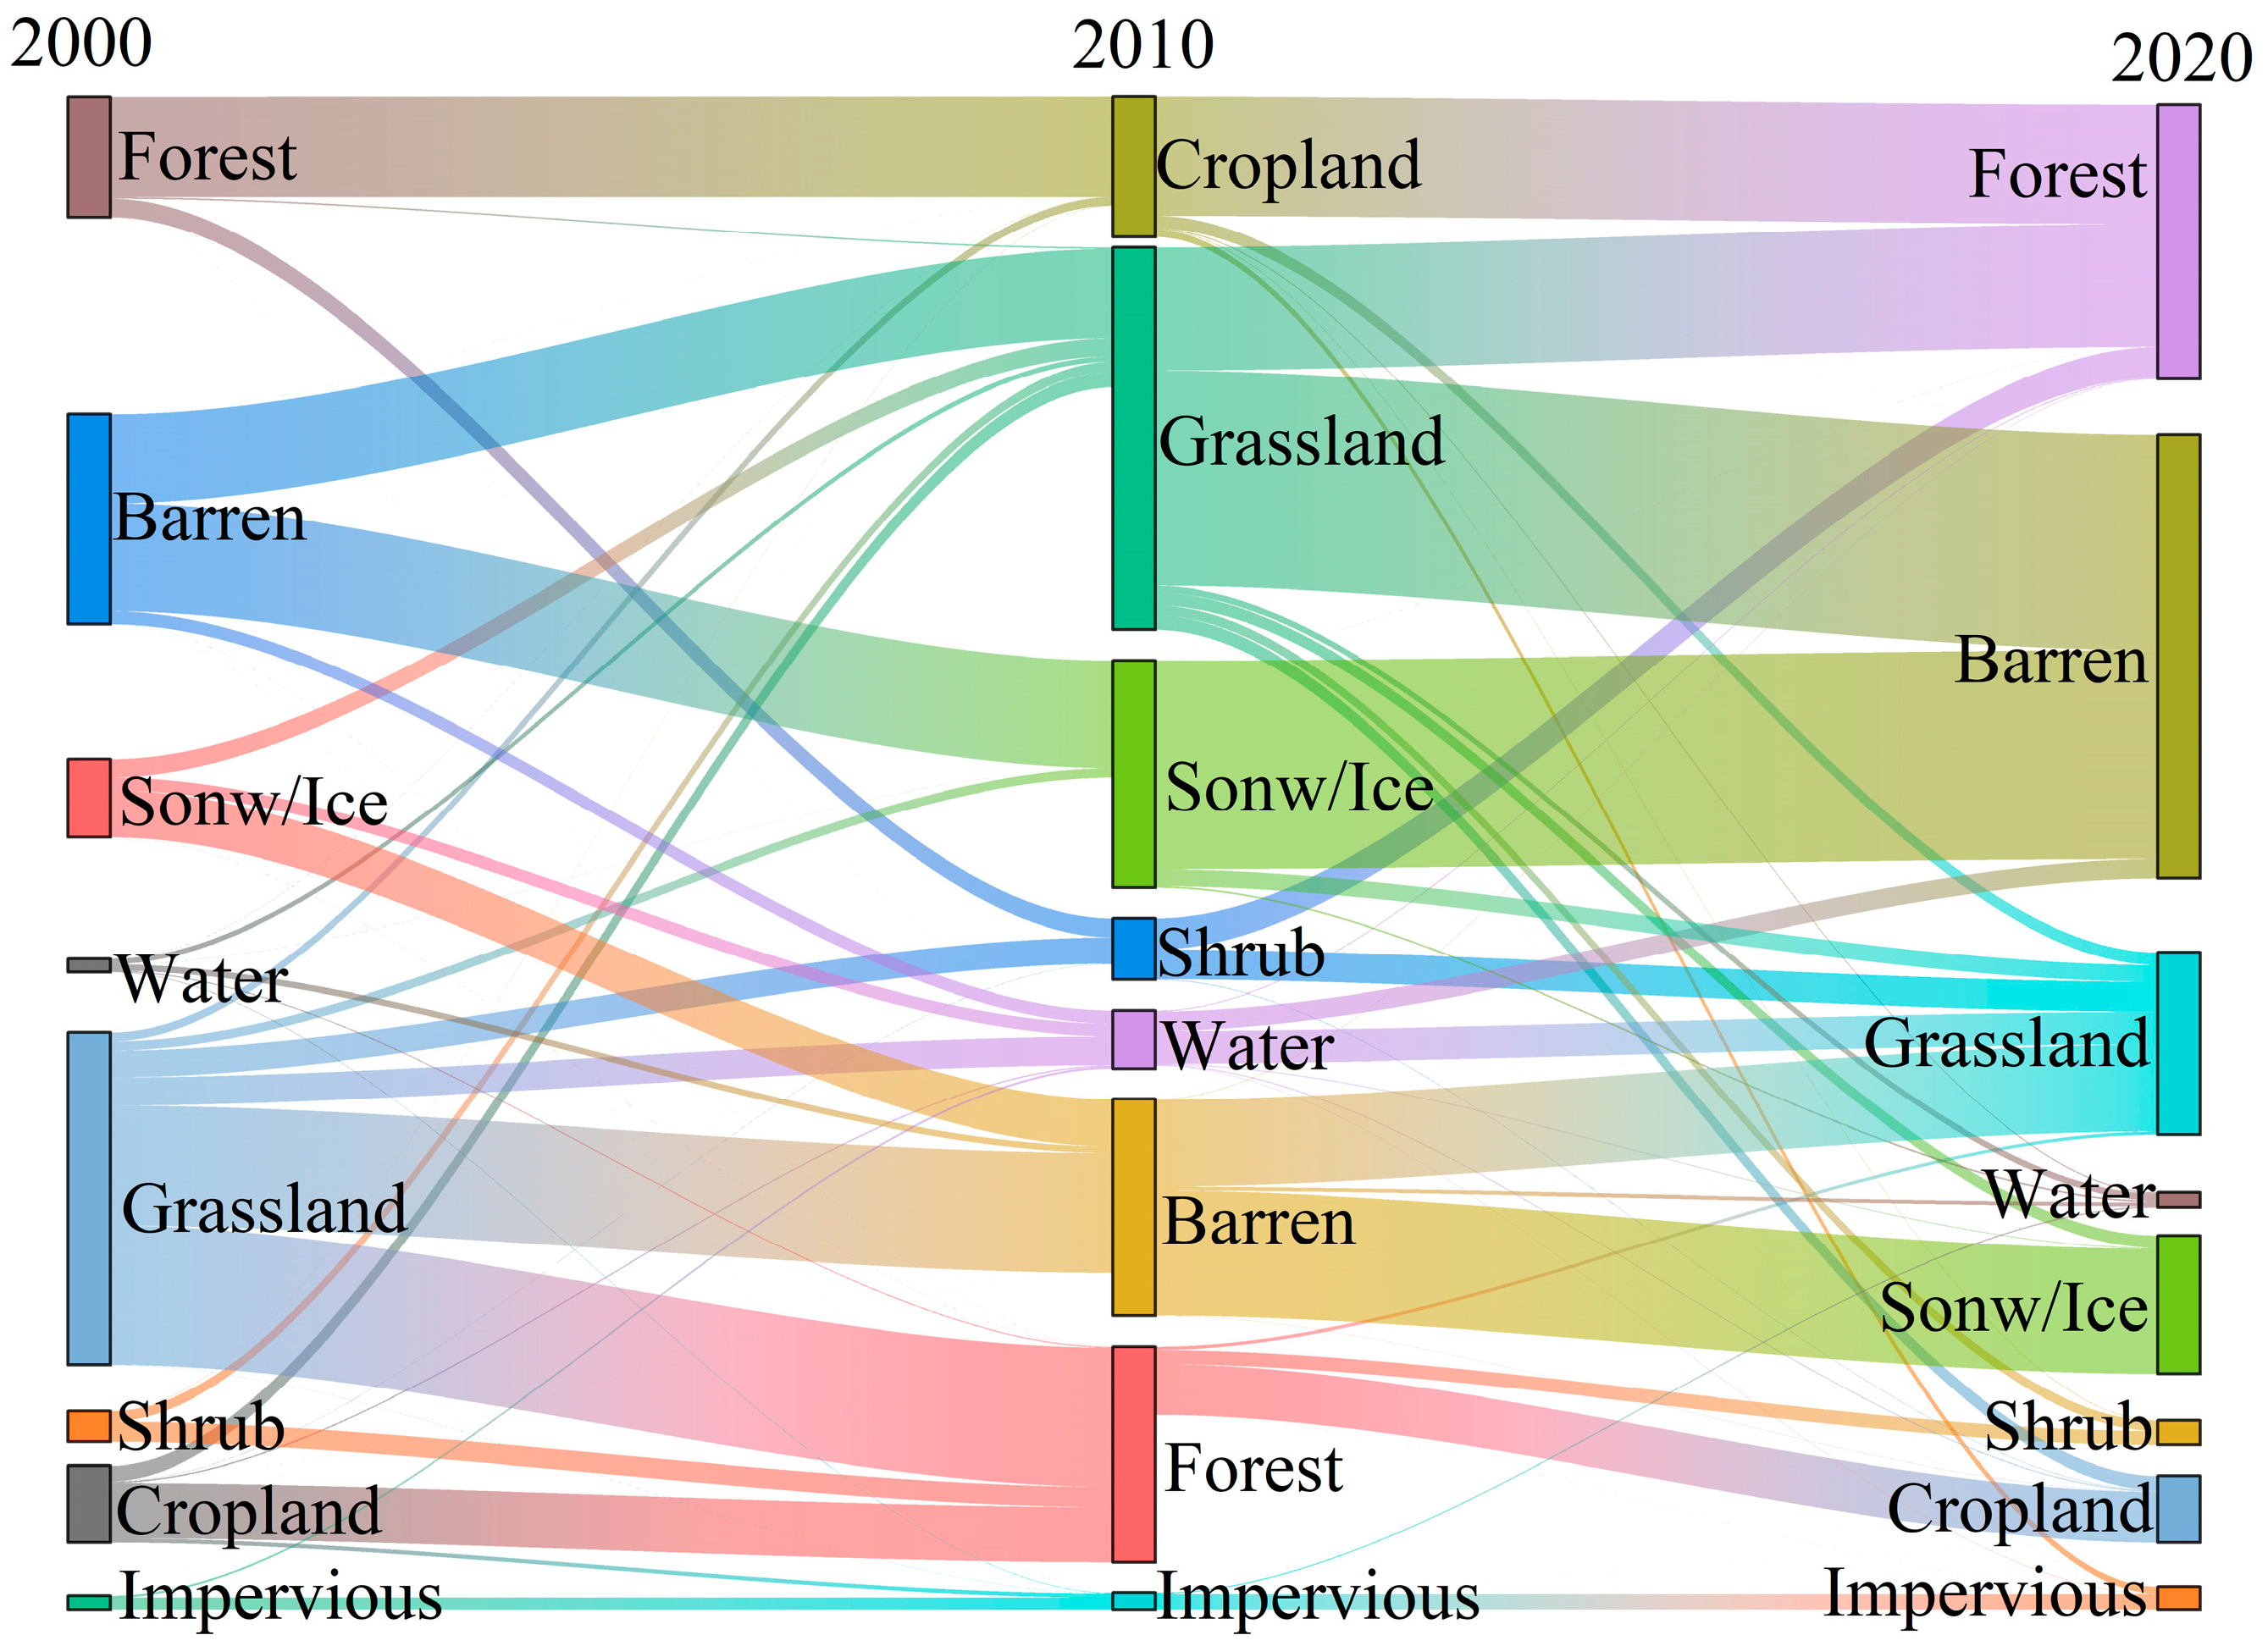
3.2. Land Use/Land Cover Transfer Matrix

We used the land use/land cover transfer matrix method to describe the land use/land cover change along the STR from 2000 to 2022. The formula [40] is as follows:
L i j = L 11 L 12 . L 1 n L 21 L 22 . L 2 n . . . . L n 1 L n 2 . L n n
where L is the area; i and j represent the land-use types at the beginning and end of the study, respectively; and n is the number of land-use types.

3.3. Determination of Evaluation Factor Weights

3.3.1. The Analytic Hierarchy Process (AHP)

The AHP is a hierarchical weighted decision analysis method, which has a wide application in the evaluation of integrated land ecology [41,42]. The specific procedural steps are as follows:
Firstly, we constructed the evaluation system and established judgment matrices based on Table 2 to compare the degree of importance between indicators.
Then, we calculated the weight of each indicator with the following expression:
m i = i = 1 n b i j i = 1 ,   2 ,   3 …… n
w i ¯ = m i n
W i = w i ¯ i = 1 n w i ¯ , i = 1 ,   2 ,   3 …… n
where mi is the product of the elements of each row in the matrix, W ¯ i is the nth square root of mi, and Wi is the normalized value.

3.3.2. The Entropy Weight Method

The entropy weight method belongs to one of the objective assignment methods, and the specific steps for calculating the weights [43] are as follows:
R i j = V i j i = 1 n V i j
E j = 1 ln n i = 1 n R i j ln R i j
W j = 1 E j j = 1 n 1 E j
where Rij is the weight of the jth indicator in year i, Vij is the indicator, Ej is the entropy value of the jth indicator, and Wj is the indicator weight.

3.4. PSR-TOPSIS Model

In this study, we employed the PSR-TOPSIS model to analyze the changes in land ecological security along the STR. The specific procedural steps [44,45] are as follows:
Firstly, we established the PSR model and determined the indicator weights using the entropy weight method.
Then, we used the TOPSIS to calculate the land ecological security index with the following expression:
P = P i j = W j × V i j
P + = max P i j | i = 1 ,   2 ,   3 ,   m
P = min P i j | i = 1 ,   2 ,   3 ,   m
D i + = j = 1 n P i j P j 2 i = 1 ,   2 ,   3 ,   m
D i = j = 1 n P i j P j + 2 i = 1 ,   2 ,   3 ,   m
C i = D i D i + + D i

3.5. Diagnostic Model of the Ecological Factors

We incorporated an obstacle factor diagnostic model for further evaluation and analysis to assess the land ecological security along the STR [46]:
M i j = W j × P i j j = 1 n W j × P i j × 100 %
where Wj is the indicator weight; Vij is the normalization matrix; P is the weighted normalized matrix; P+ and P are the positive ideal solution and negative ideal solution, respectively; D i + and D i are the positive and negative ideal solutions, respectively; and Ci is the land ecological security index.

3.6. Land Ecological Evaluation Index

If we want to comprehensively analyze the land ecological conditions of the region, it is necessary to weigh and couple the factors to obtain the land ecological indices of the region. The calculation formula is as follows:
C = P i × V i
where C is the comprehensive evaluation index, Pi is the weight of the ith indicator, and Vi is the index value of the ith indicator.

3.7. Grades of Integrated Land Ecological Index

After obtaining the integrated land ecological indices, we consulted the research findings of Khan et al. [13,37,38,39]. Additionally, considering the specific circumstances of the STR, we assigned grades to each index (Table 3).

4. Results

4.1. Land Use/Land Cover Change

The heavy lines in the Sankey diagram (Figure 3) illustrate the conversion processing on LULC. When combined with the land use transition matrix (Table 4), it is clear that the most significant changes in land use types in the research region from 2000 to 2010 occurred in grassland and forest. The area of grassland decreased by 1.04%, with 467 km2 converted from grassland to woodland and 402 km2 converted from grassland to barren. The area of forest increased by 0.52%, and the increased area was mainly converted from grassland, cropland, and shrub. Changes in land use categories in the research region from 2010 to 2020 occurred mostly in forest, grassland, and barren areas. The area of forest increased by 1.11%, with 399 km2 of cropland area being turned into forest and 412 km2 converted from grassland to forest. The grassland area decreased by 1.08%, and the reduced area was mainly converted to forest and barren. The barren area increased by 1.23%, with 723 km2 being converted from grassland and 701 km2 being converted from snow/ice. The area of snow/ice decreased by 0.48%, with the reduced area mainly being converted to grassland and barren. Overall, the grassland area continually decreased and the forest area constantly increased, while other land categories fluctuated.

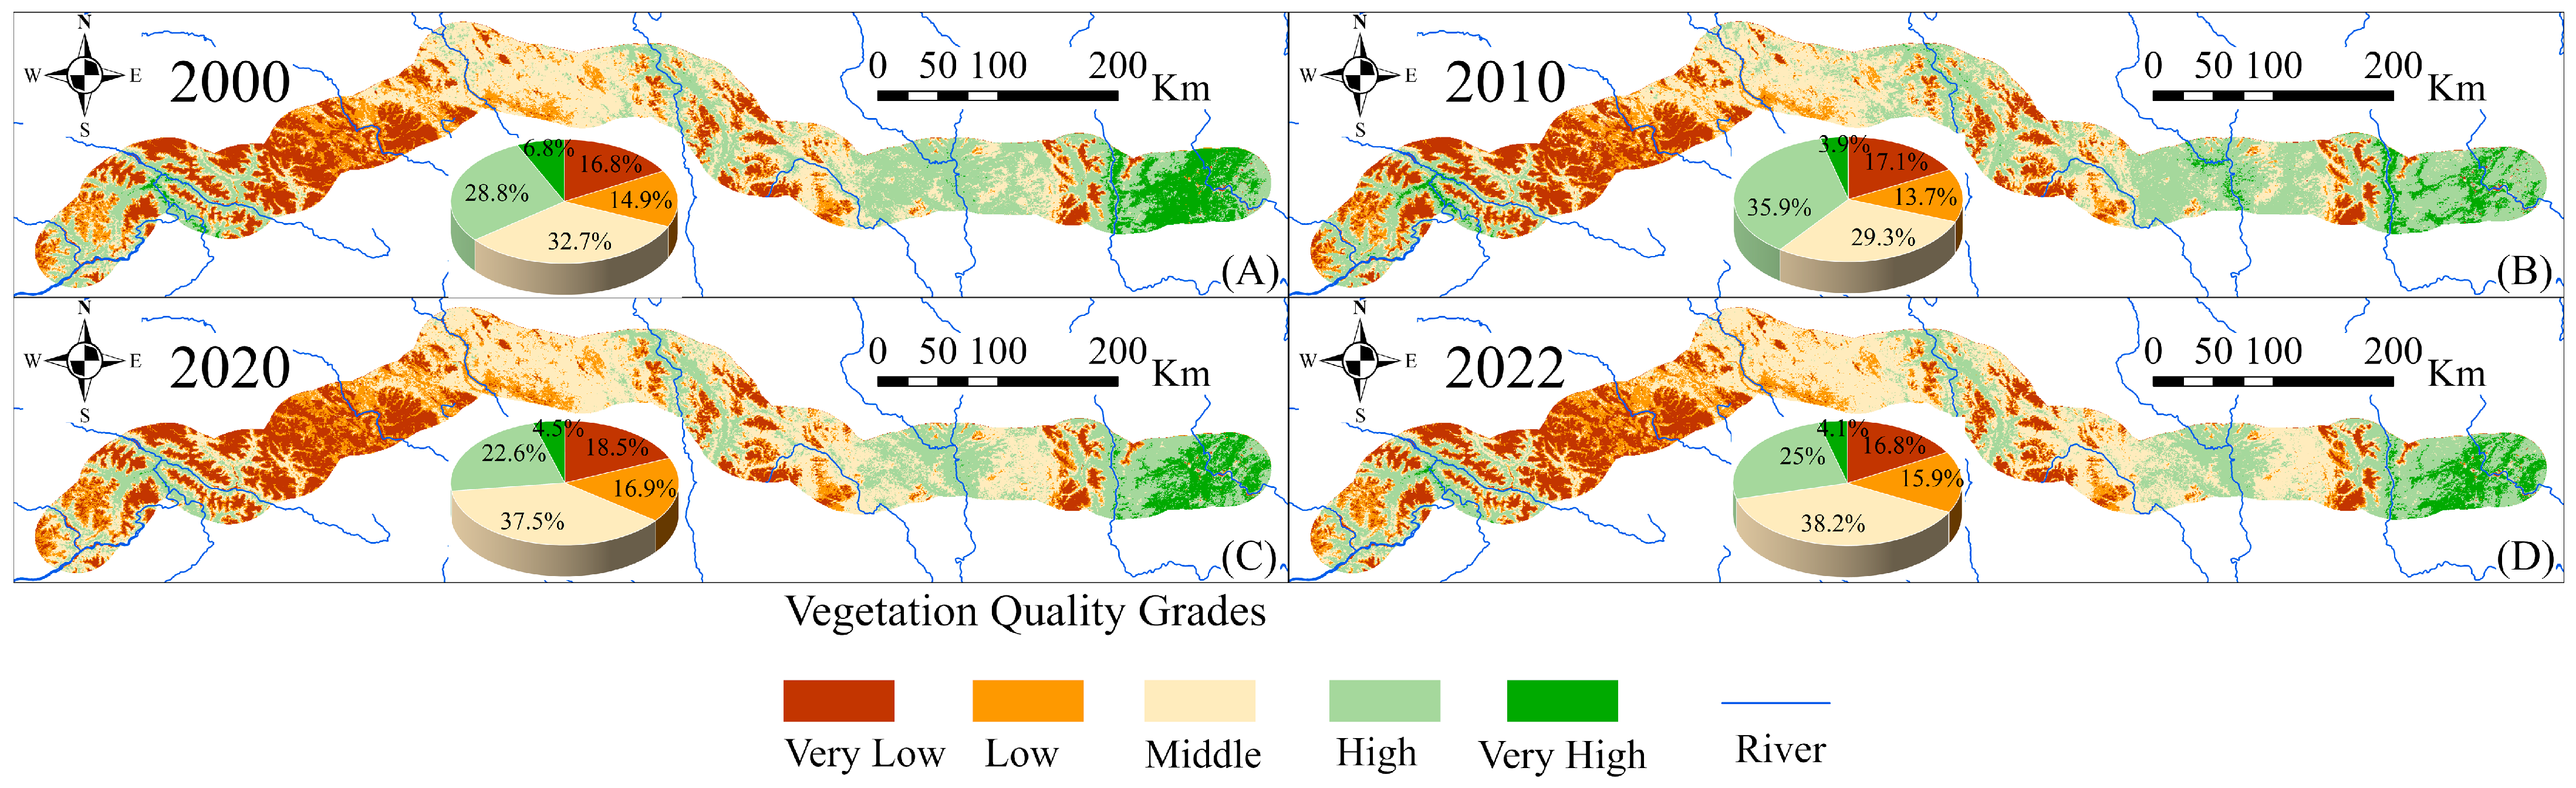
4.2. Changes in Surface Vegetation

As seen in Figure 4, regions characterized by high vegetation quality are scattered across the rightmost sections of the research area, encompassing counties in Ya’an and the leftmost segments of Nyingchi. Conversely, areas characterized by low vegetation quality are situated in Bomi, Luolong, and Basu counties in Qamdo, along with Baiyu, Batang, and Litang counties in Garze Tibetan Autonomous Prefecture. Through the examination of land use/land cover, it became evident that both Nyingchi and Ya’an exhibited high vegetation cover. The fluctuation in vegetation cover from 2000 to 2022 was minimal, indicating a stable ecological environment. Conversely, Bomi, Luolong, and Basu counties in Qamdo, along with Bainyu, Batang, and Litang counties, exhibited substantial areas of bare land, leading to a diminished overall quality of vegetation.
From the vegetation quality ratio in Figure 4, we can see that areas rated as having high vegetation quality increased by 7.1% from 2000 to 2010, indicating an improvement in the surface vegetation condition during this period. However, there was a deterioration in the surface vegetation quality along the STR from 2010 to 2020, as evidenced by a significant decrease of 13.3% in areas rated as having high vegetation quality. Meanwhile, the areas rated as having middle and low quality increased by 8.2% and 3.2%, respectively, proving that vegetation quality was destroyed during this period. This may be attributed to the land degradation due to the residue disposal sites and construction along the railway, which, in turn, affected the condition of the surface vegetation. From 2020 to 2022, there was a 2.4% increase in areas rated as having high vegetation quality and decreases of 1% and 1.7% in areas rated as having middle and low vegetation quality, respectively, within the STR range. This indicates that during this period, the surface vegetation condition along the STR started to improve due to the effective implementation of various conservation measures.

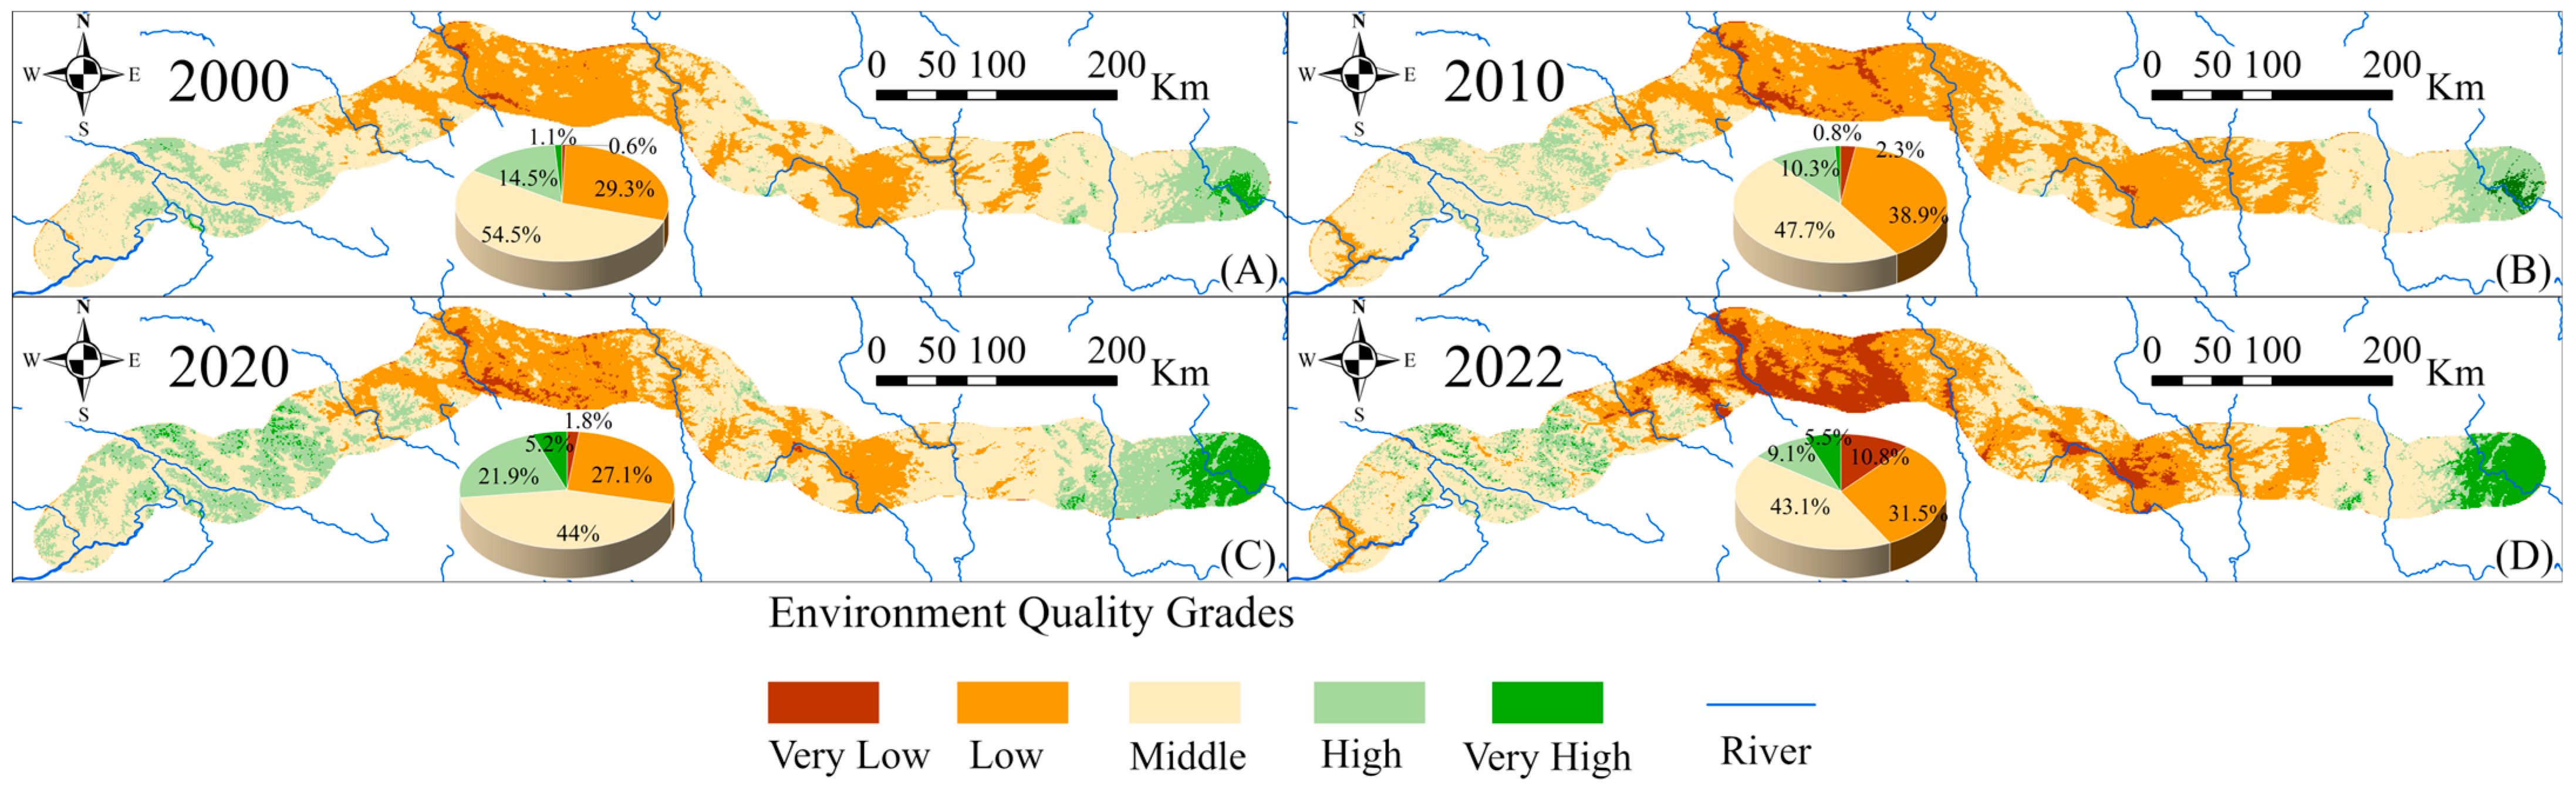
4.3. Environmental Changes

From Figure 5, it is evident that areas exhibiting superior environmental quality are concentrated within the counties of Ya’an and Nyingchi. On the contrary, Qamdo and Garze Tibetan Autonomous Prefecture exhibit inferior environmental quality. From 2000 to 2010, the environment quality along the STR experienced a deterioration, which is reflected in the finding that the areas rated as low and very low increased by 9.6% and 1.7%, respectively. Meanwhile, areas rated as high and middle quality decreased by 6.8% and 4.2%, respectively. This indicates that the environmental condition along the STR degraded during this period. However, there was an improvement in the environment quality along the STR from 2010 to 2020, as evidenced by an increase of 4.4% and 11.6% in the areas rated as having very high and high environment quality, respectively. Moreover, the ratings for the areas with middle and low environment quality decreased by 3.7% and 11.7%, respectively, which also indicates an improvement. This suggested that, from 2010 to 2020, the environment along the STR underwent restoration following the implementation of diverse environmental protection measures. However, from 2020 to 2022, the environmental quality deteriorated once more, as evidenced by a 4.4% and 9% increase in the areas with poor and very poor vegetation quality, respectively, and a sharp decrease of 12.8% in the area with high environmental quality. This indicates that railway construction activities have caused severe damage to the environment since the construction of the STR began in 2020.

4.4. Changes in Land Ecological Security

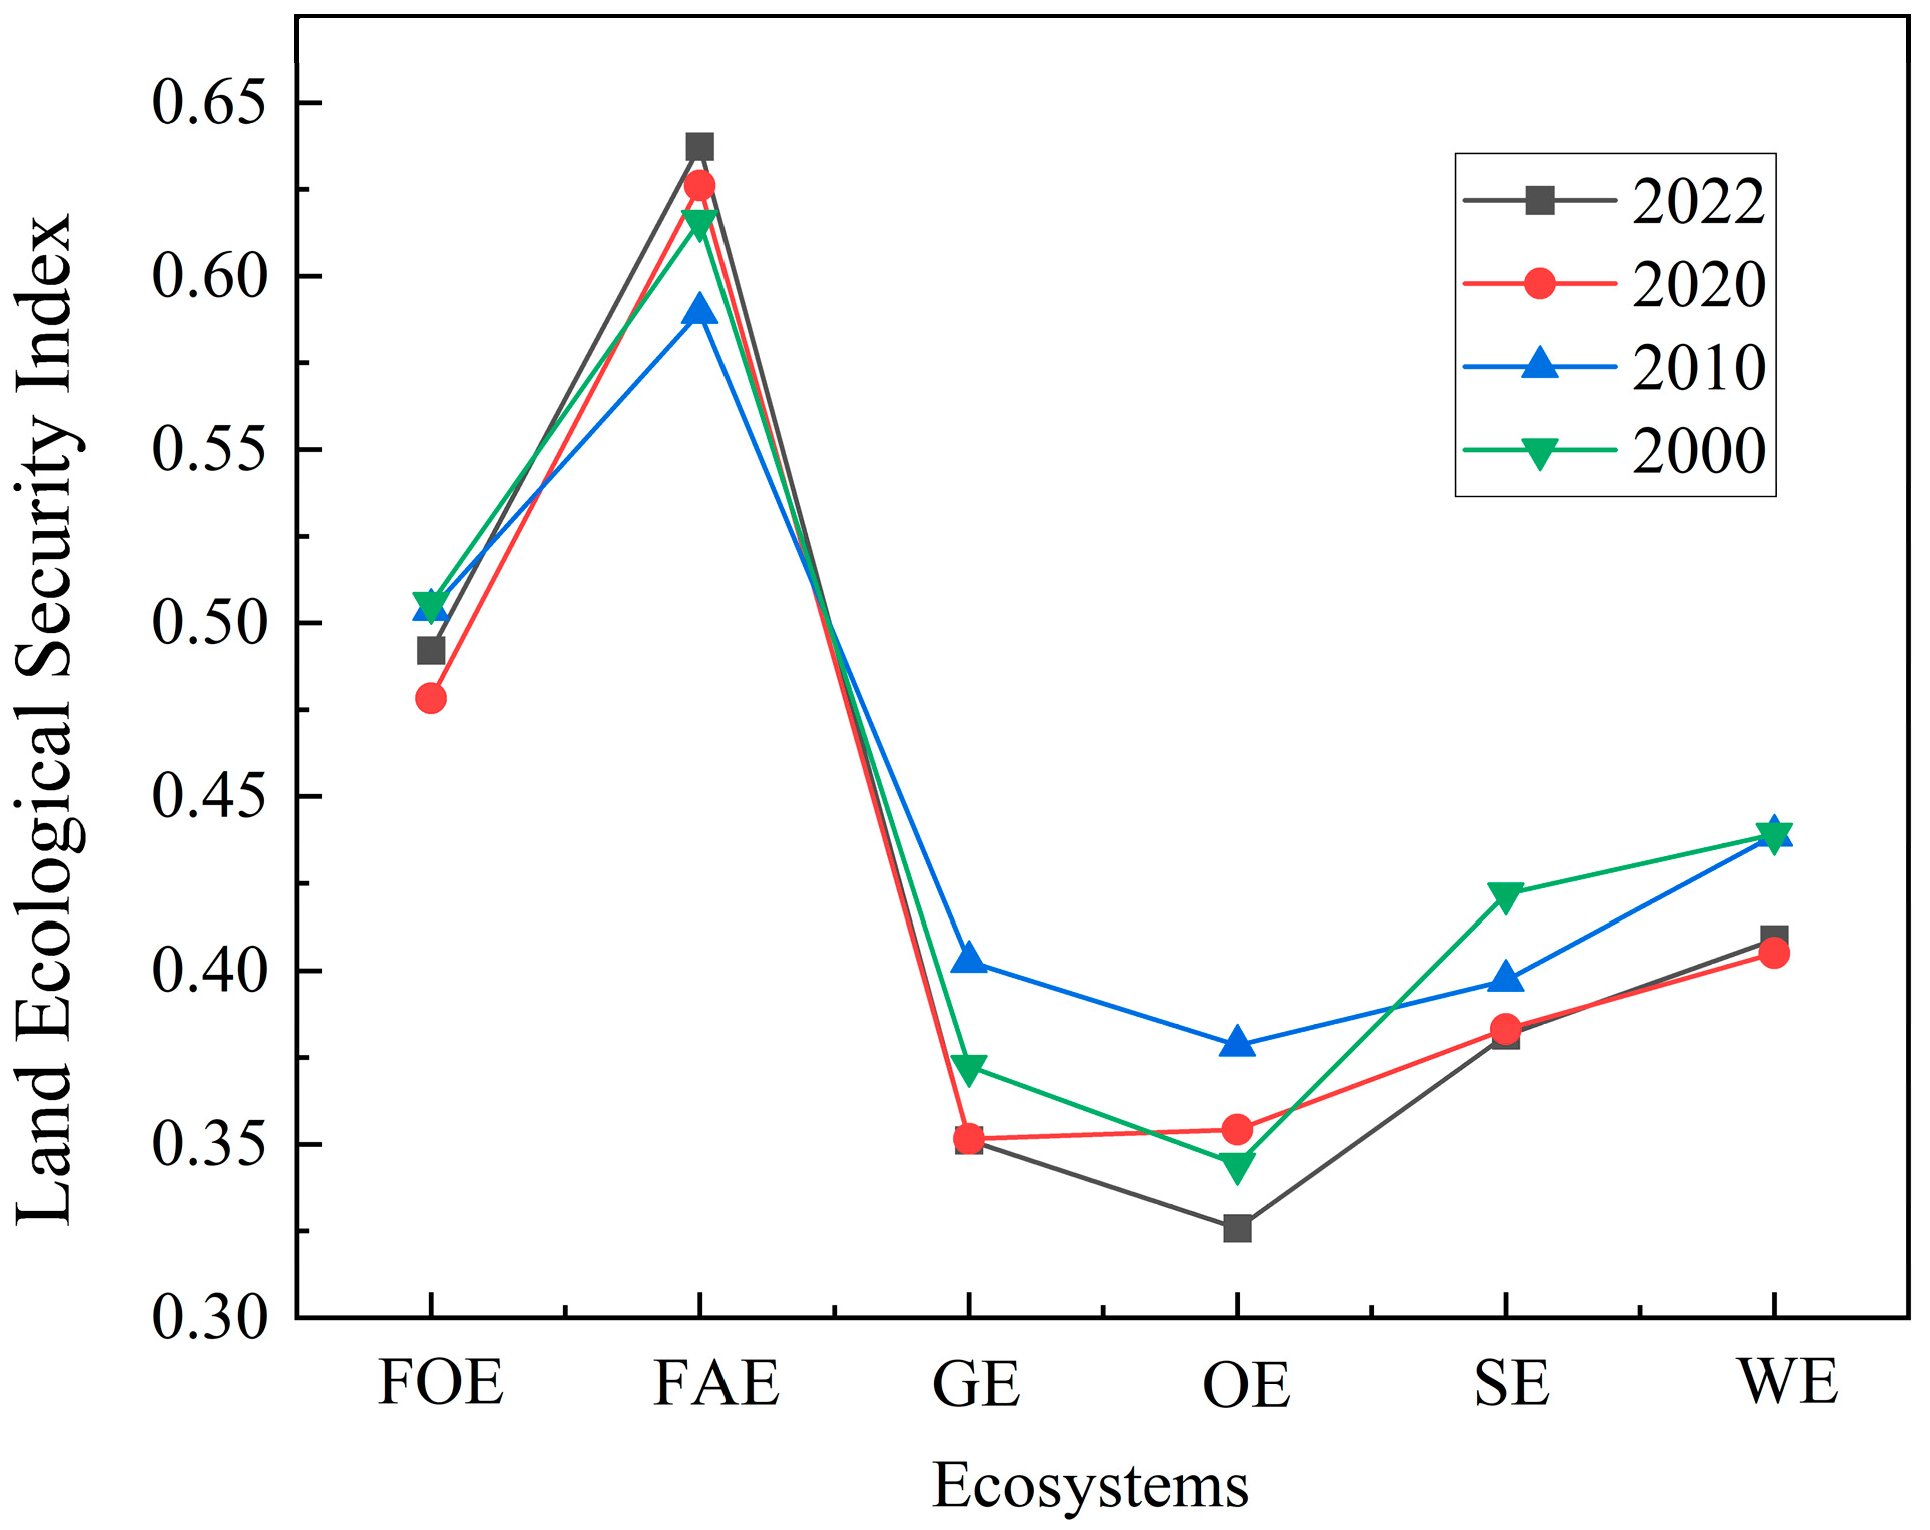
4.4.1. Land Ecological Security Analysis

Based on the research results of Xu et al. [47], we classified the STR into six ecosystem types (Figure 6). From 2000 to 2022, the overall status of land ecological security along the STR ranged from less secure to generally safe (Figure 7). Figure 7 shows that the farmland ecosystem had the best land ecological security, and from 2000 to 2022, it consistently maintained a generally safe state. However, between 2000 and 2010, the land ecological security of the farmland ecosystem experienced a decline, potentially attributable to inappropriate planting and fertilization practices resulting in soil quality deterioration. Conversely, from 2010 to 2022, there was a prevailing upward trend in the land ecological security of the farmland ecosystem. This positive trajectory can be attributed to continuous monitoring and enhancements, ensuring the stability of the ecosystem and fostering sustainable agricultural development.
The other ecosystem types along the STR exhibited lower land ecological security. Between 2000 and 2022, the highest land ecological security index was only 0.38, while the lowest was 0.33, and there was a continuous downward trend overall. This indicates that this ecosystem had suffered some damage, with exposed land surfaces and insufficient vegetation cover to maintain soil and water resource stability. This decline may be attributed to factors such as excessive grazing, over-cultivation, excessive development, and urbanization.
The other ecosystems in the research area, such as the forest ecosystem, grassland ecosystem, settlement ecosystem, and water and wetland ecosystem, exhibited a land ecological security level ranging from less secure to basically safe. It is worth noting that the grassland ecosystem, except for reaching a basically safe level in 2010, remained at a less secure level in 2000, 2020, and 2022. This suggests that the condition of the grassland ecosystem was relatively poor, with some degree of degradation and damage.

4.4.2. Analysis of the Selected Ecological Factors

We used the obstacle factor diagnosis model for further analysis. The obstacle degree of each factor was calculated using Equation (16), and the top three obstacle factors were selected for statistical analysis. This helped us identify the primary factors that impeded the land ecological security in the study area.
From Figure 8, it can be seen that the indicators presenting the largest obstacles to the forest ecosystem were WET, the LAI, and ET. WET can influence plant growth and diversity within the forest ecosystem. Excessively low or high humidity levels can destroy the ecological balance. The LAI and ET are linked to the water cycle in the forest ecosystem. They can affect transpiration rates and water use efficiency, and subsequently impact the productivity and biodiversity of the forest ecosystem. The indicators most negatively affecting the farmland ecosystem were WET and LST. WET reflects the moisture content in the soil. Insufficient humidity can limit crop growth and development, leading to drought conditions. LST is related to photosynthesis and respiration in plants. Both excessively high and low temperatures can affect crop growth and yield. For the grassland ecosystem, the main obstacles were related to LST and PRE. LST reflects the thermal environment of the ecosystem, impacting processes such as grass growth, flowering, and fruit maturation. PRE can affect the water supply for grassland plants and the functioning of the ecosystem. Excessive or insufficient rainfall can have adverse effects on biodiversity.
The NDVI and LAI presented the biggest obstacles for other ecosystems, particularly bare land, which has low vegetation coverage, leading to restrictions on plant growth and photosynthesis. Vegetation coverage is related to ecosystem productivity, climate regulation, and soil conservation. Therefore, increasing vegetation coverage is important for protecting ecosystem stability and the environment. The main obstacles in the settlement ecosystem were WET, the NDVI, and LST. The degree of urbanization in the settlement ecosystem was continually increasing, leading to a decrease in surface humidity and vegetation coverage. Additionally, industrial activities contributed to the rising surface temperatures, becoming the primary threat to land ecological security.

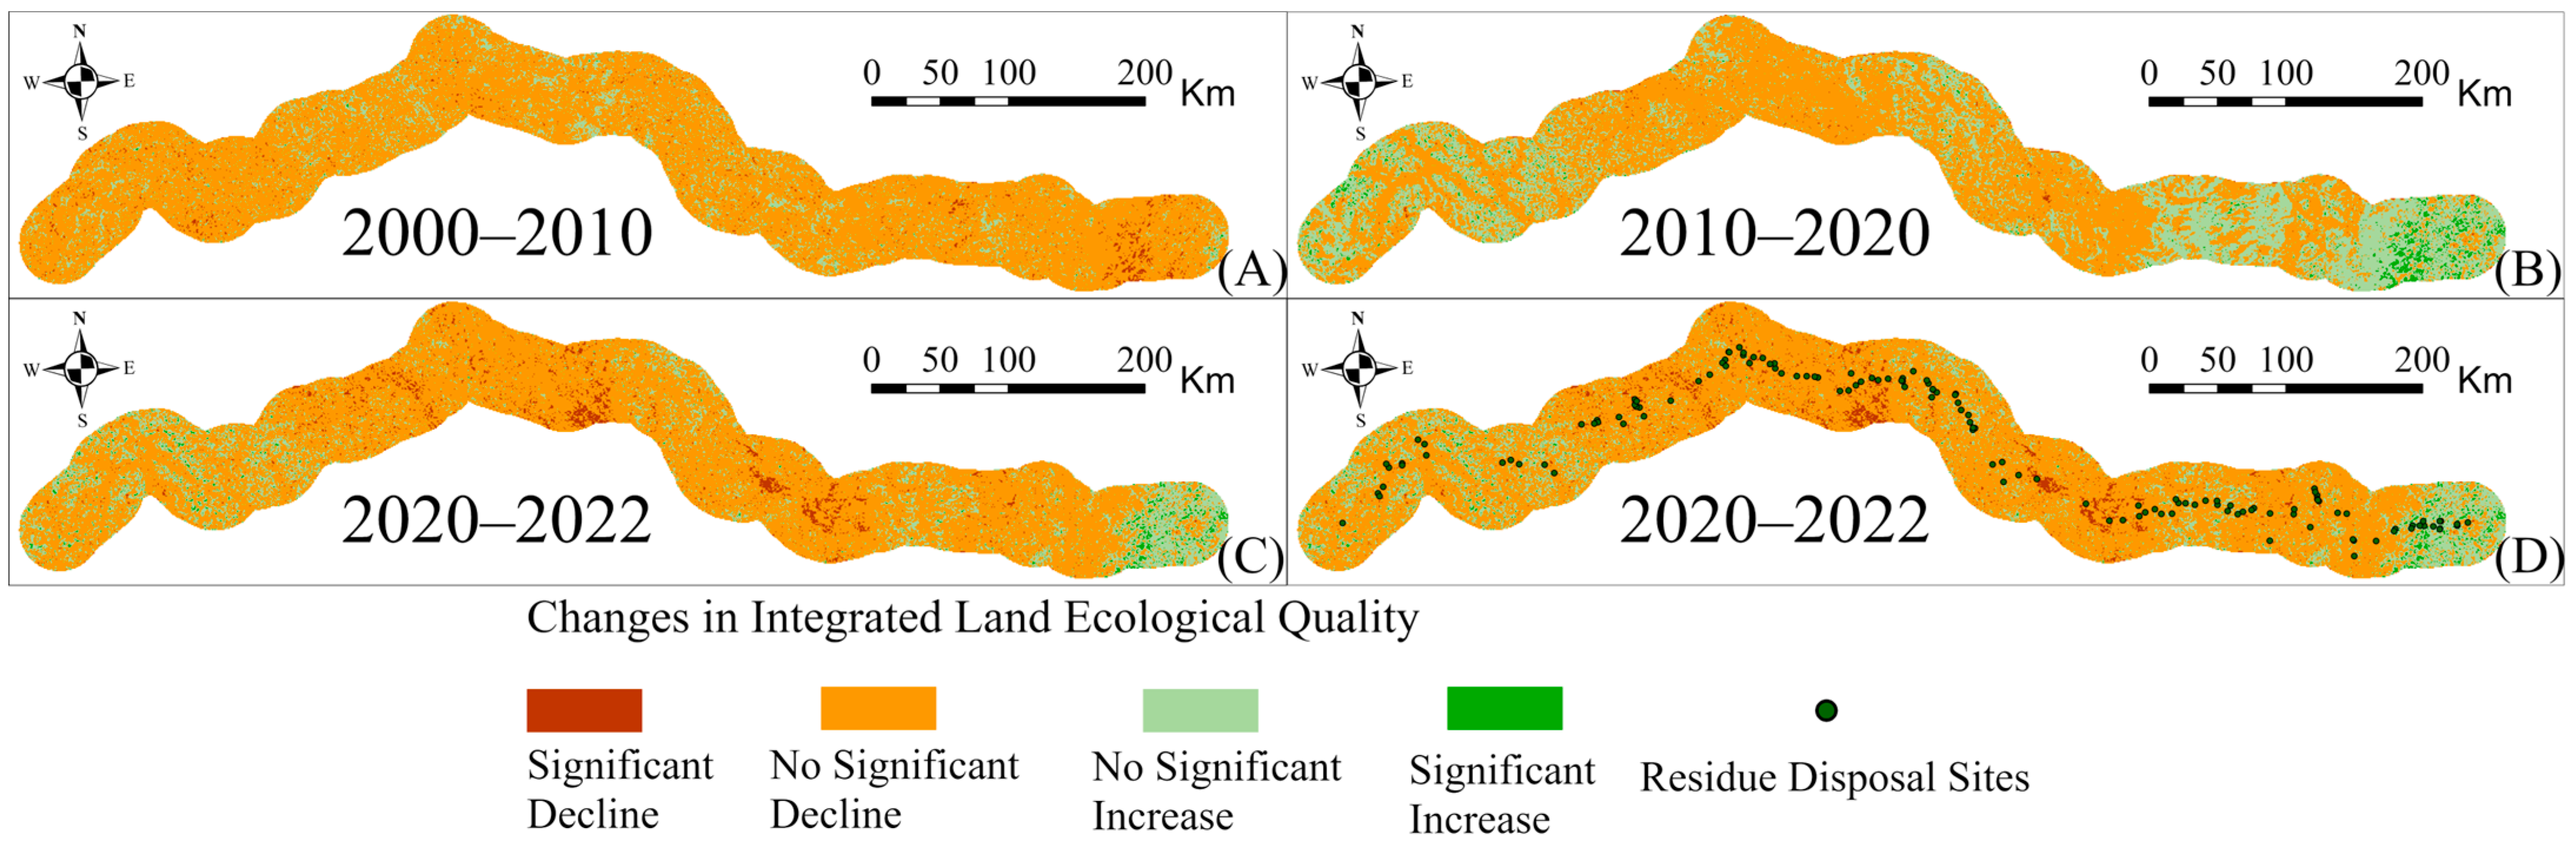
4.5. Integrated Land Ecology along the STR

After combining the analysis of land use, vegetation, environmental, and land ecological security changes, we derived an overview of the integrated land ecology along the STR (Figure 9). Figure 9 shows that regions with the highest integrated land ecological quality were concentrated in Ya’an and Nyingchi, where vegetation and environmental quality were at the highest levels. The land use distribution in this region primarily consisted of cropland and forest, where the land ecological security was at a relatively safe level. Conversely, regions with lower integrated land ecological quality were identified in Qamdo. In these areas, vegetation, environment, and land ecological security were at lower levels. These regions were composed of grassland and cropland, and the land ecological security in these areas was in an unsafe state.
Upon analyzing the distribution of residue disposal sites along the STR, we found that, except for the area around the residue disposal site in Ya’an, where the integrated land ecological quality was at a higher grade, the rest of the residue disposal sites in the study area were located in areas where the integrated land ecology showed a lower grade. This partially elucidates the considerable impact of residue disposal sites on the local land ecology. Comparing changes in integrated land ecological quality between 2020 and 2022 revealed a 4% decrease in areas with a high integrated land ecological quality rating, coupled with a 6.2% increase in areas with a lower rating. A significant decline in integrated land ecology along the STR was readily apparent. This change was closely related to the impacts of the construction of residue disposal sites along the railway since the project began in 2020.
Figure 10 shows the changes in integrated land ecology from 2000 to 2022. The overall land ecological quality in the study area showed a non-significant decreasing trend during the period from 2000 to 2010. However, the land ecological quality in some districts and counties within Ya’an decreased significantly, probably due to engineering construction and production activities. From 2010 to 2020, while the integrated land ecological quality of certain districts had improved, numerous areas continue to experience a decline. The integrated land ecological quality of Ya’an, Nyingchi, Yajiang, and Baiyu counties in Garze Tibetan Autonomous Prefecture began to rise during this period, while the vast majority of areas in Qamdo were still declining. Between 2020 and 2022, the overall trend in integrated land ecological quality in other regions was a decline, and Litang and Gongjue counties experienced a notable decline; however, it was rising in some areas in Ya’an and Nyingchi during that time. When the location of residue disposal sites was incorporated into the analysis (Figure 10D), it was observed that the integrated land ecological quality surrounding these sites exhibited a declining trend, reaffirming the adverse impact of residue disposal sites on integrated land ecology. Overall, from 2000 to 2010, the land ecological quality along the STR exhibited a declining trend. Conversely, between 2010 and 2022, the integrated land ecological quality in Ya’an and Nyingchi experienced steady improvement, while that of Qamdo continued to decline, and Garze Tibetan Autonomous Prefecture displayed a fluctuating trend.

4.6. Accuracy Verification

We took integrated land ecology as the object of validation. The accuracy of the evaluation results was verified using field images and images from unmanned aerial vehicles. The specific validation steps were as follows: 100 points were randomly selected to determine the accuracy of the experimental results by comparing the consistency between the actual situation of integrated land ecology in the field and the evaluation results derived from the experiment (Figure 11). After the comparison experiment, the evaluation accuracy was 84%, which indicates that the research results derived from this experiment have a certain degree of credibility. In this study, the selected areas A, B, and C were all near residue disposal sites. As can be seen from Figure 11, the integrated ecological quality of the land near the residue disposal sites has received more or less impact since the construction of the STR began in 2020. Areas A and C in Figure 11 have been particularly strongly affected, and the integrated ecological quality of the land in these areas has declined sharply.

5. Discussion

5.1. Spatial Distribution of Land Ecology and Its Influencing Factors

In this study, we evaluated the integrated land ecology along the STR from 2000 to 2022, employing a hierarchical analysis method, the transfer matrix method, and the PSR-TOPSIS model. Areas with higher integrated land ecological quality were concentrated in various counties within Ya’an and Nyingchi. Conversely, areas with lower integrated land ecological quality were distributed in various counties in Qamdo. The characteristics of land ecological quality distribution were generally consistent with previous studies on the Ya’an to Nyingchi railway corridor [11]. To verify the accuracy of the assessment results, we conducted field comparisons between the actual integrated land ecology and the evaluation outcomes. We determined the accuracy rate by assessing the consistency of the selected sampling areas. This is consistent with the accuracy verification method adopted by Cao et al. [48]. This also suggests the feasibility of this accuracy verification method in dealing with large-scale and regional land ecology. Previous studies mainly focused on some areas of the STR, such as Ya’an [49], Nyingchi [50], and Qamdo [51]. Compared with other studies, we expanded the study area to the entire STR corridor.
Due to the special geographic characteristics of the STR region, the primary economic activity in this area is livestock farming. Therefore, overgrazing is thought to be one of the reasons for the decline in integrated land ecology [52,53]. In addition, since the start of construction on the STR project, it has been necessary to handle the waste residues during the construction process. Although some of the waste residues can be used for the roadbed and concrete aggregate, the remaining waste must be transferred to the residue disposal sites for centralized stockpiling [54]. Therefore, many residue disposal sites have been constructed near transportation routes (Figure 12). The construction of dumps has directly occupied land resources and changed the original land type, for example, by converting forested land or fields into dumps, thus destroying vegetation and land cover [55]. In addition, the dump itself may contain toxic and harmful substances that can pollute water resources and soil under the leaching effect of rainwater [55]. The instability of spoil dumps may lead to natural disasters such as soil erosion, landslides, and mudslides, posing a serious threat to the surrounding environment [56,57]. In addition, railroad construction activities and the noise they generate can damage the ecological environment of the surrounding area [58,59,60].

5.2. Policy Implications

The STR is one of the most important engineering construction programs in China. It has economic, humanistic, and other important ramifications, and the Chinese government has deemed the project of great importance. According to the map of integrated land ecological quality along the STR (Figure 9), we can see where the areas of high and low quality along the Sichuan–Tibet line are distributed. This provides an important geographical location for the ecological protection and restoration of the STR corridor. Figure 9 shows that the low integrated land ecological quality is mainly distributed in the middle region of the STR corridor. The distribution of land use types shows that the region is dominated by grasslands. This requires the local government to enhance the protection of grasslands, such as reducing or restricting livestock grazing activities, to protect the ecosystems in sensitive areas [61,62]. Moreover, the inappropriate management of residue disposal sites can lead to the decline in land ecological quality (Figure 13). To mitigate the impact of sites for residue disposal on integrated land ecology, a series of measures need to be implemented. Firstly, the selection and design of residue disposal sites should adhere to scientific standards, keeping a considerable distance from sensitive ecological areas and water sources to minimize the impact on the surrounding ecological environment [54,63]. Secondly, there is a need to enhance the monitoring and management of residue disposal sites, ensuring that waste deposition does not result in soil and water pollution. The implementation of scientifically guided closure and restoration plans for residue disposal sites is essential to restore the affected land ecosystems and alleviate ecological damage [64,65].

5.3. Impact of Land Ecological Quality on Species Types

To further explore the influence of land ecological quality distribution on biodiversity, we referenced the refined 30 m spatial resolution land use data for China provided by Zhang et al. [66]. The species type data for the study area were then extracted. As depicted in Figure 14, the forest species types in the study area mainly consist of closed evergreen needle-leaved forest, closed evergreen broadleaved forest, closed deciduous broadleaved forest, and open evergreen needle-leaved forest. Among these types, closed evergreen needle-leaved forest occupies a majority of the land. There are also a variety of rare plants and animals in the area along the route, such as the blue sheep, Tibetan fox, Pallas’s cat, dove tree, and Cupressus gigantea [67]. The residue disposal sites are mainly located in grasslands, broad-leaved forests, and coniferous forests, and we have already discussed their negative impacts on the land ecology in Section 5.2. As the ecological quality of the land declines, the natural habitats of these flora and fauna may be lost and fragmented, leading to a decline in biodiversity [68]. Therefore, measures such as ecological restoration of the area of the dump site can be taken to ameliorate the impact on the land ecology and thereby work towards species conservation.

5.4. Limitations and Future Research Perspectives

In this study, we evaluated the integrated land ecology along the STR from 2000 to 2022. However, some limitations should be mentioned. Firstly, the health and stability of land ecosystems are influenced by a variety of factors, which can be categorized into natural and anthropogenic factors. However, there is no clear consensus on standardized evaluation indicators [69]. While this study has comprehensively considered numerous evaluation systems within land degradation, land suitability, land resources, land ecological security, and land quality to select representative evaluation criteria, there remain several limitations. We need to consider biodiversity factors such as species richness and population density when conducting an assessment of the health and stability of land ecosystems. In this study, the indicator system we selected primarily focuses on land ecosystem factors such as vegetation, productivity, and meteorological conditions. However, it does not adequately address other crucial ecological aspects, including soil quality, water quality, biodiversity, and ecosystem services [70,71]. The relatively limited comprehensiveness may result in an incomplete evaluation. Hence, there is a need to establish a more comprehensive indicator system. Secondly, we divided the land ecological quality into five grades to map the distribution of the quality along the STR. The grading criteria are only for the STR corridor and may not apply to other regions. For example, the land ecological middle grade in this paper may generally correspond to a grade of low or lower in other regions.

6. Conclusions

In this study, we used the transfer matrix method, the AHP, and the PSR-TOPSIS model to conduct an integrated land ecological assessment on the STR corridor and reached the following conclusions.
Firstly, we established the comprehensive ecological assessment process, including nine indicators (LULC, NPP, GPP, NDVI, LAI, LST, WET, ET, PRE). The results showed that the validation accuracy rate was over 80%. Therefore, the evaluation results we obtained have some reliability.
Secondly, the high-quality integrated land ecological, surface vegetation, and environmental regions were concentrated in Ya’an and Nyingchi, whereas the low-quality regions were situated in Qamdo and Garze Tibetan Autonomous Prefecture. There was an overall decline in the integrated land ecological quality along the STR from 2000 to 2022. While it steadily improved in the Ya’an and Nyingchi regions from 2010 to 2022, it continued to decline around the Qamdo region. The most degraded land-use type during the 22 years was grassland, and farmland was the most secure land-use type. Moreover, spatial analyses, coupled with examinations of residue disposal sites, indicated that these sites have had a detrimental effect on the integrated land ecology since the inception of the construction of the Sichuan–Tibet Railway.
Overall, our study includes extensive research on the integrated land ecology of the STR corridor. These results offer benchmarks for both the preservation and restoration of the land’s ecological ecosystem and the sustainability of the STR construction project.

Author Contributions

C.J.: supervision, conceptualization, funding acquisition, writing—review and editing. H.Y.: methodology, writing—original draft. X.P.: writing—review and editing. X.Z.: writing—review and editing. L.C.: writing—review and editing. D.L.: writing—review and editing. Y.C.: data curation. M.C.: writing—review and editing. J.P.: writing—review and editing. All authors have read and agreed to the published version of the manuscript.

Funding

This research was funded by the National Science Foundation of China (No. 42301459), the China Postdoctoral Science Foundation (No. 2023M740418), the China Meteorological Services Association Meteorological Science and Technology Innovation Platform Project (No. CMSA2023MC002), the Opening fund of State Key Laboratory of Geohazard Prevention and Geo-environment Protection (Chengdu University of Technology) (No. SKLGP2022K028), the Opening fund of State Environmental Protection Key Laboratory of Synergetic Control and Joint Remediation for Soil & Water Pollution (No. GHBK-2023-04), and the Opening fund of Key Laboratory of Monitoring, Evaluation, and Early Warning of Territorial Spatial Planning Implementation, Ministry of Natural Re-sources (No. LMEE-KF2023001).

Data Availability Statement

Data are contained within the article.

Conflicts of Interest

The authors declare no conflicts of interest.

References

  1. Sowińska-Świerkosz, B. Application of surrogate measures of ecological quality assessment: The introduction of the Indicator of Ecological Landscape Quality (IELQ). Ecol. Indic. 2017, 73, 224–234. [Google Scholar] [CrossRef]
  2. Stefanidis, K.; Dimitrellos, G.; Sarika, M.; Tsoukalas, D.; Papastergiadou, E. Ecological Quality Assessment of Greek Lowland Rivers with Aquatic Macrophytes in Compliance with the EU Water Framework Directive. Water 2022, 14, 2771. [Google Scholar] [CrossRef]
  3. Halder, S.; Bose, S. Ecological quality assessment of five smart cities in India: A remote sensing index-based analysis. Int. J. Environ. Sci. Technol. 2023, 21, 4101–4118. [Google Scholar] [CrossRef]
  4. Karimi, B.; Maron, P.A.; Chemidlin-Prevost Boure, N.; Bernard, N.; Gilbert, D.; Ranjard, L. Microbial diversity and ecological networks as indicators of environmental quality. Environ. Chem. Lett. 2017, 15, 265–281. [Google Scholar] [CrossRef]
  5. Adebayo, T.S.; Özkan, O. Evaluating the role of financial globalization and oil consumption on ecological quality: A new perspective from quantile-on-quantile granger causality. Heliyon 2024, 10, e24636. [Google Scholar] [CrossRef] [PubMed]
  6. Ahakwa, I.; Tackie, E.A. Natural resources as a double-edged sword towards ecological quality: Can environmental regulations and green human capital rectify the adverse impacts? J. Clean. Prod. 2024, 457, 142436. [Google Scholar] [CrossRef]
  7. Oduor, N.A.; Munga, C.N.; Imbayi, L.K.; Botwe, P.K.; Nyanjong, E.O.; Muthama, C.M.; Mise, N.A.; Moosdorf, N. Anthropogenic nutrients and phytoplankton diversity in Kenya’s coastal waters: An ecological quality assessment of sea turtle foraging sites. Mar. Pollut. Bull. 2024, 199, 115897. [Google Scholar] [CrossRef] [PubMed]
  8. Veríssimo, H.; Neto, J.M.; Teixeira, H.; Franco, J.N.; Fath, B.D.; Marques, J.C.; Patrício, J. Ability of benthic indicators to assess ecological quality in estuaries following management. Ecol. Indic. 2012, 19, 130–143. [Google Scholar] [CrossRef]
  9. Guo, J.; Cui, Y.; Xu, W.; Shen, W.; Li, T.; Yi, S. A novel friction weakening-based dynamic model for landslide runout assessment along the Sichuan-Tibet Railway. Eng. Geol. 2022, 306, 106721. [Google Scholar] [CrossRef]
  10. Zhang, D.; Sun, Z.; Fang, Q. Scientific problems and research proposals for Sichuan–Tibet railway tunnel construction. Undergr. Space 2022, 7, 419–439. [Google Scholar] [CrossRef]
  11. Chen, Y.; Zhang, T.; Zhou, X.; Li, J.; Yi, G.; Bie, X.; Hu, J.; Wen, B. Ecological sensitivity and its driving factors in the area along the Sichuan–Tibet Railway. Environ. Dev. Sustain. 2023. [Google Scholar] [CrossRef]
  12. Chen, S.Y. Research Progress on Land Ecological Assessment. Agric. Dev. Equip. 2020, 2, 42+52. [Google Scholar] [CrossRef]
  13. Liu, J.; Zhou, L.; Xi, X. Land ecological quality and its change trend prediction in the Yellow River Basin from 2000 to 2020. Arid Land Geogr. 2023, 46, 1654–1662. [Google Scholar]
  14. Zhang, Z.; Wu, F.; Wang, J.; Zhang, B. Progress of land ecological evaluation. J. Northwest For. Coll. 2005, 4, 104–107+111. [Google Scholar]
  15. Messing, I.; Hoang, M.H.; Chen, L.-D.; Fu, B.-J. Criteria for land suitability evaluation in a small catchment on the Loess Plateau in China. Catena 2003, 54, 215–234. [Google Scholar] [CrossRef]
  16. Rapport, D.; Friend, A. Towards a Comprehensive Framework for Environmental Statistics: A Stress-Response Approach; Statistics Canada: Ottawa, ON, USA, 1979; pp. 11–510. [Google Scholar]
  17. Concepts and Methods of Environment Statistics: Statistics of the Natural Environment—A Technical Report; United Nations: New York, NY, USA, 1991.
  18. Environmental Indicators: A Preliminary Set; OECD: Paris, France, 1991.
  19. Towards Sustainable Development: Indicators to Measure Progress (Proceedings of the Rome Conference); OECD Publishing: Paris, France, 2000. [CrossRef]
  20. AtKisson, A. Developing indicators of sustainable community: Lessons from sustainable Seattle. Environ. Impact Assess. Rev. 1996, 16, 337–350. [Google Scholar] [CrossRef]
  21. Gambo, J.; Binti Roslan, S.N.A.; Mohd Shafri, H.Z.; Che Ya, N.N.; Yusuf, Y.A. Unveiling and modelling: Land degradation, poverty nexus in Nigeria’s semi-arid (jigawa state) using cloud-based geospatial data. J. Arid Environ. 2024, 222, 105151. [Google Scholar] [CrossRef]
  22. Malczewski, J. GIS and Multicriteria Decision Analysis; Wiley: New York, NY, USA, 1999. [Google Scholar]
  23. Akadiri, S.S.; Alola, A.A.; Akadiri, A.C. The role of globalization, real income, tourism in environmental sustainability target. Evidence from Turkey. Sci. Total Environ. 2019, 687, 423–432. [Google Scholar] [CrossRef]
  24. Karapinar Senturk, Z. Amphibian species detection in water reservoirs using artificial neural networks for ecology-friendly city planning. Ecol. Inform. 2022, 69, 101640. [Google Scholar] [CrossRef]
  25. Hamad, K.O.; Surucu, A. Land degradation sensitivity and desertification risk in Harrir region, northern Iraq. Heliyon 2024, 10, e27123. [Google Scholar] [CrossRef]
  26. Moisa, M.B.; Feyissa, M.E.; Dejene, I.N.; Tiye, F.S.; Deribew, K.T.; Roba, Z.R.; Gurmessa, M.M.; Gemeda, D.O. Evaluation of land suitability for Moringa oleifera tree cultivation by using Geospatial technology: The case of Dhidhessa Catchment, Abay Basin, Ethiopia. Oil Crop Sci. 2023, 8, 45–55. [Google Scholar] [CrossRef]
  27. Alwan, I.A.; Aziz, N.A. Monitoring of surface ecological change using remote sensing technique over Al-Hawizeh Marsh, Southern Iraq. Remote Sens. Appl. Soc. Environ. 2022, 27, 100784. [Google Scholar] [CrossRef]
  28. Akadiri, S.S.; Alola, A.A.; Alola, U.V.; Nwambe, C.S. The role of ecological footprint and the changes in degree days on environmental sustainability in the USA. Environ. Sci. Pollut. Res. Int. 2020, 27, 24929–24938. [Google Scholar] [CrossRef] [PubMed]
  29. Wolfslehner, B.; Vacik, H. Evaluating sustainable forest management strategies with the Analytic Network Process in a Pressure-State-Response framework. J. Environ. Manag. 2008, 88, 1–10. [Google Scholar] [CrossRef] [PubMed]
  30. Aytun, C.; Erdogan, S.; Pata, U.K.; Cengiz, O. Associating environmental quality, human capital, financial development and technological innovation in 19 middle-income countries: A disaggregated ecological footprint approach. Technol. Soc. 2024, 76, 102445. [Google Scholar] [CrossRef]
  31. Li, H.; Song, W. Spatiotemporal Distribution and Influencing Factors of Ecosystem Vulnerability on Qinghai-Tibet Plateau. Int. J. Environ. Res. Public Health 2021, 18, 6508. [Google Scholar] [CrossRef] [PubMed]
  32. Yang, C.; Wang, S.; Yang, C.; Feng, C.; Gao, Y.; Sun, Q. Analysis of Temporal and Spatial Changes in Vegetation Cover along the Sichuan-Tibet Railway. Arid Zone Res. 2021, 35, 174–182. [Google Scholar] [CrossRef]
  33. Yang, J.; Huang, X. The 30 m annual land cover datasets and its dynamics in China from 1985 to 2022. Earth Syst. Sci. Data 2021, 13, 3907–3925. [Google Scholar] [CrossRef]
  34. Baig, M.H.A.; Zhang, L.; Shuai, T.; Tong, Q. Derivation of a tasselled cap transformation based on Landsat 8 at-satellite reflectance. Remote Sens. Lett. 2014, 5, 423–431. [Google Scholar] [CrossRef]
  35. Rouse, J.W.; Haas, R.d.H.; Schell, J.A.; Deering, D.W.J.N.S.P. Monitoring vegetation systems in the Great Plains with ERTS. NASA Spec. Public 1974, 351, 309. [Google Scholar]
  36. Xie, X.; Chen, M.; Tian, Y.; Wang, C. Hotspots and Prospects of Land Ecology Research in China in the Past 20 Years: A Knowledge Graph Analysis Based on Ucinet. Chin. J. Land Sci. 2018, 32, 88–96. [Google Scholar] [CrossRef]
  37. Khan, M.K.; Naeem, K.; Huo, C.; Hussain, Z. The Nexus between Vegetation, Urban Air Quality, and Public Health: An Empirical Study of Lahore. Front. Public Health 2022, 10, 842125. [Google Scholar] [CrossRef] [PubMed]
  38. Xiong, Q.; Hong, Q.; Chen, W. Temporal and Spatial Response of Ecological Environmental Quality to Land Use Transfer in Nanling Mountain Region, China Based on RSEI: A Case Study of Longnan City. Land 2024, 13, 675. [Google Scholar] [CrossRef]
  39. Ghosh, S.; Das Chatterjee, N.; Dinda, S. Urban ecological security assessment and forecasting using integrated DEMATEL-ANP and CA-Markov models: A case study on Kolkata Metropolitan Area, India. Sustain. Cities Soc. 2021, 68, 102773. [Google Scholar] [CrossRef]
  40. Mirkatouli, J.; Hosseini, A.; Neshat, A. Analysis of land use and land cover spatial pattern based on Markov chains modelling. City Territ. Archit. 2015, 2, 4. [Google Scholar] [CrossRef]
  41. Tian, H.; Jin, H.; Aun, Q.; Liang, X.; Liu, Q.; Li, X. Ecological Evaluation of Panjin Wetland Based on Analytic Hierarchy Process. Geol. Miner. Resour. 2018, 27, 268–271+287. [Google Scholar] [CrossRef]
  42. Zhao, X.; Sun, C.; Shen, X. Urban Ecological Environment Quality Evaluation Based on Analytic Hierarchy Process. China Resour. Compr. Util. 2022, 40, 163–166. [Google Scholar]
  43. Kumar, R.; Singh, S.; Bilga, P.S.; Jatin; Singh, J.; Singh, S.; Scutaru, M.-L.; Pruncu, C.I. Revealing the benefits of entropy weights method for multi-objective optimization in machining operations: A critical review. J. Mater. Res. Technol. 2021, 10, 1471–1492. [Google Scholar] [CrossRef]
  44. Gómez, A.G.; Valdor, P.F.; Ondiviela, B.; Díaz, J.L.; Juanes, J.A. Mapping the environmental risk assessment of marinas on water quality: The Atlas of the Spanish coast. Mar. Pollut. Bull. 2019, 139, 355–365. [Google Scholar] [CrossRef]
  45. Das, S.; Pradhan, B.; Shit, P.K.; Alamri, A.M. Assessment of Wetland Ecosystem Health Using the Pressure–State–Response (PSR) Model: A Case Study of Mursidabad District of West Bengal (India). Sustainability 2020, 12, 5932. [Google Scholar] [CrossRef]
  46. Li, J.; Liu, Y.; Guo, X.; Lu, Z. Land ecological security assessment and obstacle factor diagnosis in Jiangxi Province based on the PSR-TOPSIS model. Agric. Technol. 2023, 43, 96–100+5501. [Google Scholar] [CrossRef]
  47. Xu, X.L.; Liu, J.Y.; Zhang, Z.X.; Zhou, W.C.; Zhang, S.W.; Li, R.D.; Yan, C.Z.; Wu, S.X.; Shi, X.Z. A Time Series Land Ecosystem Classification Dataset of China in Five-Year Increments (1990–2010). J. Glob. Change Data Discov. 2017, 1, 52–59. [Google Scholar] [CrossRef]
  48. Cao, Z.; Wu, M.; Wang, D.; Wan, B.; Jiang, H.; Tan, X.; Zhang, Q. Space-time cube uncovers spatiotemporal patterns of basin ecological quality and their relationship with water eutrophication. Sci. Total Environ. 2024, 916, 170195. [Google Scholar] [CrossRef] [PubMed]
  49. Xian, S. Identification of Key Areas for Territorial Cological Restoration Based on Ecological Security Pattern: A Restoration Based on Ecological Security Pattern: A Case Study of Ya’an City; Sichuan Agricultral University: Ya’an, China, 2023. [Google Scholar] [CrossRef]
  50. Dong, H.; Feng, Z.; Yang, Y.; Li, P.; You, Z. Dynamic assessment of ecological sustainability and the associated driving factors in Tibet and its cities. Sci. Total Environ. 2021, 759, 143552. [Google Scholar] [CrossRef] [PubMed]
  51. Dai, X.; Yu, Z. Integrated ecosystem assessment for the transition areas between the east plateau zone and the southeast mountain-canyon zone of the Tibetan Plateau: A case study in Qamdo city, Tibet, China. Geo. Res. 2023, 42, 1971–1984. [Google Scholar]
  52. Ouyang, Z.; Zheng, H.; Xiao, Y.; Polasky, S.; Liu, J.; Xu, W.; Wang, Q.; Zhang, L.; Xiao, Y.; Rao, E.; et al. Improvements in ecosystem services from investments in natural capital. Science 2016, 352, 1455–1459. [Google Scholar] [CrossRef] [PubMed]
  53. Liu, L.; Wang, Y.; Wang, Z.; Li, D.; Zhang, Y.; Qin, D.; Li, S. Elevation-dependent decline in vegetation greening rate driven by increasing dryness based on three satellite NDVI datasets on the Tibetan Plateau. Ecol. Indic. 2019, 107, 105569. [Google Scholar] [CrossRef]
  54. Chen, K.; Qing, W.; Zhu, Y. A brief discussion on the system design of abandoned slag fields in environmentally friendly new situations in difficult mountainous areas. High-Speed Railw. Technol. 2020, 11, 87–91. [Google Scholar]
  55. Alekseenko, V.A.; Bech, J.; Alekseenko, A.V.; Shvydkaya, N.V.; Roca, N. Environmental impact of disposal of coal mining wastes on soils and plants in Rostov Oblast, Russia. J. Geochem. Explor. 2018, 184, 261–270. [Google Scholar] [CrossRef]
  56. Iqbal, J.; Dai, F.; Hong, M.; Tu, X.; Xie, Q. Failure Mechanism and Stability Analysis of an Active Landslide in the Xiangjiaba Reservoir Area, Southwest China. J. Earth Sci. 2018, 29, 646–661. [Google Scholar] [CrossRef]
  57. Lou, Y.; Wu, T.; Sun, G.; Cen, Y.; Su, B.; Gao, Z. Effect of combined rainfall and inflow on soil erosion of spoil tips. J. Soils Sediments 2022, 22, 2229–2245. [Google Scholar] [CrossRef]
  58. Zeleňáková, M.; Labant, S.; Zvijáková, L.; Weiss, E.; Čepelová, H.; Weiss, R.; Fialová, J.; Minďaš, J. Methodology for environmental assessment of proposed activity using risk analysis. Environ. Impact Assess. Rev. 2020, 80, 106333. [Google Scholar] [CrossRef]
  59. Wrótny, M.; Bohatkiewicz, J. Traffic Noise and Inhabitant Health—A Comparison of Road and Rail Noise. Sustainability 2021, 13, 7340. [Google Scholar] [CrossRef]
  60. Wrótny, M.; Bohatkiewicz, J. Impact of Railway Noise on People Based on Strategic Acoustic Maps. Sustainability 2020, 12, 5637. [Google Scholar] [CrossRef]
  61. Xu, B.; Li, J.; Luo, Z.; Wu, J.; Liu, Y.; Yang, H.; Pei, X. Analyzing the Spatiotemporal Vegetation Dynamics and Their Responses to Climate Change along the Ya’an–Linzhi Section of the Sichuan–Tibet Railway. Remote Sens. 2022, 14, 3584. [Google Scholar] [CrossRef]
  62. Cui, L.; Chen, Y.; Yuan, Y.; Luo, Y.; Huang, S.; Li, G. Comprehensive evaluation system for vegetation ecological quality: A case study of Sichuan ecological protection redline areas. Front. Plant Sci. 2023, 14, 1178485. [Google Scholar] [CrossRef] [PubMed]
  63. Zhang, M. Site Selection and Ecological Restoration Research on Railway Spoil Areas. Low Carbon World 2020, 10, 165–166. [Google Scholar] [CrossRef]
  64. Yang, X. Research on Soil Erosion Control and Ecological Restoration of Spoil Areas. Eng. Constr. Des. 2023, 2023, 139–141. [Google Scholar] [CrossRef]
  65. Yu, Y.; Yang, W.; Li, L.; Ma, L. Review on Vegetation Restoration and Reconstruction of Spoil Areas. Subtrop. Soil Water Conserv. 2015, 27, 2–5+28. [Google Scholar]
  66. Zhang, X.; Liu, L.; Zhao, T.; Chen, X.; Lin, S.; Wang, J.; Mi, J.; Liu, W. GLC_FCS30: Global land-cover product with fine classification system at 30 m using time-series Landsat imagery. Earth Syst. Sci. Data 2023, 15, 265–293. [Google Scholar] [CrossRef]
  67. Lu, Z. Diversity of National Protected Animals and Plants and Evaluation of Conservation Area Efficiency: A Case Study of the Qinghai Tibet Plateau Region; Shanghai Normal University: Shanghai, China, 2022. [Google Scholar] [CrossRef]
  68. Mörtberg, U.M.; Balfors, B.; Knol, W.C. Landscape ecological assessment: A tool for integrating biodiversity issues in strategic environmental assessment and planning. J. Environ. Manag. 2007, 82, 457–470. [Google Scholar] [CrossRef] [PubMed]
  69. Aizizi, Y.; Kasimu, A.; Liang, H.; Zhang, X.; Zhao, Y.; Wei, B. Evaluation of ecological space and ecological quality changes in urban agglomeration on the northern slope of the Tianshan Mountains. Ecol. Indic. 2023, 146, 109896. [Google Scholar] [CrossRef]
  70. Sturbois, A.; De Cáceres, M.; Bifolchi, A.; Bioret, F.; Boyé, A.; Gauthier, O.; Grall, J.; Grémare, A.; Labrune, C.; Robert, A.; et al. Ecological quality assessment: A framework to report ecosystems quality and their dynamics from reference conditions. Ecosphere 2023, 14, e4726. [Google Scholar] [CrossRef]
  71. Cook, N.A.; Sarver, E.A.; Krometis, L.H.; Huang, J. Habitat and water quality as drivers of ecological system health in Central Appalachia. Ecol. Eng. 2015, 84, 180–189. [Google Scholar] [CrossRef]
Figure 1. Location of the study area.
Land 13 00857 g001
Figure 2. Workflow diagram of methodology and analysis process.
Land 13 00857 g002
Figure 3. A 2000–2020 land use transition Sankey diagram for the study area. Conversions of the same type have been removed.
Land 13 00857 g003
Figure 4. Spatial distribution of vegetation quality in the study area for (A) 2000, (B) 2010, (C) 2020, and (D) 2022.
Land 13 00857 g004
Figure 5. Spatial distribution of environmental quality in the study area for (A) 2000, (B) 2010, (C) 2020, and (D) 2022.
Land 13 00857 g005
Figure 6. Ecosystem classification of the study area.
Land 13 00857 g006
Figure 7. Land ecological security index in the study area. FOE = forest ecosystem, FAE = farmland ecosystem, GE = grassland ecosystem, OE = other ecosystems, SE = settlement ecosystem, WE = water and wetland ecosystem.
Land 13 00857 g007
Figure 8. Main obstacles to land ecological security in the study area in 2000, 2010, 2020, and 2022. FOE = forest ecosystem, FAE = farmland ecosystem, GE = grassland ecosystem, OE = other ecosystems, SE = settlement ecosystem, WE = water and wetland ecosystem.
Land 13 00857 g008
Figure 9. Spatial distribution of integrated land ecology evaluation in the study area in (A) 2000, (B) 2010, (C) 2020, and (D) 2022.
Land 13 00857 g009
Figure 10. Changes in integrated land ecological quality in the study area. (A) Integrated land ecological quality changes from 2000 to 2010. (B) Integrated land ecological quality changes from 2010 to 2020. (C) Integrated land ecological quality changes from 2020 to 2022. (D) The impact of residue disposal sites on integrated land ecological quality from 2020 to 2022.
Land 13 00857 g010
Figure 11. Validation of the integrated land ecology evaluation results. Images with suffixes A, B, and C are Landsat images; images with suffixes D, E, F, G, and H represent field imagery; and images with suffixes a, b, c, d, e, f, g, and h are the corresponding land ecological evaluation results.
Land 13 00857 g011
Figure 12. Example of one of the residue disposal sites in the study area.
Land 13 00857 g012
Figure 13. Mangkang Mountain residue disposal site in the study area and its effect on land ecology. Images with the titles 2000, 2010, 2020, and 2022 are Landsat images.
Land 13 00857 g013
Figure 14. Species distribution and area proportions in the study area.
Land 13 00857 g014
Table 1. Information of MODIS datasets used in the present study.
Product DatasetNameTemporal GranularityPeriodResolution
NPPMODIS/061/MYD17A3HGF8-day interval2000–2010–2020–2022500 m
GPPMODIS/061/MYD17A3HGF8-day interval500 m
LAIMODIS/061/MYD15A2H8-day interval500 m
ETMODIS/006/MOD16A28-day interval500 m
LSTMODIS/006/MOD11A1Daily1000 m
Table 2. Scale used for the AHP comparisons.
ScoreMeaning
1Equally important
3Moderately important
5Strongly important
7Very strongly important
9Extremely important
2, 4, 6, 8Intermediate values between the preference
Table 3. Classification of indices.
ClassificationReference
Surface vegetation index classification
RatingVery highHighMiddleLowVery lowKhan et al. [37]
Index range1–0.70.7–0.40.4–0.250.25–0.150.15–0
Environmental index classification
RatingVery highHighMiddleLowVery lowXiong et al. [38]
Index range1–0.70.7–0.50.5–0.30.3–0.150.15–0
Land ecological security classification
SecuritySafeGenerally safeBasically safeLess secureUnsafeGhosh et al. [39]
Index range1–0.80.8–0.60.6–0.40.4–0.20.2–0
Land ecology index classification
RatingVery highHighMiddleLowVery lowLiu et al. [13]
Index range5–3.73.7–33–2.52.5–1.51.5–0
Table 4. Land use/land cover transition matrix for the study area.
2000\2010CroplandForestShrubGrasslandWaterSnow/IceBarrenImpervious
Cropland156918615250014
Forest33419,5546350000
Shrub168151350000
Grassland294678933,50195314021
Water130182450222
Snow/Ice000614322131590
Barren0002984436218540
Impervious000070039
2010\2020CroplandForestShrubGrasslandWaterSnow/IceBarrenImpervious
Cropland146339924340023
Forest17120,04947120000
Shrub2104981010000
Grassland484123432,68723427230
Water3301092552661
Snow/Ice00056618437010
Barren1102921342017110
Impervious000040051
Disclaimer/Publisher’s Note: The statements, opinions and data contained in all publications are solely those of the individual author(s) and contributor(s) and not of MDPI and/or the editor(s). MDPI and/or the editor(s) disclaim responsibility for any injury to people or property resulting from any ideas, methods, instructions or products referred to in the content.

