Article

Whether Wheat–Maize Rotation Influenced Soil Organic Carbon Content in Sushui River Basin

1
College of Resources and Environment, Shanxi Agricultural University, Jinzhong 030801, China
2
Department of Ecomomics and Management, Yuncheng University, Yuncheng 044000, China
*
Author to whom correspondence should be addressed.
Land 2024, 13(6), 859; https://doi.org/10.3390/land13060859
Submission received: 5 May 2024 / Revised: 7 June 2024 / Accepted: 13 June 2024 / Published: 15 June 2024

Abstract

:
Enhancing soil organic carbon (SOC) content in farmland is crucial for soil quality maintenance and food security. However, the relationship between crop rotation and SOC sequestration remains unclear. We used sample data on SOC, collected in September of every year, from cultivated land for quality monitoring from 2017 to 2021, combined with spatially extracted planting system information, and focused on the effects of wheat–maize crop rotation on SOC in the Sushui River Basin. An analysis of variance (ANOVA) indicated that the SOC content was only significantly different between wheat monoculture and maize monoculture. Among the three cropping systems, wheat–maize rotation did not show absolute superiority. The Geodetector analysis showed that the planting system dominated the spatial distribution of soil organic carbon (p = 0.05), but its explanatory factor was only 5%, and the explanatory power was significantly improved after interaction with other factors. Geographically weighted regression showed that wheat–maize rotation had a trade-off effect with elevation and synergistic effects with rainfall and pH. It displayed a synergistic effect with temperature in the southwest and a trade-off effect in the northeast. The degrees of trade-offs and synergy varied spatially among all interacting factors. We focused on the spatial heterogeneity of soil organic carbon in a small watershed, and the results had scientific significance for the layout of planting systems according to local conditions and the improvement in soil organic carbon levels.

1. Introduction

Soil is the largest carbon (C) pool in terrestrial ecosystems, being five times larger than the C pools of forests and other vegetation and three times larger than the atmospheric C pool [1]. As an important component of terrestrial ecosystems, agricultural soils can fix atmospheric carbon dioxide and increase soil organic carbon (SOC) content through crop photosynthesis [2]. Sixty percent of the C in the soil C pool exists in the form of organic matter in the soil, and the organic C content of agricultural soils is an important indicator of soil C sequestration and fertility [3]. Therefore, the study of agricultural SOC sequestration is of great significance for food and ecological security [4,5].
The main factors affecting the spatial distribution of SOC are climate, topography, vegetation, soil properties [6], and land use type [7]. Agricultural management activities dominated by cropping systems at certain scales have significant influences on organic C [3,8]. Conservation tillage practices, such as no-till, mulching, and diversified crop rotation, reduce C emissions and increase C inputs on farmland [9,10].
The cropping system is a fundamental agricultural activity that significantly influences SOC. Some papers on soil organic carbon spatial mapping have highlighted that adding cropping system factors can improve the accuracy of spatial mapping [3,8,11]. As one of the principles of conservation agriculture, crop rotation has received widespread attention because of its ecological functions, such as mitigating soil degradation and slowing down SOC loss [12]. In a meta-analysis conducted by Zheng et al. [12], crop rotation was shown to be able to enhance SOC in general as it can keep the ground covered, increase soil biodiversity, and boost the number of agglomerates and, in turn, organic C content [13,14,15,16]. Cover cropping can increase soil vigor by increasing the SOC content and crop yield [17,18]. Soil C sequestration mainly occurs through crop root secretions, and monocrop cultivation has a shorter duration of soil C sequestration than rotational grain cultivation [19]. However, the enhancement is affected by climate, soil properties, and other agronomic practices [12,20,21], indicating that SOC changes under the influence of crop rotation are strongly spatially heterogeneous. Understanding the interactive effects of crop rotation and environmental factors on SOC is crucial for enhancing C sequestration potential, alleviating climate stress, and improving soil fertility to enhance farm productivity [22].
The Sushui River Basin is the birthplace of farming civilization and a significant food production area in Yuncheng City and Shanxi Province. It plays a significant role in studies on the impact of human activities on farmland organic C for regional food security and climate regulation. The current crop cultivation system mainly includes wheat–maize rotation, wheat monoculture, and maize monoculture. The straw returning policy has been successfully implemented. Research shows that the yield of grain crops such as wheat and maize increases with an increase in SOC content in the root system [23]. Theoretically, wheat–maize crop rotation can both maintain perennial soil cover and increase soil C input by returning crop straw to the field in both seasons, thus enhancing soil C sequestration significantly [10]. However, a study showed that the SOC content is higher in rice monocrops than in rice–wheat rotations [3]. Similar results have been observed under soybean cultivation, with SOC content being higher under monocropping than under soybean–maize rotation, and that under soybean monocropping, the SOC content was significantly higher than that under maize monocropping [24]. Did wheat–maize rotation and straw returning significantly affect soil organic carbon in the Sushui River Basin? Are the effects spatially heterogeneous? What factors lead to its spatial differences?
Geodetector and geographical weighted regression (GWR) have been widely used in various research fields, such as socioeconomics [25], natural ecology [26,27,28], and soil studies [17]. However, there are few studies on the effect of the spatial heterogeneity of planting systems.
Based on the above analysis, we propose two hypotheses: (1) wheat–maize rotations significantly enhance SOC compared with wheat or maize monocultures, and (2) rotations may exhibit spatially variable effects in the Sushui River Basin under the influence of other factors. First, we identified the significant factors influencing SOC changes in the Sushui River Basin using a geographic detector, and analyzed the effects of crop rotation and other factors on SOC. Second, we used GWR and introduced the interaction term between the cropping system and the significant influencing factors to examine the mechanism and spatial variation in the interaction factors. The results of the present study could provide valuable insights to facilitate the planting planning and implementation of conservation tillage in wheat–maize rotation areas.

2. Materials and Methods

2.1. Study Area Overview

The Sushui River Basin is situated in the Yuncheng Basin, located to the southeast of the Loess Plateau in the southwest of Shanxi, China. It comprises six counties—Jiangxian, Wenxi, Xia, Yanhu, Yongji, Linyi, and the southern part of Wanrong County. The total area of the basin is 5774 km2, of which approximately 43% is arable land. The elevation in the area ranges from 308 m to 1939 m (Figure 1). The watershed experiences a temperate semi-arid continental monsoon climate, with an average annual rainfall of 563 mm; the average temperature is 13.6 °C, and the frost-free period lasts 207 d. The main soil type in the region is Calcaric Cambisols, with a smaller presence of Calcaric Fluvisols, Gleyic Luvisols, Rendzic Leptosols, Salic Fluvisols, and Calcic Luvisols.
The Sushui River Basin is an important grain production area in Shanxi Province. Arable land can be classified into two types: dry land and watered land. Traditionally, winter wheat and summer maize were the predominant crops. However, the planting structure has changed due to the influence of factors such as economic gain and labor migration. Figure 1 illustrates the distribution of wheat and maize planting areas, which are mainly distributed in Yongji City, Wenxi County, Xia County, and Jiang County. Among these, Yongji City has a wide distribution, while Xia County, Wenxi County, and Jiang County exhibit scattered planting areas.

2.2. Soil Data and Influential Factors

MODIS NDVI high-temporal-resolution data were combined with Sentinel-2 high-spatial-resolution data in order to extract wheat–maize rotation data. Based on these data, it is estimated that the wheat monoculture area is about 70,052 hm2, the maize cultivation area is about 58,711 hm2, and the wheat–maize rotation area is about 54,027 hm2. By combining the distribution characteristics of the wheat and maize growing areas between 2017 and 2021, in total, 112 sampling sites of continuous monoculture wheat (47), monoculture maize (30), and wheat–maize rotation (35) were selected among the arable land monitoring sampling sites in Yuncheng City (Figure 1). Each year from, 2017 to 2021, after the maize harvest, five 20 cm soil samples were collected around the monitoring site via the “S” spot sampling method using a roto-rotary soil auger, and the five soil samples were mixed and transported to the laboratory. The soil samples were air-dried, debris was removed, and the samples were ground and sieved; then, SOM content was determined via external heating with potassium dichromate. The SOC content was determined by dividing the SOM content by 1.724. The soil data were used to analyze changes in the SOC, along with the spatial characteristics and driving factors. Based on the primary factors known to affect SOC based on the literature, we considered the specific characteristics of the study area, including average annual rainfall, average annual temperature, elevation, slope, slope direction, soil type, soil bulk density, soil pH, and land type. The data sources and processing details are listed in Table 1. In addition to soil type, land type, and planting system, other continuous factors were standardized and classified using the quantile method for geographical detectors.

2.3. Analysis Methods

2.3.1. Analysis of Variance (ANOVA)

The ANOVA showed that the SOC content did not differ significantly between the cropping systems. It was measured at the 5% significance level using the least significant difference (LSD) [29].

2.3.2. Geodetector

Geodetector [30] detects spatially stratified heterogeneity and the interaction of each influencing factor by stratifying the influencing factors. This study investigated the effects of major food cropping patterns and other factors on the spatial heterogeneity of the SOC. It also aimed to assess the effects of interaction between cropping systems and other factors on SOC spatial heterogeneity. The following formulae were used:
q = 1 h = 1 L N h σ h 2 N σ 2 = 1 S S W S S T
S S W = h = 1 L N h σ h 2 ,     S S T = N σ 2
where h = 1, …, L is the stratification of the independent variable X, i.e., classification or partitioning; Nh and N are the numbers of cells in layer h and the study area, respectively; σ h 2 and σ2 are the variances in SOC content in layer h and the whole study area, respectively; and SSW and SST are the sum of the variance within layers and the total variance of the study area, respectively.

2.3.3. GWR Model

GWR [31,32] is an extension of the OLS regression model that uses data from each sample point and the surrounding sampling points to build a local regression model that presents the spatial heterogeneity of the effect of the explanatory variables on the dependent variable. The formula used is as follows:
y i = β 0 u i , v i + k β k u i , v i x i k + I i
where u i , v i represents the geographical coordinates of the i-th sample point, and β 0 u i , v i and β k u i , v i are the regression parameters that vary with the sample point. The coefficients are calculated as follows:
β ^ u i , v i = ( x T W u i , v i X ) 1 X T W ( u i , v i ) Y
where W u i , v i is the sample point weight. Points closer to the target sample point have greater influence, and thus higher weight, while farther points have lower weight. This study utilized an adaptive kernel function with different regional spatial ranges based on sample point density. The bandwidth was determined using the Akaike Information Criterion (AICc).
To examine the spatial influence of the interaction between the wheat–maize rotation system and significant influencing factors on SOC, we introduced a dummy variable for wheat–maize rotation as a reference. The interaction factor was obtained by multiplying two factors, and its coefficient represented the trade-off or synergistic relationship between the two factors. A positive value indicated a synergistic promotion of organic C change, while a negative value indicated a trade-off between the two factors.

3. Results

3.1. Analysis of Spatial and Temporal Variation Patterns in SOC Content

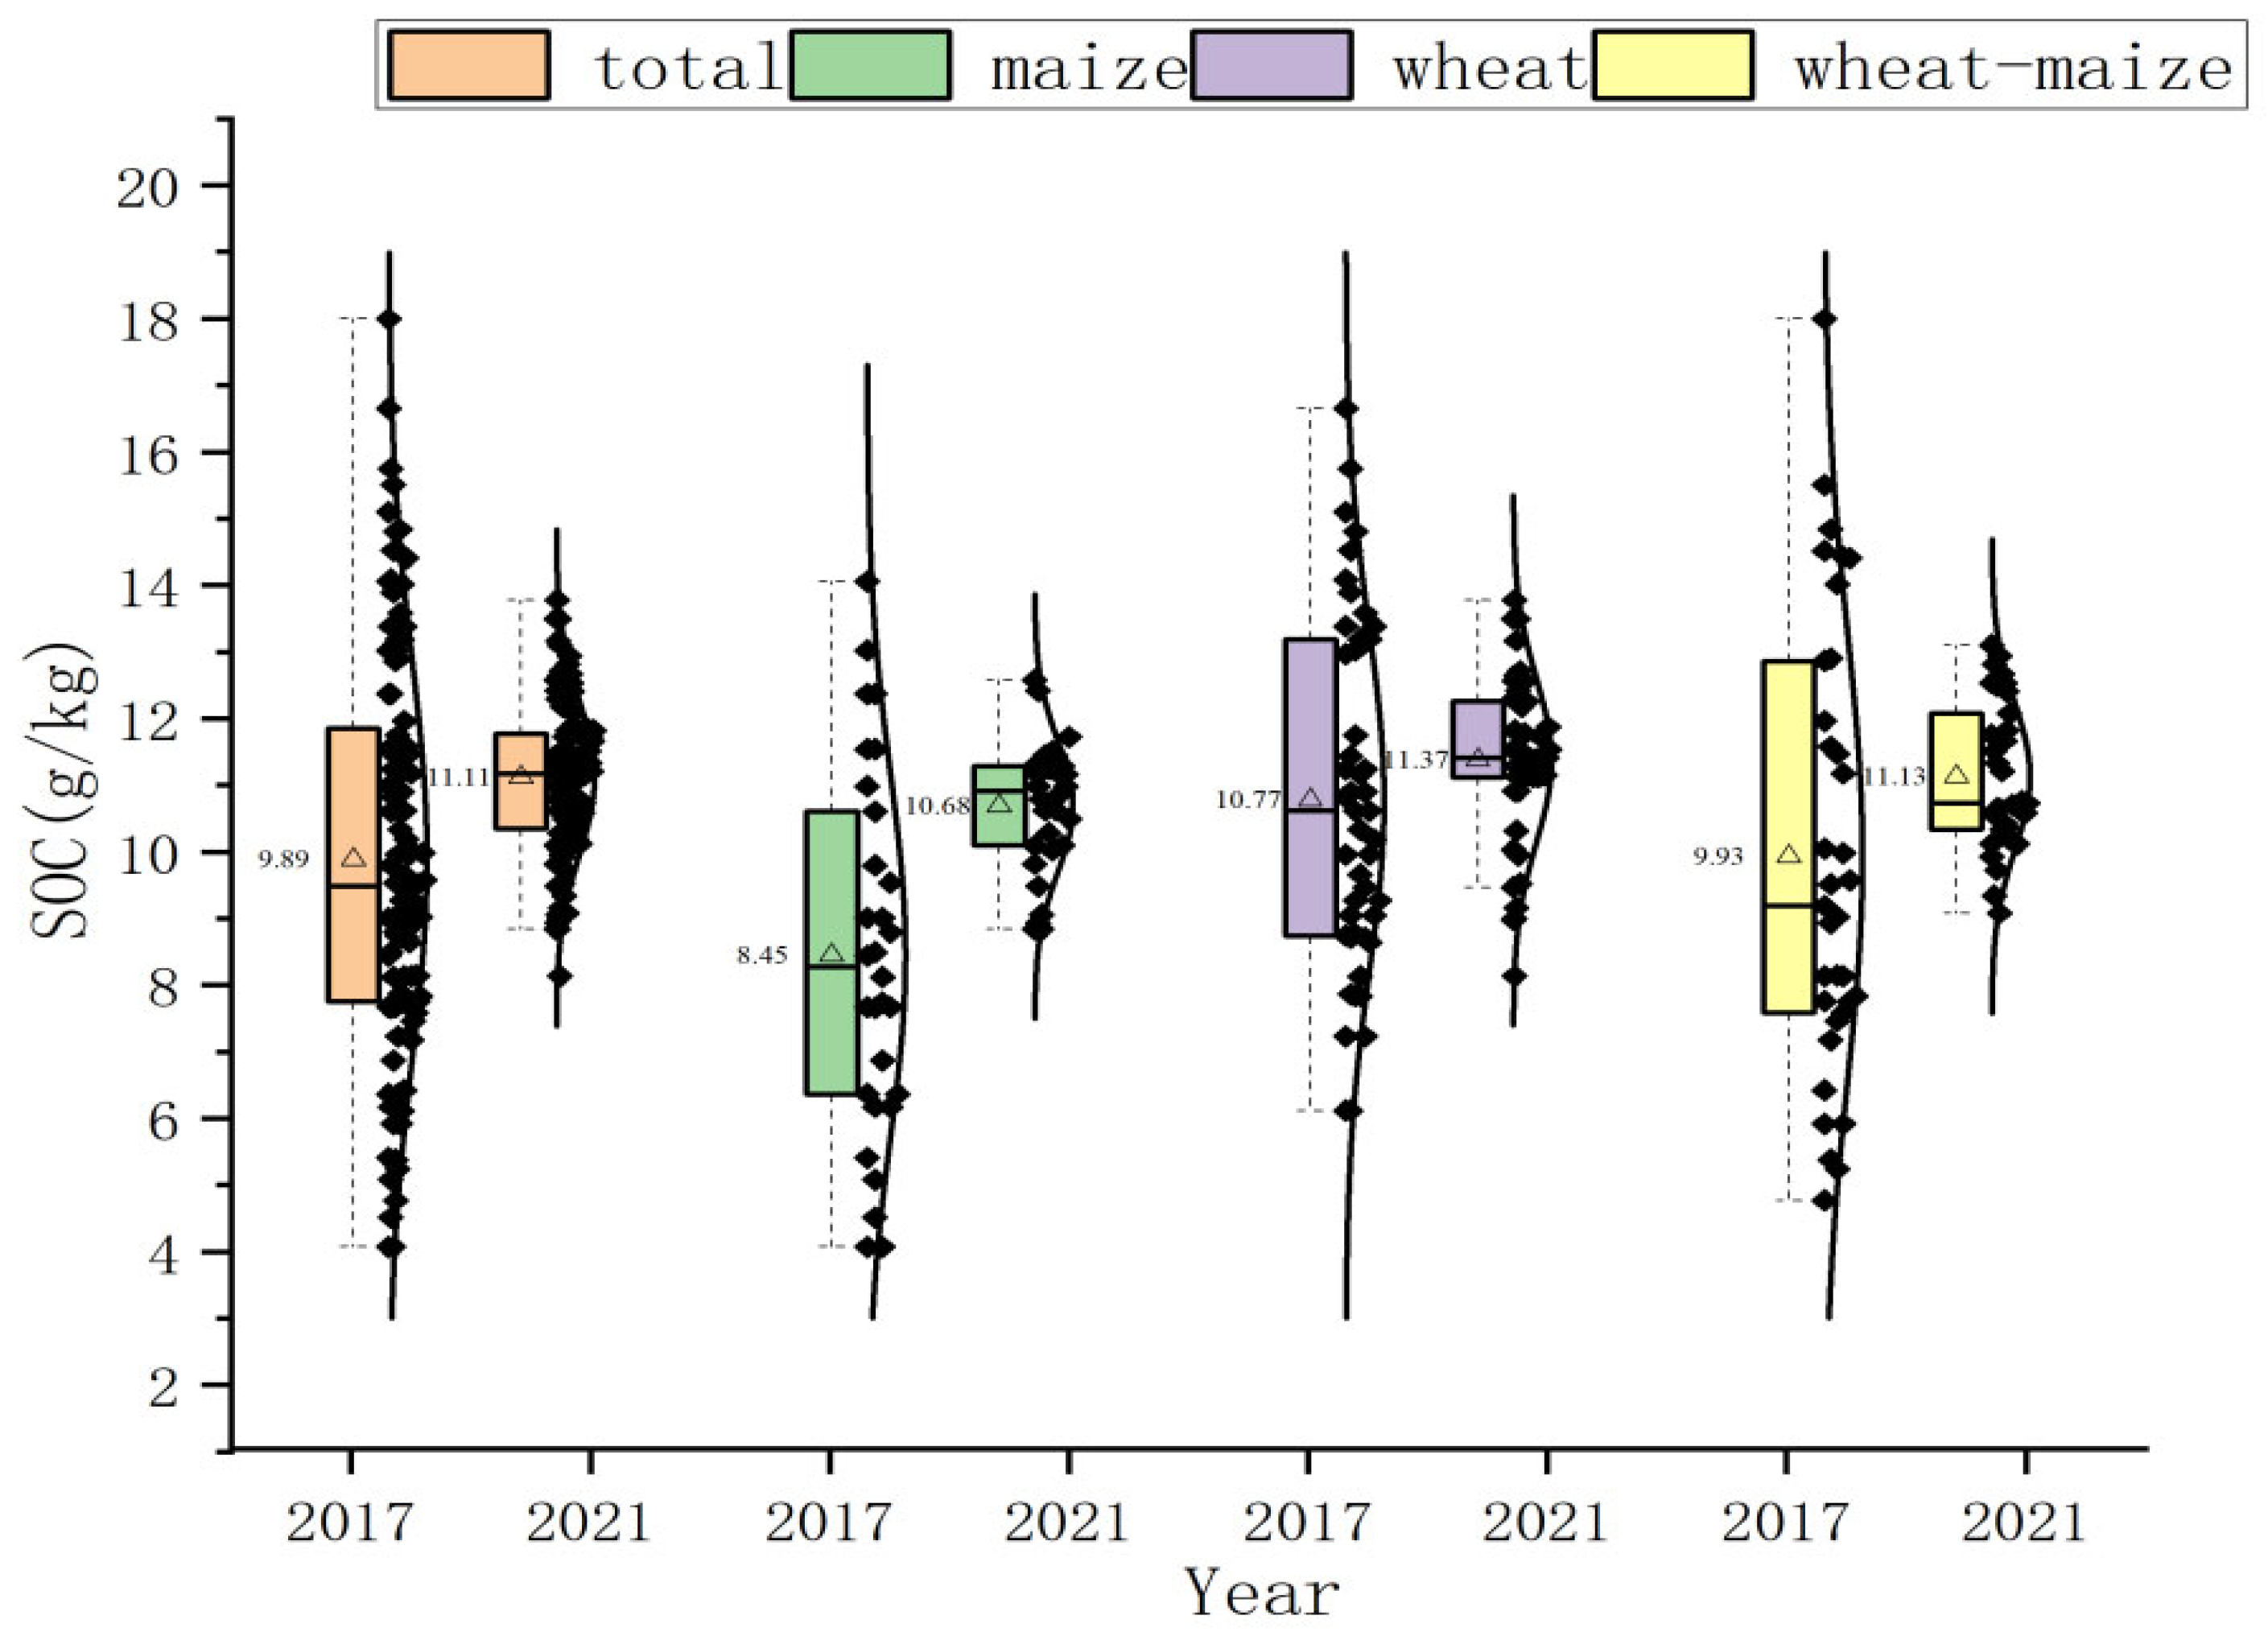
3.1.1. Changes in Basic Statistical Indicators

On average, the SOC content in the sample sites of continuous maize monoculture, wheat monoculture, and wheat–maize rotation showed an increasing trend from 2017 to 2021. In 2017, the highest average SOC content was wheat monoculture (10.77 g/kg), and the variation range of the sample values was 6.12–16.65 g/kg. The average SOC content of crop rotation (9.93 g/kg) was ranked after that of wheat monoculture, and its sample values ranged from 4.77 to 17.99 g/kg. The maize monoculture’s average SOC content was 8.45 g/kg, and the variation range of the sample values was 4.07–14.05 g/kg. Even after four years of continuous planting, the ranking remained the same: wheat monoculture (11.37 ± 1.22 g/kg), wheat–maize rotation (11.13 ± 1.09 g/kg), and maize monoculture (10.68 ± 0.98 g/kg). There were instances where the SOC content decreased at certain sample sites. The highest values of all three cropping systems decreased compared with those in 2017. An analysis of variance (ANOVA) showed that the mean SOC content only differed significantly between wheat monoculture and maize monoculture (p < 0.05). The differences between the other planting methods were not statistically significant. After four years of continuous tillage, the concentration of SOC in the sampling points under the three cropping patterns increased. Notably, the minimum values of SOC content in 2021 were greater in the crop rotation than those in the other two monoculture systems. The minimum organic carbon content value in the crop rotation field showed the highest increase (Table 2 and Figure 2).

3.1.2. Changes in Spatial Distribution of SOC

The SOC content of the sampling points in 2017 ranged between 4.07 and 17.99 g/kg. In 2021, the range changed from 8.14 to 13.78 g/kg. In Figure 3a,b, the red and orange sampling points, representing a SOC content <8 g/kg in 2017, disappeared in 2021, and the points were mainly distributed within Yongji City. In 2017, sampling points with SOC content >10 g/kg were mainly distributed in Wenxi County. However, by 2021, the points with >10 g/kg were extended to the whole basin. Some sampling points exhibited a decrease in SOC content between 2017 and 2021. There were 14 rotating cropping sites and 25 monocropping sites among 39 organic C decline sites. Figure 3c shows the points where the organic carbon declined, in red dots, which are mainly located in the central region of Wenxi County.

3.2. Geodetector-Based Spatial Heterogeneity Factor Analysis of SOC

Table 3 shows that several factors significantly (p < 0.05) influenced the change in SOC from 2017 to 2021. The factors included cropping system (x1), elevation (x6), pH (x7), rainfall (x8), and temperature (x10). However, the classification of long-term maize monoculture, wheat monoculture, and wheat–maize rotation as standard cropping systems explained only 5% of the spatial variation in the SOC. The results indicate that the SOC varied insignificantly among the cropping systems, while the SOC under the same cropping system showed large spatial heterogeneity throughout the watershed. Among the influencing factors, temperature (x10) had the highest explanatory power (19%) for SOC spatial heterogeneity, followed by rainfall (x8) (16%), pH (12%), and elevation (x6) (17%).
The factor interaction analysis (Figure 4) revealed that the change in SOC content following four years of crop cultivation from 2017 to 2021 was influenced by factors such as cropping system (x1), land type (x2), soil type (x3), slope (x4), slope direction (x5), elevation (x6), pH (x7), rainfall (x8), bulkiness (x9), and temperature (x10). Among the factors, 75% exhibited a two-factor non-linear enhancement and the remaining 25% exhibited a two-factor enhancement. The interactions between the planting system (x1) and other factors demonstrated bivariate non-linear enhancement, excluding rainfall (x8).
The interaction produced an enhanced degree of influence. By comparing the q values, it was observed that the interaction between the cropping system and factors that significantly explained spatial heterogeneity in the single-factor probes increased the spatial explanatory power of SOC. The comparisons showed that the highest increase in the explanatory power was observed for the interaction between cropping system (x1) and elevation (x6) (27%), followed by cropping system (x1) and temperature (x10) (27%), cropping system (x1) and rainfall (x8) (20%), and cropping system (x1) and pH (x7) (20%). Elevation had the highest impact (10%), followed by pH (8%), temperature (8%), and rainfall (4%). Therefore, when considering the effect of a cropping system on the SOC, special attention should be paid to the degrees and directions of the effects under different altitudes, pH, temperature, and rainfall conditions to select the optimal cropping system for SOC enhancement.

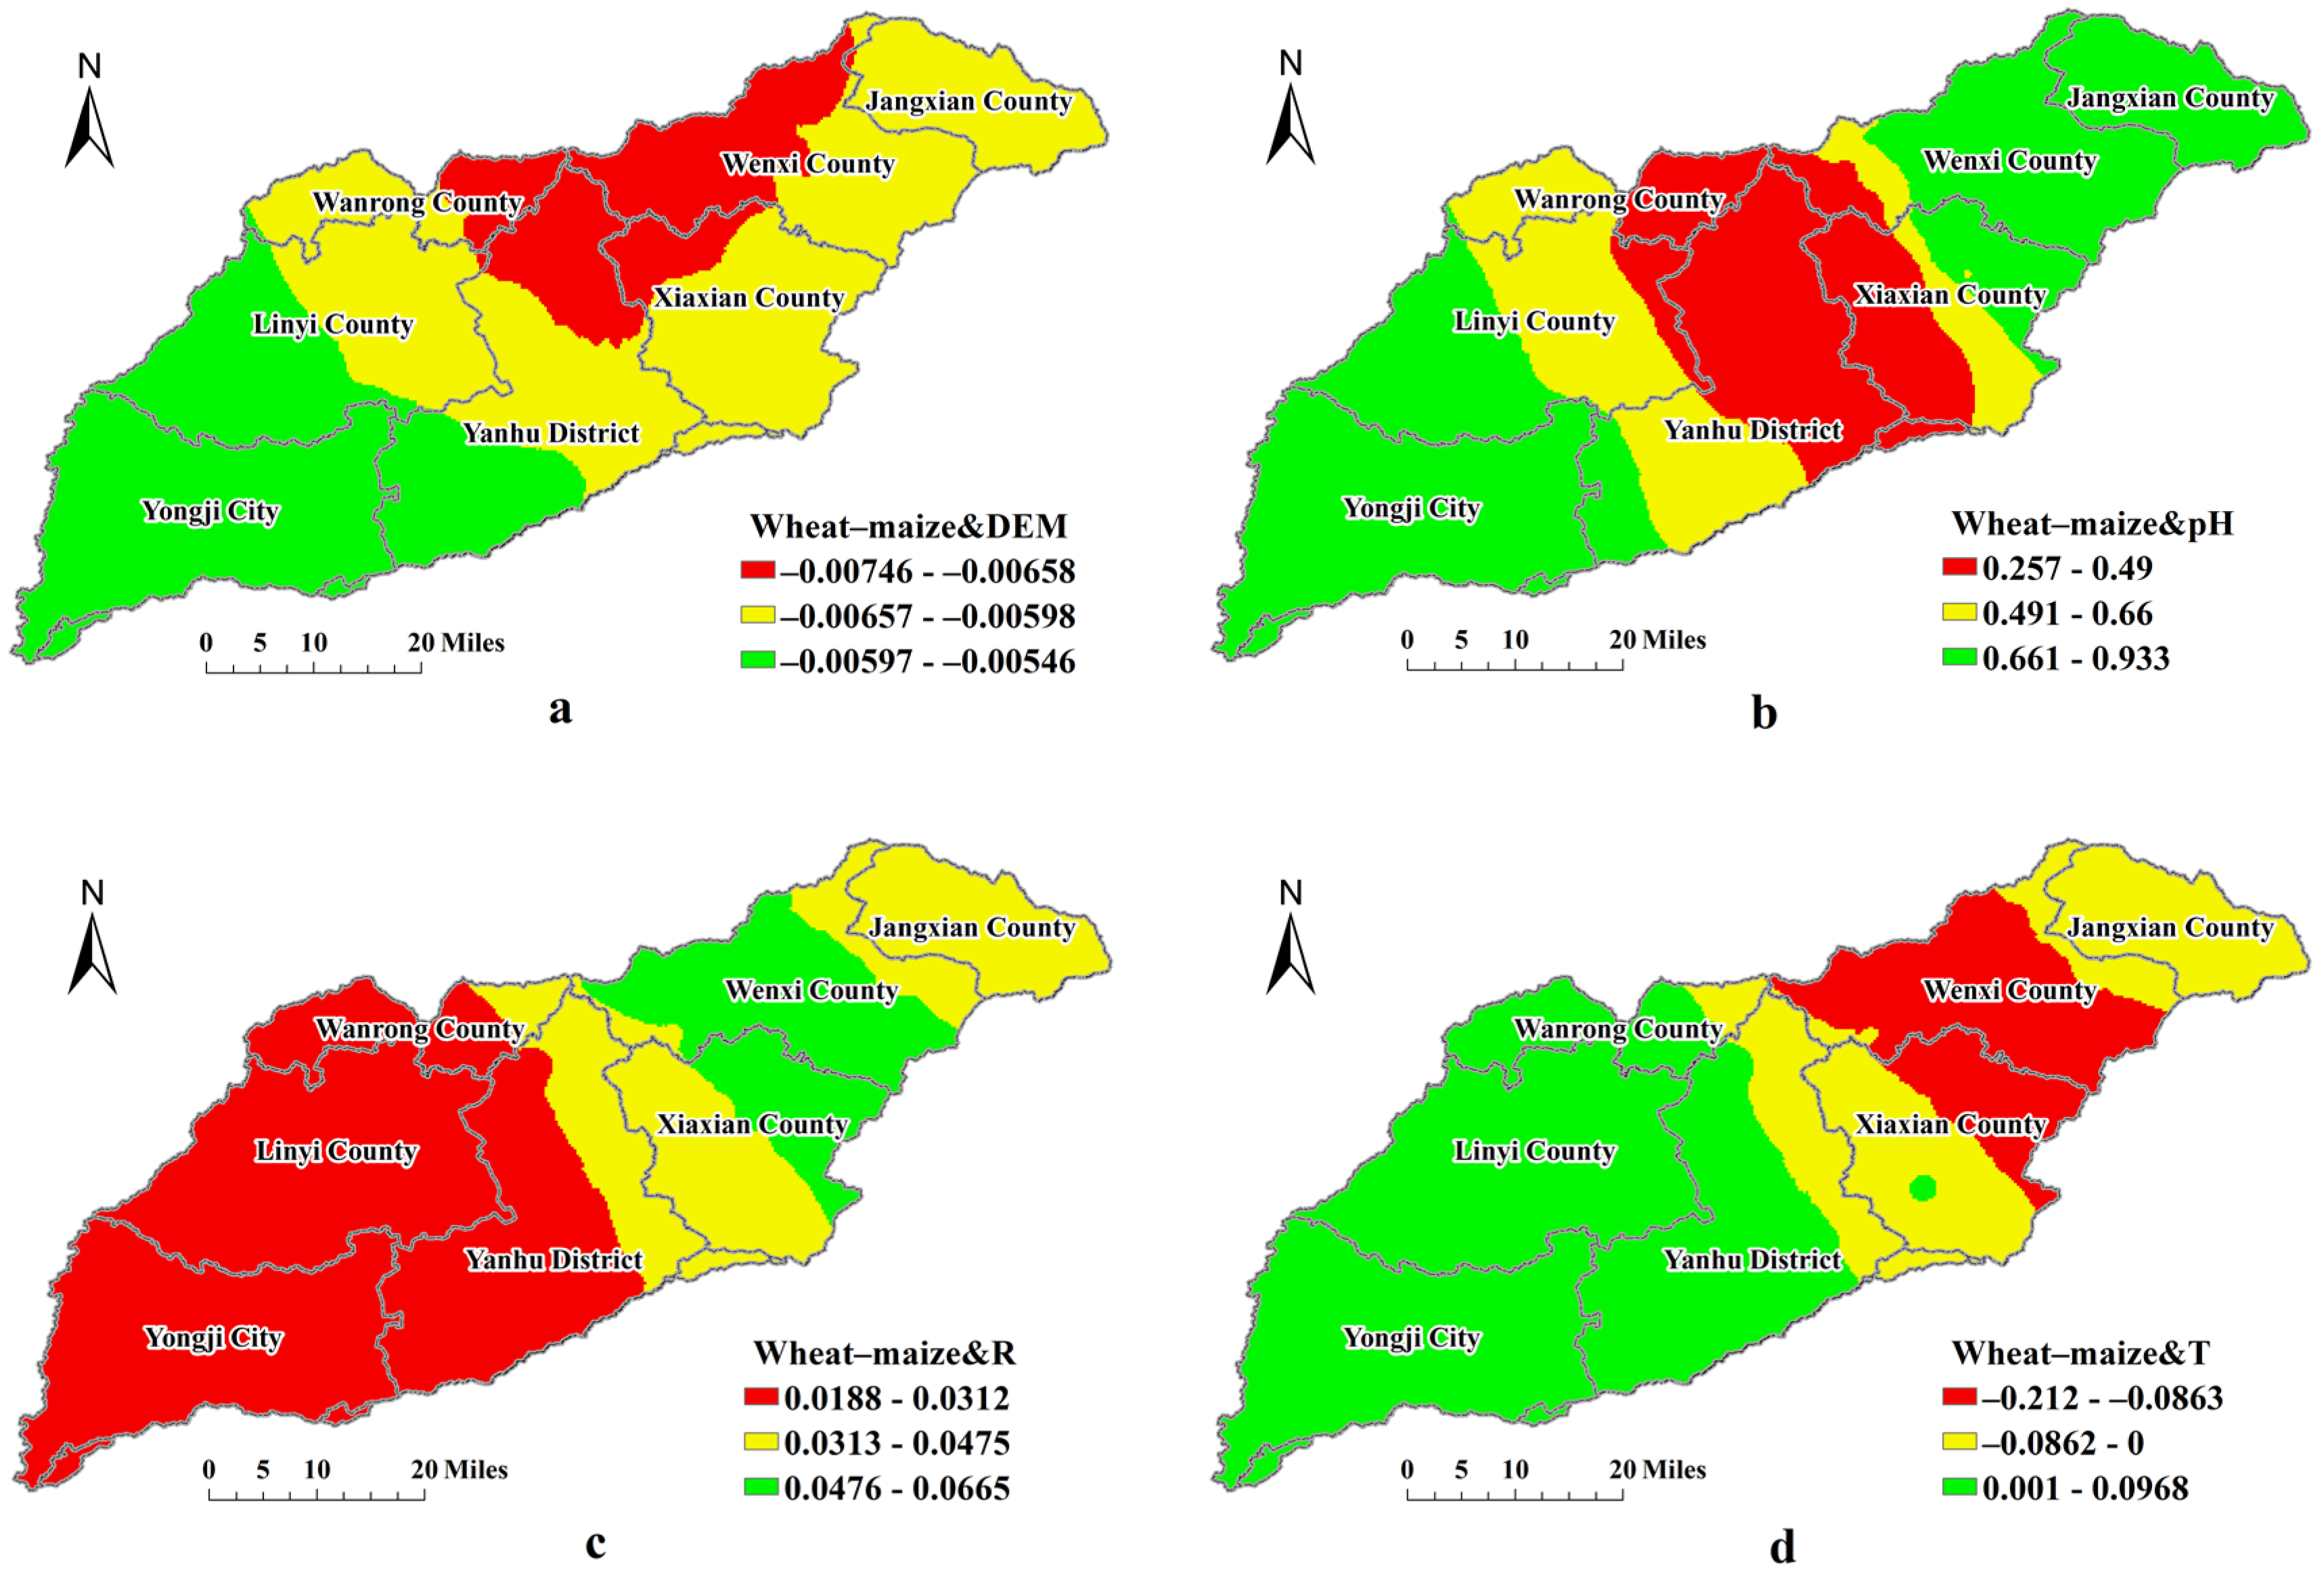
3.3. GWR-Based Analysis of the Effect of Wheat–Maize Crop Rotation on SOC

Using the change in SOC from 2017 to 2021 as the dependent variable, four interaction terms were introduced into the GWR model: wheat–maize rotation and elevation (x11), wheat–maize rotation and pH (x12), wheat–maize rotation and rainfall (x13), and wheat–maize rotation and temperature (x14). Relative to that of the OLS regression model (Table 4), the fitting accuracy of the GWR model was improved, and the optimal bandwidth corresponding to the red pool criterion was reduced, indicating that the GWR could better model the relationship between interaction factors and SOC.
The coefficients of the interaction term (x11) between wheat–maize rotation and elevation were all negative (Table 4), indicating that the effects of wheat–maize rotation and elevation on SOC were trade-offs in the whole watershed. The absolute values of the coefficients were all <0.01, and the degree of their effects was not large. This shows that the negative effects of rotation on SOC increased with an increase in elevation. The greatest degree of influence was found in the northwestern part of Wenxi County and Xia County, and the northern hilly cultivated land in Yanhu District (Figure 5a).
The coefficients of interaction factors x12 and x13 for wheat–maize rotation with pH and rainfall were all positive (Table 4), indicating that crop rotation with pH and rainfall can synergistically promote the growth of organic C content in the watershed. Figure 5b shows that the pH values of the whole watershed are suitable for crop rotation, and the promotion of SOC content growth via crop rotation is stronger (>0.5) upstream and downstream, but relatively weak midstream. According to Figure 5c, rainfall had little effect on SOC in rotation in most areas of Yongji, Linyi County, and Yanhu District downstream of the watershed, but had a greater effect in the middle and upstream areas.
The interaction factor (x14) coefficient between wheat–maize rotation and temperature had 52 positive and 60 negative values, indicating that the combination of the two factors had both trade-off and synergistic effects on SOC changes in the watershed. Figure 5d shows that Jiangxian, Wenxi, and Xia counties had negative values, and in Yanhu District, Yongji City, Linyi County, and Wanrong County, the factor had positive values.

4. Discussion

4.1. Effect of Cropping System on SOC

After four years of continuous tillage, the SOC in most sample sites in the watershed showed an increasing trend; however, some sample sites showed a decreasing trend (Figure 3c). The results showed that both monoculture and crop rotation enhanced SOC content in the watershed. This may be closely related to the straw return policy implemented in recent years because wheat and maize straw returns can improve soil structure, SOC content, and crop yield [33]. Wheat–maize rotation did not show a clear advantage based on the mean level, and the highest mean SOC was observed under continuous wheat monoculture conditions, followed by wheat–maize rotation and maize monoculture. There was no significant difference in SOC content between wheat–maize rotation and wheat monoculture, or between wheat–maize rotation and maize monoculture. A significant difference in the SOC content was only evident between wheat monoculture and maize monoculture. Therefore, the first hypothesis, that wheat–maize rotation did not significantly increase SOC content, was rejected. This finding is similar to the results reported by Seben Junior et al. [24], where the effect of crop rotation was lower than that of soybean monoculture and higher than that of maize monoculture in soybean–maize rotation versus monoculture.
However, the greatest increase in the minimum SOC content indicates that wheat–maize rotation can produce better results under certain conditions than under the other two monoculture patterns. Crop rotation accounted for only 29% of the sample sites with increased, mainly within Yongji City and the southwestern of the watershed, and the increased monoculture sample sites were mainly in the northeastern region of the watershed. In addition, rotation accounted for 36% of the sample that showed organic carbon reduction, mainly distributed in Wenxi County. The study only obtained 5% explanatory power for the cropping systems for SOC, indicating that the difference between the three cropping systems was not significant, while the spatial variation in the cropping system was greater within the watershed. Therefore, the effect of wheat–maize crop rotation on SOC was spatially heterogeneous within the watershed, and its applicability and suitable areas need to be explored further.
The Geodetector study identified temperature, rainfall, pH, elevation, and cropping system as significant factors affecting the spatial variation in SOC in the Sushui River Basin. Among these factors, the cropping system had the lowest explanatory power, which is consistent with the results of previous studies [22,34,35]. Although crop rotation did not significantly increase the SOC content, the combination of crop rotation and other factors enhanced the explanatory power of the spatial heterogeneity of the SOC. This indicates that there is a certain interaction between the factors affecting SOC, and that the interaction between crop rotation and other factors should be noted in the suitability analysis.

4.2. Spatial Heterogeneity of the Effect of Wheat and Maize Crop Rotation Cultivation on SOC

The trade-off between crop rotation and elevation indicated that crop rotation decreased the SOC as the elevation increased (Figure 5a). The Sushui River Basin is dominated by mountains and hills in the southeast, northwest, and northeast, with an overall high northeast and low southwest. Therefore, crop rotation is more suitable in the southwestern part of the Linyi and Yanhu districts in the lower part of the basin. Several studies on the status of the replanting index have shown that the replanting index of hilly and mountainous areas is lower than that of plains [35,36]. In actual agricultural production, in the northwestern part of Wenxi and Xiaxian counties and the northern hilly cultivated land of Yanhu District, farmers opt to cultivate wheat or maize alone to guarantee grain production because of insufficient irrigation and temperature conditions. The adoption of a wheat−maize rotation cropping system will seriously affect the biomass and yield of the crops and reduce C sequestration in the soil.
It can be seen from Figure 5b,c that the interaction factors between planting system and pH or rainfall are both positive, but the positive values are distributed differently in the basin. Thus, the interaction between crop rotation and pH and rainfall synergistically promoted SOC growth. The most significant effect of crop rotation on SOC enhancement was observed when the pH was in the middle value of 6−8 and rainfall was in the 600−1000 mm range [12]. The pH range of soils in the Sushui River Basin is 7.5−9; when the pH value is in the 6−8 range, it is favorable for biodiversity. This can promote crop growth to improve straw return and maintain soil aggregate stability, thereby promoting SOC sequestration [12,13,14,15,16]. When the average rainfall is 600–1000 mm, crop rotation can significantly promote SOC growth [12]. Rainfall in the Sushui River Basin falls within this range; therefore, crop rotation and rainfall factors contribute to organic carbon. However, Figure 5c shows that under the interaction between crop rotation and rainfall, the response of organic carbon was strong in the upper and middle reaches, but not in the lower reaches. This is because rainfall mainly affects the soil water supply. In the lower reaches, where irrigation conditions can be guaranteed, the response to rainfall is not significant, whereas in the upper and middle reaches, where irrigation conditions cannot be guaranteed, rainfall will significantly affect the soil water supply. This finding is consistent with the conclusion that water availability significantly affects SOC formation in water-limited areas [37].
The interaction between crop rotation and temperature had both trade-off and synergistic effects on the SOC in the study area. Suitable temperature and moisture conditions can enhance crop biomass and improve the soil aggregate structure by increasing the amount of straw returned to the field, thus enhancing the SOC content [38]. In the areas with restricted irrigation conditions in Jiangxian, Wenxi, and Xia counties, there was a trade-off between crop rotation and temperature. This was because insufficient irrigation resulted in water stress, which led to reduced crop biomass and straw return to the field. Furthermore, elevated temperatures can promote SOC decomposition [39], eventually leading to soil C loss. In Yanhu District, Yongji City, Linyi County, and Wanrong County, where irrigation conditions are favorable, relatively high temperature conditions can support the growth of wheat and maize crops in both seasons and increase C input through straw return to the field in both seasons, thus enhancing the SOC content. Therefore, under temperature-constrained conditions, wheat monoculture or maize monoculture should be selected to maintain SOC balance by maintaining biomass and soil C input.
In conclusion, the effect of crop rotation on soil organic carbon in the Sushui River Basin was influenced by other factors, resulting in significant spatial heterogeneity, which confirmed the second hypothesis. The most suitable areas for enhancing SOC in farmland through wheat–maize rotation are Yongji City, southwestern Linyi County, and the western part of Yanhu District. These regions have suitable temperatures, rainfall, and irrigation conditions [40]. Promoting wheat–maize rotation in these areas can simultaneously enhance grain production and increase farmland C storage [41]. The most unsuitable areas include the northwestern part of Wenxi County, a small part of the southeastern part of Wanrong County, and the mountainous and hilly area in the northern part of Yanhu District. These regions have poor irrigation conditions and do not meet the requirements for double crop growth [42]. Consideration should be given to the construction of farmland water facilities and the exploration of other suitable cash crops. In other regions, if wheat–maize rotation is implemented, ensuring an adequate water supply during grain growth is crucial. Additionally, combining no-till practices with straw mulching under wheat–maize cultivation could mitigate the SOC release caused by rising temperatures.

4.3. Shortcomings and Directions for Improvement

This study utilized sample points from arable land quality monitoring data, which had limitations in terms of distribution and did not comprehensively capture the soil properties influencing SOC. Furthermore, this study focused solely on the spatial heterogeneity of the effects of wheat–maize rotation on SOC, neglecting the spatial heterogeneity of the effects of SOC on crop yield. Therefore, the present study has certain limitations. Future studies should be conducted through surveys and sampling data to explore the relationship between crop rotation, straw return, no-till, and other conservation tillage practices on SOC or crop yield, which could facilitate the development of rational planning layouts that enhance farmland C sequestration and improve productivity. Furthermore, Due to the influence of industrial production, population growth and agricultural activities, agricultural soils in many parts of the world were more or less polluted by heavy metals. Some heavy metals had adverse effects on soil health and crop growth, affected soil organic carbon sequestration through affecting crop growth, soil microbial diversity, soil structure, and aggregate stability, and had a negative impact on carbon cycle and climate mitigation [43,44,45].The effect of heavy metals on soil organic carbon should also be paid attention to in addition to other factors. The geochemical survey data on the Sushui River Basin showed that the heavy metal content in the basin was within the normal range, which was related to the fact that the region was mainly agricultural. Therefore, the effect of heavy metals was not considered in this study. However, human activities in agricultural production also lead to a certain degree of soil heavy metal pollution [43].Therefore, in subsequent studies, heavy metal indexes will be added to sample monitoring. The changes in heavy metals themselves and their effects on soil health and soil organic carbon will be studied.

5. Conclusions

This sample site study revealed that the overall SOC of farmlands in the Sushui River watershed exhibited an increasing trend from 2017 to 2021. The effect of wheat−maize rotation on SOC enhancement was suboptimal at the average level. Therefore, the first hypothesis was rejected. A Geodetector analysis showed that the explanatory power of the cropping method was only 5% for the spatial heterogeneity of SOC. Moreover, the average organic carbon content under the three cropping systems was in the order of wheat monoculture (11.37 g/kg) > wheat–maize rotation (11.13 g/kg) > maize monoculture (10.68 g/kg). In the present study, crop rotation did not have an absolute advantage. However, the explanatory power increased after interaction with other factors, indicating that there was a spatially heterogeneous effect of cropping rotation in the study area. After introducing interaction terms for spatial exploration using GWR, crop rotation exhibited a trade-off relationship with elevation, synergistic relationships with rainfall and pH, and a synergistic–trade-off relationship with temperature. This supported the second hypothesis. According to the degree of trade-off and synergy, the most suitable areas in the Sushui River Basin for enhancing SOC in farmland using wheat–maize rotation were Yongji City, southwestern Linye County, and the western part of the Salt Lake District. The least suitable areas were northwestern Wenxi County, a small part of southeastern Wanrong County, and the mountainous and hilly area in northern Yanhu District. The integration of suitable conservation tillage practices could amplify the positive effects of crop rotation on SOC. The results of the present study provide a scientific basis for formulating reasonable planting methods. There are some limitations in the use of monitoring point data in this study. Future studies should conduct special sample investigations and collection based on the research content, and include other human activity factors affecting SOC to study the change in SOC and its impact on crop productivity.

Author Contributions

Data curation, Y.J. and H.D.; writing—original draft, Y.J.; project administration, R.B. and W.S.; writing—review and editing, H.Z., H.J. and Y.J. All authors have read and agreed to the published version of the manuscript.

Funding

The research was funded by the Institute of Salt Protection and Utilization of Yuncheng City, Shanxi Province. The project name is “Research on Industrial Transformation and Regional high-quality Development of Yuncheng Salt Lake”.

Data Availability Statement

The datasets presented in this article are not readily available because the data are part of an ongoing study.

Acknowledgments

We would like to thank the Land Information Technology Laboratory of Shanxi Agricultural University for its data support and technical help.

Conflicts of Interest

The authors declare no conflicts of interest.

References

  1. Pan, G.; Ding, Y.; Chen, S. Exploring the nature of soil organic matter from humic substances isolation to SOMics of molecular assemblage. Adv. Earth Sci. 2019, 34, 451–470. [Google Scholar]
  2. Xiao, G.; Hu, Y.; Zhang, Q.; Wang, J.; Li, M. Impact of cultivation on soil organic carbon and carbon sequestration potential in semiarid regions of China. Soil Use Manag. 2020, 36, 83–92. [Google Scholar] [CrossRef]
  3. Wu, Z.; Liu, Y.; Han, Y.; Zhou, J.; Liu, J.; Wu, J. Mapping farmland soil organic carbon density in plains with combined cropping system extracted from NDVI time-series data. Sci. Total Environ. 2021, 754, 142120. [Google Scholar] [CrossRef] [PubMed]
  4. Lal, R. Managing world soils for food security and environmental quality. Adv. Agron. 2001, 74, 155–192. [Google Scholar] [CrossRef]
  5. Lal, R. Soil carbon-sequestration impacts on global climate change and food security. Science 2004, 304, 1623–1627. [Google Scholar] [CrossRef] [PubMed]
  6. Dong, Q.; Chen, X.; Chen, J.; Zhang, C.; Liu, L.; Cao, X.; Zang, Y.; Zhu, X.; Cui, X. Mapping winter wheat in North China using Sentinel 2A/B data: A method based on phenology-time weighted dynamic time warping. Remote Sens. 2020, 12, 1274. [Google Scholar] [CrossRef]
  7. Lamichhane, S.; Kumar, L.; Wilson, B. Digital soil mapping algorithms and covariates for soil organic carbon mapping and their implications: A review. Geoderma 2019, 352, 395–413. [Google Scholar] [CrossRef]
  8. Tian, H.; Zhang, J.; Zheng, Y.; Shi, J.; Qin, J.; Ren, X.; Bi, R. Prediction of soil organic carbon in mining areas. CATENA 2022, 215, 106311. [Google Scholar] [CrossRef]
  9. Saikat, C.; Nanthi, B.; Mark, F.; Binoy, S.; Jharna, R.; Mary, B.; Hossain, M.; Kim, G. Role of cultural and nutrient management practices in carbon sequestration in agricultural soil. Adv. Agron. 2020, 166, 131–193. [Google Scholar]
  10. Yang, Y.; Ti, J.; Zou, J.; Wu, Y.; Rees, R.M.; Harrison, M.T.; Li, W.; Huang, W.; Hu, S.; Liu, K.; et al. Optimizing crop rotation increases soil carbon and reduces GHG emissions without sacrificing yields. Agric. Ecosyst. Environ. 2023, 342, 108220. [Google Scholar] [CrossRef]
  11. Yang, L.; Song, M.; Zhu, A.X.; Qin, C.; Zhou, C.; Qi, F.; Li, X.; Chen, Z.; Gao, B. Predicting soil organic carbon content in croplands using crop rotation and Fourier transform decomposed variables. Geoderma 2019, 340, 289–302. [Google Scholar] [CrossRef]
  12. Zheng, F.; Liu, X.; Ding, W.; Song, X.; Li, S.; Wu, X. Positive effects of crop rotation on soil aggregation and associated organic carbon are mainly controlled by climate and initial soil carbon content: A meta-analysis. Agric. Ecosyst. Environ. 2023, 355, 108600. [Google Scholar] [CrossRef]
  13. Schmer, M.R.; Jin, V.L.; Wienhold, B.J.; Becker, S.M.; Varvel, G.E. Long-term rotation diversity and nitrogen effects on soil organic carbon and nitrogen stocks. Agrosystems Geosci. Environ. 2020, 3, e20055. [Google Scholar] [CrossRef]
  14. Lobe, I.; Sandhage-Hofmann, A.; Brodowski, S.; Du Preez, C.C.; Amelung, W. Aggregate dynamics and associated soil organic matter contents as influenced by prolonged arable cropping in the South African Highveld. Geoderma 2011, 162, 251–259. [Google Scholar] [CrossRef]
  15. Ma, P.; Nan, S.; Yang, X.; Qin, Y.; Ma, T.; Li, X.; Yu, Y.; Bodner, G. Macroaggregation is promoted more effectively by organic than inorganic fertilizers in farmland ecosystems of China—A meta-analysis. Soil Tillage Res. 2022, 221, 105394. [Google Scholar] [CrossRef]
  16. Bansal, S.; Yin, X.; Sykes, V.; Lee, J.; Jagadamma, S. Soil aggregate-associated organic carbon and nitrogen response to long-term no-till crop rotation, cover crop, and manure application. Soil Sci. Soc. Am. J. 2021, 85, 2169–2184. [Google Scholar] [CrossRef]
  17. Nandan, R.; Singh, V.; Singh, S.S.; Kumar, V.; Hazra, K.K.; Nath, C.P.; Poonia, S.; Malik, R.K.; Bhattacharyya, R.; McDonald, A. Impact of conservation tillage in rice–based cropping systems on soil aggregation, carbon pools and nutrients. Geoderma 2019, 340, 104–114. [Google Scholar] [CrossRef] [PubMed]
  18. Lal, R. Soil organic matter content and crop yield. J. Soil Water Conserv. 2020, 75, 27A–32A. [Google Scholar] [CrossRef]
  19. Montgomery, D.R. Farming Revolution: Let the Soil Change Machine; Ganlin, M.Z., Translator; Shanghai Science and Technology Press: Shanghai, China, 2019. [Google Scholar]
  20. Deiss, L.; Sall, A.; Demyan, M.S.; Culman, S.W. Does crop rotation affect soil organic matter stratification in tillage systems. Soil Tillage Res. 2021, 209, 104932. [Google Scholar] [CrossRef]
  21. Luo, Z.; Wang, E.; Sun, O.J. Soil carbon change and its responses to agricultural practices in Australian agro-ecosystems: A review and synthesis. Geoderma 2010, 155, 211–223. [Google Scholar] [CrossRef]
  22. Zhao, S.; Liu, B.; Lu, L.; Li, D.; Zhang, G. Spatial modeling of soil organic matter over low relief areas based on geographically weighted regression. Trans. Chin. Soc. Agric. Eng. 2019, 35, 9. [Google Scholar]
  23. Lal, R. Soil health and carbon management. Food Energy Secur. 2016, 5, 212–222. [Google Scholar] [CrossRef]
  24. Seben Junior, G.F.; Corá, J.E.; Lal, R. Soil aggregation according to the dynamics of carbon and nitrogen in soil under different cropping systems. Pesq. Agropec. Bras. 2016, 51, 1652–1659. [Google Scholar] [CrossRef]
  25. Fan, L.; Zhang, D. Research on influence mechanism and spatial heterogeneity characteristics of block vitality in Beijing: Based on multi-scale geographically weighted regression. City Plan. Rev. 2022, 46, 11. [Google Scholar]
  26. Chen, Y.; Li, J.F.; Xu, J. The impact of socio-economic factors on ecological service value in Hubei Province: A geographically weighted regression approach. China Land Sci. 2015, 29, 89–96. [Google Scholar]
  27. Hu, H.; Hong, Z. Analyzing spatial effects of influencing factors on air quality in the Yellow River Basin using multi-scale geographically weighted regression. J. Appl. Stat. Manag. 2023, 42, 416–426. [Google Scholar]
  28. Liu, C.; Wu, X.; Wang, L. Analysis on land ecological security change and affect factors using RS and GWR in the Danjiangkou reservoir area, China. Appl. Geogr. 2019, 105, 1–14. [Google Scholar] [CrossRef]
  29. Vincent, D.P.O.; Lal, R. Using meta-analyses to assess pedo-variability under different land uses and soil management in central Ohio, USA. Geoderma 2014, 232–234, 56–68. [Google Scholar]
  30. Wang, J.; Xu, C. Geodetector: Principle and prospective. Acta Geogr. Sin. 2017, 72, 19. [Google Scholar]
  31. Binbin, L.; Martin, C.; Paul, H.; Fotheringham, A. Geographically weighted regression with a non-euclidean distance metric: A case study using hedonic house price data. Int. J. Geogr. Inf. Sci. 2014, 28, 660–681. [Google Scholar] [CrossRef]
  32. Wu, D. Spatially and temporally varying relationships between ecological footprint and influencing factors in China’s provinces using Geographically Weighted Regression (GWR). J. Clean. Prod. 2020, 261, 121089. [Google Scholar] [CrossRef]
  33. Zhao, H.; Shar, A.G.; Li, S.; Chen, Y.; Shi, J.; Zhang, X.; Tian, X. Effect of straw return mode on soil aggregation and aggregate carbon content in an annual maize-wheat double cropping system. Soil Till. Res. 2018, 175, 178–186. [Google Scholar] [CrossRef]
  34. Zhang, C.; Tang, Y.; Xu, X.; Kiely, G. Towards spatial geochemical modelling: Use of geographically weighted regression for mapping soil organic carbon contents in Ireland. Appl. Geochem. 2011, 26, 1239–1248. [Google Scholar] [CrossRef]
  35. Wang, J.; Wang, X.; Xu, M.; Feng, G.; Zhang, W.; Yang, X.; Huang, S. Contributions of wheat and maize residues to soil organic carbon under long-term rotation in north China. Sci. Rep. 2015, 5, 11409. [Google Scholar] [CrossRef] [PubMed]
  36. Zhang, C.; He, H. The evolution of spatiotemporal patterns and the influencing factors of the multiple cropping index of cultivated land in Southwest China. Agric. Res. Arid Areas 2020, 38, 222–230. [Google Scholar]
  37. Wynn, J.G.; Bird, M.I.; Vellen, L.; Grand-Clement, E.; Carter, J.; Berry, S.L. Continental-scale measurement of the soil organic carbon pool with climatic, edaphic, and biotic controls. Glob. Biogeochem. Cycles 2006, 20, GB1007. [Google Scholar] [CrossRef]
  38. Liu, W.X.; Wei, Y.X.; Li, R.C.; Chen, Z.; Wang, H.D.; Virk, A.L.; Lal, R.; Zhao, X.; Zhang, H.L. Improving soil aggregates stability and soil organic carbon sequestration by no-till and legume-based crop rotations in the North China Plain. Sci. Total Environ. 2022, 847, 157518. [Google Scholar] [CrossRef]
  39. Liao, Y.; Cui, J.; Yang, Z. Temperature sensitivity of soil respiration from the typical land-use types in the Sanjiang Plain, northeastern Heilongjiang Province. Geol. Bull. China 2012, 31, 164–171. [Google Scholar]
  40. Bi, R.; Du, J.; Chai, Y. A study on soil diversity in Sushui River based on the DEM. Chin. J. Soil Sci. 2013, 44, 266–270. [Google Scholar]
  41. da Silva, P.C.G.; Tiritan, C.S.; Echer, F.R.; dos Cordeiro, C.F.S.; Rebonatti, M.D.; de Santos, C.H. No-tillage and crop rotation increase crop yields and nitrogen stocks in sandy soils under agroclimatic risk. Food Crop. Resour. 2020, 258, 107947. [Google Scholar] [CrossRef]
  42. Zhao, Y.; Wang, B.; Liu, Q.; Song, T.; Zhang, X.; Chen, Y.; Sui, P. Characteristics of farmland water consumption under two-year wheat-maize interannual rotation patterns in Heilonggang Plain. Acta Agron. Sin. 2022, 48, 1787–1799. [Google Scholar]
  43. Shaheen, M.E.; Tawfik, W.; Mankola, A.F.; Gagnon, J.E.; Fryer, B.J.; El-Mekawy, F.M. Assessment of contamination levels of heavy metals in the agricultural soils using ICP-OES. Soil Sediment Contam. Int. J. 2022, 32, 665–691. [Google Scholar] [CrossRef]
  44. Fayek, N.; Tawfik, W.; Khalafallah, A.; Hamed, S.; Mousa, W.; Fikry, M. Evaluation of Heavy Metal Presence in Agricultural Samples of Lactuca sativa and Trifolium alexandrinum Using Picosecond Laser-Induced Breakdown Spectroscopy and Flame Atomic Absorption Spectroscopy in Banha and Giza Governorates, Egypt. Minerals 2023, 13, 1300. [Google Scholar] [CrossRef]
  45. Mankoula, A.F.; Tawfik, W.; Gagnon, J.; Fryer, B.; El-Mekawy, F.; Shaheen, M. Assessment of heavy metals content in the agricultural soils of kafr el-zayat egypt using laser ablation inductively coupled plasma mass spectrometry and inductively coupled plasma optical emission spectroscopy. Egypt. J. Chem. 2021, 64, 1167–1177. [Google Scholar] [CrossRef]
Figure 1. Distribution of study area and sample sites.
Land 13 00859 g001
Figure 2. Soil organic carbon (SOC) trends in different wheat–maize cropping systems. The figure shows the distribution and changes in four datasets: all sampling sites, maize monocrops, wheat monocrops, and wheat–maize rotations. The change from 2017 to 2021 was significant (p < 0.05) in the four datasets. The differences in SOC in maize monocropping, wheat monocropping, and wheat–maize rotation groups between 2017 and 2021 were significant (p < 0.05).
Land 13 00859 g002
Figure 3. Spatial distribution and trends of soil organic carbon. (a,b) are the distribution maps of soil organic carbon at sample points in 2017 and 2021 respectively, and (c) is the spatial distribution map of soil organic carbon change at sample points from 2017 to 2021.
Land 13 00859 g003
Figure 4. Interaction of factors influencing SOC.
Land 13 00859 g004
Figure 5. Spatial heterogeneity of SOC based on interaction between wheat–maize rotation and other factors. (a,b,c,d) represent the spatial distribution of factors after interaction between wheat-corn wheel and DEM, pH, rainfall and temperature, respectively..
Land 13 00859 g005
Table 1. Data sources and processing.
DataSourceGWR Data ProcessingGeodetector Data Processing
Soil organic C contentArable land quality monitoring data from Yuncheng City in 2017 and 2021Normalized values using Z-Score
x = x μ σ
where μ   is   the   mean   of   the   sample   data ,   and   σ is the standard deviation of the sample data.
Stratification of data using quantile method
pH
Soil bulk density
Elevation30 m SRTMDEM data from the Geospatial Data Cloud website of the Computer Network Information Center of the Chinese Academy of Sciences (www.gscloud.cn, accessed on 10 September 2020)
Slope-
Slope direction-
Average annual rainfallRegional station data from the Yuncheng Meteorological Bureau for the years 2017–2021. After calculating the annual average values, kriging interpolation was used to obtain the spatial distribution data of the study areaNormalized values using Z-Score
x = x μ σ
where μ   is   the   mean   of   the   sample   data ,   and   σ is the standard deviation of the sample data
Average annual temperature
Soil typeHarmonized World Soil Database (HWSD)-Calcaric Cambisols, Calcaric Fluvisols, Gleyic Luvisols, Rendzic Leptosols, Salic Fluvisols, and Calcic Luvisols
Land TypeArable land quality monitoring data from Yuncheng City in 2017 and 2021.-Dry land and watered land
Food growing systemMODIS and Sentinel-2 spatial extractionThe values of 1, 2, and 3 were assigned to the maize, wheat, and wheat–maize rotations based on the duration of crop coverage of the soil in a year under monoculture, wheat, and rotation conditionsMaize monoculture, wheat monoculture, and wheat–maize crop rotation
Table 2. Comparison of soil organic carbon content between 2017 and 2021.
Crop Growing SystemFood Crop
Planting System
Maximum Value
(g/kg)
Minimum Value
(g/kg)
Coefficient of Variation
201720212017202120172021
MonocropMaize14.0612.584.078.8431.71%9.17%
Wheat16.6513.786.128.1423.86%10.73%
Crop rotationWheat–maize17.9913.104.779.0833.43%9.79%
Table 3. SOC change factor detection.
x1x6x7x8x10
q statistic0.050.170.120.160.19
p-value0.050.0000.030.0000.01
Table 4. GWR coefficients and tests.
GWR FactorOLS Coefficient
Average ValueStandard DeviationMinimum ValueMedianMaximum ValuePositive ValuesNegative Values
x11−0.0060.00−0.007−0.006−0.0050112−0.01
x120.640.170.260.720.9311200.75
x130.040.010.020.040.0711200.02
x14−0.010.09−0.21−0.030.0952600.07
Diagnostic InformationGWRR2 = 40.28%AICc: 541.19CV = 7.37
OLSR2 = 31.96%AICc: 547.852CV = 7.79
Disclaimer/Publisher’s Note: The statements, opinions and data contained in all publications are solely those of the individual author(s) and contributor(s) and not of MDPI and/or the editor(s). MDPI and/or the editor(s) disclaim responsibility for any injury to people or property resulting from any ideas, methods, instructions or products referred to in the content.

