Article

How to Plan Urban Parks and the Surrounding Buildings to Maximize the Cooling Effect: A Case Study in Xi’an, China

1
College of Landscape Architecture and Arts, Northwest A&F University, Yangling, Xianyang 712100, China
2
Xi’an High-Tech Zone Natural Resources and Planning Bureau, Xi’an 710117, China
3
School of Human Settlements and Civil Engineering, Xi’an Jiaotong University, Xi’an 710049, China
4
School of Architecture, Chang’an University, Xi’an 710055, China
*
Author to whom correspondence should be addressed.
Land 2024, 13(8), 1117; https://doi.org/10.3390/land13081117
Submission received: 18 June 2024 / Revised: 19 July 2024 / Accepted: 21 July 2024 / Published: 23 July 2024

Abstract

:
Urban areas with parks tend to have the best outdoor thermal comfort in regions with high urban heat island effects during summer. This study analyzed the synergistic cooling effects of 94 urban parks and the adjacent built-up areas in six districts of Xi’an City using four cooling indicators: park cooling intensity (PCI), park cooling area (PCA), park cooling effect (PCE), and park cooling gradient (PCG). The results showed that 84 out of 94 parks exhibited significant cooling effects, with an average PCI of 1.98 °C, PCA of 51.7 ha, PCE of 6.6, and PCG of 8.2 °C/km. Correlation analyses indicated that the intrinsic park attributes, external buffer zone building height, and building density were the main factors affecting the cooling effect. The park landscape configuration, building height, and density significantly influenced the PCI and PCG, while the park shape and size were crucial for the PCA (positive) and PCE (negative). The optimal park areas for improving the thermal environment were identified as 26 ha (cooling area focus, building density <13%) and 15 ha (cooling intensity focus, building height <21 m, density >32%). This study provides theoretical guidance for planning urban parks and the surrounding areas based on cooling effects, offering insights for future climate resilience planning.

1. Introduction

Urbanization has increased urban heat waves, posing a significant threat to urban residents’ health. High temperatures and the associated heat stress not only raise mortality and morbidity rates among residents but also adversely impact mental health [1]. Furthermore, urbanization has precipitated numerous ecological issues, including the urban heat island phenomenon. Generally, urban areas experience higher temperatures than rural areas, a phenomenon known as the urban heat island (UHI) effect [2,3,4]. Addressing residents’ thermal comfort through surface temperature and humidity adjustments has garnered considerable attention from the global scientific community and policymakers.
Effective urban planning can enhance the urban thermal environment and mitigate the urban heat island effect. Various interventions exist to alleviate the UHI’s impact, among which urban green spaces are recognized as sustainable cooling strategies. Urban parks, integral components of urban green spaces (UBGs), effectively alleviate urban heat stress [4,5]. As cooling agents, urban parks often exchange heat with surrounding urban areas, thus enhancing the comfort of the urban thermal environment and mitigating the urban heat island effect [6]. Parks provide cooling to urban areas in two ways. Firstly, by lowering the temperature inside the park and thus providing shelter from the heat, and secondly, by cooling the area around the park. Previous studies have utilized various metrics, including the park cooling intensity (PCI), cooling gradient (PCE), cooling area (PCA), and cooling efficiency (PCG), to evaluate parks’ cooling effect [5]. Standard assessment methods, such as the equal-area method and fixed-radius method, are widely employed [7].
Currently, the methods used to determine the surrounding area of a park and obtain the cooling indicator are the fixed-radius method and the equal-area radius method. However, these methods primarily quantify the cooling effect of urban parks based on the maximum values, such as the maximum cooling distance and maximum cooling intensity [8,9], which overlook the spatially nonlinear cooling effect of urban parks. To address this limitation, the inflection point method is employed to explore the cooling effect from both the maximum value and the cumulative value perspectives, thereby improving the accuracy of determining the cooling distance.
Parks’ cooling effects are shaped by various factors, including the internal landscape structure (such as the area, shape, location, and configuration), surrounding conditions (such as buildings and land cover), local climate, and human activities [10,11,12]. Liao found that doubling the park size can increase the PCII by 0.8 K [11]. Furthermore, the cooling capacity of urban park green spaces is impacted by factors such as the park vegetation cover, vegetation type, and sky view factor (SVF) of the surrounding urban built-up area [13,14,15].
While the impact of the surrounding landscape’s two-dimensional aspects on park cooling has been extensively studied [5,16,17], the influence of three-dimensional buildings on park cooling has received less attention. Han found that during extremely hot weather, 3D architectural metrics in the vicinity exert a more pronounced effect on park cooling than 2D landscape metrics [12]. For instance, a study noted that green spaces around Xi’an exhibit optimal cooling effects when the building density ranges between 0.2 and 0.3, and when the plot ratio is between 2.5 and 3 [18]. However, the precise extent of the built environment’s influence within and around the park on its cooling effects and the underlying mechanisms remains unclear.
Numerous scholars have explored the impact of the interaction between parks and the surrounding buildings on the cooling effect. Gao found that parks significantly influence the surrounding thermal environment, much more than the surroundings affect the parks themselves [19]. Liang observed that internal park factors contribute over 50% of the cooling effect across all the seasons [20]. Additionally, research indicates that increasing the size of parks has a direct and significant cooling impact, whereas surrounding buildings influence the cooling effect more indirectly by affecting cold air diffusion [21]. These findings suggest that rational park design is crucial for enhancing the cooling effect.
Despite the cooling benefits provided by parks, their construction requires land acquisition and capital investment, leading to inevitable carbon emissions. Unlike previous studies, this research focuses on the design of parks and the optimization of the surrounding land allocation to more effectively meet the diverse cooling needs of residents.
Research methods for quantifying the relationship between the cooling effectiveness and the influencing factors in parks primarily rely on statistical modeling, such as correlation analysis or linear regression. However, there needs to be more exploration of the relative importance of cooling’s influencing factors and the common mechanisms of action. Many studies have indicated a high degree of uncertainty regarding the influence of indicator factors on the cooling effect. Nonlinear regression offers greater adaptability in addressing complex problems and capturing intricate nonlinear relationships. Consequently, this study employs a machine-learning approach, specifically the augmented regression tree model, to analyze the influencing factors of cooling in parks, a method that has yielded numerous results since its inception [12,22]. Utilizing a boosted regression tree (BRT) provides a distinct advantage in quantifying the influence of internal and external factors on the cooling effect in parks. Additionally, due to the study’s large sample size, obtaining a targeted thermal environment improvement strategy takes time and effort.
This study compiles data from 94 parks in Xi’an, the historical starting point of the Silk Road, which has undergone rapid economic development and urban expansion [23]. The swift urbanization has amplified the heat stress and elevated the risk of high temperatures [24]. In recent years, Xi’an has frequently experienced intolerably high temperatures during summer, exacerbated by the windless conditions in the main urban area due to the basin topography. Greening emerges as one of the limited optimization methods for scorching weather [18], necessitating further research. This study aims to comprehensively evaluate the cooling capacity of urban parks in Xi’an, analyze the influencing factors, and quantify the impacts of internal and external factors on the thermal environment. The objectives include (1) assessing the spatial distribution heterogeneity of cooling effects in urban parks during extreme hot weather, (2) quantifying the influence of interactions between urban parks, the surroundings, and the built environment on cooling effects using Pearson’s correlation analysis and BRT, and (3) summarizing the optimal thresholds for integrating internal and external indices under varying cooling needs. These findings will provide valuable insights for future urban park planning and construction endeavors.

2. Materials and Methods

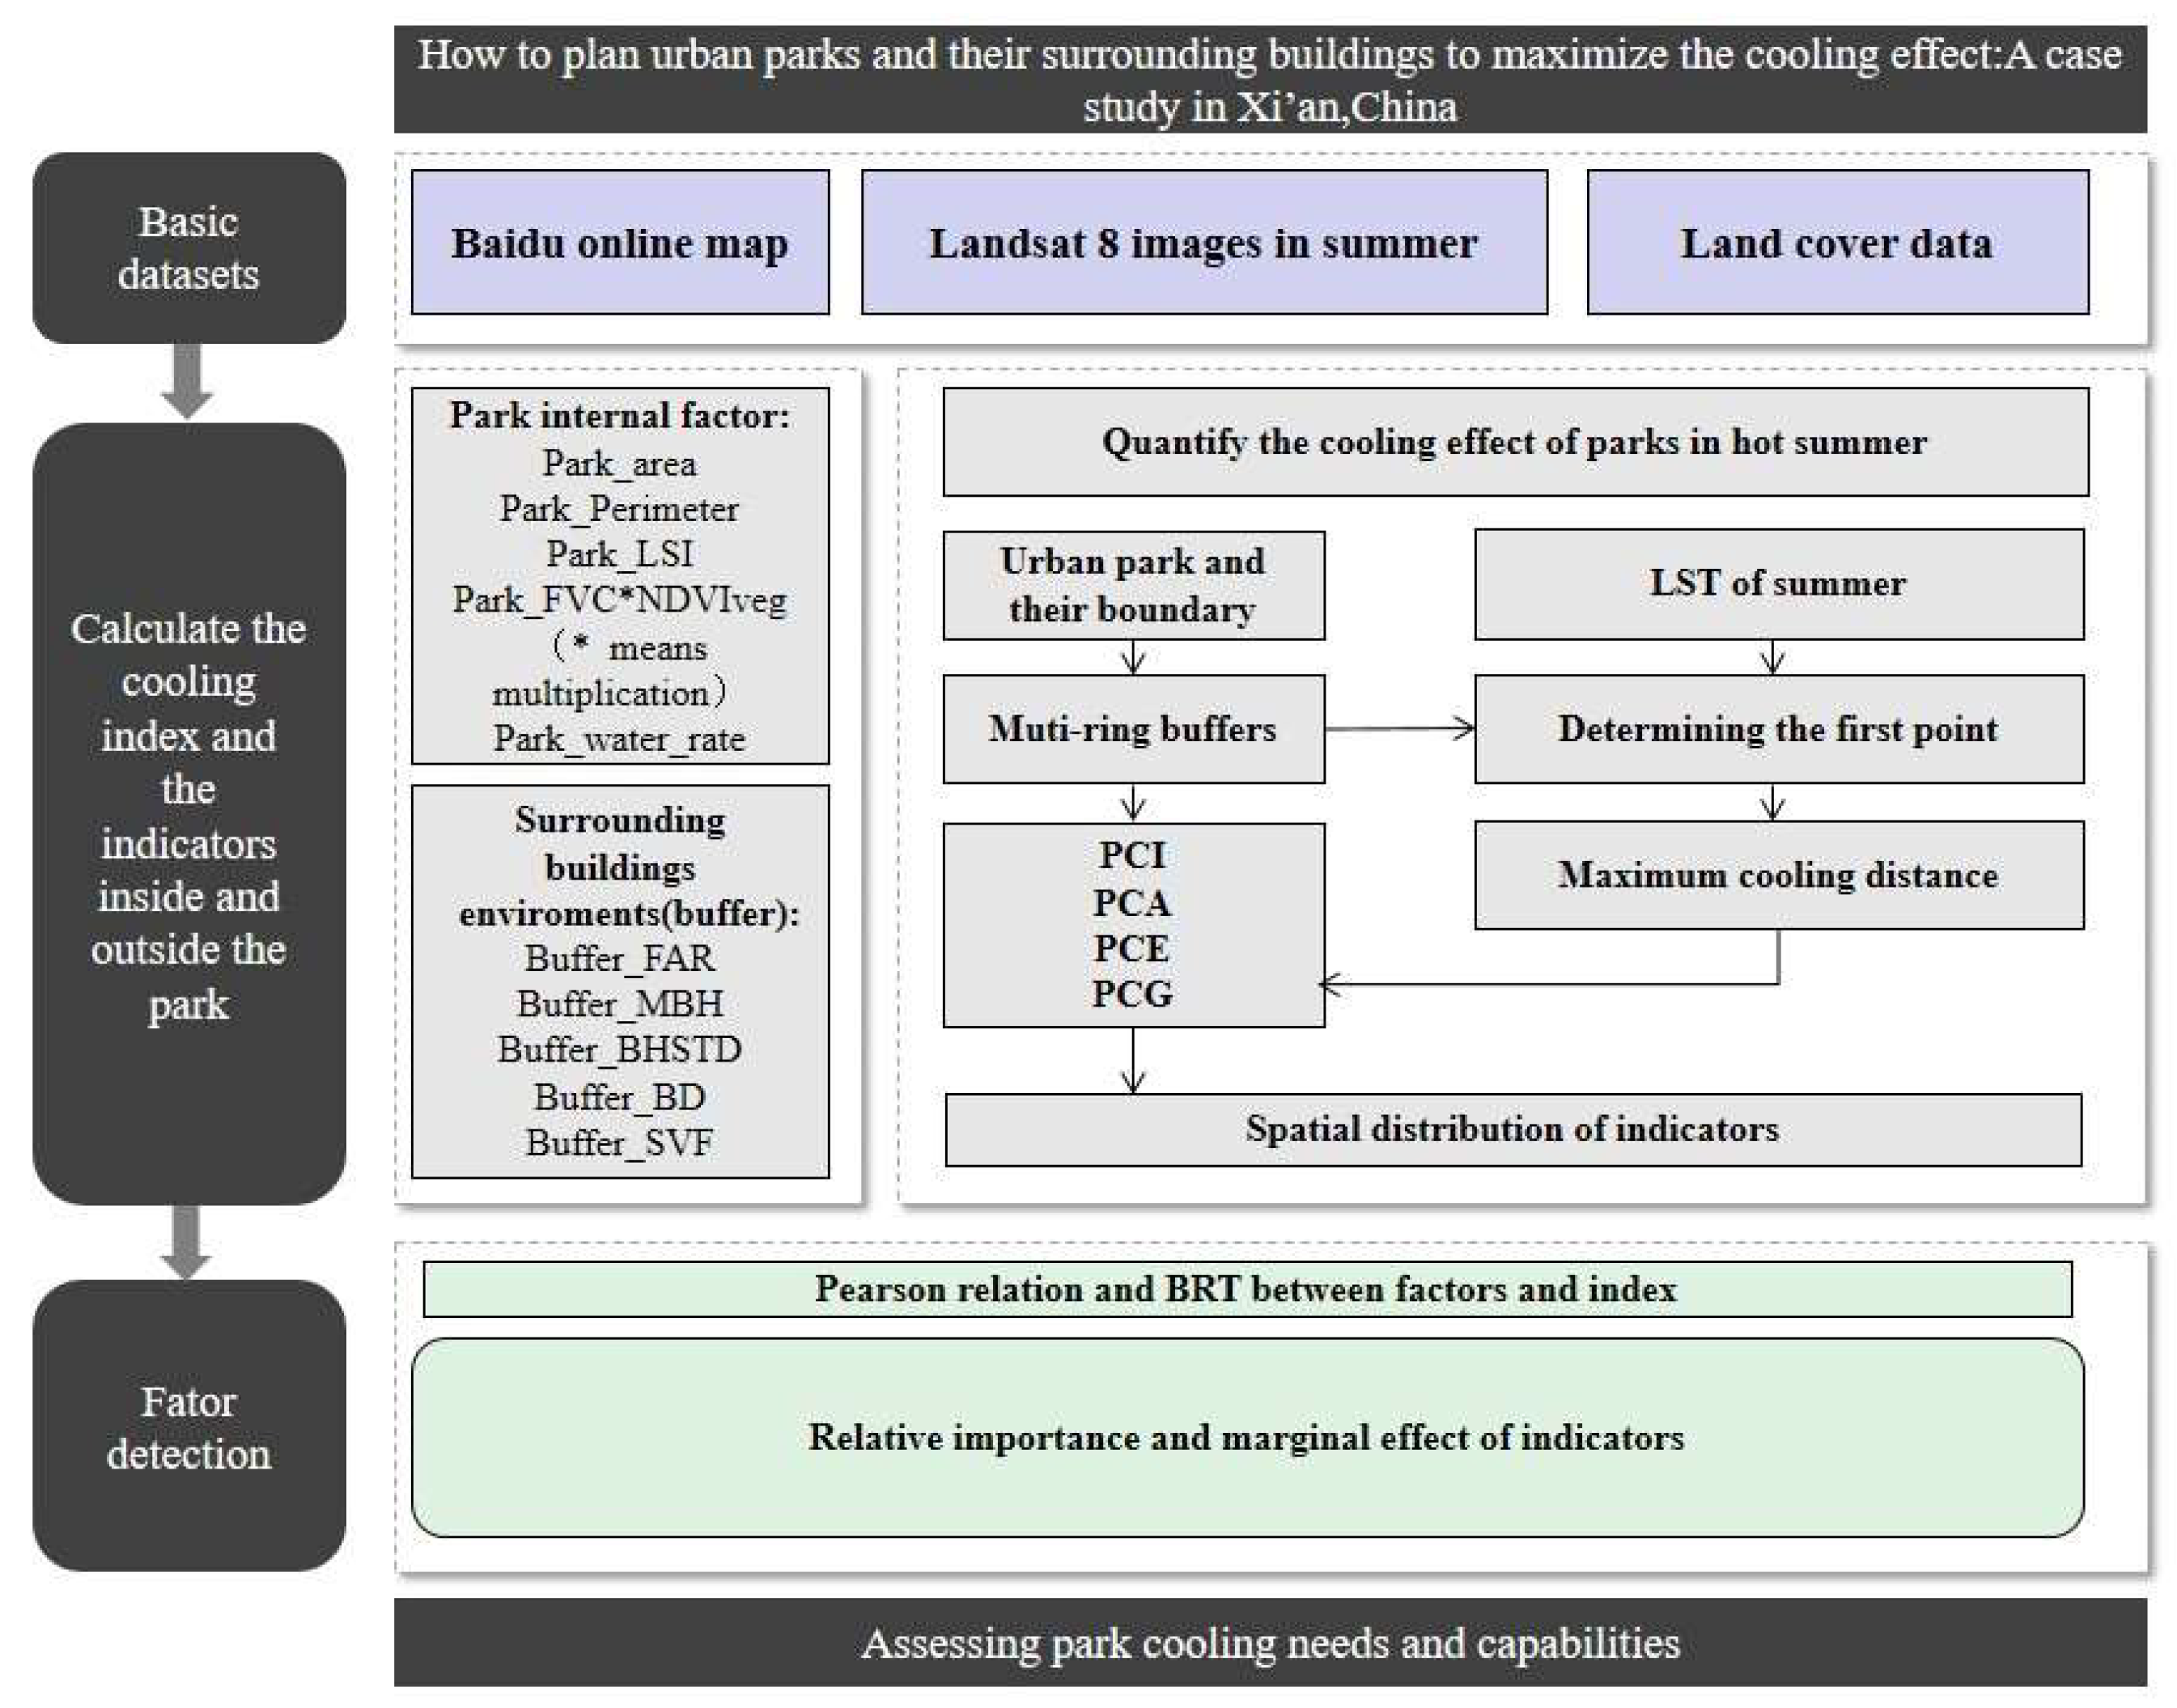
2.1. Research Framework and Data Resource
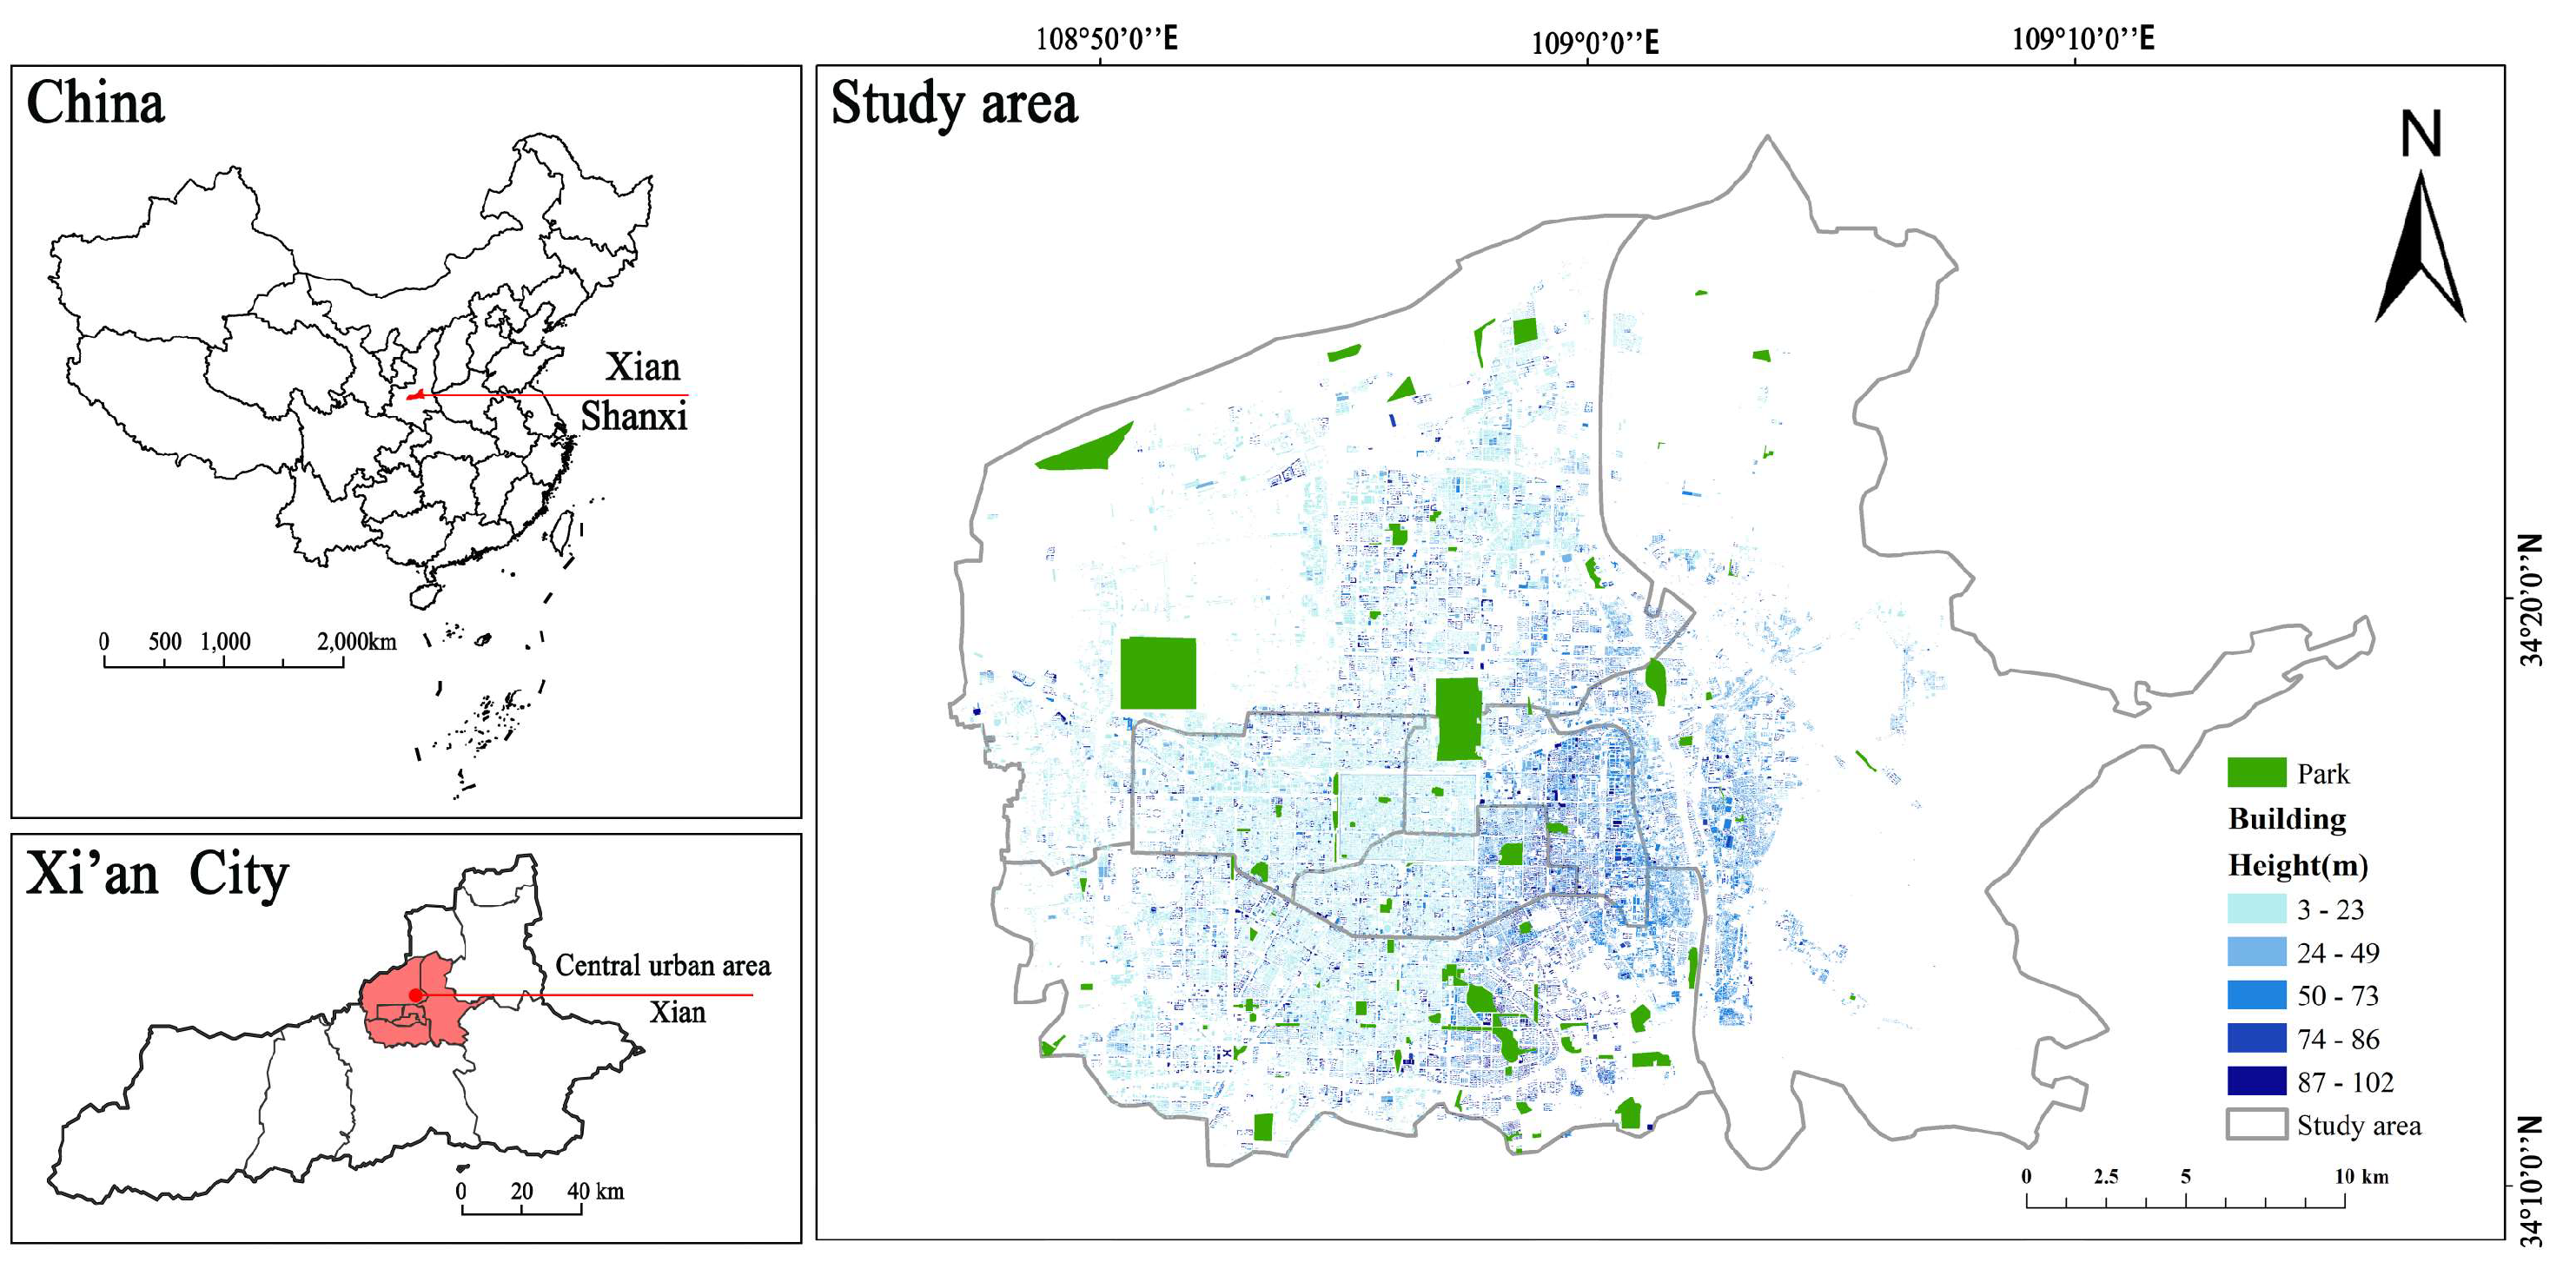
The study framework comprises four main steps (Figure 1):
(1) Data acquisition: The land surface temperature (LST) is used to assess the cooling effect, and Landsat 8 satellite images equipped with a land imager (OLI) sensor and a thermal infrared sensor (TIRS) are widely used for surface temperature retrieval [24,25,26]. In this study, Landsat 8 OLI_TIRS images with minimal (<6%) cloud are downloaded through the Geospatial Data Cloud “https://www.gscloud.cn (accessed on 2 August 2021)” were used to obtain the land image, and the LST data are computed by the radiative transfer equation (RTE) algorithm. Additionally, 2D and 3D spatial information about Xi’an City, including the building contours and heights, are obtained through the Baidu Map Open Platform and Baidu Street View Map, facilitating the calculation of urban spatial data such as the building density and plot ratio [6]. Details are collated below (Table 1).
(2) Data preprocessing: The boundaries of 118 parks are obtained by combining the Baidu API map and the Xi’an City Parks Directory, from which 94 parks meeting specific criteria are selected. These criteria include a minimum park area of 1 ha, exclusion of smaller and scattered parks to minimize the experimental error due to the Landsat-8 data resolution [11], absence of adjacency to large water bodies to mitigate the influence on park cooling effects [10], and a landscape morphology index (LSI) <3 to enhance the analysis accuracy [27]. The selected parks are categorized into five types according to China’s urban green space classification standard (CJJ/T85-2017) [28]: comprehensive parks, theme parks, community parks, amusement parks, and heritage parks, based on their specific functions and sizes.
(3) Calculation of indicators and parameters: Four indicators—the PCI, PCA, PCE, and PCG—are computed based on the park buffer zones. Ten potential factor characteristics are categorized into the park internal factors and the surrounding built environment factors (Table 2).
(4) Relationship exploration: Pearson correlation analysis and the BRT augmented regression tree method are combined to explore the dominant factors and classify the parks based on the cooling effect and thermal comfort indexes. A scientific park design scheme can be planned by comparing the factor values across different classifications [29].

2.2. Study Area

As the geographic center of China, Xi’an is classified as a cold region in China’s architectural thermal zoning. It has a continental monsoon climate with distinct cold and warm seasons and an average annual temperature of 13.7 °C. Being one of the world’s four great ancient capitals, Xi’an has served as the capital for 13 dynasties over the past 3000 years, and it is surrounded by mountains and plains of varying heights amidst its flat topography. Despite being classified as a cold region in China’s architectural thermal zoning, the frequency of scorching summer weather has increased in recent years. Also, due to the basin’s topography, a low wind speed prevails in the main urban area all year round. This terrain tends to accumulate heat and at the same time dissipate it more slowly, which is particularly noticeable in hot summer weather, reaching a temperature of 42.9 °C on 17 June 2006. During summer, the average wind speed is approximately 1.6 m/s, with the dominant wind direction coming from the northeast. Therefore, green space becomes one of the few ways to improve the thermal environment in Xi’an [10].
Unlike previous studies, this study concentrates on the effect of the internal and external combined coupling of spatial features of urban parks on the cooling capacity. Due to the considerable microclimate changes that can occur when the area is too large, this study centers on the central urban area of Xi’an (Figure 2), i.e., Baqiao, Lianhu, Weiyang, Xincheng, Beilin, and Yanta districts, which is less than 9% of the total area of Xi’an but has more than half of the total resident population “http://tjj.xa.gov.cn (accessed on 31 May 2021)”.

2.3. Method

2.3.1. LST Retrieval

For this study, extreme hot weather is defined as daily high temperatures exceeding 35 °C [30], persisting for seven days from 1 August to 7 August, according to the China Meteorological Administration (CMA), with a peak of 39.1 °C.
Landsat 8 OLI_TIRS imagery from the Geospatial Data Cloud is showing a daily maximum temperature of 39.1 °C, with minimal cloud cover (<6%) over the study area “https://www.gscloud.cn (accessed on 2 August 2021)”. After the LST retrieval is completed, we calculate the normalized vegetation index (NDVI), vegetation cover (FVC) and LST (land surface temperature). Meteorological data is sourced from the National Meteorological Centre of China “http://data.cma.cn (accessed on 2 August 2021)” and includes a mean temperature of 30 °C, with a maximum temperature of 39 °C, no rainfall, a mean relative humidity of 63.5%, and a maximum wind speed of 5 m/s under light breeze conditions.
Due to the unstable parameter settings of Landsat 8 OLI_TIRS, the single-window algorithm cannot be applied to the summer weather in Xi’an with high water vapor content, while the radiative transfer equation (RTE) algorithm can show higher accuracy with higher water vapor content [31,32]. Thus, we choose the radiative transfer equation (RTE) algorithm for the surface temperature retrieval, and the equation can be expressed as:
L λ = [ ε B ( T s ) + ( 1 ε ) L ] τ + L
where Lλ is the thermal infrared radiation brightness value received by the satellite sensor; L↑ is the atmospheric upward radiation brightness; L↓ is the energy reflected by the atmospheric downward radiation after reaching the ground; T s is the physical temperature of the ground surface, and B( T s ) is the blackbody radiance. The atmospheric transmittance τ in the thermal infrared wavelength band, the energy reflected by the atmospheric downward radiation after reaching the ground, and the atmospheric upward radiation brightness, and L are obtained from the NASA “http://latmcor.gsfc.nasa.gov”. ε is the surface-specific radiance calculated using the NDVI threshold method proposed by Sobrino.
According to the inverse function of Planck’s law, the black body radiance B(Ts) is calculated as:
B ( T s ) = [ L λ L τ ( 1 ε ) L ] / τ ε
Finally, the LST can be obtained as a function of Planck’s formula:
T s = K 2 / l n ( K 1 / B ( T s ) + 1 )
where K 1 = 774.89 W/(m2·sr·μm) and K 2 = 1321.08 K for band 10 of Landsat 8.

2.3.2. Quantification of Thermal Mitigation in Urban Parks

This study quantifies the thermal mitigation in urban parks using four metrics: park cooling area (PCA), park cooling intensity (PCI), park cooling efficiency (PCE), and park cooling gradient (PCG).
Analysis of the cooling curves indicates that the surface temperature increases with the distance from the park edge, but the surface temperature difference decreases as the distance increases to a certain critical value, and in most cases, the cooling distance is limited to within 900 m [17]. Given that the spatial resolution of the surface temperature is 30 m, this study establishes a continuous 30 m buffer zones and uses polynomial fitting to fit the cooling curves of the park at different distances under 300 m, 600 m, and 900 m buffer widths so that the most accurate correlations can be obtained (Figure 3). The relationship between the temperature difference inside and outside the park and the distance is determined using a third-degree polynomial.
T(L) = aL3 + bL2 + Cl + d
where the independent variable L is the distance between the urban park boundary and the buffer zone, and the dependent variable T(L) is the average surface temperature at distance L from the urban park boundary.
The average temperature within each buffer zone allows us to visually identify the first decreasing inflection point in a series of temperatures, which determines the first time the surface temperature of the buffer zone decreases with the cooling distance from the park [33]. We define the extent of the buffer zone from the inflection point to the park boundary as the park cooling area (PCA) [5], with larger PCA values indicating that the cooling effect of the park covers a wider range of the surrounding environment. The PCE is the proportion of the PCA to the parking area, and it represents the cooling of a unit of park area efficiency. The difference between the average temperature at the inflection point and the average temperature inside the park is defined as the park cooling intensity PCI; the larger the PCI, the faster the temperature inside the park decreases relative to the surrounding environment of the park. The PCG is quantified as the ratio of the PCI to the maximum cooling distance.
PCI = ΔLST
PCA = S m a x
PCE = S m a x S p a r k
PCG = Δ L S T L

2.3.3. Factors Affecting Heat Mitigation in Urban Parks

This study selects ten factors that may simultaneously affect the thermal mitigation of the park, encompassing five factors of the park itself and five factors of the park’s surrounding built form. Specific descriptions are provided in Table 2, and the extent of the surrounding built-up area in this study refers to the buffer area within the cooling distance.
Five indicator landscapes, namely area, PP, LSI, Park_FVC*NDVIveg, and Park_water_rate, are used to describe the park’s structure [5,12]. The park area is mainly recognized as a factor that significantly affects the thermal environment and the cooling capacity of the park [34]. The landscape shape index (LSI) is used as an additional landscape metric in this study to assess the configuration of green spaces. In addition, the NDVI and FVC alone do not represent vegetation factors well, so Park_FVC*NDVIveg is used to consider both the vegetation cover and greenness of the park [5], the symbol ”*” means multiplication, with FVC being the vegetation cover and NDVIveg being the NDVI of the vegetated area. In addition, the ratio of the area of water bodies in the park, Park_water_rate, is used to represent the park’s area ratio to the blue color landscape. Water bodies are mapped using data from the 2017 Xi’an land change survey, including lakes, rivers, and reservoirs.
Second, five urban form indicators (mean building height MBH, building density BD, sky view factor SVF, floor area ratio FAR, and standard deviation mean of building height BHSTD) are used to quantify the urban building form around the park [22,35,36], which can comprehensively characterize the state of urban heat exchange and balance processes [10]. The MBH, BD, FAR, and BHSTD are calculated in ArcGIS10.6. The SVF is calculated using C++ algorithmic language combined with ArcObiects programming.

2.3.4. Methods of Statistical Analysis

We initially used a Pearson correlation analysis to assess the linear relationship between the cooling indicators and the influencing factors. Recognizing that linear regression may not capture complex nonlinear relationships, we further combined it with boosted regression tree (BRT) modeling to determine the relative importance and marginal effects of the independent variables. Multicollinearity between variables, while not affecting the predictive power of the model, weakens the interpretability of the model. Hence, before performing the correlation analysis and training and iterating the BRT model, we assess the multicollinearity among the independent variables by the variance inflation factor (VIF) test based on SPSS 25.0. The VIF test shows that all the independent variables have VIF values below 5 (Table 3), confirming their suitability for the subsequent analysis.
The BRT model uses the “gem” and “dismal” packages in the R 4.3.0 to investigate the effects of the park’s metrics and those of the surrounding buildings on urban cooling. Because the cooling efficiency and cooling gradient are quadratically calculated from the cooling intensity and cooling area, we choose the PCI, PCA, PCE and PCG as the primary cooling metrics to measure the thermal mitigation of the park as dependent variables, and the independent variables are ten internal and external park metrics. In this study, we set the learning rate to 0.005, the tree complexity to 5, and the bagging fraction to 0.8, respectively. In addition, the optimal model is determined by 10-fold cross-validation. The relative importance of each independent variable is applied to determine its contribution to the PCI, PCA, PCE and PCG. At the same time, the partial correlation plot (PDP) [37] is used to characterize the marginal effects of changes in the park cooling indicators with the five main influences. Combining importance and marginal effects allows for assessment of the significance of variable impacts.

3. Results

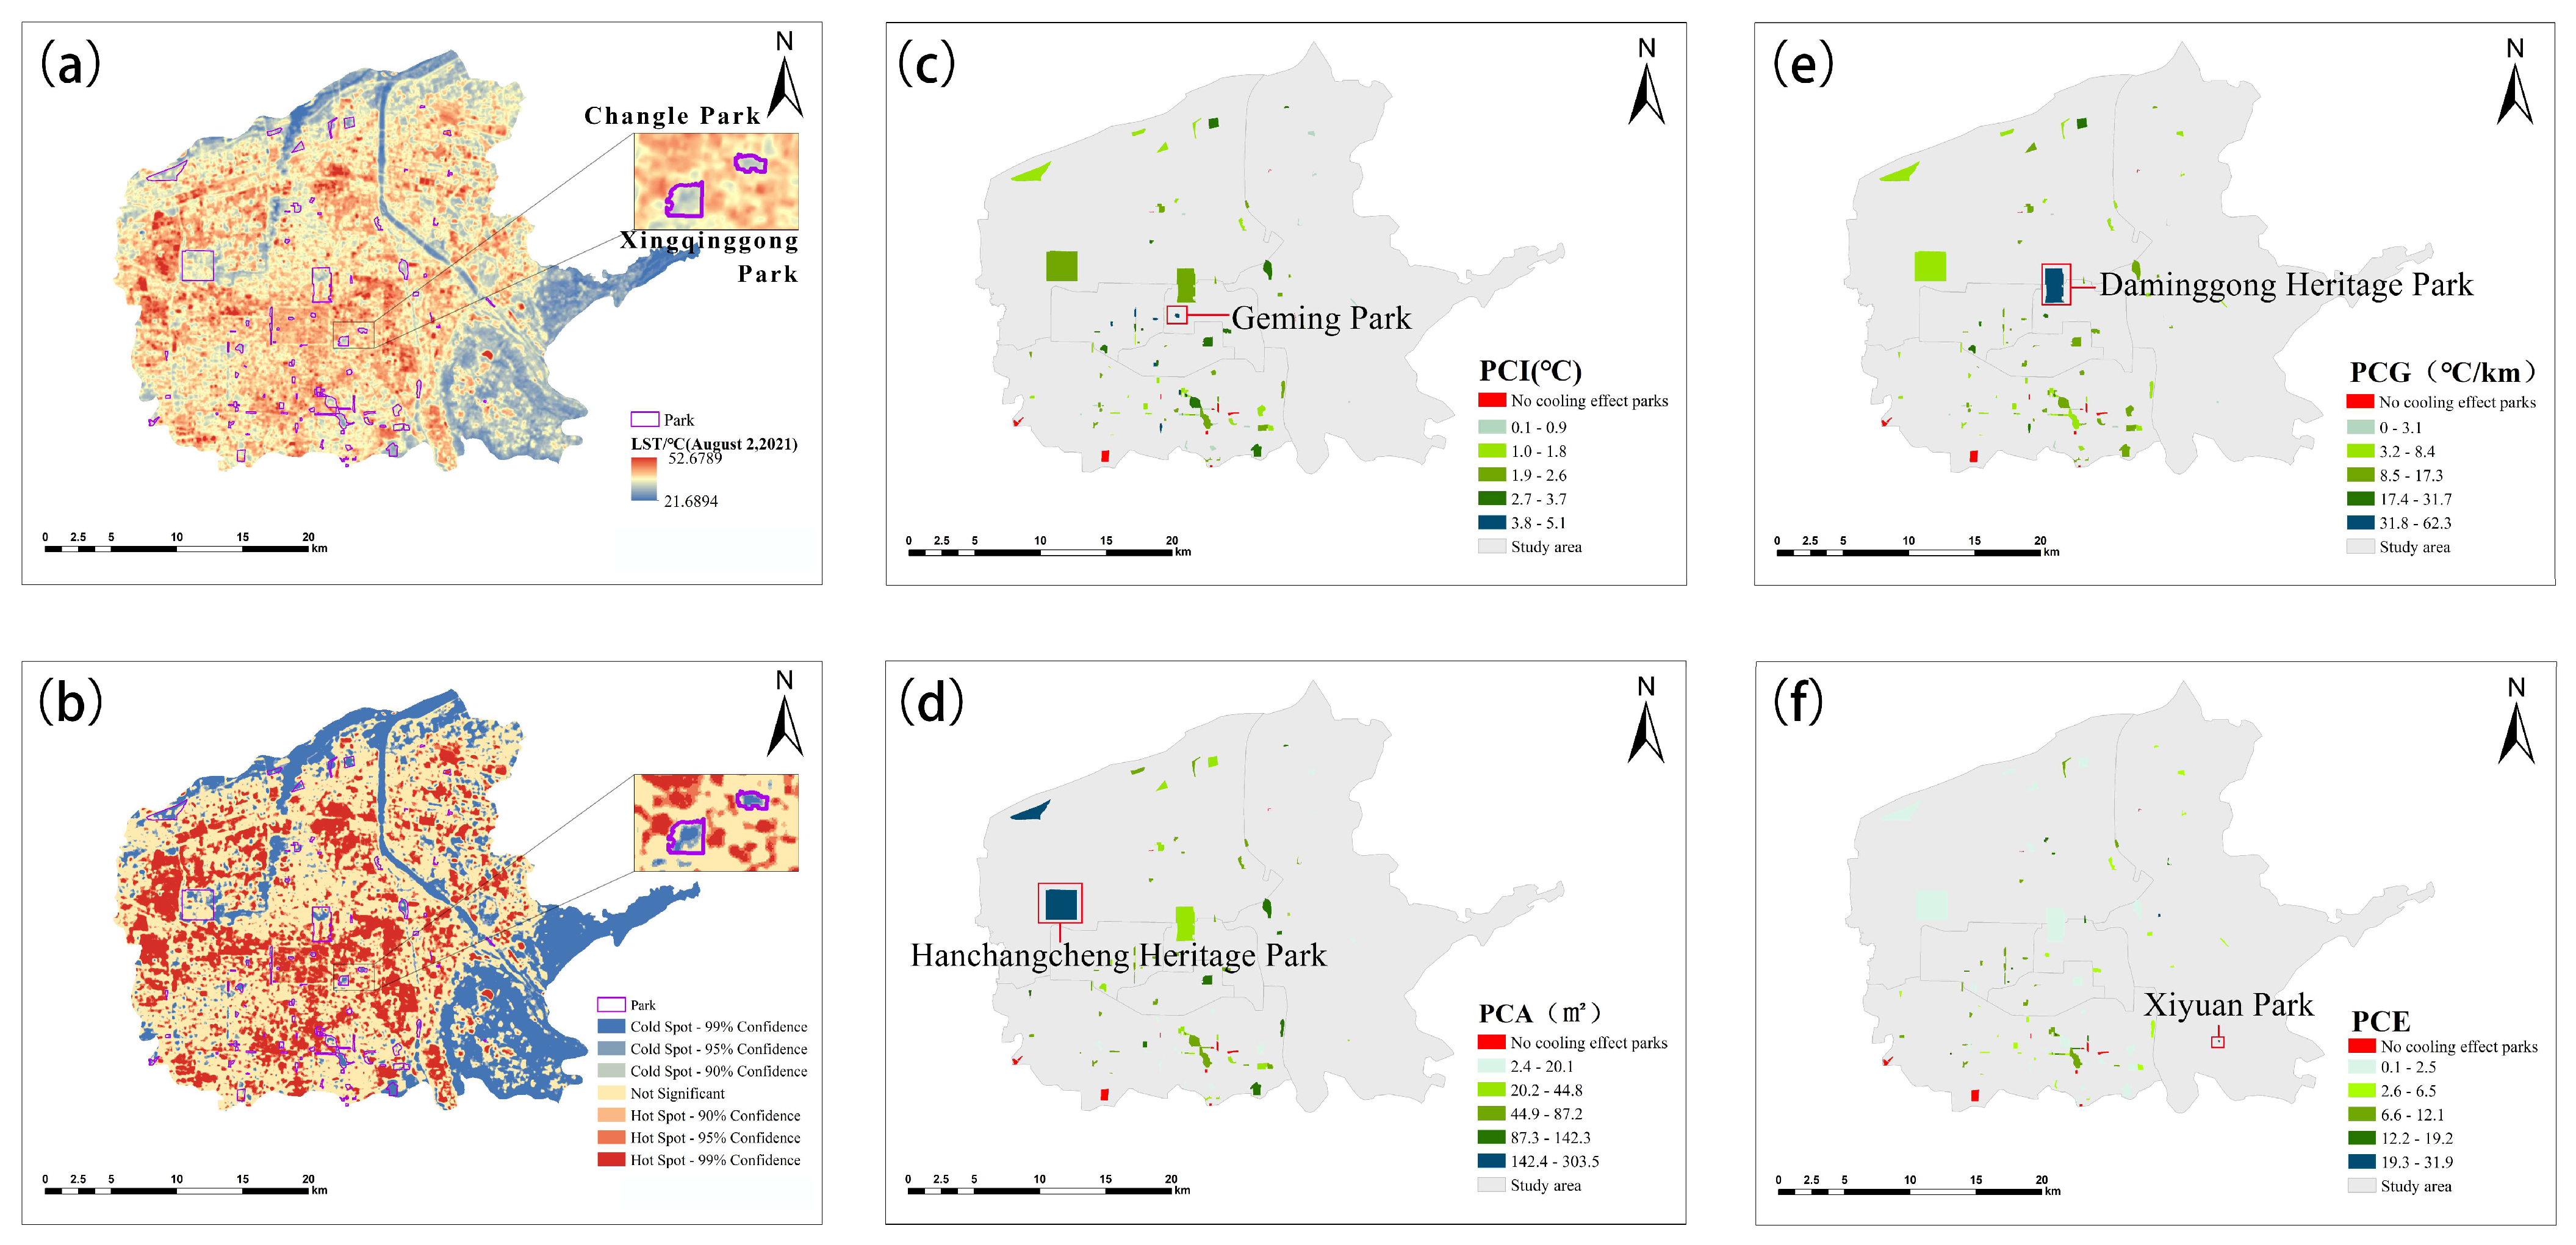
3.1. Spatial Distribution of Thermal Mitigation Effects in Xi’an Urban Parks

According to the combined LST and hotspot analysis (excluding large water bodies outside the parks) shown in Figure 4a,b, the LST distribution in the city of Xi’an in 2021 is characterized by the following: the LST in Xi’an ranges from 21.7 °C to 52.7 °C, with an average LST of 36.3 °C. Most of the parks in the study area are located in significant cold spot areas (p < 0.01), mainly situated in blue–green landscape areas such as urban parks and rivers, which are typically extraordinary islands in the city (Figure 4b). In contrast, hot spots are primarily concentrated in densely populated urban residential and commercial areas. By further selecting Xingqinggong Park and Changle Park to illustrate the distribution of the surface temperatures, it is clear that there are significant cool spots within the parks (within the purple wireframe).
Most parks exhibit significant cooling effects. However, 10 out of 94 parks are without cooling effects (Figure 4c), which may be related to the internal landscape composition of the parks and the morphological characteristics of the surrounding built-up areas [35]. The average value of the PCI is 1.98 °C, with a range of 0.1–5.1 °C, and the average value of the PCA is 51.7 ha (Figure 4d), with a range of 2.4–303.5 ha. The average value of the PCE is 6.6 (Figure 4f), which means that the average cooling area of a park is about 6.6 times its own, with a range of 0.3–31.9, and the average value of the PCG is 8.2 °C/km, with a range of 1.1–62.3 °C/km (Figure 4e).
The denser the surrounding buildings, the higher the cooling intensity of the parks, with Revolution Park having the highest cooling intensity of 5.1 °C. In addition, it is found that the cooling area increases with an increasing park area, with the Han Chang’an City Ruins Park having the largest cooling area of 303.5 ha. The Daming Palace Ruins Park has the highest cooling gradient of 62.3 °C/km. Larger park areas are associated with a smaller PCE, while the West Park exhibits the highest cooling efficiency, with a cooling area 31.9 times larger than its own.

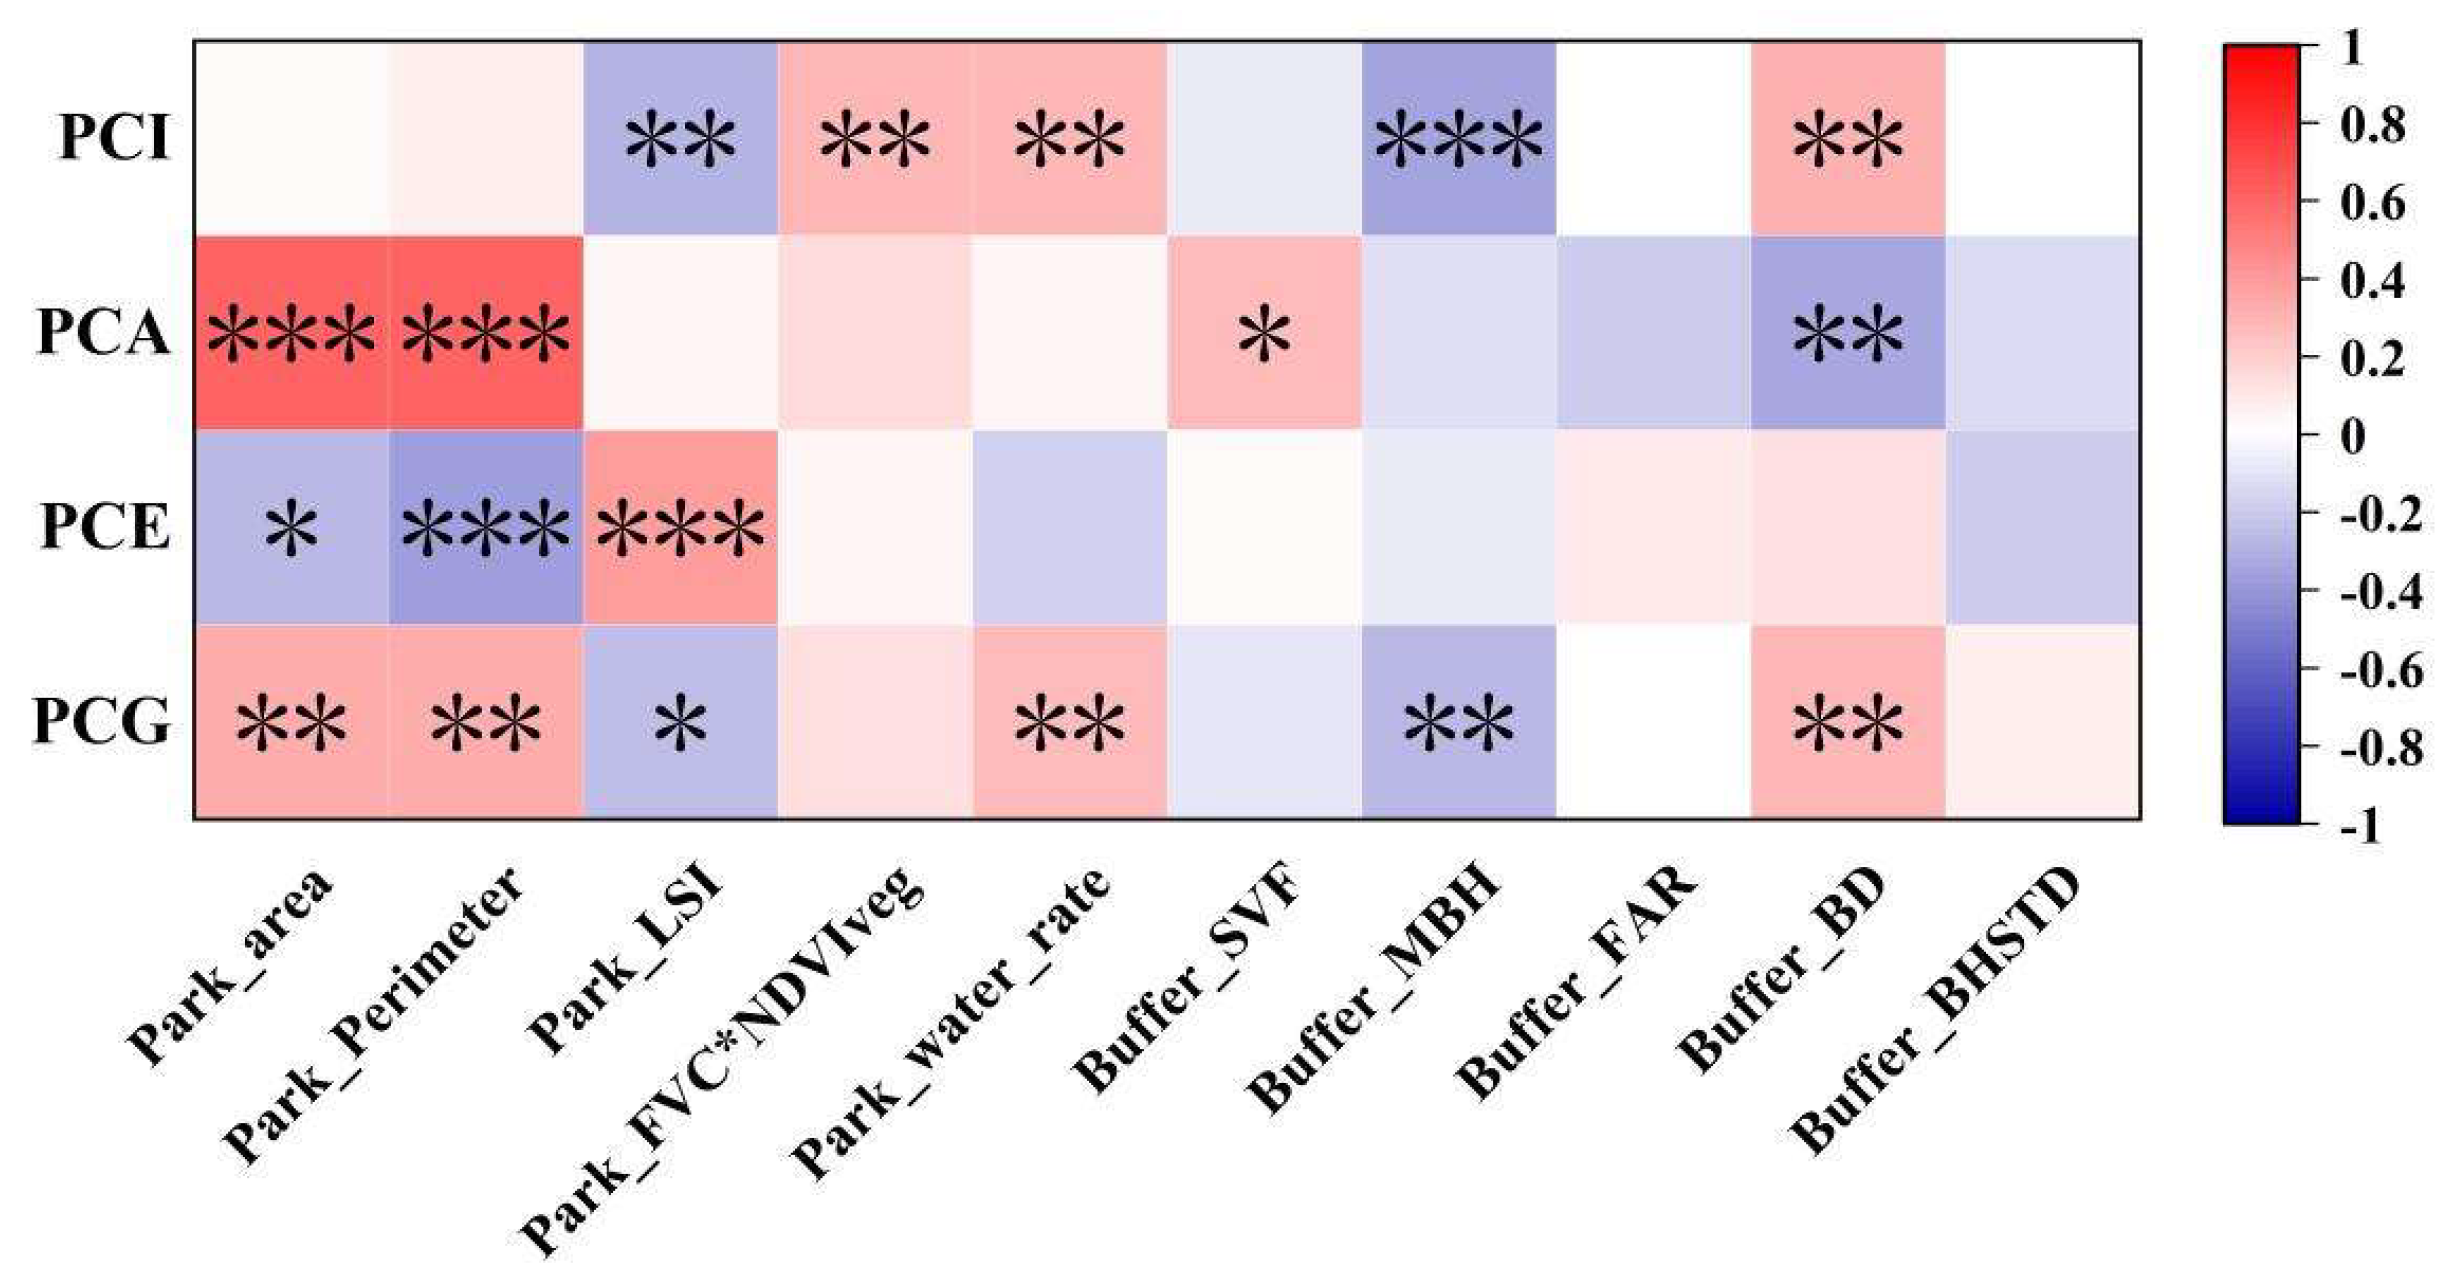
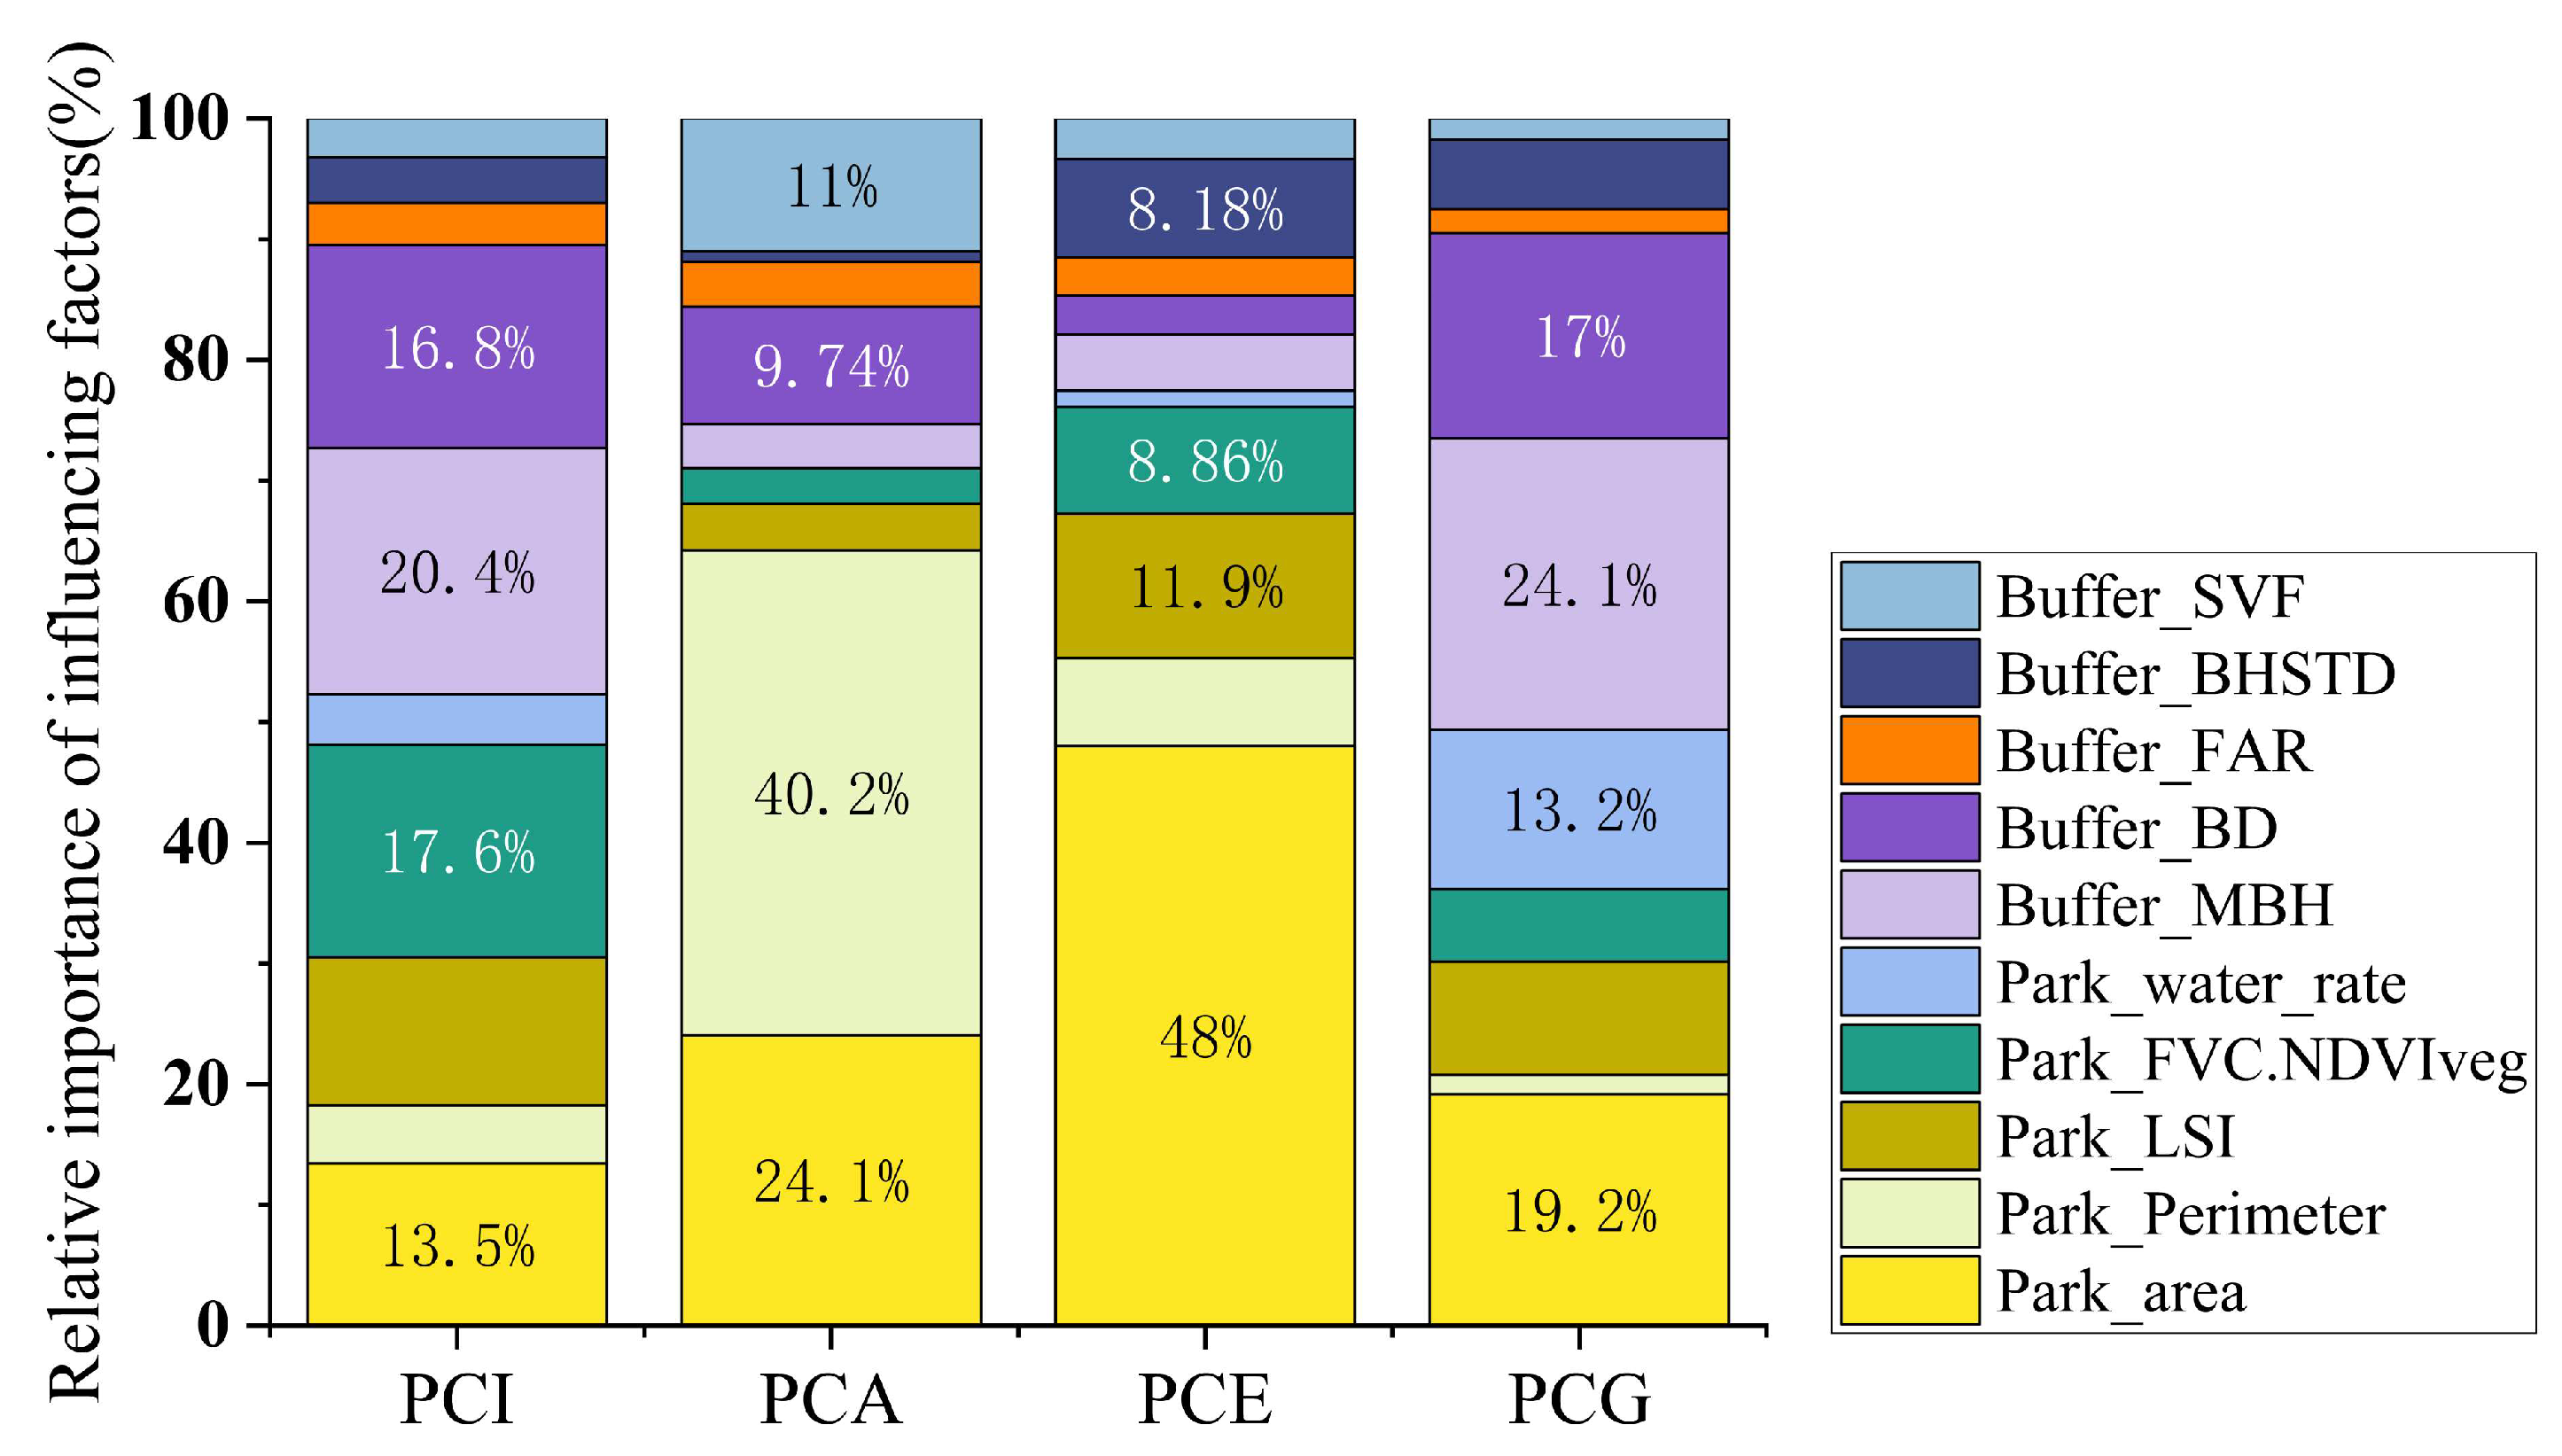
3.2. Influencing Factors of Thermal Mitigation Effects in Xi’an Urban Parks

3.2.1. Urban Park Factors without Cooling Effects

Based on Landsat 8-TIRS imagery from 2 August 2021, it is observed that ten parks exhibit a land surface temperature (LST) slightly higher than their surrounding areas, lacking a cold island effect. These parks encompass mixed-use, heritage, street, and theme parks. Some of these parks have lower vegetation cover, resulting in a higher LST within the parks compared to the surroundings. This may be attributed to higher green space cover in the surrounding settlements, making these settlements the centers of cold islands for external cooling. Additionally, the high percentage of hard, impervious surfaces within certain parks leads to a higher park LST compared to the surrounding built-up areas, preventing these parks from functioning as external cooling islands.
The average area, perimeter, landscape form index, vegetation cover, and water body proportion of these parks are all lower, indicating smaller scales, more regular shapes, and a predominance of impervious surfaces and structures. Externally, although the mean building height (Buffer_MBH) around these parks is higher, the lower building density (Buffer_BD) results in dispersed buildings that fail to form effective ventilation corridors to enhance cold air diffusion. Consequently, some parks have an internal LST higher than the surrounding built-up areas, failing to provide external cooling. Certain parks also have high building density but low building heights, hindering cold air diffusion within the parks [38].

3.2.2. Analysis of Drivers of Urban Parks with Thermal Mitigation Effects

Pearson correlation analysis is performed using SPSS 25.0 to analyze the cooling effect of 84 urban parks (Figure 5). Both the park area and perimeter significantly enhance the PCA and PCG but are negatively correlated with the PCE, suggesting that the smaller the park size, the better the economic benefits. Park_LSI shows that although the complex shape of the park has a higher PCE, it likewise lead to a smaller PCI and PCG, and the proportion of vegetation and the proportion of water in the park has a significant positive correlation (p < 0.01) with the PCI and PCG, suggesting that a rich layer of vegetation and water cover in the park would enhance the cooling effect. This suggests that rich vegetation levels and water body cover in the park would enhance the cooling effect.
In terms of the peripheral buffer zone indicators, only the building density, building height, and SVF are significantly correlated with the cooling indicators, and the PCI and PCG are negatively correlated with the building height and positively correlated with the building density, indicating that the location of the parks also has a certain effect on the cooling effect. Urban parks located in dense low-rise building areas can provide higher cooling intensities and more economical cooling intensities per unit. Additionally, the SVF is positively correlated with the PCA, which suggests that the more open the park is between buildings, the greater the cooling area.

3.3. Marginal Effects of Different Metrics on Thermal Mitigation in Xi’an Urban Parks

The relative importance of ten in-park and out-of-park factors in relation to the PCI, PCA, PCE and PCG is explored using the BRT method (Figure 6). The coefficients of determination (R2) for the four indicators are 0.565, 0.761, 0.447, and 0.588. respectively, meeting the prediction accuracy requirements. The results show that the top four key influencing factors for the PCI, PCA, PCE and PCG differ under extreme heat.
Overall, the intrinsic park attributes and surrounding buffer zone building heights and building densities are the main drivers affecting the PCI and PCG park cooling metrics, with a relative importance of over 60%. The park area is the main determinant affecting the PCE, with the relative importance of this indicator approaching 48%. The park area and park perimeter are the main factors affecting the PCA, with their relative importance exceeding 64%. Specifically, an increase in the park size leads to an increase in the area of internal cooling sources, resulting in an increased capacity to absorb heat. Different combinations of rows and heights of surrounding buildings change the roughness of the ground surface, impeding the infiltration and diffusion of cool air. It is worth noting that in our study, the factors that significantly contribute to the PCE coincide with a decrease in the PCI and PCG. This is consistent with studies conducted in Shenzhen [5], where the cooling effect diminishes with an increasing cooling distance.
To further explore the influence of these urban characteristics on the cooling effect, the PDP was used to reveal the complex pattern of correlation between them. The figure shows the one-factor PDP of the first four urban characteristics on the cooling indicator (Figure 7). When the park area exceeds 22 ha, the curve is almost unchanged due to the small amount of data; therefore, this part of the curve will not be discussed due to the relatively low confidence level.
From the correlation and significance analyses described above, it can be seen that the intrinsic park attributes (Park_area, Park_Perimeter, Park_LSI, Park_FVC*NDVIveg, Park_water_rate) and the peripheral buffer factors (Buffer_BD and Buffer_MBH) can both significantly influence the cooling effect. The park area is generally positively correlated with the PCI, PCA and PCG, and negatively correlated with the PCE. When the park area increases, the PCI, PCA, and PCG increase sharply, and the thresholds reached by the three are 15, 26, and 24 ha, respectively. The PCI reaches a plateau much faster than the PCA and PCG. At the same time, the PCE decreases sharply with the increase in park area, with the threshold value being 13 ha, indicating that parks with smaller areas are more economically efficient. The PCA increases with the increase in the park perimeter, and when the park perimeter reaches 2100 m, the PCA stabilizes at 47.3 ha. In addition to this, an increase in the park’s perimeter and LSI can enhance the PCA and PCE, respectively. The larger the perimeter, the greater the contact area for heat exchange between the park and the periphery. Similarly, the more fragmented the park, the higher the PCE. The proportions of vegetation and water bodies in the park are positively correlated with the cooling index, with the thresholds for vegetation and water bodies at 49% and 5%, respectively.
On the other hand, the building height and building density show a logarithmic relationship with the PCI and PCG, with the PCI and PCG increasing sharply when Buffer_BD is between 13% and 32%, while both the PCI and PCG decrease sharply when building height is between 21 and 54 m. This suggests that parks arranged near low-rise, dense building clusters of less than seven stories can provide better cooling. Due to the weak correlation between Buffer_SVF, Buffer_FAR, and Buffer_BHSTD and the cooling effect index of parks, the curve trends and thresholds of these factors are not discussed in this study.

4. Discussion

4.1. Selection of Internal Park Metrics and External Building Metrics

Numerous studies have investigated the independent influence of two-dimensional landscapes inside or around parks on the cooling effect. However, related studies have shown that peripheral three-dimensional buildings have a more significant impact on the cooling effect than two-dimensional landscapes under extreme weather conditions [10]. In this study, five internal metrics (area, perimeter, landscape morphology index, vegetation cover, and percentage of water bodies) and five peripheral architectural indicators (Buffer_BD, Buffer_MBH, Buffer_SVF, Buffer_FAR, Buffer_BHSTD) are utilized to investigate the combined influence of internal and external factors on the thermal mitigation effect of parks.
The landscape metrics can be categorized into composition (e.g., Park_water_rate and Park_FVC*NDVIveg) and configuration (e.g., perimeter and LSI). These metrics are integrated to measure the park composition and spatial morphology. Additionally, unlike two-dimensional landscapes, urban form indicators (Buffer_BD, Buffer_MBH, Buffer_SVF, Buffer_FAR, Buffer_BHSTD) are utilized to describe the built form, comprehensively responding to the balancing process of urban energy [12].

4.2. Influence of Internal and External Factors on Thermal Mitigation in Urban Parks

In this study, the thermal mitigation effect of urban parks in Xi’an is investigated using the PCI, PCA, PCE, and PCG, revealing that the thermal mitigation effect of urban parks is influenced by both intrinsic and extrinsic factors [9,32]. Eighty-four out of ninety-four parks exhibited a cooling effect. The LST increased with the increase in cooling and began to decrease or remain stable after a certain distance, consistent with previous studies [5,16,17].
Compared to Chen’s study [16], this study finds that the parks have higher PCE values and lower PCA, PCG, and PCI values, which may be related to the limited sample selection of Wuhan community parks. Studies indicate that the complex shape of urban parks significantly affects the PCA [39]. An elevated perimeter expands the contact area for heat exchange between the park and the surrounding built-up areas (e.g., buildings, impermeable surfaces), generating more dispersed and fragmented greenfield patches, which effectively exchanges heat more deeply into the heat island areas within the multiple surrounding densely packed building clusters [40,41]. Thus, extending greenery and water bodies into surrounding built-up areas through green space corridors and landscaped strips can provide comfortable thermal environments and increase the park’s cooling range. Additionally, this study based on the PDP analysis not only explored the area with the highest PCI but also illustrated the threshold size of urban parks, which require the smallest park area to achieve the maximum PCI compared to the PCA and PCG, suggesting that the parks have a much greater impact on their surroundings than the surroundings have on the parks themselves, which is consistent with Gao’s finding [10] that when the PCI reaches the maximum value and remains constant, the cooling effect produced by the park requires a larger park area to penetrate the external built environment to reach the PCA threshold.
Three-dimensional buildings around the park alter its energy balance pattern, affecting the LST and causing the park to exhibit varying cooling capacities [12]. This study also finds that the floor area ratio (FAR) has little effect on the cooling effect, consistent with the findings of Li’s study and Yuan’s study [35,36]. In this study, buildings with a higher FAR occupy a larger floor area and often become heat sources in the city, but the building density has an inverse effect on the cooling effect, decreasing the FAR’s impact on the cooling effect. Furthermore, when the FAR exceeds a critical value, building shadows from higher structures counteract the cooling effect of the park. The influence of the sky view factor (SVF) on the cooling effect is also low. The SVF characterizes the area share of the sky viewable area, possibly due to the small spatial parallax and the exclusion of external vegetation influence in this study’s SVF calculation, consistent with Yuan and Han’s results [12,36].

4.3. How to Plan and Design Urban Parks and the Surrounding Built Environment Can Achieve the Best Thermal Mitigation Effect

Previous studies have concentrated on the impact of the internal landscape or external landscape on the cooling effect of parks. However, the heat exchange between the internal and external environments of parks is ongoing and thus cannot be separated for a separate discussion. Our study further demonstrates the interactions between urban parks and the surrounding built environment, underscoring the importance of considering the park layout and surrounding urban development in urban planning. Several studies have developed comprehensive assessment frameworks for park cooling effects, focusing on aspects like park accessibility, urban development, and climate enhancement [16,42,43].
As the construction of parks involves economic investment and the constraints of tight urban land use, it is not feasible to blindly expand the scale of parks, and builders need to consider how to rationally allocate resources in the most economical way to achieve the best cooling effect. For instance, a small park with an area of 5 ha is sufficient to produce the same cooling effect as a large park. If the decision maker wishes to emphasize the cooling efficiency per unit area of the park, then a medium-sized park of up to 13 ha should be built, or a large park of at least 26 ha should be built if it is desired to radiate out to a larger surrounding area.
Although it is not possible to enhance the cooling effect by directly lowering the internal temperature of the park by adjusting the configuration of the park’s external buildings, it is possible to change the surface temperature of the park’s peripheral area by influencing the diffusion of cold air, thus producing a different cooling effect [44]. A sparse arrangement of high-rise buildings is more conducive to the diffusion of the cooling effect, whereas an arrangement with an average number of floors of less than seven and a building density of 32% is more conducive to the park’s external concentration of cooling.
The optimal configuration of both the park and the surrounding buildings can be determined by quantifying the park’s cooling effect. However, further research is required to explore the interaction between the cooling effects of the park and the surrounding buildings. In urban planning, development, and construction, it is often necessary to combining urban land units’ functionally while adhering to various land use and architectural control guidelines. This underscores the necessity of integrating the cooling effects of the parks with those of the surrounding building configurations [21] to maximize the overall cooling efficiency and ensure the optimal arrangement of buildings within different urban units.
Due to the decision-making processes of local governments and the variability of urban planning land use standards, it is often challenging to prioritize the maximization of cooling effects in urban park design while simultaneously coordinating the surrounding land use attributes. This results in certain limitations in practical design practices.

4.4. Limitations and Future Research

This paper employs the inflection point method to assess the cooling indices of urban parks. Variations in the measurement approaches for park cooling effects can yield differing results, and the current methods lack a definitive criterion for defining the cooling distance. To address this limitation, polynomial fitting is applied to model the cooling curves of parks at buffer widths of 300 m, 600 m, and 900 m, aiming to establish the most accurate relationship between the cooling distance and the four calculated cooling metrics. However, the point at which the cooling effect becomes negligible is often not sufficiently distinct, necessitating further consideration of the potential impact of the surrounding landscape on the cooling effect measurements.
This study has several limitations. The spatial composition indicators within the park, such as the 3D landscape features (topography, structures), still needed further development. The 30 m resolution Landsat images employed in this study do not permit the depiction of smaller greenspaces, and the limited number of images may lead to a restricted representation when using a single image to depict extreme thermal values. The absence of finer remote-sensing data constrains the resolution of the raw data, consequently affecting the results presented in this paper. Efforts will be made in future research to enhance the quality and resolution of the data to improve the results’ accuracy. To mitigate the impacts of water bodies, urban parks in close proximity to large water bodies are excluded. Consequently, the number of selected urban parks (94) is relatively limited, and the cooling metrics and impact factor thresholds might differ if a larger number of urban parks were considered. Additionally, expanding the sample size of parks considered in this study might have highlighted the impact of water bodies within parks on enhancing the park thermal environments. Finally, this study primarily focuses on the effect of extreme daytime heat on the park cooling effectiveness without considering variations in the daytime and nighttime weather, which could be explored further to understand diurnal variations.
In future studies, additional factors affecting the park’s cooling capacity should be considered, such as the overall wind direction, tree shade within the park, shadows from surrounding buildings, and local microclimatic variations. Additionally, the influence of socio-economic and cultural factors, such as the urban GDP, population density, and road density, and other relevant indicators on the cooling effect will be analyzed in subsequent studies to achieve a more comprehensive analysis.

5. Conclusions

This study analyzed 94 parks and green spaces in Xi’an to quantify the park cooling using Landsat 8 imagery and the BRT machine-learning algorithm. The objective was to explore the spatial and temporal distribution variability of park heat islands during extremely hot weather, aiming to enhance understanding of the spatial interaction mechanisms of the park cooling capacity. The results are as follows. Eighty-four out of ninety-four parks exhibited significant cooling effects, with an average park cooling intensity (PCI) of 1.98 °C, a park cooling area (PCA) of 51.7 ha, a park cooling efficiency (PCE) of 6.6, and a park cooling gradient (PCG) of 8.2 °C/km, respectively. The correlation analyses and relative importance results indicated that the parks’ intrinsic attributes, external buffer zone building height and density were the primary factors influencing the cooling effectiveness. It was found that the influencing factors varied considerably for different cooling indices of the parks. Generally, the park landscape configuration (percentage of water bodies and vegetation) and external buffer zone building heights and densities significantly influenced the PCI and PCG, while the park shape and size were the most important factors controlling for the PCA (positive influence) and PCE (negative impact). Additionally, based on the partial dependency diagram (PDP), it was calculated that the optimal park area to improve the thermal environment by focusing on the cooling area is 26 ha, with the building density around the park being less than 13%. The optimal park area to improve the thermal environment by focusing on the cooling intensity is 15 ha, with vegetation cover exceeding 49%, average building height around the park being less than 21 m, and building density being 32%. This study emphasized the complexity of the cooling capacity in urban parks, highlighting the importance of considering the internal topography and building shading effects in future research to further understand the impact on the park cooling capacity. These findings contribute to a more comprehensive understanding of the role of parks in improving the urban thermal environment. They are pertinent to urban-scale park planning, facilitating the creation of layout strategies for parks and neighboring building complexes to enhance the cooling capacity.

Author Contributions

Conceptualization, T.W.; methodology, T.W., X.W., L.X. and C.D.; formal analysis, X.W., L.X. and C.D.; data curation, Z.Y. and C.W.; writing—original draft preparation, T.W.; writing—review and editing, T.W., X.W. and Z.Y.; visualization, L.X., J.D. and Z.Y.; supervision, X.W., C.D. and Y.S.; project administration, T.W.; funding acquisition, X.W. and K.Y. All authors have read and agreed to the published version of the manuscript.

Funding

This study was supported by the National Natural Science Foundation of China (Grant No. 52278047) and the Shaanxi Provincial Social Science Foundation Project (Grant No. 2023J041).

Data Availability Statement

The raw data supporting the conclusions of this article will be made available by the authors on request.

Conflicts of Interest

The authors declare no conflicts interest.

References

  1. Ebi, K.L.; Capon, A.; Berry, P.; Broderick, C.; de Dear, R.; Havenith, G.; Honda, Y.; Kovats, R.S.; Ma, W.; Malik, A.; et al. Hot weather and heat extremes: Health risks. Lancet 2021, 398, 698–708. [Google Scholar] [CrossRef] [PubMed]
  2. Oke, T.R. The energetic basis of the urban heat island. Q. J. R. Meteorol. Soc. 1982, 108, 1–24. [Google Scholar] [CrossRef]
  3. Peng, J.; Xie, P.; Liu, Y.; Ma, J. Urban thermal environment dynamics and associated landscape pattern factors: A case study in the Beijing metropolitan region. Remote Sens. Environ. 2016, 173, 145–155. [Google Scholar] [CrossRef]
  4. Yu, Z.; Yang, G.; Zuo, S.; Jørgensen, G.; Koga, M.; Vejre, H. Critical review on the cooling effect of urban blue-green space: A threshold-size perspective. Urban For. Urban Green. 2020, 49, 126630. [Google Scholar] [CrossRef]
  5. Peng, J.; Dan, Y.; Qiao, R.; Liu, Y.; Dong, J.; Wu, J. How to quantify the cooling effect of urban parks? Linking maximum and accumulation perspectives. Remote Sens. Environ. 2021, 252, 112135. [Google Scholar] [CrossRef]
  6. Zhang, Q.; Zhou, D.; Xu, D.; Cheng, J.; Rogora, A. Influencing factors of the thermal environment of urban green space. Heliyon 2022, 8, e11559. [Google Scholar] [CrossRef] [PubMed]
  7. Xiao, Y.; Piao, Y.; Pan, C.; Lee, D.; Zhao, B. Using buffer analysis to determine urban park cooling intensity: Five estimation methods for Nanjing, China. Sci. Total Environ. 2023, 868, 161463. [Google Scholar] [CrossRef] [PubMed]
  8. Chen, X.; Su, Y.; Li, D.; Huang, G.; Chen, W.; Chen, S. Study on the cooling effects of urban parks on surrounding environments using Landsat TM data: A case study in Guangzhou, southern China. Int. J. Remote Sens. 2012, 33, 5889–5914. [Google Scholar] [CrossRef]
  9. Feyisa, G.L.; Dons, K.; Meilby, H. Efficiency of parks in mitigating urban heat island effect: An example from Addis Ababa. Landsc. Urban Plan. 2014, 123, 87–95. [Google Scholar] [CrossRef]
  10. Gao, Y.; Zhao, J.; Han, L. Quantifying the nonlinear relationship between block morphology and the surrounding thermal environment using random forest method. Sustain. Cities Soc. 2023, 91, 104443. [Google Scholar] [CrossRef]
  11. Liao, W.; Guldmann, J.-M.; Hu, L.; Cao, Q.; Gan, D.; Li, X. Linking urban park cool island effects to the landscape patterns inside and outside the park: A simultaneous equation modeling approach. Landsc. Urban Plan. 2023, 232, 104681. [Google Scholar] [CrossRef]
  12. Han, D.; Xu, X.; Qiao, Z.; Wang, F.; Cai, H.; An, H.; Jia, K.; Liu, Y.; Sun, Z.; Wang, S.; et al. The roles of surrounding 2D/3D landscapes in park cooling effect: Analysis from extreme hot and normal weather perspectives. Build. Environ. 2023, 231, 110053. [Google Scholar] [CrossRef]
  13. Founda, D.; Santamouris, M. Synergies between Urban Heat Island and Heat Waves in Athens (Greece), during an extremely hot summer (2012). Sci. Rep. 2017, 7, 10973. [Google Scholar] [CrossRef] [PubMed]
  14. Yang, Y.; Zhou, D.; Wang, Y.; Ma, D.; Chen, W.; Xu, D.; Zhu, Z. Economical and outdoor thermal comfort analysis of greening in multistory residential areas in Xi’an. Sustain. Cities Soc. 2019, 51, 101730. [Google Scholar] [CrossRef]
  15. Zhao, C.; Fu, G.; Liu, X.; Fu, F. Urban planning indicators, morphology and climate indicators–A case study for a north-south transect of Beijing, China. Build. Environ. 2011, 46, 1174–1183. [Google Scholar] [CrossRef]
  16. Chen, M.; Jia, W.; Yan, L.; Du, C.; Wang, K. Quantification and mapping cooling effect and its accessibility of urban parks in an extreme heat event in a megacity. J. Clean. Prod. 2022, 334, 130252. [Google Scholar] [CrossRef]
  17. Du, C.; Jia, W.; Chen, M.; Yan, L.; Wang, K. How can urban parks be planned to maximize cooling effect in hot extremes? Linking maximum and accumulative perspectives. J. Environ. Manag. 2022, 317, 115346. [Google Scholar] [CrossRef] [PubMed]
  18. Zhang, Q.; Zhou, D.; Xu, D.; Rogora, A. Correlation between cooling effect of green space and surrounding urban spatial form: Evidence from 36 urban green spaces. Build. Environ. 2022, 222, 109375. [Google Scholar] [CrossRef]
  19. Gao, Z.; Zaitchik, B.F.; Hou, Y.; Chen, W. Toward park design optimization to mitigate the urban heat island: Assessment of the cooling effect in five U.S. cities. Sustain. Cities Soc. 2022, 81, 103870. [Google Scholar] [CrossRef]
  20. Liang, Z.; Li, Z.; Fan, Z. Seasonal impacts of built environment and its interactions on urban park cooling effects in Nanjing, China. Build. Environ. 2023, 242, 110580. [Google Scholar] [CrossRef]
  21. Bernard, J.; Rodler, A.; Morille, B.; Zhang, X. How to Design a Park and Its Surrounding Urban Morphology to Optimize the Spreading of Cool Air? Climate 2018, 6, 10. [Google Scholar] [CrossRef]
  22. Lin, Z.; Xu, H.; Yao, X.; Yang, C.; Yang, L. Exploring the relationship between thermal environmental factors and land surface temperature of a “furnace city” based on local climate zones. Build. Environ. 2023, 243, 110732. [Google Scholar] [CrossRef]
  23. Li, L.; Zha, Y. Population exposure to extreme heat in China: Frequency, intensity, duration and temporal trends. Sustain. Cities Soc. 2020, 60, 102282. [Google Scholar] [CrossRef]
  24. Yang, C.; Yan, F.; Zhang, S. Comparison of land surface and air temperatures for quantifying summer and winter urban heat island in a snow climate city. J. Environ. Manag. 2020, 265, 110563. [Google Scholar] [CrossRef] [PubMed]
  25. Kim, G.-H.; Lee, Y.-G.; Kim, J.; Choi, H.-W.; Kim, B.-J. Analysis of the Cooling Effects in Urban Green Areas using the Landsat 8 Satellite Data. Korean J. Remote Sens. 2018, 34, 167–178. [Google Scholar] [CrossRef]
  26. Xu, H.; Shi, T.; Wang, M.; Fang, C.; Lin, Z. Predicting effect of forthcoming population growth–induced impervious surface increase on regional thermal environment: Xiong’an New Area, North China. Build. Environ. 2018, 136, 98–106. [Google Scholar] [CrossRef]
  27. Huang, X.; Wang, Y. Investigating the effects of 3D urban morphology on the surface urban heat island effect in urban functional zones by using high-resolution remote sensing data: A case study of Wuhan, Central China. ISPRS J. Photogramm. Remote Sens. 2019, 152, 119–131. [Google Scholar] [CrossRef]
  28. Ministry of Housing and Urban-Rural Development of the People’s Republic of China (MOHURD). Urban Green Space Classification Standard (CJJ/T 85-2017); MOHURD: Beijing, China, 2017. [Google Scholar]
  29. Liu, A.; Ma, X.; Du, M.; Su, M.; Hong, B. The cooling intensity of green infrastructure in local climate zones: A comparative study in China’s cold region. Urban Clim. 2023, 51, 101631. [Google Scholar] [CrossRef]
  30. McElroy, S.; Schwarz, L.; Green, H.; Corcos, I.; Guirguis, K.; Gershunov, A.; Benmarhnia, T. Defining heat waves and extreme heat events using sub-regional meteorological data to maximize benefits of early warning systems to population health. Sci. Total Environ. 2020, 721, 137678. [Google Scholar] [CrossRef]
  31. Barsi, J.A.; Schott, J.R.; Palluconi, F.D.; Hook, S.J. Validation of a web-based atmospheric correction tool for single thermal band instruments. In Proceedings of the Optics and Photonics 2005, Earth Observing Systems X, San Diego, CA, USA, 31 July–4 August 2005; SPIE: San Francisco, CA, USA, 2005; Volume 5882, p. 58820E. [Google Scholar] [CrossRef]
  32. Jiang, L.; Liu, S.; Liu, C.; Feng, Y. How do urban spatial patterns influence the river cooling effect? A case study of the Huangpu Riverfront in Shanghai, China. Sustain. Cities Soc. 2021, 69, 102835. [Google Scholar] [CrossRef]
  33. Yu, Z.; Xu, S.; Zhang, Y.; Jørgensen, G.; Vejre, H. Strong contributions of local background climate to the cooling effect of urban green vegetation. Sci. Rep. 2018, 8, 6798. [Google Scholar] [CrossRef] [PubMed]
  34. Aram, F.; Solgi, E.; Higueras García, E.; Mosavi, A.; Várkonyi-Kóczy, R. The Cooling Effect of Large-Scale Urban Parks on Surrounding Area Thermal Comfort. Energies 2019, 12, 3904. [Google Scholar] [CrossRef]
  35. Li, Z.; Wang, Z.; Wen, D.; Wu, L. How urban parks and their surrounding buildings affect seasonal land surface temperature: A case study in Beijing, China. Urban For. Urban Green. 2023, 87, 128047. [Google Scholar] [CrossRef]
  36. Yuan, B.; Zhou, L.; Dang, X.; Sun, D.; Hu, F.; Mu, H. Separate and combined effects of 3D building features and urban green space on land surface temperature. J. Environ. Manag. 2021, 295, 113116. [Google Scholar] [CrossRef] [PubMed]
  37. Friedman, J.H. Greedy function approximation: A gradient boosting machine. Ann. Stat. 2001, 29, 1189–1232. [Google Scholar] [CrossRef]
  38. He, B.-J.; Ding, L.; Prasad, D. Enhancing urban ventilation performance through the development of precinct ventilation zones: A case study based on the Greater Sydney, Australia. Sustain. Cities Soc. 2019, 47, 101472. [Google Scholar] [CrossRef]
  39. Cao, X.; Onishi, A.; Chen, J.; Imura, H. Quantifying the cool island intensity of urban parks using ASTER and IKONOS data. Landsc. Urban Plan. 2010, 96, 224–231. [Google Scholar] [CrossRef]
  40. Zhao, L.; Lee, X.; Smith, R.; Oleson, K. Strong contributions of local background climate to urban heat islands. Nature 2014, 511, 216–219. [Google Scholar] [CrossRef] [PubMed]
  41. Lu, J.; Li, C.; Yang, Y.; Zhang, X.-H.; Jin, M. Quantitative evaluation of urban park cool island factors in mountain city. J. Cent. South Univ. Technol. 2012, 19, 1657–1662. [Google Scholar] [CrossRef]
  42. Xiao, Y.; Piao, Y.; Wei, W.; Pan, C.; Lee, D.; Zhao, B. A comprehensive framework of cooling effect-accessibility-urban development to assessing and planning park cooling services. Sustain. Cities Soc. 2023, 98, 104817. [Google Scholar] [CrossRef]
  43. Shi, M.; Chen, M.; Jia, W.; Du, C.; Wang, Y. Cooling effect and cooling accessibility of urban parks during hot summers in China’s largest sustainability experiment. Sustain. Cities Soc. 2023, 93, 104519. [Google Scholar] [CrossRef]
  44. Meng, Q.; Gao, J.; Zhang, L.; Hu, X.; Qian, J.; Jancsó, T. Coupled cooling effects between urban parks and surrounding building morphologies based on the microclimate evaluation framework integrating remote sensing data. Sustain. Cities Soc. 2024, 102, 105235. [Google Scholar] [CrossRef]
Figure 1. Methodological framework of this study.
Land 13 01117 g001
Figure 2. Location of the study area.
Land 13 01117 g002
Figure 3. Diagram of the cooling effect of a city park.
Land 13 01117 g003
Figure 4. (a,b) Spatial pattern of cold spots. (cf) Spatial pattern of cooling metrics and in urban parks.
Land 13 01117 g004
Figure 5. Correlation analysis of the park thermal mitigation indicators and influencing factors (*** p < 0.001 ** p < 0.01 * p < 0.05).
Land 13 01117 g005
Figure 6. Relative importance of influencing factors on park thermal mitigation indicators.
Land 13 01117 g006
Figure 7. Marginal effect of the top four index factors of importance.
Land 13 01117 g007
Table 1. Data source and description.
DataDateResolutionSource
Landsat 8 OIL2 August 202130 mhttps://www.gscloud.cn (accessed on 2 August 2021)
Building dataset2021Vector datahttps://lbsyun.baidu.com (accessed on 5 May 2021)
Park data2020Vector dataList of parks in Xi’an City Xi’an Garden and Forestry Bureau
Meteorological data2021Vector dataXi’an Meteorological Bureau
Land cover data2021Vector dataChanged data of the Third Land Survey of Xi’an Municipality
Administrative
boundary
2021Vector dataNational Geomatics Center of China
POI2023Vector datahttps://www.openstreetmap.org (accessed on 8 March 2023)
Table 2. Park and surrounding building indicators’ descriptions.
Categories of IndexesImpact FactorsDescription
Landscape composition character of urban parksPark_areaArea of the urban park
Park_PerimeterPerimeter of the urban park
Park_LSIDegree of landscape shape complexity
Park_FVC*NDVIveg()Consideration is also given to quantifying the vegetation cover and greenness of the park, with NDVIveg as the vegetated area
Park_water_ratePercentage of park water bodies
External environment factors of urban parksBuffer_FARBuilding floor area ratio (FAR) within the park perimeter buffer zone
Buffer_MBHMean building height within the park perimeter buffer zone
Buffer_BHSTDHi is the height of building i; Hmean is the average height of all the average heights of buildings; n is the number of buildings; the standard deviation of the building height
Buffer_BDProportion of building footprint in the buffer zone to total buffer zone area
Buffer_SVFSky view factor, which indicates the amount of sky visible from the ground at a given location and refers to the proportion of the sky that is not obstructed by surrounding buildings
Table 3. VIF test of the urban morphology indicators.
Urban Morphology IndicatorVIF
PCIPCAPCGPCE
Park_area4.5444.5444.5444.544
Park_Perimeter4.7254.7254.7254.725
Park_LSI1.2931.2931.2931.293
Park_FVC*NDVIveg (* means multiplication)1.0821.0821.0821.082
Park_water_rate1.2731.2731.2731.273
Buffer_FAR1.5241.5241.5241.524
Buffer_MBH1.7751.7751.7751.775
Buffer_BHSTD1.9711.9711.9711.971
Buffer_BD1.9381.9381.9381.938
Buffer_SVF1.0891.0891.0891.089
Disclaimer/Publisher’s Note: The statements, opinions and data contained in all publications are solely those of the individual author(s) and contributor(s) and not of MDPI and/or the editor(s). MDPI and/or the editor(s) disclaim responsibility for any injury to people or property resulting from any ideas, methods, instructions or products referred to in the content.

