
Characteristics of Changes in Typical Mountain Wetlands in the Middle and High Latitudes of China over the Past 30 Years
Abstract
:1. Introduction
2. Materials and Methods
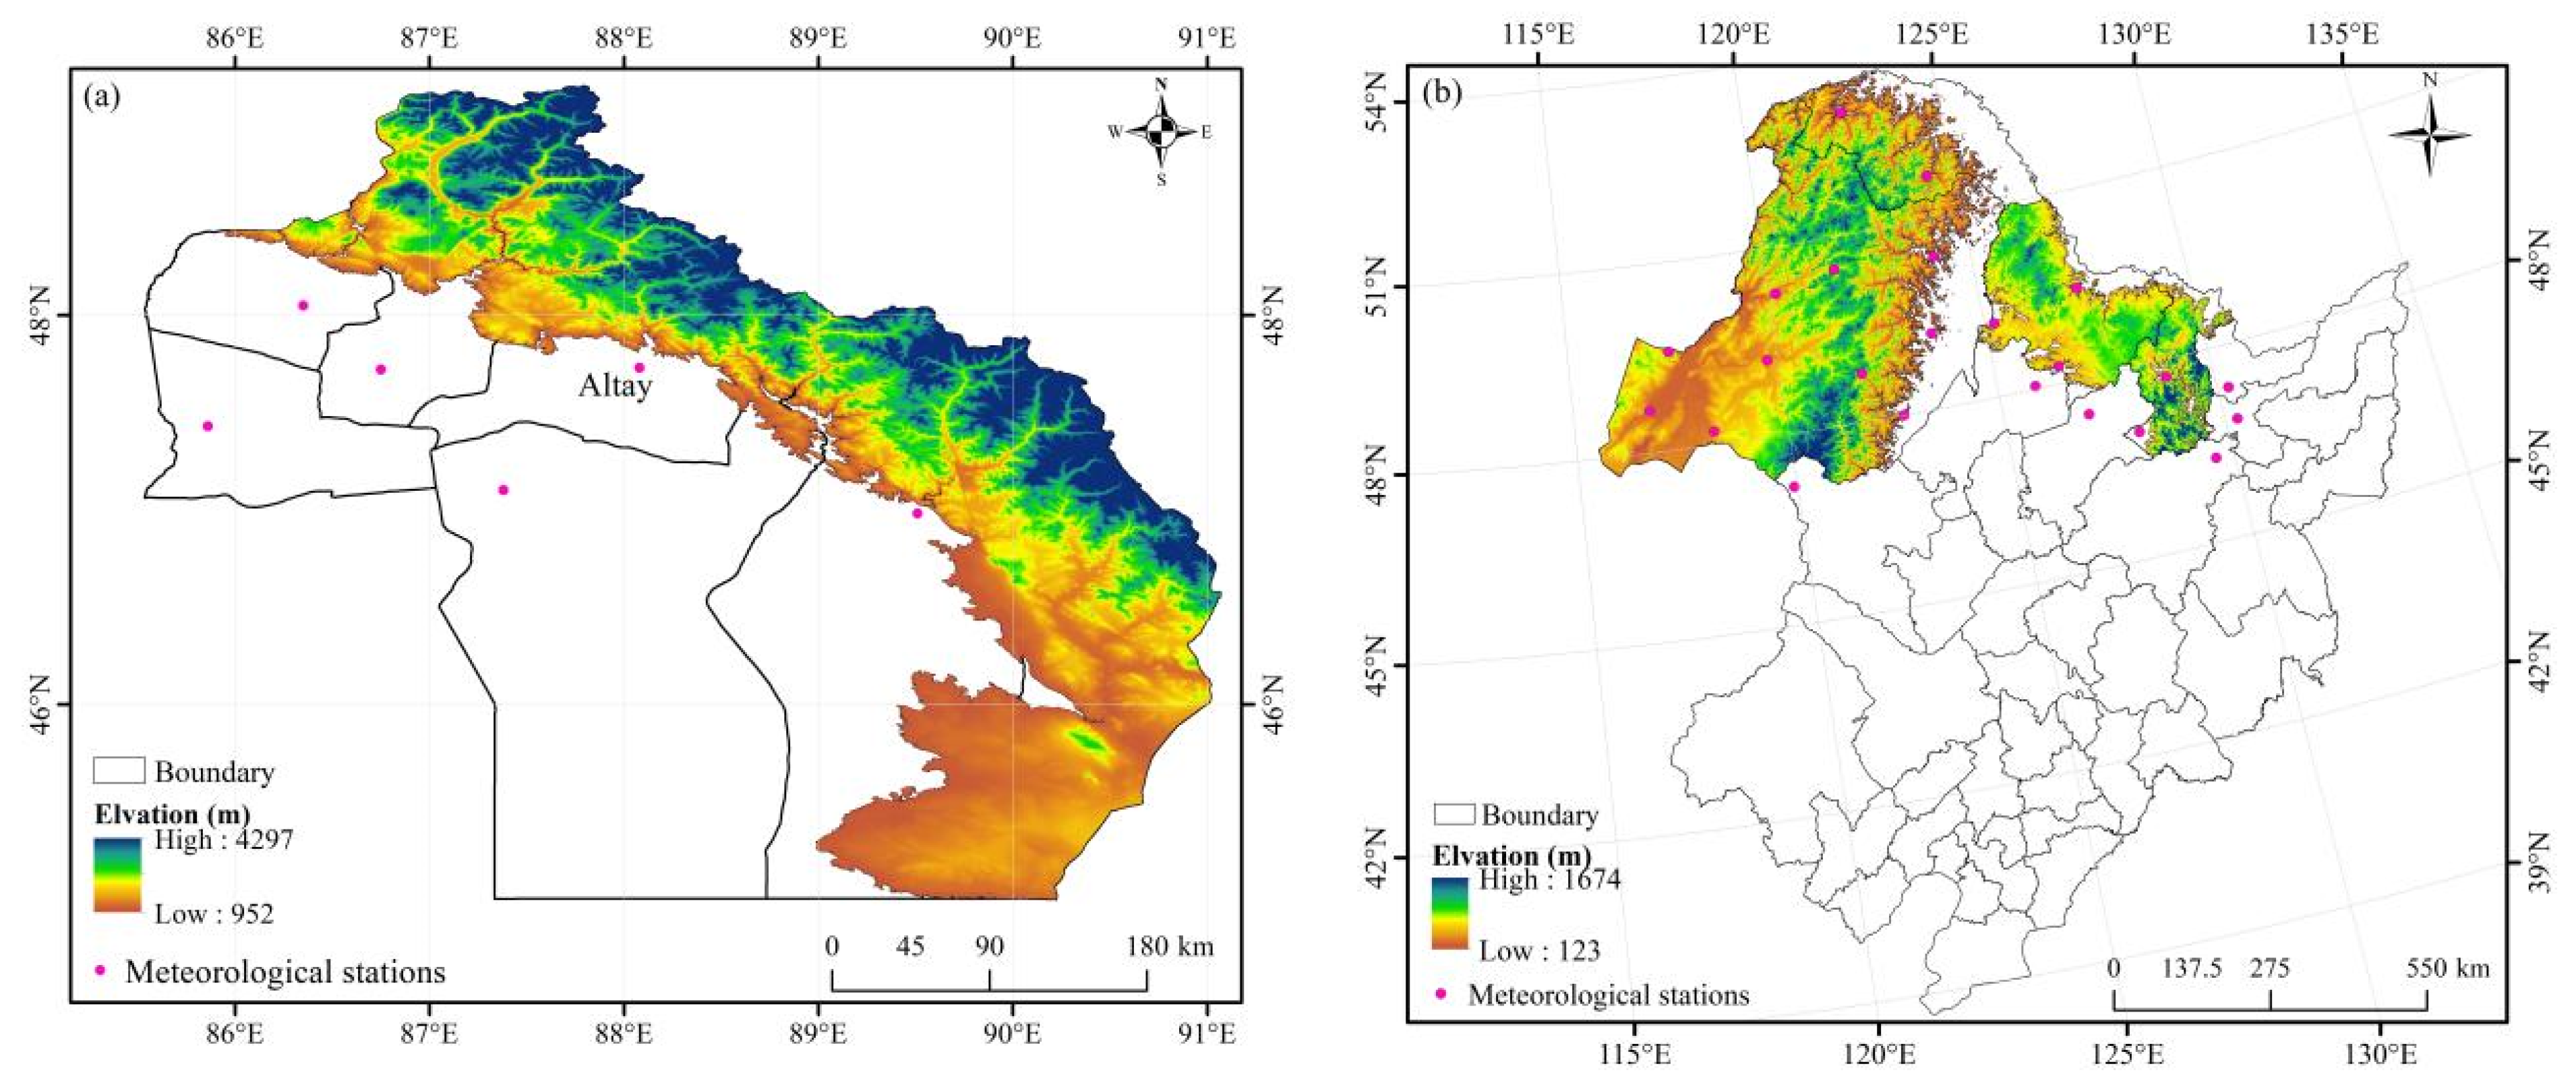
2.1. Study Area
2.2. Data Sources and Processing
2.3. Methods
3. Results
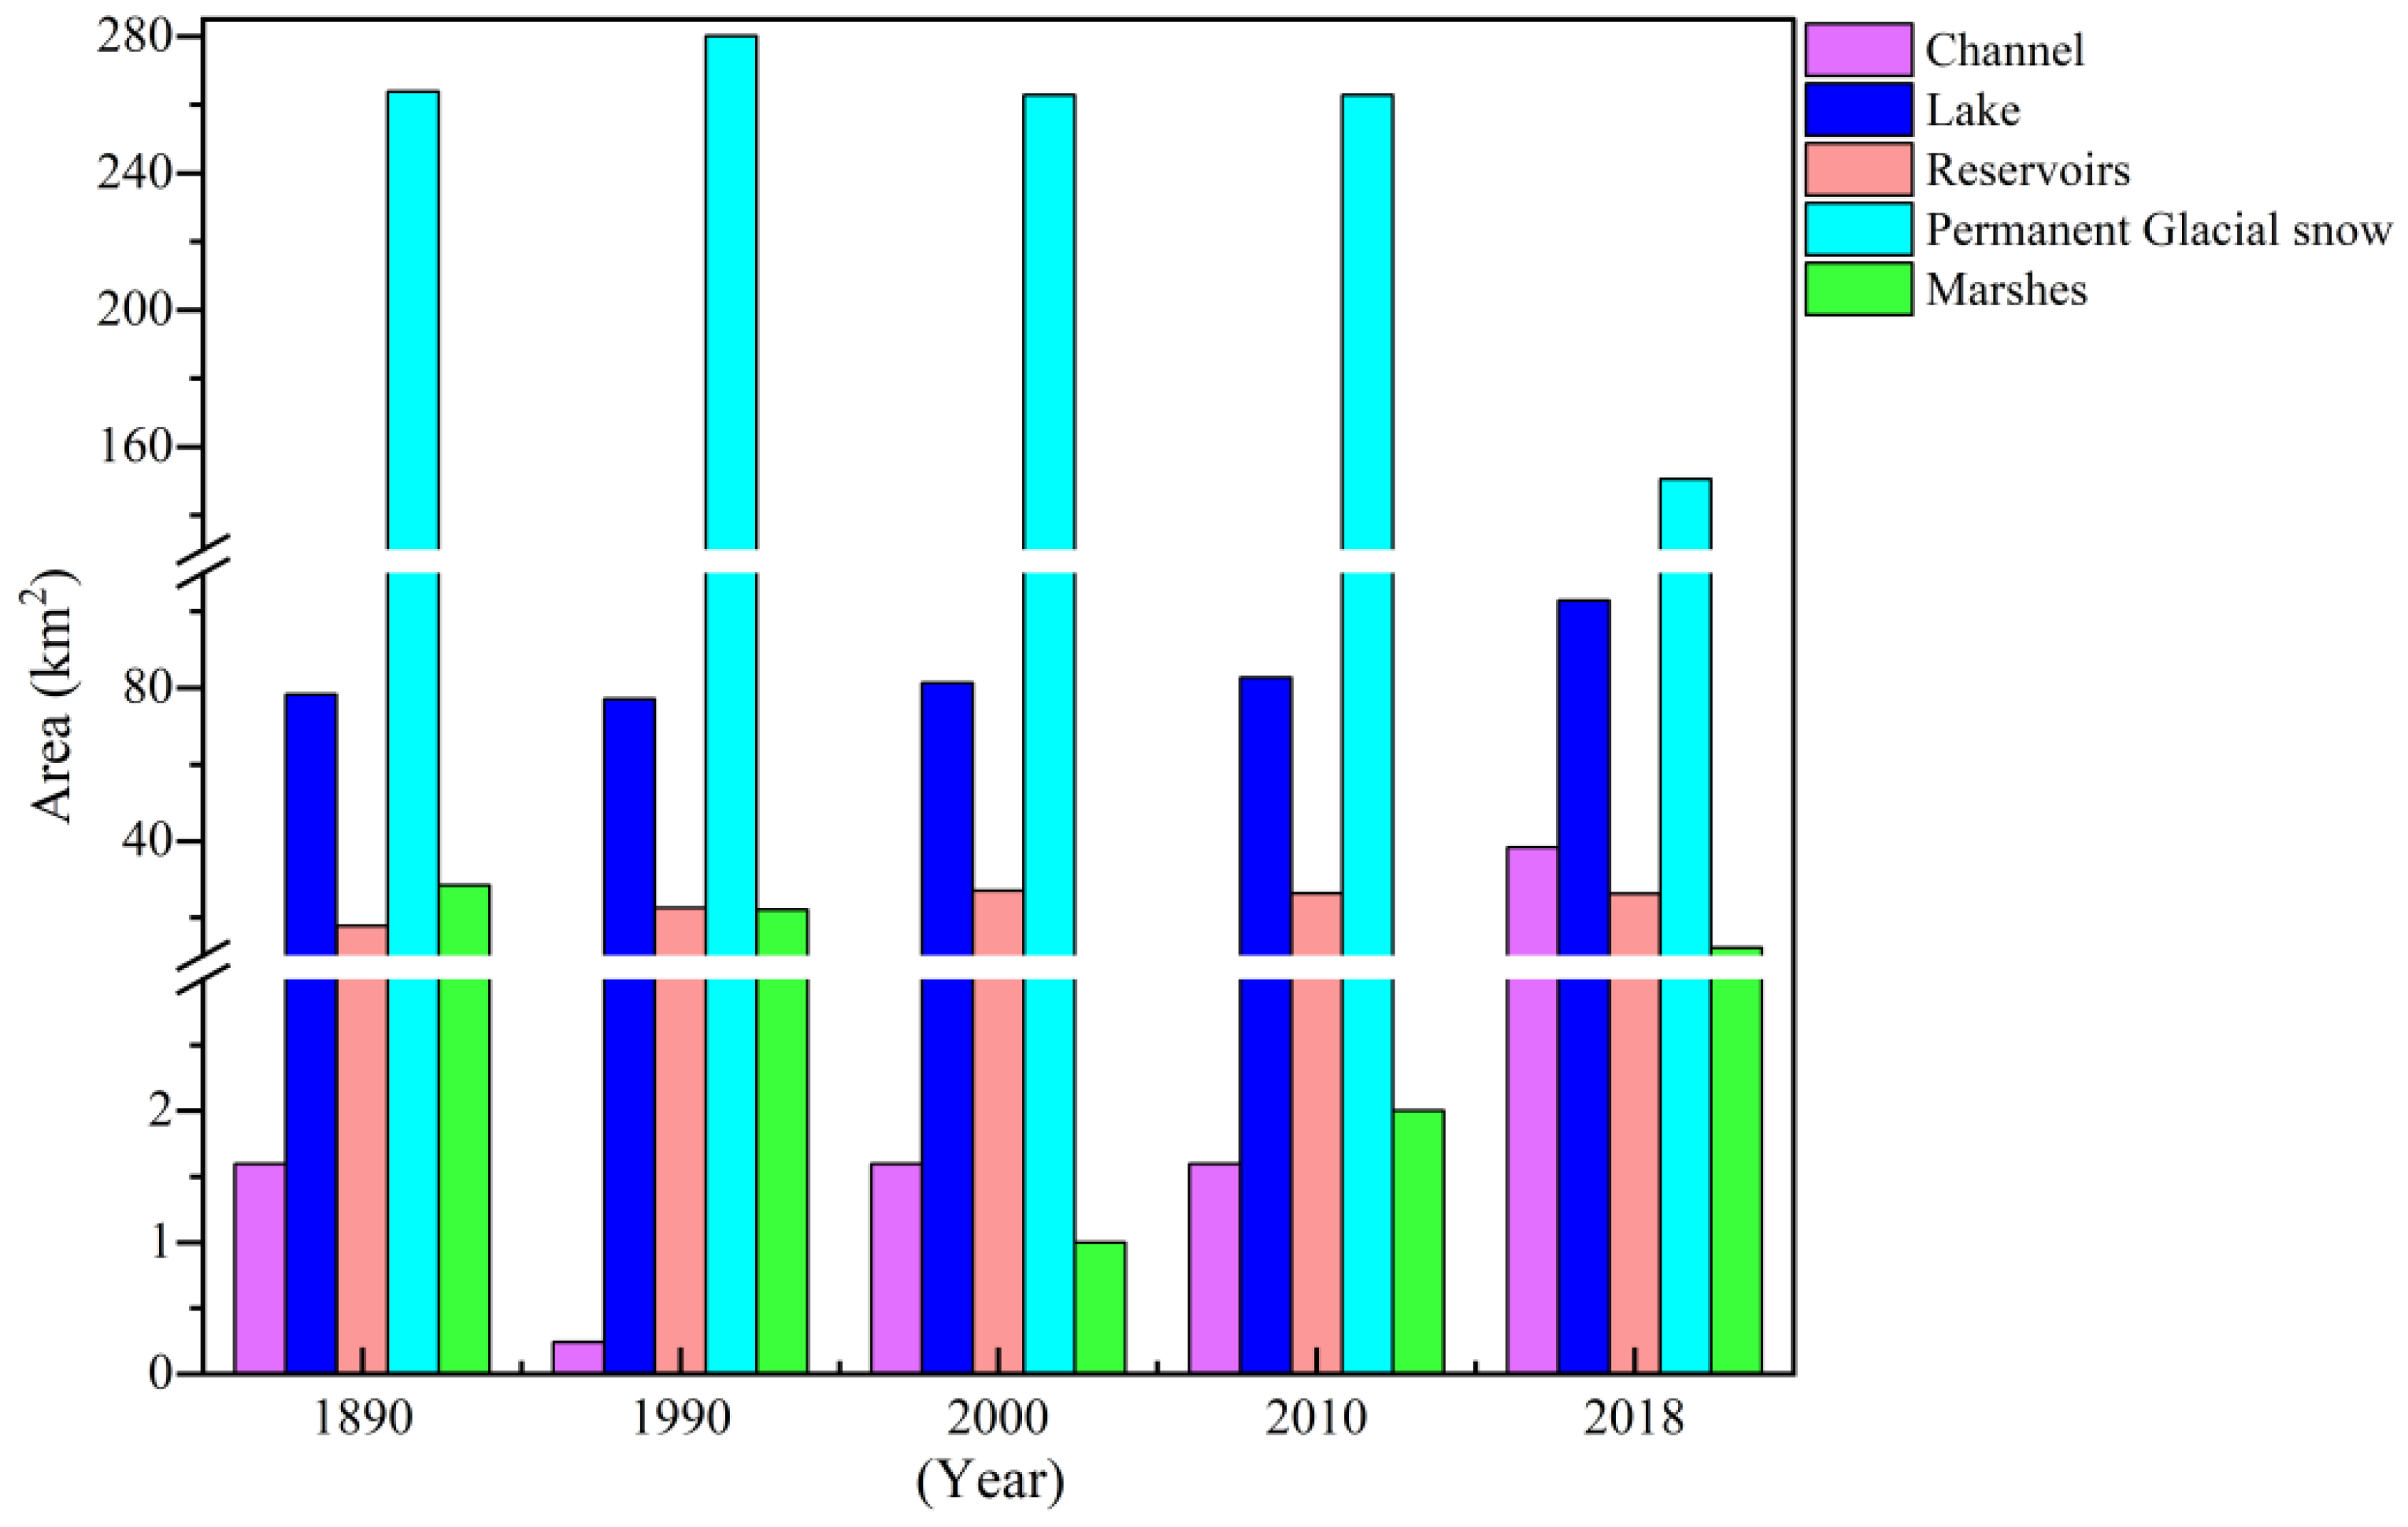
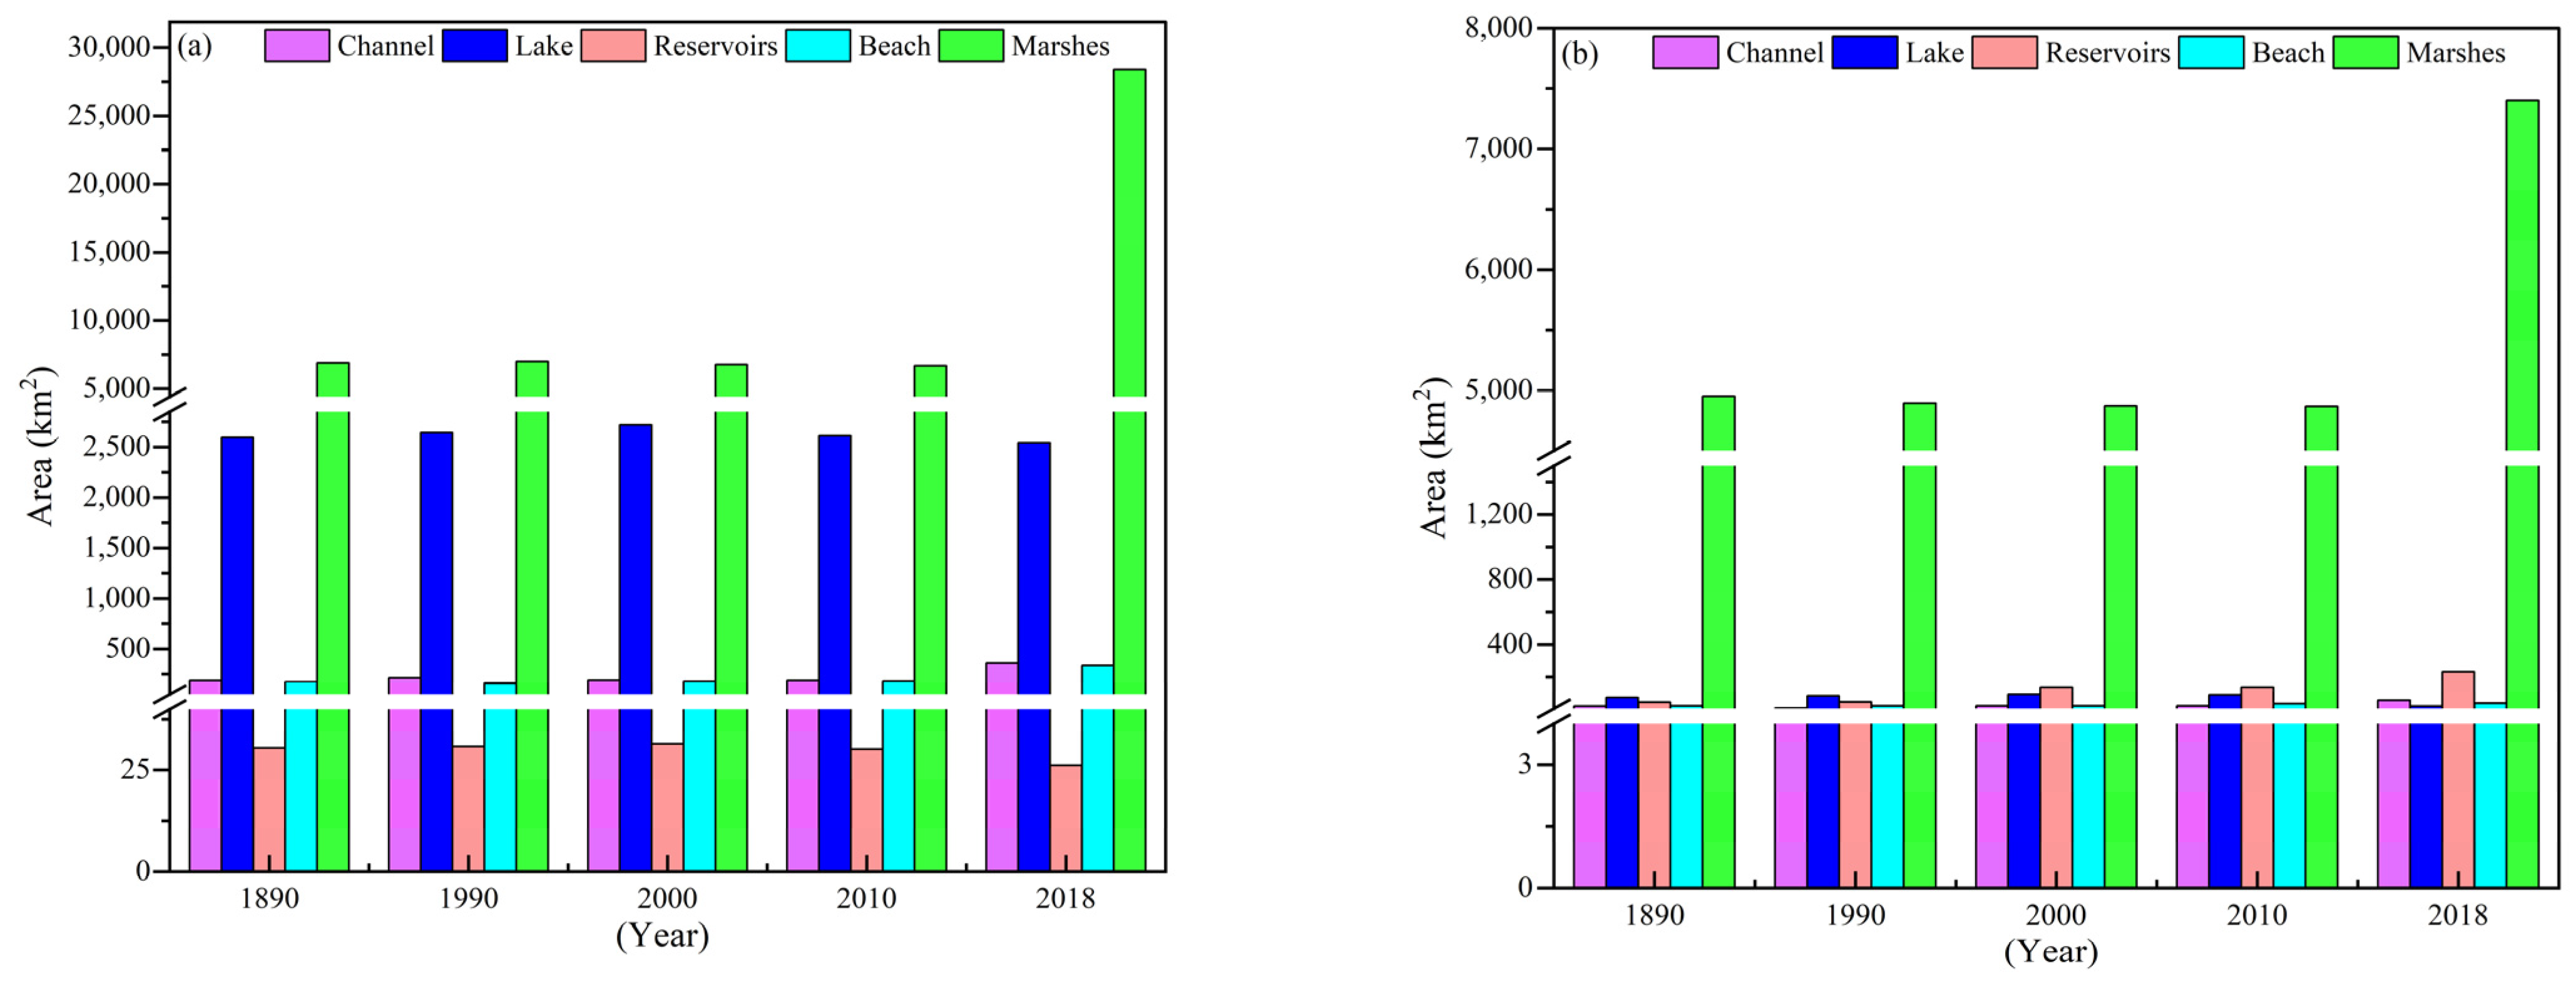
3.1. Wetland Area
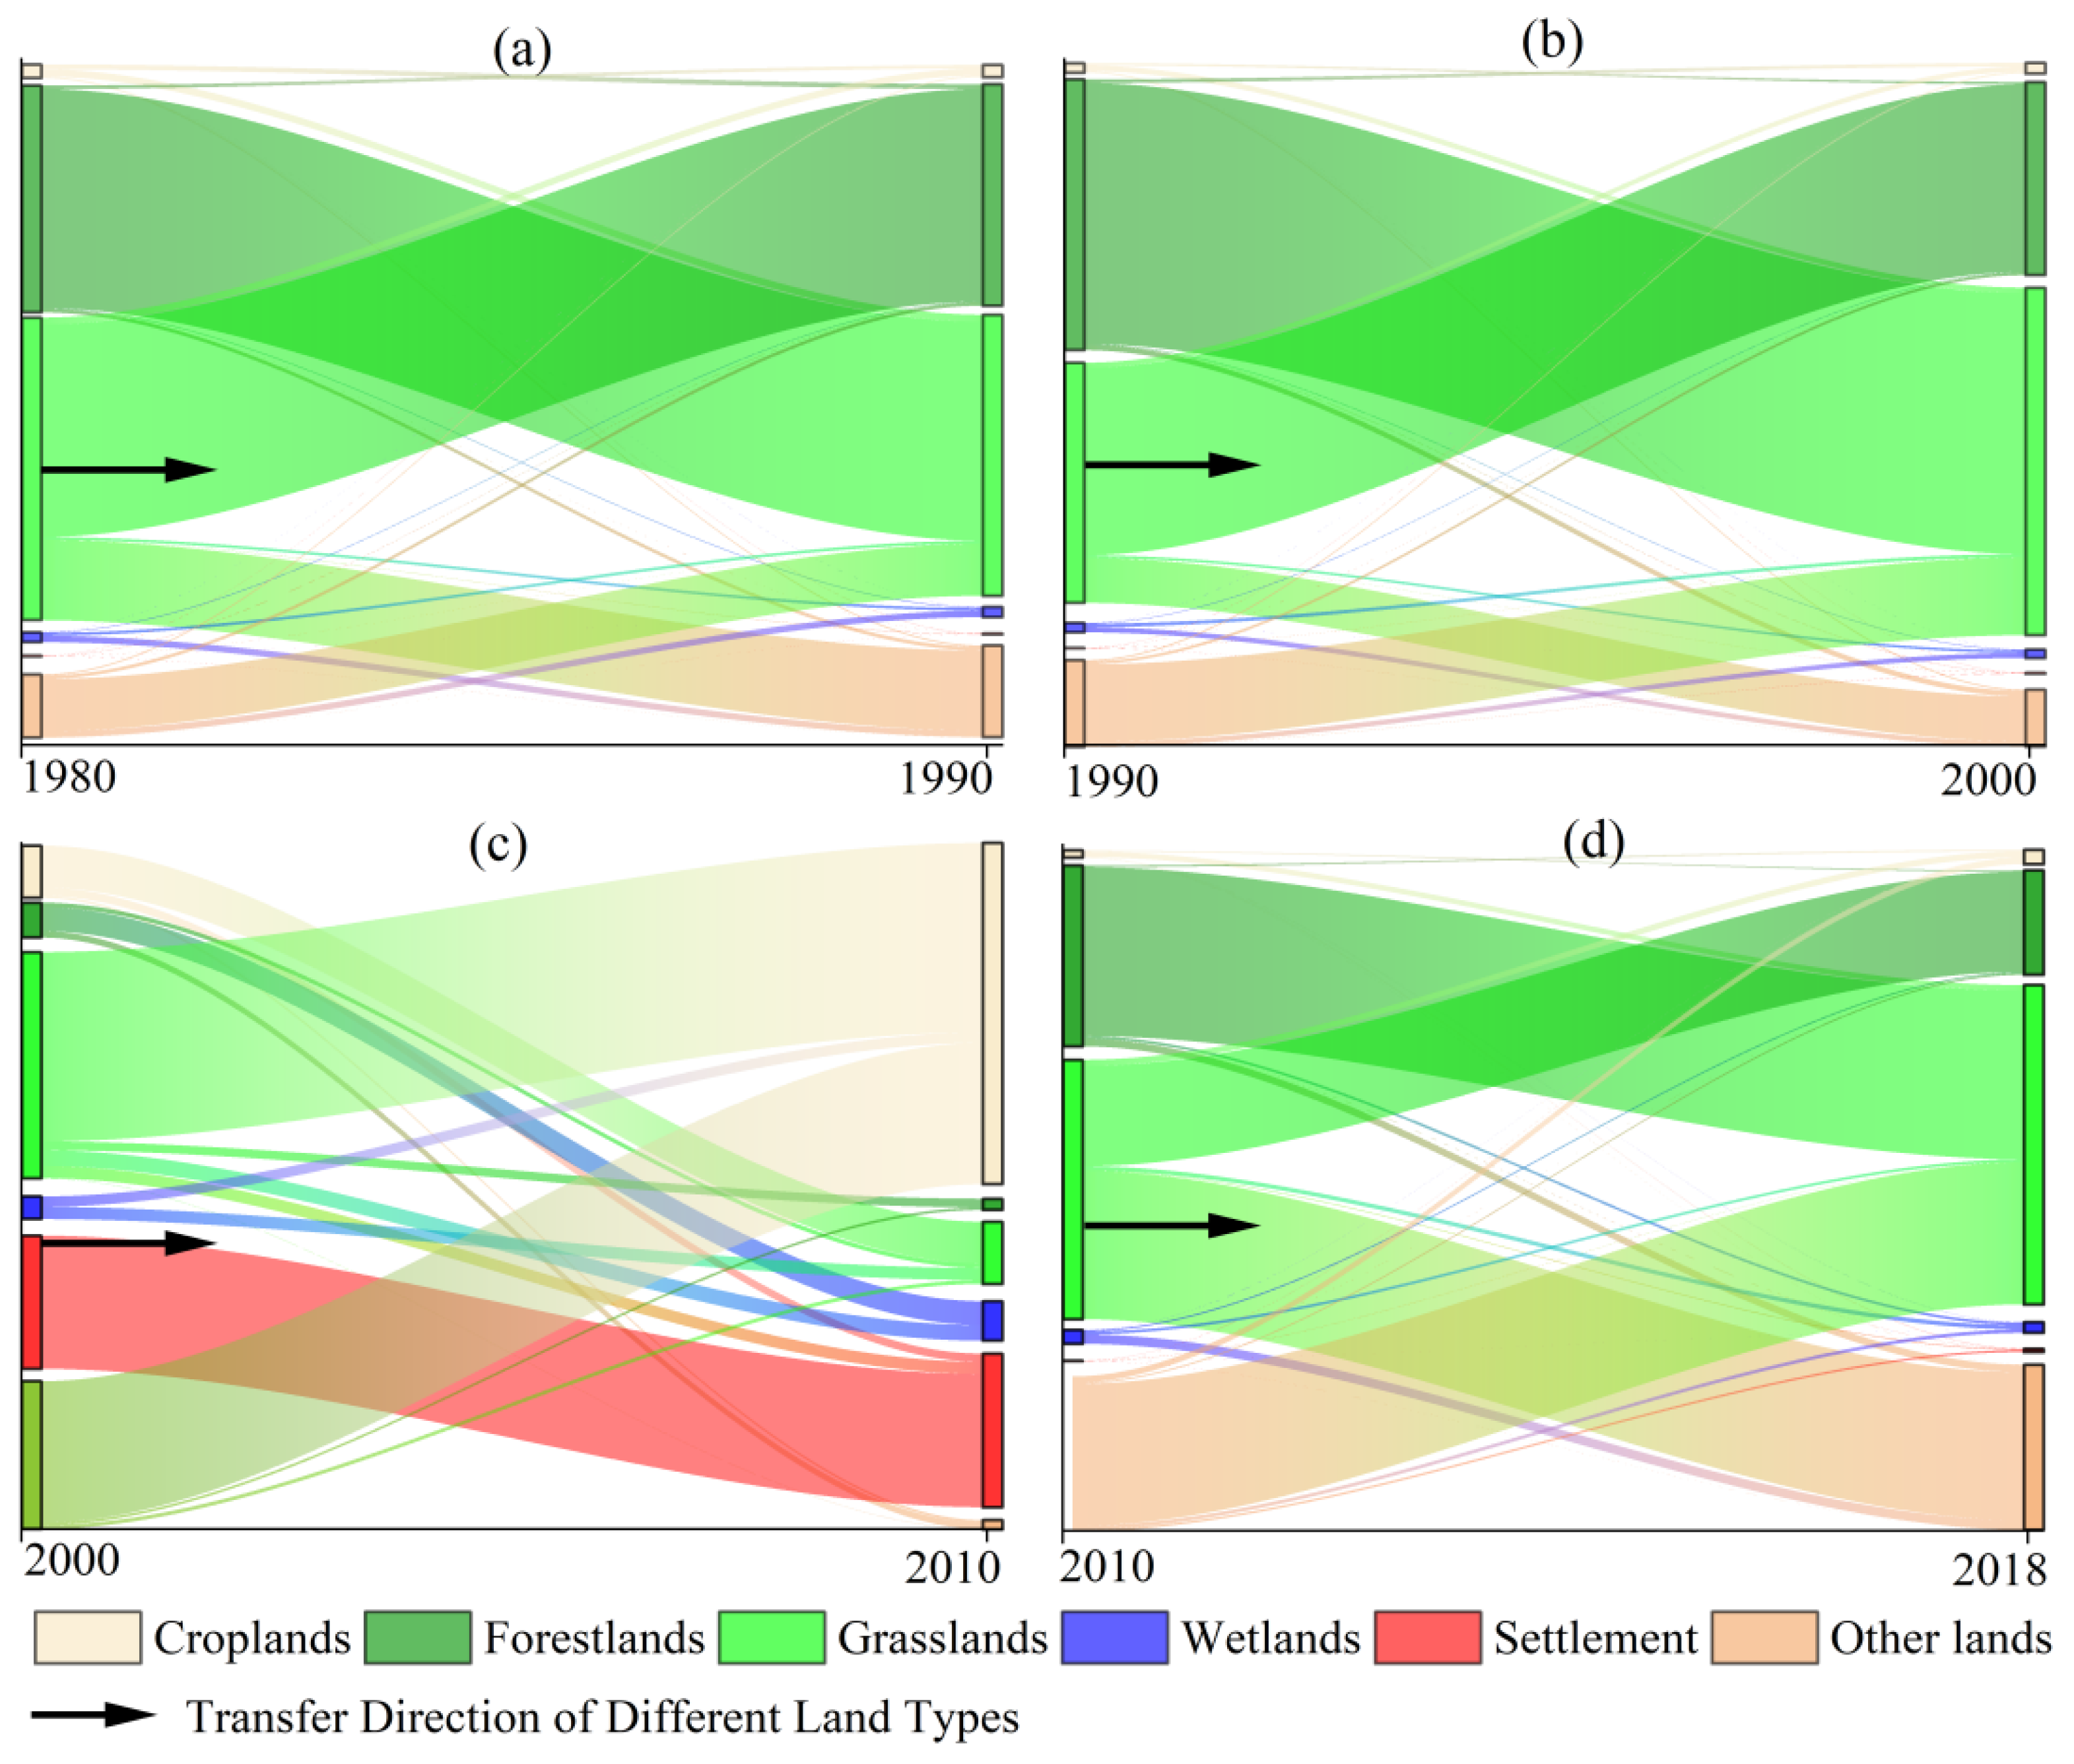
3.2. Transfer Matrix
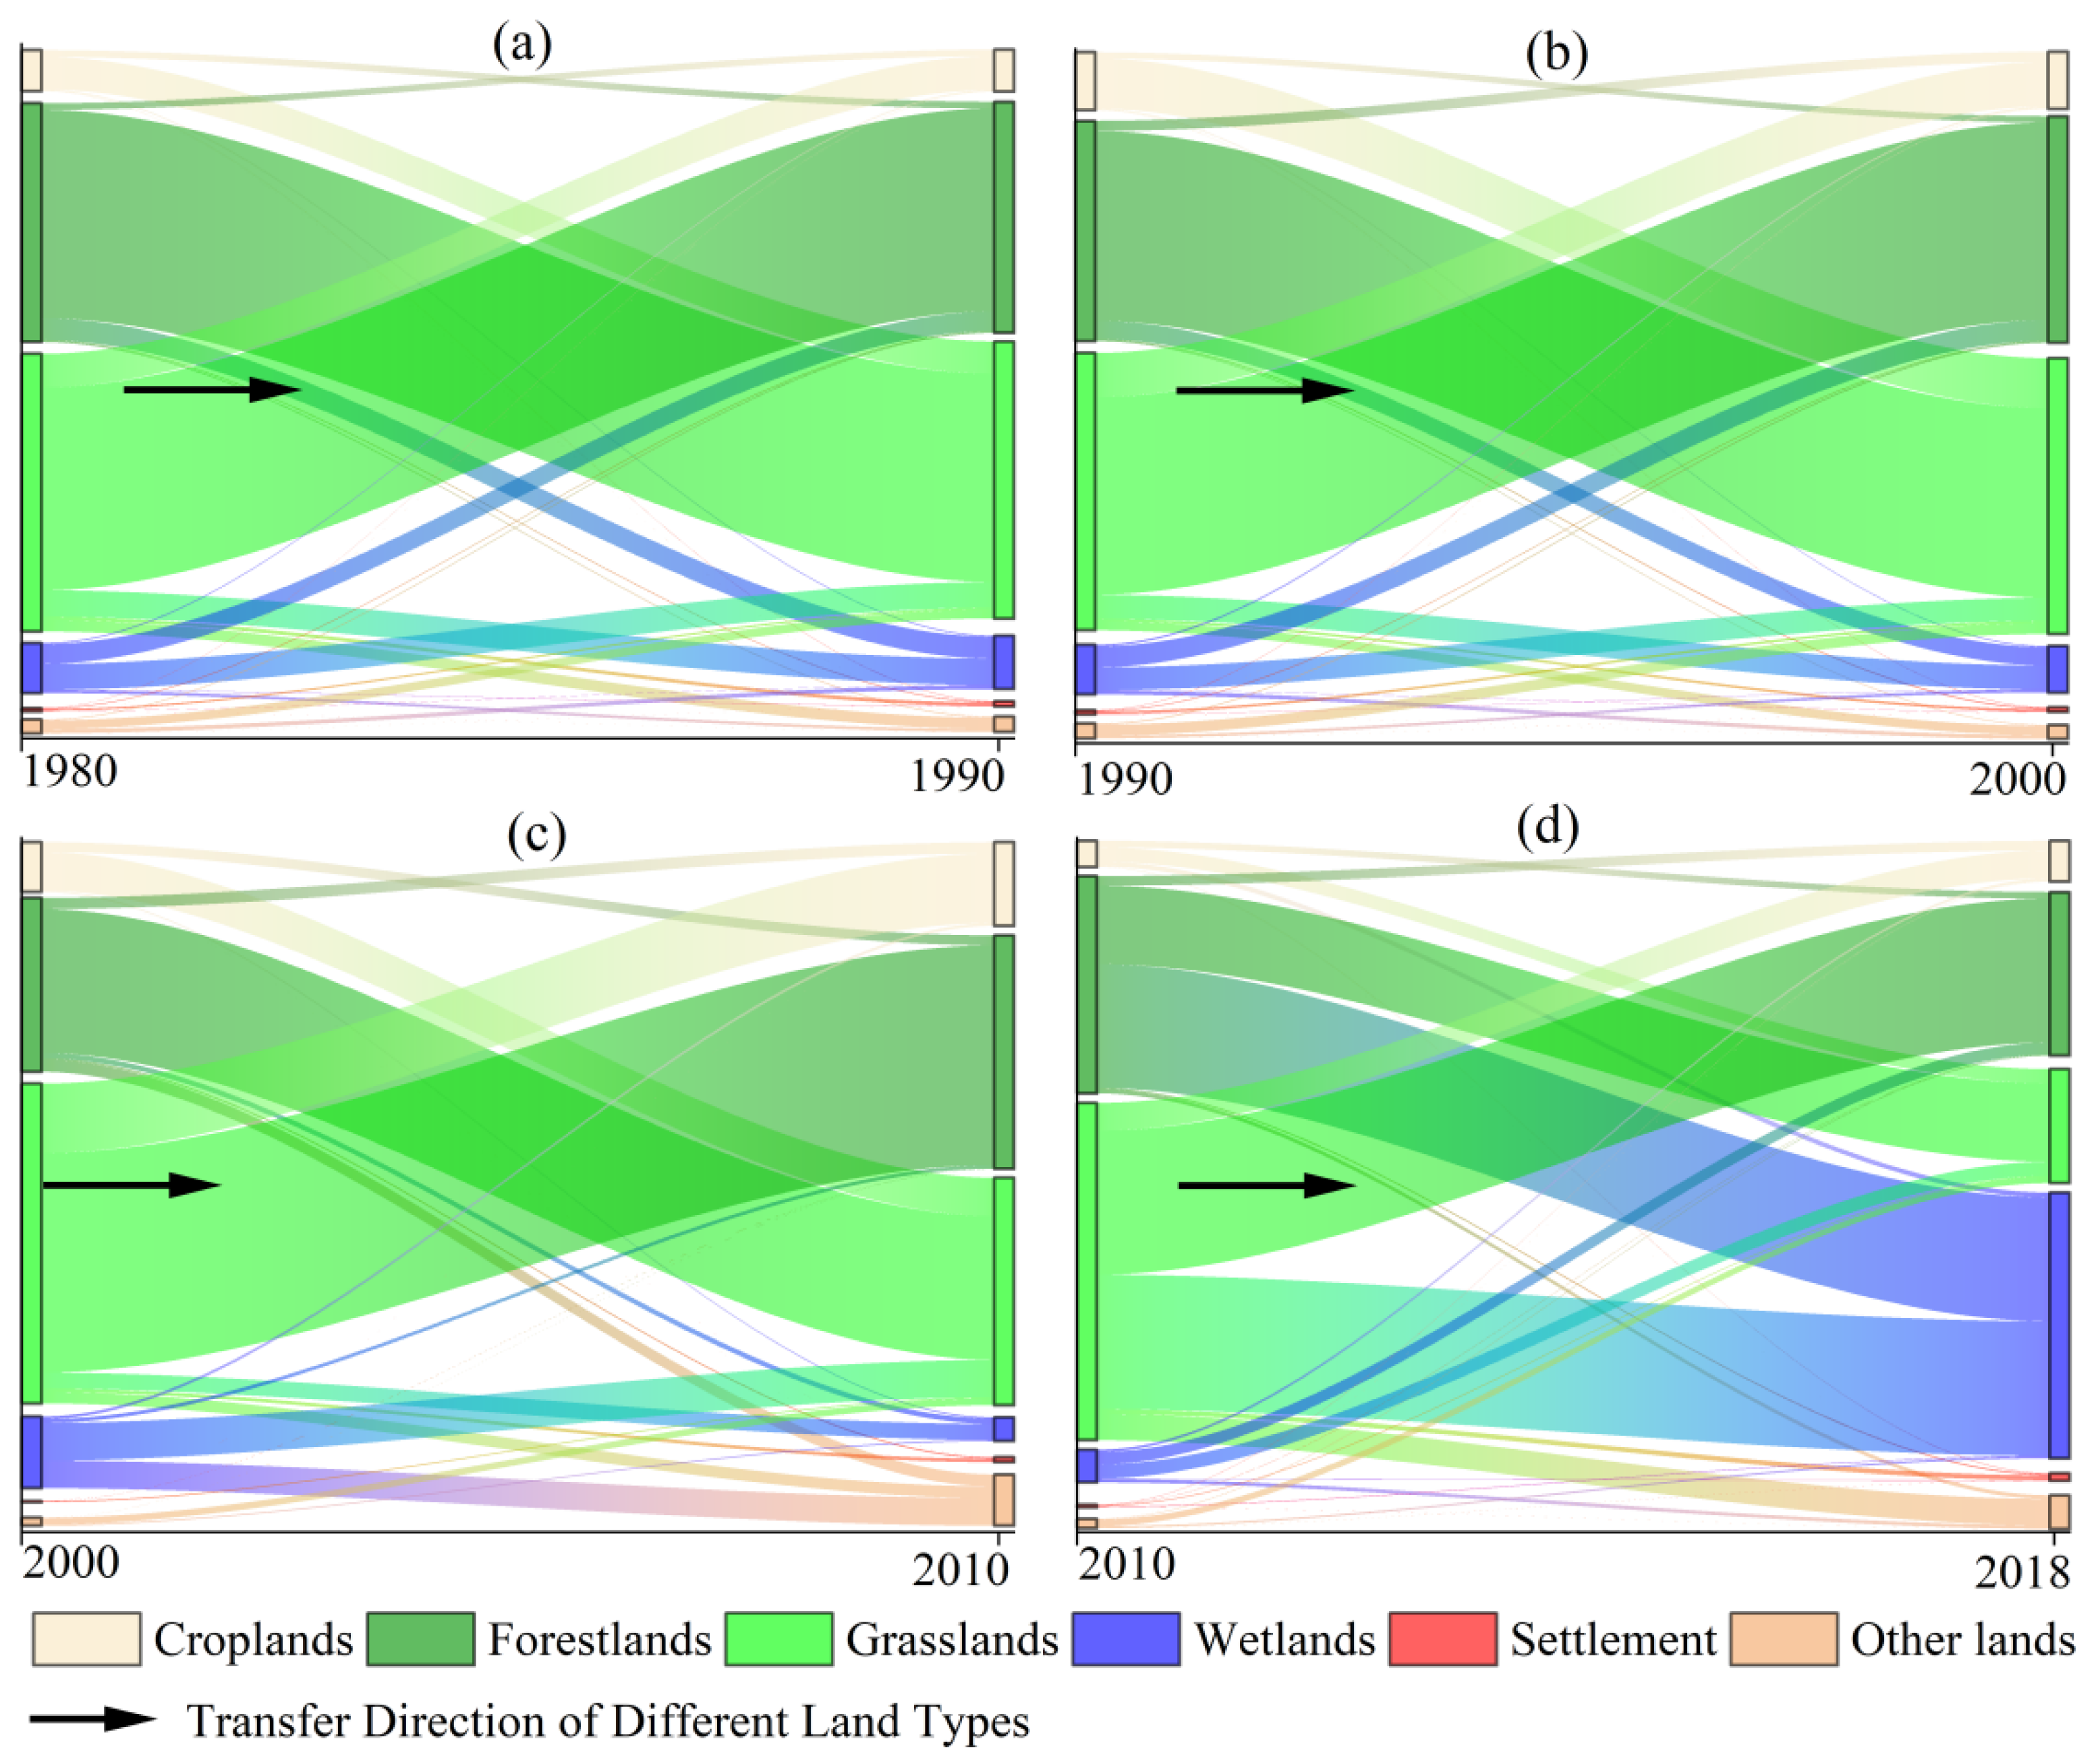
3.2.1. Transfer Matrix of Altay Mountains
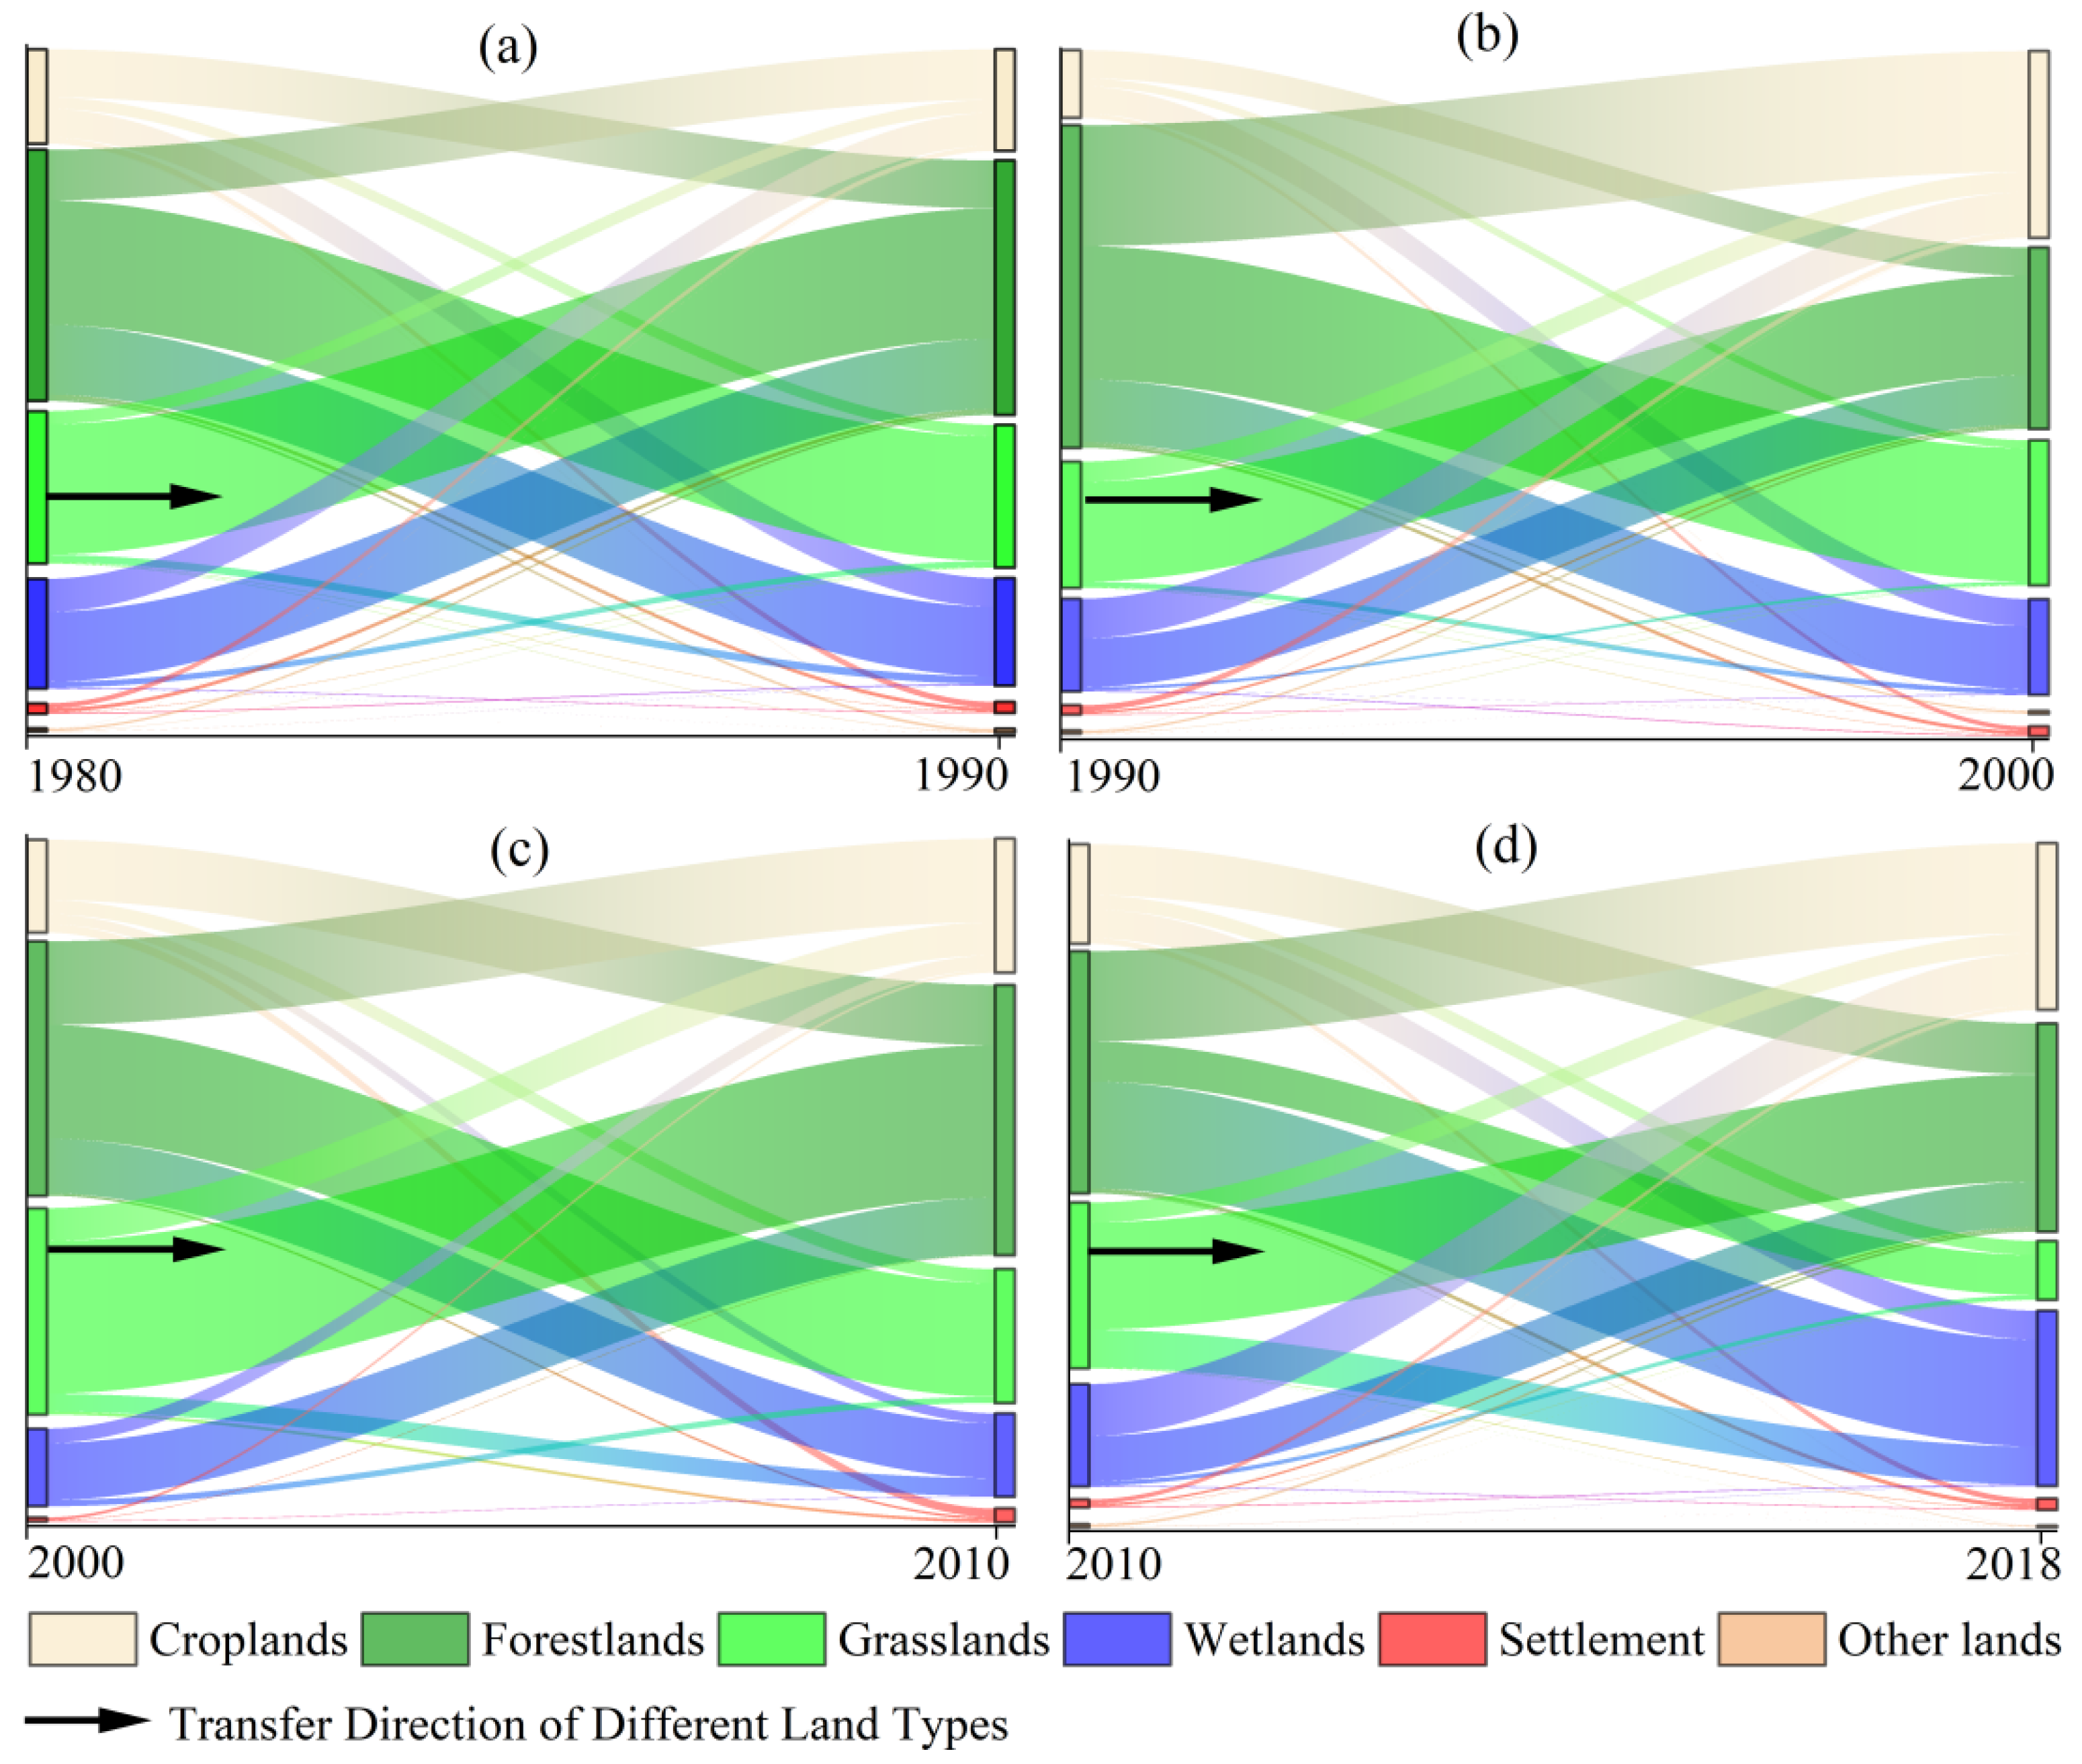
3.2.2. Transfer Matrix of the Greater Khingan Mountains
3.2.3. Transfer Matrix of the Lesser Khingan Mountains
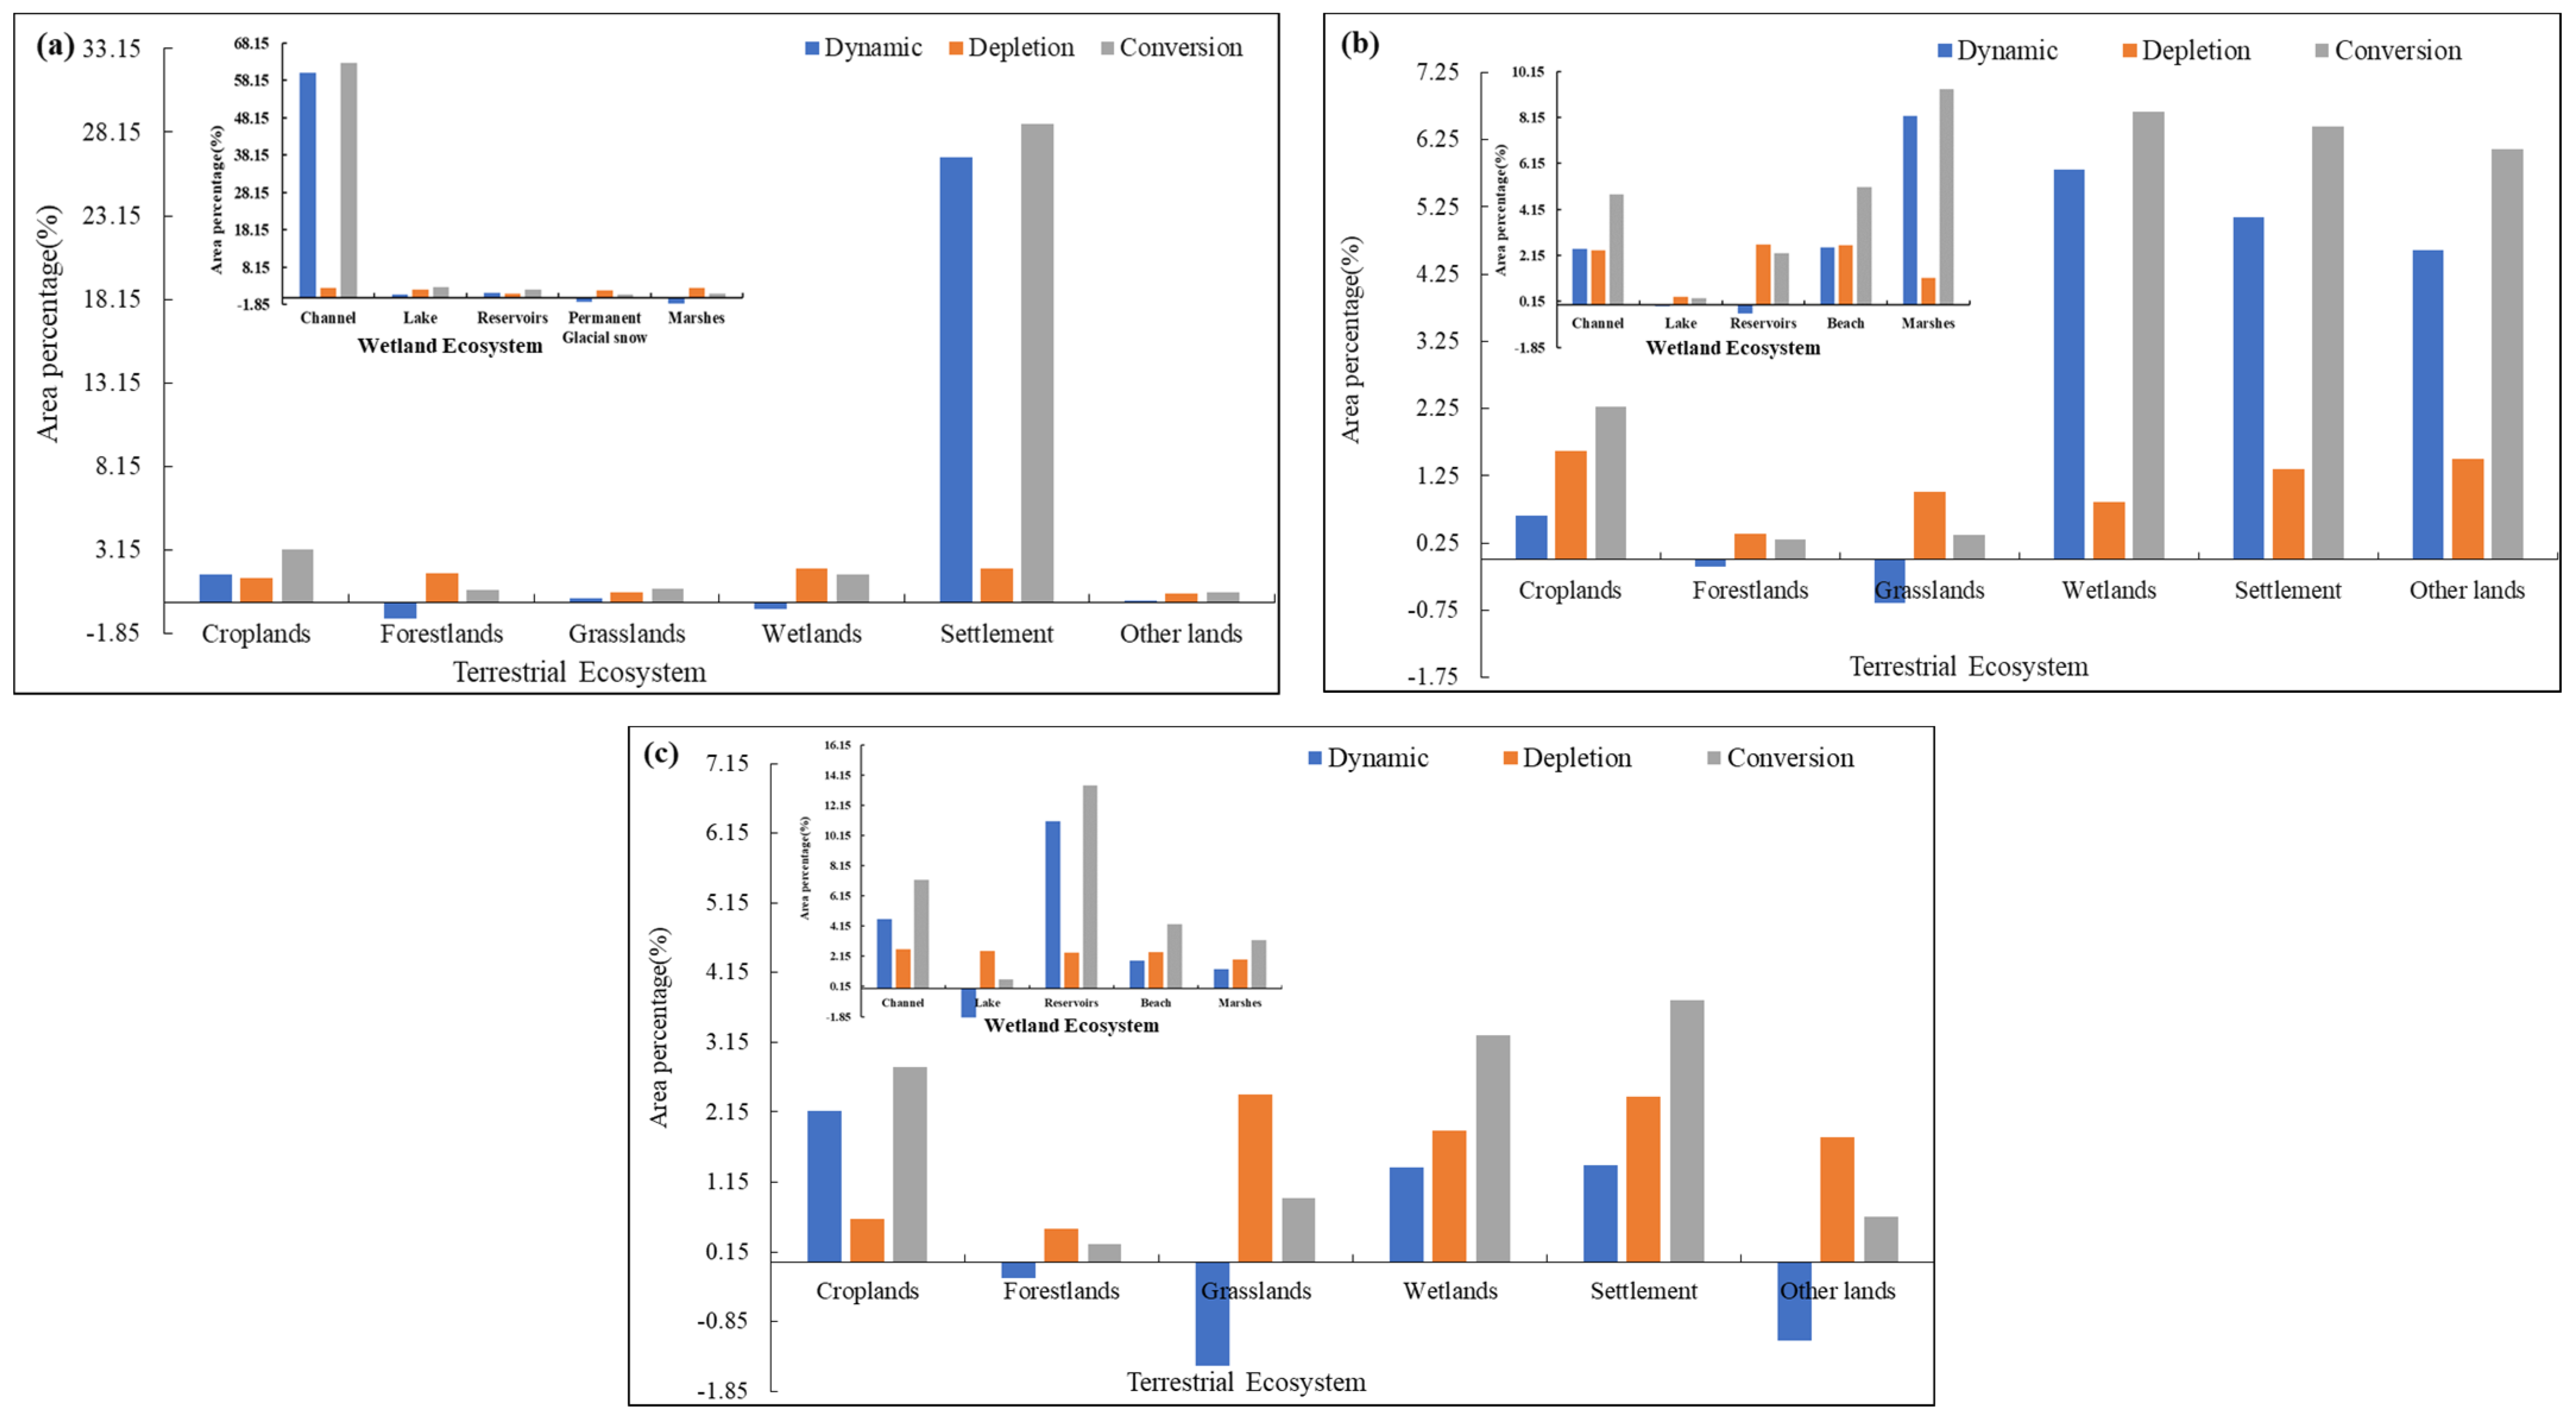
3.3. Dynamic Changes
4. Discussion
4.1. Spatiotemporal Variation of Natural Wetlands
4.2. Main Driving Force of Natural Wetland
5. Conclusions
Supplementary Materials
Author Contributions
Funding
Data Availability Statement
Acknowledgments
Conflicts of Interest
References
- Ramachandra, T.V.; Rajinikanth, R.; Ranjini, V.G. Economic valuation of wetlands. J. Environ. Biol. 2005, 26, 439–447. [Google Scholar] [PubMed]
- Wu, X.; Zhao, H.; Wang, M.; Yuan, Q.; Chen, Z.; Jiang, S.; Deng, W. Evolution of Wetland Patterns and Key Driving Forces in China’s Drylands. Remote Sens. 2024, 16, 702. [Google Scholar] [CrossRef]
- Ge, Y.; Sklenička, P.; Chen, Z. Socioeconomic and Climate Effects on Changes in Wetlands in China during a Three-Decade Period of Rapid Growth. Remote Sens. 2023, 15, 1683. [Google Scholar] [CrossRef]
- Xiao, D.; Deng, L.; Kim, D.; Huang, C.; Tian, K. Carbon budgets of wetland ecosystems in China. Glob. Change Biol. 2019, 25, 2061–2076. [Google Scholar] [CrossRef] [PubMed]
- Li, S.; Ma, H.; Yang, D.; Hu, W.; Li, H. The Main Drivers of Wetland Evolution in the Beijing-Tianjin-Hebei Plain. Land 2023, 12, 480. [Google Scholar] [CrossRef]
- Wei, C.; Guo, B.; Lu, M.; Zang, W.; Yang, F.; Liu, C.; Wang, B.; Huang, X.; Liu, Y.; Yu, Y.; et al. The Changes in Dominant Driving Factors in the Evolution Process of Wetland in the Yellow River Delta during 2015–2022. Remote Sens. 2023, 15, 2858. [Google Scholar] [CrossRef]
- Zhu, C.; Zhang, X.; Huang, Q. Four Decades of Estuarine Wetland Changes in the Yellow River Delta Based on Landsat Observations Between 1973 and 2013. Water 2018, 10, 933. [Google Scholar] [CrossRef]
- Ding, J.S.; Lin, J.X.; Gu, N.K. Studies on Reservoir Wetlands and Its Hydroecology Protection on Qinghai Plateau. J. Hydroecol. 2010, 2, 9–16. [Google Scholar]
- Song, C.; He, H.S.; Liu, K.; Du, H.; Krohn, J. Impact of historical pattern of human activities and natural environment on wetland in Heilongjiang River Basin. Front. Environ. Sci. Eng. 2023, 17, 151. [Google Scholar] [CrossRef]
- Yan, J.; Zhu, J.; Zhao, S.; Su, F. Coastal wetland degradation and ecosystem service value change in the Yellow River Delta, China. Glob. Ecol. Conserv. 2023, 44, e02501. [Google Scholar] [CrossRef]
- Kirwan, M.L.; Megonigal, J.P. Tidal wetland stability in the face of human impacts and sea-level rise. Nature 2013, 504, 53–60. [Google Scholar] [CrossRef]
- Bian, H.; Li, W.; Li, Y.; Ren, B.; Zeng, Z. Driving forces of changes in China’s wetland area from the first (1999–2001) to second (2009–2011) National Inventory of Wetland Resources. Glob. Ecol. Conserv. 2019, 21, e00867. [Google Scholar] [CrossRef]
- Meng, W.; He, M.; Hu, B.; Mo, X.; Li, H.; Liu, B.; Wang, Z. Status of wetlands in China: A review of extent, degradation, issues and recommendations for improvement. Ocean Coast. Manag. 2017, 146, 50–59. [Google Scholar] [CrossRef]
- Liu, J.; Tian, H.; Liu, M.; Zhuang, D.; Melillo, J.M.; Zhang, Z. China’s changing landscape during the 1990s: Large-scale land transformations estimated with satellite data. Geophys. Res. Lett. 2005, 32, L02405. [Google Scholar] [CrossRef]
- Li, M.; Sun, H.; Su, Z. Research progress in dry/wet climate variation in Northwest China. Geogr. Res. 2021, 40, 1180–1194. [Google Scholar]
- Zhao, R.; Sun, H.; Xing, L.; Li, R.; Li, M. Effects of anthropogenic climate change on the drought characteristics in China: From frequency, duration, intensity, and affected area. J. Hydrol. 2023, 617, 129008. [Google Scholar] [CrossRef]
- AghaKouchak, A.; Chiang, F.; Huning, L.S.; Love, C.A.; Mallakpour, I.; Mazdiyasni, O.; Moftakhari, H.; Papalexiou, S.M.; Ragno, E.; Sadegh, M. Climate Extremes and Compound Hazards in a Warming World. Annu. Rev. Earth Planet. Sci. 2020, 48, 519–548. [Google Scholar] [CrossRef]
- You, Q.; Kang, S.; Li, J.; Chen, D.; Zhai, P.; Ji, Z. Several research frontiers of climate change over the Tibetan Plateau. J. Glaciol. Geocryol. 2021, 43, 885–901. [Google Scholar]
- Ribeiro, K.; Pacheco, F.S.; Ferreira, J.W.; De Sousa-Neto, E.R.; Hastie, A.; Krieger Filho, G.C.; Alvalá, P.C.; Forti, M.C.; Ometto, J.P. Tropical peatlands and their contribution to the global carbon cycle and climate change. Glob. Chang. Biol. 2021, 27, 489–505. [Google Scholar] [CrossRef]
- Lee, J.; Park, S.; Kim, J.; Sur, C.; Chen, J. Extreme drought hotspot analysis for adaptation to a changing climate: Assessment of applicability to the five major river basins of the Korean Peninsula. Int. J. Clim. 2018, 38, 4025–4032. [Google Scholar] [CrossRef]
- Vicente-Serrano, S.M.; Beguería, S.; López-Moreno, J.I. A Multiscalar Drought Index Sensitive to Global Warming: The Standardized Precipitation Evapotranspiration Index. J. Clim. 2010, 23, 1696–1718. [Google Scholar] [CrossRef]
- Yang, Y.; Dai, E.; Yin, J.; Jia, L.; Zhang, P.; Sun, J. Spatial and Temporal Evolution Patterns of Droughts in China over the Past 61 Years Based on the Standardized Precipitation Evapotranspiration Index. Water 2024, 16, 1012. [Google Scholar] [CrossRef]
- Zhou, K.; Wu, S.; Li, J. Spatial and temporal variability of wetland resources in Xinjiang. Geogr. Arid. Zones 2004, 27, 4. [Google Scholar]
- Luo, N.; Yu, R.; Mao, D.; Wen, B.; Liu, X. Spatiotemporal variations of wetlands in the northern Xinjiang with relationship to climate change. Wetl. Ecol. Manag. 2021, 29, 617–631. [Google Scholar] [CrossRef]
- Gong, Z.; Li, H.; Zhao, W.; Gong, H. Driving forces analysis of reservoir wetland evolution in Beijing during 1984–2010. J. Geogr. Sci. 2013, 23, 753–768. [Google Scholar] [CrossRef]
- Jing, Y.; Zhang, F.; He, Y.; Kung, H.-T.; Johnson, V.C.; Arikena, M. Assessment of spatial and temporal variation of ecological environment quality in Ebinur Lake Wetland National Nature Reserve, Xinjiang, China. Ecol. Indic. 2020, 110, 105874. [Google Scholar] [CrossRef]
- Mao, D.; Luo, L.; Wang, Z.; Wilson, M.C.; Zeng, Y.; Wu, B.; Wu, J. Conversions between natural wetlands and farmland in China: A multiscale geospatial analysis. Sci. Total Environ. 2018, 634, 550–560. [Google Scholar] [CrossRef] [PubMed]
- Pratte, S.; Bao, K.; Shen, J.; Mackenzie, L.; Klamt, A.-M.; Wang, G.; Xing, W. Recent atmospheric metal deposition in peatlands of northeast China: A review. Sci. Total Environ. 2018, 626, 1284–1294. [Google Scholar] [CrossRef]
- Bao, K.; Liu, T.; Chen, M.; Lin, Z.; Zhong, J.; Neupane, B. Peat records of atmospheric environmental changes in China: A brief review and recommendations for future research perspectives. Catena 2023, 229, 107234. [Google Scholar] [CrossRef]
- Chang, X.L.; Yu, S.P.; Jin, H.J.; Zhang, Y.L. Vegetation impact on the thermal regimes of the active layer and near-surface permafrost in the Greater Hinggan Mountains, Northeastern China. Sci. Cold Arid. Reg. 2014, 6, 511–520. [Google Scholar]
- Jin, X.; Qiang, H.; Zhao, L.; Jiang, S.; Cui, N.; Cao, Y.; Feng, Y. SPEI-based analysis of spatio-temporal variation characteristics for annual and seasonal drought in the Zoige Wetland, Southwest China from 1961 to 2016. Theor. Appl. Clim. 2020, 139, 711–725. [Google Scholar] [CrossRef]
- Zhang, H.; Chen, W.; Liu, Z. Spatiotemporal Evolution of Entrepreneurial Activities and Its Driving Factors in the Yangtze River Delta, China. Land 2022, 11, 216. [Google Scholar] [CrossRef]
- Shcheglova, A.A. Impulse Transfer Matrix of a Time-Varying System of Differential-Algebraic Equations. J. Comput. Syst. Sci. Int. 2023, 62, 1–16. [Google Scholar] [CrossRef]
- Anputhas, M.; Janmaat, J.J.A.; Nichol, C.F.; Wei, X.A. Modelling spatial association in pattern based land use simulation models. J. Environ. Manag. 2016, 181, 465–476. [Google Scholar] [CrossRef]
- Luo, N.; Wen, B.; Bao, K.; Yu, R.; Sun, J.; Li, X.; Liu, X. Centennial records of Polycyclic aromatic hydrocarbons and black carbon in Altay Mountains peatlands, Xinjiang, China. Front. Ecol. Evol. 2022, 10, 1046076. [Google Scholar] [CrossRef]
- Bishara, A.J.; Hittner, J.B. Testing the significance of a correlation with nonnormal data: Comparison of Pearson, Spearman, transformation, and resampling approaches. Psychol. Methods 2012, 17, 399–417. [Google Scholar] [CrossRef] [PubMed]
- Zhang, Y.; Yang, P.; Tong, C.; Liu, X.; Zhang, Z.; Wang, G.; Meyers, P.A. Palynological record of Holocene vegetation and climate changes in a high-resolution peat profile from the Xinjiang Altai Mountains, northwestern China. Quat. Sci. Rev. Int. Multidiscip. Rev. J. 2018, 201, 111–123. [Google Scholar] [CrossRef]
- Wu, X.; Zhang, C.; Dong, S.; Hu, J.; Tong, X.; Zheng, X. Spatiotemporal changes of the aridity index in Xinjiang over the past 60 years. Environ. Earth Sci. 2023, 82, 392. [Google Scholar] [CrossRef]
- Wang, W.; Jiao, A.; Shan, Q.; Wang, Z.; Kong, Z.; Ling, H.; Deng, X. Expansion of typical lakes in Xinjiang under the combined effects of climate change and human activities. Front. Environ. Sci. 2022, 10, 1015543, Correction in Front. Environ. Sci. 2023, 11, 1187155. [Google Scholar] [CrossRef]
- Mamitiya, Y. Study on the Dynamic Changes of Peat Wetlands in Altay Mountains of China and Countermeasures for Their Restoration. Master’s Thesis, Xinjiang University, Xinjiang, China, 2011. [Google Scholar]
- Zhao, K.Y. Rcords of Mires in China; Science Press: Beijing, China, 1999. [Google Scholar]
- Nuerbyi, A.; Yelebolati, T.; Kong, Q.Y. Investigation and study of Wetlands in Altay area. J. Urumqi Vocat. Univ. 2008, 6, 8–13. [Google Scholar]
- Yu, X.; Ma, Y. Spatial and Temporal Analysis of Extreme Climate Events over Northeast China. Atmosphere. 2022, 13, 1197. [Google Scholar] [CrossRef]
- Jia, J.; Guo, J. Characteristics of climate change in northeast China for last 46 years. J. Arid. Land Resour. Environ. 2011, 25, 109–115. [Google Scholar]
- Sun, F.; Yang, X.; Lu, S.; Yang, S. The contrast analysis on the average and extremum temperature trend in northeast China. Sci. Meteorol. Sin. 2006, 26, 157–163. [Google Scholar]
- Jiao, R.M. A Review of the Causes of Extreme Weather and Climate Events in Northeast China since Modern Times. Soc. Sci. J. 2013, 6, 156–162. [Google Scholar]
- Zhao, D.D. The Change of Wetland distribution and the Simulated Response to Climatic Change in the Great Xing’an Mountains. Ph.D. Thesis, Northeast Normal University, Changchun, China, 2019. [Google Scholar]
- Li, Y.; Mao, D.; Wang, Z.; Wang, X.; Tan, X.; Jia, M.; Ren, C. Identifying variable changes in wetlands and their anthropogenic threats bordering the Yellow Sea for water bird conservation. Glob. Ecol. Conserv. 2021, 27, e01613. [Google Scholar] [CrossRef]
- Xu, W.; Fan, X.; Ma, J.; Pimm, S.L.; Kong, L.; Zeng, Y.; Li, X.; Xiao, Y.; Zheng, H.; Liu, J.; et al. Hidden Loss of Wetlands in China. Curr. Biol. 2019, 29, 3065–3071.e2. [Google Scholar] [CrossRef]
- Liu, Y.; Liu, X.; Liu, Z. Effects of climate change on paddy expansion and potential adaption strategies for sustainable agriculture development across Northeast China. Appl. Geogr. 2022, 141, 102667. [Google Scholar] [CrossRef]

| Time-Period | Croplands | Forestlands | Grasslands | Wetlands and Water Bodies | Settlements | Other Lands |
|---|---|---|---|---|---|---|
| 1980 | 269.15 | 7671.79 | 25,009.9 | 387.09 | 6.69 | 15,448.44 |
| 1990 | 248.62 | 7602.74 | 24,679.8 | 399.73 | 8.31 | 15,711.05 |
| 2000 | 259.89 | 6502.44 | 26,322.0 | 370.66 | 13.21 | 15,327.42 |
| 2010 | 290.02 | 6499.85 | 26,304.4 | 372.60 | 15.21 | 15,310.08 |
| 2018 | 440.93 | 4922.22 | 27,330.4 | 329.77 | 74.38 | 15,498.44 |
| Time Period | Croplands | Forestlands | Grasslands | Wetlands and Water Bodies | Settlement | Other Lands |
|---|---|---|---|---|---|---|
| 1980 | 5958.1 | 138,974.0 | 88,780.3 | 9869.2 | 341.2 | 1433.5 |
| 1990 | 6016.3 | 138,445.0 | 88,653.3 | 10,041.2 | 481.9 | 1525.9 |
| 2000 | 5971.4 | 138,907.0 | 88,634.5 | 9875.7 | 511.8 | 1458.0 |
| 2010 | 6101.8 | 139,135.0 | 88,281.1 | 9692.0 | 525.1 | 1624.5 |
| 2018 | 7452.6 | 133,914.0 | 67,252.2 | 31,663.0 | 1001.3 | 3942.3 |
| Time Period | Croplands | Forestlands | Grasslands | Wetlands and Water Bodies | Settlement | Other Lands |
|---|---|---|---|---|---|---|
| 1980 | 7398.8 | 60,176.5 | 6393.6 | 5110.5 | 290.7 | 175.9 |
| 1990 | 7575.3 | 60,261.1 | 6158.6 | 5054.2 | 307.0 | 192.9 |
| 2000 | 11,035.1 | 56,155.3 | 6709.1 | 5144.8 | 320.5 | 181.5 |
| 2010 | 11,090.2 | 56,178.2 | 6613.0 | 5151.9 | 333.4 | 181.5 |
| 2018 | 13,497.6 | 54,972.5 | 2782.5 | 7749.7 | 443.7 | 100.8 |
| (a) Altay Mountain | Dryland | Lake | Permanent Glacial Snow | Reservoirs | Channel | ||
| Dryland | 118.37 | 0.96 | / | 2.15 | 1.22 | ||
| Reservoirs | 1.13 | / | / | 10.99 | / | ||
| Lake | / | 15.73 | / | / | 0.76 | ||
| Permanent glacial snow | / | 2.14 | 58.04 | / | / | ||
| Beach | / | / | / | / | / | ||
| Marshes | 0.13 | / | / | 0.33 | / | ||
| (b) Greater Khingan Mountains | Paddy Fields | Dryland | Lake | Beach | Marshes | Reservoirs | Channel |
| Dryland | 0.16 | 2302.57 | / | 6.63 | 300.18 | 0.65 | 8.34 |
| Reservoirs | / | / | 2.00 | / | 13.12 | / | / |
| Channel | / | 2.25 | 7.86 | 5.27 | 93.43 | / | 18.15 |
| Lake | / | 1.64 | 2246.73 | 15.16 | 119.8 | / | / |
| Beach | / | 8.78 | 0.97 | 1.25 | 114.22 | / | 13.89 |
| Marshes | 1.37 | 242.6 | 35.24 | 108.73 | 3815.8 | 8.38 | 50.90 |
| (c) Lesser Khingan Mountains | Paddy Fields | Dryland | Lake | Beach | Marshes | Reservoirs | Channel |
| Dryland | 1.04 | 5630.54 | 6.59 | 0.22 | 580.13 | 34.64 | 2.18 |
| Reservoirs | / | 21.76 | 4.70 | / | 7.28 | 4.09 | / |
| Channel | / | 0.48 | / | / | 2.78 | / | 0.24 |
| Lake | / | 23.11 | 3.17 | / | 3.31 | 30.97 | / |
| Beach | / | 1.30 | / | 1.64 | 0.12 | / | / |
| Marshes | 3.93 | 1885.85 | 0.62 | 4.00 | 1321.73 | 52.44 | 6.20 |
| Study Area | Correlation Coefficient |
|---|---|
| Altay mountains | 0.85 |
| Greater Khingan Mountains | 0.90 * |
| Lesser Khingan Mountains | 0.32 |
Disclaimer/Publisher’s Note: The statements, opinions and data contained in all publications are solely those of the individual author(s) and contributor(s) and not of MDPI and/or the editor(s). MDPI and/or the editor(s) disclaim responsibility for any injury to people or property resulting from any ideas, methods, instructions or products referred to in the content. |
© 2024 by the authors. Licensee MDPI, Basel, Switzerland. This article is an open access article distributed under the terms and conditions of the Creative Commons Attribution (CC BY) license (https://creativecommons.org/licenses/by/4.0/).
Share and Cite
Luo, N.; Yu, R.; Wen, B. Characteristics of Changes in Typical Mountain Wetlands in the Middle and High Latitudes of China over the Past 30 Years. Land 2024, 13, 1124. https://doi.org/10.3390/land13081124
Luo N, Yu R, Wen B. Characteristics of Changes in Typical Mountain Wetlands in the Middle and High Latitudes of China over the Past 30 Years. Land. 2024; 13(8):1124. https://doi.org/10.3390/land13081124
Chicago/Turabian StyleLuo, Nana, Rui Yu, and Bolong Wen. 2024. "Characteristics of Changes in Typical Mountain Wetlands in the Middle and High Latitudes of China over the Past 30 Years" Land 13, no. 8: 1124. https://doi.org/10.3390/land13081124