Abstract
Environmental and design factors determine the stormwater management capacity of green roofs; however, the design and environmental factors that impact their hydrological performance in subtropical humid regions are poorly understood. In particular, meteorological factors have received little attention. Meteorological factors vary greatly at different stages of a rainfall event (e.g., during the rainfall and outflow). Therefore, the impact of meteorological factors at different stages on hydrological performance should be considered separately to obtain a more accurate picture of their effects on hydrological performance. In this study, experimental green roofs were established based on four substrate types and two depths. For the first time, this study systematically explored the effects of design factors for the substrate (type and depth) and multi-stage environmental factors on the hydrological performance of green roofs. Environmental factors, including meteorological factors, from three critical stages (before and during a rainfall event and during the outflow), and rainfall characteristics (e.g., rainfall depth and rainfall duration) were incorporated to determine the variation in hydrological performance. The effects of multi-stage environmental factors on retention and peak reduction were analyzed, with a ranking of each factor’s relative importance. Environmental factors played a leading role in determining hydrological performance. However, the impact of multi-stage environmental factors was not as important as that of rainfall depth and antecedent volumetric water content. Differences in hydrological performance were compared across combinations of design factors. No significant differences were observed across substrate types and depths. However, potential interactive effects might exist, though these were not significant compared to environmental factors (e.g., rainfall depth and rainfall duration). These results confirmed that the meteorological factors in the different event-related stages significantly impacted the hydrological performance. Quantifying the effects of design and environmental factors is critical for hydrological performance evaluation. The results provided a broader perspective on understanding influence mechanisms of hydrological performance and highlighted the impact of microclimates on hydrological performance.
1. Introduction
Increases in urbanization [1] and urban population growth have exerted great pressure on traditional urban stormwater management practices [2]. The impacts of climate change may lead to more frequent urban flooding in densely urbanized areas [3,4]. As an effective stormwater management practice, green roofs hold significant potential for serving as critical hydrological green infrastructure in these urban areas, given their ability to efficiently utilize traditional rooftops that account for up to 50% of impervious surface areas [5,6,7]. Green roofs contribute to stormwater management by notably enhancing stormwater retention [8,9,10], mitigating peak flow [11,12,13], and providing source controls [14]. Additionally, green roofs offer a variety of environmental (e.g., thermal benefits [15], carbon sequestration [16,17], and serving as wildlife habitats [18,19]), social (e.g., psychological benefits [20] and wellbeing restoration [21]), and economic benefits (e.g., increase in property value [22] and energy conservation [23]). Green roofs have therefore become widely adopted for the aforementioned benefits in cities worldwide, and several studies have investigated the optimization of their hydrological performance and the mechanisms that control their performance, in an attempt to better understand their potential as stormwater management tools.
Extensive green roofs, with a substrate thickness of <20 cm [24,25], have been widely applied and studied in terms of their hydrological performance due to their lightweight and low-maintenance properties and their cost-effectiveness in application [26,27,28,29,30]. The hydrological performance of green roofs has mainly been assessed through the metrics of retention and detention. Retention refers to the ability of a green roof to capture rainwater during a rainfall event [31]. Detention is the ability to detain rainwater, thereby reducing or delaying peak flow, which is manifested as attenuation or peak reduction [32]. While retention and detention are both important in stormwater management, most previous studies have focused on retention, with relatively less research on detention [33].
The hydrological performance of a green roof is subject to numerous factors that can be categorized into two main groups: environmental and design factors [34]. Environmental factors encompass rainfall characteristics and various other meteorological factors (e.g., relative humidity, temperature, and solar radiation), while design factors are related to the methods and materials used to construct green roofs.
Understanding how environmental factors impact green roofs is important for guiding and optimizing their design and placement in urban climates. In many studies conducted across different regions, environmental factors, especially rainfall characteristics, have been extensively investigated (Table 1). Rainfall characteristics, (e.g., rainfall depth (RD), mean intensity of the event (imean), and duration) have been shown to have a significant impact on hydrological performance [35,36,37,38,39]. Previous researchers have come to different conclusions on how antecedent moisture conditions (AMC) affect the hydrological performance of green roofs [11,14,40,41]. The antecedent dry weather period (ADWP) is a surrogate indicator of AMC. However, [14] suggested that there are limitations to the use of the ADWP as an indicator for antecedent climate conditions. The antecedent volumetric water content (AVWC) is a more intuitive indicator of soil moisture. The antecedent dry weather period (ADWP) and antecedent volumetric water content have also been proven to significantly impact hydrological performance [35,42,43,44].
Only a few studies have directly examined the impact of meteorological factors on hydrological performance, and the consideration of meteorological factors in these studies was limited to the antecedent stage of the event, as shown in Table 1. This may be why in some studies the regression models could not explain more variance [9,45]. Meteorological factors continuously affect green roofs from before the rainfall event to the end of the runoff period. Therefore, meteorological factors from antecedent stages might be insufficient to explain the overall hydrological performance. The consideration of meteorological factors from different rainfall event-related stages may therefore better explain the hydrological performance of green roofs.

Table 1.
Summary of past research on the factors affecting the hydrological performance of green roofs.
Table 1.
Summary of past research on the factors affecting the hydrological performance of green roofs.
| Reference | Location | Climatic Feature | Retention | Peak Reduction | RD | Duration | imax | imean | Depth | Type | Season | ADWP | AVWC | RH24 | SR24 |
|---|---|---|---|---|---|---|---|---|---|---|---|---|---|---|---|
| [46] | Athens, USA | Subtropical | ○ | × | 1 | ||||||||||
| [47] | Sheffield, UK | Temperate | ○ | ○ | 1 | 1 | 1 | 1 | |||||||
| [31] | Michigan, USA | Temperate | × | ○ | 1 | ||||||||||
| [14] | Sheffield, UK | Temperate | ○ | ○ | 1 | 1 | 1 | 1 | |||||||
| [8] | Auckland, New Zealand | Subtropical | ○ | ○ | 1 | 0 | 0 | ||||||||
| [35] | Adelaide, Australia | Hot Mediterranean | ○ | × | 1 | 1 | 1 | 1 | |||||||
| [36] | Central Texas, USA | Subtropical | ○ | × | 1 | 1 | 1 | ||||||||
| [48] | New York, USA | Humid Continental | ○ | ○ | 1 | 1 | 0 | 0 | |||||||
| [9] | Leeds, UK | Temperate | ○ | × | 1 | 1 | 1 | 1 | 0 | ||||||
| [43] | Hong Kong, China | Humid Subtropical | ○ | × | 1 | 1 | 1 | 0 | 1 | ||||||
| [37] | Chongqing, China | Humid Subtropical | ○ | × | 1 | 1 | |||||||||
| [38] | Lisbon, Portugal | Mediterranean | ○ | × | 1 | 1 | |||||||||
| [49] | Gansu, China | Semi-arid | ○ | × | 1 | 1 | 0 | 1 | |||||||
| [50] | Melbourne, Australia | Temperate | ○ | × | 0 | ||||||||||
| [13] | London, UK | Moderate | × | ○ | 0 | 1 | |||||||||
| [51] | Salerno, Italy | Mediterranean | ○ | × | 1 | 1 | 1 | ||||||||
| [52] | Rio Grande do Sul, Brazil | Humid Subtropical | ○ | × | 1 | 0/1 | 1 | ||||||||
| [53] | Rio Grande do Sul, Brazil | Humid Subtropical | ○ | × | 1 | 0 | 1 | 0 | |||||||
| [34] | Chongqing, China | Humid Subtropical | ○ | ○ | 1 | 0 | 0 | 1 | 1 | 1 | 1/0 | 0 |
Note: “○” and “×” indicate whether retention or peak reduction were the metrics used to define hydrological performance. Specifically, “○” denotes that the factor was considered, while “×” signifies that the factor was not considered; “1” indicates that the factor had a significant impact, while “0” means the impact was insignificant. The slash-separated 0 and 1 (“0/1” or “1/0”), respectively, indicate the significance of this factor’s impact on retention and peak reduction. An empty space indicates that this study did not consider the factor. Abbreviations: rainfall depth (RD), rainfall duration (duration), mean intensity of the event (imean), maximum of the intensity of the event (imax), depth (substrate depth), type (substrate type), antecedent dry weather period (ADWP), antecedent volumetric water content (AVWC), mean relative humidity during the 24 h preceding the event (RH24), mean solar radiation during the 24 h preceding the event (SR24).
There are many design factors to consider in the construction of green roofs, including the substrate, vegetation, slope, drainage layer, and area. The substrate has received much attention because it can affect the hydrological performance, vegetation survival, and structural loads of green roofs [49,54,55]. The substrate types and depths primarily determine these substrate properties. Therefore, optimal combinations of substrate types and depths are crucial for enhancing the hydrological performance of green roofs. However, the hydrological performance of various combinations from different studies often lacks consistency [49,56]. The primary reasons may be the variations in climate and materials. Consequently, region-specific green roof design and product development are essential to mitigate the local incompatibilities of generic products. Due to the increase in maintenance, design, and construction costs, together with the lack of incentives for developers, the implementation of green roofs in China is still in the initial stage compared to some European countries, the USA, and Canada [57,58]. Most Chinese cities lack green roof designs and products tailored to their regional climate, even in some metropolises, such as Chongqing in southwestern China, which has a humid subtropical climate. Therefore, based on a previous study [34], exploring the regional hydrological performance across a range of design factors can help to develop products and improve green roof design for specific climates.
Some studies have suggested that a single factor alone cannot adequately explain hydrological performance [14]. Exploring the effects of numerous factors can enhance the understanding of mechanisms controlling the hydrological performance of green roofs. Even among multiple factors, complex interactions may exist with strong correlations between different factors, and certain factors may only be influential within specific ranges [14,34]. Although the study by [34] has preliminarily investigated the effects of design and environmental factors on hydrological performance, it confined its scope of environmental factors to the antecedent stage of the event and omitted the substrate depth, which could be more instructive for cost control and building load. When evaluating hydrological performance, the consideration of design factors and multi-stage environmental factors can provide practical insights on extensive green roof design and give information to make valuable decisions on urban green roof layouts in the humid subtropical region.
In this study, a one-year field experiment was conducted to determine the effects of design and multi-stage (before and during a rainfall event and during the outflow) environmental factors on the hydrological performance (retention and peak reduction) of green roofs. Linear mixed models were used to evaluate the effects of environmental factors and design factors on hydrological performance, with season and module number included as random factors to capture their unobserved variability. The aims of this study were as follows.
(1) Various environmental factors, including meteorological factors from three stages (before and during a rainfall event and during the outflow) and rainfall factors (e.g., rainfall depth and rainfall duration) were considered to explain the hydrological performance of green roofs. For the first time, meteorological factors (i.e., air relative humidity, temperature, solar radiation, and atmosphere pressure) of different event-related stages were considered together. The relative importance of significant factors was ranked to determine their effects on the hydrological performance of green roofs.
(2) The optimal combinations of substrate types and depths among the design factors for green roofs were identified.
2. Data and Methods
2.1. Site Description
This study was conducted in an experimental area of Southwest University, Chongqing (29°48′51.25″ N, 106°24′47.83″ E). According to the Köppen–Geiger climate classification, the local climate is humid subtropical (Cfa). The average annual temperature is 19.0 °C, with hot, humid summers where highs often exceed 40 °C and mild, damp winters where lows remain above 0 °C. The average annual rainfall is 1156.8 mm, with the majority falling from May to September, and the average relative humidity is 80%. The experimental green roofs were installed on an open platform that was well exposed to outdoor weather conditions (Figure 1a,b).
2.2. Experimental Setup
Square green roof modules were constructed using a custom-made, 2 mm thick stainless steel platform, measuring 120 cm in length × 120 cm in width × 35 cm in height. Each module was equipped with a typical extensive green roof system [34,43,59], consisting of five layers, which include a vegetation layer, a 20 cm substrate layer, a 0.1 cm geotextile fabric filter layer, and a 2.5 cm porous plastic drainage layer from top to bottom (Figure 2a). A single drainage hose was centrally installed at the bottom of each module to conduct the outflow to the drainage unit (Figure 1c,f and Figure 2a).
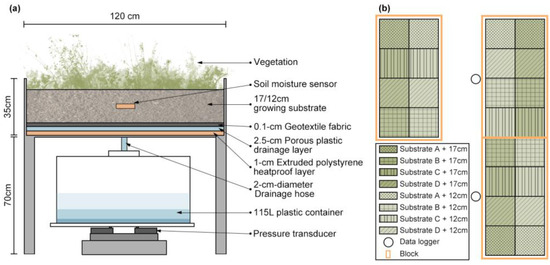
Figure 2.
(a) Profile of a green roof module, (b) Module layout following a strip-plot design.
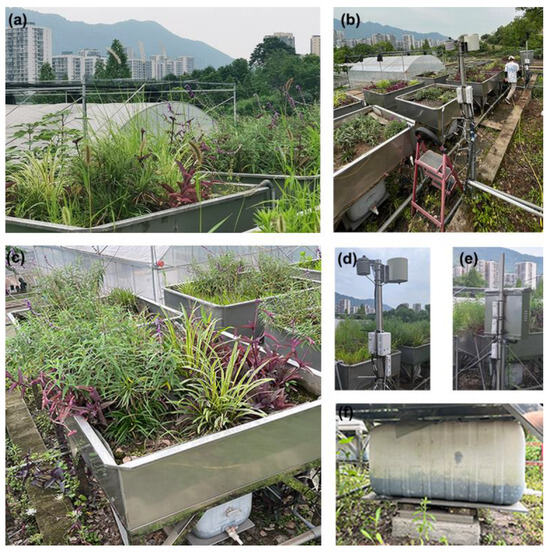
Figure 1.
(a) Green roof modules situated on an open platform. (b) An overview of the module arrays immediately following the initial planting phase. (c) A single green roof module. (d) Meteorological instruments positioned alongside the green roof modules. (e) Data logger positioned next to the green roof modules. (f) A runoff collection container beneath a module.

The green roof modules followed a strip-plot design [60,61] with two primary factors (substrate types and substrate depths). Four types of substrates (A, B, C, and D) were engineered, with two depths of 12 and 17 cm for each type. There were three replicates for each treatment, resulting in a total of 24 modules (Figure 2b). Each treatment was considered a block, designed to identify the impact of the surrounding environment.
Mixed forb species were selected for all the modules used in this study based on their availability and tolerance to the harsh environment of our previous study [34]. The mixed forb species formed a more stable community compared to the grass species, exhibiting high coverage even in the absence of irrigation. Moreover, there was no significant difference in hydrological performance between forb and grass species [34]. Therefore, in this study, the same mixed forb was used in each module. Each module was planted with 18 individuals of 6 forb species (3 for each species) according to a completely random design. The species were Liriope muscari, Salvia leucantha, Ruellia simplex, Tradescantia pallida, Dianthus plumarius, and Lycoris chinensis. To avoid any edge effects, a 15 cm unplanted border was included within each module. On 6 May 2022, all modules were planted with grown plants purchased from a local nursery. Vegetation coverage in each module had reached a stable state (coverage > 70%) before data collection on 1 June 2022.
The raw materials for each substrate type were selected from the following materials: 3–8 mm expanded shale, 1–3 mm vermiculite, 3–6 mm perlite, 1–2 mm zeolite, sandy loam, and compost. Expanded shale and perlite can help in the retention capacity [62] and reduce structural load due to their lightweight properties [30]. Fine materials, such as 1–3 mm vermiculite, 1–3 mm zeolite, and sandy loam, were utilized for plant support and water retention. The compost consisted of 12.5% peat soil, 6.25% matured animal waste, and 1.25% pine bark. All green roofs received basic nutritional maintenance from compost, which had a fixed volume proportion of 20% across all substrate types and gradually releases nutrients. All the materials described above were locally available. The composition of the four substrates (A, B, C, and D) used in the experiment is presented in Table 2. The particle size distribution of each type of substrate conformed to the requirements of the German Landscape Research, Development and Construction Society (FLL) guidelines (FLL, 2018). These four types of substrate could effectively support the selected plant species and were shown to have promising hydrological performance in previous studies [34]. Samples of all the substrates were analyzed in a laboratory to determine their physical properties according to the Chinese National Standards (CNS) LY/T 1215-1999 [63]. The results are shown in Table 3.
Table 2.
Composition of the growing substrates used in the experiment.
Table 3.
Physical properties of the initial substrates used in the experiment.
2.3. Data Collection
The green roof modules were monitored from 1 June 2022, to 31 May 2023. Meteorological data, including relative humidity, barometric pressure, air temperature, and solar radiation were measured by a pyranometer (METER Group, Pullman, WA, USA) and a weather sensor (METER Group, ATMOS 14). A high-resolution (0.2 mm) rain gauge (METER Group, ECRN-100) was used to collect precipitation data. It should be noted that wind speed was not considered because Chongqing is located in the Sichuan Basin that experiences extremely low wind speeds [64,65]. All instruments were located next to the module array and placed at a consistent height as the array to share the same roof microclimate conditions (Figure 1a,d,e).
In addition to the ADWP (unit: h), the volumetric water content (VWC) (cm3/cm3) was measured using moisture sensors to quantify the AMC of the substrate. Due to instrument availability issues, two different METER moisture sensors (ECH2O EC-5 or 5TM) were used in this study for VWC monitoring, with both having exactly the same measurement principle and accuracy. The sensor was inserted horizontally into the mid-depth of the substrate in the geometric center of each module. According to the METER soil sensor calibration method (METER Group, 2023), each sensor was substrate-specifically calibrated before the experiment, and the raw data were transformed into actual data with an accuracy within 1–2%.
Data loggers (METER Group, EM50 and EM60, Figure 1d) were used to record meteorological data (including precipitation) at 1 min intervals. The antecedent volumetric water content (AVWC) was determined as the VWC at the last minute before each event.
The runoff outflow fed through a single hose to each module was collected in a 115 L capacity plastic container placed directly underneath the module. A fixed square base was fitted under the container to stabilize it, and four pressure transducer weighing load cells (Daysensor, DYX-301, Bengbu, China) were symmetrically installed under the base to continuously record the weights of the container. Pressure transducers were field-calibrated to measure the weights of containers. A data logger (Campbell Scientific, CR1000x, Logan, UT, USA, Figure 1e) next to the module arrays was used to store the readings at 30 s intervals, which were averaged into 1 min readings.
According to the definition generally adopted in previous studies, an independent event is separated from other events by continuous dry periods of at least 6 h [14,66]. If a rainfall event occurred before the termination of outflow from the previous event, these two events were merged into a single event [8,11]. The outflow period was the duration of the period from the inception to the termination of the pressure transducer data increment. Rainfall events were categorized into three levels based on the cumulative rainfall depth: small (<10 mm), medium (10–50 mm), and large (>50 mm). The modified levels are based on the rainfall classification of the China Meteorological Administration (CMA), in which the original threshold of a large event is 25 mm. This modification helped to reduce the quantity differences between rainfall types and enabled an effective comparison with our previous study [34].
2.4. Definition of Variables
The hydrological performance of green roofs was characterized by event-based retention and peak reduction in green roofs. Retention refers to the cumulative retention derived from a comparison between rainfall and outflow:
where Rr is cumulative rainfall (mm) and Rd is cumulative outflow (mm).
R(%) = (Rr − Rd)/Rr
Peak reduction is defined as a percentage peak flow reduction:
where Pr is peak 1 min rainfall intensity (mm/min), and Pd is peak 1 min drainage intensity (mm/min).
PR(%) = (Pr − Pd)/Pr
In this study, the environmental variables included rainfall characteristics (e.g., rainfall depth, and rainfall duration) and various averaged meteorological variables (i.e., air relative humidity, air temperature, atmosphere pressure, and solar radiation). The rainfall characteristics include rainfall depth, mean intensity, maximum intensity, and duration. For meteorological variables, although more precise divisions of event-related stages (e.g., isolating the overlapping part of event duration and outflow) were considered, due to the strong correlations observed among the data from continuous stages of an event, only the three representative stages were used in the analysis: (1) antecedent stages of the events (i.e., the 24 h period before an event), (2) duration of the events, and (3) duration of the outflows. Antecedent meteorological variables were calculated by averaging the 24 h meteorological data before each rainfall event. A period of <24 h would lead to an inequality of diurnal and nocturnal duration [43]. The durations of events and outflows were considered to be separate and independent stages, even when they overlapped in some events. Based on data availability, four types of average meteorological data were calculated for each stage (Table 4).
Table 4.
Descriptive statistics of all variables.
Both the ADWP and AVWC were used to quantify the antecedent meteorological conditions. The design variables included substrate type (4 types), substrate depth (2 depths), and their eight combinations (i.e., roof groups) formed by pairing each substrate type with each depth (Figure 2b). Seasons were also considered due to the seasonal variations in meteorological conditions and vegetation dynamics. All the green roof modules were numbered to identify individual differences. The descriptive statistics of the variables are presented in Table 4.
2.5. Statistical Analysis
All statistical analyses were performed based on event-based retention and peak reduction using R version 4.2.3 [67]. Events with no or very little outflow (retention > 99.9%) were removed from the dataset. To improve the fitting performance and parameter estimation accuracy of the LMMs, the retention and peak reduction data were logistically transformed to essentially conform to a normal distribution. All continuous variables were normalized prior to analyses for interpretability.
Least absolute shrinkage and selection operator (LASSO) regression models were fitted to identify pertinent factors and exclude irrelevant factors for retention and peak reduction. The LASSO is an attractive technique for performing dimension reduction and factor selection, and it provides parsimonious solutions and copes with multicollinearity [68,69]. This method implements a penalty term to the model estimation, which can severely penalize unnecessary or correlated variables by forcing their regression coefficients to zero and retaining only the important ones, achieving variable selection [70]. The LASSO regression models were fitted using the glmnet package in R [71], with a 10-fold cross-validation to facilitate better selection of the optimal λ values that were then used to determine the optimal models. The factors in the models with non-zero coefficients were selected as relevant factors affecting both retention and peak reduction. The selected factors were applied for further collinearity tests that were conducted using the car package [72], and factors with a variance inflation factor (VIF) of >2 were excluded. Finally, the remaining factors were applied to linear mixed models.
Linear mixed models (LMMs) were used to examine the effects of selected factors on retention and peak reduction using the lme4 package of R [73]. For each model, seasons and modules nested within groups were treated as random factors, while the remaining selected factors were treated as fixed factors. The primary purpose of setting random variables is to capture the variability in the data caused by certain unobservable or unmeasurable factors. In the model, the nested structure of modules within groups estimates nested random effects, accounting for random variation in intercept (the baseline of retention or peak reduction in the model) among modules within roof groups [74]. Furthermore, a random effect associated with each season was integrated to capture the potential influences different seasons might have on retention and peak reduction baselines. According to the corrected Akaike’s information criterion (AICc), model fits were ranked to select the most parsimonious ones (ΔAICc < 2) [75]. Subsequently, these selected models underwent model averaging based on AICc weights. The process above was performed using the MuMIn package [76]. The relative importance of each factor was calculated based on the averaged model, with its parameter estimate expressed as a percentage of the total parameter estimates [77]. The marginal R2 (R2m) and conditional R2 (R2c) values were determined according to [78]. The marginal R2 represents the variance explained by the fixed factors, while the conditional R2 represents the variance explained by the fixed and random factors together. Based on the best models, substrate type, depth, and their interaction were included as fixed factors to clarify their impact on retention and peak reduction.
Kruskal–Wallis tests were conducted to determine the differences between each level of substrate types, substrate depths, and roof groups for retention and peak reduction. Dunn tests were then applied for post hoc multiple comparisons to cope with ties (i.e., the same values in rank-based tests). Bonferroni corrections were performed to obtain more accurate p-values. These procedures were conducted using the FSA package of R [79].
3. Results
3.1. Overall Hydrological Performance of Green Roofs
A total of 89 rainfall events were recorded from 2 June 2022, to 7 June 2023. Due to unexpected equipment failures, outflow data were missing between November 17 and 29 December 2022. After excluding the events during that period, there were 75 valid rainfall events, ranging from 0.2 mm (the lower limit of rainfall gauge accuracy) to 80.8 mm. Small events accounted for 80% of these valid events. Outflow occurred in 40 rainfall events. The descriptive statistics of valid events are shown in Table 5.
Table 5.
Descriptive statistics of valid events.
On average, valid events had a retention of 67.53% and a peak reduction of 87.34%. However, retention and peak reduction varied across different rainfall types. Green roofs exhibited high hydrological performance under small events, with an average of 94.30% retention and a 99.03% peak reduction. Although the hydrological performance under large events was less than half of that for small events (Table 6), these results indicated that green roofs exhibited promising hydrological performance during the experimental period in humid subtropics since small and medium events accounted for 94.7% of the total number of events (Table 5).
Table 6.
Retention and peak reduction in eight roof groups.
3.2. Hydrological Performance across Design Factors
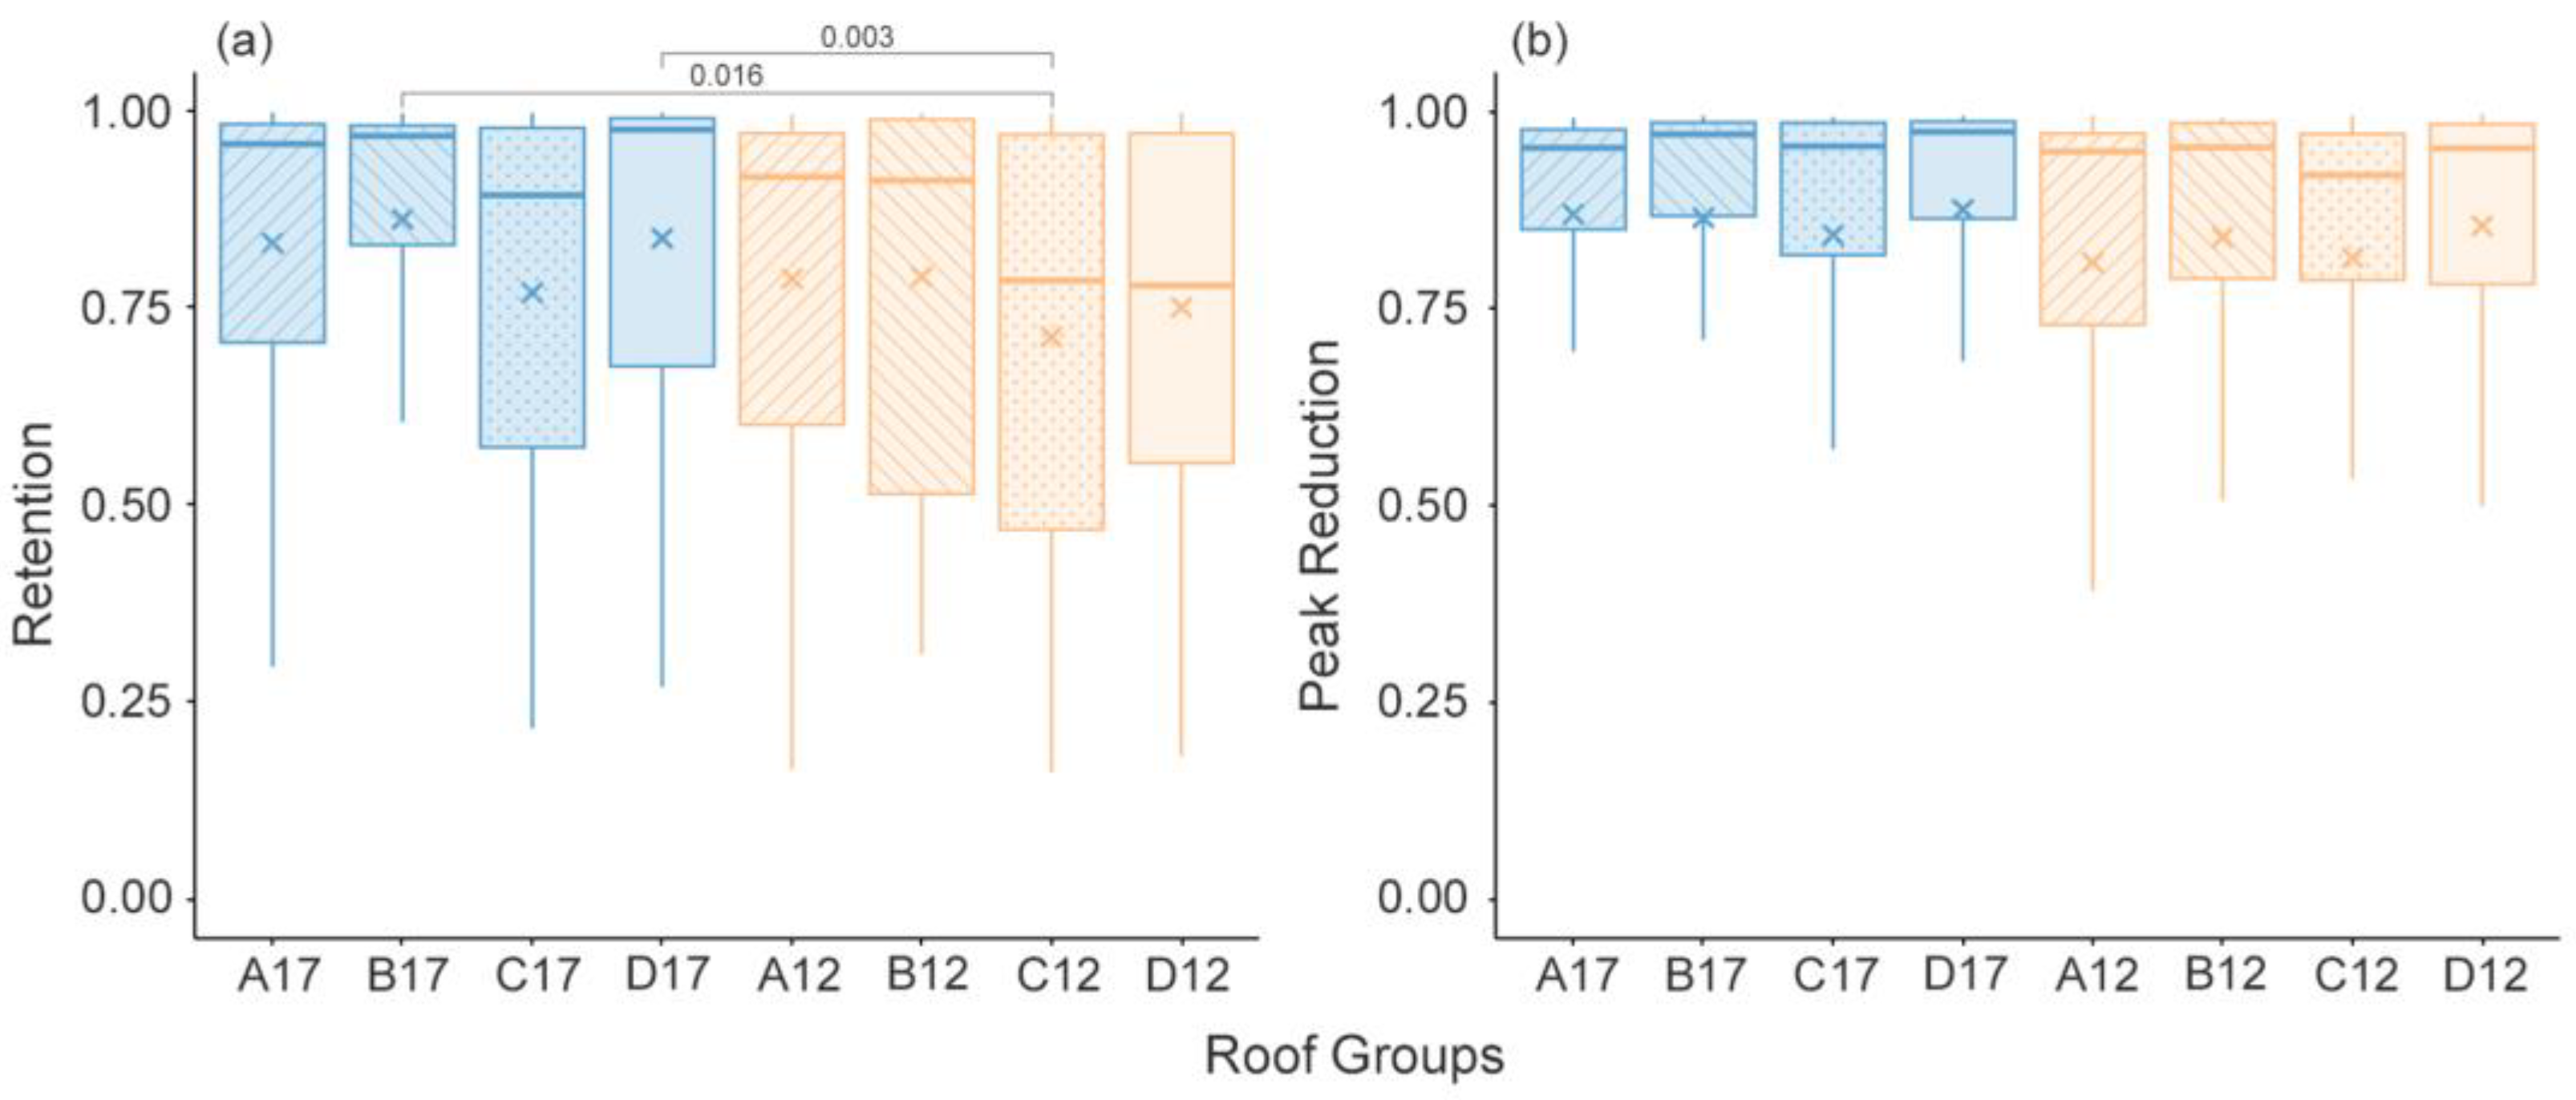
The hydrological performance of all the roof groups can be found in Table 6. The hydrological performance among most roof groups was similar, regardless of the rainfall depths. Group B17 (substrate B with 17 cm depth) exhibited the highest retention across all rainfall events, and it was 13.46% higher than the worst-performing group, which was Group C12 (substrate C with 12 cm depth). The results of the Kruskal–Wallis tests shown in Figure 3 also revealed a similar trend. For the eight groups of green roofs with different combinations of substrate types and substrate depths, the only significant difference in their hydrological performance was observed for retention (χ2 = 26.828, p < 0.001; Figure 3a). Only groups B17 and D17 (substrate C with 17 cm depth) were significantly higher than group C12 (p < 0.05), while there were no significant differences among the other groups. Additionally, there were no significant differences in peak reduction among the groups, substrate types, or depths (χ2 = 14.02, p = 0.0508; Figure 3b).
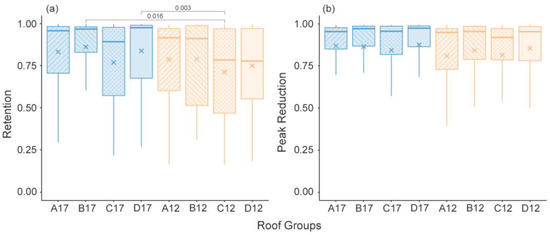
Figure 3.
Differences in (a) retention and (b) peak reduction among the roof groups. The numbers between the groups represent the p-values from pairwise comparisons. The “×” denotes the mean value of retention or peak reduction. A, B, C, and D represent substrate types, while 12 and 17 indicate the substrate depth (cm). For example, A17 refers to substrate A with a depth of 17 cm.
3.3. The LMMs for Retention and Peak Reduction
After the LASSO regressions and collinearity tests, eight environmental factors were included in the model for retention, and seven were included for peak reduction (Table 4, Table 7). With the most parsimonious models, 64.8~66.9% of the variance (R2c) was explained for retention, while fixed factors accounted for more than 53.7% of the variance. For peak reduction, 65.0~66.9% of the variance (R2c) was explained (Table 7), while fixed factors accounted for >55.4% of the variance. For both retention and peak reduction, most of the explained variance was related to fixed factors, indicating that environmental factors were more important for explaining hydrological performance. Additionally, as shown in Figure 4, the rainfall characteristics were often the dominant environmental factor.
Table 7.
The model pool of the most parsimonious LMMs (ΔAICc < 2) and best models (ΔAICc = 0) with design factors.

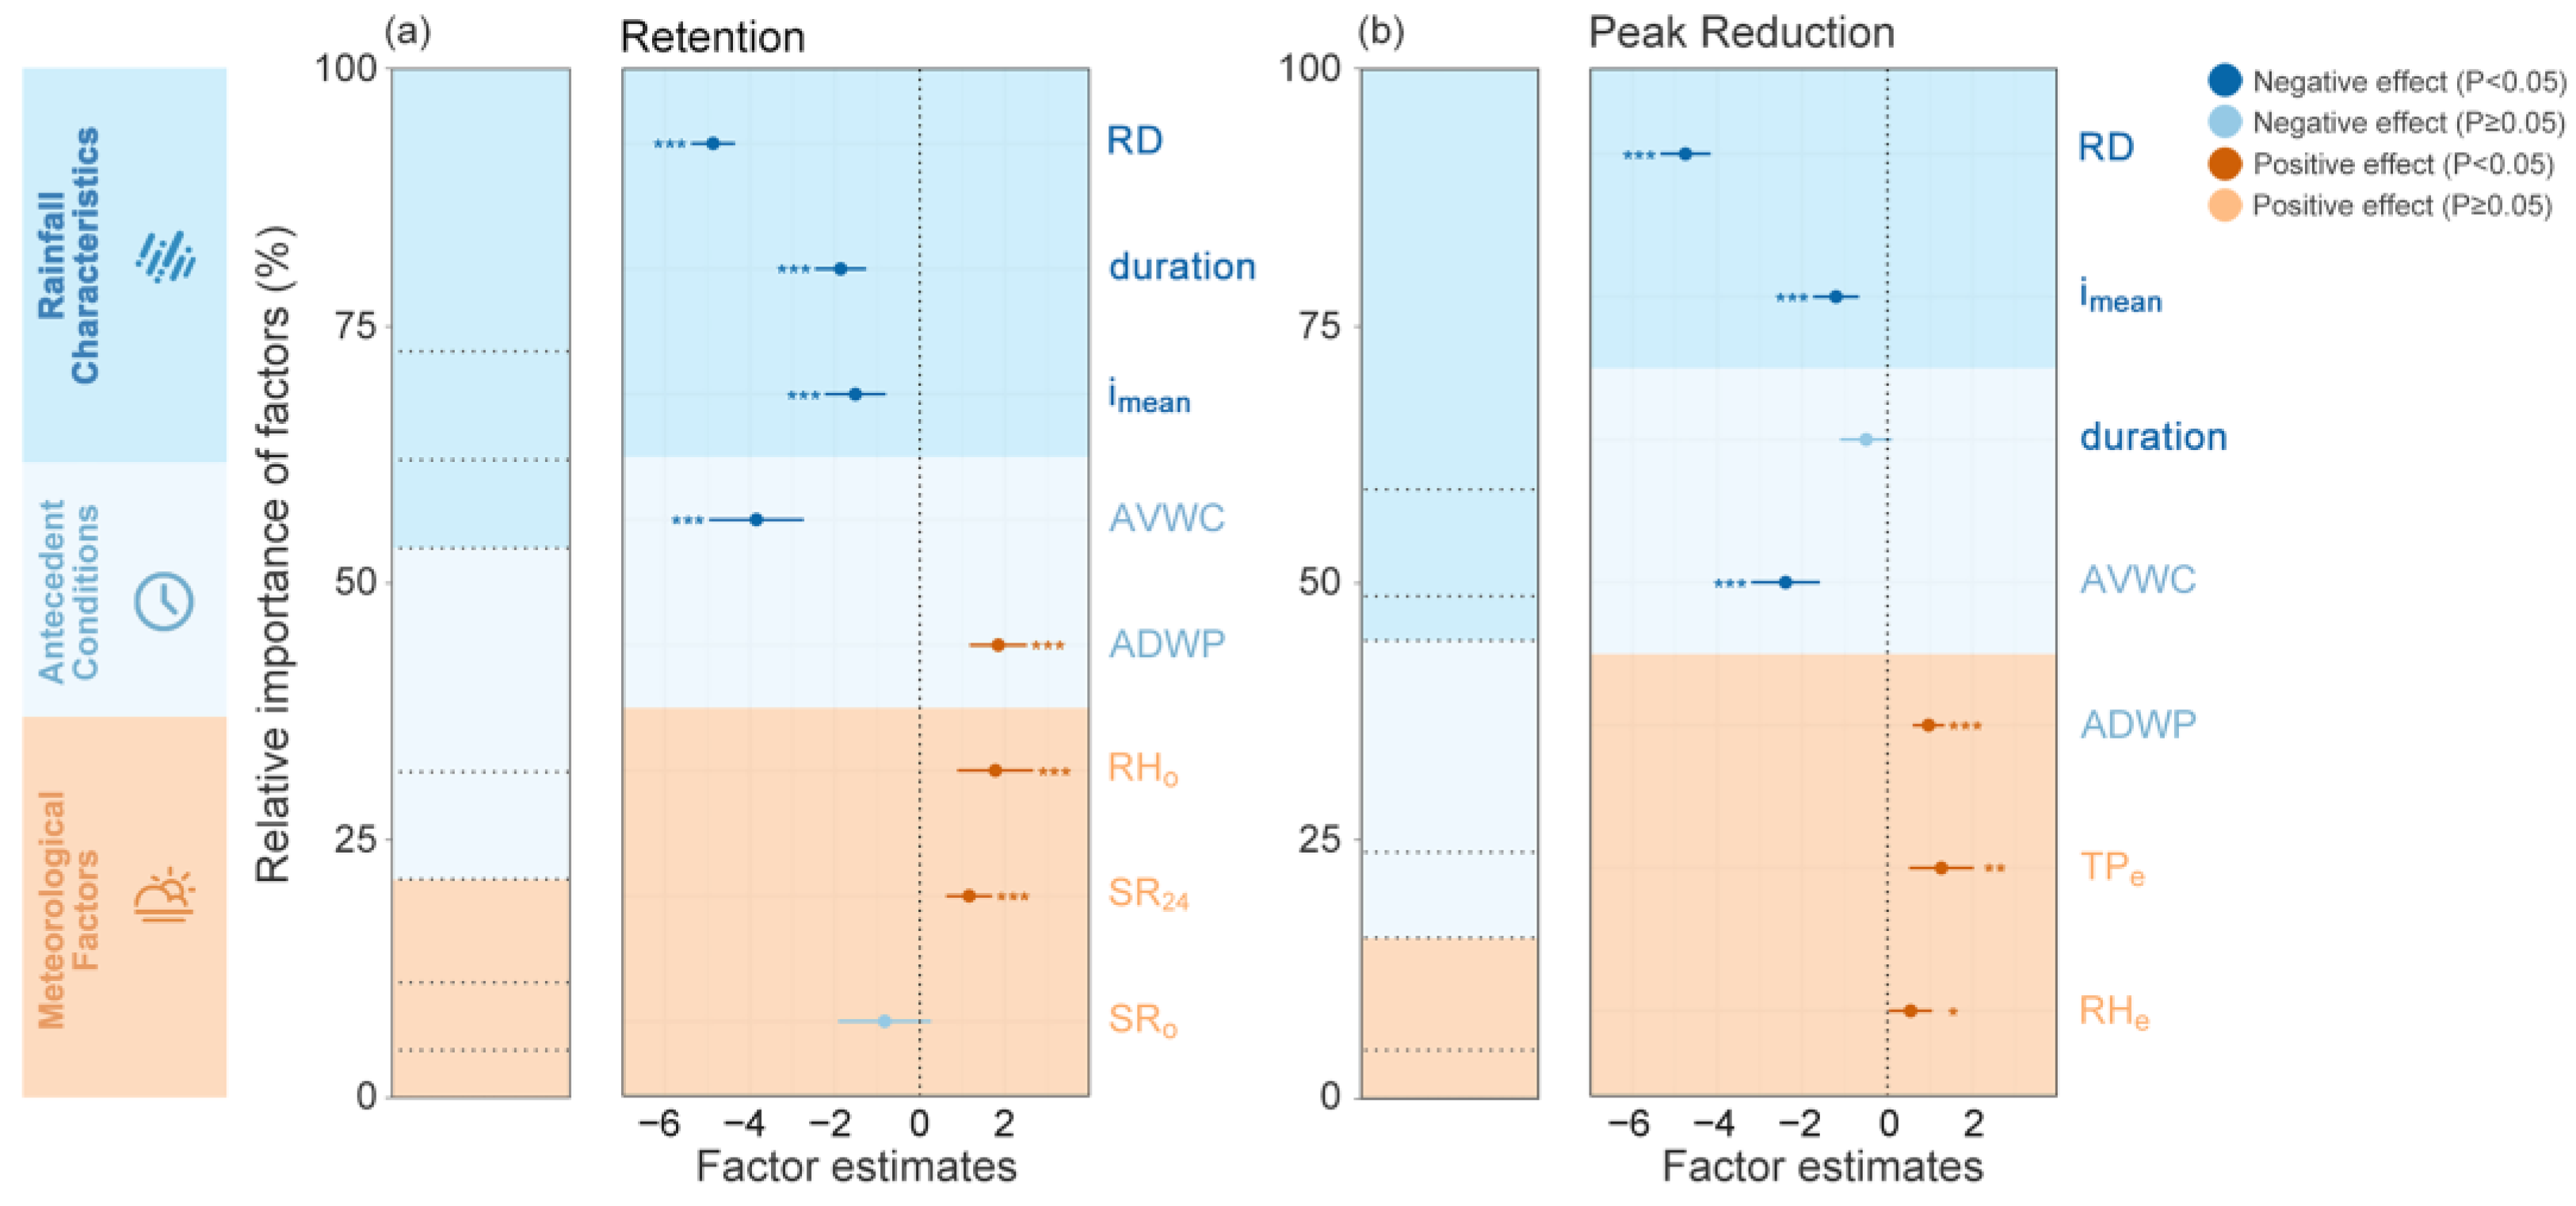
Figure 4.
Relative importance of the different factors and the effects of environmental factors (including rainfall characteristics, antecedent conditions, and meteorological factors) on (a) retention and (b) peak reduction based on the averaged models. The averaged models were calculated from the most parsimonious models (ΔAICc < 2; Table 7) after model selection, shown with the 95% confidence intervals of each factor. For each factor, p-values for the model were given as *** p < 0.001, ** p < 0.01, and * p < 0.05. See Table 4 for abbreviations.
The impact of continuous factors (variables) was determined by comparing the absolute values of their estimates in the model. Factors with larger absolute values (e.g., rainfall depth, and AVWC) were considered to have a stronger impact on the retention of green roofs. According to the averaged model calculated from the most parsimonious LMMs (Figure 4, Table 7), rainfall depth (RD) was the most critical factor for retention and had a significant negative impact (p < 0.001, Figure 4a). In addition, mean intensity (imean), AVWC, and duration had significant negative impacts on retention, while ADWP, mean relative humidity during the outflow (RHo), and mean solar radiation during the 24 h preceding the event (SR24) positively impacted retention (p < 0.001). Mean solar radiation during the outflow (SRo) had a negative effect on retention, but it was not statistically significant (p > 0.05). The ranking was as follows: RD > AVWC > duration > ADWP > RHo > imean > SR24 > SRo (Figure 4a).
As shown in Figure 4b, rainfall depth, AVWC, and mean intensity had significant negative impacts on peak reduction (p < 0.001, Figure 4b). The ADWP, mean air temperature during the event (TPe), and mean relative humidity during the event (RHe) had a significant positive effect on retention (p < 0.05). Based on the absolute values of factors, the ranking was RD > AVWC > TPe > imean > ADWP > RHe > duration (Figure 4b).
After adding the substrate types, depths, and their interaction into the best models, it was found that none of them had significant impacts on the hydrological performance of the green roofs, and the R2m changes were minimal (no less than 0.013, Table 7). This indicates that their influence was slight compared to environmental factors.
4. Discussion
4.1. Overall Hydrological Performance
Although various factors among different green roofs make direct comparisons challenging, a retention of 66.88% and peak reduction of 85.71% (accumulative averaged data like in some other studies, not event-based averaged data) were consistent with other studies conducted in the subtropical climates. For example, in areas with similar climates, such as Auckland (New Zealand), Central Texas (USA), Chongqing (China), Rio Grande do Sul (Brazil), and Hong Kong (China), the mean retention of green roofs ranged from 66% to 77.7% with the substrate depths in these regions ranging from 70 mm to 150 mm [8,11,36,37,52,80].
It was unusual that the cumulative retention was over 25% higher than that in our previous study, which employed the same substrate types but with a uniform depth of 20 cm (40%, [34]). This could have been related to rainfall characteristics and antecedent conditions. As the results indicate, these factors exerted significant impacts on retention, particularly rainfall depth, and AVWC (Figure 4). Due to the similarity in the experimental setups of this study and our previous studies [34], as well as the use of the same experimental platform, the results of the experiments are comparable. Therefore, we compared the data from this study with that from our previous studies. Compared to this study (with an average rainfall depth of 8.49 mm, ADWP of 104.5 h, and AVWC of 0.197 cm3/cm3), our previous study obtained a higher average rainfall depth, shorter ADWP, and higher AVWC [34]. Therefore, it can be inferred that variations in rainfall characteristics and antecedent conditions contributed to the retention differences.
These comparisons indicated that even within the same climatic zone, rainfall patterns of different years could result in large variations in the retention of green roofs, which is consistent with previous studies [9]. This difference in rainfall patterns emphasizes the importance of long-term monitoring, which ensured the completeness of event sampling and was crucial for evaluating the hydrological performance of green roofs. Overall, green roofs remained highly effective in retaining small rainfall events, but their retention significantly decreased during larger events. This result was consistent with those of most previous studies, thus reaffirming the limited stormwater management capability of green roofs under subtropical climates.
4.2. Hydrological Performance across Design Factors
In our experiment, eight roof groups were established through a combination of four substrate types and two substrate depths. Significant differences in retention were only observed among a few groups. When keeping the substrate depths or types constant, there was no significant difference in hydrological performance among different substrate types or depths (Figure 3). Similar results have been reported in past experiments [8,52,81]. These results suggest a potential “additive” effect between substrate types and depths, leading to an increased difference in retention among the groups. This effect was assumed to be an interaction effect in LMMs, but the interaction was not found to be significant (Table 7). The retention for group B17 and D17 were significantly higher than that of group C12 (Figure 3). This might be attributed to groups B17 and D17 having a higher capillary storage than C12 (Table 3). For the majority of small and medium events, capillary storage was the primary mechanism for retention [13]. The differences in substrate properties arose from their differing compositions. The expanded shale in substrate C (Z25:ES30:V25:C20) was lightweight but had a lower capacity for retaining water (ASTM, 2014), while in substrates B (P25: SL30:V25:C20) and D (Z25: SL30:V25:C20), the predominantly sand-based sandy loam was heavier but had the better ability to retain water.
Furthermore, for roof groups containing substrate A (P25:ES30:V25:C20), there was no significant difference in retention compared to the other groups. This inconsistency may be due to differences in ADWP between the two monitoring periods reported in Section 4.1. Groups with substrate A have a rapid hydrological cycle capability [34], which was attributed to the perlite in its composition that could dry quickly to restore its retention capacity [82]. In this study, the ADWP (76.5 h in average, min–max: 5.3–384.5 h, Table 4) seems to allow all substrate types to achieve sufficient dryness, resulting in similar retention. Furthermore, no significant difference in peak reduction was observed among all the roof groups. This could be attributed to the fact that every roof group effectively attenuated the peak flows, as indicated by their high peak reduction in Table 6.
Although groups B17 and D17 performed better than the others, it would be worth considering lower-depth (12 cm) roof groups for green roof construction because they can support healthy vegetation growth while being cost-effective and structurally sound. The groups with substrate A (P25:ES30:V25:C20), which possessed the lightest volumetric density (Table 3), also had a similar performance to substrate B (P25:SL30:V25:C20) and D (Z25: SL30:V25:C20). However, substrate C (Z25:ES30:V25:C20) is not recommended due to its poorest averaged hydrological performance (Figure 3), which aligns with the results of the previous study [34].
Several previous studies have highlighted the significant impact of design factors on hydrological performance [48,49,81]. However, these results do not necessarily indicate the importance of substrate types and depths in explaining the hydrological performance, especially in comparison with environmental factors [34]. Furthermore, while there might be an interaction effect for substrate types and depth, it is uncertain if the observed “additive” effect is an interaction. The results in Table 7 may provide evidence to support these hypotheses. When considering the substrate type, depth, and their interaction in the best models (ΔAICc = 0, Table 7), they did not appear to be significant factors, as they accounted for only 1.3% and 0.6% of the changes in R2c for retention and peak reduction, respectively (Table 7). Furthermore, as indicated in some earlier studies, it seems that the variance explained by design factors was quite low. In the model proposed by [34], only 2.5% of the variance could be explained by substrate types. In the five-way ANOVA models presented by [56], which included factors such as substrate, depth, plants, area, and their interactions, the variance in runoff explained by design factors did not exceed 3.3%. Although design factors did not explain much of the variance in hydrological performance, it is important to emphasize their non-negligible effects. By controlling the combination of design factors, noticeable impacts can be made on construction costs, building loads, and plant growth performance for green roofs [30].
4.3. Environmental Factors as Drivers of Retention
Rainfall depth had a significant negative impact on retention, and its impact was the strongest (Figure 4a). This result was consistent with those of other studies in subtropical or other climatic regions. For green roofs without irrigation, rainfall can be considered the only source of outflow from the green roof [8], and the water storage capacity of green roofs is finite [83]. Therefore, large events will generate larger proportional amounts of runoff than small events. Especially in subtropical areas, the rainfall depth of a single event could exceed 100 mm, which is far beyond the field capacity of green roofs, and most of the rainfall will be converted into runoff. Additionally, rainfall depth has the highest relative importance among all the environmental factors (Figure 4a). This result was consistent with some previous studies [34,43]. Mean intensity (imean) also significantly negatively impacted retention, which was consistent with previous studies [35,37,43]. However, mean intensity had the lowest relative importance of all environmental factors, indicating that its impact was quite weak.
As reported in previous studies, AVWC significantly negatively impacted retention [34,39,44,49,52]. AVWC influences the quantity of rainfall that the substrates can absorb in the subsequent events because drier substrates can recover more water storage for rainfall [24]. A less water-saturated substrate implies more soil pores available, offering increased capillary storage. This necessitates more rainfall to fill the pores and establish flow pathways [39]. In this study, AVWC had a greater impact than in some previous studies [34,43]. This may be attributable to the lower AVWC observed in this study (see Section 4.1), which allowed AVWC to have a more substantial influence on retention.
The model results indicated a significant positive effect of the ADWP on retention (p < 0.001, Figure 4a), which was a result that has been confirmed in many previous studies [14,35,43]. A longer ADWP can provide enough time for the substrate to become drier, so ADWP was often used as a substitute for antecedent moisture conditions in early studies [43], and it is generally believed to affect the retention of green roofs by directly influencing AVWC. However, in this study, there was only a very slight, but significant, correlation between the AVWC and ADWP (r = −0.17, p < 0.001), suggesting that the connection between the ADWP and AVWC may not be as strong as previously reported. The antecedent water content (AWC) can be determined by the effect of the ADWP on the evapotranspiration (ET) of the entire system, including the plant species, substrates, and drainage layers. Therefore, ADWP has a more extensive impact. Considering only the impact of ADWP on the substrate would not provide a complete picture because the overall impact of the AWC on retention was likely greater than that of the substrate’s AWC. The substantially different R2 values in [14] for four different multiple regression models that incorporated ADWP suggest that the relationship between ADWP and hydrological performance is complex. As for unirrigated green roofs, the green roof ET is the only other pathway for water loss besides outflows during ADWP [43].
The mean relative humidity during the outflow (RHo) had a significant positive influence on retention (p < 0.001, Figure 4a), indicating that a higher RHo favors green roof water retention. ET typically accounts for 20~48% of moisture loss [11], and a higher relative humidity in the air suppresses the overall ET of green roofs, seemingly working against retention [84]. However, given the consistently high RHo during every event (average of 86.0%), the ET rates across all roofs were likely relatively similar. Consequently, it is plausible to assume that the inhibitory effects of ET on green roof retention were consistent. An alternate hypothesis is that a higher RHo might enhance soil particle absorption of water within the substrate, maintaining a hygroscopic equilibrium with the ambient air.
Duration had a significant negative impact on retention, which agreed with the results of previous studies [38,39,43]. Longer rainfall durations can make the substrate more saturated, reducing its retention capacity [39]. Additionally, the meteorological conditions during the rainfall events inhibit evaporation and plant transpiration, and a longer duration is not therefore conducive to the green roof’s recovery of its water storage capacity.
The mean solar radiation during the 24 h preceding the event (SR24) had a significant positive impact on retention (p < 0.001, Figure 4a), which concurred with the findings of [43]. This was attributed to the ability of solar radiation to facilitate the overall ET of the green roof system, resulting in a drier substrate and subsequently a lower AVWC, thus enhancing retention [43,44,85]. Additionally, an excessively high SR24 might subject plants to drought stress, predisposing them to absorb rainwater more efficiently and in larger quantities following a rainfall event.
4.4. Links between Environmental Factors and Peak Reduction
Rainfall depth had a significant negative impact on peak reduction (p < 0.001, Figure 4a), which was consistent with the results of previous studies. At lower rainfall depths, most rainfall is absorbed, leading to a reduced peak flow. For rainfall events where the volume exceeds the field capacity of the substrate, peak reduction significantly decreases. This is because, in such circumstances, the peak runoff and peak rainfall occur almost simultaneously [13]. Based on the unit field capacity measurements of the substrate (Table 3), an estimation of the maximum field capacity was conducted for the modules, and it was found that the rainfall depth in the majority of the events was insufficient to reach the field capacity of the modules. Hence, in this study, most peak runoff may have occurred before the field capacity was reached. According to [13], capillary storage is the primary peak reduction mechanism. Therefore, the average peak reduction should be considerably high and significantly higher than that observed for events where field capacity is reached. As shown in Table 6, the average peak reduction in large events (44.36%) that may exceed the field capacity of the modules was almost less than half of that in small (99.03%) and medium events (87.30%), which was consistent with the previous research findings.
The above mechanism also explains the significant negative impact of AVWC on peak reduction (p < 0.001, Figure 4a) because a lower AVWC implies more unsaturated soil, which can provide a larger capillary capacity. In such a situation, the outflow from the green roof occurs through preferential flow paths [50,86]. Consequently, there is a substantial decrease in peak runoff. When the substrate possesses a higher AVWC, it becomes more likely that the rainfall will overcome the limited capillary capacity and attain the field capacity, reducing peak reduction.
The TPe had a significant positive impact on peak reduction (p < 0.01, Figure 4). The results may have been influenced by seasonal variations because subtropical regions experience significant temperature differences between seasons. Specifically, plants tend to absorb moisture from a substrate more rapidly during the hot summer months. This accelerated absorption could facilitate the continuous infiltration of runoff into capillary pores, thereby improving the efficiency of capillary storage and contributing to a higher peak reduction. Furthermore, the ET rate from a green roof system is generally higher in the summer, which could also enhance the cyclical efficiency of capillary storage.
Mean intensity (imean) significantly negatively influenced peak reduction (p < 0.001, Figure 4b). This indicates that, over a certain period, a higher rainfall intensity could decrease peak reduction. This phenomenon is not fully understood but may be explained as follows: Events with a larger imean tend to fill the substrate pores or establish flow paths more rapidly during the initial stage of rainfall, after which the subsequent reduction in rainfall significantly weakens and forms peak runoff. In other words, in high-intensity rainfall events, the speed at which the substrate moisture front is forced out is faster than in low-intensity rainfall events [35], resulting in a lower peak reduction.
ADWP had a significantly positive impact on peak reduction (p < 0.001, Figure 4b), with longer ADWP durations notably enhancing peak reduction. This was attributed to the possibility of an extended ADWP, leading to drier soil, releasing more air-filled pore spaces, and enabling the substrate to better absorb peak rainfall. Additionally, a prolonged ADWP may impose drought stress on plants, which can increase their ability to absorb water in subsequent rainfall events. Various broad-leaved plants were used in this study. They may reduce their transpiration and biomass to counteract drought conditions. For example, following extended ADWPs, leaf curling was observed in T. pallida and S. leucantha to minimize their leaf area, which enabled the plants to gradually rehydrate and recover after rainfall. These observations suggest that plants under drought stress could contribute to peak reduction. The significant impact of ADWP on hydrological performance can give information about the irrigation frequency of green roofs. A non-irrigation strategy might lead to vegetation mortality in the summer in areas with a subtropical climate. Consequently, supplemental irrigation in the evenings when consecutive sunny high-temperature days are expected may aid vegetation survival, and the rapid evaporation during the subsequent day will not compromise the hydrological performance of the green roof. In the future, further insights can be obtained to support more rational region-specific irrigation strategies by investigating plant growth and hydrological performance under varying interval-based irrigation regimes.
Mean relative humidity during the event (RHe) significantly positively influences peak reduction (p < 0.05, Figure 4b), suggesting that RHe promotes peak reduction. The mechanism by which de_RH affects peak reduction may be similar to how RHo affects retention; that is, relative humidity impacts hydrological performance by affecting the moisture equilibrium between the air and the substrate.
5. Conclusions
This study quantitatively evaluated the hydrological performance of green roofs under the combined impact of environmental and design factors. Moreover, for the first time, this study demonstrated the significant impact of meteorological factors during three distinct stages (before and during a rainfall event and during the outflow) on hydrological performance, providing a quantitative understanding of their impact.
The experimental green roofs performed well, achieving a retention of 67.53% and a peak reduction of 87.34%. Substrate B at a depth of 17 cm and Substrate D at a depth of 17 cm had the best retention. However, due to the insignificant differences between substrate depths, substrates A (P25:ES30:V25:C20), B (P25:SL30:V25:C20), and D (Z25:SL30:V25:C20) at a depth of 12 cm are recommended. Linear mixed models were applied to determine the relative importance of environmental factors. While rainfall depth and AVWC were the most critical factors affecting hydrological performance, meteorological variables from different event stages were found to significantly influence hydrological performance significantly. The mean humidity during outflow affected retention. The mean air temperature during the event and mean humidity during the event affected peak reduction. Incorporating these factors into the model enabled the variation in hydrological performance to be better explained. In the complex spatial environment of high-density cities, microclimatic variations are likely to influence the hydrological performance of green roofs. Based on the significant environmental factors, optimizing the design and layout of green roofs will be necessary to maximize the hydrological performance.
Given the experimental design, it may not be sufficient to accurately identify the optimal substrate depth with only two depths tested. Additionally, more precise experiments need to be conducted to study the impact mechanisms of each influencing factor, especially meteorological factors, on the hydrological performance of green roofs, in order to obtain quantitative results. Environmental factors are the key drivers of hydrological performance in humid subtropical climates. Variability in weather and rainfall patterns can lead to inconsistent hydrological performance from year to year. Therefore, long-term monitoring is necessary for identifying how hydrological performance varies over time in subtropical climates. Furthermore, other design factors, such as the materials and thickness of the drainage layer, should also receive more attention in the future, as they likewise impact hydrological performance.
This study offered insights into the mechanisms affecting the hydrological performance of green roofs in subtropical climates, particularly by considering multi-stage meteorological factors. It provided a new perspective for a deeper understanding of the mechanisms influencing hydrological performance and emphasized the critical role of environmental factors in impacting hydrological performance. The results can be used to develop maintenance and management plans for region-specific green roofs, ensuring optimal hydrological performance in changing environmental conditions. Additionally, these findings can assist in the spatial optimization of green infrastructure and urban green spaces within cities, which requires a consideration of a balance between multiple benefits, among which hydrological performance is a significant aspect. Moreover, these findings may enhance the intelligence of green roof systems when integrated with real-time monitoring systems (for example, the Internet of Things, IoT [87]) to realize dynamic adjustment of stormwater management strategies such as the regulating of irrigation systems. Green space is notably limited in many densely populated subtropical cities, such as those currently undergoing extensive urban renewal in China. Consequently, there is an urgent need for further studies, effective products, and supportive policies to promote the widespread implementation of green roofs as green infrastructures.
Author Contributions
Conceptualization, Z.L., J.L. and Y.L.; methodology, Z.L. and J.L.; software, Z.L.; validation, Z.L., J.L. and Y.L.; formal analysis, Z.L.; investigation, Z.L.; resources, J.L.; data curation, Z.L.; writing—original draft preparation, Z.L.; writing—review and editing, Z.L., J.L. and Y.L.; visualization, Z.L.; supervision, J.L.; project administration, J.L.; funding acquisition, J.L. All authors have read and agreed to the published version of the manuscript.
Funding
This research was funded by the National Natural Science Foundation of China, grant number 52178058, awarded to Jialin Liu.
Data Availability Statement
The data presented in this study are available on request from the corresponding author.
Acknowledgments
The authors would like to thank Mary Beth Kirkham of Kansas State University for reviewing the manuscript. We thank Shiqiang Jin from Bristol Myers Squibb for his technical support in the data analysis. We also thank Wuxi Li, Yu Liu, Rui Zhang, Jisheng Zhang, and Peilin Yang from Southwest University for their assistance in the experimental setup.
Conflicts of Interest
The authors declare no conflicts of interest.
References
- Cao, Y.; Kong, L.; Zhang, L.; Ouyang, Z. The Balance between Economic Development and Ecosystem Service Value in the Process of Land Urbanization: A Case Study of China’s Land Urbanization from 2000 to 2015. Land Use Policy 2021, 108, 105536. [Google Scholar] [CrossRef]
- Iftekhar, M.S.; Pannell, D.J. Developing an Integrated Investment Decision-Support Framework for Water-Sensitive Urban Design Projects. J. Hydrol. 2022, 607, 127532. [Google Scholar] [CrossRef]
- Milly, P.C.D.; Wetherald, R.T.; Dunne, K.A.; Delworth, T.L. Increasing Risk of Great Floods in a Changing Climate. Nature 2002, 415, 514–517. [Google Scholar] [CrossRef]
- Hirabayashi, Y.; Mahendran, R.; Koirala, S.; Konoshima, L.; Yamazaki, D.; Watanabe, S.; Kim, H.; Kanae, S. Global Flood Risk under Climate Change. Nat. Clim. Change 2013, 3, 816–821. [Google Scholar] [CrossRef]
- Akbari, H.; Shea Rose, L.; Taha, H. Analyzing the Land Cover of an Urban Environment Using High-Resolution Orthophotos. Landsc. Urban Plan. 2003, 63, 1–14. [Google Scholar] [CrossRef]
- Dunnett, N.; Kingsbury, N. Planting Options for Extensive and Semi-Extensive Green Roofs; The Cardinal Group: Timber Press, OR, USA, 2004; pp. 221–236. [Google Scholar]
- Besir, A.B.; Cuce, E. Green Roofs and Facades: A Comprehensive Review. Renew. Sustain. Energy Rev. 2018, 82, 915–939. [Google Scholar] [CrossRef]
- Fassman-Beck, E.; Voyde, E.; Simcock, R.; Hong, Y. 4 Living Roofs in 3 Locations: Does Configuration Affect Runoff Mitigation? J. Hydrol. 2013, 490, 11–20. [Google Scholar] [CrossRef]
- Nawaz, R.; Mcdonald, A.W.; Postoyko, S. Hydrological Performance of a Full-Scale Extensive Green Roof Located in a Temperate Climate. Ecol. Eng. 2015, 82, 66–80. [Google Scholar] [CrossRef]
- Bortolini, L.; Bettella, F.; Zanin, G. Hydrological Behaviour of Extensive Green Roofs with Native Plants in the Humid Subtropical Climate Context. Water 2020, 13, 44. [Google Scholar] [CrossRef]
- Voyde, E.; Fassman, E.; Simcock, R. Hydrology of an Extensive Living Roof under Sub-Tropical Climate Conditions in Auckland, New Zealand. J. Hydrol. 2010, 394, 384–395. [Google Scholar] [CrossRef]
- Karteris, M.; Theodoridou, I.; Mallinis, G.; Tsiros, E.; Karteris, A. Towards a Green Sustainable Strategy for Mediterranean Cities: Assessing the Benefits of Large-Scale Green Roofs Implementation in Thessaloniki, Northern Greece, Using Environmental Modelling, GIS and Very High Spatial Resolution Remote Sensing Data. Renew. Sustain. Energy Rev. 2016, 58, 510–525. [Google Scholar] [CrossRef]
- Sims, A.W.; Robinson, C.; Smart, C.C.; O’Carroll, D. Mechanisms Controlling Green Roof Peak Flow Rate Attenuation. J. Hydrol. 2019, 557, 123972. [Google Scholar] [CrossRef]
- Stovin, V.; Vesuviano, G.; Kasmin, H. The Hydrological Performance of a Green Roof Test Bed under UK Climatic Conditions. J. Hydrol. 2012, 414, 148–161. [Google Scholar] [CrossRef]
- Ávila-Hernández, A.; Simá, E.; Ché-Pan, M. Research and Development of Green Roofs and Green Walls in Mexico: A Review. Sci. Total Environ. 2023, 856, 158978. [Google Scholar] [CrossRef] [PubMed]
- Dong, X.; He, B.-J. A Standardized Assessment Framework for Green Roof Decarbonization: A Review of Embodied Carbon, Carbon Sequestration, Bioenergy Supply, and Operational Carbon Scenarios. Renew. Sustain. Energy Rev. 2023, 182, 113376. [Google Scholar] [CrossRef]
- Shafique, M.; Xue, X.; Luo, X. An Overview of Carbon Sequestration of Green Roofs in Urban Areas. Urban For. Urban Green. 2020, 47, 126515. [Google Scholar] [CrossRef]
- Calviño, A.A.; Tavella, J.; Beccacece, H.M.; Estallo, E.L.; Fabián, D.; Moreno, M.L.; Salvo, A.; Fenoglio, M.S. The Native- Exotic Plant Choice in Green Roof Design: Using a Multicriteria Decision Framework to Select Plant Tolerant Species That Foster Beneficial Arthropods. Ecol. Eng. 2023, 187, 106871. [Google Scholar] [CrossRef]
- Deng, H.; Jim, C.Y. Spontaneous Plant Colonization and Bird Visits of Tropical Extensive Green Roof. Urban Ecosyst. 2017, 20, 337–352. [Google Scholar] [CrossRef]
- Williams, K.J.H.; Lee, K.E.; Sargent, L.; Johnson, K.A.; Rayner, J.; Farrell, C.; Miller, R.E.; Williams, N.S.G. Appraising the Psychological Benefits of Green Roofs for City Residents and Workers. Urban For. Urban Green. 2019, 44, 126399. [Google Scholar] [CrossRef]
- Lee, K.; Wylie, B.; Williams, N.S.G.; Johnson, K.A.; Sargent, L.D.; Williams, K.J.H. “It’s a Little Soap Opera of Its Own”: Fascinating Green Roofs Offer Complexity, Movement, Sensory Engagement, and Vast Vistas. Landsc. Urban Plan. 2024, 242, 104925. [Google Scholar] [CrossRef]
- Teotonio, I.; Silva, C.M.; Cruz, C.O. Eco-Solutions for Urban Environments Regeneration: The Economic Value of Green Roofs. J. Clean. Prod. 2018, 199, 121–135. [Google Scholar] [CrossRef]
- Castleton, H.; Stovin, V.; Beck, S.; Davison, J. Green Roofs; Building Energy Savings and the Potential for Retrofit. Energy Build. 2010, 42, 1582–1591. [Google Scholar] [CrossRef]
- Czemiel Berndtsson, J. Green Roof Performance towards Management of Runoff Water Quantity and Quality: A Review. Ecol. Eng. 2010, 36, 351–360. [Google Scholar] [CrossRef]
- Chen, C.-F. Performance Evaluation and Development Strategies for Green Roofs in Taiwan: A Review. Ecol. Eng. 2013, 52, 51–58. [Google Scholar] [CrossRef]
- Carson, T.; Marasco, D.E.; Culligan, P.J.; McGillis, W.R. Hydrological Performance of Extensive Green Roofs in New York City: Observations and Multi-Year Modeling of? Three Full-Scale Systems. Environ. Res. Lett. 2013, 8, 024036. [Google Scholar] [CrossRef]
- Nektarios, P.A.; Ntoulas, N.; Nydrioti, E.; Kokkinou, I.; Bali, E.-M.; Amountzias, I. Drought Stress Response of Sedum Sediforme Grown in Extensive Green Roof Systems with Different Substrate Types and Depths. Sci. Hortic. 2015, 181, 52–61. [Google Scholar] [CrossRef]
- William, R.; Goodwell, A.; Richardson, M.; Le, P.V.V.; Kumar, P.; Stillwell, A.S. An Environmental Cost-Benefit Analysis of Alternative Green Roofing Strategies. Ecol. Eng. 2016, 95, 1–9. [Google Scholar] [CrossRef]
- Schultz, I.; Sailor, D.; Starry, O. Effects of Substrate Depth and Precipitation Characteristics on Stormwater Retention by Two Green Roofs in Portland OR. J. Hydrol. Reg. Stud. 2018, 18, 110–118. [Google Scholar] [CrossRef]
- Leite, F.R.; Antunes, M.L.P. Green Roof Recent Designs to Runoff Control: A Review of Building Materials and Plant Species Used in Studies. Ecol. Eng. 2023, 189, 106924. [Google Scholar] [CrossRef]
- Carpenter, D.D.; Kaluvakolanu, P. Effect of Roof Surface Type on Storm-Water Runoff from Full-Scale Roofs in a Temperate Climate. J. Irrig. Drain. Eng. 2011, 137, 161–169. [Google Scholar] [CrossRef]
- Stovin, V.; Vesuviano, G.; De-Ville, S. Defining Green Roof Detention Performance. Urban Water J. 2017, 14, 574–588. [Google Scholar] [CrossRef]
- Alim, M.A.; Rahman, A.; Tao, Z.; Garner, B.; Griffith, R.; Liebman, M. Green Roof as an Effective Tool for Sustainable Urban Development: An Australian Perspective in Relation to Stormwater and Building Energy Management. J. Cleaner Prod. 2022, 362, 132561. [Google Scholar] [CrossRef]
- Li, Y.; Liu, J. Green Roofs in the Humid Subtropics: The Role of Environmental and Design Factors on Stormwater Retention and Peak Reduction. Sci. Total Environ. 2023, 858, 159710. [Google Scholar] [CrossRef] [PubMed]
- Razzaghmanesh, M.; Beecham, S. The Hydrological Behaviour of Extensive and Intensive Green Roofs in a Dry Climate. Sci. Total Environ. 2014, 499, 284–296. [Google Scholar] [CrossRef] [PubMed]
- Volder, A.; Dvorak, B. Event Size, Substrate Water Content and Vegetation Affect Storm Water Retention Efficiency of an Un-Irrigated Extensive Green Roof System in Central Texas. Sustain. Cities Soc. 2014, 10, 59–64. [Google Scholar] [CrossRef]
- Zhang, Q.; Miao, L.; Wang, X.; Liu, D.; Zhu, L.; Zhou, B.; Sun, J.; Liu, J. The Capacity of Greening Roof to Reduce Stormwater Runoff and Pollution. Landsc. Urban Plan. 2015, 144, 142–150. [Google Scholar] [CrossRef]
- Brandao, C.; Cameira, M.R.; Valente, F.; Carvalho, R.C.D.; Paço, T. Wet Season Hydrological Performance of Green Roofs Using Native Species under Mediterranean Climate. Ecol. Eng. 2017, 102, 596–611. [Google Scholar] [CrossRef]
- Gobatti, L.; Leite, B.C.C. Unmanaged Vegetated Roofs Hydrological Performance in Subtropical Areas: An Investigation in São Paulo, Brazil. Sci. Total Environ. 2023, 874, 162417. [Google Scholar] [CrossRef]
- DeNardo, J.C.; Jarrett, A.R.; Manbeck, H.B.; Beattie, D.J.; Berghage, R. Stormwater Mitigation and Surface Temperature Reduction by Green Roofs. Trans. ASABE 2005, 48, 1491–1496. [Google Scholar] [CrossRef]
- Palla, A.; Gnecco, I.; Lanza, L. Compared Performance of a Conceptual and a Mechanistic Hydrologic Models of a Green Roof. Hydrol. Process. 2012, 26, 73–84. [Google Scholar] [CrossRef]
- Lee, J.Y.; Lee, M.J.; Han, M. A Pilot Study to Evaluate Runoff Quantity from Green Roofs. J. Environ. Manag. 2015, 152, 171–176. [Google Scholar] [CrossRef]
- Wong, G.K.L.; Jim, C.Y. Identifying Keystone Meteorological Factors of Green-Roof Stormwater Retention to Inform Design and Planning. Landsc. Urban Plan. 2015, 143, 173–182. [Google Scholar] [CrossRef]
- Sims, A.W.; Robinson, C.E.; Smart, C.C.; Voogt, J.A.; Hay, G.J.; Lundholm, J.T.; Powers, B.; O’Carroll, D.M. Retention Performance of Green Roofs in Three Different Climate Regions. J. Hydrol. 2016, 542, 115–124. [Google Scholar] [CrossRef]
- Simmons, M.; Gardiner, B.; Windhager, S.; Tinsley, J. Green Roofs Are Not Created Equal: The Hydrologic and Thermal Performance of Six Different Extensive Green Roofs and Reflective and Non-Reflective Roofs in a Sub-Tropical Climate. Urban Ecosyst. 2008, 11, 339–348. [Google Scholar] [CrossRef]
- Carter, T.L.; Rasmussen, T.C. Hydrologic Behavior of Vegetated Roofs. JAWRA J. Am. Water Resour. Assoc. 2007, 42, 1261–1274. [Google Scholar] [CrossRef]
- Stovin, V. The Potential of Green Roofs to Manage Urban Stormwater: The Potential of Green Roofs to Manage Urban Stormwater. Water Environ. J. 2010, 24, 192–199. [Google Scholar] [CrossRef]
- Hakimdavar, R.; Culligan, P.; Finazzi, M.; Barontini, S.; Ranzi, R. Scale Dynamics of Extensive Green Roofs: Quantifying the Effect of Drainage Area and Rainfall Characteristics on Observed and Modeled Green Roof Hydrologic Performance. Ecol. Eng. 2014, 73, 494–508. [Google Scholar] [CrossRef]
- Liu, W.; Feng, Q.; Chen, W.; Wei, W.; Deo, R. The Influence of Structural Factors on Stormwater Runoff Retention of Extensive Green Roofs: New Evidence from Scale-Based Models and Real Experiments. J. Hydrol. 2019, 569, 230–238. [Google Scholar] [CrossRef]
- Zhang, Z.; Szota, C.; Fletcher, T.D.; Williams, N.S.G.; Werdin, J.; Farrell, C. Influence of Plant Composition and Water Use Strategies on Green Roof Stormwater Retention. Sci. Total Environ. 2018, 625, 775–781. [Google Scholar] [CrossRef]
- Longobardi, A.; D’Ambrosio, R.; Mobilia, M. Predicting Stormwater Retention Capacity of Green Roofs: An Experimental Study of the Roles of Climate, Substrate Soil Moisture, and Drainage Layer Properties. Sustainability 2019, 11, 6956. [Google Scholar] [CrossRef]
- Liberalesso, T.; Tassi, R.; Ceconi, D.E.; Allasia, D.G.; Arboit, N.K.S. Effect of Rice Husk Addition on the Physicochemical and Hydrological Properties on Green Roof Substrates under Subtropical Climate Conditions. J. Clean. Prod. 2021, 315, 128133. [Google Scholar] [CrossRef]
- Persch, C.G.; Tassi, R.; Minetto, B.; Allasia, D.; Rippel, E. Assessing the Scale Dynamics of the Rainfall Retention of Green Roofs in a Subtropical Climate. J. Environ. Eng. 2021, 147, 04021054. [Google Scholar] [CrossRef]
- Kazemi, F.; Mohorko, R. Review on the Roles and Effects of Growing Media on Plant Performance in Green Roofs in World Climates. Urban For. Urban Green. 2017, 23, 13–26. [Google Scholar] [CrossRef]
- Shafique, M.; Shafique, M.; Shafique, M.; Kim, R.; Rafiq, M. Green Roof Benefits, Opportunities and Challenges—A Review. Renew. Sustain. Energy Rev. 2018, 90, 757–773. [Google Scholar] [CrossRef]
- Xie, H.; Liu, J.; Randall, M. Impact of Structural Factors on Green Roof Runoff—A Field Investigation and Statistical Analysis. J. Hydrol. 2022, 613, 128345. [Google Scholar] [CrossRef]
- Xiao, M.; Lin, Y.; Han, J.; Zhang, G. A Review of Green Roof Research and Development in China. Renew. Sustain. Energy Rev. 2014, 40, 633–648. [Google Scholar] [CrossRef]
- Chen, X.; Shuai, C.; Chen, Z.; Zhang, Y. What Are the Root Causes Hindering the Implementation of Green Roofs in Urban China? Sci. Total Environ. 2019, 654, 742–750. [Google Scholar] [CrossRef] [PubMed]
- Vijayaraghavan, K. Green Roofs: A Critical Review on the Role of Components, Benefits, Limitations and Trends. Renew. Sustain. Energy Rev. 2016, 57, 740–752. [Google Scholar] [CrossRef]
- Sadeghi, S.H.; Moosavi, V.; Karami, A.; Behnia, N. Soil Erosion Assessment and Prioritization of Affecting Factors at Plot Scale Using the Taguchi Method. J. Hydrol. 2012, 448–449, 174–180. [Google Scholar] [CrossRef]
- Zhang, F.B.; Wang, Z.L.; Yang, M.Y. Assessing the Applicability of the Taguchi Design Method to an Interrill Erosion Study. J. Hydrol. 2015, 521, 65–73. [Google Scholar] [CrossRef]
- Guo, J.; Zhang, Y.; Che, S. Performance Analysis and Experimental Study on Rainfall Water Purification with an Extensive Green Roof Matrix Layer in Shanghai, China. Water Sci. Technol. 2018, 77, 670–681. [Google Scholar] [CrossRef] [PubMed]
- Zhang, W.; Yang, G.; Tu, X.; Zhang, P. LY/T 1215-1999; Determination of Forest Soil Water-Physical Properties. China Academy of Forestry, Forest Research Institute: Beijing, China, 1999.
- Li, X.; Hussain, S.A.; Sobri, S.; Md Said, M.S. Overviewing the Air Quality Models on Air Pollution in Sichuan Basin, China. Chemosphere 2021, 271, 129502. [Google Scholar] [CrossRef] [PubMed]
- Xiang, X.; Shi, G.; Wu, X.; Yang, F. The Extraordinary Trend of the Spatial Distribution of PM2.5 Concentration and Its Meteorological Causes in Sichuan Basin. Atmosphere 2022, 13, 853. [Google Scholar] [CrossRef]
- Speak, A.; Rothwell, J.; Lindley, S.; Smith, C.L. Rainwater Runoff Retention on an Aged Intensive Green Roof. Sci. Total Environ. 2013, 461–462, 28–38. [Google Scholar] [CrossRef] [PubMed]
- R Core Team. R: A Language and Environment for Statistical Computing; R Foundation for Statistical Computing: Vienna, Austria, 2023. [Google Scholar]
- Chang, L.; Roberts, S.; Welsh, A. Robust Lasso Regression Using Tukey’s Biweight Criterion. Technometrics 2018, 60, 36–47. [Google Scholar] [CrossRef]
- Lee, J.H.; Shi, Z.; Gao, Z. On LASSO for Predictive Regression. J. Econom. 2022, 229, 322–349. [Google Scholar] [CrossRef]
- Tibshirani, R. Regression Shrinkage and Selection via the Lasso. J. R. Stat. Soc. Ser. B Stat. Methodol. 1996, 58, 267–288. [Google Scholar] [CrossRef]
- Friedman, J.; Tibshirani, R.; Hastie, T. Regularization Paths for Generalized Linear Models via Coordinate Descent. J. Stat. Softw. 2010, 33, 1–22. [Google Scholar] [CrossRef] [PubMed]
- Fox, J.; Weisberg, S. An R Companion to Applied Regression, 3rd ed.; Sage: Thousand Oaks, CA, USA, 2019. [Google Scholar]
- Bates, D.; Mächler, M.; Bolker, B.; Walker, S. Fitting Linear Mixed-Effects Models Using lme4. J. Stat. Softw. 2015, 67, 1–48. [Google Scholar] [CrossRef]
- Barr, D.J.; Levy, R.; Scheepers, C.; Tily, H.J. Random Effects Structure for Confirmatory Hypothesis Testing: Keep It Maximal. J. Mem. Lang. 2013, 68, 255–278. [Google Scholar] [CrossRef]
- Akaike, H. A New Look at the Statistical Model Identification. IEEE Trans. Autom. Control 1974, 19, 716–723. [Google Scholar] [CrossRef]
- Bartoń, K. MuMIn: Multi-Model Inference. R Package Version 1.47.5. 2023. Available online: https://CRAN.R-project.org/package=MuMIn (accessed on 21 July 2024).
- Canessa, R.; van den Brink, L.; Berdugo, M.B.; Hättenschwiler, S.; Rios, R.S.; Saldaña, A.; Tielbörger, K.; Bader, M.Y. Trait Functional Diversity Explains Mixture Effects on Litter Decomposition at the Arid End of a Climate Gradient. J. Ecol. 2022, 110, 2219–2231. [Google Scholar] [CrossRef]
- Nakagawa, S.; Johnson, P.C.D.; Schielzeth, H. The Coefficient of Determination R2 and Intra-Class Correlation Coefficient from Generalized Linear Mixed-Effects Models Revisited and Expanded. J. R. Soc. Interface 2016, 14, 134. [Google Scholar]
- Ogle, D.H.; Doll, J.C.; Wheeler, A.P.; Dinno, A. FSA: Simple Fisheries Stock Assessment Methods. R Package Version 0.9.5. 2023. Available online: https://CRAN.R-project.org/package=FSA (accessed on 21 July 2024).
- Wong, G.K.L.; Jim, C.Y. Quantitative Hydrologic Performance of Extensive Green Roof under Humid-Tropical Rainfall Regime. Ecol. Eng. 2014, 70, 366–378. [Google Scholar] [CrossRef]
- Gong, Y.; Yin, D.; Li, J.; Zhang, X.; Wang, W.; Fang, X.; Shi, H.; Wang, Q. Performance Assessment of Extensive Green Roof Runoff Flow and Quality Control Capacity Based on Pilot Experiments. Sci. Total Environ. 2019, 687, 505–515. [Google Scholar] [CrossRef]
- Jamei, M.; Guiras, H.; Chtourou, Y.; Kallel, A.; Romero, E.; Georgopoulos, I. Water Retention Properties of Perlite as a Material with Crushable Soft Particles. Eng. Geol. 2011, 122, 261–271. [Google Scholar] [CrossRef]
- Stovin, V.; Poë, S.; Berretta, C. A Modelling Study of Long Term Green Roof Retention Performance. J. Environ. Manag. 2013, 131, 206–215. [Google Scholar] [CrossRef]
- Cascone, S.; Coma, J.; Gagliano, A.; Pérez, G. The Evapotranspiration Process in Green Roofs: A Review. Build. Environ. 2019, 147, 337–355. [Google Scholar] [CrossRef]
- Arboit, N.K.S.; Tassi, R.; Liberalesso, T.; Ceconi, D.E.; Piccili, D.G.A. Green Roof Evapotranspiration Rates and Stormwater Control under Subtropical Climate: A Case Study in Brazil. RBRH 2021, 26, e32. [Google Scholar] [CrossRef]
- Liu, R.; Fassman-Beck, E. Hydrologic Response of Engineered Media in Living Roofs and Bioretention to Large Rainfalls: Experiments and Modeling. Hydrol. Process. 2017, 31, 556–572. [Google Scholar] [CrossRef]
- Tseng, K.-H.; Chung, M.-Y.; Chen, L.-H.; Chou, L.-A. A Study of Green Roof and Impact on the Temperature of Buildings Using Integrated IoT System. Sci. Rep. 2022, 12, 16140. [Google Scholar] [CrossRef] [PubMed]

Disclaimer/Publisher’s Note: The statements, opinions and data contained in all publications are solely those of the individual author(s) and contributor(s) and not of MDPI and/or the editor(s). MDPI and/or the editor(s) disclaim responsibility for any injury to people or property resulting from any ideas, methods, instructions or products referred to in the content. |
© 2024 by the authors. Licensee MDPI, Basel, Switzerland. This article is an open access article distributed under the terms and conditions of the Creative Commons Attribution (CC BY) license (https://creativecommons.org/licenses/by/4.0/).