Abstract
As an important incentive and constraint system to coordinate the contradiction between ecological resource protection and regional economic development, the ecological and environmental protection effect after its implementation deserves special attention, especially for China, which involves the widest scope of payment and the largest transfer and has become the largest governmental ecological compensation program in China and even in the world. Starting from the evolution of China’s eco-financial transfer system, this study conducts an empirical investigation of the ecological and environmental protection effect of the eco-financial transfer system. Such an undertaking is based on the theoretical exploration of the impact mechanism of the eco-financial transfer system to improve the ecological environment quality and based on the panel data of 40 counties in Hubei Province from 2010 to 2020. Results of the study show that the ecological financial transfer system can promote the improvement of regional ecological environment quality, but the promotion effect is insignificant. The financial funds reflect more of a financial compensation effect than a system incentive effect. The increase in the scale of ecological transfer payments is conducive to strengthening the incentive function of the system, promoting local governments to increase environmental protection expenditures and environmental regulation efforts to improve the quality of the ecological environment. Therefore, in the process of implementing ecological financial transfers from the province to the counties, the concept of ecological value contribution should be incorporated into the fund allocation process. In addition, the current ecological transfer payment fund allocation method should be reconstructed on the basis of the ecological value contribution to enhance the guiding role of “high quality and high price, more work and more gain.” The goal is to effectively stimulate the enthusiasm of local governments for ecological environmental protection. Findings have significant guidance for developing countries that are currently seeking to formulate and implement such policies.
1. Introduction
The rapid economic development has caused drastic changes in regional land use, and the natural landscape pattern dominated by vegetation, soil, and organisms has been gradually replaced by the urban landscape pattern dominated by artificial buildings; such manmade interventions have led to a series of ecological and environmental problems such as soil erosion, soil degradation, urban heat island effect intensification, and biodiversity reduction [1,2]. The Global Assessment of Biodiversity and Ecosystem Services (GABES) released by the Intergovernmental Platform for Monitoring Biodiversity and Ecosystem Services (IPBES) in 2019 states that frequent human socio-economic activities have led to profound changes in three-fourths of terrestrial natural ecological landscapes, and that ecosystem health and security are being degraded on a global scale with localized trends that are difficult to contain [3]. As the world’s largest developing country, China is in the process of rapid economic development over the past few decades; the fragmentation, marginalization, and depletion of natural ecosystems have gradually come to the fore, leading to the gradual degradation of ecosystem functions; the security and stability of ecosystems have been subjected to serious challenges [4,5]. Notably, these problems are also faced by other developing countries in the process of rapidly advancing urbanization and industrialization [6,7,8]. Therefore, to effectively deal with the objective fact of the gradual degradation of ecosystems and to improve the quality of the ecological environment, China has implemented ecological environmental protection projects in areas with impaired ecological functions. Examples of these projects include returning farmland to forests and grasslands, comprehensively treating the sources of wind and sand in the Beijing–Tianjin–Hebei area, and a major project of comprehensively preventing and controlling soil and water erosion in the Yellow River Basin. Meanwhile, a cross-regional ecological transfer payment system was implemented in 2008 for ecological functional zones, with the aim of compensating for the cost of implementing ecological environmental protection by the ecological functional zone governments through the system and incentivizing them to take the initiative in strengthening ecological environmental protection and management and improving the ecological environment of the entire region. As of 2020, the cumulative investment in cross-regional ecological financial transfers implemented by China has exceeded 600 billion yuan, which has become the largest governmental ecological protection compensation program in China and the world [9,10].
As one of the important means to effectively incentivize local governments to strengthen ecological environmental protection, the cross-regional ecological financial transfer system has long been established in some developing and developed countries worldwide. For instance, Brazil introduced ecological index weights into the fiscal redistribution of ICMS on the basis of the value-added tax (ICMS) to form the ICMS-E system; in France, cities containing core areas of national and marine parks are included in ecological fiscal transfers in the DGF (La dotation globale de fonctionnement) process of allocating fiscal funds; in Portugal and India, fiscal transfers to areas with spatial control of natural ecosystems have been achieved through the establishment of fiscal equalization fund systems and forestry eco-environmental protection fund systems, respectively; Germany only implements ecological financial transfer payments in certain states and increases the indicators related to ecological protection in the fiscal balance system from state to state and state to local governments to achieve nature protection; Mongolia implements ecological transfer payments from the central to local governments based on ecological indicators such as the area of nature reserves, the natural form of land, and the need for land restoration when the local government’s environmental protection expenditure is in deficit [11]. In addition, countries such as Indonesia, Uganda, and Ukraine, as well as Finland and Australia, are in the initial stages of implementing or preparing to implement the system.
For established ecological transfer payment systems, some scholars have conducted research on the ecological and environmental protection effects of the system. For example, Kumar and Managi made a comprehensive analysis of the ecological transfer payment system implemented in India, and found that the system of local governments in India to play a better incentive constraints, which helped local governments internalize the external effects of eco-environmental protection and incentivized them to provide eco-environmental products [12]. Santos et al. assessed the eco-environmental effects of eco-transfers in various regions of Portugal and found that the implementation of the system significantly improved the regional ecosystem’s environmental quality with positive incentive effects [13]. Droste et al. assessed the effects of the implementation of ecological transfers (ICMS-E) in Brazilian states and found that the implementation of the system helped incentivize local governments to increase regional ecological protection, and that the implementation of the ICMS-E showed a positive correlation with the area of protected areas [14].
The ecological financial transfer payment system implemented in China has typical Chinese characteristics. It is an institutional arrangement that tilts the transfer system to ecological functional areas by increasing the weight of ecological environment in the design of balanced transfer payment and allocates funds based on the “standard financial gap”, supplemented by comprehensive financial security coefficients such as ecological protection areas, industrial development constraints, and population size with subsidies on the basis of the standard financial gap accounting for 75 per cent of all transfer funds. Does the eco-transfer system carried out on the basis of such design concepts and fund allocation methods have the same eco-environmental effects? Some scholars have explored this issue but produced inconsistent conclusions. Some scholars have argued that China’s ecological financial transfers have helped improve regional ecological quality. To illustrate, Zhang and Chen, based on the empirical analysis of panel data from 2008–2018 in 31 provinces (cities) across China, found that the eco-transfer system significantly enhances the local government’s investment in pollution control, suppresses the local government’s pollutant emissions, and improves the regional ecological environment quality [15]. Gong et al. explored the national key ecological functional zones as an empirical sample and similarly found that the implementation of the ecological fiscal transfer system can effectively incentivize local governments to strengthen the environmental regulation of industrial pollution, effectively reduce the local government’s industrial pollution emissions, and improve the ecological environment quality [16]. Li and Xue conducted a study using the county scale as the evaluation unit and similarly found that eco-transfers promoted the effectiveness of local governments’ environmental governance behaviors and played an incentive effect on county environmental protection [17]. However, some scholars argued that China’s eco-fiscal transfers have not significantly improved the ecological quality of the environment. For instance, Miu and Zhao, based on China’s provincial panel data, found that the financial transfer system of ecological functional areas only played the compensation effect of funds in the process of improving the ecological environment effect and did not effectively incentivize local governments for eco-friendly governance; this phenomenon led to a decrease in the significant effect of the system in improving the ecological environment [18]. Cao et al. similarly found that the system implemented in China incentivized local governments and somewhat improved environmental quality but did not contribute to the improvement of ecological quality and even failed to leverage the funds [19]. Li et al. analyzed the longitudinal and horizontal comparison of the ecosystem pattern before and after the ecological transfer payment; they subsequently concluded that the ecological transfer payment system can somewhat improve the ecosystem environmental quality, but the improvement effect is insufficient [20]. On the one hand, the divergence in research views may primarily be due to the differences in research regions and research scales, which have different geographic characteristics and may reveal different phenomena and laws [21]. In comparison, additional micro-scale research is closer to the essence of the phenomenon. On the other hand, it may be due to the difference in theoretical modeling, which is often based on different theoretical logic and research perspectives, thus leading to different research views. Therefore, an urgent need arises to clarify the theoretical logic and key variables between eco-transfers and ecological environment improvement to clarify the mechanism between the two and to clarify the actual impact of eco-financial transfers on ecological environment improvement.
Existing studies have explored the ecological and environmental protection governance effects of China’s ecological fiscal transfer system with relative richness. However, the current research has the following persistent shortcomings. First, in terms of theoretical research, fewer studies investigate from the perspective of local government environmental protection behavior to explore the impact mechanism of the ecological transfer system in improving the quality of the ecological environment and building the corresponding model to yield empirical evidence. In-depth analysis of the role of local government ecological protection behavior in the process of ecological transfer payment to improve ecological environment quality and clarification of the relationship among ecological transfer payment, local government ecological protection behavior, and ecological environment quality improvement will have important reference significance for improving future ecological transfer payment systems. Second, in terms of empirical research, for the quantitative characterization of the key variable of ecological environmental quality, most scholars have constructed indexes from the single dimension of natural ecology or environmental conditions, and fewer scholars have combined the weighting of these two dimensions to construct a comprehensive index of ecological environmental quality. Characterizing ecological quality by considering both the natural ecology and environmental conditions can reasonably reflect the ecological and environmental protection effects under the implementation of the system, which is conducive to the policy makers to obtain a clearer grasp of the actual ecological and environmental protection effects of the system and lay down the reference basis for the subsequent reform of the system. In addition, fewer scholars in their empirical research take the county as the evaluation unit; meanwhile, given that the county is the most basic financial unit and the ultimate bearer of ecological and environmental protection governance and with the combination of macro-policy formulation and micro-policy implementation, discussing it as the evaluation unit is more realistic.
Based on the above discussion, starting from the evolution of China’s eco-fiscal transfer system, this study first introduces local government eco-environmental behaviors into the path framework of eco-fiscal transfer affecting eco-environmental quality at the theoretical level; it then analyzes the mechanism of local government eco-environmental behaviors on the eco-transfer system to improve eco-environmental quality. Second, based on the theoretical mechanism, using Hubei Province’s ecological transfer payments to 40 counties as a research sample, it characterizes the quality of ecological environment from the two dimensions of natural ecology and environmental conditions and constructs the corresponding panel data model for empirical investigation. It further analyzes the heterogeneity around the behavioral preferences of environmental protection of the local governments as well as the differences in the scale of ecological transfer funds to reveal the policy effects of the ecological transfer payment system at a deeper level. Our conclusions may provide a theoretical basis for China’s subsequent reform of its existing eco-transfer system and provide a reference for developing countries (e.g., Indonesia, Uganda, and Ukraine) that are currently seeking to formulate and implement such policies.
2. Background and Impact Mechanism of Ecological Fiscal Transfer System
2.1. Background of the Ecological Fiscal Transfer System
2.1.1. Evolution of the Ecological Fiscal Transfer System
Eco-transfers in China are expressed in the form of transfers to key ecological function areas, which is a financial mechanism with the nature of eco-protection; the objectives are to enhance the ability of the government of the ecological function areas to provide basic public services and incentivize them to maintain the regional ecological environment security and stability [22,23]. The system, which has been implemented for nearly 15 years since 2008, is the only ecological transfer in China’s current ecological transfer practice with institutional safeguards from the central government and provincial governments as well as a stable allocation of financial funds; it also involves the widest range of payments and the largest transfer and has become the largest governmental ecological protection compensation program in China and even in the world [9,10]. Based on the administrative level, the ecological transfer system can be categorized into two types: central-to-provincial and provincial-to-county. Given that this study takes the counties in Hubei Province as the research unit, the evolution of the ecological transfer system from the province to the counties is only sorted out for the ecological transfer system from Hubei Province to the counties.
- (1)
- Central-to-provincial ecological transfer payment system
In 2008, the central government coordinated the planning of the national main functional areas and the fiscal transfer system and for the first time implemented a fiscal transfer to a pilot area (the Sanjiangyuan Ecological Reserve), initiating the trial implementation of China’s vertical ecological transfer system. Subsequently, in 2009, the Ministry of Finance officially issued the “Transfer Payment (Pilot) Measures for National Key Ecological Functional Zones.” On the basis of the pilot, the counties (cities and districts) with better ecological and environmental protection and stronger spillover are included in the scope of ecological transfer payments. The amount of funds allocated to each province is determined on the basis of the standard financial gap between the government’s revenue and expenditure in each county and combined with the special ecological and environmental protection expenditures in each county. In 2011, on the basis of the Measures for Transfer Payments to Key National Ecological Functional Zones promulgated in 2009, the scope of subsidies was adjusted to restricted development areas and prohibited development areas in the National Plan for Functional Zones as well as counties with better ecological and environmental protection. Guiding subsidies were also provided to other national ecological functional zones. On the basis of the original allocation, the provincial capital allocation quota has increased the prohibition of development zone subsidies and provincial guiding subsidies, and the subsidy coefficient is determined according to the financial status and the gap between city and county standard fiscal revenue and expenditure. In 2012, the scope of the subsidy was categorized on the basis of the 2011 data with the Sanjiangyuan Nature Reserve in Qinghai, the South-to-North Water Diversion Central Water Source Protection Zone, and the core ecological protection zone in the central mountainous area of Hainan listed separately. On the basis of the original allocation, the item “special expenditure on ecological environmental protection” was deleted, and a new subsidy was added for “funding for pilot ecological civilization demonstration projects,” to be determined in accordance with the criteria of 3 million yuan per project at the municipal level and 2 million yuan per project at the county level. Incentive subsidies should be given to areas with better ecological and environmental protection, and the subsidies for prohibited development zones are clearly determined comprehensively according to the factors such as the area and number of prohibited developments in each province.
For 2016–2022, the scope of the subsidy and the method of determining the amount of allocation has been adjusted and optimized on the basis of 2012. The scope of the subsidy was further expanded in 2016 to include counties belonging to the Beijing–Tianjin–Hebei Synergistic Development Zone, the “Two Screens and Three Belts”, and other ecological merit zones in the scope of payment. The allocation quota emphasizes the performance assessment mechanism of regional ecological protection for the first time, requiring dynamic adjustment of the fund allocation quota according to the ecological protection performance assessment status of the previous year and consequently encouraging the county (city, district) government to actively maintain regional ecological security. Second, the influence of ecological protection area and industrial development limitation on the industry is included in the calculation process of the distribution coefficient. In 2017, the target of transfer payments for ecological functional areas began shifting to the implementation of the concept of green development, and the scope of subsidies was tilted to the National Ecological Civilization Pilot Zone, National Park System Pilot Zone, and Major Ecological Project Construction Zone. Additionally, the ecological ranger subsidy project was added to the original distribution system. Moreover, the prohibited development zone subsidies and guided subsidies are inclined to the prohibited development zones dominated by national nature reserves and national forest parks. In 2018, fiscal transfers to provinces and municipalities along the Yangtze River Economic Belt, the “Three Regions and Three Prefectures”, and other deeply impoverished areas were further increased. Among them, the subsidies for provinces and municipalities along the Yangtze River Economic Belt are mainly based on factors such as the area of the red line for ecological protection and the size of the population. The subsidies for the “Three Regions and Three Prefectures” are mainly based on factors such as the proportion of the population living in poverty in the region and the amount of per capita transfers with ecological environmental protection and ecological poverty alleviation considered during the transfer process. In 2022, the scope of transfer payments has been expanded to include all relevant counties in the Beijing–Tianjin–Hebei and Hainan Provinces and counties around the Xiong’an New Area and Baiyangdian that were earlier excluded from the scope of transfer payments and will be further expanded to the scope of counties that are the focus of rural revitalization. Guided subsidies will also be provided to the areas related to the South-to-North Water Diversion Project (the water source area of the Eastern Route and the middle and lower reaches of the Han River) as well as to counties that are important in ecological functions to consider ecological environmental protection and rural revitalization (see Figure 1).
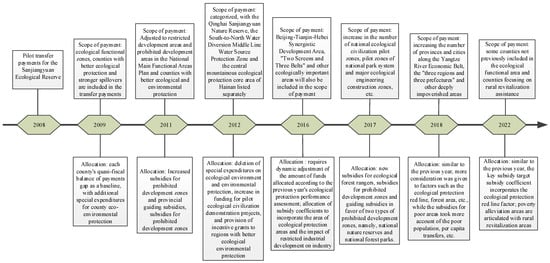
Figure 1.
Evolution of the central-to-provincial ecological fiscal transfer system, 2009–20221.
Overall, the scope of the central government’s allocation of ecological transfers to localities has been expanding annually, slowly expanding from the Sanjiangyuan in Qinghai to key ecological functional areas, namely national ecological civilization pilot zones and national park system pilot zones. The objective of transfer payments has also gradually changed from the earlier “dual objective” of environmental protection and improvement of people’s livelihoods to a more unidimensional objective of ecological civilization construction and ecological environmental protection. The transfer payment allocation method has gradually considered the inclusion of factors such as the size of ecological protection areas, the size of ecological red lines, and the degree of poverty in the allocation process. It has also been measured in grades and categorized from the basis of the standard financial shortfalls in each county as the main basis for allocation. On this basis, guiding subsidies, subsidies for ecological forest rangers, and a mechanism for assessment (i.e., reward and punishment based on ecological protection performance) have been added in an attempt to bring into play the guiding and incentivizing functions of the funds. However, the allocation method based on the standard fiscal balance gap does not fully reflect the opportunity cost loss of local governments due to ecological protection. In addition, the correlation with the demand for ecological protection remains weak. Furthermore, research scarcely considers the differences in ecological resource protection actually undertaken by localities in the process of fiscal allocation, which may somewhat affect the efficiency of the utilization of funds.
- (2)
- Hubei Province’s ecological transfer payment system to counties
The provincial-to-county ecological transfer payment system is based on the central-to-provincial ecological transfer payment system, combined with the ecological resources of the provinces (municipalities), to establish the scope of the general ecological transfer payment in the province and according to the “National Key ecological function zone transfer payment measures” to formulate the provincial ecological transfer payment measures for the county ecological function zone. For the first time, 28 counties (cities and districts) in Hubei Province were included in the national key ecological function zones. In 2017, according to the adjustment of the transfer payment scope of the national key ecological function zones, Tongshan County and Tongcheng County in Hubei Province were included in the national key ecological function zones, and a total of 30 counties (cities and districts) were included in the national key ecological function zones. In addition, in Hubei Province, based on the province’s ecological resources profile and the province’s implementation of major ecological projects’ construction areas and on the basis of the key ecological functional areas designated by the state, 18 counties (cities and districts) adjacent to the key ecological functional areas, such as Enshi City, Yangxin County, and Jingshan County, have been included in the scope of provincial-to-county general ecological transfer payments. In terms of fund allocation, the factor method is used for calculation and allocation; that is, the total number of ecological transfer payment subsidies in a county is the sum of the numbers of key subsidies, prohibited development zone subsidies, and incentives and punishments. The number of key subsidies is the sum of the previous year’s base, the current year’s allocation increment, and the phased bottom-up subsidy. The incremental allocation for the current year is obtained by multiplying the degree of financial difficulties of the county with the transfer subsidy coefficient. The phased bottom-up subsidy is mainly based on the newly incorporated ecological functional zones with no subsidy base, and the subsidy sub-item is set up to equalize the level of subsidies for the various counties. The subsidy for prohibited development zones is based on the area of national prohibited development zones in each region and is tilted in favor of two types of prohibited development zones, namely national nature reserves and national forest parks. The number of rewards and penalties and incentive grants is based on the results of the provincial ecological and environmental assessment of the counties. Those with a comprehensive assessment score lower than −1 and −0.5, respectively, shall not participate in the year’s incremental allocation of subsidies and according to the value of the proportional deduction of the subsidy base shall be liable to the implementation of penalties. The comprehensive assessment is performed with choices ranging from “generally better” to “significantly better,” to take a proportionate share of the central and provincial incentives for the implementation of incentives.
2.1.2. Allocation of Funds for Ecological Transfers
- (1)
- Ecological transfers from the central government to the provinces and their regional distribution
Since the establishment of the national key ecological function zone transfer payment system in 2008, the covered counties have increased year by year, from 221 in 2008 to 818 in 2020, an increase of roughly four times the initial rate. In addition, the coverage of provinces has also expanded from the previous 17 provinces to 31 provinces (municipalities and autonomous regions). The distribution area is primarily concentrated in the relatively backward central and western regions of China, and the number of transfer payments accounts for roughly two-thirds of the total counties. In terms of the amount of transfer payments, the period from 2008 to 2020 has also shown a roughly year-on-year increase, from 6.58 billion yuan in 2008 to 79.45 billion yuan in 2020 with a cumulative total of 603.622 billion yuan having been invested, representing an average annual increase of 30.27 per cent. The year with the fastest growth was 2010, 2.08 times that of 2009, mainly due to the implementation of the National Main Functional Areas Plan, which expanded the number of counties in which the central government implemented ecological transfers and the amount of payments. From the standpoint of the proportion of transfer payments, the amount of financial transfers to ecological functional zones as a proportion of general transfer payments has also grown from 0.70% in 2008 to 1.14% in 2020, with the largest proportion in 2010 at 2.03%; it basically stabilized at roughly 1.80% in 2011−2018 and then declined in 2019−2020. Although the amount of this ecological transfer and its share of general transfers has been gradually increasing overall, the overall size of the funds transferred is small, which is less than two percent of general transfers as shown in Figure 2.
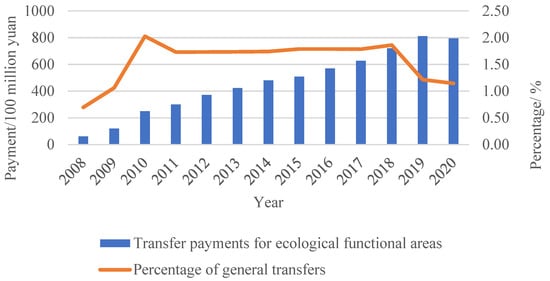
Figure 2.
Amount of central government transfers to ecological functional zones in each province and its proportion of general transfers2.
In terms of regional distribution, since the start of the pilot program in 2008, the number of provinces in which the central government has made ecological transfer payments to localities has increased from 17 provinces (municipalities and autonomous regions) in 2008 to 31 in 2012 with the focus of the funds being shifted from naturally ecologically rich areas in the central and western regions to ecologically rich areas in all provinces and territories of the country. From 2008 to 2020, the three provinces with the highest cumulative ecological transfer payments from the central government to local governments are Gansu, Guizhou, and Xinjiang, with cumulative payments of 48.712 billion yuan, 44.75 billion yuan, and 36.573 billion yuan, respectively. Whereas the three provinces (municipalities) with the lowest cumulative payments are Shanghai Municipality, Tianjin Municipality, and Jiangsu Province with cumulative payments of 321 million yuan, 472 million yuan, and 982 million yuan, respectively, with the former being the largest multiple of the latter by roughly 152 times. From the distribution structure of each region (see Figure 3), the western region receives the most ecological transfer funds, growing from 4.19 billion yuan in 2008 to 42.461 billion yuan in 2020, accounting for up to 69.23% of the national ecological transfer funds. Then, with the expansion of the scope of transfer of the ecological functional areas in 2012, the proportion it accounts for has declined, but the proportion still reaches 53.44%. The eastern region receives the least amount of ecological transfer funds with only Hainan Province being included in the scope of the transfer during the pilot period in 2008 with a transfer amount of only 27 million yuan. Then, with Shanghai, Jiangsu, Zhejiang, and other provinces being included in the scope of the transfer, the amount of transfer has increased. By 2020, the ecological transfer funds it receives as a proportion of the national ecological transfer funds has risen to 17.45%. The ecological transfer funds received by the central region have grown from 1.834 billion yuan in 2008 to 23.128 billion yuan in 2020 with the proportion of the national ecological transfer funds generally stabilizing at roughly 30 per cent. As a region rich in ecological resources and relatively backward in economic development, the central and western regions of China have taken on too much responsibility for ecological protection, resulting in limited economic development. In addition, the central government’s ecological transfers to the provinces are biased toward the central and western regions, reflecting the purpose of incentivizing local governments to maintain regional ecological environments and balancing local financial resources to narrow the gap. However, in recent years, as some provinces in the eastern region have been included in the scope of ecological transfers, the proportion of general ecological transfers received by the eastern region has gradually increased. By contrast, the proportion of financial transfers received by the central and western regions has declined. Moreover, the dilemma of insufficient financial resources of the central government and insufficient centralized transfers in the central and western regions may reduce the incentive of the central and western regions to protect the ecological environment to a certain degree.
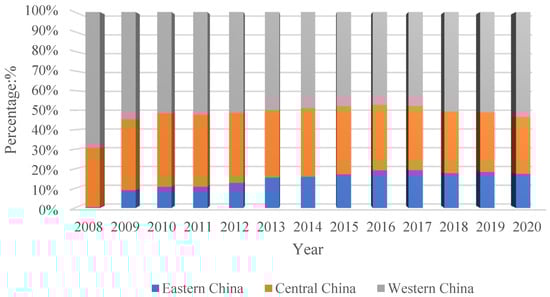
Figure 3.
Ratio of eco-transfers to total national eco-transfers received by East, Central, and West China.
- (2)
- Amount of fund transfers from Hubei Province to counties and their distribution
First, from the perspective of the scale of ecological transfer payments, the overall trend of fluctuating and increasing, from 1.282 billion in 2010 to 3.622 billion in 2020, the cumulative total of 30.778 billion yuan has been invested, with an average annual growth of 12.82%. The fastest growth was in 2011, which was 1.75 times that of 2010, mainly due to the adjustment of the scope of transfers to ecological functional zones in 2011 under the new Measures for the Transfer of Payments to National Key Ecological Functional Zones issued by the central government. The latter added subsidies for prohibited development zones and provincial-level guiding subsidies on top of the original allocations. Second, from the perspective of regional distribution of transfer payments, the ecological transfer payments in Hubei Province increased from 40 counties in 2010 to 48 counties in 2020, and the three counties with the highest cumulative ecological transfer payments were Danjiangkou City, Utopia, and Fang County, with cumulative allocations of 1.56 billion yuan, 1.318 billion yuan, and 1.279 billion yuan, respectively. The three counties with the lowest cumulative disbursements were Tuanfeng County, Yuan’an County, and Yangxin County with cumulative disbursements of 5.47 million yuan, 6.99 million yuan, and 14.31 million yuan, respectively, with the former being the largest multiple of the latter by a factor of roughly 286. with the former exceeding the latter by a factor of roughly 286. In terms of the distribution structure of each region, the region with the most ecological transfer payment is Northwest Hubei, from 925 million yuan in 2010 to 2.647 billion yuan in 2020, accounting for the proportion of the province’s ecological transfer payment fund which is basically stabilized at roughly 70%; followed by East Hubei, accounting for the proportion of the province’s ecological transfer payment fund which is basically stabilized at roughly 20%. The lowest eco-transfer funds are in the middle of Hubei, accounting for roughly 10% of the province’s eco-transfer funds (see Figure 4). As an important soil and water conservation area, water conservation area, and biodiversity protection area in Hubei Province, Northwest Hubei is also a relatively backward area in terms of the economic development of the province, which bears too much responsibility for ecological protection and leads to the limitation of economic development. Hubei Province’s ecological transfer payment to the north of Hubei Province reflects the purpose of incentivizing the local government to maintain the regional ecological environment and balance the local financial resources to narrow the gap. However, compared with the protection responsibilities borne by the northwestern region of Hubei Province, the province’s financial transfers to the region are far from being able to satisfy the cost of its ecological protection responsibilities. An example is its ecological and environmental protection expenditure cost. In 2020, the ecological and environmental protection expenditure cost of Northwest Hubei Region is 6.472 billion, while the ecological financial transfers it receives only account for 40.90%3 of its ecological and environmental protection expenditures. Additionally, matching the responsibility with the financial right is difficult, which may reduce the enthusiasm of protecting the ecological environment in the Northwest Hubei Region.
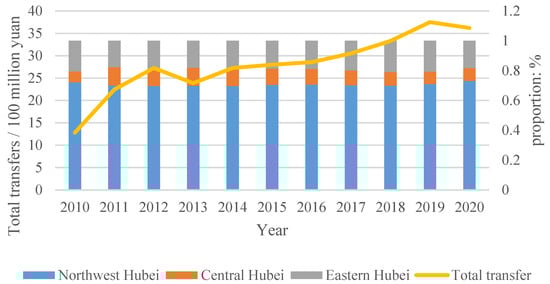
Figure 4.
Hubei Province’s eco-transfers to counties and their ratio to total eco-transfers, 2010–20204.
2.2. Mechanism Analysis of the Impact of Eco-Fiscal Transfers on Eco-Environmental Protection
As the agent of the state, the central government is responsible for making long-term planning for the maintenance of ecological security in the country and for seeking sustainable development. However, owing to the fact that the central government has high implementation costs and lacks the advantage of information collection in the process of ecological safety maintenance responsibility, it has the advantage of flexibility of supervision and adjustment of policies; therefore, the responsibility for the maintenance of ecological safety is often transferred to the local government and entrusted to the local government to carry out the implementation, that is, the responsibility for ecological protection is basically concentrated at the level of the local government [24]. However, owing to China’s current system of fiscal decentralization, fiscal revenues are shared between the central and local governments, which somewhat restricts the enthusiasm of local governments to invest their limited financial resources in environmental protection, coupled with the economic development constraints caused by territorial control. Moreover, the mismatch between fiscal rights and responsibility further aggravates their inertia in protecting the ecological environment. Therefore, implementing effective financial means to incentivize local governments to display ecological and environmental protection behaviors is necessary for the central government. As a financial governance tool from the central government downwards, eco-transfer payments are an important mechanism for it to incentivize local governments to improve the ecological environment [22,25]. Furthermore, the implementation of ecological protection has a strong positive externality. Through territorial spatial control, the local government improves the regional ecological environment, but its ecological environment improvement can also benefit the neighboring areas without compensation, leading to the neighboring local governments’ “free-riding” tendency. Such a cost-benefit mismatch of environmental protection behaviors tends to lead to the abandonment of environmental management in ecological environment protection zones and ultimately to the formation of bottom-up competition among local governments [26]. Pigou considers possible solutions through the use of taxation and subsidies, and the implementation of taxation and subsidy policies can internalize the external effects of ecological protection and achieve the consistency of individual optimization and social optimization [27]. Eco-transfer as essentially a form of subsidy policy, through the central financial institutions for the eco-protected areas to provide financial subsidies, can somewhat incentivize local governments to implement eco-environmental protection behavior.
Based on this assumption, eco-transfer payments can be seen to be a way of cracking the dilemma of the environmental protection behavior game between the central and local governments and between local governments and to realize incentives to environmental protection behavior of local governments. The main effect is manifested in two aspects: first, the ecological transfer payment can provide other financial funds for ecological protection areas, alleviate local financial pressure, enhance the economic basis for ecological construction, and help motivate local governments to implement ecological environment management and improve the ecological environment. In addition, the alleviation of local financial pressure can somewhat weaken the motivation of local governments to illegally occupy ecological resources and develop industries (because the level of ecological environment can be regarded as a minus function of industrial development). Second, eco-transfers can also compensate for local ecological protection costs and internalize the role of externalities [28]. From the viewpoint of the ecological financial transfer system, the amount of annual ecological transfer funds is also linked with the local government’s ecological protection and governance effects; the better the ecological protection and governance effects, the higher the amount of incentives they receive, which can also incentivize the local government’s ecological protection and governance enthusiasm. Under the operation logic of such ecological transfer system, its implementation can effectively improve the local ecological environment.
However, owing to the unique nature of China’s ecological transfer payment, it is a type of transfer established by the Ministry of Finance within the framework of general transfer payments. It utilizes the fiscal revenue and expenditure gap as its core indicator and incorporates ecological environment factors to allocate funds, aiming to simultaneously safeguard the ecological environment and enhance public service capacity. Although the central government has constantly emphasized ecological environmental protection as its main policy objective, it has gradually highlighted the policy orientation of “ecological civilization construction” and “ecological environmental protection”. However, considering the lack of clarity in defining the policy boundary between the dual objectives of ecology and people’s livelihoods, local governments have a greater degree of arbitrariness in the use of these funds. Therefore, the local governments’ decision to favor the use of funds for ecological environmental protection depends on the degree of importance the local governments attach to environmental protection [18,23]. A high self-emphasis on environmental protection can promote local governments to use funds for ecological protection, but they may favor the provision of other public services to develop the economy at the expense of ecological environment improvement.
As shown in Figure 5a, for the convenience of analysis, the fiscal budget of local governments between the dual objectives is regarded as the behavioral process of rational economic man who chooses consumption between consumer goods; the horizontal axis indicates that the local government spends the financial funds on other public service supply to develop the economy, and the vertical axis indicates that the local government spends the financial funds on ecological environmental protection. We assume that before obtaining ecological fiscal transfers, the local government’s fiscal budget constraint line is AB, and the corresponding utility function curve is E. After obtaining ecological fiscal transfers, if the local government’s choice preferences have not changed, its budget constraint curve is flattened from AB to A1B1, and the corresponding utility function curve is E1. If the local government emphasizes ecological environment protection, its budget constraint curves are AB1 and A1B2, and the corresponding utility function curves are F and F1. Based on points G and K, under the condition that the budgetary input of local governments for other public service provision remains unchanged, local governments that emphasize ecological environmental protection will increase the ecological environmental protection input from OQ1 to OQ2. From the comparison of GG1 and KK1, the ecological fiscal transfer funds will substantially enhance the ecological environmental protection inputs of the local governments. Similarly, as shown in Figure 5b, if the local government emphasizes improving the supply of other public services but neglects the ecological environment protection, its budget constraint curves are A1B and A2B1, and the corresponding utility function curves are S and S1. Based on points M and N, under the condition that the local government’s budgetary input for ecological environmental protection remains unchanged, the local government that emphasizes economic development will increase the ability to provide other public services from OP1 to OP2. From the comparison of MM1 and NN1, the ecological fiscal transfers will substantially increase the local government’s use of the funds for the provision of other public services while ignoring ecological environmental protection.
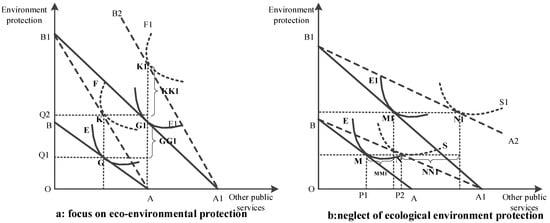
Figure 5.
Behavioral path choices of local governments.
However, the degree of importance that local governments attach to regional environmental protection depends on their own consistent development philosophy. If local governments consistently implement the development philosophy of “green water and green mountains are the mountains of gold and silver”, they may tend to use funds for environmental protection expenditures and environmental regulations. In fact, although the central government has repeatedly emphasized the building of an ecological civilization, the combination of economic decentralization and political centralization in China’s political system has led to a strong tendency for local governments to develop the economy and to have “upward responsibility” [29]. Local governments tend to sacrifice the environment in exchange for economic benefits, especially in areas with low levels of fiscal revenue; with financial difficulties; which do not have enough to make ends meet; where investing funds is easier in economic construction; and where changing the traditional concept of the use of funds by local governments is difficult in a short period of time; the latter results in the formation of the use of funds of the “flypaper effect” [30], that is, the budget constraint curve is more likely to be A1B in Figure 5b, rather than AB1 in Figure 5a. By contrast, it depends on whether the ecological transfer system implemented by the central government has incentivized local governments to pay extra attention to environmental protection. If the transfer system incentivizes local governments to pay attention to environmental protection, it may trigger local governments’ preference to use the funds for environmental protection expenditures and environmental regulation, which is the original purpose of the central government to implement the transfer system [18]. However, in terms of the centralized design of the system, incentives may be lacking. It is mainly manifested in two aspects. First, the standard establishment of ecological transfer payment is centered on the standard fiscal balance gap supplemented by the financial security coefficient for the design. It does not consider the difference in the cost of ecological protection in different regions due to the different ecological types nor completely consider the contribution of the ecological value of each ecological functional area, which is out of touch with the actual ecological value of the contribution of the various regions. The latter may further lead to the protection of ecological resources of the region in order to obtain limited funds but cannot effectively incentivize the protection of the ecological environment. Second, the reward and punishment effects of the performance appraisal system are not sufficiently incentivized.
The reward and punishment mechanism of the current system is mainly based on the change interval of the regional ecological environment quality index (significantly better, basically stable, and significantly worse) as the basis for rewards and punishments, which will lead the local government to keep the change interval of the ecological environment quality index within the corresponding range, so that no rewards and punishments will occur. Additionally, it cannot effectively incentivize the enthusiasm to improve the quality of the ecological environment. In terms of the type of transfer payment in 2020, the sum of key grants, grants for prohibited development zones, guiding grants, assessment incentives, and assessment deductions for localities amounted to 62.592 billion yuan, 6.5 billion yuan, 10.643 billion yuan, 784 million yuan, and −399 million yuan, respectively, and assessment incentives and assessment deductions accounted for less than 2% of the total amount of payment. Compared with the huge costs incurred in implementing ecological improvement, their reward and punishment effects are very limited. Therefore, in the case of the development concept centered on economic development and the insufficient incentive effect of eco-transfers, it may lead to the local government’s preference to use the limited eco-transfers to improve the supply capacity of regional public services but weakening ecological environmental protection. Therefore, the problem of “fiscal competition” lies in the distribution of funds, i.e., the A1B in Figure 5b has somewhat weakened the environmental effect of the eco-transfers. Figure 6 illustrates the specific mechanism.
Figure 6.
Mechanisms of impact of eco-transfers to improve ecosystem quality.
Accordingly, we formulate the hypothesis of this study: the current implementation of ecological financial transfers in China promotes the improvement of regional ecological environment quality. However, the extent of the promotion of the benefits may be weak possibly because the system has insufficient incentive for local governments’ ecological and environmental protection behaviors, thereby reflecting more the fund compensation effect rather than the incentive effect of the system.
3. Empirical Study
3.1. Model Construction
On the basis of theoretical analysis, this section constructs relevant econometric models to carry out empirical tests from the two levels of eco-environmental effects of eco-transfers and incentive mechanism of eco-transfers. First, the environmental protection effect of eco-transfers is explored, i.e., whether eco-transfers improve local environmental quality. Considering that under the incentive and constraint mechanism of the eco-fiscal transfer system, the quality of the eco-environment also affects the amount of per capita eco-fiscal transfers in the following year, i.e., a certain degree of endogeneity may exist among the variables. Therefore, to solve this problem with reference to related studies [31,32], a dynamic panel data model is adopted and estimated using systematic GMM estimation to eliminate possible endogeneity of the model.
The model dependent variable is the ecosystem quality index. Based on the ecological environment evaluation index system set up in the Measures for Transferring Payments to National Key Ecological Functional Areas, the indexes are selected from the two dimensions of natural ecology and environmental conditions and weighted on the basis of the panel entropy method to obtain the comprehensive index of ecological environment quality. The natural ecological dimension is characterized by the ratio of forest area, water area, wetland area, and grassland area, which is a positive indicator; the larger the value, the better the regional environmental quality. The dimension of environmental status was quantified from the perspectives of water area environmental protection and air environmental protection, and the characteristics of industrial wastewater discharge intensity and PM2.5 concentration were selected, respectively, both of which are negative indicators; the higher the value, the worse the regional ecological environment quality. The core explanatory variable is per capita ecological fiscal transfers. The specific model is constructed as follows:
where the subscripts i and t of each variable denote the region and year, respectively; and is the interpreted variable ecological environment quality index. is the ecological quality index for the lag period; is the core explanatory variable per capita ecological transfers; is a series of control variables; is a constant term; ,, and are the influence coefficients corresponding to the respective variables; and is the random error term.
Second, to further explore the incentive effect of eco-transfers, i.e., to explore whether eco-transfers changed the local government’s emphasis on environmental protection and incentivized the local government to increase environmental protection inputs and environmental regulation, a fixed-effects model was used for the empirical research. Considering that the environmental protection behaviors of local governments are also subject to the environmental protection behaviors of local governments in neighboring regions, i.e., under the driving mechanism of the governmental hierarchical system and the “political championship”, the local governments, when faced with the opportunities for economic development in neighboring regions due to the implementation of behaviors such as lowering the thresholds of enterprise entry and environmental regulation, will also produce imitation and competition effects and thus form “bottom-up competition” in environmental protection behaviors [26,33]. Therefore, the spatial lag term of local government environmental protection is added to the model to characterize the spillover of local government environmental protection behaviors.
The model dependent variable is local government environmental protection behavior, which is characterized by two dimensions. First, it is characterized by the ratio of the local government’s environmental protection expenditure to the local general public budget revenue5; the larger the value, the more importance the local government attaches to environmental protection. Second, it is characterized by the strength of environmental regulation by local governments; the greater the strength of environmental regulation, the greater the importance the local governments attach to environmental protection. The core explanatory variable is per capita ecological fiscal transfers. The specific design of the model is as follows:
where is the spatial spillover effect of local environmental protection importance; is the spatial spillover effect of local government environmental behavior; and is the spatial weight matrix. This study adopts a gravitational spatial weight matrix characterization, which is the weight of the integrated geographic distance and economic linkage. This spatial weight matrix, compared with the spatial weight matrix based on adjacency, distance function, and discrete points which are mostly used in the existing research, effectively quantifies the following objective reality: the spatial–strategic interaction effect of the environmental protection behaviors of the inter-governments is gradually weakening with the increase in the distance between two places; additionally, it considers the effect of the economic interaction of the inter-governments on these behaviors [34,35]. In general, the closer the economic interaction, the more obvious the interaction effect of spatial strategy of environmental protection behavior between governments. The weighting formula is as follows:
where and denote the average GDP per capita in regions i and j, respectively; is the distance between the two places; and is the correction factor.
characterizes the incentive effect of ecological transfers on the importance of local environmental protection; and are the individual fixed effects and time fixed effects, respectively; is the environmental protection behavior of local governments, characterized by the ratio of local government environmental protection expenditures to local general public budget revenues and the strength of local government environmental regulations, in which the calculation of environmental regulation intensity (ERI), this paper adopts the “three waste” emission composite index to characterize it based on the practice of Zhou et al. [36] and Wang et al. [37]. The formula is as follows:
where is the relative emission intensity of the j-th pollutant in the t-th year of region i (j = 1, 2, 3); is the emission of the j-th pollutant in the t-th year of region i; is the value of secondary sector output in the t-th year of region i; is a composite index of the relative emission intensity of the “three wastes” for region i in the t-th year; is the environmental regulation intensity index of region i in the t-th year; the larger the value, the stronger the environmental regulation of the local government; n is the number of study units.
Control variables (): based on the research of relevant scholars [16,23,38] and data availability, GDP per capita (pgdp), industrial structure (ins), urbanization level (urb), population density (pop), urban-rural income disparity (ucig), and financial self-sufficiency (fs) are selected for characterization. GDP per capita reflects the level of economic development of the region, according to Kuznets’ inverted U-shaped hypothesis of environmental pollution; when the economic development of the region is low, the local government will make sacrifices at the expense of the environment to develop the economy. Nonetheless, with the development of the economy, the residents with demands for high-quality life for the improvement of the local government will also be prompted to increase the governance of environmental protection. The industrial structure is characterized by the proportion of the output value of the secondary industry, and a high proportion of the output value of the secondary industry reflects the local government’s thinking and mode of industrial development, which has an impact on the quality of the regional environment and the government’s governance behavior. The promotion of urbanization will accelerate encroachment on ecological resources (wetlands, forests, and waters, etc.) and increase pollution emissions. It will also force local governments to increase investment in public service provision, resulting in the crowding out of environmental protection expenditures and affecting the improvement of the regional ecological environment. Population density somewhat reflects the local environmental carrying pressure; higher population density indicates that the regional ecological environment is also more costly and may be subjected to a greater degree of destruction. Additionally, higher population density indicates that the regional demand for ecological products will increase, forcing the local government to increase the supply of ecological products. The urban–rural income gap is characterized by the ratio of disposable income per capita of urban residents to net income per capita of rural residents; the wider the gap between urban and rural incomes, the greater the encroachment on local ecological resources and the destruction of the ecological environment by farmers to increase their incomes, which indirectly leads to a decline in the quality of the regional ecological environment. The financial self-sufficiency rate is characterized by the ratio of general budget revenues to general budget expenditures, which reflects the local government’s own financial status. The latter affects the amount of investment in environmental protection. In addition, the local government’s excessive pursuit of balanced financial status may weaken the willingness to spend on environmental protection.
3.2. Data Sources and Descriptions
This study takes the first 40 counties in Hubei Province that received ecological transfer payments from 2010 to 2020 as the research sample. The data of forest area, water area, and grassland area share come from China’s 30 m annual land cover classification product CLCD (1990–2020) published by Yang and Huang of Wuhan University in “Earth System Science Data” [39]. The PM2.5 concentration data were obtained from the raster data of global annual average PM2.5 concentration published by the Atmospheric Composition Analysis Group Center of Dalhousie University (https://sites.wustl.edu/acag/datasets/surface-pm2-5/, accessed on 7 October 2022). Based on ArcGIS10.2, the annual dataset was spatially corrected, and the corrected data were cropped and partitioned by matching the vector data of the administrative divisions of Hubei Province, which were resolved into the annual average data of 40 counties in Hubei Province (μg/m3). The data on ecological transfer payments for counties (cities and districts) were obtained from the project investigation of the Hubei Provincial Department of Finance. The emissions of the “three wastes” and the environmental protection expenditure of local governments and the control variables are obtained from the statistical yearbook of the city of each county, the county statistical yearbook, the financial budget and final accounts report, and the statistical communique of national economic and social development. In view of the absence of the “three waste” emissions of individual counties in certain years, the “three waste” emissions of the municipalities of the county are used as the base, and the ratio of the industrial output value above the scale of the county to the industrial output value above the scale of the municipalities of the county is used as a reasonable supplement. In addition, to eliminate the effect of price and to satisfy the normal distribution characteristics of the data, the data of the relevant variables were deflated and the natural logarithm was taken.
3.3. Analysis of Empirical Results
3.3.1. Ecological Protection and Incentive Effects of Eco-Transfers
Given that the lagged term of the explanatory variables is introduced as an explanatory variable in the model of the environmental protection effect of ecological transfer payments, a dynamic panel data model is constructed, but estimating the model by using the fixed or random effect model is inappropriate. Therefore, estimating the model using the systematic GMM method is more effective [40,41]. In terms of the environmental effects of ecological transfers, the p-value of AR(2) in model (1)-model (2) is greater than 0.10, indicating that no significant autocorrelation is found in the test of second-order autocorrelation, i.e., the original hypothesis that the model is not second-order serially correlated is valid, and the model is set up reasonably. Additionally, the Sargan test p-values are greater than 0.10, indicating that the instrumental variables set in the model are valid. The estimation results show that the coefficients of the lagged terms of the ecological environment quality index are all significantly positive in the model, which indicates that the setting of the dynamic panel model to explore the impact of ecological transfers on ecological environment quality is more symbolic of the actual situation. It also indicates that the ecological environment quality in the current period is dependent on the ecological environment effect generated by the ecological transfers in the previous period and the environmental protection behaviors of the local governments. Therefore, the implementation of the eco-transfer policy should focus on the long-term process and should incorporate a dynamic assessment mechanism into the eco-transfer mechanism. The coefficient of the core explanatory variable-per capita ecological transfer payment passes the significance test, indicating that the ecological transfer payment helps improve the regional ecological environment quality, but the absolute value of the regression coefficients is small; they are all lower than 0.020, and with the gradual increase in the control variables, the regression coefficient values are smaller. It shows that the currently implemented ecological transfer payment helps improve the regional ecological environment quality, but the improvement effect is limited, which is consistent with the theoretical hypothesis proposed in this study. From the standpoint of each control variable, GDP per capita and ecological environment quality show a positive correlation, indicating that each local government is gradually discarding the road toward rough economic development, stepping into the inflection point of a win-win situation between the level of economic development and the quality of the ecological environment, and is on the right side of the environmental Kuznets curve. Industrial structure, urbanization level, and population density are all significantly negatively correlated with ecological environment quality, indicating that increases in the proportion of secondary industry, urbanization level, and population density are somewhat detrimental to the improvement of regional ecological environment quality.
While eco-transfers have helped improve regional ecological quality at the county level, the effect of improving regional ecological quality has been limited. Therefore, what exactly is the reason for the result? Based on the previous theoretical analysis, the ecological transfer payments can influence the local government’s environmental protection behavior and the incentives to increase the local environmental protection investment and environmental regulation. The increase in both efforts can drive and pry the whole society’s environmental protection behavior and the formation of social synergy while jointly promoting the improvement of the regional ecological environment quality. Therefore, this study further portrays the local governments’ emphasis on environmental protection from the dimensions of the proportion of environmental protection expenditures and the strength of environmental regulation to explore whether eco-transfers incentivize the local governments’ emphasis on environmental protection.
First is from the dimension of environmental protection expenditure ratio portraying the degree of importance attached to environmental protection by local governments. The coefficient of ecological transfer payment on the behavior of local government’s environmental protection expenditure is significantly positive (see Table 1), but the absolute value of the coefficient is low, and the coefficient size is only 0.058. This finding indicates that the ecological transfer payment can somewhat promote the local government’s environmental protection expenditure, but the effect of promotion is insignificant. In addition, it may be more reflective of the compensatory effect of the funds. Second is from the dimension of environmental regulation strength that portrays the degree of importance the local governments attach to environmental protection. The coefficient of the behavior of ecological transfer payments and local government environmental regulation is significantly positive, which indicates that ecological transfer payments at the county level somewhat incentivize county-level local governments to increase environmental regulation, but the absolute value of the coefficient is relatively small. This finding indicates that ecological transfer payments can somewhat increase environmental regulation, but the promotional effect is also insignificant. That is, eco-transfers can somewhat incentivize local governments to increase the share of environmental protection expenditures and environmental regulation, but the incentive effect is limited. In summary, ecological transfers are not sufficiently incentivizing local governments’ ecological and environmental protection behaviors, verifying the hypothesis of this study.

Table 1.
Ecological protection and incentive effects of eco-transfers.
In terms of the interaction effect of the spatial strategies of environmental protection behaviors among governments, the behavior of environmental protection expenditures as a percentage of expenditures at the county level shows a significant positive correlation, indicating that the environmental protection expenditures of the neighboring governments have a positive spillover effect on the environmental protection expenditures of the local governments, i.e., increasing environmental protection expenditures by the neighboring governments can promote the local governments to increase their expenditures on environmental protection as well. Therefore, for the provincial government, it should further enhance the incentive effect of ecological transfer payment to the county government and promote it to increase the investment in environmental protection. With such efforts, it can further drive the environmental protection investment behavior of the government of the neighboring areas and play the multiplier effect of the ecological transfer payment funds. By contrast, the behavior of environmental regulation efforts shows a negative correlation at the county level, i.e., neighboring governments somewhat increase their environmental regulation efforts but rather inhibit the local government’s environmental regulation efforts. The possible reason for this phenomenon is that environmental regulations are mainly targeted at enterprises, and increased environmental regulations in neighboring regions force polluting industries to move to neighboring regions. By contrast, neighboring regions, with insufficient incentive effects of transfer payments, will reduce environmental regulations to receive industry transfers from neighboring regions for the purpose of economic development. Therefore, in the process of ecological and environmental governance, emphasis should be placed on integrated promotion; each local government should set the corresponding threshold for the transfer of industries from neighboring regions to force enterprises to optimize their production technologies and reduce the redundancy of pollutants.
3.3.2. Heterogeneity Analysis of Ecological Protection and Incentive Effects of Eco-Transfers
The research aims to further reveal the difference in local government’s environmental protection consciousness in the process of ecological transfer payment’s influence on ecological environment quality and the difference in ecological transfer payment fund scale’s influence on local government’s environmental protection behavior. In this subsection, based on the above analysis and the size of per capita environmental protection expenditure and the size of per capita ecological functional area transfer funds, the ecological transfer counties in Hubei Province are divided into the “higher environmental protection awareness group” and “lower environmental protection awareness group” and “higher transfer payment group” and “lower transfer payment group” to test their heterogeneity, respectively. Compared with the group with lower emphasis on environmental protection, the group with higher emphasis on environmental protection has a relatively higher effect of eco-transfers on ecological environment quality (0.027 > 0.011) (see Table 2), which indicates that local government’s emphasis on environmental protection plays an important role in the process of eco-transfers to improve the quality of the ecological environment in the region. That is, the more local governments pay attention to environmental protection, the more obvious the “bias” of their environmental protection expenditures and the more significant the improvement of regional ecological environment. From the perspective of the test of transfer size heterogeneity, the effect of ecological transfers on the local government’s emphasis on environmental protection in the higher transfer size group is significantly positive, whereas the effect of ecological transfers on the local government’s emphasis on environmental protection in the lower transfer size group is negative. The heterogeneity of the coefficients of the two groups somewhat explains the lower incentive effect of ecological transfers on the local environmental protection emphasis in the overall analysis of the full sample. In addition, it shows the difference in the impact of the ecological transfer fund size on the environmental protection behavior of local governments, i.e., increasing the transfer size is somewhat conducive to promoting local governments to enhance the importance of environmental protection, and the incentive effect is more significant. Based on the heterogeneity test, the reason for the insufficient effect of eco-transfers to improve the quality of the ecological environment may originate from the insufficient attention paid to environmental protection by the local government. One of the reasons for the insufficient attention paid to environmental protection by the local government may be due to the small scale of eco-transfer funds. Therefore, increasing the scale of eco-transfer funds and incentivizing local governments to pay attention to environmental protection should be the direction of optimizing the eco-transfer system in the future.
Table 2.
Heterogeneity analysis of ecological protection and incentive effects of eco-transfers.
4. Conclusions
4.1. Main Conclusions
The transfer payment system for ecological functional areas can somewhat promote the improvement of regional ecological environment quality, but the promotion effect is insignificant because the transfer payment system lacks adequate incentives for local government ecological and environmental protection behaviors, restricting the environmental protection expenditures and environmental regulation efforts. The transferred financial funds are more a kind of financial compensation effect. Compared with the group with lower emphasis on environmental protection, the ecological transfer payments of the group with higher emphasis on environmental protection have a relatively higher effect on the ecological environment quality, i.e., the higher the emphasis on environmental protection of the local government, the more obvious its environmental protection expenditures and the more significant the improvement of the ecological environment in the region. However, the scale of ecological transfer payment has a different impact on the environmental protection behavior of local governments; the larger the scale of transfer payment, the more conducive it is to promote local governments to pay extra attention to environmental protection. Moreover, the incentive effect is more significant.
4.2. Financial Compensation Effects of Ecological Fiscal Transfers
According to the above analysis results, the currently implemented ecological transfer payment helps improve the regional ecological environment quality, but the improvement effect is limited. This scenario may probably be due to the fact that ecological transfer payments do not effectively incentivize local governments to strengthen environmental protection but have more of a financial compensation effect. In China’s current financial decentralization system, local governments are faced with a mismatch between financial power and expenditure responsibility, resulting in local governments becoming prone to financial difficulties and in the political system of political centralization, which causes the local government to have a strong tendency to develop the economy and show “upward responsibility”. In the limited financial situation, the local government’s behavioral choices have a distorting effect, resulting in the lack of incentives for the transfer of funds. From 2012–2019, the Ministry of Finance and the Ministry of Ecology and Environment issued an annual “Circular on the Results of Monitoring, Evaluation and Assessment of the Ecological Environment Quality of National Key Ecological Function Counties”. Moreover, the annual percentage of counties with better ecological environment quality is only roughly 10%. The ecological environment quality of the vast majority of counties has basically remained stable with an annual percentage of roughly 80%. The ecological environment quality of the counties with worse ecological environment quality accounts for roughly 10%, and the results of this assessment somewhat reflect the effect of ecological transfers to improve the quality of ecological environment of the region which is limited.
4.3. Constructing an Ecological Financial Transfer System Based on the Contribution of Ecological Value
Based on the evolution of the eco-transfer system, although the design concept and measurement method of the current eco-transfer system somewhat reflects regional ecological indicators, the key subsidies, with the standardized fiscal revenue and expenditure gap as the determining indicator, account for roughly 75% of the total transfer funds, and the ecological environment factor as the adjusting parameter has limited influence on the actual distribution of the results. Furthermore, it does not consider the difference in the cost of ecological protection in different areas due to different ecological types, geographic locations, and regional characteristics, nor does it fully examine the ecological value contribution of each ecological functional area. The latter does not better reflect the differentiated ecological value of the local area, which is unfair to the areas with high intensity of territorial spatial control and areas with high ecological value contribution. Moreover, the guiding effect of “High quality and high price, more work and more gain” is not enough, which restricts the incentives for ecological protection. To be truly effective in practice, the ecological fiscal transfer system, as a fiscal governance tool, must form a set of institutional systems based on fiscal theory and ecological and environmental economic theory and then select a reasonable point of correlation as a breakthrough to improve the efficiency of the system’s implementation. Additionally, based on the above heterogeneous empirical exploration, the expansion of the scale of transfer payments is conducive to promoting local governments to enhance the importance of environmental protection and improve the ecological environment quality. Therefore, in the process of implementing ecological financial transfers from province to county, the concept of ecological value contribution can be incorporated into the fund allocation process. The study also suggests considering a reconstruction of the current ecological transfer measurement and allocation method based on the ecological value contribution to increase the amount of ecological financial transfer to ecologically rich areas and to practically incentivize the enthusiasm of local governments for environmental protection.
4.4. Research Limitations and Prospects
In this study, to quantify the key variable of ecological environment quality in a more reasonable way. We constructed a comprehensive index characterizing ecological environment quality by weighting the indicators selected from two dimensions, namely natural ecology and environmental conditions. Although this approach somewhat solves the current problem of quantifying ecological environmental quality in a single dimension, the index system is common to each ecological functional area, and its characteristic indexes are excluded from the evaluation index system. By contrast, the combination of common and characteristic indexes to quantify ecological environmental quality better reflects the actual situation of regional ecological environmental protection. Future research can consider the ecological characteristics of different ecological functional zones and incorporate the characteristic indicators into the ecological environment quality evaluation system. In addition, to explore the mechanism of ecological financial transfers on the ecological environment, on the basis of theoretical analysis, this study constructed a dynamic panel data model to find empirical evidence with 40 counties in Hubei Province as the research sample. It then verified the research hypotheses put forward during the theoretical analysis process, which is somewhat reasonable. However, some differences exist in the ecological financial transfer mechanism of different provinces and the cost of ecological protection in different regions. Thus, future research needs to further explore whether this research hypothesis can be verified in other provinces or regions.
Author Contributions
M.L.: Methodology, Software, Writing—original draft. Y.X.: Software, Data curation, Writing—review and editing. A.Z.: Funding acquisition, Project administration. All authors have read and agreed to the published version of the manuscript.
Funding
This research was funded by the National Natural Science Foundation of China (71873053), and The APC was funded by Institutional Open Access Program.
Data Availability Statement
The datasets used and/or analyzed during the current study are available from the corresponding author on reasonable request.
Conflicts of Interest
The authors declare no conflicts of interest.
Notes
| 1 | Organized by the authors based on the “Measures for Transferring Payments from the Central Government to Local Key Ecological Functional Areas” in previous years. |
| 2 | Data from the Ministry of Finance of the People’s Republic of China public survey data, the same below. |
| 3 | Data from author’s calculations based on aggregation of municipal statistical yearbooks. |
| 4 | The data come from the public survey data of the Finance Department of Hubei Province. |
| 5 | The environmental protection expenditure category of local governments includes environmental monitoring and supervision expenditure, pollution control expenditure, natural ecology protection expenditure, pollution reduction expenditure, natural forest protection project expenditure, energy conservation and utilization as well as renewable energy and comprehensive utilization of resources, and other expenditures, which can better characterize the environmental protection behavior of local governments. |
References
- Saddique, N.; Mahmood, T.; Bernhofer, C. Quantifying the impacts of land use/land cover change on the water balance in the afforested River Basin, Pakistan. Environ. Earth Sci. 2020, 79, 448. [Google Scholar] [CrossRef]
- Gaur, S.; Mittal, A.; Bandyopadhyay, A.; Holman, I.; Singh, R. Spatio-temporal analysis of land use and land cover change: A systematic model inter-comparison driven by integrated modelling techniques. Int. J. Remote Sens. 2020, 41, 9229–9255. [Google Scholar] [CrossRef]
- Bongaarts, J. Summary for policymakers of the global assessment report on biodiversity and ecosystem services of the Intergovernmental Science-Policy Platform on Biodiversity and Ecosystem Services. Popul. Dev. Rev. 2019, 45, 680–681. [Google Scholar] [CrossRef]
- Liu, W.W.; Guo, Z.L.; Jiang, B.; Lu, F.; Wang, H.N.; Wang, D.A.; Zhang, M.Y.; Cui, L.J. Improving wetland ecosystem health in China. Ecol. Indic. 2020, 113, 106184. [Google Scholar] [CrossRef]
- Chen, M.K.; Tan, Y.; Xu, X.B.; Lin, Y.Y. Identifying ecological degradation and restoration zone based on ecosystem quality: A case study of Yangtze River Delta. Appl. Geogr. 2024, 162, 103149. [Google Scholar] [CrossRef]
- Shiferaw, M.; Kebebew, Z.; Gemeda, D.O. Effect of forest cover change on ecosystem services in central highlands of Ethiopia: A case of Wof-Washa forest. Heliyon 2023, 9, e18173. [Google Scholar] [CrossRef]
- Sheergojri, I.A.; Rashid, I.; Ul Rehman, I. Systematic review of wetland ecosystem services valuation in India: Assessing economic approaches, knowledge gaps, and management implications. J. Environ. Stud. Sci. 2024, 14, 167–179. [Google Scholar] [CrossRef]
- Aziz, T. Accounting impacts of renewable energy expansions on ecosystem services to balance the trade-offs. Sci. Total Environ. 2023, 879, 162990. [Google Scholar] [CrossRef]
- Ouyang, Z.; Zheng, H.; Xiao, Y.; Polasky, S.; Liu, J.; Xu, W.; Wang, Q.; Zhang, L.; Xiao, Y.; Rao, E.M.; et al. Improvements in ecosystem services from investments in natural capital. Science 2016, 352, 1455–1459. [Google Scholar] [CrossRef]
- Shang, W.X.; Gong, Y.C.; Wang, Z.J.; Stewardson, M.J. Eco-compensation in China: Theory, practices and suggestions for the future. J. Environ. Manag. 2018, 210, 162–170. [Google Scholar] [CrossRef]
- Busch, J.; Ring, I.E.; Akullo, M.; Amarjargal, O.; Borie, M.; Cassola, R.S.; Cruz-Trinidad, A.; Droste, N.; Haryanto, J.T.; Kasymov, U.; et al. A global review of ecological fiscal transfers. Nat. Sustain. 2021, 4, 756–765. [Google Scholar] [CrossRef]
- Kumar, S.; Managi, S. Compensation for environmental services and intergovernmental fiscal transfers: The case of India. Ecol. Econ. 2009, 68, 3052–3059. [Google Scholar] [CrossRef]
- Santos, R.; Ring, I.; Antunes, P.; Clemente, P. Fiscal transfers for biodiversity conservation: The Portuguese Local Finances Law. Land Use Policy 2012, 29, 261–273. [Google Scholar] [CrossRef]
- Droste, N.; Ring, I.; Santos, R.; Kettunen, M. Ecological Fiscal Transfers in Europe—Evidence-Based Design Options for a Transnational Scheme. Ecol. Econ. 2018, 147, 373–382. [Google Scholar] [CrossRef]
- Zhang, C.J.; Chen, Y.X. Eco-transfer payments and local governments’ incentives for environmental governance. J. Wuhan Univ. (Philos. Soc. Sci. Ed.) 2021, 74, 158–173. [Google Scholar]
- Gong, C.G.; Zhang, J.H.; Liu, H. Do industrial pollution activities in China respond to ecological fiscal transfers? Evidence from payments to national key ecological function zones. J. Environ. Plan. Manag. 2021, 64, 1184–1203. [Google Scholar] [CrossRef]
- Li, S.R.; Xue, G. Environmental protection incentive effect of sub-provincial ecological transfer payment system. Chin. J. Popul. Resour. Environ. 2022, 32, 138–145. [Google Scholar]
- Miu, X.L.; Zhao, Y.S. The impact of transfer payments in ecological function areas on ecological environment improvement: Financial compensation or institutional incentives? Financ. Res. 2019, 5, 17–32. [Google Scholar]
- Cao, H.J.; Qi, Y.; Chen, J.W.; Shao, S.; Lin, S.X. Incentive and coordination: Ecological fiscal transfers’ effects on eco-environmental quality. Environ. Impact Assess. 2021, 87, 106518. [Google Scholar] [CrossRef]
- Li, Y.; Li, B.L.; Qi, J.L. Comparative analysis of county-level changes in ecosystem patterns due to transfer payments in national key functional areas. Acta Ecol. Sin. 2022, 42, 4369–4378. [Google Scholar]
- Cao, L.; Wang, M.Y.; Lei, S.J. Evaluation of environmental effects of eco-transfer policies based on quasi-natural experiments. Environ. Sci. Res. 2022, 35, 2627–2638. [Google Scholar]
- Jin, S.T.; Jiang, A.L.; Bao, B.F. Can China’s transfer payment in key ecological function areas reduce the carbon intensity? Quasi-Natural experimental evidence from Jiangxi, China. Ecol. Indic. 2023, 154, 110537. [Google Scholar] [CrossRef]
- Cheng, Y.H.; Ma, B.; Sun, Y.D. Does central ecological transfer payment enhance local environmental performance? Quasi-experimental evidence from China. Ecol. Econ. 2023, 212, 107920. [Google Scholar] [CrossRef]
- Su, X.Y. Exploration of transfer payment mechanism under the threshold of sharing common rights and expenditure responsibility. Econ. Probl. 2022, 6, 30–34+66. [Google Scholar]
- Richter, L.L.; Pollitt, M.G. Which smart electricity service contracts will consumers accept? The demand for compensation in a platform market. Energy Econ. 2018, 72, 436–450. [Google Scholar] [CrossRef]
- Hartter, J.; Ryan, S.J. Top-down or bottom-up? Decentralization, natural resource management, and usufruct rights in the forests and wetlands of western Uganda. Land Use Policy 2010, 27, 815–826. [Google Scholar] [CrossRef]
- Edenhofer, O.; Franks, M.; Kalkuhl, M. Pigou in the 21st Century: A tribute on the occasion of the 100th anniversary of the publication of The Economics of Welfare. Int. Tax Public Financ. 2021, 28, 1090–1121. [Google Scholar] [CrossRef] [PubMed]
- Lin, B.Q.; Zhu, J.P. Fiscal spending and green economic growth: Evidence from China. Energy Econ. 2019, 83, 264–271. [Google Scholar] [CrossRef]
- Blanchard, O.; Shleifer, A. Federalism with and without political centralization: China versus Russia. IMF Staff Pap. 2001, 48, 171–179. [Google Scholar] [CrossRef]
- Fu, M.J. Twenty years of tax separation system: Evolutionary lineage and reform direction. Sociol. Res. 2016, 31, 215–240. [Google Scholar]
- Dagar, V.; Khan, M.K.; Alvarado, R.; Rehman, A.; Irfan, M.; Adekoya, O.B.; Fahad, S. Impact of renewable energy consumption, financial development and natural resources on environmental degradation in OECD countries with dynamic panel data. Environ. Sci. Pollut. Res. 2022, 29, 18202–18212. [Google Scholar] [CrossRef] [PubMed]
- Bozatli, O.; Akca, H. The effects of environmental taxes, renewable energy consumption and environmental technology on the ecological footprint: Evidence from advanced panel data analysis. J. Environ. Manag. 2023, 345, 118857. [Google Scholar] [CrossRef]
- Kunce, M.; Shogren, J.F. On interjurisdictional competition and environmental federalism. J. Environ. Econ. Manag. 2005, 50, 212–224. [Google Scholar] [CrossRef]
- Lewis, W.; DiFurio, F. Using a SLX Model to Examine the Impact of the Great Recession on Poverty in South Carolina. J. Poverty 2022, 26, 567–586. [Google Scholar] [CrossRef]
- Vega, S.H.; Elhorst, J.P. The Slx Model. J. Reg. Sci. 2015, 55, 339–363. [Google Scholar] [CrossRef]
- Zhou, Y.; Zhu, S.J.; He, C.F. How do environmental regulations affect industrial dynamics? Evidence from China’s pollution-intensive industries. Habitat. Int. 2017, 60, 10–18. [Google Scholar] [CrossRef]
- Wang, F.Y.; Sun, Z.Y. Does the Environmental Regulation Intensity and ESG Performance Have a Substitution Effect on the Impact of Enterprise Green Innovation: Evidence from China. Int. J. Environ. Res. Public Health 2022, 19, 8558. [Google Scholar] [CrossRef]
- Zhang, M.M.; Kafy, A.A.; Ren, B.; Zhang, Y.W.; Tan, S.K.; Li, J.X. Application of the Optimal Parameter Geographic Detector Model in the Identification of Influencing Factors of Ecological Quality in Guangzhou, China. Land 2022, 11, 1303. [Google Scholar] [CrossRef]
- Yang, J.; Huang, X. The 30 m annual land cover dataset and its dynamics in China from 1990 to 2019. Earth Syst. Sci. Data 2021, 13, 3907–3925. [Google Scholar] [CrossRef]
- Eugster, F. Endogeneity and the Dynamics of Voluntary Disclosure Quality: Is there Really an Effect on the Cost of Equity Capital? Contemp. Account. Res. 2020, 37, 2590–2614. [Google Scholar] [CrossRef]
- Park, S. The impact of FDI restrictions on tourism growth. Tour. Econ. 2024, 30, 262–266. [Google Scholar] [CrossRef]
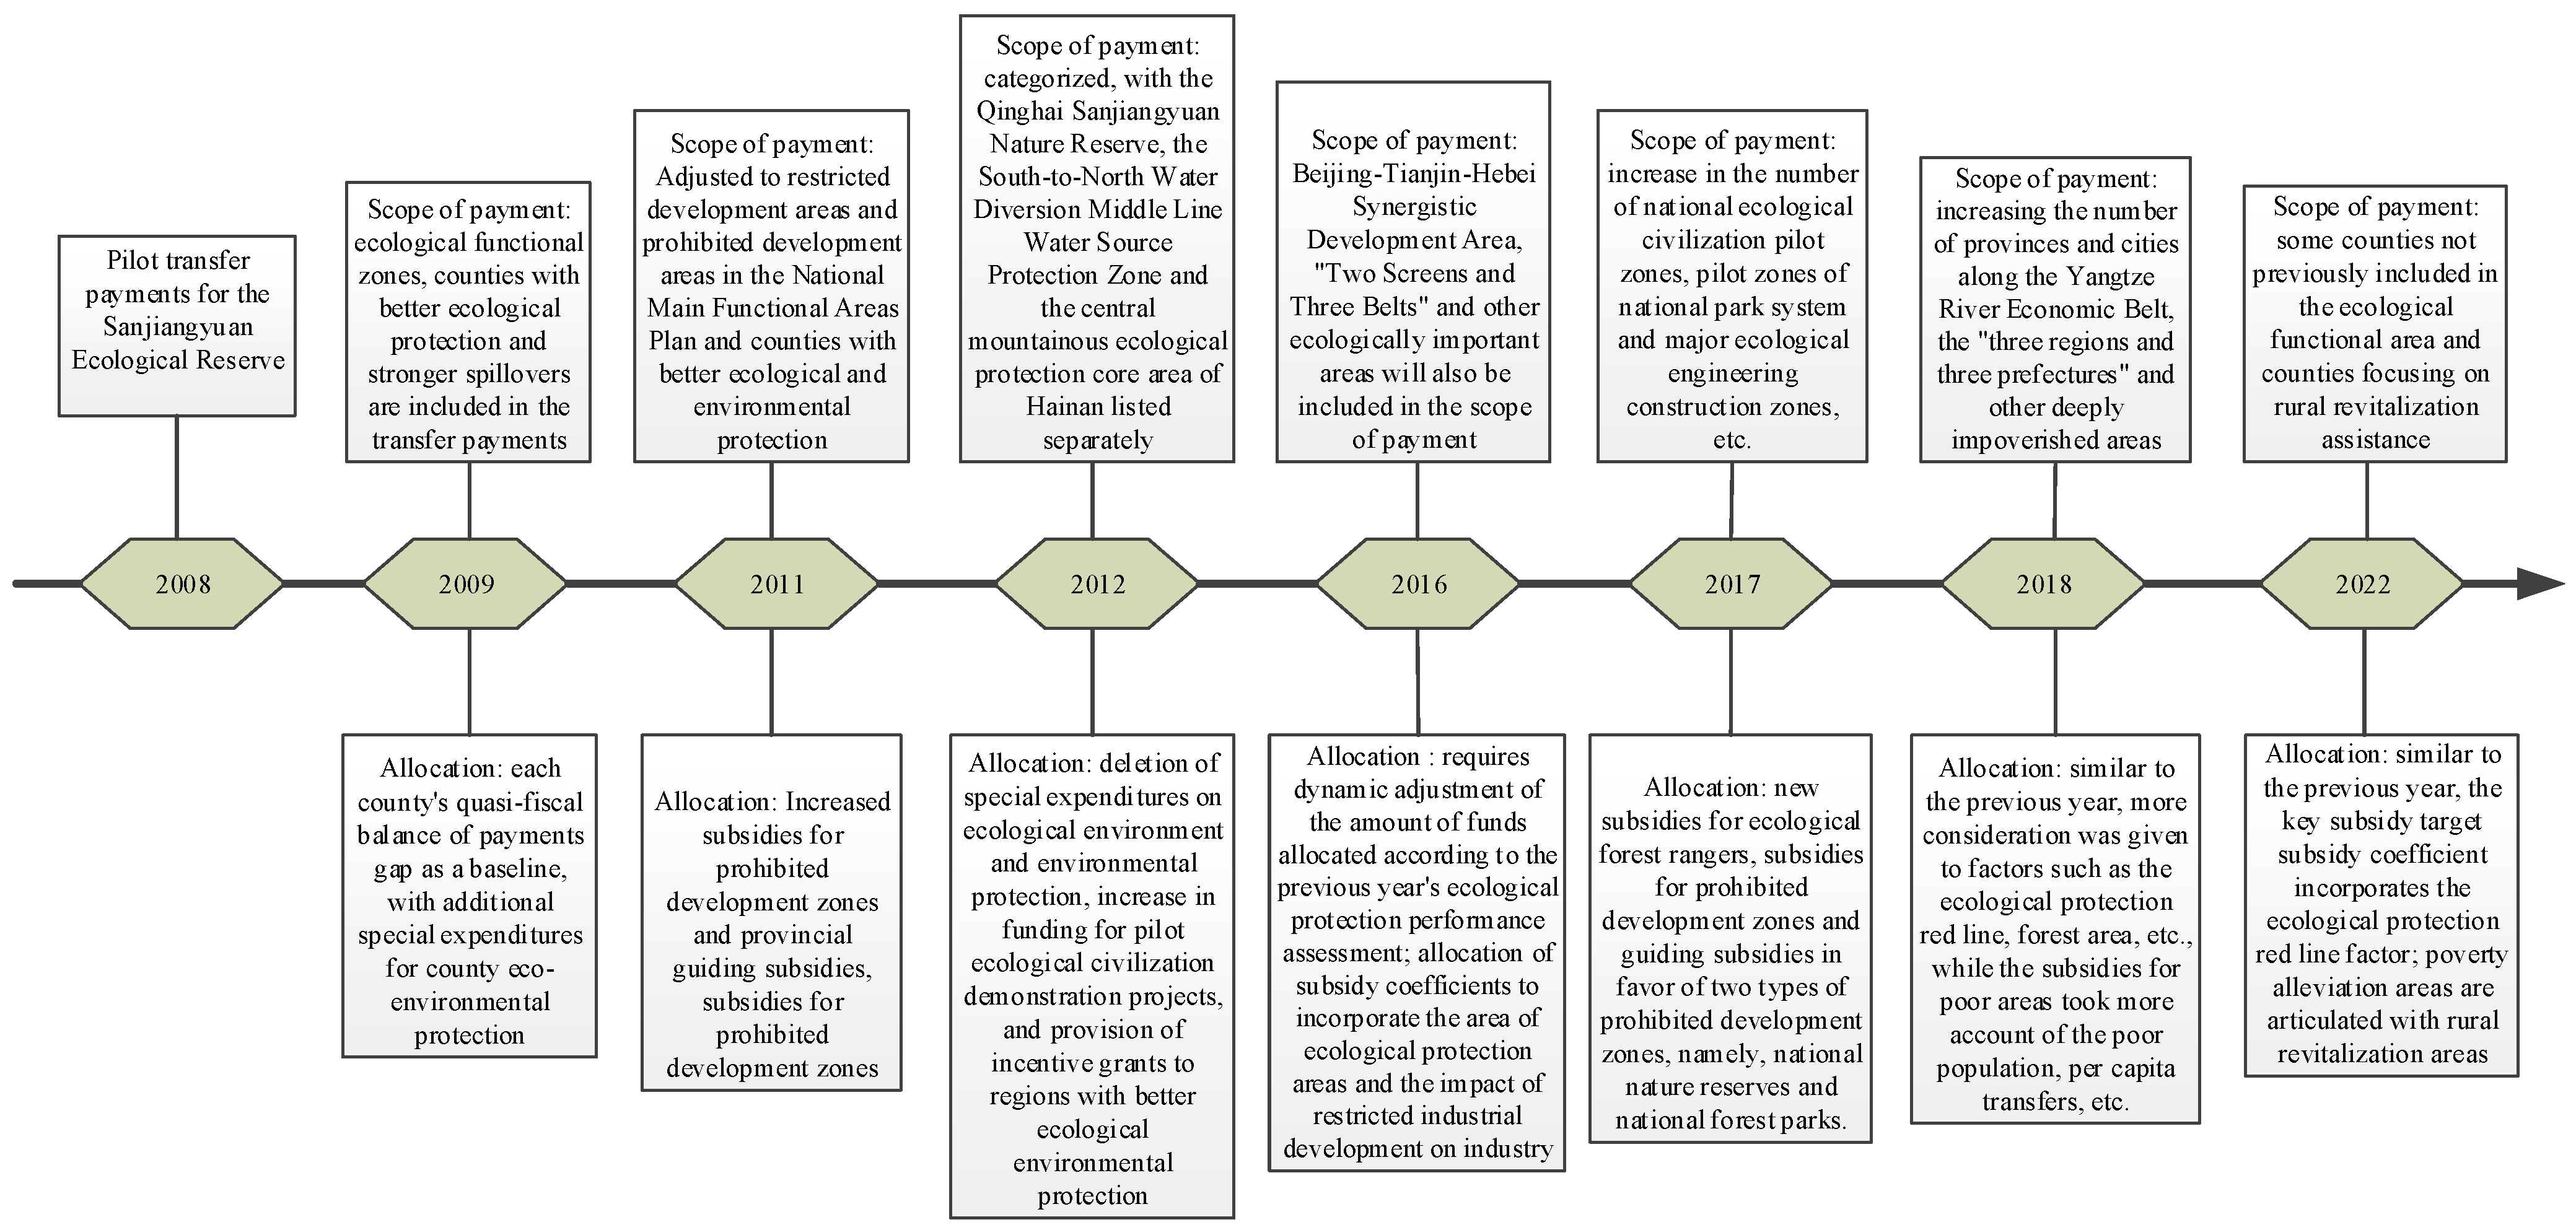


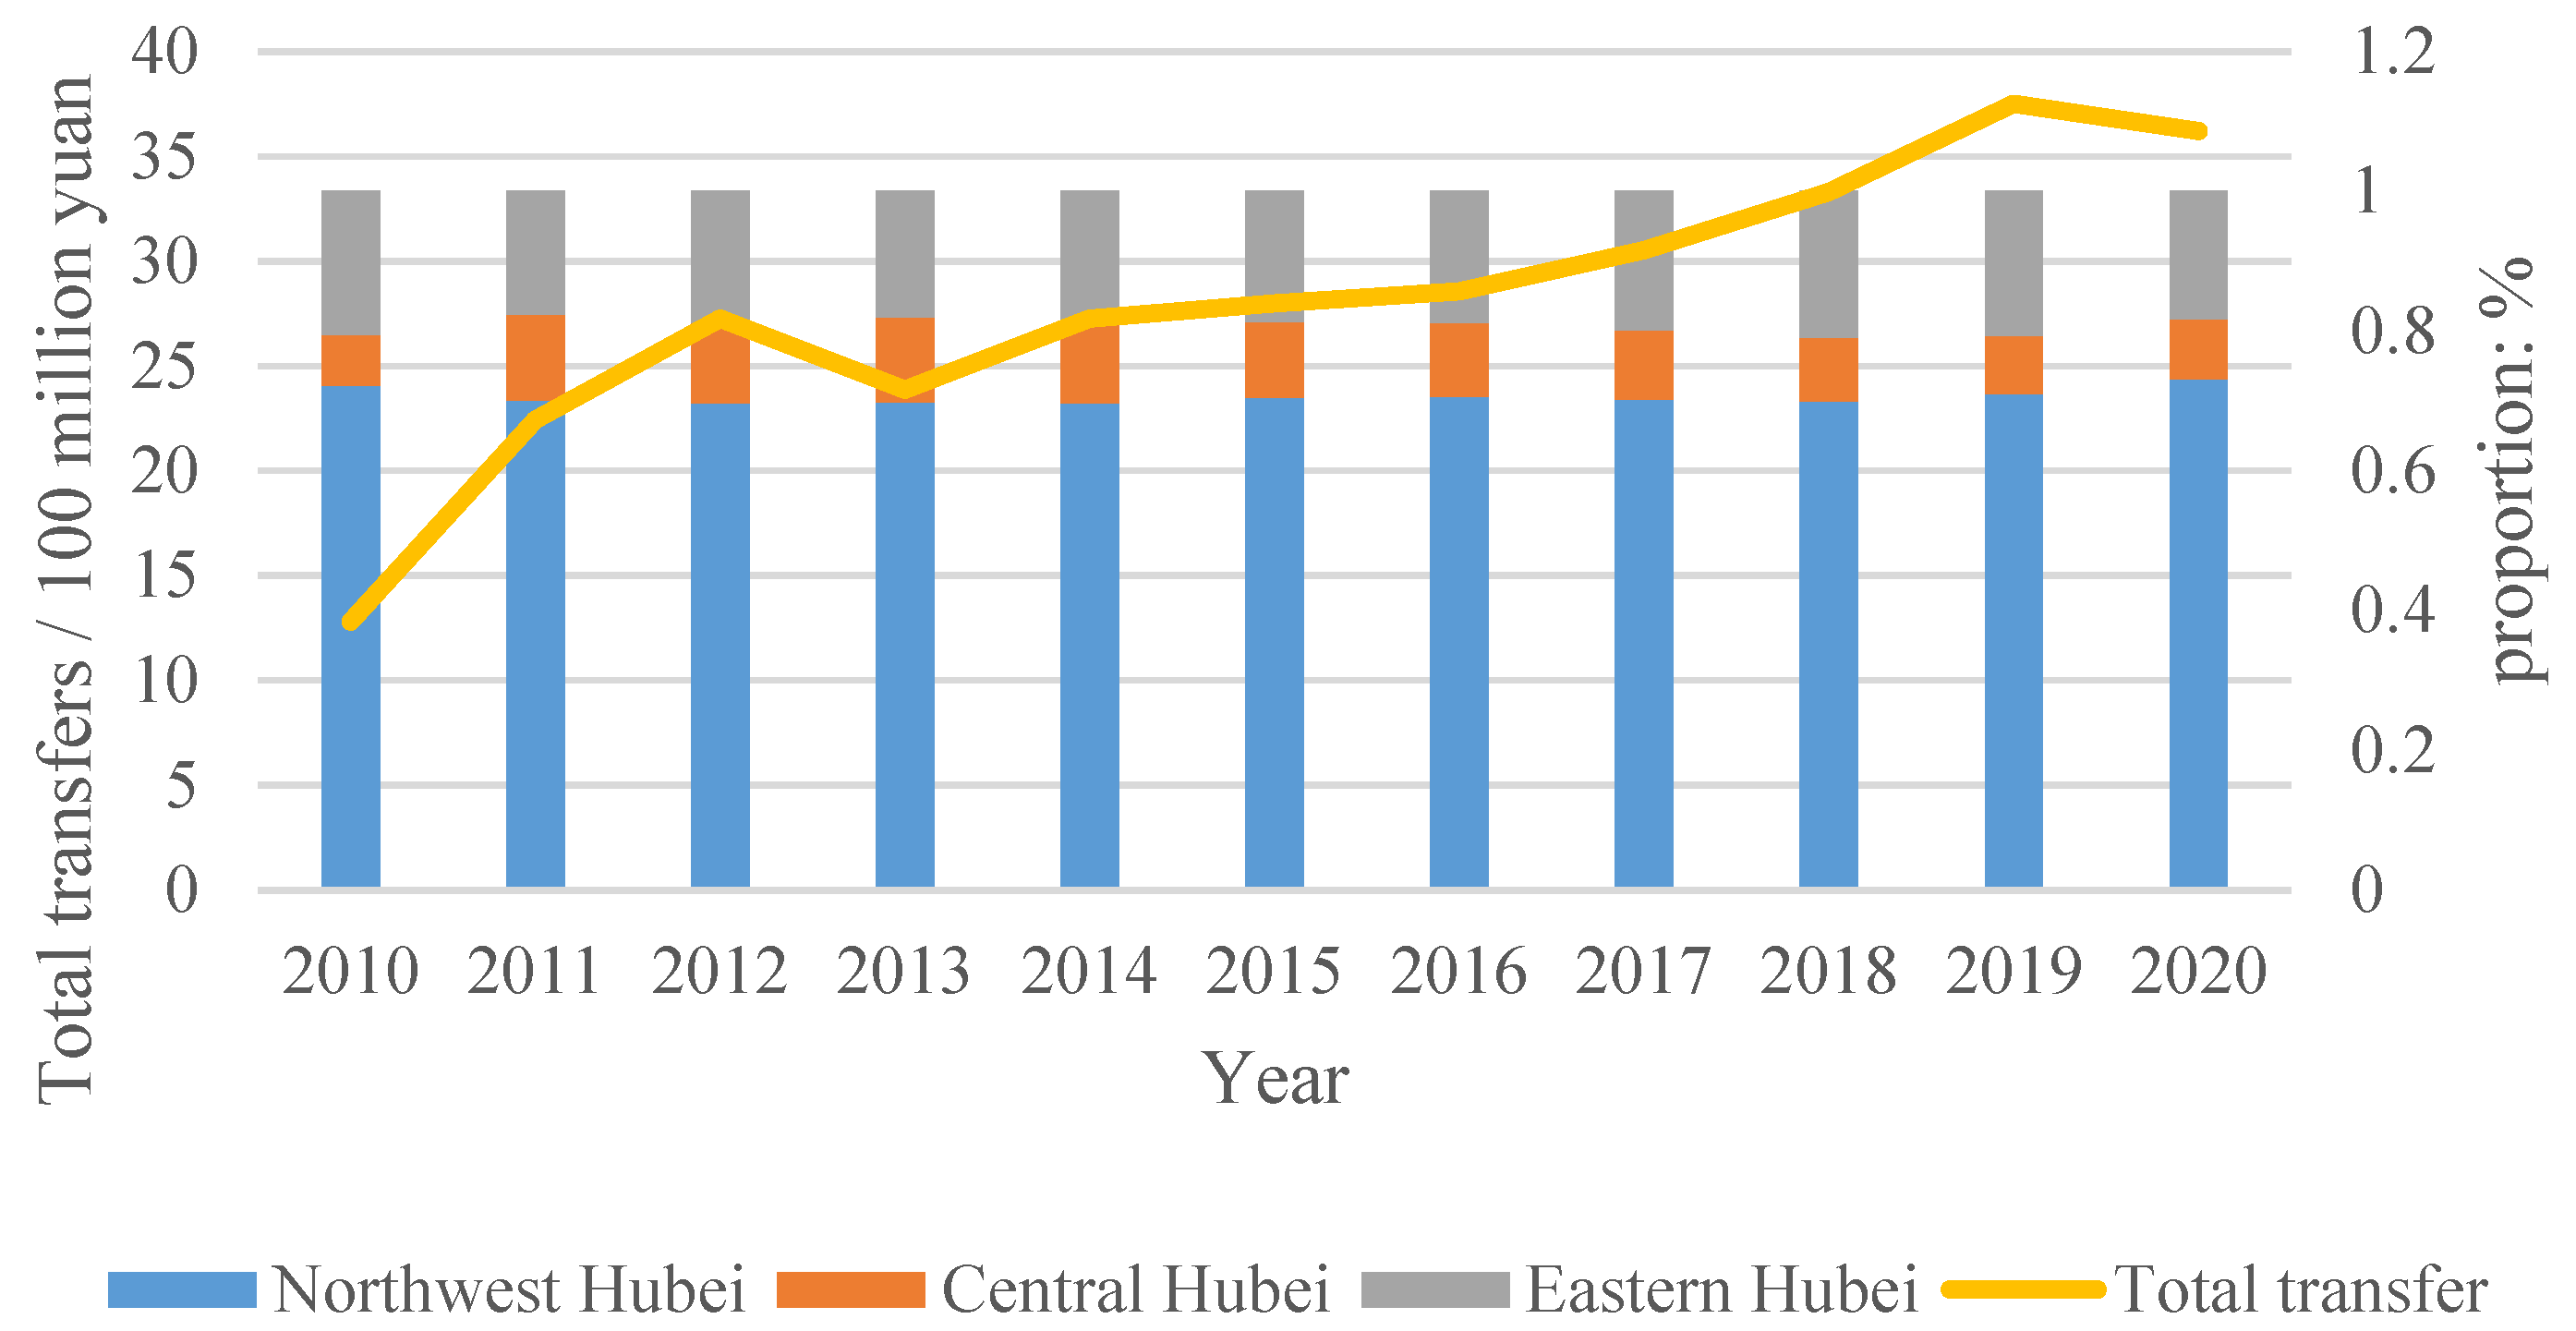

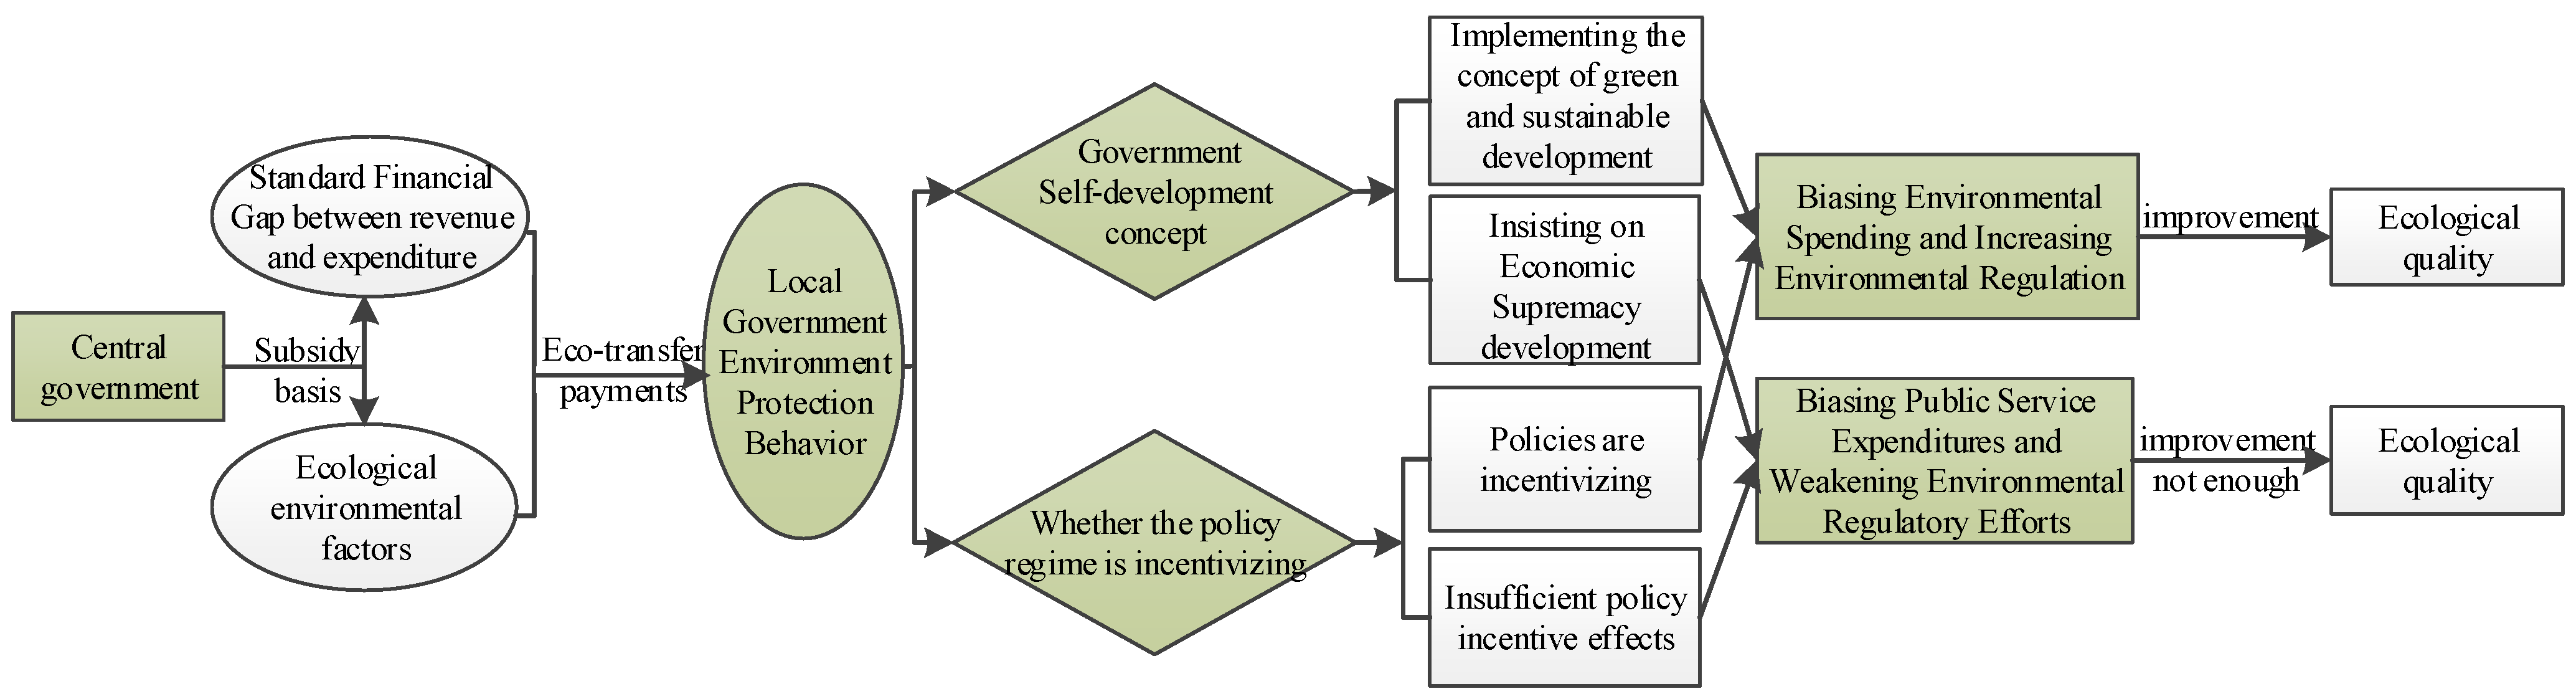
Disclaimer/Publisher’s Note: The statements, opinions and data contained in all publications are solely those of the individual author(s) and contributor(s) and not of MDPI and/or the editor(s). MDPI and/or the editor(s) disclaim responsibility for any injury to people or property resulting from any ideas, methods, instructions or products referred to in the content. |
© 2024 by the authors. Licensee MDPI, Basel, Switzerland. This article is an open access article distributed under the terms and conditions of the Creative Commons Attribution (CC BY) license (https://creativecommons.org/licenses/by/4.0/).