Article

Eutrophication Risk Potential Assessment between Forest and Agricultural Sub-Catchments Using LCIA Principles

1
Department of Applied Ecology, Faculty of Agriculture and Technology, University of South Bohemia in České Budějovice, Branišovská 1645/31A, 370 05 České Budějovice, Czech Republic
2
Department of Agroecosystems, Faculty of Agriculture and Technology, University of South Bohemia in České Budějovice, Branišovská 1645/31A, 370 05 České Budějovice, Czech Republic
*
Authors to whom correspondence should be addressed.
Land 2024, 13(8), 1150; https://doi.org/10.3390/land13081150 (registering DOI)
Submission received: 29 June 2024 / Revised: 21 July 2024 / Accepted: 24 July 2024 / Published: 27 July 2024

Abstract

:
The management of landscapes and agricultural activities significantly impacts phosphorus (P) and nitrogen (N) losses, directly influencing eutrophication risk. This study quantifies the eutrophication potential of different land covers through in-situ measurements and analysis of runoff and inorganic substances. The research was conducted in two sub-catchments in the Bedřichovský stream basin, Novohradské hory, Czech Republic: a forest-dominated upper sub-catchment (UFS) and an agricultural lower sub-catchment (LAS). Water flows and surface water samples were measured over a hydrological year (November 2017 to October 2018) to determine runoff and concentrations of nitrate (N-NO3) and phosphate (P-PO43−). The ReCiPe 2016 method, as a tool for LCIA, was used to quantify the eutrophication potential, converting N and P concentrations into nitrogen equivalents (N eq ha−1 sub-catchment) for marine eutrophication and phosphorus equivalents (P eq ha−1 sub-catchment) for freshwater eutrophication. The potential loss of species (species·yr ha−1 sub-catchment) was assessed as follows. Results indicate UFS has about 60% lower freshwater and 80% lower marine eutrophication potential compared to LAS, along with about 60% lower potential for biodiversity loss. This highlights the role of forest and grassland covers in mitigating eutrophication and protecting water sources. These findings can guide landscape management practices to reduce eutrophication potential, enhancing environmental quality and biodiversity conservation.

1. Introduction

For a long time, serious environmental issues have been caused by the widespread uprooting of natural plants, primarily forests and grasslands, to make way for cropland [1]. With pastures and agricultural land comprising approximately 40% of the planet’s land area, they are currently the largest terrestrial biome [2]. In the future, there will be an increase in this area, together with ongoing deforestation. The approximate amount of degraded land worldwide due to farming operations is around 12,400,000 km2 [2]. The diminution of biodiversity, soil erosion, loss of accumulated soil nutrients, and pollution of accessible water supplies are the ultimate consequences of extensive agricultural practices [3,4,5,6,7].
Concerns are becoming more prevalent about nitrogen (N) and phosphorus (P) from agricultural land contaminating ground and surface water streams and enriching lake systems with nutrients [8,9,10]. Nitrate leaching (for N losses) and increased P concentrations in surface runoff (for P losses) account for the majority of N and P losses from agricultural systems [11,12]. The precise amount of N and P lost varies greatly depending on the specific type of land use (agriculture versus forestry) and management approaches. In arable agricultural lands, for instance, fertilizer N treatments exceeding 200 kg N ha−1 yr−1 are typically administered to meet crop N demands and sustain commercial crop output [13,14]. The majority of nitrate leaching happens in the fall and spring, and it mostly comes from crop residues that have been harvested in late summer [15]. Considering there is no plant to absorb N from the soil during the fallow phase following harvesting, the nitrate level in the soil rises and is susceptible to leaching. Compounding the issue is the possibility that cultivation could accelerate the mineralization of soil organic N [16,17]. Also, the risk of nitrate leaching differs significantly between soil types, precipitation regimes, and nutrient management strategies [18]. For example, a combination of high precipitation and low water holding capacity of soil leads to higher N leaching than under low precipitation and/or soils with higher water holding capacity [19].
Phosphorus (P) can hasten the process of freshwater eutrophication, which is currently one of the most common ways water quality is compromised in developed countries [20,21]. Due to the increasing growth of unwanted algae and macrophytes and the oxygen limitations brought on by their decomposition, eutrophication lowers the amount of water that may be used for industry, recreation, and fisheries [22,23]. Furthermore, a growing number of surface waters have seen recurring, dangerous algal blooms (such as those caused by Cyanobacteria and Pfiesteria), which have been linked to human brain damage, the formation of carcinogens through water chlorination, summer fish kills, and unpalatable drinking water [24,25]. On the other hand, it should be noted that eutrophication greatly affects greenhouse gas emissions from freshwater. Lakes with agricultural catchments release greater CO2 and CH4 into the air compared with lakes away from human activities [26,27]. Significant progress has been made in reducing point source P releases, such as the amount of P in the effluent of sewage treatment plants [28]. The ease with which point sources can now be identified has contributed to these advancements. Nonetheless, non-point sources of P have received less attention, mostly because they are challenging to identify and manage [11,29]. Controlling non-point sources of P is, therefore, a significant challenge to preventing the eutrophication of fresh surface waters. Water bodies receive P from various non-point sources, but heavy agricultural practices are drawing attention. Enhancing comprehension and effectively evaluating and managing eutrophication are imperative to protect the sustainability of freshwater systems. A thorough analysis of the eutrophication effects linked to agricultural production has not yet been done in sufficient range in the Czech Republic (CZ) and is absent in the global context due to country-specific considerations. Several impact assessment methodologies related to eutrophication level assessment prediction have been established depending on various nations, regions, and continents. The ReCiPe 2016, ILCD 2011, CML-IA baseline, or IMPACT 2002+ method is one of the most current updates to these techniques [30,31,32,33] used for Life cycle impact assessment (LCIA). However, the international standards LCA ISO 14040 and ISO 14044 [34,35] do not specify a single method for performing LCIA [33].
There is a severely limited amount of information available that does not only use the modeling or prediction to gain the results that would unequivocally suggest differences in the specific runoff and concentrations of nitrogen nitrate (N-NO3) and phosphorus phosphate (P-PO43−) between the forest sub-catchment and the agricultural sub-catchment. This study provides such a comparison based on the entire hydrological year (2017/2018). It aims to quantify the potential eutrophication risk associated with different landscape management based on detailed in-situ measurement of specific runoff and analysis of inorganic substances directly affecting eutrophication. To do this, we compared the data obtained from two sub-catchments with different land covers (agricultural and forest) and with varying characteristics in their runoffs; then, we quantified the associated eutrophication impacts, including freshwater eutrophication potential (as phosphorus increases in freshwater) and marine eutrophication potential (as dissolved inorganic nitrogen increases in marine water), according to the LCIA principles following the ReCiPe 2016 v1.1—a harmonized life-cycle impact assessment method at midpoint and endpoint level [36]. The emission impacts on freshwater (freshwater eutrophication potential) are based on the transfer of phosphorus from the soil to freshwater bodies, its residence time in freshwater systems, and the potentially disappeared fraction following increased phosphorus concentrations in freshwater. Impacts on marine water (marine eutrophication potential) are based on the transfer of dissolved inorganic nitrogen from the soil and freshwater bodies or directly to marine water, its residence time in marine systems dissolved oxygen depletion, and the potentially disappeared fraction, modeled as a function of dissolved inorganic nitrogen emitted. Marine eutrophication occurs due to the runoff and leach of plant nutrients from the soil and to the discharge of those into riverine or marine systems and the subsequent rise in nutrient levels, i.e., phosphorus and nitrogen (N). In contrast, the assumption is that N is the limiting nutrient in marine waters [37].
It was hypothesized that a landscape with a large share of agricultural land presents a much higher risk of eutrophication and biodiversity loss potential than one mainly consisting of forests and permanent grasslands. Land cover and land use significantly impact the rate of water runoff and associated nutrients [38]. Forests with a large amount of vegetation usually allow more water infiltration into the soil than meadows and arable land [39]. Forests thus deposit more water into the soil than agricultural land due to infiltration [40,41]. Forest soils have a higher field water capacity [42,43]. This water retention ability causes a lower water runoff and substances contained in it [44]. Conversely, deforestation or the transfer of forests to arable land results in a sudden increase in water runoff water and substances such as calcium, potassium, or nitrates [45]. The study’s results can significantly contribute to improving landscape management, leading to the regulation of eutrophication potential, which impacts environmental quality and biodiversity.

2. Materials and Methods

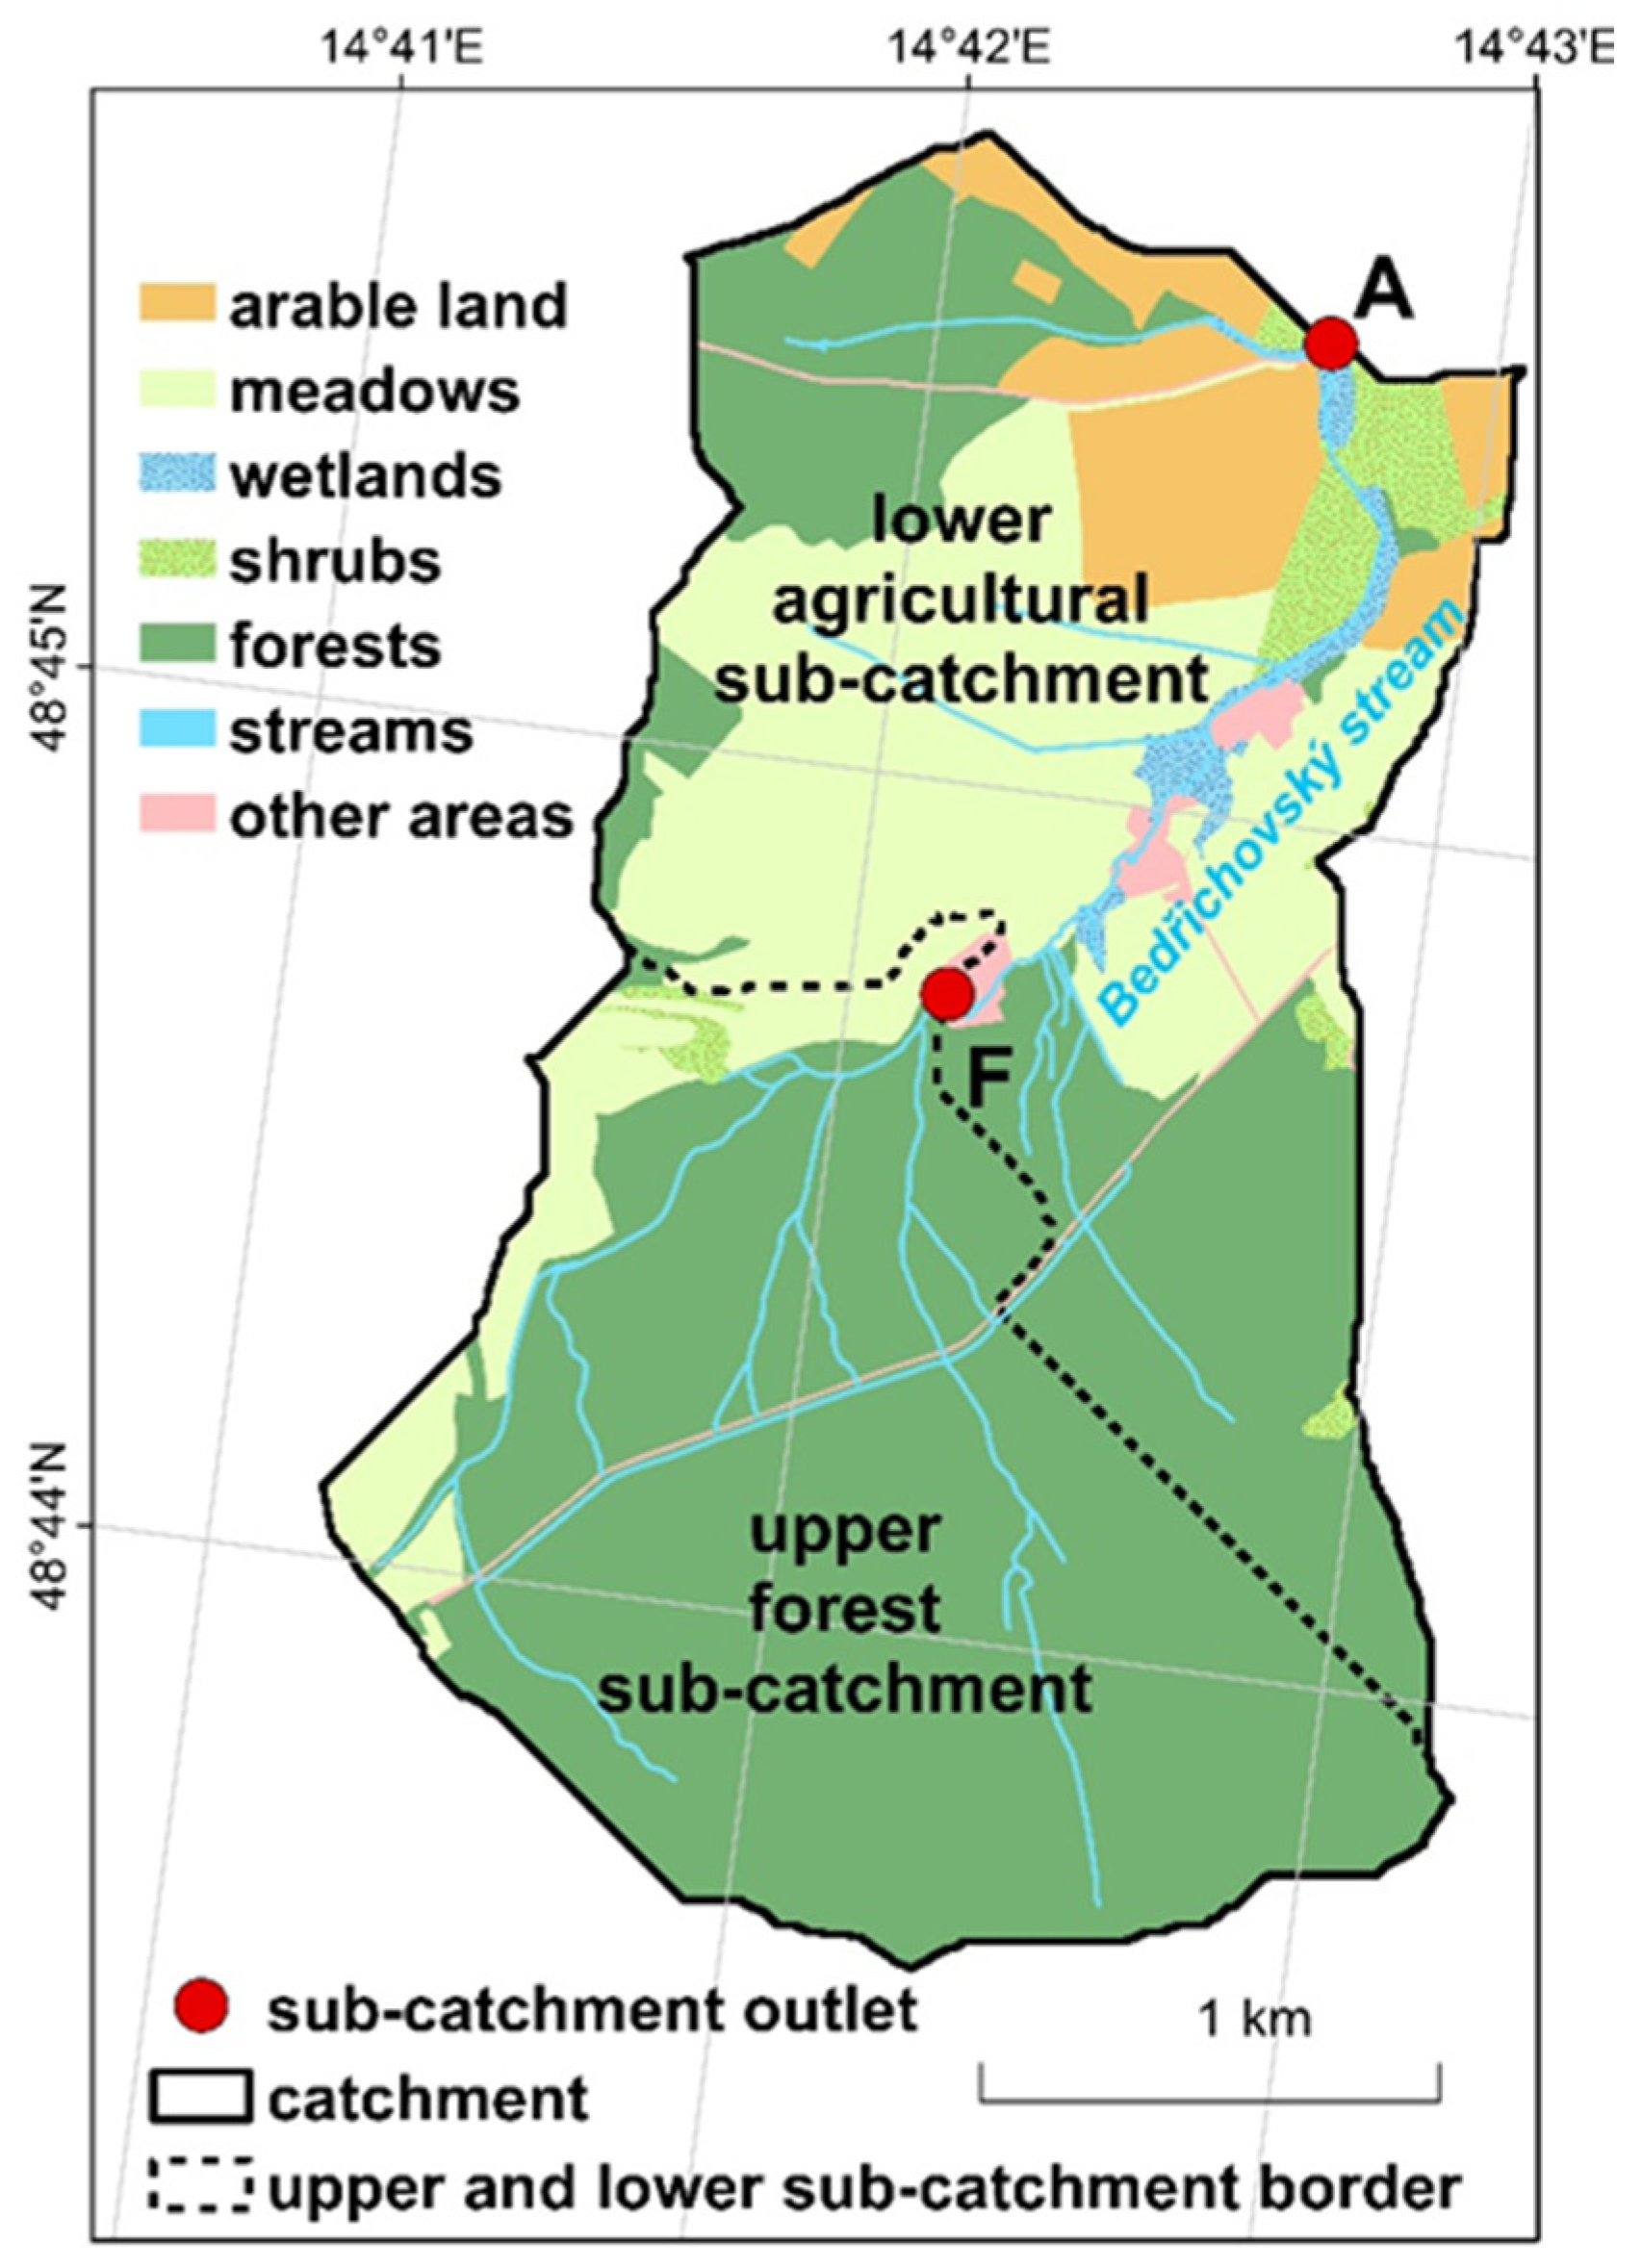
2.1. Study Area Description

Both monitored sub-catchments are located in the foothills of the Bedřichovský stream basin in the Novohradské hory, Czech Republic (CZ), Europe. The upper sub-catchment (upper forest sup-catchment: UFS), with an area of 306.8 ha, is currently covered by 88% forest cover, the area of which has hardly changed since the start of monitoring. The rest of the upper sub-catchment consists mainly of grasslands. A tiny part of the upper sub-catchment (<2%) was formed by arable land in the past (Figure 1 and Table 1). The forest cover comprises coniferous and deciduous trees with the predominant spruce (Picea abies). The predominant soil type in the upper sub-catchment is Skeletic Cambisol. Eutric Leptosol also appears in the highest part of the sub-catchment. The lower sub-catchment (lower agricultural sub-catchment: LAS), with an area of 362.9 ha, comprises a mosaic of mainly grasslands, arable land, and forest stands. During the last two decades, wheat, barley, maize, and rapeseed were cultivated in arable land areas. The soil types Arenic and Dystric Cambisol comprise most of the lower sub-catchment soils, and Stagnic Cambisol also appears in the stream floodplain.
Both sub-catchments differ geomorphologically. The upper one (UFS) has a 3.7° greater average slope of the terrain and is drained by a 1/4 denser network of watercourses with a greater slope. The monitored area is in the temperate zone. Its average altitude is 679 m above sea level. The long-term mean annual air temperature is 6.5 °C (14.5 °C in summer), and the long-term mean annual precipitation is 624 mm (275 mm in summer).

2.2. Specific Runoff Measurement

Water flows were measured in the Bedřichovský stream in the sub-catchment outlets of UFS and LAS during one hydrological year (November 2017 to October 2018). Water levels were measured by an automatic measuring device at ten-minute intervals in the outlets of the stream beds (A, F). The water levels were then converted to water flows using the mathematical function, which was calculated using precise measurements of the water flow velocities in the outlets. Water flow in the A profile covered water from both the upper and lower sub-catchment. Therefore, the profile UFS water flow value was subtracted from the profile LAS water flow value. In this way, water flow values were obtained, representing the contribution of the relevant sub-catchment in both profiles. The flow values in the profiles were converted to specific water runoffs (m3 ha−1 month−1) by dividing the areas of the sub-catchments. Precipitation totals were measured for the entire hydrological year by an automatic rain gauge station in ten-minute intervals with an accuracy of 0.1 mm. Based on the measured data, datasets of the relationships between precipitation totals and specific water outflows from both sub-catchments were compiled for the entire hydrological year 2017/2018.

2.3. Hydrochemical Parameters Measurement

Surface waters were sampled in the sub-catchment outlets of both sub-catchments. Water samples were collected once a month during the entire hydrological year. The concentrations of nitrate nitrogen N-NO3 (mg L−1) and phosphate phosphorus P-PO43− (μg L−1) were analyzed in the sampled waters. Nitrates and orthophosphates are forms of nitrogen and phosphorus that are directly usable by photosynthesizing organisms. As the concentration of nitrates and phosphates in water increases, so does the risk of an increase in algae and cyanobacteria density in surface waters, especially stagnant ones. Therefore, agricultural activity has chosen nitrate nitrogen and phosphate phosphorus as suitable markers of surface water pollution. Since exact water flows in sub-catchment outlets were measured in the hydrological year 2017/2018, it was possible for this period to convert the concentration of substances in water directly to specific outflows of substances from individual sub-catchments (kg ha−1 month−1) (Table 2). Chemical analysis of the collected water samples (orthophosphates and nitrates by precision flow spectrometry) was performed using a laboratory flow spectrometer (FIASTAR 5000 flow spectrometer by FOSS Analytical).

2.4. Eutrophication Risk Potential Assessment

The environmental impact assessment related to the freshwater and marine eutrophication risk potential was performed using LCIA principles (Figure 2). Nitrate nitrogen N-NO3 (kg ha−1 month−1) and phosphate phosphorus P-PO43− (kg ha−1 month−1) were considered as the form of pollutants in the water. The harmonized life cycle impact assessment (LCIA) method ReCiPe [36] was used for eutrophication risk potential assessment for the impact category of freshwater eutrophication (expressed via P-eq) and marine eutrophication (expressed via N-eq), where freshwater eutrophication is driven primarily by phosphorus (P) as the limiting nutrient and marine eutrophication is driven primarily by nitrogen (N) as the limiting nutrient. The following midpoint characterization factors (CFs) related to the ReCiPe 2016 Midpoint method (V1.1) (H) were used to quantify eutrophication potential:
(1)
Phosphorus (CZ) to water/river, CF 0.674 kg P eq per kg P, expressed in freshwater eutrophication potential impact category, Characterization/Midpoint level.
(2)
Nitrogen (CZ) to water/river, CF 0.297 kg N eq per kg N, expressed in marine eutrophication potential impact category, Characterization/Midpoint level.
Then, the ReCiPe 2016 Endpoint (H) method (V1.1) was used to quantify the potential damage to the ecosystems via potential species loss (species·yr ha−1 sub-catchment) in water. The Damage Assessment model was employed. The unit species·yr used in the endpoint category of ecosystem quality in ReCiPe 2016 refers to the potential loss of species over a year in relation to assessed pollutants [36]. This metric represents the potential biodiversity loss due to environmental impacts. The following endpoint CFs from the ReCiPe 2016 Endpoint method (V1.1) (H) were used for the environmental impact expression:
(3)
Phosphorus (CZ) to water/river, CF 4.52·10−7 species·yr per kg P, expressed in freshwater eutrophication potential impact category, Damage assessment/Endpoint level.
(4)
Nitrogen (CZ) to water/river, CF 5.05·10−10 species·yr per kg N, expressed in marine eutrophication potential impact category, Damage assessment/Endpoint level.
For data expression/interpretation, the specialized software tool SimaPro 9.6.0.1 Analyst [46] was used, where the ReCiPe 2016 method and the related CFs are integrated. The P-eq, N-eq, and potential loss species datasets for UFS and LAS were compared using Student’s Paired t-test. The normality of the data was tested using the Shapiro–Wilk test. The logarithmic transformation was used because the data normality assumption was not met. All statistical tests were performed in the R platform for statistical computing [47] at the probability level of α = 5%.

3. Results

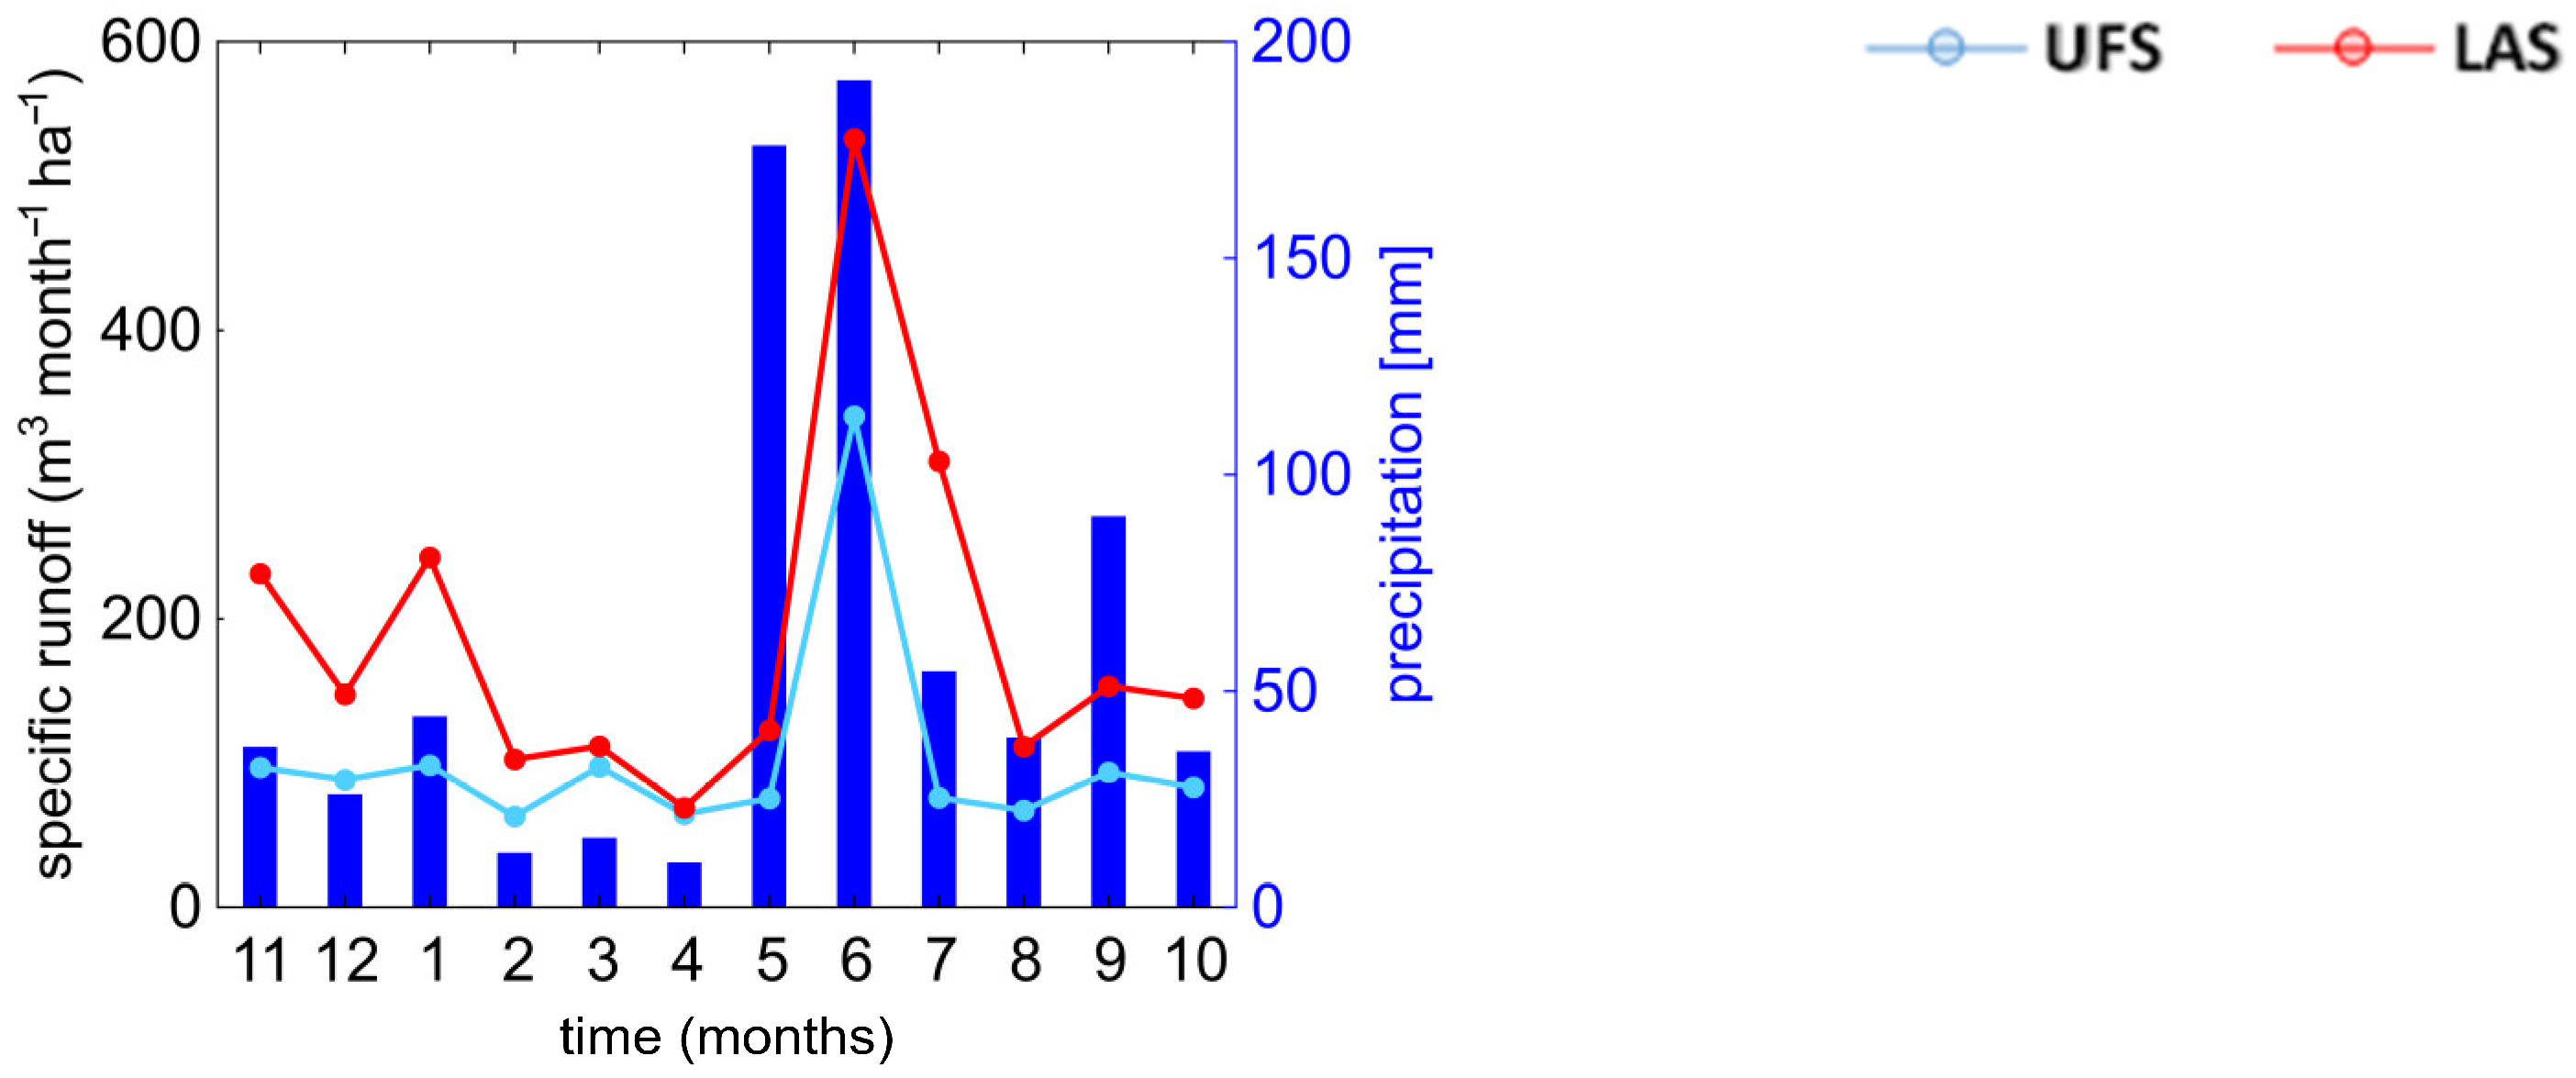
3.1. Specific Runoff Parameters

The land cover in the two sub-catchments varies considerably (Figure 1), and the resulting effluent parameters reflect these differences and changes (Table 2). Based on the results, the highest amounts of specific runoff N-NO3 and P-PO43− per ha for both sub-catchments were obtained from collected samples in June 2018 with kg amounts of 0.152 (N-NO3) and 0.014 (P-PO43−) in UFS and 0.554 (N-NO3) and 0.030 (P-PO43−) in LAS. Also, the highest specific water runoff in UFS and LAS landscapes was observed in June 2018, with 340.6 and 532.8 m3 ha−1 month−1, respectively.
In June and July, higher runoffs of nitrates and phosphates from both sub-catchments are caused by higher precipitation and, thus, higher surface water runoff. In the winter months of the beginning of the year, higher runoff of nitrates and phosphates from LAS is caused by the absence of vegetation on arable land, which would hinder the runoff of these substances. This is expressed via the following hydrograph (Figure 3).

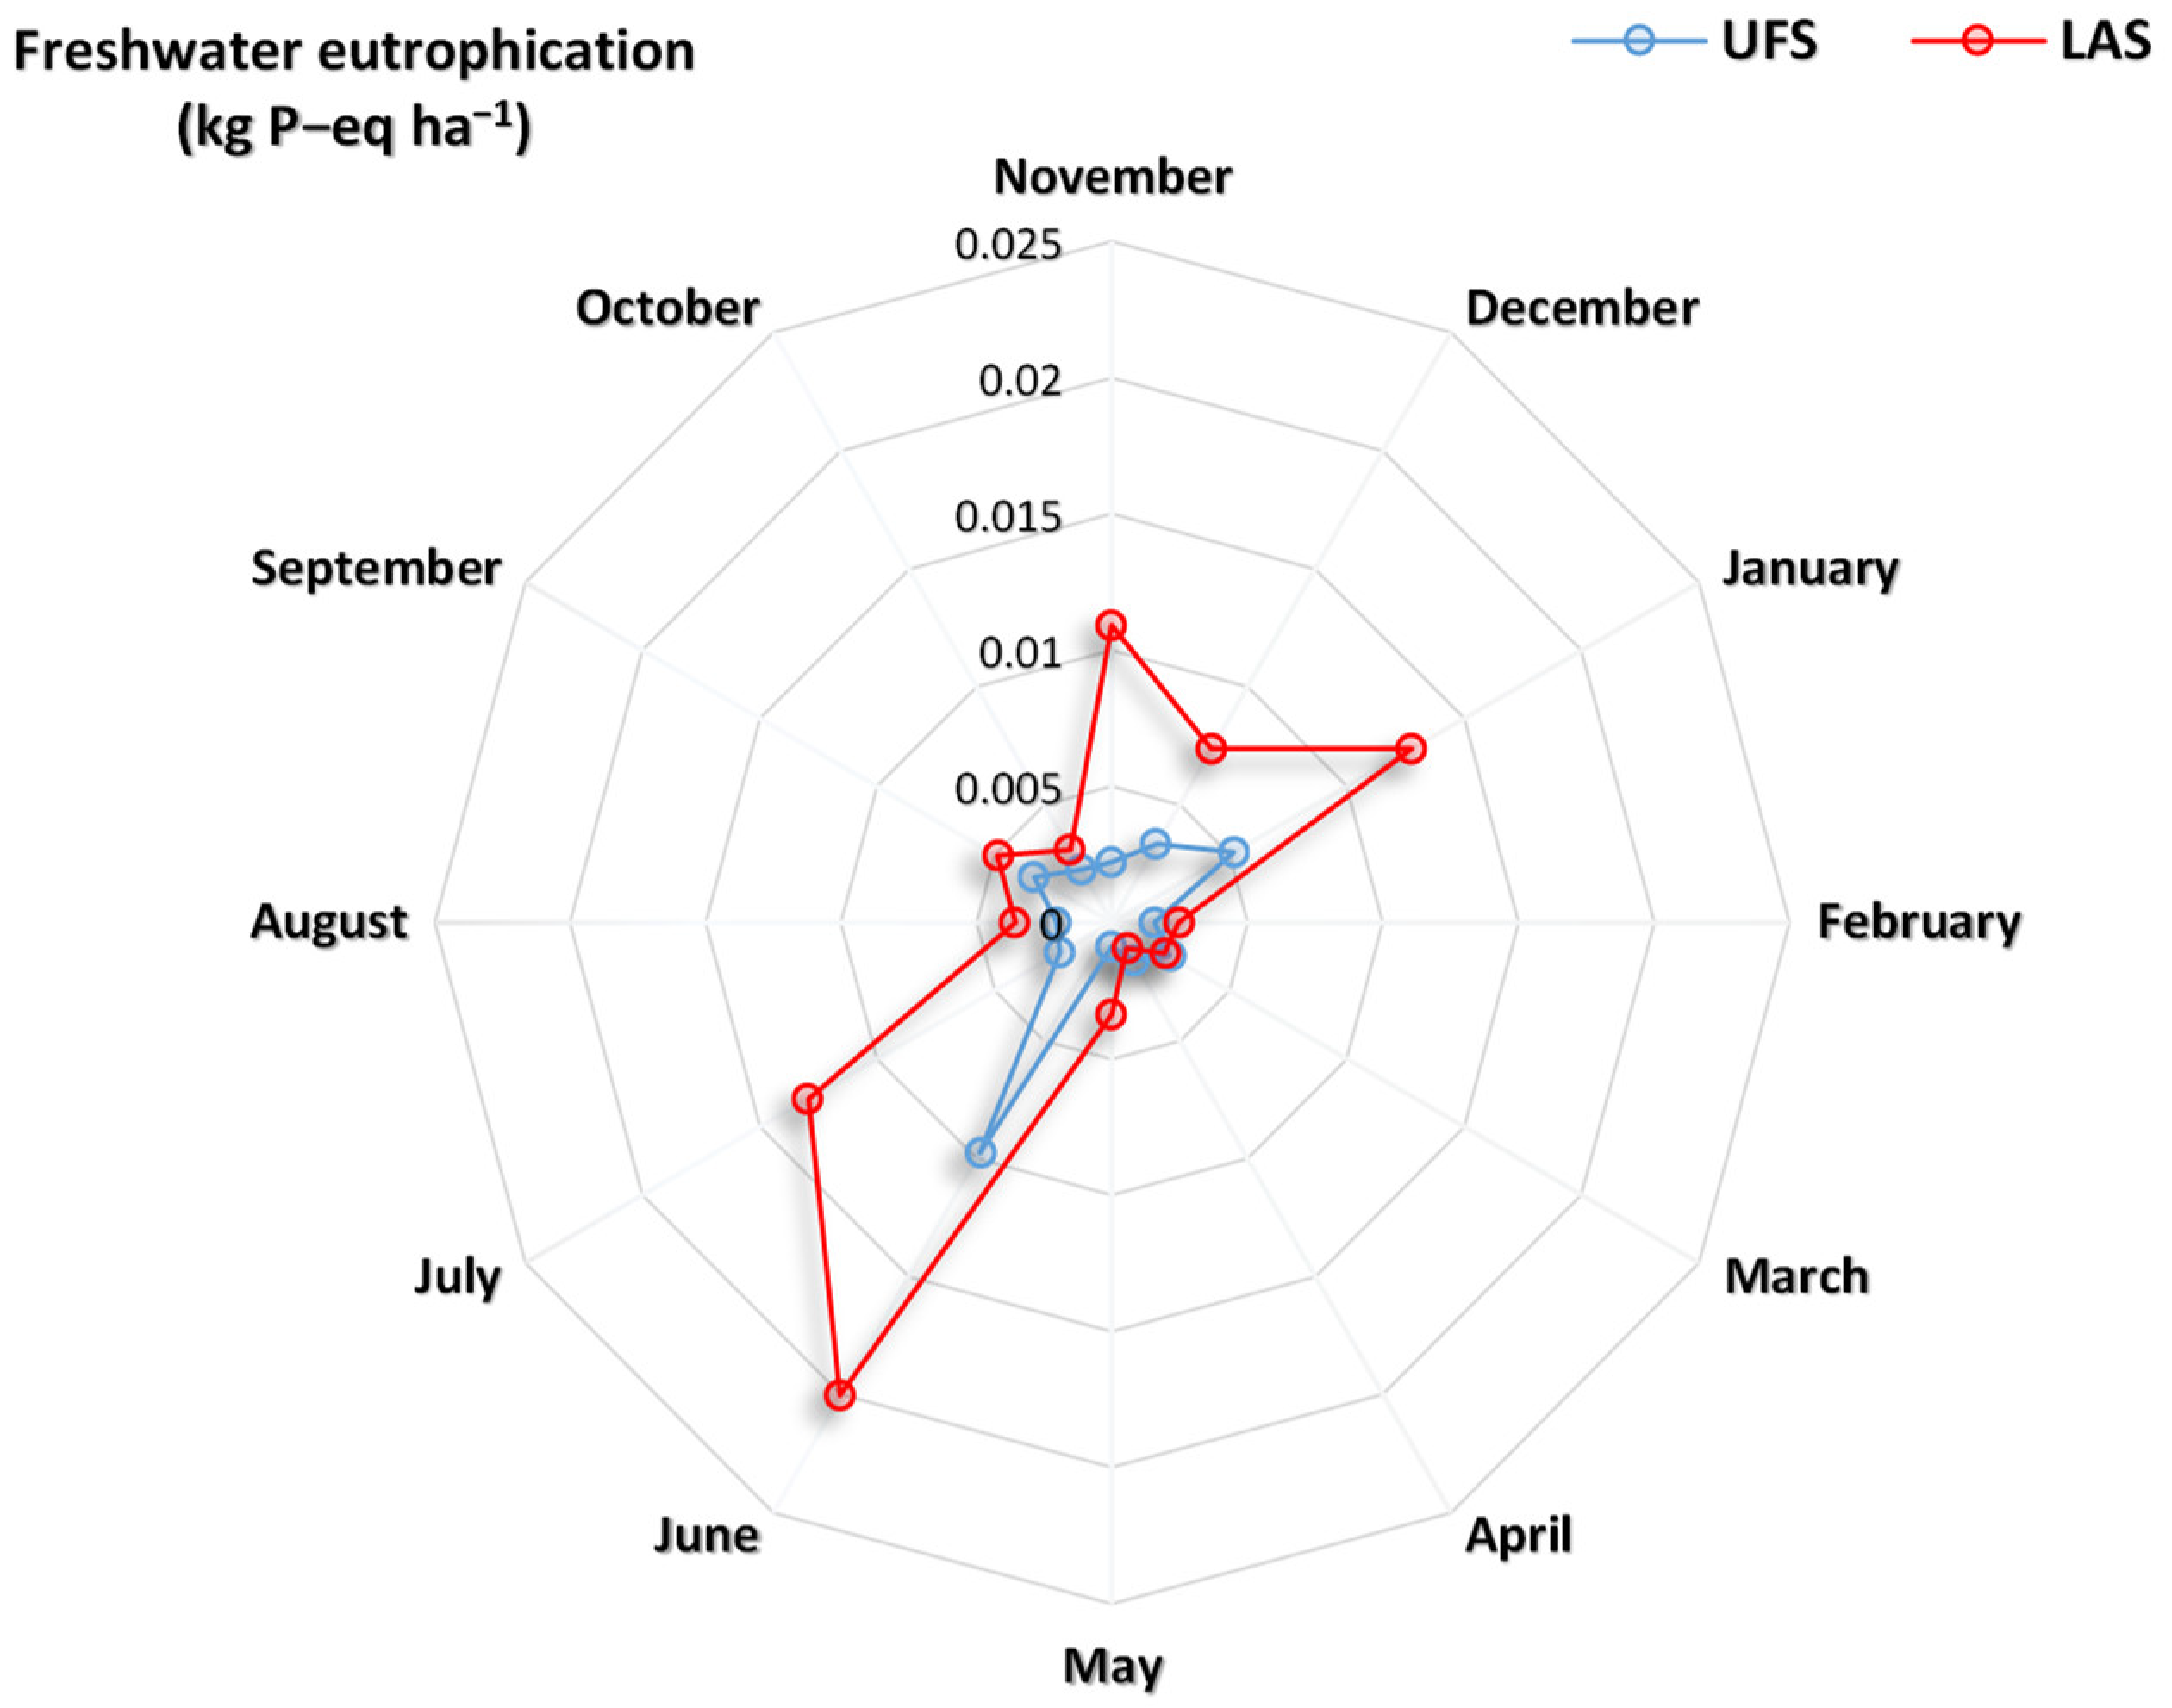
3.2. Freshwater and Marine Eutrophication Risk Potential Assessment (Midpoint Level)

The results of freshwater eutrophication risk assessment between the two landscapes are presented in Figure 4. The results showed that the sub-catchment covered mainly by forest stands (UFS) has a markedly lower freshwater eutrophication potential from the point of view of P-PO43− runoff, in contrast to the agricultural sub-catchment (LAS). The most visible differences were detected in November (0.0022 kg P-eq ha−1 UFS to 0.0109 kg P-eq ha−1 LAS), December (0.0033 kg P-eq ha−1 UFS to 0.0073 kg P-eq ha−1 LAS), January (0.0051 kg P-eq ha−1 UFS to 0.0127 kg P-eq ha−1 LAS), June (0.0097 kg P-eq ha−1 UFS to 0.0201 kg P-eq ha−1 LAS), and July (0.0022 kg P-eq ha−1 UFS to 0.0129 kg P-eq ha−1 LAS). On the contrary, the smallest differences were in February, March, and April, and then August, September, and October, where no differences were among them, with an average value of 0.0027 kg P-eq ha−1 UFS to 0.0035 kg P-eq ha−1 LAS.
Also, the results of marine eutrophication potential (based on specific runoff N-NO3) between the two monitored landscapes are presented in Figure 5. The results showed that in contrast with the freshwater eutrophication potential, the difference is even more dominant in the case of marine eutrophication potential. In all the samplings carried out and in all subsequent models of eutrophication risk potential assessment carried out, the agricultural sub-catchment (LAS) clearly tends to have a higher (about 80%) eutrophication potential (1.1076 kg N-eq ha−1 hydrological year−1 for LAS) within the monitored hydrological year than the forest sub-catchment (0.2159 kg N-eq ha−1 hydrological year−1 for UFS). In addition, the forest sub-catchment shows high stability in terms of specific runoff N-NO3, while only in the case of June did the value of specific runoff N-NO3 increase (about 66% more than the average of the other months) compared to other monthly values.
The overall eutrophication risk potential for the completed hydrological year has been assessed for marine and freshwater eutrophication. The results showed that the rate of freshwater eutrophication risk reflecting specific runoff P-PO43− is significantly higher (t = −3.7408, df = 11, p < 0.05) in sub-catchment with agricultural landscape (LAS) by about 60%. Also, the rate of marine eutrophication risk reflecting specific runoff N-NO3 is up to 80% higher in sub-catchment with forest landscape (UFS) (t = −15.088, df = 11, p < 0.05). From comparing the two sub-catchments (UFS vs. LAS), forest one clearly tends to have a significantly lower eutrophication risk potential.

3.3. Eutrophication Risk Potential for Ecosystems (Endpoint Level)

The results of the eutrophication risk potential assessment for the ecosystem between the two sub-catchments (UFS vs. LAS) were calculated. Following the eutrophication risk potential for freshwater (based on specific runoff P-PO43−) and marine (based on specific runoff N-NO3) environments, the eutrophication risk for potential loss of species, damage of ecosystems, respectively, was modeled via the Damage assessment endpoint model (expressed in the unit of species·yr ha−1 sub-catchment). This assessment should be considered as another perspective of the results that indicate, again, a significantly (t = −4.0457, df = 11, p < 0.05) higher risk potential for potential loss of species (about 60%) via eutrophication in the case of agricultural sub-catchment.

4. Discussion

The results presented in this study highlight the importance of landscape management for eutrophication risk potential. The assessment of two sub-catchments with different landscape cover within the full hydrological year points out their fundamental differences in specific runoff N-NO3 and P-PO43− which can be understood as potential pollutants for the water environment. Respectively, in-situ water management at the river/stream basin scale was considered to quantify the eutrophication risk potential. That is the recommended way to assess water/nutrient management [48] or [49]. Because commonly used factors and methodologies do not have to be representative of the assessed regions [48,50] or site-specific conditions [50,51], this study thus used an approach where N and P values (specific runoff N-NO3 and P-PO43−) were collected in-situ and laboratory-processed (Section 2.2 and Section 2.3). Then, the values for freshwater and marine eutrophication potential as a midpoint impact category and for impact on the ecosystem as an endpoint impact category were recalculated using characterization factors from the ReCiPe methodology, which is one of the most widely used methods by practitioners [52], to convert into the risk freshwater and marine eutrophication potential [32]. Taking ReCiPe is one of the most used methodologies for environmental impact assessment [36], even for assessing eutrophication potential and impact on ecosystems [32,50]. The methodological choices during LCIA (e.g., ReCiPe 2016, ILCD 2011, CML-IA baseline, or IMPACT 2002+) can have significant implications for the characterization results in absolute values. In contrast, the results related to the eutrophication impact categories can be considered consistent except for the IMPACT 2002+ method [33]. In the end, similar in-situ measurements of waterborne nutrient emissions responsible for eutrophication potential could provide valuable information for life cycle assessments and increase the relevance of LCA as a tool for assessing product-related eutrophication impact. A more precise set of characterization factors for conversion to eutrophication potential could also improve the approach [48].
Results of the presented study indicate a fundamentally lower potential for eutrophication in the UFS than in the LAS (about 60% lower freshwater and about 80% lower marine eutrophication potential). Therefore, the study’s results contribute to the claims that the forested landscape, or the landscape with high forest cover, is associated with a significantly lower eutrophication potential than the agricultural landscape [53,54]. Forest cover influences not only the amount of surface runoff but also its quality [54]. The concentrations of chemicals in surface runoff differ between forest catchments and non-forest catchments (agricultural areas). However, these differences are not mainly caused by the influence of the forest cover but by changes in agricultural land management [53]. Among other things, this is also related to the characteristics of water runoff [55,56]. Respectively, the fact that, in general, a forested or grassed landscape has a lower tendency to water runoff from the landscape compared to agricultural land. The specific water runoff and substances from the land cover with dominant mature vegetation (forest landscape, e.g.) are smaller due to the following aspects: interception [57,58,59], evaporation from plant surfaces and transpiration [60], increasing surface roughness and improving infiltration conditions [61,62] and usually higher soil organic matter content [63,64]. This confirmed, for example, an in-situ study by Ogden et al. [55] based on a paired catchment methodology to analyze hydrologic data on three catchments of contrasting land cover and land use or a model study by Ma et al. [65]. In our study, the average water runoff (m3 ha−1 month−1) in UFS was nearly 50% lower than in the case of LAS (UFs 104 vs. LAS 190 m3 ha−1 month−1). Different volumes of precipitation and then subsequent values of water runoff also affect the concentration of potential water-born emissions responsible for eutrophication. For example, nitrogen concentration in rainfall-normal years is higher than in rainfall-deficit years. This shows that surface runoff and the underground flow during the rainy season strongly affect non-point sources of potential pollutant loss and transport [66].
In general, land cover and general land use, respectively, in agricultural areas significantly impact nitrogen and phosphorus leaching and runoff [67]. Nitrate levels are lower under forest cover. Surface runoff from agricultural lands is the main cause of water pollution, and nitrification is greater in an agricultural environment [53]. There have been examples of land-use change from agriculture to forestry to promote better water quality [68]. Regarding the risk of eutrophication, water quality is connected with the intensity of agricultural production and the use of fertilizers and pesticides [69,70]. Agricultural land is the primary factor influencing N and P in suburban and rural areas; the relationship was strong as the pollutants were mainly from agricultural surface runoff [71]. And then, not only is specific runoff N-NO3 and P-PO43− risky for biological loss (via the eutrophication and impact on ecosystems) but also residues of pesticide use, reliably detected in the interest sub-catchment (the stable concentrations [0.24 µg L−1 on average] of desisopropyl-atrazine); however, they were already banned by the European Commission in 2004 [56]. Pesticide residues persist in soil for years after the cessation of their use and pollute surface waters. Due to the increase in the frequency of high precipitation episodes during climate change, the problem is growing.
One of the solutions to reduce specific runoff N-NO3, P-PO43−, and pesticides will be to change agricultural management and improve landscape structure in the sense of better control of surface runoff [56]. For example, grasslands limit erosion [72] and, thus, the leaching of nutrients. They accumulate nitrogen and phosphorus to build their plant tissue. This function is manifested throughout the year in grasses and forest communities, which is the main advantage over arable land not covered with vegetation year-round [73]. This measure would also contribute to the limitation of N and P runoff. Kvítek [74] states that if 50–70% of arable land located in vulnerable areas were to be covered with grass, it would also reduce nitrate pollution of waterways by roughly 50–70% in streams.
Also, the rate of N addition to a site is likely to be a crucial determinant of whether an ecosystem will be sustainable long-term or whether the soil or vegetation (land cover in general) should be changed [73]. N in agricultural systems has played a great role in increasing crop yield and meeting the demand of population growth. However, related nitrate N leaching and surface runoff seriously threaten people’s health and pollute biological environments [73]. To improve the current status of the agricultural sub-catchment from the perspective of N runoff (also in the form of N-NO3), implementation of the cover crop on the arable land can be an option. For example, Hanrahan et al. [75] study results show that cover crops’ influence on N loads was consistent across temporal scales of examination, demonstrating that cover crops effectively increased N demand and mitigated N losses from agricultural fields. On the other hand, it was not confirmed in the case of P. The variable influence of cover crops on P loads underscores the need for a deeper understanding of the factors and mechanisms that control P loss in systems that include cover crop management.
Because the approach and frame used in this study are newly applied, studies dealing with comparing forest and agricultural sub-catchments on a similar level are not discussed. Standardly, freshwater and marine eutrophication risk potential assessment for agricultural or forest land, as well as the direct emissions influencing those impact categories, are quantified via specialized methodologies like WFLDB [76], for example, where the LCIA principles are employed, too.

5. Conclusions

A limited amount of information is available that does not use the modeling or prediction to gain the results that would unequivocally suggest differences in the specific runoff and concentrations of nitrogen nitrate (N-NO3) and phosphorus phosphate (P-PO43−) between the forest sub-catchment and the agricultural sub-catchment. This study provides such a comparison based on the entire hydrological year (2017/2018) and in-situ measurement. Then, it examines the impact of landscape management on nitrogen and phosphorus losses, contributing to freshwater and marine eutrophication risk potential and impact on the ecosystems (damage to ecosystems) with the employment of LCIA principles. Results indicate a fundamentally lower potential for eutrophication in the forest sub-catchment than in the agricultural sub-catchment (about 60% lower freshwater and about 80% lower marine eutrophication potential). Following the eutrophication risk potential for environments, the eutrophication risk for ecosystems was also modeled via the potential damage to the ecosystems, as potential species loss (species·yr ha−1 sub-catchment). This assessment indicates a higher risk of potential species loss (about 60%), respectively impacting the ecosystem as an endpoint category via eutrophication in the case of agricultural sub-catchment. This finding underscores the importance of forest and permanent grassland covers in mitigating eutrophication risks and protecting water sources. The study’s results can inform landscape management practices to reduce eutrophication potential, thereby enhancing environmental quality and biodiversity conservation.

Author Contributions

T.B.: Conceptualization, methodology, validation, formal analysis, investigation, resources, data curation, writing—original draft preparation, writing—review and editing, visualization; V.N.: Conceptualization, methodology, validation, formal analysis, investigation, resources, data curation, writing—original draft preparation, writing—review and editing, visualization, supervision; M.G.: Conceptualization, formal analysis, investigation, resources, data curation, writing—original draft preparation, writing—review and editing, visualization; J.B. (Jakub Brom): Conceptualization, validation, formal analysis, data curation, writing—original draft preparation, visualization, supervision, project administration, funding acquisition; E.A.: writing—original draft preparation, writing—review and editing; J.B. (Jaroslav Bernas): Conceptualization, methodology, software, validation, formal analysis, investigation, resources, data curation, writing—original draft preparation, writing—review and editing, visualization. All authors have read and agreed to the published version of the manuscript.

Funding

The research was financially supported by the Grant Agency of the University of South Bohemia in České Budějovice (project No. GAJU 069/2022/Z).

Data Availability Statement

The original contributions presented in the study are included in the article, further inquiries can be directed to the corresponding author.

Conflicts of Interest

The authors declare no conflict of interest.

References

  1. Ekka, P.; Patra, S.; Upreti, M.; Kumar, G.; Kumar, A.; Saikia, P. Land Degradation and Its Impacts on Biodiversity and Ecosystem Services. In Land and Environmental Management through Forestry; Raj, A., Jhariya, M.K., Banerjee, A., Nema, S., Bargali, K., Eds.; Wiley: Hoboken, NJ, USA, 2023; pp. 77–101. ISBN 978-1-119-91040-4. [Google Scholar]
  2. Rey Benayas, J.M.; Martins, A.; Nicolau, J.M.; Schulz, J.J. Abandonment of Agricultural Land: An Overview of Drivers and Consequences. CABI Rev. 2007, 2, 1–14. [Google Scholar] [CrossRef]
  3. Kolawole, A.S.; Iyiola, A.O. Environmental Pollution: Threats, Impact on Biodiversity, and Protection Strategies. In Sustainable Utilization and Conservation of Africa’s Biological Resources and Environment; Izah, S.C., Ogwu, M.C., Eds.; Sustainable Development and Biodiversity; Springer Nature: Singapore, 2023; Volume 32, pp. 377–409. ISBN 978-981-19697-3-7. [Google Scholar]
  4. Angon, P.B.; Mondal, S.; Jahan, I.; Datto, M.; Antu, U.B.; Ayshi, F.J.; Islam, M.d.S. Integrated Pest Management (IPM) in Agriculture and Its Role in Maintaining Ecological Balance and Biodiversity. Adv. Agric. 2023, 2023, 5546373. [Google Scholar] [CrossRef]
  5. Francaviglia, R.; Almagro, M.; Vicente-Vicente, J.L. Conservation Agriculture and Soil Organic Carbon: Principles, Processes, Practices and Policy Options. Soil Syst. 2023, 7, 17. [Google Scholar] [CrossRef]
  6. Demo, A.H.; Asefa Bogale, G. Enhancing Crop Yield and Conserving Soil Moisture through Mulching Practices in Dryland Agriculture. Front. Agron. 2024, 6, 1361697. [Google Scholar] [CrossRef]
  7. Srivastav, A.L.; Patel, N.; Rani, L.; Kumar, P.; Dutt, I.; Maddodi, B.S.; Chaudhary, V.K. Sustainable Options for Fertilizer Management in Agriculture to Prevent Water Contamination: A Review. Environ. Dev. Sustain. 2023, 26, 8303–8327. [Google Scholar] [CrossRef]
  8. Aloo, B.N. Pollution of Ground and Surface Waters with Agrochemicals. In Handbook of Water Pollution; Inamuddin, Altalhi, T., Alrooqi, A., Eds.; Wiley: Hoboken, NJ, USA, 2024; pp. 65–96. ISBN 978-1-119-90480-9. [Google Scholar]
  9. Rajasekar, A.; Murava, R.T.; Norgbey, E.; Zhu, X. Spatial Distribution, Risk Index, and Correlation of Heavy Metals in the Chuhe River (Yangtze Tributary): Preliminary Research Analysis of Surface Water and Sediment Contamination. Appl. Sci. 2024, 14, 904. [Google Scholar] [CrossRef]
  10. Srivastav, A.L.; Patel, N.; Prajapati, U.B.; Chaudhary, V.K. Nitrate Pollution in Groundwater and Their Possible Remediation Through Adsorption. In Groundwater Geochemistry; Madhav, S., Singh, P., Eds.; Wiley: Hoboken, NJ, USA, 2021; pp. 105–119. ISBN 978-1-119-70969-5. [Google Scholar]
  11. Qi, D.; Wu, Q.; Zhu, J. Nitrogen and Phosphorus Losses from Paddy Fields and the Yield of Rice with Different Water and Nitrogen Management Practices. Sci. Rep. 2020, 10, 9734. [Google Scholar] [CrossRef] [PubMed]
  12. Cui, N.; Cai, M.; Zhang, X.; Abdelhafez, A.A.; Zhou, L.; Sun, H.; Chen, G.; Zou, G.; Zhou, S. Runoff Loss of Nitrogen and Phosphorus from a Rice Paddy Field in the East of China: Effects of Long-Term Chemical N Fertilizer and Organic Manure Applications. Glob. Ecol. Conserv. 2020, 22, e01011. [Google Scholar] [CrossRef]
  13. Guo, C.; Liu, X.; He, X. A Global Meta-Analysis of Crop Yield and Agricultural Greenhouse Gas Emissions under Nitrogen Fertilizer Application. Sci. Total Environ. 2022, 831, 154982. [Google Scholar] [CrossRef]
  14. Lu, J.; Hu, T.; Zhang, B.; Wang, L.; Yang, S.; Fan, J.; Yan, S.; Zhang, F. Nitrogen Fertilizer Management Effects on Soil Nitrate Leaching, Grain Yield and Economic Benefit of Summer Maize in Northwest China. Agric. Water Manag. 2021, 247, 106739. [Google Scholar] [CrossRef]
  15. Frerichs, C.; Glied-Olsen, S.; De Neve, S.; Broll, G.; Daum, D. Crop Residue Management Strategies to Reduce Nitrogen Losses during the Winter Leaching Period after Autumn Spinach Harvest. Agronomy 2022, 12, 653. [Google Scholar] [CrossRef]
  16. Dong, Y.; Yang, J.-L.; Zhao, X.-R.; Yang, S.-H.; Mulder, J.; Dörsch, P.; Zhang, G.-L. Nitrate Leaching and N Accumulation in a Typical Subtropical Red Soil with N Fertilization. Geoderma 2022, 407, 115559. [Google Scholar] [CrossRef]
  17. Frick, H.; Oberson, A.; Frossard, E.; Bünemann, E.K. Leached Nitrate under Fertilised Loamy Soil Originates Mainly from Mineralisation of Soil Organic N. Agric. Ecosyst. Environ. 2022, 338, 108093. [Google Scholar] [CrossRef]
  18. Sapkota, T.B.; Askegaard, M.; Lægdsmand, M.; Olesen, J.E. Effects of Catch Crop Type and Root Depth on Nitrogen Leaching and Yield of Spring Barley. Field Crops Res. 2012, 125, 129–138. [Google Scholar] [CrossRef]
  19. Askegaard, M.; Eriksen, J. Growth of Legume and Nonlegume Catch Crops and residual-N Effects in Spring Barley on Coarse Sand. J. Plant Nutr. Soil Sci. 2007, 170, 773–780. [Google Scholar] [CrossRef]
  20. Weihrauch, C.; Weber, C.J. Phosphorus Enrichment in Floodplain Subsoils as a Potential Source of Freshwater Eutrophication. Sci. Total Environ. 2020, 747, 141213. [Google Scholar] [CrossRef] [PubMed]
  21. Jarvie, H.P.; Pallett, D.W.; Schäfer, S.M.; Macrae, M.L.; Bowes, M.J.; Farrand, P.; Warwick, A.C.; King, S.M.; Williams, R.J.; Armstrong, L.; et al. Biogeochemical and Climate Drivers of Wetland Phosphorus and Nitrogen Release: Implications for Nutrient Legacies and Eutrophication Risk. J. Environ. Qual. 2020, 49, 1703–1716. [Google Scholar] [CrossRef] [PubMed]
  22. Geletu, T.T. Lake Eutrophication: Control of Phytoplankton Overgrowth and Invasive Aquatic Weeds. Lakes Reserv. 2023, 28, e12425. [Google Scholar] [CrossRef]
  23. Sundblad, G.; Bergström, L.; Söderqvist, T.; Bergström, U. Predicting the Effects of Eutrophication Mitigation on Predatory Fish Biomass and the Value of Recreational Fisheries. Ambio 2020, 49, 1090–1099. [Google Scholar] [CrossRef]
  24. Mishra, R.K. The Effect of Eutrophication on Drinking Water. BJMAS 2023, 4, 7–20. [Google Scholar] [CrossRef]
  25. Lürling, M.; Mucci, M. Mitigating Eutrophication Nuisance: In-Lake Measures Are Becoming Inevitable in Eutrophic Waters in the Netherlands. Hydrobiologia 2020, 847, 4447–4467. [Google Scholar] [CrossRef]
  26. Lapierre, J.; Seekell, D.A.; Filstrup, C.T.; Collins, S.M.; Emi Fergus, C.; Soranno, P.A.; Cheruvelil, K.S. Continental-scale Variation in Controls of Summer CO 2 in United States Lakes. JGR Biogeosci. 2017, 122, 875–885. [Google Scholar] [CrossRef]
  27. Yang, H.; Andersen, T.; Dörsch, P.; Tominaga, K.; Thrane, J.-E.; Hessen, D.O. Greenhouse Gas Metabolism in Nordic Boreal Lakes. Biogeochemistry 2015, 126, 211–225. [Google Scholar] [CrossRef]
  28. Preisner, M.; Neverova-Dziopak, E.; Kowalewski, Z. Mitigation of Eutrophication Caused by Wastewater Discharge: A Simulation-Based Approach. Ambio 2021, 50, 413–424. [Google Scholar] [CrossRef] [PubMed]
  29. Garske, B.; Stubenrauch, J.; Ekardt, F. Sustainable Phosphorus Management in European Agricultural and Environmental Law. Rev. Eur. Comp. Int. Environ. 2020, 29, 107–117. [Google Scholar] [CrossRef]
  30. Rosenbaum, R.K.; Hauschild, M.Z.; Boulay, A.-M.; Fantke, P.; Laurent, A.; Núñez, M.; Vieira, M. Life Cycle Impact Assessment. In Life Cycle Assessment; Hauschild, M.Z., Rosenbaum, R.K., Olsen, S.I., Eds.; Springer International Publishing: Cham, Switzerland, 2018; pp. 167–270. ISBN 978-3-319-56474-6. [Google Scholar]
  31. Bulle, C.; Margni, M.; Patouillard, L.; Boulay, A.-M.; Bourgault, G.; De Bruille, V.; Cao, V.; Hauschild, M.; Henderson, A.; Humbert, S.; et al. IMPACT World+: A Globally Regionalized Life Cycle Impact Assessment Method. Int. J. Life Cycle Assess. 2019, 24, 1653–1674. [Google Scholar] [CrossRef]
  32. Dekker, E.; Zijp, M.C.; Van De Kamp, M.E.; Temme, E.H.M.; Van Zelm, R. A Taste of the New ReCiPe for Life Cycle Assessment: Consequences of the Updated Impact Assessment Method on Food Product LCAs. Int. J. Life Cycle Assess. 2020, 25, 2315–2324. [Google Scholar] [CrossRef]
  33. Rybaczewska-Błażejowska, M.; Jezierski, D. Comparison of ReCiPe 2016, ILCD 2011, CML-IA Baseline and IMPACT 2002+ LCIA Methods: A Case Study Based on the Electricity Consumption Mix in Europe. Int. J. Life Cycle Assess. 2024. [Google Scholar] [CrossRef]
  34. ISO 14040:2006; Environmental Management—Life Cycle Assessment—Principles and Framework. International Organization for Standardization: Geneva, Switzerland, 2006.
  35. ISO 14044:2006; Environmental Management—Life Cycle Assessment—Requirements and Guidelines. International Organization for Standardization: Geneva, Switzerland, 2006.
  36. Huijbregts, M.A.J.; Steinmann, Z.J.N.; Elshout, P.M.F.; Stam, G.; Verones, F.; Vieira, M.; Zijp, M.; Hollander, A.; Van Zelm, R. ReCiPe2016: A Harmonised Life Cycle Impact Assessment Method at Midpoint and Endpoint Level. Int. J. Life Cycle Assess. 2017, 22, 138–147. [Google Scholar] [CrossRef]
  37. Cosme, N.; Koski, M.; Hauschild, M.Z. Exposure Factors for Marine Eutrophication Impacts Assessment Based on a Mechanistic Biological Model. Ecol. Model. 2015, 317, 50–63. [Google Scholar] [CrossRef]
  38. Calder, I.R. Forests and Water—Ensuring Forest Benefits Outweigh Water Costs. For. Ecol. Manag. 2007, 251, 110–120. [Google Scholar] [CrossRef]
  39. Gajic, B.; Dugalic, G.; Sredojevic, Z.; Tomic, Z. Proceedings of the VII. Alps-Adria Scientific Workshop, 28 April-2 May 2008, Stara Lesna, Slovakia. Part II. Cereal Res. Commun. 2008, 36, 675–1394. [Google Scholar] [CrossRef]
  40. Gray, D.M. Handbook on the Principles of Hydrology; Water Information Center: New York, NY, USA, 1973. [Google Scholar]
  41. Wood, H.B. Hydrologic Differences between Selected Forested and Agricultural Soils in Hawaii. Soil Sci. Soc. Am. J. 1977, 41, 132–136. [Google Scholar] [CrossRef]
  42. Bharati, L.; Lee, K.-H.; Isenhart, T.M.; Schultz, R.C. Soil-Water Infiltration under Crops, Pasture, and Established Riparian Buffer in Midwestern USA. Agrofor. Syst. 2002, 56, 249–257. [Google Scholar] [CrossRef]
  43. Seobi, T.; Anderson, S.H.; Udawatta, R.P.; Gantzer, C.J. Influence of Grass and Agroforestry Buffer Strips on Soil Hydraulic Properties for an Albaqualf. Soil Sci. Soc Am. J. 2005, 69, 893–901. [Google Scholar] [CrossRef]
  44. Kvítek, T. (Ed.) Retence a Jakost Vody v Povodí Vodárenské Nádrže Švihov na Želivce (Retention and Water Quality in the Catchment of the Švihov Water Reservoir on Želivka River), 1st ed.; Povodí Vltavy, státní podnik: Praha, Czech Republic, 2018; ISBN 978-80-270-5244-8. [Google Scholar]
  45. Bormann, F.; Likens, G.E. Pattern and Process in a Forested Ecosystem; Springer: New York, NY, USA, 1994. [Google Scholar] [CrossRef]
  46. PRé Sustainability. SimaPro, Version 9.6.0.1 Analyst; PRé Sustainability: Amersfoort, The Netherlands, 2024.
  47. R Core Team. R: A Language and Environment for Statistical Computing; R Foundation for Statistical Computing: Vienna, Austria, 2024. [Google Scholar]
  48. Henryson, K.; Hansson, P.-A.; Sundberg, C. Spatially Differentiated Midpoint Indicator for Marine Eutrophication of Waterborne Emissions in Sweden. Int. J. Life Cycle Assess 2018, 23, 70–81. [Google Scholar] [CrossRef]
  49. Payen, S.; Ledgard, S.F. Aquatic Eutrophication Indicators in LCA: Methodological Challenges Illustrated Using a Case Study in New Zealand. J. Clean. Prod. 2017, 168, 1463–1472. [Google Scholar] [CrossRef]
  50. Morelli, B.; Hawkins, T.R.; Niblick, B.; Henderson, A.D.; Golden, H.E.; Compton, J.E.; Cooter, E.J.; Bare, J.C. Critical Review of Eutrophication Models for Life Cycle Assessment. Environ. Sci. Technol. 2018, 52, 9562–9578. [Google Scholar] [CrossRef] [PubMed]
  51. Ortiz-Reyes, E.; Anex, R.P. A Life Cycle Impact Assessment Method for Freshwater Eutrophication Due to the Transport of Phosphorus from Agricultural Production. J. Clean. Prod. 2018, 177, 474–482. [Google Scholar] [CrossRef]
  52. Wahl, A. Life Cycle Impact Assessment—The Most Widely Used LCIA Methods; iPoint: Reutlingen, Germany, 2018. [Google Scholar]
  53. Trenčiansky, M.; Šterbová, M.; Výbošťok, J.; Lieskovský, M. Impacts of Forest Cover on Surface Runoff Quality in Small Catchments. BioResources 2021, 16, 7830–7845. [Google Scholar] [CrossRef]
  54. Raulund-Rasmussen, K.; Hansen, K.; Katzensteiner, K.; Loustau, D.; de Jong, J.; Gundersen, P.; Humphrey, J.W.; Ravn, H.P.; Klimo, E. Synthesis Report on Impact of Forest Management on Environmental Services; European Forest Institute: Joensuu, Finland, 2011; p. 125. [Google Scholar]
  55. Ogden, F.L.; Crouch, T.D.; Stallard, R.F.; Hall, J.S. Effect of Land Cover and Use on Dry Season River Runoff, Runoff Efficiency, and Peak Storm Runoff in the Seasonal Tropics of Central Panama: Sponge Effect Paper. Water Resour. Res. 2013, 49, 8443–8462. [Google Scholar] [CrossRef]
  56. Veselá, T.; Nedbal, V.; Brom, J. Detection of Pesticide in a Small Agricultural Basin after 15 Years of Application Ban. In Proceedings of the 20th International Multidisciplinary Scientific GeoConference SGEM 2020, Albena, Bulgaria, 18–24 August 2020; Volume 20, pp. 75–82. [Google Scholar]
  57. Ghimire, C.P.; Bruijnzeel, L.A.; Lubczynski, M.W.; Bonell, M. Rainfall Interception by Natural and Planted Forests in the Middle Mountains of Central Nepal. J. Hydrol. 2012, 475, 270–280. [Google Scholar] [CrossRef]
  58. Gardon, F.R.; Toledo, R.M.D.; Brentan, B.M.; Santos, R.F.D. Rainfall Interception and Plant Community in Young Forest Restorations. Ecol. Indic. 2020, 109, 105779. [Google Scholar] [CrossRef]
  59. Mendes, T.A.; Alves, R.D.; Gitirana, G.D.F.N.; Pereira, S.A.D.S.; Rebolledo, J.F.R.; Da Luz, M.P. Evaluation of Rainfall Interception by Vegetation Using a Rainfall Simulator. Sustainability 2021, 13, 5082. [Google Scholar] [CrossRef]
  60. Jones, H.G. Plants and Microclimate: A Quantitative Approach to Environmental Plant Physiology, 2nd ed.; Horticulture Research International: Warwick, UK, 1992. [Google Scholar]
  61. Zhang, Y.; Wang, X.; Hu, R.; Pan, Y.; Paradeloc, M. Rainfall Partitioning into Throughfall, Stemflow and Interception Loss by Two Xerophytic Shrubs within a Rain-Fed Re-Vegetated Desert Ecosystem, Northwestern China. J. Hydrol. 2015, 527, 1084–1095. [Google Scholar] [CrossRef]
  62. Zhang, X.; Li, P.; Li, Z.B.; Yu, G.Q.; Li, C. Effects of Precipitation and Different Distributions of Grass Strips on Runoff and Sediment in the Loess Convex Hillslope. CATENA 2018, 162, 130–140. [Google Scholar] [CrossRef]
  63. Rawls, W.J.; Pachepsky, Y.A.; Ritchie, J.C.; Sobecki, T.M.; Bloodworth, H. Effect of Soil Organic Carbon on Soil Water Retention. Geoderma 2003, 116, 61–76. [Google Scholar] [CrossRef]
  64. Ankenbauer, K.J.; Loheide, S.P. The Effects of Soil Organic Matter on Soil Water Retention and Plant Water Use in a Meadow of the Sierra Nevada, CA: Soil Organic Matter Affects Plant Water Use. Hydrol. Process. 2017, 31, 891–901. [Google Scholar] [CrossRef]
  65. Ma, K.; Huang, X.; Liang, C.; Zhao, H.; Zhou, X.; Wei, X. Effect of Land Use/Cover Changes on Runoff in the Min River Watershed. River Res. Apps 2020, 36, 749–759. [Google Scholar] [CrossRef]
  66. Chen, L.; Fu, B.; Zhang, S.; Qiu, J.; Guo, X.; Yang, F. A Comparative Study on Nitrogen-Concentration Dynamics in Surface Water in a Heterogeneous Landscape. Environ. Geol. 2002, 42, 424–432. [Google Scholar] [CrossRef]
  67. De Oliveira, L.M.; Maillard, P.; De Andrade Pinto, É.J. Modeling the Effect of Land Use/Land Cover on Nitrogen, Phosphorous and Dissolved Oxygen Loads in the Velhas River Using the Concept of Exclusive Contribution Area. Environ. Monit. Assess. 2016, 188, 333. [Google Scholar] [CrossRef] [PubMed]
  68. Hiscock, K.; Lovett, A.; Saich, A.; Dockerty, T.; Johnson, P.; Sandhu, C.; Sünnenberg, G.; Appleton, K.; Harris, B.; Greaves, J. Modelling Land-Use Scenarios to Reduce Groundwater Nitrate Pollution: The European Water4All Project. Q. J. Eng. Geol. Hydrogeol. 2007, 40, 417–434. [Google Scholar] [CrossRef]
  69. Allan, J.D. Landscapes and Riverscapes: The Influence of Land Use on Stream Ecosystems. Annu. Rev. Ecol. Evol. Syst. 2004, 35, 257–284. [Google Scholar] [CrossRef]
  70. Stoate, C.; Boatman, N.D.; Borralho, R.J.; Carvalho, C.R.; de Snoo, G.R.; Eden, P. Ecological Impacts of Arable Intensification in Europe. J. Environ. Manag. 2001, 63, 337–365. [Google Scholar] [CrossRef]
  71. Chen, Q.; Mei, K.; Dahlgren, R.A.; Wang, T.; Gong, J.; Zhang, M. Impacts of Land Use and Population Density on Seasonal Surface Water Quality Using a Modified Geographically Weighted Regression. Sci. Total Environ. 2016, 572, 450–466. [Google Scholar] [CrossRef]
  72. Milazzo, F.; Francksen, R.M.; Zavattaro, L.; Abdalla, M.; Hejduk, S.; Enri, S.R.; Pittarello, M.; Price, P.N.; Schils, R.L.M.; Smith, P.; et al. The Role of Grassland for Erosion and Flood Mitigation in Europe: A Meta-Analysis. Agric. Ecosyst. Environ. 2023, 348, 108443. [Google Scholar] [CrossRef]
  73. Wang, Z.-H.; Li, S.-X. Nitrate N Loss by Leaching and Surface Runoff in Agricultural Land: A Global Issue (a Review). In Advances in Agronomy; Elsevier: Amsterdam, The Netherlands, 2019; Volume 156, pp. 159–217. ISBN 978-0-12-817598-9. [Google Scholar]
  74. Kvítek, T. Zemědělské Meliorace, 1st ed.; Zemědělská Fakulta, Jihočeská Univerzita: Budějovicích, Czech Republic, 2006; ISBN 978-80-7040-858-2. [Google Scholar]
  75. Hanrahan, B.R.; King, K.W.; Duncan, E.W.; Shedekar, V.S. Cover Crops Differentially Influenced Nitrogen and Phosphorus Loss in Tile Drainage and Surface Runoff from Agricultural Fields in Ohio, USA. J. Environ. Manag. 2021, 293, 112910. [Google Scholar] [CrossRef]
  76. Nemecek, T.; Bengoa, X.; Lansche, J.; Roesch, A.; Faist-Emmenegger, M.; Rossi, V.; Humbert, S. Methodological Guidelines for the Life Cycle Inventory of Agricultural Products. Version 3.5; World Food LCA Database (WFLDB): Zurich, Switzerland, 2019. [Google Scholar]
Figure 1. Overview of the study site. F = upper forest sub-catchment (UFS); A = lower agricultural sub-catchment (LAS).
Land 13 01150 g001
Figure 2. Overview of eutrophication risk potential assessment via LCIA principles (according to ReCiPe method [36]).
Land 13 01150 g002
Figure 3. Hydrological performance of sub-catchments (UFS vs. LAS) during the hydrological year (hydrographs). UFS: upper sub-catchment; LAS: lower sub-catchment. Precipitation (deep blue bars) and specific water runoff from UFS and LAS in months of the hydrological year.
Land 13 01150 g003
Figure 4. Comparison of freshwater eutrophication potential (for specific runoff P-PO43− per ha of sub-catchment) of sub-catchments (UFS vs. LAS) during the hydrological year. UFS: upper sub-catchment; LAS: lower sub-catchment. Freshwater eutrophication quantified via Method: ReCiPe 2016 Midpoint (H) V1.1/World (2010) H/Characterisation.
Land 13 01150 g004
Figure 5. Comparison of marine eutrophication potential (for specific runoff N-NO3 per ha of sub-catchment) of sub-catchments (UFS vs. LAS) during the hydrological year. UFS: upper sub-catchment; LAS: lower sub-catchment. Marine eutrophication quantified via Method: ReCiPe 2016 Midpoint (H) V1.1/World (2010) H/Characterisation.
Land 13 01150 g005
Table 1. Area of land cover features in the upper forest and lower agricultural sub-catchment during the study period 2009–2022.
Land Cover FeaturesUFS (ha)LAS (ha)
Arable land047.9
Grassland31.3139.8
Wetland09.2
Shrub2.317
Forest271.3139.5
Others1.99.5
Sum306.8362.9
UFS: upper forest sub-catchment; LAS: lower agricultural sub-catchment.
Table 2. Hydrochemical data for the monitored hydrological year.
DateSpecific Runoff N-NO3
(kg ha−1 month−1)
Specific Runoff P-PO43−
(kg ha−1 month−1)
Specific Runoff of Water
(m3 ha−1 month−1)
UFS
November-20170.06720.003397.027
December-20170.06330.005088.461
January-20180.07260.007798.401
February-20180.05310.002363.169
March-20180.07700.003697.524
April-20180.04760.002464.618
May-20180.03110.001375.607
June-20180.15260.0144340.585
July-20180.03370.003375.897
August-20180.03590.003167.352
September-20180.05310.004993.657
October-20180.03960.003383.098
LAS
November-20170.39310.0162231.374
December-20170.29190.0109147.502
January-20180.54810.0189242.623
February-20180.27370.0036102.658
March-20180.29520.0033111.773
April-20180.18030.001668.931
May-20180.19120.0050122.880
June-20180.55410.0297532.830
July-20180.45730.0192309.208
August-20180.15850.0053111.437
September-20180.21590.0073153.212
October-20180.17010.0046144.992
UFS: upper forest sub-catchment; LAS: lower agricultural sub-catchment.
Disclaimer/Publisher’s Note: The statements, opinions and data contained in all publications are solely those of the individual author(s) and contributor(s) and not of MDPI and/or the editor(s). MDPI and/or the editor(s) disclaim responsibility for any injury to people or property resulting from any ideas, methods, instructions or products referred to in the content.

